Embed Size (px)
Citation preview
August 2010
NASA/TM–2010-216838
Mode II Interlaminar Fracture Toughness and Fatigue Characterization of a Graphite Epoxy Composite Material T. Kevin O’Brien NASA Langley Research Center, Hampton, Virginia
William M. Johnston Lockheed Martin, Hampton, Virginia
Gregory J. Toland University of California, Santa Barbara, California
https://ntrs.nasa.gov/search.jsp?R=20100031113 2018-08-14T08:40:49+00:00Z

NASA STI Program . . . in Profile
Since its founding, NASA has been dedicated to the advancement of aeronautics and space science. The NASA scientific and technical information (STI) program plays a key part in helping NASA maintain this important role.
The NASA STI program operates under the auspices of the Agency Chief Information Officer. It collects, organizes, provides for archiving, and disseminates NASA’s STI. The NASA STI program provides access to the NASA Aeronautics and Space Database and its public interface, the NASA Technical Report Server, thus providing one of the largest collections of aeronautical and space science STI in the world. Results are published in both non-NASA channels and by NASA in the NASA STI Report Series, which includes the following report types:
• TECHNICAL PUBLICATION. Reports of
completed research or a major significant phase of research that present the results of NASA programs and include extensive data or theoretical analysis. Includes compilations of significant scientific and technical data and information deemed to be of continuing reference value. NASA counterpart of peer-reviewed formal professional papers, but having less stringent limitations on manuscript length and extent of graphic presentations.
• TECHNICAL MEMORANDUM. Scientific
and technical findings that are preliminary or of specialized interest, e.g., quick release reports, working papers, and bibliographies that contain minimal annotation. Does not contain extensive analysis.
• CONTRACTOR REPORT. Scientific and
technical findings by NASA-sponsored contractors and grantees.
• CONFERENCE PUBLICATION. Collected
papers from scientific and technical conferences, symposia, seminars, or other meetings sponsored or co-sponsored by NASA.
• SPECIAL PUBLICATION. Scientific,
technical, or historical information from NASA programs, projects, and missions, often concerned with subjects having substantial public interest.
• TECHNICAL TRANSLATION. English-
language translations of foreign scientific and technical material pertinent to NASA’s mission.
Specialized services also include creating custom thesauri, building customized databases, and organizing and publishing research results. For more information about the NASA STI program, see the following: • Access the NASA STI program home page at
http://www.sti.nasa.gov • E-mail your question via the Internet to
[email protected] • Fax your question to the NASA STI Help Desk
at 443-757-5803 • Phone the NASA STI Help Desk at
443-757-5802 • Write to:
NASA STI Help Desk NASA Center for AeroSpace Information 7115 Standard Drive Hanover, MD 21076-1320
National Aeronautics and Space Administration Langley Research Center Hampton, Virginia 23681-2199
August 2010
NASA/TM–2010-216838
Mode II Interlaminar Fracture Toughness and Fatigue Characterization of a Graphite Epoxy Composite Material T. Kevin O’Brien NASA Langley Research Center, Hampton, Virginia
William M. Johnston Lockheed Martin, Hampton, Virginia
Gregory J. Toland University of California, Santa Barbara, California
Available from:
NASA Center for AeroSpace Information 7115 Standard Drive
Hanover, MD 21076-1320 443-757-5802
Trade names and trademarks are used in this report for identification only. Their usage does not constitute an official endorsement, either expressed or implied, by the National Aeronautics and Space Administration.
2
Abstract
Mode II interlaminar fracture toughness and delamination onset and growth characterization data were generated for IM7/8552 graphite epoxy composite materials from two suppliers for use in fracture mechanics analyses. Both the fracture toughness testing and the fatigue testing were conducted using the End-notched Flexure (ENF) test. The ENF test for mode II fracture toughness is currently under review by ASTM as a potential standard test method. This current draft ASTM protocol was used as a guide to conduct the tests on the IM7/8552 material. The results for material produced by the two suppliers were similar for all material property values measured. The insight gained is valuable for current and future material property standards development. The draft ASTM procedure for GIIc was followed, and produced consistently repeatable interlaminar fracture toughness values. Furthermore, the testing procedures developed in this study, and the associated test results, will be useful for developing mode II fatigue standards. Methods were developed to parse and analyze fatigue data. Development of a Mode II fatigue delamination onset curve for precracked specimens and specimens with inserts was discussed. The effects of performing material property tests from either precracks or inserts were discussed and compared. Testing from a precracked specimen gave more conservative properties than testing from an insert, for both interlaminar fracture toughness and fatigue onset data.
3
Introduction
As part of the Space Act Agreement (SAA) between the Center for Rotorcraft Innovation (CRI) and NASA Langley Research Center, fracture mechanics based analyses are being performed to predict delamination onset and growth in structural subcomponents made of IM7/8552 carbon-epoxy composite materials. Delamination characterization data for opening (mode I) and shear (mode II) fracture modes are needed as input to these models. The mode II characterization of this material includes the testing of fracture toughness during static loading and the determination of delamination onset and growth during fatigue loading. Both the fracture toughness testing and the fatigue testing were conducted using the End-notched Flexure (ENF) test. The ENF test for mode II fracture toughness is currently under review by ASTM as a potential standard test method [1]. This current draft ASTM protocol was used as a guide to conduct the tests on the IM7/8552 material. There is no current ASTM standard for conducting Mode II fatigue delamination characterization. This report summarizes the test approach, methods, procedures and results of this characterization effort.
Experimental Scope and Approach
Characterization tests were conducted on IM7/8552 ENF coupons produced by two different rotorcraft manufacturers and made to their own specifications. The Mode II characterization included both the determination of the interlaminar fracture toughness, GIIC, as well as the fatigue delamination onset and growth.
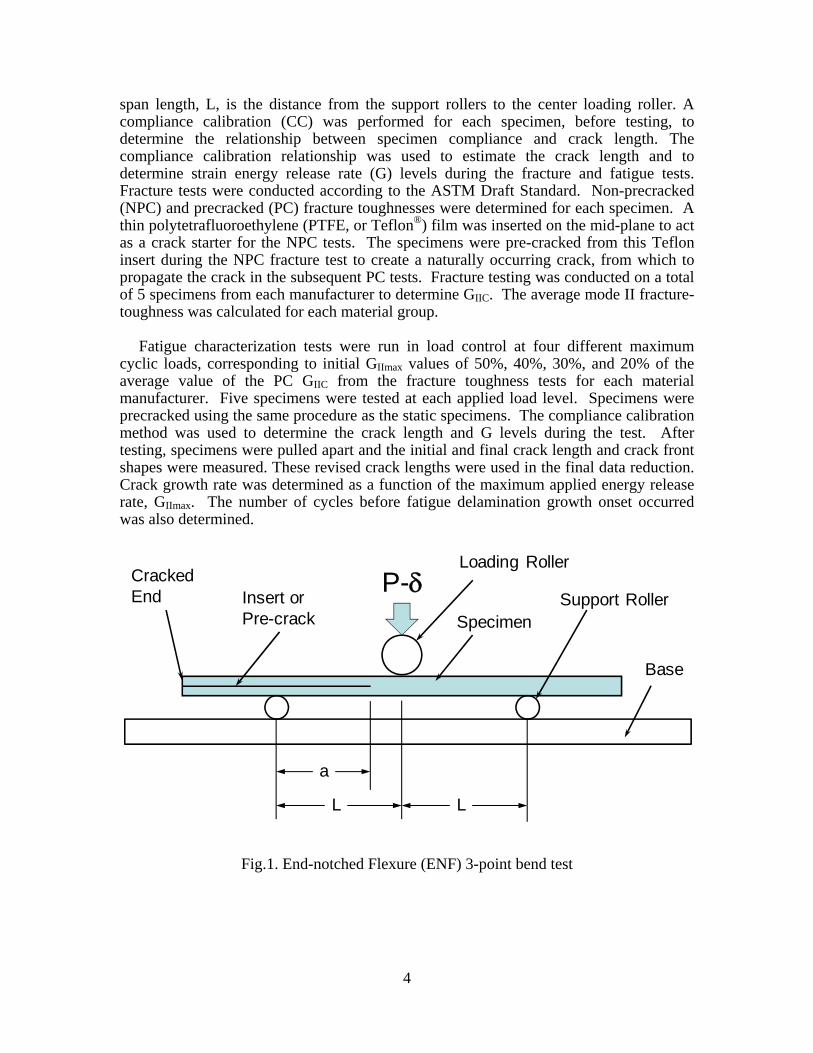
Tests were conducted using the End-notched Flexure specimen. The ENF test involves loading a beam with a mid-plane starter crack at one end, in three-point bending, as shown in figure 1. Crack length, a, is measured from the support roller, and the half-
The terms “delamination” and “crack” will be used interchangeably throughout this report.
4
span length, L, is the distance from the support rollers to the center loading roller. A compliance calibration (CC) was performed for each specimen, before testing, to determine the relationship between specimen compliance and crack length. The compliance calibration relationship was used to estimate the crack length and to determine strain energy release rate (G) levels during the fracture and fatigue tests. Fracture tests were conducted according to the ASTM Draft Standard. Non-precracked (NPC) and precracked (PC) fracture toughnesses were determined for each specimen. A thin polytetrafluoroethylene (PTFE, or Teflon®) film was inserted on the mid-plane to act as a crack starter for the NPC tests. The specimens were pre-cracked from this Teflon insert during the NPC fracture test to create a naturally occurring crack, from which to propagate the crack in the subsequent PC tests. Fracture testing was conducted on a total of 5 specimens from each manufacturer to determine GIIC. The average mode II fracture-toughness was calculated for each material group.
Fatigue characterization tests were run in load control at four different maximum cyclic loads, corresponding to initial GIImax values of 50%, 40%, 30%, and 20% of the average value of the PC GIIC from the fracture toughness tests for each material manufacturer. Five specimens were tested at each applied load level. Specimens were precracked using the same procedure as the static specimens. The compliance calibration method was used to determine the crack length and G levels during the test. After testing, specimens were pulled apart and the initial and final crack length and crack front shapes were measured. These revised crack lengths were used in the final data reduction. Crack growth rate was determined as a function of the maximum applied energy release rate, GIImax. The number of cycles before fatigue delamination growth onset occurred was also determined.
Loading Roller
LL
a
Cracked End Support Roller
Specimen
Base
Insert or Pre-crack
P-
Fig.1. End-notched Flexure (ENF) 3-point bend test
5
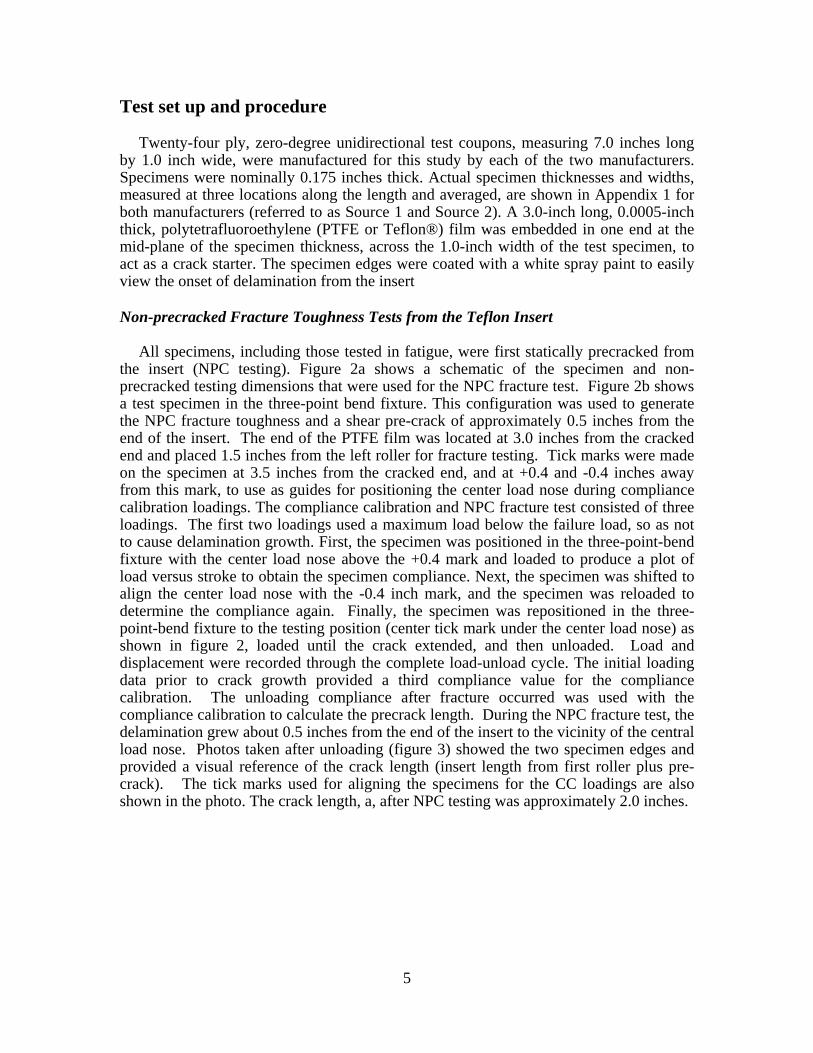
Test set up and procedure
Twenty-four ply, zero-degree unidirectional test coupons, measuring 7.0 inches long by 1.0 inch wide, were manufactured for this study by each of the two manufacturers. Specimens were nominally 0.175 inches thick. Actual specimen thicknesses and widths, measured at three locations along the length and averaged, are shown in Appendix 1 for both manufacturers (referred to as Source 1 and Source 2). A 3.0-inch long, 0.0005-inch thick, polytetrafluoroethylene (PTFE or Teflon®) film was embedded in one end at the mid-plane of the specimen thickness, across the 1.0-inch width of the test specimen, to act as a crack starter. The specimen edges were coated with a white spray paint to easily view the onset of delamination from the insert
Non-precracked Fracture Toughness Tests from the Teflon Insert
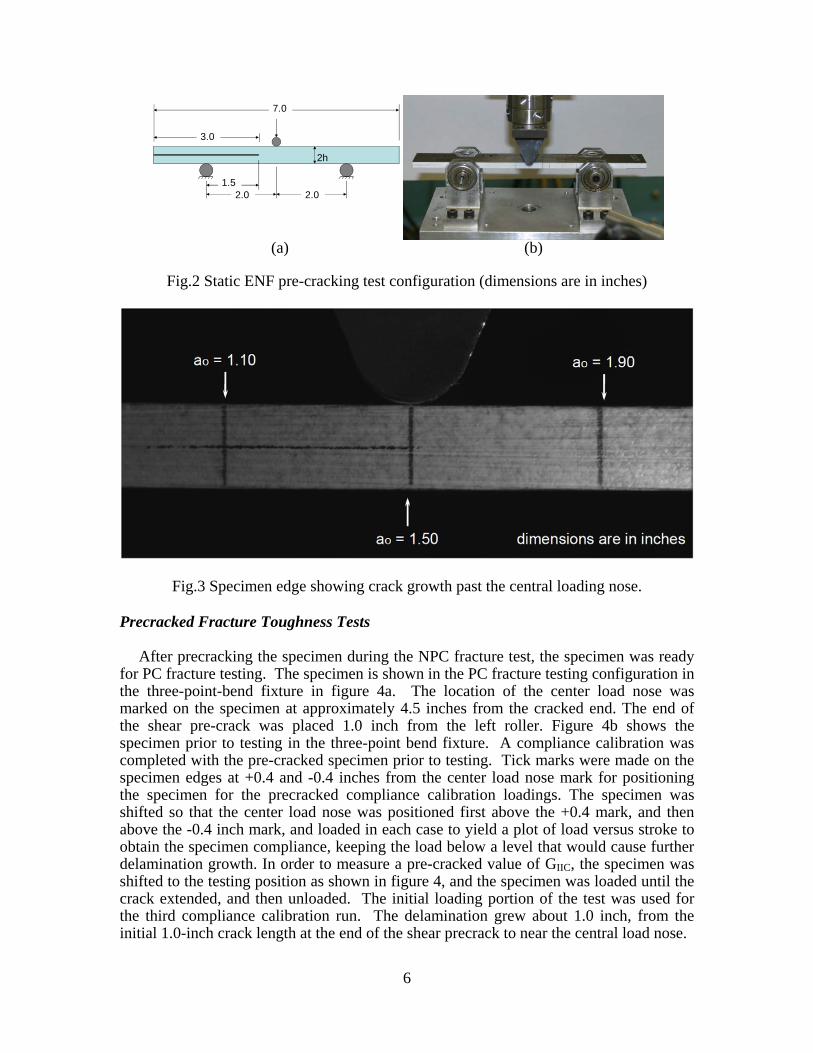
All specimens, including those tested in fatigue, were first statically precracked from the insert (NPC testing). Figure 2a shows a schematic of the specimen and non-precracked testing dimensions that were used for the NPC fracture test. Figure 2b shows a test specimen in the three-point bend fixture. This configuration was used to generate the NPC fracture toughness and a shear pre-crack of approximately 0.5 inches from the end of the insert. The end of the PTFE film was located at 3.0 inches from the cracked end and placed 1.5 inches from the left roller for fracture testing. Tick marks were made on the specimen at 3.5 inches from the cracked end, and at +0.4 and -0.4 inches away from this mark, to use as guides for positioning the center load nose during compliance calibration loadings. The compliance calibration and NPC fracture test consisted of three loadings. The first two loadings used a maximum load below the failure load, so as not to cause delamination growth. First, the specimen was positioned in the three-point-bend fixture with the center load nose above the +0.4 mark and loaded to produce a plot of load versus stroke to obtain the specimen compliance. Next, the specimen was shifted to align the center load nose with the -0.4 inch mark, and the specimen was reloaded to determine the compliance again. Finally, the specimen was repositioned in the three-point-bend fixture to the testing position (center tick mark under the center load nose) as shown in figure 2, loaded until the crack extended, and then unloaded. Load and displacement were recorded through the complete load-unload cycle. The initial loading data prior to crack growth provided a third compliance value for the compliance calibration. The unloading compliance after fracture occurred was used with the compliance calibration to calculate the precrack length. During the NPC fracture test, the delamination grew about 0.5 inches from the end of the insert to the vicinity of the central load nose. Photos taken after unloading (figure 3) showed the two specimen edges and provided a visual reference of the crack length (insert length from first roller plus pre-crack). The tick marks used for aligning the specimens for the CC loadings are also shown in the photo. The crack length, a, after NPC testing was approximately 2.0 inches.
6
2h
7.0
3.0
1.52.0 2.0
(a) (b)
Fig.2 Static ENF pre-cracking test configuration (dimensions are in inches)
Fig.3 Specimen edge showing crack growth past the central loading nose.
Precracked Fracture Toughness Tests
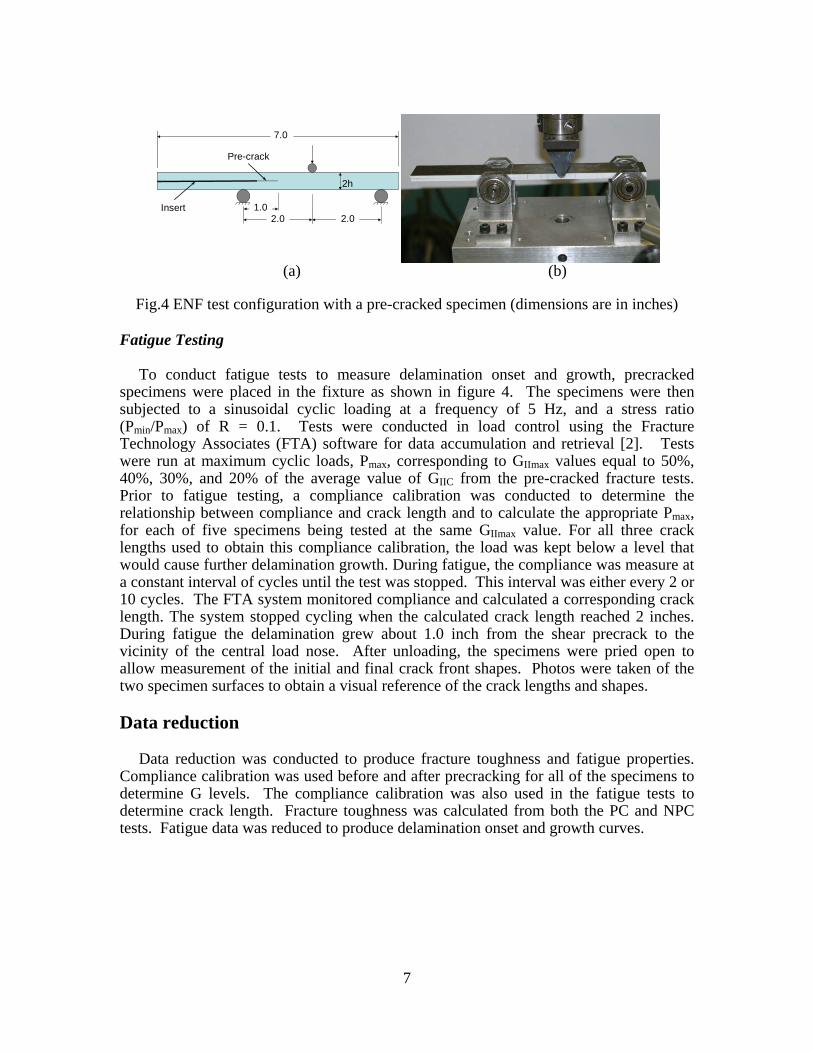
After precracking the specimen during the NPC fracture test, the specimen was ready for PC fracture testing. The specimen is shown in the PC fracture testing configuration in the three-point-bend fixture in figure 4a. The location of the center load nose was marked on the specimen at approximately 4.5 inches from the cracked end. The end of the shear pre-crack was placed 1.0 inch from the left roller. Figure 4b shows the specimen prior to testing in the three-point bend fixture. A compliance calibration was completed with the pre-cracked specimen prior to testing. Tick marks were made on the specimen edges at +0.4 and -0.4 inches from the center load nose mark for positioning the specimen for the precracked compliance calibration loadings. The specimen was shifted so that the center load nose was positioned first above the +0.4 mark, and then above the -0.4 inch mark, and loaded in each case to yield a plot of load versus stroke to obtain the specimen compliance, keeping the load below a level that would cause further delamination growth. In order to measure a pre-cracked value of GIIC, the specimen was shifted to the testing position as shown in figure 4, and the specimen was loaded until the crack extended, and then unloaded. The initial loading portion of the test was used for the third compliance calibration run. The delamination grew about 1.0 inch, from the initial 1.0-inch crack length at the end of the shear precrack to near the central load nose.
7
2.01.0
2h
2.0
7.0
Insert
Pre-crack
(a) (b)
Fig.4 ENF test configuration with a pre-cracked specimen (dimensions are in inches)
Fatigue Testing
To conduct fatigue tests to measure delamination onset and growth, precracked specimens were placed in the fixture as shown in figure 4. The specimens were then subjected to a sinusoidal cyclic loading at a frequency of 5 Hz, and a stress ratio (Pmin/Pmax) of R = 0.1. Tests were conducted in load control using the Fracture Technology Associates (FTA) software for data accumulation and retrieval [2]. Tests were run at maximum cyclic loads, Pmax, corresponding to GIImax values equal to 50%, 40%, 30%, and 20% of the average value of GIIC from the pre-cracked fracture tests. Prior to fatigue testing, a compliance calibration was conducted to determine the relationship between compliance and crack length and to calculate the appropriate Pmax, for each of five specimens being tested at the same GIImax value. For all three crack lengths used to obtain this compliance calibration, the load was kept below a level that would cause further delamination growth. During fatigue, the compliance was measure at a constant interval of cycles until the test was stopped. This interval was either every 2 or 10 cycles. The FTA system monitored compliance and calculated a corresponding crack length. The system stopped cycling when the calculated crack length reached 2 inches. During fatigue the delamination grew about 1.0 inch from the shear precrack to the vicinity of the central load nose. After unloading, the specimens were pried open to allow measurement of the initial and final crack front shapes. Photos were taken of the two specimen surfaces to obtain a visual reference of the crack lengths and shapes.
Data reduction
Data reduction was conducted to produce fracture toughness and fatigue properties. Compliance calibration was used before and after precracking for all of the specimens to determine G levels. The compliance calibration was also used in the fatigue tests to determine crack length. Fracture toughness was calculated from both the PC and NPC tests. Fatigue data was reduced to produce delamination onset and growth curves.
8
Compliance Calibration
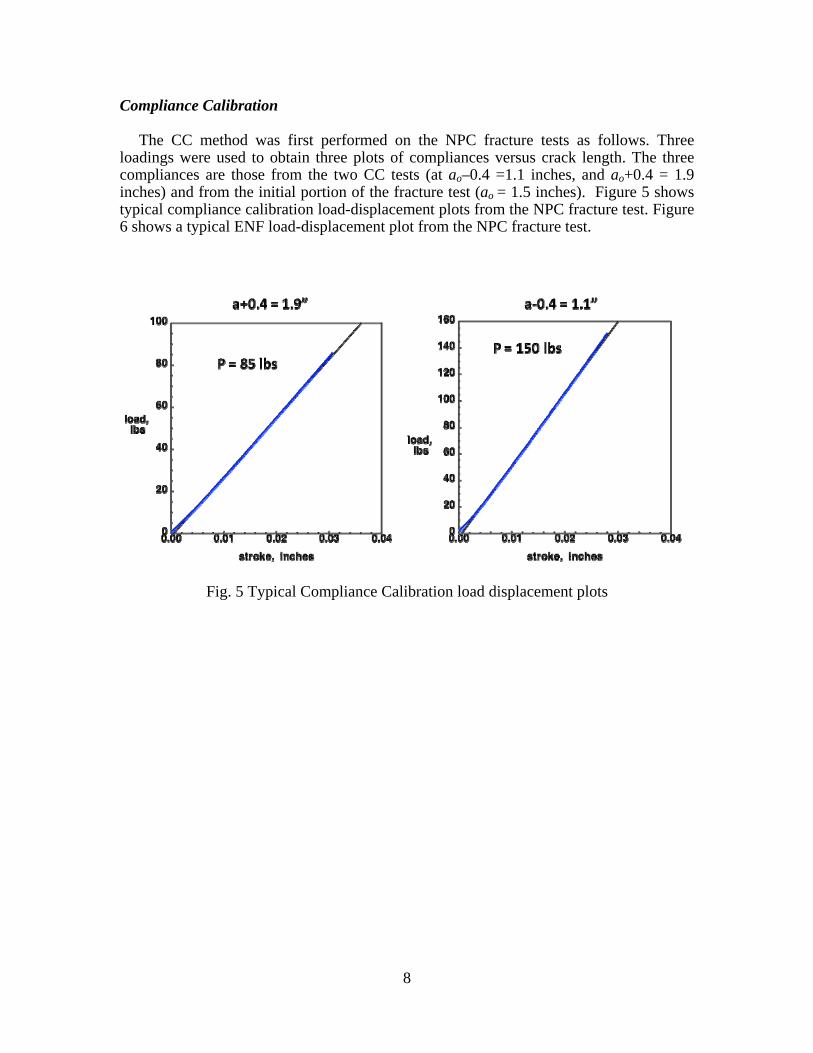
The CC method was first performed on the NPC fracture tests as follows. Three loadings were used to obtain three plots of compliances versus crack length. The three compliances are those from the two CC tests (at ao–0.4 =1.1 inches, and ao+0.4 = 1.9 inches) and from the initial portion of the fracture test (ao = 1.5 inches). Figure 5 shows typical compliance calibration load-displacement plots from the NPC fracture test. Figure 6 shows a typical ENF load-displacement plot from the NPC fracture test.
Fig. 5 Typical Compliance Calibration load displacement plots
9
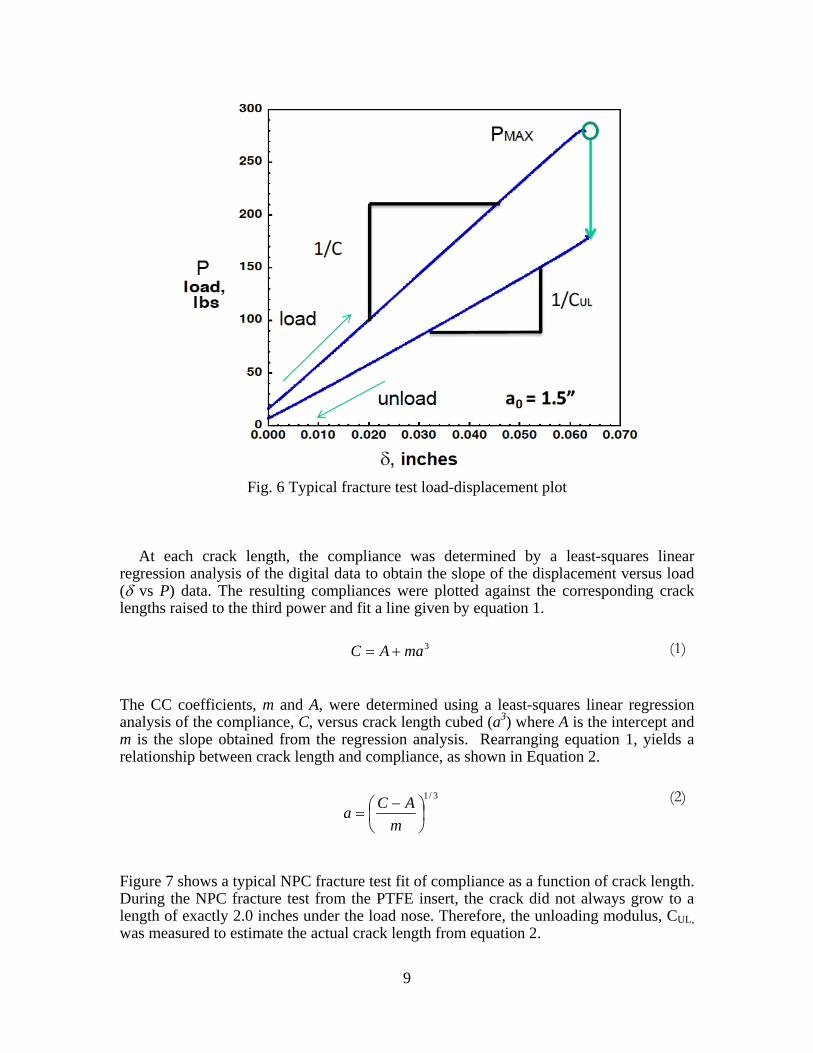
Fig. 6 Typical fracture test load-displacement plot
At each crack length, the compliance was determined by a least-squares linear regression analysis of the digital data to obtain the slope of the displacement versus load ( vs P) data. The resulting compliances were plotted against the corresponding crack lengths raised to the third power and fit a line given by equation 1.
3maAC (1)
The CC coefficients, m and A, were determined using a least-squares linear regression analysis of the compliance, C, versus crack length cubed (a3) where A is the intercept and m is the slope obtained from the regression analysis. Rearranging equation 1, yields a relationship between crack length and compliance, as shown in Equation 2.
3/1
m
ACa
(2)
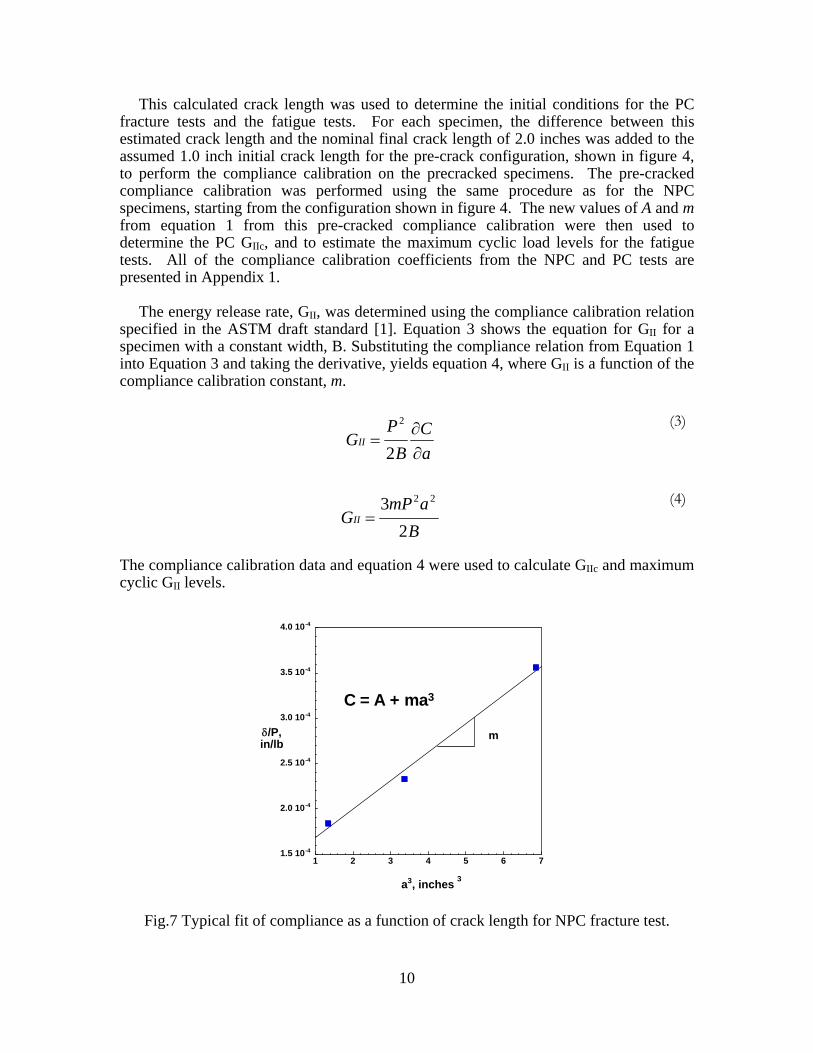
Figure 7 shows a typical NPC fracture test fit of compliance as a function of crack length. During the NPC fracture test from the PTFE insert, the crack did not always grow to a length of exactly 2.0 inches under the load nose. Therefore, the unloading modulus, CUL, was measured to estimate the actual crack length from equation 2.
10
This calculated crack length was used to determine the initial conditions for the PC fracture tests and the fatigue tests. For each specimen, the difference between this estimated crack length and the nominal final crack length of 2.0 inches was added to the assumed 1.0 inch initial crack length for the pre-crack configuration, shown in figure 4, to perform the compliance calibration on the precracked specimens. The pre-cracked compliance calibration was performed using the same procedure as for the NPC specimens, starting from the configuration shown in figure 4. The new values of A and m from equation 1 from this pre-cracked compliance calibration were then used to determine the PC GIIc, and to estimate the maximum cyclic load levels for the fatigue tests. All of the compliance calibration coefficients from the NPC and PC tests are presented in Appendix 1.
The energy release rate, GII, was determined using the compliance calibration relation specified in the ASTM draft standard [1]. Equation 3 shows the equation for GII for a specimen with a constant width, B. Substituting the compliance relation from Equation 1 into Equation 3 and taking the derivative, yields equation 4, where GII is a function of the compliance calibration constant, m.
a
C
B
PGII
2
2
(3)
B
amPGII
2
3 22
(4)
The compliance calibration data and equation 4 were used to calculate GIIc and maximum cyclic GII levels.
1.5 10-4
2.0 10-4
2.5 10-4
3.0 10-4
3.5 10-4
4.0 10-4
1 2 3 4 5 6 7
/P,in/lb
a3, inches 3
m
C = A + ma3
Fig.7 Typical fit of compliance as a function of crack length for NPC fracture test.
11
Fracture Toughness Calculations
The mode II NPC and PC fracture toughness was determined using equation 4, where m is the CC coefficient, P is the maximum load from the fracture test, a is the initial crack length, and B is the specimen width. As a further check on the estimated crack lengths, test specimens were pried open following final failure. Using the end of the PTFE film and the tick marks as guides, the initial delamination lengths were corrected, providing accurately measured values.
Fatigue Property Calculations
Fatigue tests were conducted at maximum cyclic GII levels corresponding to 50%, 40%, 30%, and 20% of the average pre-cracked GIIc for each source. These maximum cyclic load levels were obtained by solving equation 4 for P (equation 5) and then substituting the appropriate GIImax value.
m
BG
aP
3
21 maxII2/1
0max
(5)
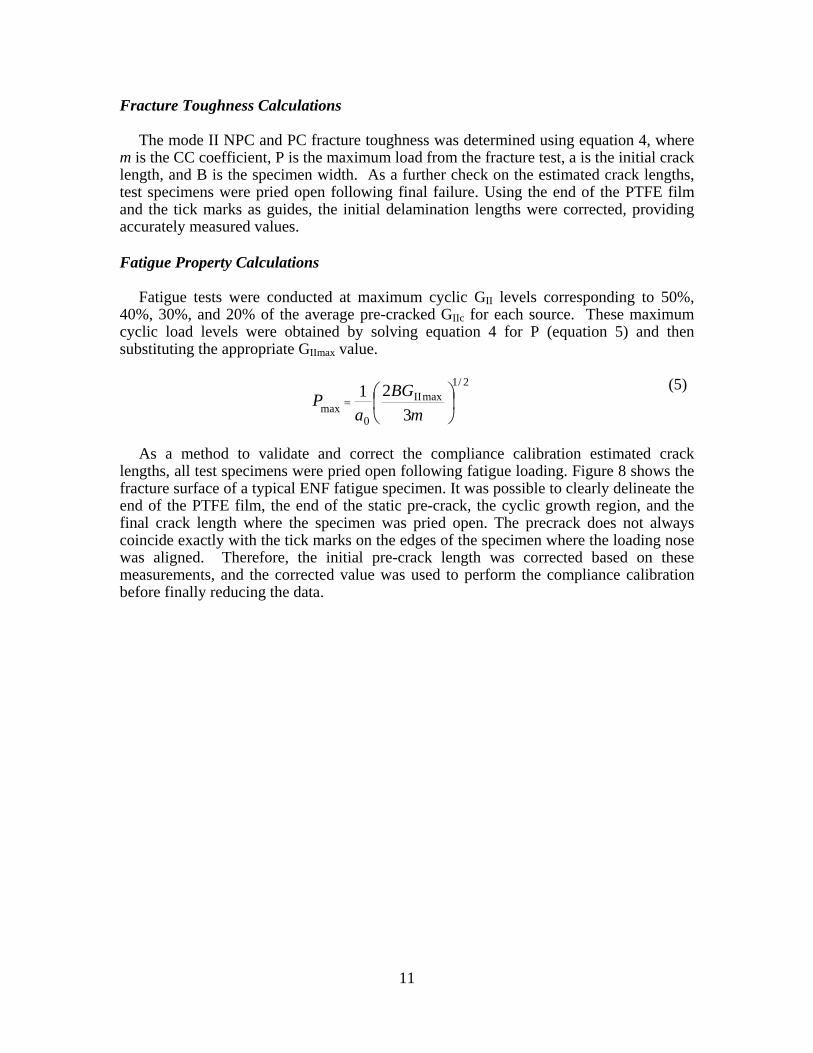
As a method to validate and correct the compliance calibration estimated crack lengths, all test specimens were pried open following fatigue loading. Figure 8 shows the fracture surface of a typical ENF fatigue specimen. It was possible to clearly delineate the end of the PTFE film, the end of the static pre-crack, the cyclic growth region, and the final crack length where the specimen was pried open. The precrack does not always coincide exactly with the tick marks on the edges of the specimen where the loading nose was aligned. Therefore, the initial pre-crack length was corrected based on these measurements, and the corrected value was used to perform the compliance calibration before finally reducing the data.
12
Fig.8 Fracture surfaces of typical ENF fatigue specimen
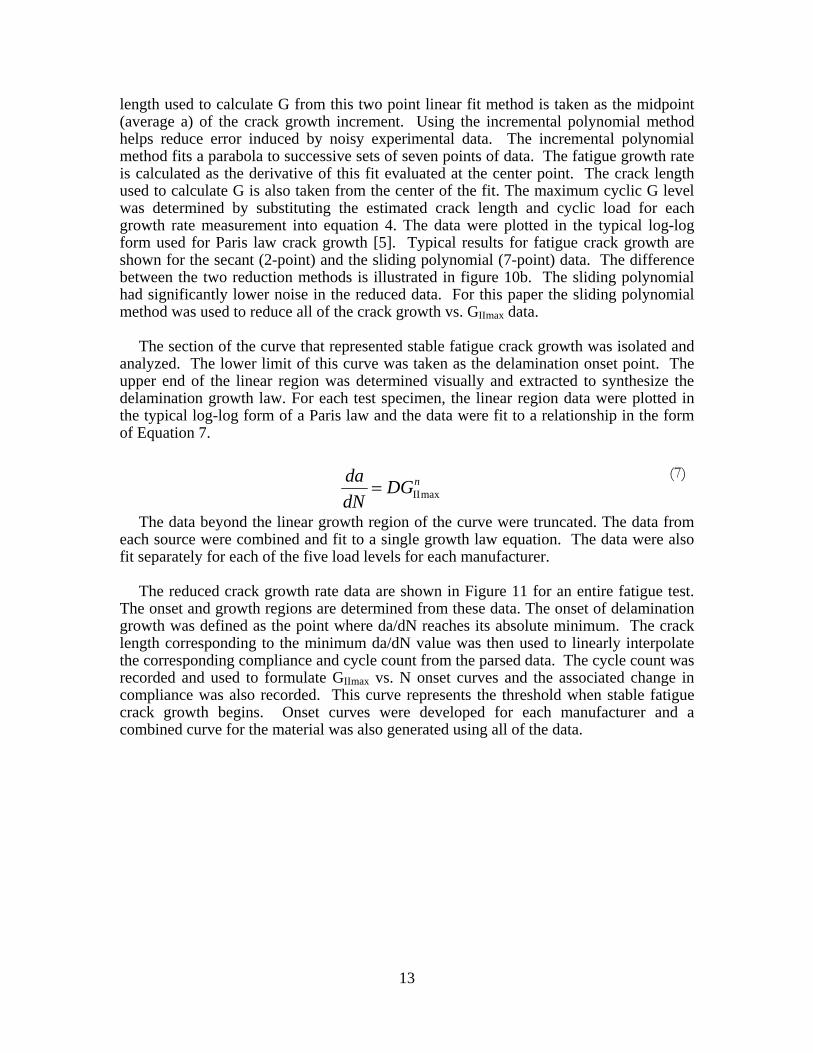
The FTA data acquisition system used during the fatigue tests provided compliance as a function of cycle count. To determine crack growth rate as a function of GIImax, the compliance data were initially converted to crack length using Equation 2 and the CC data for the specimens (Figure 9). The derivative was taken numerically to provide the crack growth rate, da/dN.
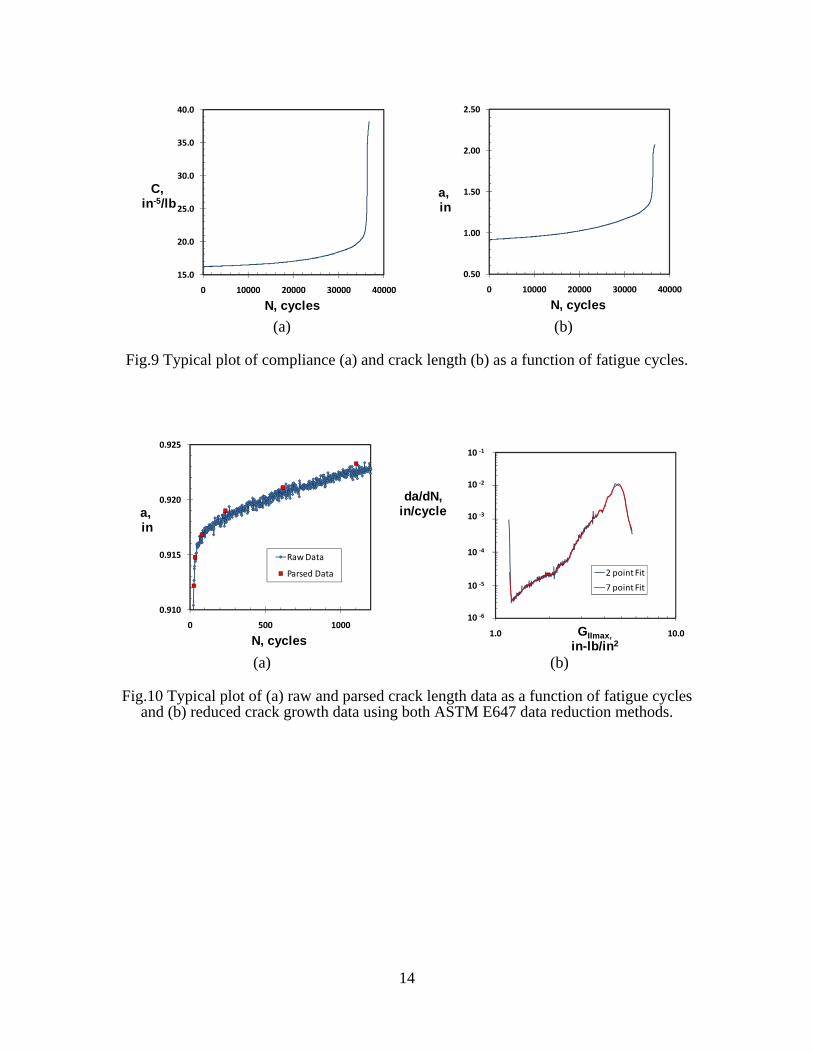
Because the data sets produced were large and contained noise, compliance was recorded at 2-cycle intervals for the 50% GIIc tests and at 10-cycle intervals for the 20-40% GIIc tests to ensure that no data were lost. These intervals were not optimized to ensure a significant (above the noise level) increment of crack growth. To remedy this, the data were parsed to remove any crack growth interval of less than 0.002 inches, which was about twice the noise level in the data. The raw data and the resultant parsed data for one specimen are shown in Figure 10a. These parsed data were then analyzed to determine the crack growth rate.
The fatigue crack growth rate, da/dN, was calculated from the parsed data using the secant method and the incremental polynomial method, described in ASTM E647 [4]. Using the secant method, fatigue crack growth rate was calculated as,
i1i
i1i
NN/dNd
aaa (6)
where ai is a crack length corresponding to cycle count Ni, and ai+1 and Ni+1 are crack length and cycle count values corresponding to the next available data point. The crack
13
length used to calculate G from this two point linear fit method is taken as the midpoint (average a) of the crack growth increment. Using the incremental polynomial method helps reduce error induced by noisy experimental data. The incremental polynomial method fits a parabola to successive sets of seven points of data. The fatigue growth rate is calculated as the derivative of this fit evaluated at the center point. The crack length used to calculate G is also taken from the center of the fit. The maximum cyclic G level was determined by substituting the estimated crack length and cyclic load for each growth rate measurement into equation 4. The data were plotted in the typical log-log form used for Paris law crack growth [5]. Typical results for fatigue crack growth are shown for the secant (2-point) and the sliding polynomial (7-point) data. The difference between the two reduction methods is illustrated in figure 10b. The sliding polynomial had significantly lower noise in the reduced data. For this paper the sliding polynomial method was used to reduce all of the crack growth vs. GIImax data.
The section of the curve that represented stable fatigue crack growth was isolated and analyzed. The lower limit of this curve was taken as the delamination onset point. The upper end of the linear region was determined visually and extracted to synthesize the delamination growth law. For each test specimen, the linear region data were plotted in the typical log-log form of a Paris law and the data were fit to a relationship in the form of Equation 7.
nDGdN
damaxII
(7)
The data beyond the linear growth region of the curve were truncated. The data from each source were combined and fit to a single growth law equation. The data were also fit separately for each of the five load levels for each manufacturer.
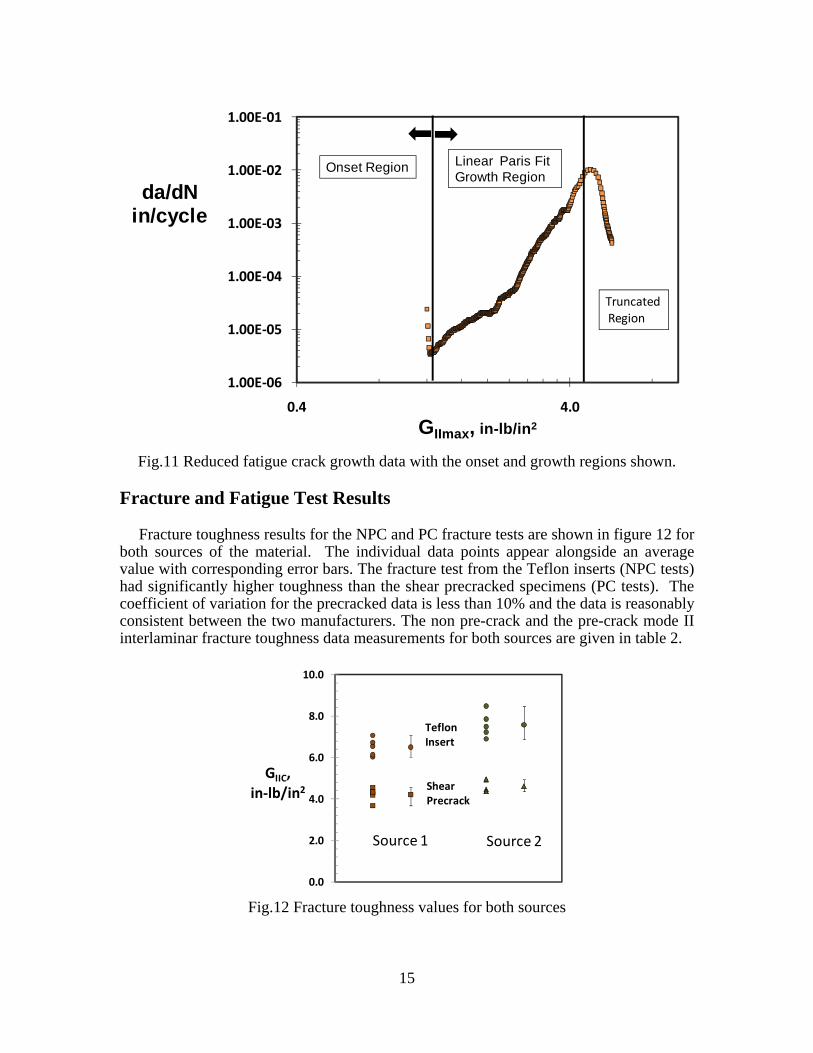
The reduced crack growth rate data are shown in Figure 11 for an entire fatigue test. The onset and growth regions are determined from these data. The onset of delamination growth was defined as the point where da/dN reaches its absolute minimum. The crack length corresponding to the minimum da/dN value was then used to linearly interpolate the corresponding compliance and cycle count from the parsed data. The cycle count was recorded and used to formulate GIImax vs. N onset curves and the associated change in compliance was also recorded. This curve represents the threshold when stable fatigue crack growth begins. Onset curves were developed for each manufacturer and a combined curve for the material was also generated using all of the data.
14
15.0
20.0
25.0
30.0
35.0
40.0
0 10000 20000 30000 40000
C,in-5/lb
N, cycles
0.50
1.00
1.50
2.00
2.50
0 10000 20000 30000 40000
a,in
N, cycles (a) (b)
Fig.9 Typical plot of compliance (a) and crack length (b) as a function of fatigue cycles.
0.910
0.915
0.920
0.925
0 500 1000
a,in
N, cycles
Raw Data
Parsed Data
1.00E‐06
1.00E‐05
1.00E‐04
1.00E‐03
1.00E‐02
1.00E‐01
1.0 10.0
da/dN,in/cycle
GIImax,
in-lb/in2
2 point Fit
7 point Fit
10 ‐1
10 ‐2
10 ‐3
10 ‐4
10 ‐5
10 ‐6
(a) (b)
Fig.10 Typical plot of (a) raw and parsed crack length data as a function of fatigue cycles and (b) reduced crack growth data using both ASTM E647 data reduction methods.
15
1.00E‐06
1.00E‐05
1.00E‐04
1.00E‐03
1.00E‐02
1.00E‐01
0.4 4.0
da/dNin/cycle
GIImax, in-lb/in2
Onset Region Linear Paris Fit Growth Region
TruncatedRegion
Fig.11 Reduced fatigue crack growth data with the onset and growth regions shown.
Fracture and Fatigue Test Results
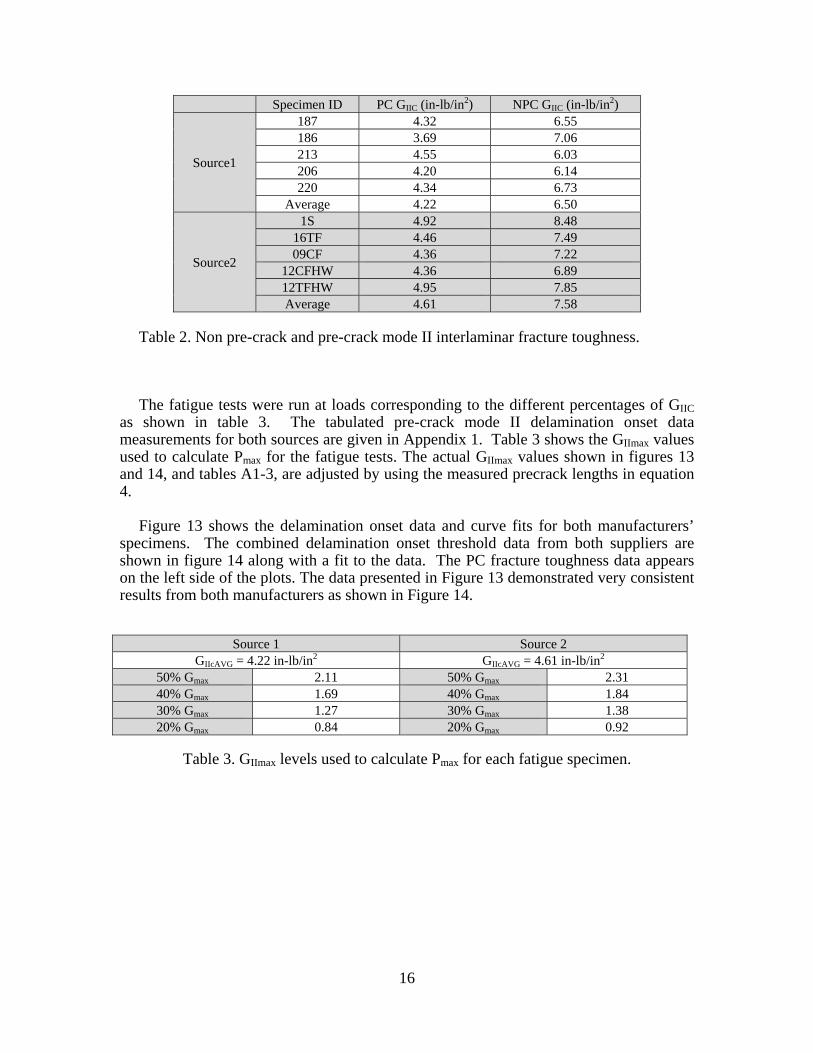
Fracture toughness results for the NPC and PC fracture tests are shown in figure 12 for both sources of the material. The individual data points appear alongside an average value with corresponding error bars. The fracture test from the Teflon inserts (NPC tests) had significantly higher toughness than the shear precracked specimens (PC tests). The coefficient of variation for the precracked data is less than 10% and the data is reasonably consistent between the two manufacturers. The non pre-crack and the pre-crack mode II interlaminar fracture toughness data measurements for both sources are given in table 2.
0.0
2.0
4.0
6.0
8.0
10.0
0 2 4 6
GIIC,in‐lb/in2
Source 1 Source 2
Teflon Insert
ShearPrecrack
Fig.12 Fracture toughness values for both sources
16
Specimen ID PC GIIC (in-lb/in2) NPC GIIC (in-lb/in2)
Source1
187 4.32 6.55 186 3.69 7.06 213 4.55 6.03 206 4.20 6.14 220 4.34 6.73
Average 4.22 6.50
Source2
1S 4.92 8.48 16TF 4.46 7.49 09CF 4.36 7.22
12CFHW 4.36 6.89 12TFHW 4.95 7.85 Average 4.61 7.58
Table 2. Non pre-crack and pre-crack mode II interlaminar fracture toughness.
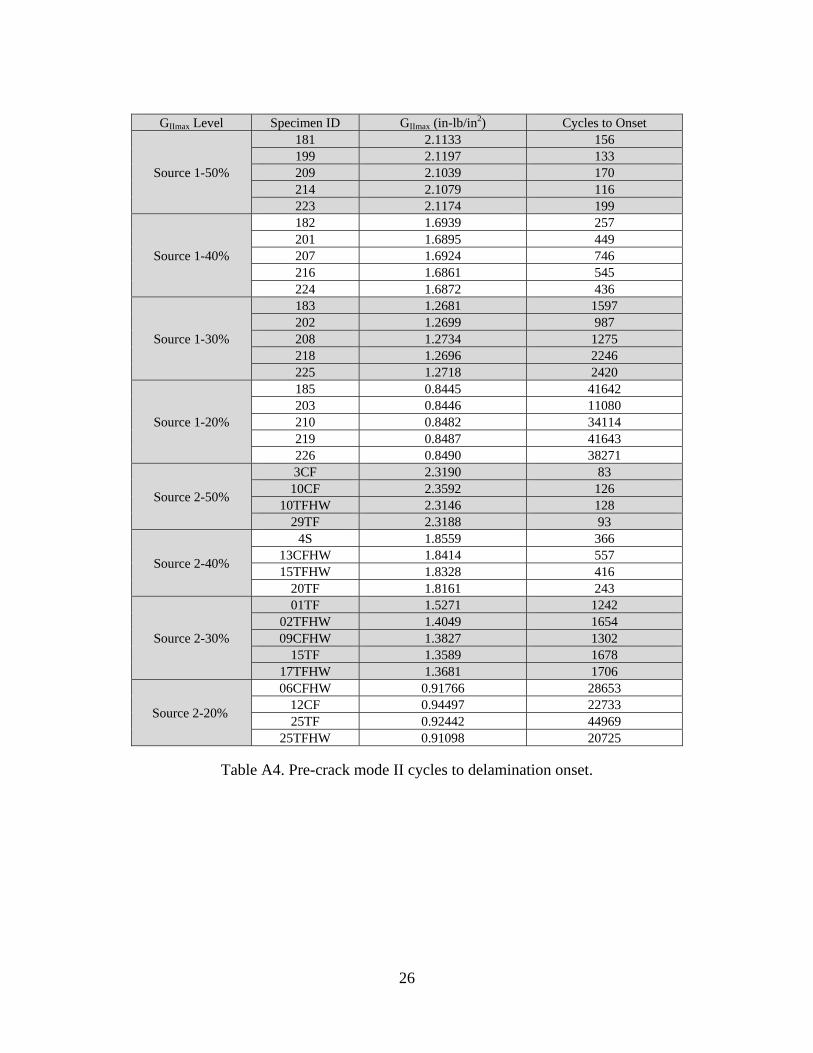
The fatigue tests were run at loads corresponding to the different percentages of GIIC as shown in table 3. The tabulated pre-crack mode II delamination onset data measurements for both sources are given in Appendix 1. Table 3 shows the GIImax values used to calculate Pmax for the fatigue tests. The actual GIImax values shown in figures 13 and 14, and tables A1-3, are adjusted by using the measured precrack lengths in equation 4.
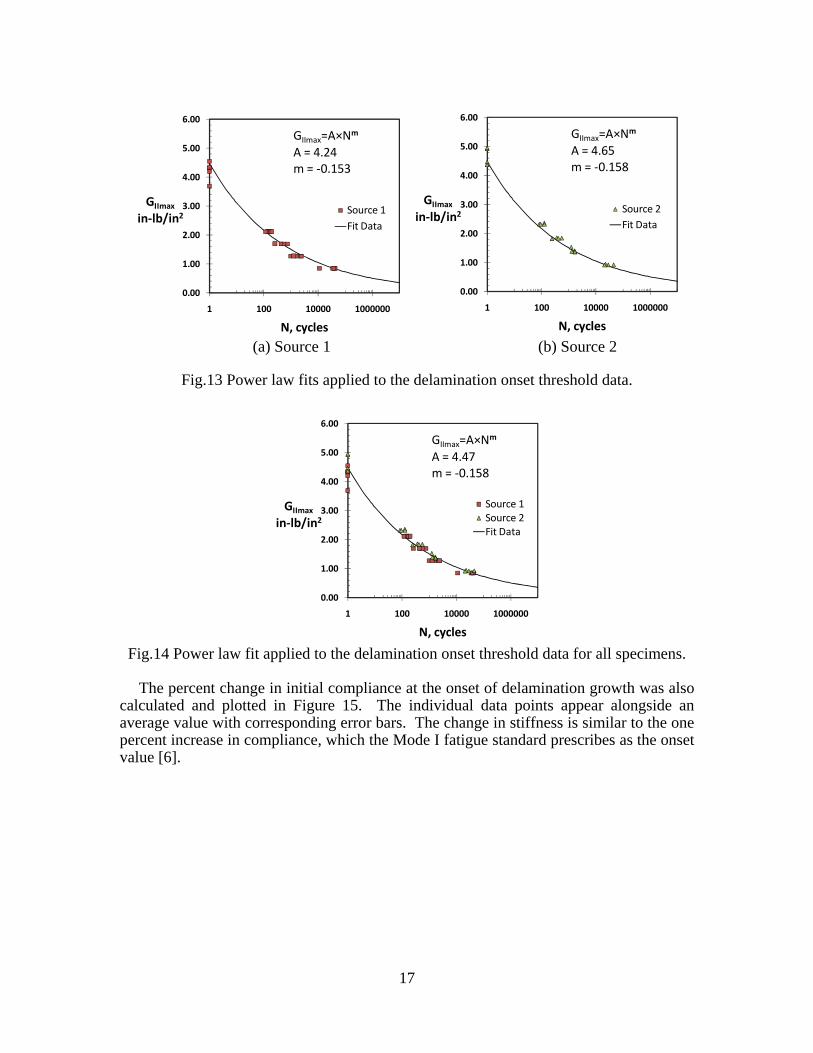
Figure 13 shows the delamination onset data and curve fits for both manufacturers’ specimens. The combined delamination onset threshold data from both suppliers are shown in figure 14 along with a fit to the data. The PC fracture toughness data appears on the left side of the plots. The data presented in Figure 13 demonstrated very consistent results from both manufacturers as shown in Figure 14.
Table 3. GIImax levels used to calculate Pmax for each fatigue specimen.
Source 1 Source 2 GIIcAVG = 4.22 in-lb/in2 GIIcAVG = 4.61 in-lb/in2
50% Gmax 2.11 50% Gmax 2.31 40% Gmax 1.69 40% Gmax 1.84 30% Gmax 1.27 30% Gmax 1.38 20% Gmax 0.84 20% Gmax 0.92
17
0.00
1.00
2.00
3.00
4.00
5.00
6.00
1 100 10000 1000000
GIImax
in‐lb/in2
N, cycles
Source 1
Fit Data
GIImax=A×Nm
A = 4.24m = ‐0.153
0.00
1.00
2.00
3.00
4.00
5.00
6.00
1 100 10000 1000000
GIImax
in‐lb/in2
N, cycles
Source 2
Fit Data
GIImax=A×Nm
A = 4.65m = ‐0.158
(a) Source 1 (b) Source 2
Fig.13 Power law fits applied to the delamination onset threshold data.
0.00
1.00
2.00
3.00
4.00
5.00
6.00
1 100 10000 1000000
GIImax
in‐lb/in2
N, cycles
Source 1Source 2Fit Data
GIImax=A×Nm
A = 4.47m = ‐0.158
Fig.14 Power law fit applied to the delamination onset threshold data for all specimens.
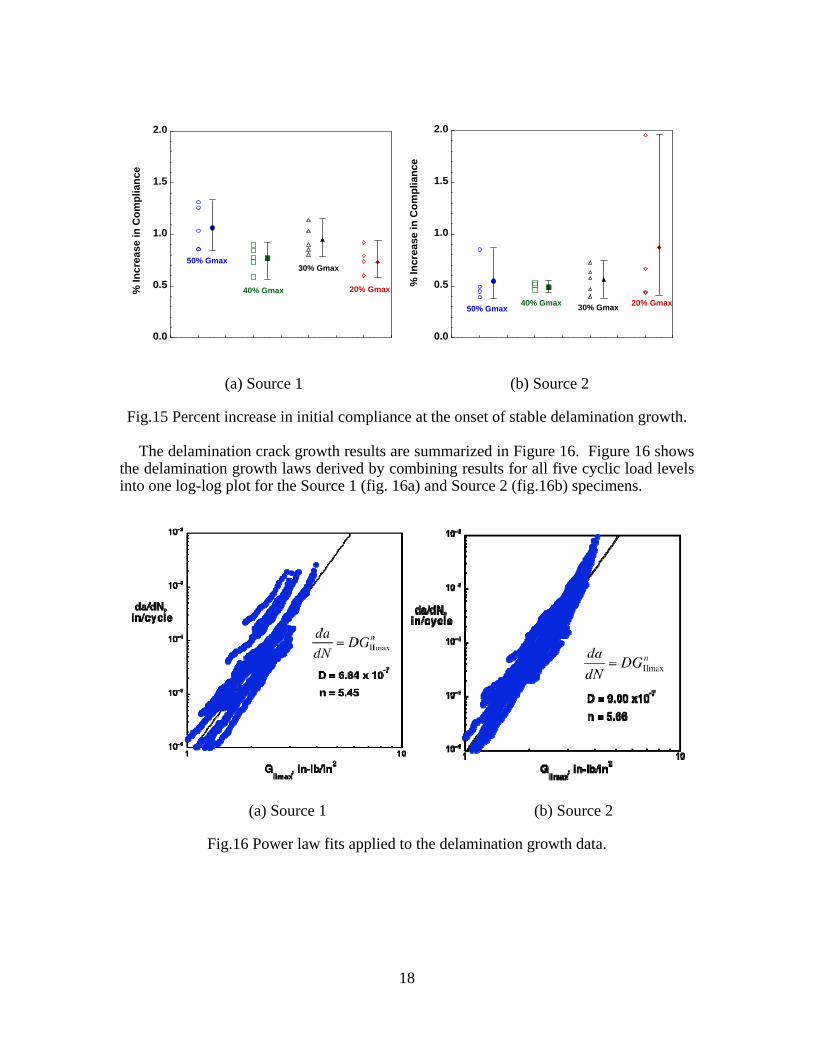
The percent change in initial compliance at the onset of delamination growth was also calculated and plotted in Figure 15. The individual data points appear alongside an average value with corresponding error bars. The change in stiffness is similar to the one percent increase in compliance, which the Mode I fatigue standard prescribes as the onset value [6].
18
0.0
0.5
1.0
1.5
2.0%
Incr
ease
in C
om
plia
nce
50% Gmax
40% Gmax
30% Gmax
20% Gmax
0.0
0.5
1.0
1.5
2.0
50% Gmax40% Gmax
30% Gmax
% In
crea
se in
Co
mp
lian
ce
20% Gmax
(a) Source 1 (b) Source 2
Fig.15 Percent increase in initial compliance at the onset of stable delamination growth.
The delamination crack growth results are summarized in Figure 16. Figure 16 shows the delamination growth laws derived by combining results for all five cyclic load levels into one log-log plot for the Source 1 (fig. 16a) and Source 2 (fig.16b) specimens.
(a) Source 1 (b) Source 2
Fig.16 Power law fits applied to the delamination growth data.
19
Discussion
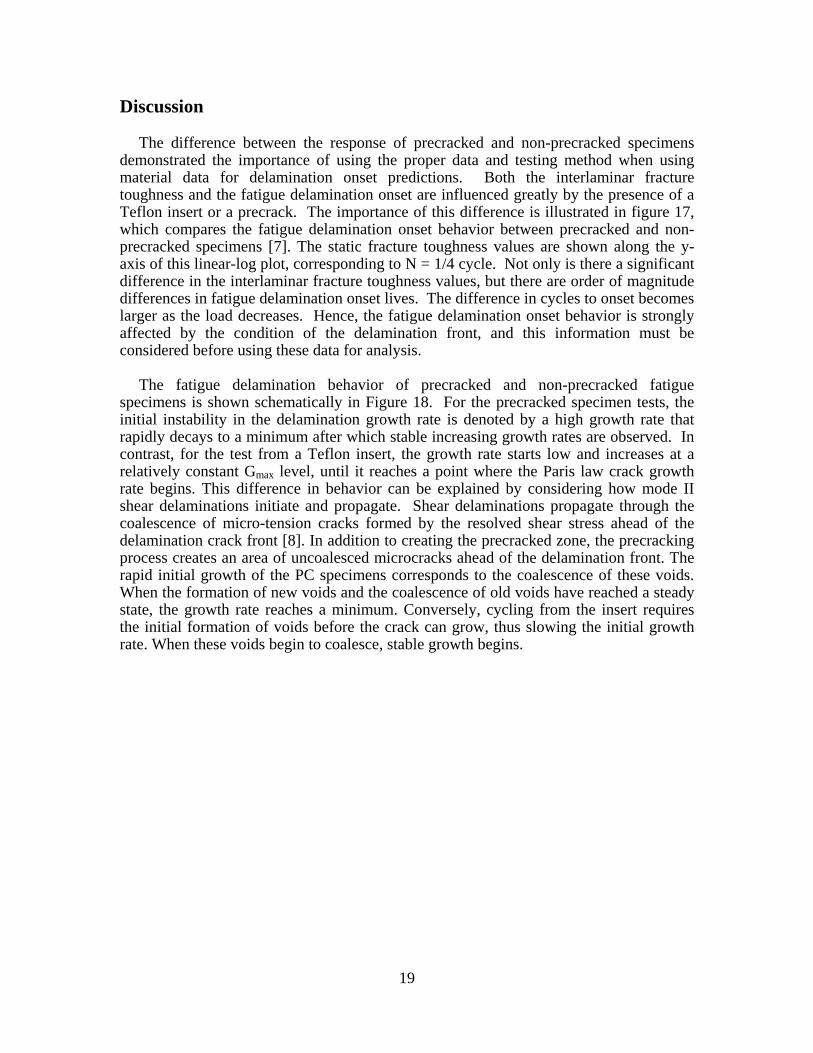
The difference between the response of precracked and non-precracked specimens demonstrated the importance of using the proper data and testing method when using material data for delamination onset predictions. Both the interlaminar fracture toughness and the fatigue delamination onset are influenced greatly by the presence of a Teflon insert or a precrack. The importance of this difference is illustrated in figure 17, which compares the fatigue delamination onset behavior between precracked and non-precracked specimens [7]. The static fracture toughness values are shown along the y-axis of this linear-log plot, corresponding to N = 1/4 cycle. Not only is there a significant difference in the interlaminar fracture toughness values, but there are order of magnitude differences in fatigue delamination onset lives. The difference in cycles to onset becomes larger as the load decreases. Hence, the fatigue delamination onset behavior is strongly affected by the condition of the delamination front, and this information must be considered before using these data for analysis.
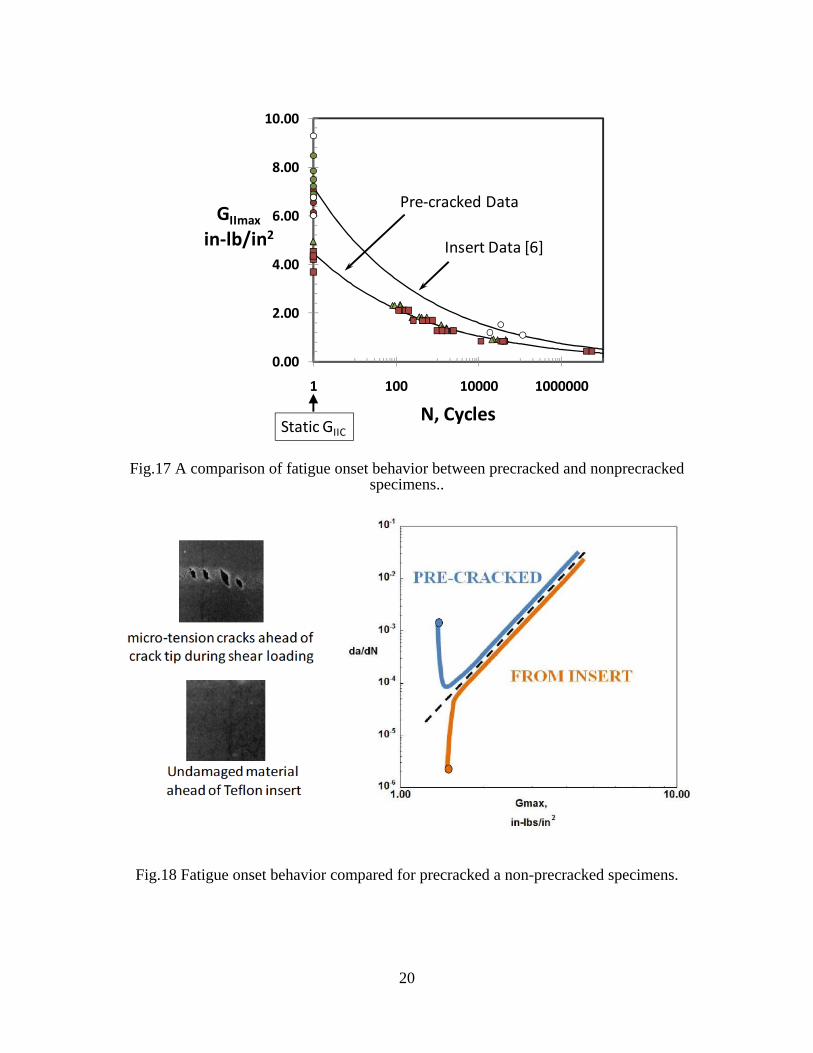
The fatigue delamination behavior of precracked and non-precracked fatigue specimens is shown schematically in Figure 18. For the precracked specimen tests, the initial instability in the delamination growth rate is denoted by a high growth rate that rapidly decays to a minimum after which stable increasing growth rates are observed. In contrast, for the test from a Teflon insert, the growth rate starts low and increases at a relatively constant Gmax level, until it reaches a point where the Paris law crack growth rate begins. This difference in behavior can be explained by considering how mode II shear delaminations initiate and propagate. Shear delaminations propagate through the coalescence of micro-tension cracks formed by the resolved shear stress ahead of the delamination crack front [8]. In addition to creating the precracked zone, the precracking process creates an area of uncoalesced microcracks ahead of the delamination front. The rapid initial growth of the PC specimens corresponds to the coalescence of these voids. When the formation of new voids and the coalescence of old voids have reached a steady state, the growth rate reaches a minimum. Conversely, cycling from the insert requires the initial formation of voids before the crack can grow, thus slowing the initial growth rate. When these voids begin to coalesce, stable growth begins.
20
0.00
2.00
4.00
6.00
8.00
10.00
1 100 10000 1000000
GIImax
in‐lb/in2
N, Cycles
Pre‐cracked Data
Insert Data [6]
Static GIIC
Fig.17 A comparison of fatigue onset behavior between precracked and nonprecracked specimens..
Fig.18 Fatigue onset behavior compared for precracked a non-precracked specimens.
21
Summary
Mode II interlaminar fracture toughness and delamination onset and growth characterization data were generated for IM7/8552 graphite epoxy composite materials from two suppliers for use in fracture mechanics analyses. The results for material produced by the two suppliers were similar for all material property values measured.
Insight was gained into testing that should be valuable for current and future material property standards. The draft ASTM procedure for GIIc was followed and produced consistently repeatable interlaminar fracture toughness values. Furthermore, the testing procedures developed in this study, and the associated test results, will be useful for developing mode II fatigue standards. Methods were developed to parse and analyze fatigue data. Development of a Mode II fatigue delamination onset curve for precracked specimens and specimens with inserts were discussed. The effects of performing material property tests from either precracks or inserts was discussed and compared. Testing from a precracked specimen gave more conservative properties than testing from an insert, for both interlaminar fracture toughness and fatigue onset data.
22
References
[1] ASTM Draft Standard Test Method for Determination of the Mode II Interlaminar Fracture Toughness of Unidirectional Fiber Reinforced Polymer Matrix Composites using the End-Notched Flexure (ENF) Test.
[2] Fracture Technology Associates, Bethlehem, PA, http://www.fracturetech.com/index.html.
[3] D. Broek, Elementary Engineering Fracture Mechanics, 1991, p.124.
[4] ASTM International, E 647-00, “Standard Test Method for Measurement of Fatigue Crack Growth Rates”.
[5] P. C. Paris, M. P. Gomez and W. E. Anderson, “A Rational Analytic Theory of Fatigue,” The Trend in Engineering (1961). 13, pp. 9-14.
[6] Standard Test Method for Mode I Fatigue Delamination Growth Onset of Unidirectional Fiber- Reinforced Polymer Matrix Composites, ASTM standard D6115-97, American Society for Testing and Materials Annual Book of standards, Vol. 15.03, 1997, pp. 338-343.
[7] R. Martin, U.S. Army European Research Office Report - Report# N68171-98-M-5177, 1998.
[8] O'Brien, T.K., “Composite Interlaminar Shear Fracture Toughness: GIIc: Shear Measurement or Sheer Myth?”, Composite Materials: Fatigue and Fracture, Seventh Volume, ASTM STP 1330, 1998, pp. 3-18.

23
APPENDIX 1 – Tabulated Data
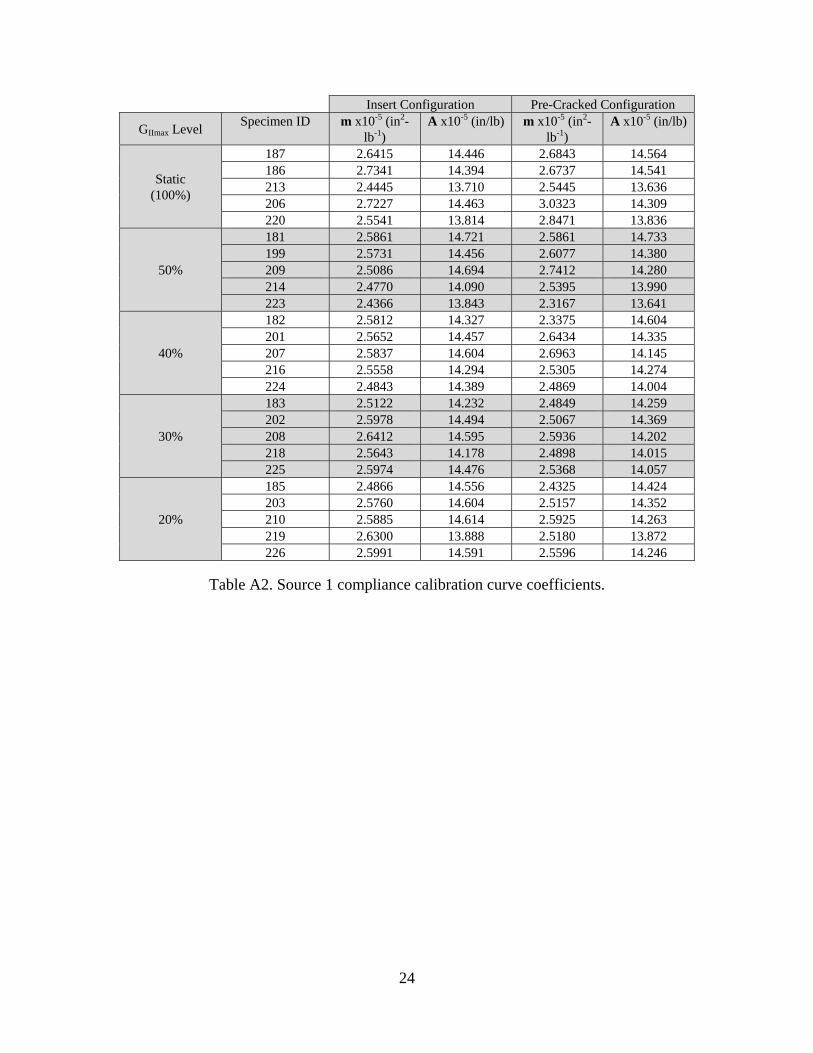
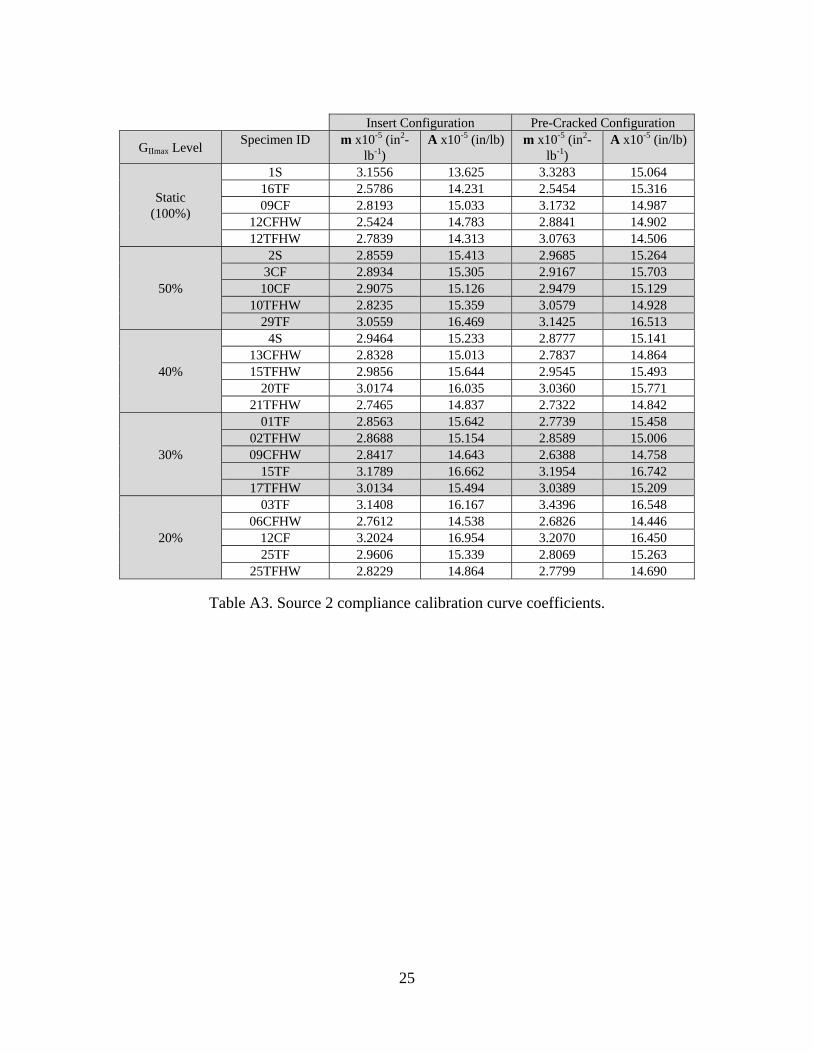
This appendix tabulates the data used in this report for future reference. Specimen thicknesses and widths, measured at three locations along the length and averaged, are shown in Table A1 for both manufacturers (referred to as Source 1 and Source 2). The non-precracked and precracked compliance calibration coefficients are summarized in tables A2 and A3 below for Source 1 and Source 2 specimens, respectively. The fatigue onset data is summarized in table A4 for both sources
Source 1 Source 2 Specimen ID Width, B (in) Thickness (in) Specimen ID Width, B (in) Thickness (in)
181 0.992 0.1770 03CF 0.999 0.1723 182 0.991 0.1773 09CF 0.997 0.1760 183 0.991 0.1767 10CF 0.998 0.1752 185 0.989 0.1777 12CF 0.998 0.1687 186 0.993 0.1778 06CFHW 0.997 0.1793 187 0.991 0.1765 09CFHW 0.997 0.1775 199 0.991 0.1768 12CFHW 0.997 0.1748 201 0.992 0.1772 13CFHW 0.998 0.1755 202 0.991 0.1767 1S 0.994 0.1727 203 0.991 0.1765 2S 0.991 0.1753 206 0.990 0.1787 4S 0.993 0.1728 207 0.990 0.1793 01TF 0.998 0.1742 208 0.988 0.1792 03TF 0.998 0.1713 209 0.991 0.1783 15TF 0.997 0.1677 210 0.989 0.1782 16TF 0.997 0.1715 213 0.986 0.1823 20TF 0.998 0.1720 214 0.990 0.1788 25TF 0.998 0.1725 216 0.990 0.1783 29TF 0.998 0.1698 218 0.991 0.1783 02TFHW 0.990 0.1748 219 0.990 0.1792 10TFHW 0.990 0.1760 220 0.986 0.1807 12TFHW 0.989 0.1763 223 0.990 0.1828 15TFHW 0.990 0.1723 224 0.987 0.1813 17TFHW 0.990 0.1720 225 0.988 0.1803 21TFHW 0.990 0.1765 226 0.989 0.1788 25TFHW 0.992 0.1767
Table A1. ENF specimen dimensions.
24
Insert Configuration Pre-Cracked Configuration
GIImax Level Specimen ID m x10-5 (in2-
lb-1) A x10-5 (in/lb) m x10-5 (in2-
lb-1) A x10-5 (in/lb)
Static (100%)
187 2.6415 14.446 2.6843 14.564 186 2.7341 14.394 2.6737 14.541 213 2.4445 13.710 2.5445 13.636 206 2.7227 14.463 3.0323 14.309 220 2.5541 13.814 2.8471 13.836
50%
181 2.5861 14.721 2.5861 14.733 199 2.5731 14.456 2.6077 14.380 209 2.5086 14.694 2.7412 14.280 214 2.4770 14.090 2.5395 13.990 223 2.4366 13.843 2.3167 13.641
40%
182 2.5812 14.327 2.3375 14.604 201 2.5652 14.457 2.6434 14.335 207 2.5837 14.604 2.6963 14.145 216 2.5558 14.294 2.5305 14.274 224 2.4843 14.389 2.4869 14.004
30%
183 2.5122 14.232 2.4849 14.259 202 2.5978 14.494 2.5067 14.369 208 2.6412 14.595 2.5936 14.202 218 2.5643 14.178 2.4898 14.015 225 2.5974 14.476 2.5368 14.057
20%
185 2.4866 14.556 2.4325 14.424 203 2.5760 14.604 2.5157 14.352 210 2.5885 14.614 2.5925 14.263 219 2.6300 13.888 2.5180 13.872 226 2.5991 14.591 2.5596 14.246
Table A2. Source 1 compliance calibration curve coefficients.
25
Insert Configuration Pre-Cracked Configuration
GIImax Level Specimen ID m x10-5 (in2-
lb-1) A x10-5 (in/lb) m x10-5 (in2-
lb-1) A x10-5 (in/lb)
Static (100%)
1S 3.1556 13.625 3.3283 15.064 16TF 2.5786 14.231 2.5454 15.316 09CF 2.8193 15.033 3.1732 14.987
12CFHW 2.5424 14.783 2.8841 14.902 12TFHW 2.7839 14.313 3.0763 14.506
50%
2S 2.8559 15.413 2.9685 15.264 3CF 2.8934 15.305 2.9167 15.703
10CF 2.9075 15.126 2.9479 15.129 10TFHW 2.8235 15.359 3.0579 14.928
29TF 3.0559 16.469 3.1425 16.513
40%
4S 2.9464 15.233 2.8777 15.141 13CFHW 2.8328 15.013 2.7837 14.864 15TFHW 2.9856 15.644 2.9545 15.493
20TF 3.0174 16.035 3.0360 15.771 21TFHW 2.7465 14.837 2.7322 14.842
30%
01TF 2.8563 15.642 2.7739 15.458 02TFHW 2.8688 15.154 2.8589 15.006 09CFHW 2.8417 14.643 2.6388 14.758
15TF 3.1789 16.662 3.1954 16.742 17TFHW 3.0134 15.494 3.0389 15.209
20%
03TF 3.1408 16.167 3.4396 16.548 06CFHW 2.7612 14.538 2.6826 14.446
12CF 3.2024 16.954 3.2070 16.450 25TF 2.9606 15.339 2.8069 15.263
25TFHW 2.8229 14.864 2.7799 14.690
Table A3. Source 2 compliance calibration curve coefficients.
26
GIImax Level Specimen ID GIImax (in-lb/in2) Cycles to Onset
Source 1-50%
181 2.1133 156 199 2.1197 133 209 2.1039 170 214 2.1079 116 223 2.1174 199
Source 1-40%
182 1.6939 257 201 1.6895 449 207 1.6924 746 216 1.6861 545 224 1.6872 436
Source 1-30%
183 1.2681 1597 202 1.2699 987 208 1.2734 1275 218 1.2696 2246 225 1.2718 2420
Source 1-20%
185 0.8445 41642 203 0.8446 11080 210 0.8482 34114 219 0.8487 41643 226 0.8490 38271
Source 2-50%
3CF 2.3190 83 10CF 2.3592 126
10TFHW 2.3146 128 29TF 2.3188 93
Source 2-40%
4S 1.8559 366 13CFHW 1.8414 557 15TFHW 1.8328 416
20TF 1.8161 243
Source 2-30%
01TF 1.5271 1242 02TFHW 1.4049 1654 09CFHW 1.3827 1302
15TF 1.3589 1678 17TFHW 1.3681 1706
Source 2-20%
06CFHW 0.91766 28653 12CF 0.94497 22733 25TF 0.92442 44969
25TFHW 0.91098 20725
Table A4. Pre-crack mode II cycles to delamination onset.
27
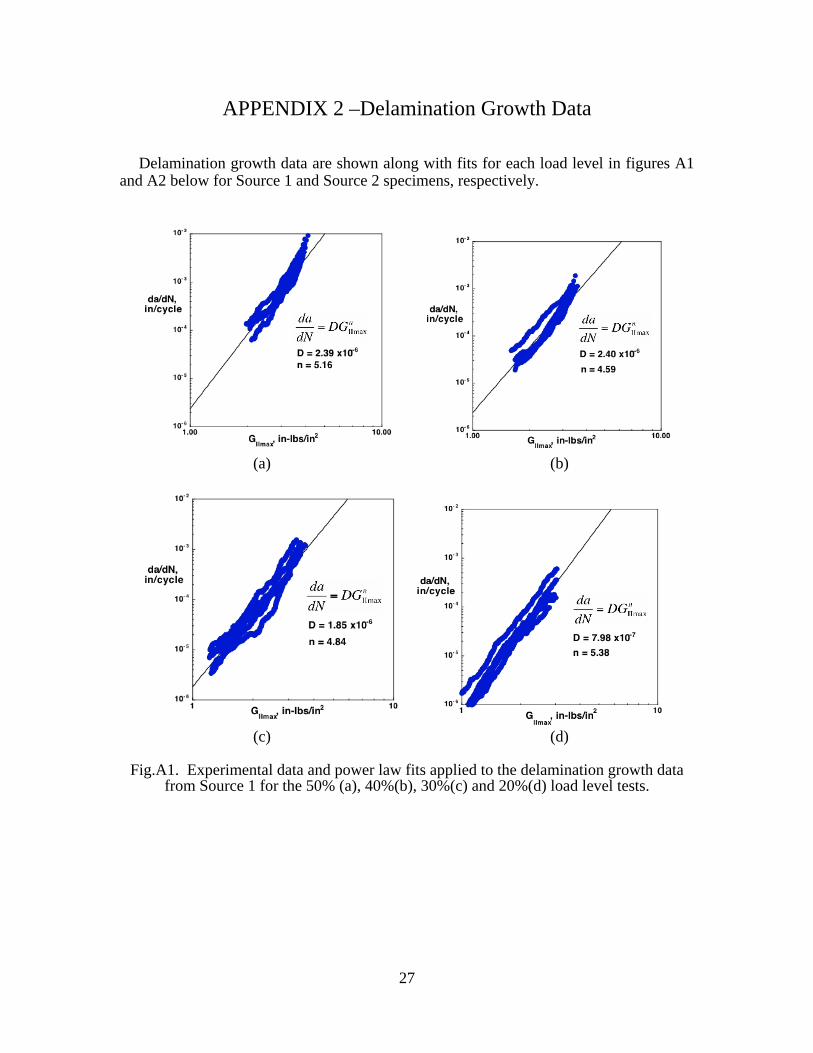
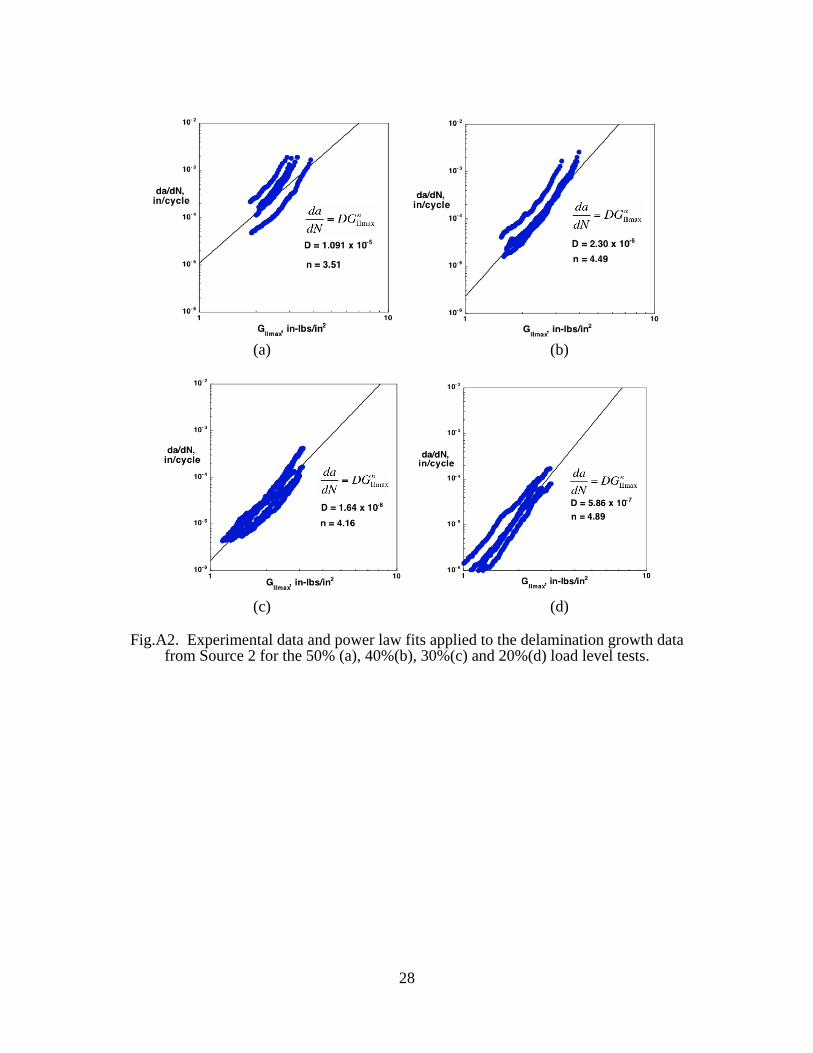
APPENDIX 2 –Delamination Growth Data
Delamination growth data are shown along with fits for each load level in figures A1 and A2 below for Source 1 and Source 2 specimens, respectively.
(a) (b)
(c) (d)
Fig.A1. Experimental data and power law fits applied to the delamination growth data from Source 1 for the 50% (a), 40%(b), 30%(c) and 20%(d) load level tests.
28
(a) (b)
(c) (d)
Fig.A2. Experimental data and power law fits applied to the delamination growth data from Source 2 for the 50% (a), 40%(b), 30%(c) and 20%(d) load level tests.
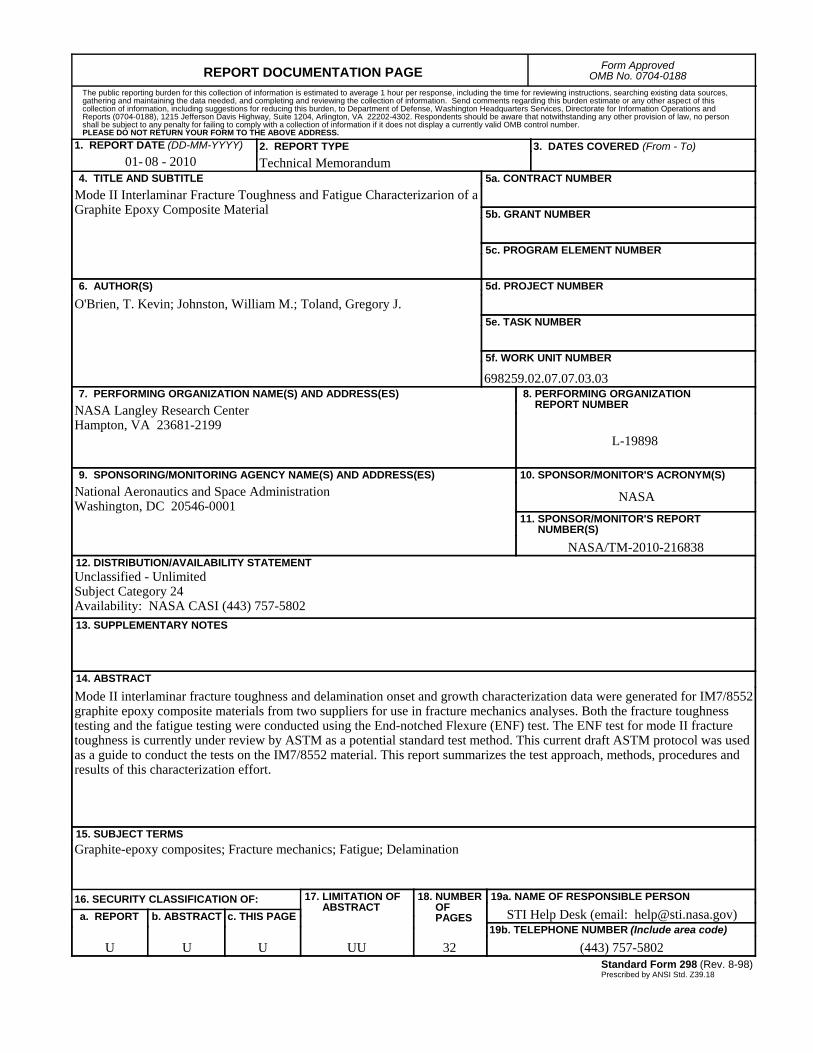
REPORT DOCUMENTATION PAGE Form ApprovedOMB No. 0704-0188
2. REPORT TYPE Technical Memorandum
4. TITLE AND SUBTITLEMode II Interlaminar Fracture Toughness and Fatigue Characterizarion of a Graphite Epoxy Composite Material
5a. CONTRACT NUMBER
6. AUTHOR(S)
O'Brien, T. Kevin; Johnston, William M.; Toland, Gregory J.
7. PERFORMING ORGANIZATION NAME(S) AND ADDRESS(ES)NASA Langley Research CenterHampton, VA 23681-2199
9. SPONSORING/MONITORING AGENCY NAME(S) AND ADDRESS(ES)National Aeronautics and Space AdministrationWashington, DC 20546-0001
8. PERFORMING ORGANIZATION REPORT NUMBER
L-19898
10. SPONSOR/MONITOR'S ACRONYM(S)
NASA
13. SUPPLEMENTARY NOTES
12. DISTRIBUTION/AVAILABILITY STATEMENTUnclassified - UnlimitedSubject Category 24Availability: NASA CASI (443) 757-5802
19a. NAME OF RESPONSIBLE PERSON
STI Help Desk (email: [email protected])
14. ABSTRACT
Mode II interlaminar fracture toughness and delamination onset and growth characterization data were generated for IM7/8552 graphite epoxy composite materials from two suppliers for use in fracture mechanics analyses. Both the fracture toughness testing and the fatigue testing were conducted using the End-notched Flexure (ENF) test. The ENF test for mode II fracture toughness is currently under review by ASTM as a potential standard test method. This current draft ASTM protocol was used as a guide to conduct the tests on the IM7/8552 material. This report summarizes the test approach, methods, procedures and results of this characterization effort.
15. SUBJECT TERMSGraphite-epoxy composites; Fracture mechanics; Fatigue; Delamination
18. NUMBER OF PAGES
3219b. TELEPHONE NUMBER (Include area code)
(443) 757-5802
a. REPORT
U
c. THIS PAGE
U
b. ABSTRACT
U
17. LIMITATION OF ABSTRACT
UU
Prescribed by ANSI Std. Z39.18Standard Form 298 (Rev. 8-98)
3. DATES COVERED (From - To)
5b. GRANT NUMBER
5c. PROGRAM ELEMENT NUMBER
5d. PROJECT NUMBER
5e. TASK NUMBER
5f. WORK UNIT NUMBER
698259.02.07.07.03.03
11. SPONSOR/MONITOR'S REPORT NUMBER(S)
NASA/TM-2010-216838
16. SECURITY CLASSIFICATION OF:
The public reporting burden for this collection of information is estimated to average 1 hour per response, including the time for reviewing instructions, searching existing data sources, gathering and maintaining the data needed, and completing and reviewing the collection of information. Send comments regarding this burden estimate or any other aspect of this collection of information, including suggestions for reducing this burden, to Department of Defense, Washington Headquarters Services, Directorate for Information Operations and Reports (0704-0188), 1215 Jefferson Davis Highway, Suite 1204, Arlington, VA 22202-4302. Respondents should be aware that notwithstanding any other provision of law, no person shall be subject to any penalty for failing to comply with a collection of information if it does not display a currently valid OMB control number.PLEASE DO NOT RETURN YOUR FORM TO THE ABOVE ADDRESS.
1. REPORT DATE (DD-MM-YYYY)08 - 201001-
![Edinburgh Research Explorer - Abstract: · Web view[53]F.A. Almansour, H.N. Dhakal, Z.Y. Zhang, Effect of water absorption on mode I interlaminar fracture toughness of flax/basalt](https://img.pdfslide.net/doc/110x75/60493cfb128a0261de70e6f2/edinburgh-research-explorer-abstract-web-view-53fa-almansour-hn-dhakal.jpg)