Embed Size (px)
Citation preview

19.10.2016 © 2016 UNIVERSITÄT ROSTOCK | FAKULTÄT FÜR INFORMATIK UND ELEKTROTECHNIK
Model Order Reduction using the COMSOL Multiphysics® Software - A Compact Model of a
Wireless Power Transfer System
M.Sc. Jairo A. Pico
Dr.-Ing. Tamara Bechtold
Prof. Dr.-Ing. Dennis Hohlfeld
July, 2016
Introduction
Fundamentals
Model Order Reduction
Numerical Modelling
Results
Conclusions and Outlook
19.10.2016 © 2016 UNIVERSITÄT ROSTOCK | FAKULTÄT FÜR INFORMATIK UND ELEKTROTECHNIK 2
Outline

19.10.2016 © 2016 UNIVERSITÄT ROSTOCK | FAKULTÄT FÜR INFORMATIK UND ELEKTROTECHNIK 5
Introduction
Resonant Inductive Coupling
• Improved power transfer efficiency by using resonant circuits(i.e. a series/parallel capacitor for each coil)
• Greater distances in the range of meters can be covered.
• Interference in radio communications can be introduced.
• Further studies are needed in regard of human exposure to electromagnetic fields.

19.10.2016 © 2016 UNIVERSITÄT ROSTOCK | FAKULTÄT FÜR INFORMATIK UND ELEKTROTECHNIK 7
Introduction
The company IPT-Technology wirelesslycharging buses equipped with receiver coils,which are energized as they stop or parkover powered pads, those embedded in theroadway or in the garage floor.
Since 2002, its buses are serving along thecities of Turin and Genoa.
The company Bombardier alsodeveloped a suite of e-mobilitysolutions for electric transit,containing on-board lightbatteries.
Currently some deployments oftheir WPT buses are underwayin Mannheim and Berlin,Germany, as well as in Bruges,Belgium.

19.10.2016 © 2016 UNIVERSITÄT ROSTOCK | FAKULTÄT FÜR INFORMATIK UND ELEKTROTECHNIK 8
Introduction
In 2009, Bombardier introduced anWPT Rail Tram in Augsburg, Germany.
The system deliver a power output inthe range of 100-500 kW at 200 kHz,the tram achieves up to 90 km/h..
Companies HELLA and VAHLE worktogether with two approaches in cars:
• locating the coils beneath the car,
• a coil surrounding the frontal licenseplate, while the other in a pole.
Several configurations for the coils are developed: bipolar solenoid, unipolarrectangular and bipolar rectangular, for systems delivering up to 3.7 kW.
Distance between coils in the range of 80-250 mm, and with an axismisalignment lower than 100 mm.

19.10.2016 © 2016 UNIVERSITÄT ROSTOCK | FAKULTÄT FÜR INFORMATIK UND ELEKTROTECHNIK 9
Introduction
In 2007, an initial report demonstratedefficient WPT over distances up to eighttimes the radius of the coil.
Approximately 40% of efficiency wasreached over distances in excess of twometers.
In 2010, a work with helical coils waspresented, allegedly providing a betterapproach between the analytical model andits experimental counterpart.
It was informed that power efficiency was upto 87% at a distance of 75 cm, with aresonant frequency of 10 MHz.
19.10.2016 © 2016 UNIVERSITÄT ROSTOCK | FAKULTÄT FÜR INFORMATIK UND ELEKTROTECHNIK 10
Introduction
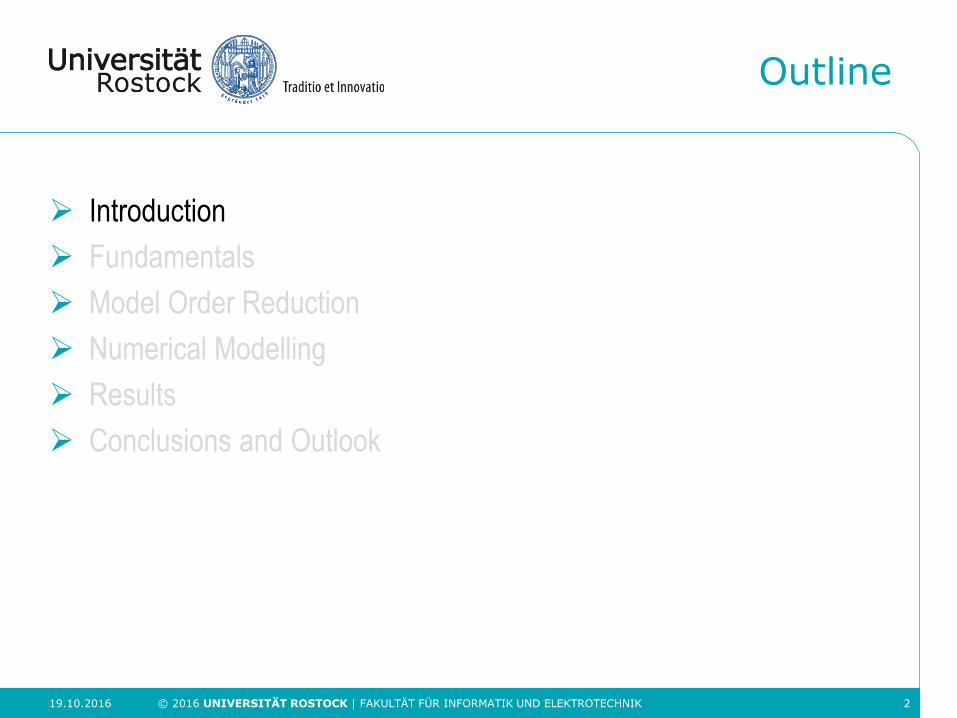
In 2013, an experiment is conducted inregard of measuring the efficiency whenaluminium plates are placed behind theresonators.
Efficiency greater than 96% wasdelivered in a distance of 60 cm, for aresonator with a coil radius of 30 cm at8.4 MHz.
In 2014, a full recharging system is reportedfor EVs, the circuit is operated at 400 VDC anda frequency range between 10 to 200 kHz.
The system consisted of a couple of rectanglecoils each attached to a ferrite layer, avoidingthat any magnetic field flux reaches the car,which were also covered by an shieldaluminum plate.

19.10.2016 © 2016 UNIVERSITÄT ROSTOCK | FAKULTÄT FÜR INFORMATIK UND ELEKTROTECHNIK 11
Introduction
Fundamentals
Model Order Reduction
Numerical Modelling
Results
Conclusions and Outlook
Outline

19.10.2016 © 2016 UNIVERSITÄT ROSTOCK | FAKULTÄT FÜR INFORMATIK UND ELEKTROTECHNIK 13
Fundamentals
WPT circuit analysis
When a pair of coils are apart fromeach other, their resonance frequenciesare:
However, as they are placed near, their coupling coefficient 𝑘 > 0 , Both coils
are coupled magnetically, through the mutual inductance 𝑀 = 𝑘 𝐿𝑝𝐿𝑠, and
can exchange energy, as the lumped circuit represented in the diagram.

19.10.2016 © 2016 UNIVERSITÄT ROSTOCK | FAKULTÄT FÜR INFORMATIK UND ELEKTROTECHNIK 14
Fundamentals
WPT circuit analysis (Cont‘d)
An equivalent lumped circuit can beelaborated, since the mutualinductance M can be represented as acoupled inductance, between primaryand secondary resonators.
The Kirchhoff’s Voltage Law (KVL)equations for primary and secondarycircuits can be formulatedstraightforward from the circuit .

19.10.2016 © 2016 UNIVERSITÄT ROSTOCK | FAKULTÄT FÜR INFORMATIK UND ELEKTROTECHNIK 15
Fundamentals
Frequency splitting
At resonance, reactance of the circuit iszero for input impedance, and thus ityields a fourth degree polynomial withthe following solutions, if it is assumedthat 𝑅𝐿 = 𝑅𝑝 = 𝑅𝑠 = 0:
In case both resonant frequencies are set to thesame value 𝜔𝑝 = 𝜔𝑠 = 𝜔0 , then only two
solutions are yielded:
19.10.2016 © 2016 UNIVERSITÄT ROSTOCK | FAKULTÄT FÜR INFORMATIK UND ELEKTROTECHNIK 16
Fundamentals
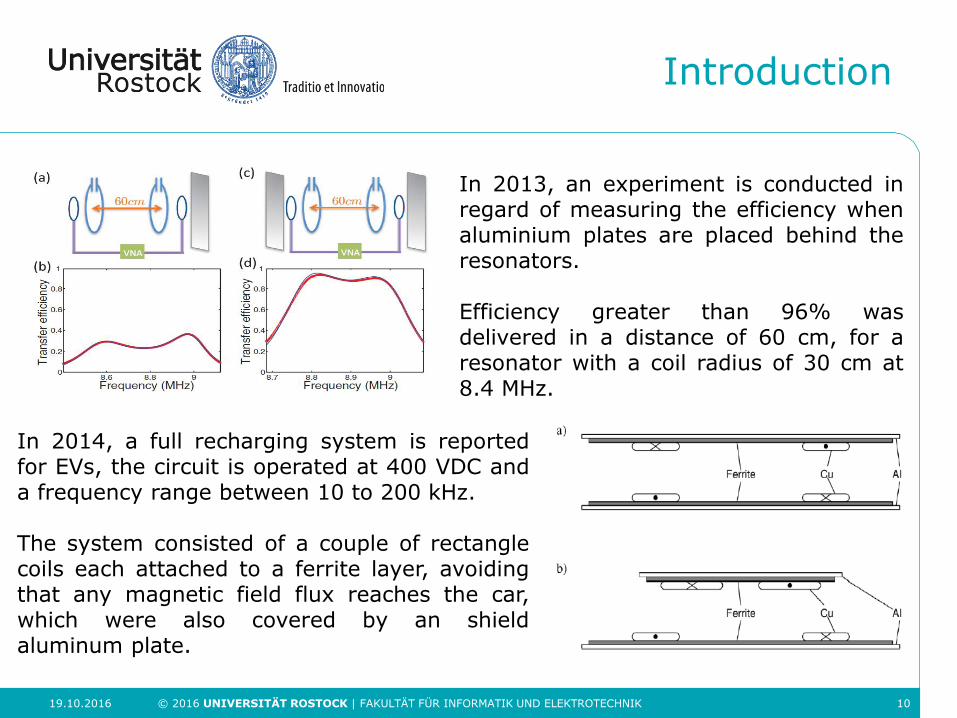
Power transfer efficiency
Defined as the ratio of the output power 𝑃𝑜𝑢𝑡 divided by the input power 𝑃𝑖𝑛:

19.10.2016 © 2016 UNIVERSITÄT ROSTOCK | FAKULTÄT FÜR INFORMATIK UND ELEKTROTECHNIK 18
Fundamentals
Numerical modeling by using Finite Element Method (FEM)
Ampère’s law is used for solving problems in electrical and magnetism fields,
which can be expressed in terms of the magnetic vector potential 𝐴:
𝐻: magnetic field strength
𝐵:magnetic field
𝐷:electric displacement field
𝐸: electric field 𝐽: total current density𝑉: electric potential. 𝐽𝑒: source current densityµ0:permeability constant𝜎: conductivity 𝜀0: permittivity constant𝐼𝑐𝑜𝑖𝑙: current flowing in the coil
Multi-turn Coil:

19.10.2016 © 2016 UNIVERSITÄT ROSTOCK | FAKULTÄT FÜR INFORMATIK UND ELEKTROTECHNIK 19
Introduction
Fundamentals
Model Order Reduction
Numerical Modelling
Results
Conclusions and Outlook
Outline

19.10.2016 © 2016 UNIVERSITÄT ROSTOCK | FAKULTÄT FÜR INFORMATIK UND ELEKTROTECHNIK 20
Model Order Reduction
First order systems

19.10.2016 © 2016 UNIVERSITÄT ROSTOCK | FAKULTÄT FÜR INFORMATIK UND ELEKTROTECHNIK 21
Model Order Reduction
Transfer function of first order systems
By using Neumann Expansion:
Moments of H(s):

19.10.2016 © 2016 UNIVERSITÄT ROSTOCK | FAKULTÄT FÜR INFORMATIK UND ELEKTROTECHNIK 23
Model Order Reduction
Approximation by Projection.
Orthogonal projection of a vector onto another vector

19.10.2016 © 2016 UNIVERSITÄT ROSTOCK | FAKULTÄT FÜR INFORMATIK UND ELEKTROTECHNIK 24
Model Order Reduction
Approximation by Projection.
Orthogonal projection of a vector onto a plane

19.10.2016 © 2016 UNIVERSITÄT ROSTOCK | FAKULTÄT FÜR INFORMATIK UND ELEKTROTECHNIK 25
Model Order Reduction
Approximation by Projection.
General Projection of a Vector

19.10.2016 © 2016 UNIVERSITÄT ROSTOCK | FAKULTÄT FÜR INFORMATIK UND ELEKTROTECHNIK 26
Model Order Reduction
Approximation by Projection.

19.10.2016 © 2016 UNIVERSITÄT ROSTOCK | FAKULTÄT FÜR INFORMATIK UND ELEKTROTECHNIK 27
Model Order Reduction
Approximation by Projection. (Cont’d)

19.10.2016 © 2016 UNIVERSITÄT ROSTOCK | FAKULTÄT FÜR INFORMATIK UND ELEKTROTECHNIK 36
Model Order Reduction
Second Order Systems
𝑃 ∈ ℝ𝑛×𝑛 is a non-singular matrix, and its choice is optional and has no effect on the results

19.10.2016 © 2016 UNIVERSITÄT ROSTOCK | FAKULTÄT FÜR INFORMATIK UND ELEKTROTECHNIK 41
Model Order Reduction
Arnoldi Method (Cont’d)
19.10.2016 © 2016 UNIVERSITÄT ROSTOCK | FAKULTÄT FÜR INFORMATIK UND ELEKTROTECHNIK 42
Introduction
Fundamentals
Model Order Reduction
Numerical Modelling
Results
Conclusions and Outlook
Outline
19.10.2016 © 2016 UNIVERSITÄT ROSTOCK | FAKULTÄT FÜR INFORMATIK UND ELEKTROTECHNIK 44
Numerical Modelling
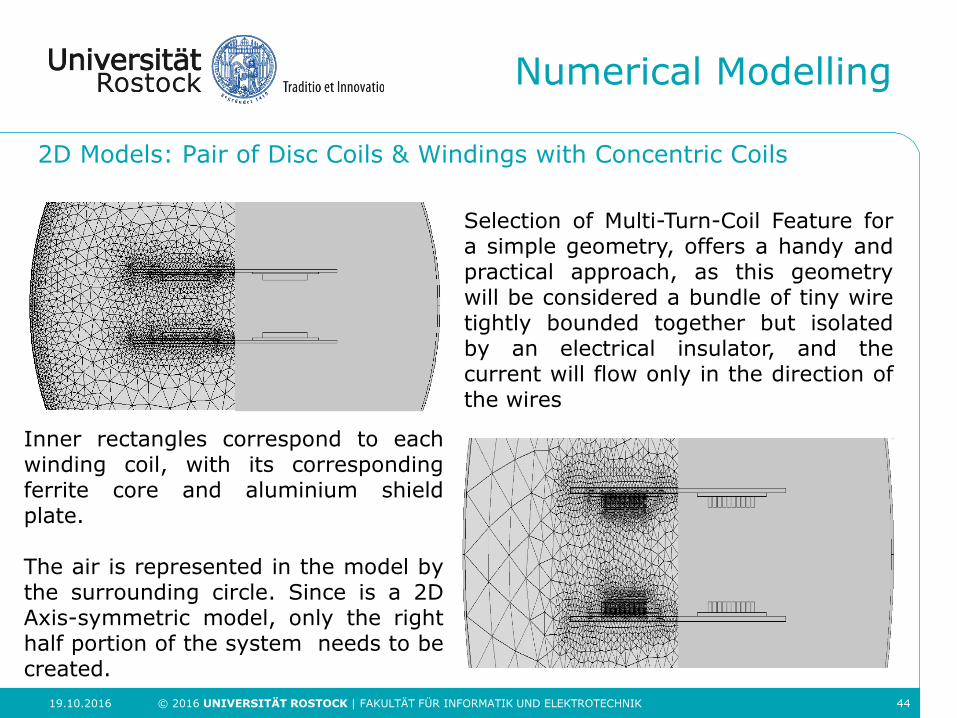
2D Models: Pair of Disc Coils & Windings with Concentric Coils
Inner rectangles correspond to eachwinding coil, with its correspondingferrite core and aluminium shieldplate.
The air is represented in the model bythe surrounding circle. Since is a 2DAxis-symmetric model, only the righthalf portion of the system needs to becreated.
Selection of Multi-Turn-Coil Feature fora simple geometry, offers a handy andpractical approach, as this geometrywill be considered a bundle of tiny wiretightly bounded together but isolatedby an electrical insulator, and thecurrent will flow only in the direction ofthe wires

19.10.2016 © 2016 UNIVERSITÄT ROSTOCK | FAKULTÄT FÜR INFORMATIK UND ELEKTROTECHNIK 45
Numerical Modelling
3D model: Pair of Disc Coils
Despite a 3D model offers a morerealistic approach to the system,and more accurate results, itsDoF is dramatically increased, andthus the calculation time is alsoextended.
The complexity of the modelmight also affect the convergenceto a solution.
Nevertheless, some features are only reproduced in 3D scenario, since theyare simply not possible for an 2D axis-symmetric system.
For instance, a vertical displacement between coils is possible to be modelledin the 2D model, however it is not the case for a horizontal displacement

19.10.2016 © 2016 UNIVERSITÄT ROSTOCK | FAKULTÄT FÜR INFORMATIK UND ELEKTROTECHNIK 46
Introduction
Fundamentals
Model Order Reduction
Numerical Modelling
Results
Conclusions and Outlook
Outline

19.10.2016 © 2016 UNIVERSITÄT ROSTOCK | FAKULTÄT FÜR INFORMATIK UND ELEKTROTECHNIK 49
Results
Sensitivity analysis of reduced models
Parameter Value
Name Model 3D Disc Coils
Degrees of freedom 131.829
Range of frequency 10-500 kHz
Vertical displacement 100 mm
Horizontal displacement 0 mm
Output variables Resistance in first coil and mutual
inductance
Block Arnoldi algorithms Input-Sided, Output-Sided and Two-
Sided SOAR
MOR expansion point 1 kHz
Number of Moments 4, 5 , 6 and 7 moments
The following analysis was focused in comparing the accuracy of the block Arnoldi algorithms that were implemented against the results generated by running the original model in Comsol.

19.10.2016 © 2016 UNIVERSITÄT ROSTOCK | FAKULTÄT FÜR INFORMATIK UND ELEKTROTECHNIK 50
Results
Sensitivity analysis of reduced models
• Run original model in Comsol and save data in CSV file format.
• Extract the state-space matrices of the model from Comsol byusing Matlab.
• Perform MOR of the matrices by using every of the block Arnoldialgorithms
• By using the reduced matrices, calculate the output variables forthe range of frequency, and its corresponding relative erroragainst the results that were produced by the original model.
19.10.2016 © 2016 UNIVERSITÄT ROSTOCK | FAKULTÄT FÜR INFORMATIK UND ELEKTROTECHNIK 51
Results
Sensitivity analysis of reduced models
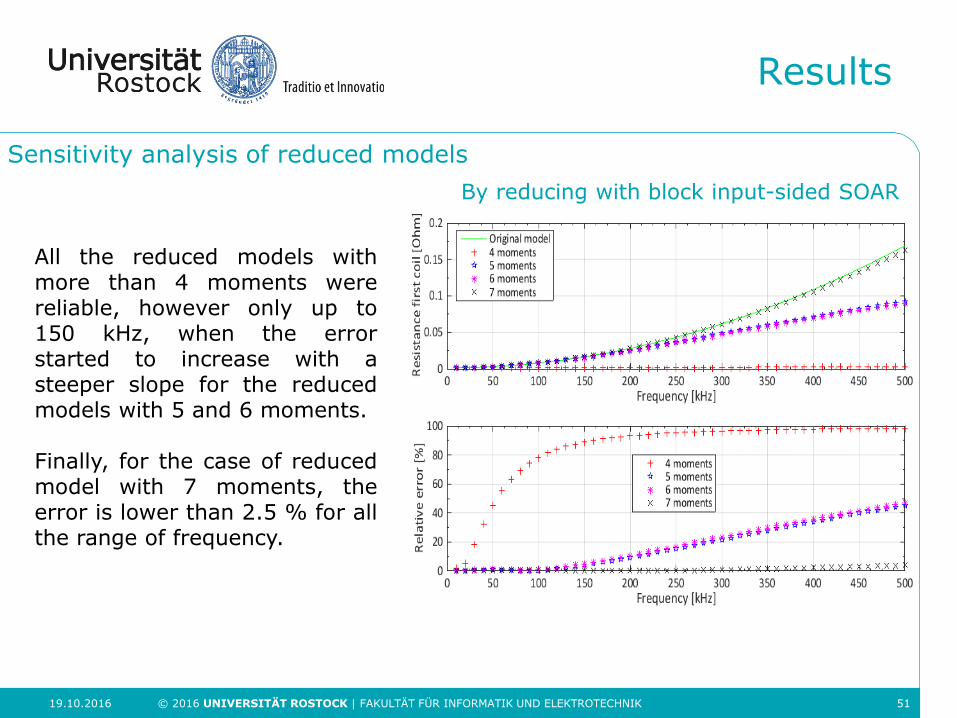
By reducing with block input-sided SOAR
All the reduced models withmore than 4 moments werereliable, however only up to150 kHz, when the errorstarted to increase with asteeper slope for the reducedmodels with 5 and 6 moments.
Finally, for the case of reducedmodel with 7 moments, theerror is lower than 2.5 % for allthe range of frequency.

19.10.2016 © 2016 UNIVERSITÄT ROSTOCK | FAKULTÄT FÜR INFORMATIK UND ELEKTROTECHNIK 52
Results
Sensitivity analysis of reduced models
By reducing with block output-sided SOAR
Even the 4-moments modelproduces better results than itsinput-sided counterpart;nonetheless its relative error isnear 25 % for high frequencies.
With an acceptable response,reduced systems with 5 and 6moments score a relative errornear 7 % as frequencies becomegreater than 100 kHz.
The 7-moments reduced systemonly yields a relative error below1 % for all the range offrequencies

19.10.2016 © 2016 UNIVERSITÄT ROSTOCK | FAKULTÄT FÜR INFORMATIK UND ELEKTROTECHNIK 53
Results
Sensitivity analysis of reduced models
By reducing with block two-sided SOAR
Every reduced model is reliableto the original model’s results byusing two-sided SOAR, with amaximum error of 5×10⁻³ % for
all of them.
Block two-sided SOAR algorithmportrays a great robustness andaccuracy, even for models thatwere created with lower numberof moments, not to mention itsresponse is above of thoseyielded by the one-sidedalgorithms

19.10.2016 © 2016 UNIVERSITÄT ROSTOCK | FAKULTÄT FÜR INFORMATIK UND ELEKTROTECHNIK 54
Results
Power efficiency analysis
Parameter Value
Name Model 3D Disc Coils
Degrees of freedom 131.829
Desired resonant frequency 150 kHz
Range vertical displacement 25 – 250 mm. Interval increment : 25 mm
Range horizontal displacement 0 - 450 mm. Interval increment: 50 mm
Output variables Resonant capacitance, optimal load and power efficiency
Block Arnoldi algorithm Two-Sided SOAR
MOR expansion point 150 kHz
Number of Moments 10 moments
Simplorer’s Range of Frequency 0 -500 kHz
A power analysis was conducted as a final investigation, which summarizes all the theorical and practical work that was involved on this thesis.
Furthermore, this analysis demanded that the reduced models were exported to Simplorer, and connected to an electric circuit, in such a way that the power efficiency could be measured

19.10.2016 © 2016 UNIVERSITÄT ROSTOCK | FAKULTÄT FÜR INFORMATIK UND ELEKTROTECHNIK 56
Results
Power efficiency analysisEvery set of reduced matrices wassaved into a VHDL file, thus, they willrepresent as a 2-ports electricalcircuit. Thereafter, this can be thenimported and connected to anyextended electric circuits insideSimplorer.
Inductance is calculated forevery single set of reducedmatrices, and thereafter byusing the formula of resonantfrequency, the capacitance couldbe finally determined:
𝜔 =1
𝐿𝐶

19.10.2016 © 2016 UNIVERSITÄT ROSTOCK | FAKULTÄT FÜR INFORMATIK UND ELEKTROTECHNIK 57
Results
Power efficiency analysis
Disc coils with a) 150 mm and b) 350 mm of horizontal
misalignment and 50 mm of vertical distance
As it is expected, the value of loadresistance decreases as vertical orhorizontal displacement is increased,however a particular phenomena occursaround the range of 50-250 mm, with aminimum near 150 mm, where the valueof optimal load resistance drops nearzero.

19.10.2016 © 2016 UNIVERSITÄT ROSTOCK | FAKULTÄT FÜR INFORMATIK UND ELEKTROTECHNIK 58
Results
Power efficiency analysis
Vertical distance [mm] 𝑓0 1 + 𝑘 [kHz] 𝑓0 1 − 𝑘 [kHz]
50 119,74 228,53
100 132,34 177,36
150 140,13 162,3
200 144,42 156,28
A detailed zoom is displayedaround the central resonancefrequency of 150 kHz andillustrates the WPT frequencysplitting.
Table listing the approximatedranges for this frequencysplitting, as the circuitresistances are assumed equalto zero

19.10.2016 © 2016 UNIVERSITÄT ROSTOCK | FAKULTÄT FÜR INFORMATIK UND ELEKTROTECHNIK 59
Results
Power efficiency analysis
Maximum power efficiency always occurs between the range comprised by the frequency splitting phenomena.
The central resonance frequency always lies in between this range.
The length of the range is affected by the separation between coils.

19.10.2016 © 2016 UNIVERSITÄT ROSTOCK | FAKULTÄT FÜR INFORMATIK UND ELEKTROTECHNIK 60
Introduction
Fundamentals
Model Order Reduction
Numerical Modelling
Results
Conclusions and Outlook
Outline

19.10.2016 © 2016 UNIVERSITÄT ROSTOCK | FAKULTÄT FÜR INFORMATIK UND ELEKTROTECHNIK 61
Conclusions and Outlook
• All elaborated models in Comsol proved their reliability, since they yielded results with an
relative error lower than 4 % than those provided by the reference model.
• Even though, 2D models could not be used in analysis with horizontal displacements, they
were useful for testing and validating every required step in the conducted experiments.
• For SOAR methods, experiments showed an overall better response and stability of the block
two-sided algorithm as being compared with the one-sided methods. Nonetheless, they also
showed the overall robustness of all of them, and how with only a handful number of
moments, they can reproduce the same response than a full model with more than 10k and
100k DoF for 2D and 3D case respectively.
• MOR also allows to take advantage of exporting the model as an electric two-port device, due
to the fact that the limit on the number of equations inside the model-container VHDL file is
not a hurdle anymore, and hence the model can be easily imported in electric-circuit
simulation tools, such as Simplorer.

19.10.2016 © 2016 UNIVERSITÄT ROSTOCK | FAKULTÄT FÜR INFORMATIK UND ELEKTROTECHNIK 62
Conclusions and Outlook
• Frequency splitting was analysed, and its approximated values were calculated in a scenario
where all the resistances are equal to zero, showing to be in the close range to those
provided by the resulting data in Simplorer. Finally, it was observed a maximum in the transfer
of power was held for all the calculated frequency range.
• A slight difference in axis misalignment above a certain threshold, proved that affected the
power efficiency more than a vertical displacement, mainly because both coils had the same
diameter, and this issue was notoriously magnified in the range of 50 – 250 mm, where the
values were affected by magnetic fields flux in a reverse direction
• For this issue, one possible solution would be to increase the diameter size of the primary
coil, or perhaps to investigate other different geometries (e.g. solenoid type , bipolar solenoid,
unipolar rectangular and bipolar rectangular).

THANK YOU FOR YOUR ATTENTION !
19.10.2016 © 2016 UNIVERSITÄT ROSTOCK | FAKULTÄT FÜR INFORMATIK UND ELEKTROTECHNIK 63