Embed Size (px)
Citation preview
www.canberra.com
Radiation Safety. Amplified.
Model S574 LabSOCS*™
Calibration Software
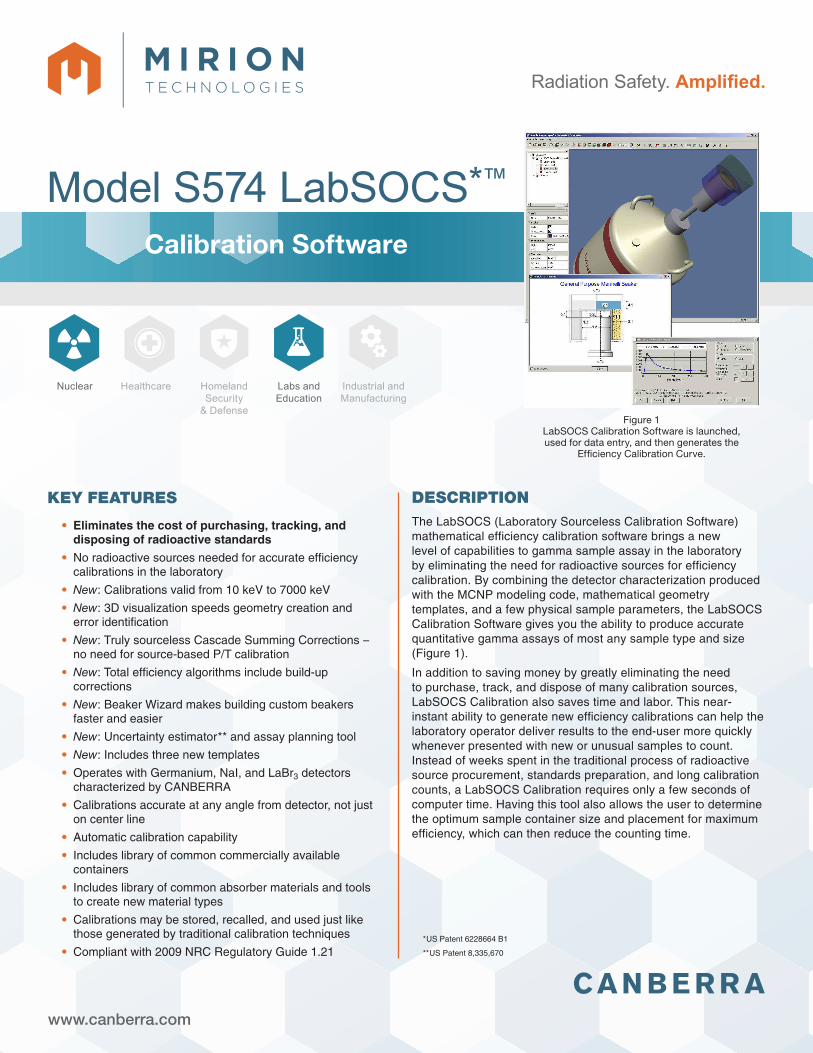
KEY FEATURES DESCRIPTIONThe LabSOCS (Laboratory Sourceless Calibration Software) mathematical efficiency calibration software brings a new level of capabilities to gamma sample assay in the laboratory by eliminating the need for radioactive sources for efficiency calibration. By combining the detector characterization produced with the MCNP modeling code, mathematical geometry templates, and a few physical sample parameters, the LabSOCS Calibration Software gives you the ability to produce accurate quantitative gamma assays of most any sample type and size (Figure 1).
In addition to saving money by greatly eliminating the need to purchase, track, and dispose of many calibration sources, LabSOCS Calibration also saves time and labor. This near-instant ability to generate new efficiency calibrations can help the laboratory operator deliver results to the end-user more quickly whenever presented with new or unusual samples to count. Instead of weeks spent in the traditional process of radioactive source procurement, standards preparation, and long calibration counts, a LabSOCS Calibration requires only a few seconds of computer time. Having this tool also allows the user to determine the optimum sample container size and placement for maximum efficiency, which can then reduce the counting time.
• Eliminates the cost of purchasing, tracking, and disposing of radioactive standards
• No radioactive sources needed for accurate efficiency calibrations in the laboratory
• New: Calibrations valid from 10 keV to 7000 keV
• New: 3D visualization speeds geometry creation and error identification
• New: Truly sourceless Cascade Summing Corrections – no need for source-based P/T calibration
• New: Total efficiency algorithms include build-up corrections
• New: Beaker Wizard makes building custom beakers faster and easier
• New: Uncertainty estimator ** and assay planning tool
• New: Includes three new templates
• Operates with Germanium, NaI, and LaBr3 detectors characterized by CANBERRA
• Calibrations accurate at any angle from detector, not just on center line
• Automatic calibration capability
• Includes library of common commercially available containers
• Includes library of common absorber materials and tools to create new material types
• Calibrations may be stored, recalled, and used just like those generated by traditional calibration techniques
• Compliant with 2009 NRC Regulatory Guide 1.21 * US Patent 6228664 B1
** US Patent 8,335,670
Figure 1 LabSOCS Calibration Software is launched, used for data entry, and then generates the
Efficiency Calibration Curve.
Labs and Education
Healthcare Industrial and Manufacturing
Homeland Security
& Defense
Nuclear
2
The companion for LabSOCS is the Model S573 ISOCS mathematical efficiency calibration software for In Situ applications. Both ISOCS and LabSOCS have had great success over the years and are now the industry standard for sourceless calibration software.
Many new improvements have been added in this latest LabSOCS release. These improvements include replacing the Windows® graphical user interface with a new 3D visualization user interface where the detector, sample, absorbers, and collimators are all rendered real time, and to scale, in 3D virtual space. This new interface provides fingertip control with the use of context menus and mouse wheel functionality in addition to immediate visual feedback, making geometry creation faster than ever and identification of errors much easier.
Significant Cascade Summing improvements have been made which include (1) extending the low energy limit of the characterizations, Material library, and COI library from 45 keV to 10 keV, (2) expansion of the COI library to include 200 nuclides, (3) eliminating the need for a Peak-to-Total calibration, (4) a coincidence library with the latest nuclear data extracted from the internationally recognized ENSDF database, and (5) enhancing the True Coincidence summing algorithms to include coincidences not just from Gamma-Gamma but also gamma-X and gamma-511 keV true coincidences. All modifications have been extensively validated with NIST-traceable sources down to 14 keV and results published.
A new beaker editor has been added that allows visual feedback of custom beakers during creation and 3D display of beakers and absorbers integrated with the geometry. This new editor provides the added ability to model three new absorbers around the beaker, collimator, and detector. Simplified template drawings can be shown in a separate window simultaneously with the data input window to facilitate beaker creation. Templates partially filled out with static information can be saved and recalled to facilitate analysis of samples with few parameters that change. A Geometry Composer Report screen contains all information defined about that geometry for the user to see and print, including the 3D rendering of the object or geometry.
The secret to this ability to create accurate mathematical efficiency calibrations without radioactive sources is twofold:
1. The energy/efficiency/spatial response profile of each specific detector to be used with ISOCS/LabSOCS has been characterized by CANBERRA with a combination of NIST-traceable sources and MCNP Monte Carlo modeling.
2. Mathematical templates have been created for most of the sample geometries that will be encountered – cylinders viewed from the ends, cylinders with complex sides and bottoms, rectangular boxes, Marinelli beakers, cylinders (bottles) viewed from the side, etc.
To a basic geometry template, add the specifics for a given sample – its size, density, distance from the detector, etc. – and the LabSOCS Calibration Software generates a custom efficiency calibration specifically tailored for that detector and sample. The remainder of this document will describe how this is done and how the various standard geometry templates are used.
THE ASSAY AND CALIBRATION PROCESS To better understand how the LabSOCS Calibration Software is used, it’s necessary to look at the complete LabSOCS sample calibration process. In general terms, it’s as follows:
1. Using the Data Quality Objective (DQO) process, determine your measurement requirements for sensitivity and accuracy. The ISOCS Uncertainty Estimator (IUE) tool can be used in determining your measurement strategy to help achieve your objectives.
2. Select the Detector to be calibrated.
3. Select the Geometry Template which best fits the sample type (such as Marinelli beaker, rectangular box, cylinder, etc.).
4. Measure the relevant physical sample parameters required by that template (such as sample fill height, sample material, density, distance to the detector, any absorbers like sample shelves, etc.).
5. Enter these parameters into the LabSOCS Calibration Software and generate an efficiency calibration for those conditions in 15 seconds, typically. Examine/modify the shape of the resultant Genie™ 2000 calibration curve and store it as a CAM file.
6. Count the sample using a detector that has been characterized by CANBERRA and use the calibration created in Step 5 for the analysis of the spectrum collected, yielding a qualitative and quantitative assay of the sample.
The sample parameters recorded in Step 4 are key elements to the process, for they allow the software to tailor the mathematical response profile of the detector to the specific sample being assayed. For maximum accuracy and flexibility, each template allows a wide variety of parameters which can be specified, as necessary.
Model S574 LabSOCS Calibration Software
3
In addition to the parameters mentioned in Step 4, provisions are included for things like container wall thickness, the presence of absorbers between the source and detector, the presence of absorbers around the sample, collimator, and detector, multiple layers of sources or non-sources within a container, variable sample densities, and off-axis sample placement. In short, most any factor that can impact the assay may be input into the model and its effect determined. If a parameter is not known, or not well known, the new IUE tool can be used to determine what influence, if any, that parameter has on the results of the assay. In addition, if more than one parameter is not well known, the new IUE tool can be used to vary several values simultaneously to determine the impact on the final result.
CALIBRATION TEMPLATES INCLUDED WITH LabSOCS The LabSOCS calibration software comes with ten basic geometry templates and two advanced templates that allow you to import custom contours. In addition to these standard templates, custom templates can be defined by CANBERRA to meet special application needs.
The standard templates and their applications are as follows:
GENERAL PURPOSE MARINELLI BEAKER – A Marinelli beaker, off-center with two source layers.
GENERAL PURPOSE BEAKER – A conical or right cylinder, off-center with two source layers.
CUSTOM GENERAL PURPOSE MARINELLI BEAKER – A template similar to the General Purpose Marinelli Beaker that allows you to pick from a selection of user generated contours.
CUSTOM GENERAL PURPOSE BEAKER – A template similar to the General Purpose Beaker that allows you to pick from a selection of user generated contours.
CYLINDER – A centerline right cylinder with one source layer.
DISK – A centerline right cylinder with no thickness.
POINT – A point on centerline.
SIMPLIFIED BOX – A basic rectangular box or carton sample container.
CYLINDER FROM SIDE – A basic sample bottle, when viewed from the side of the container.
SIMPLIFIED SPHERE – Internally contaminated spherical objects, like gas sampling containers.
SIMPLIFIED MARINELLI BEAKER – A Marinelli beaker on centerline with one source layer.
SIMPLIFIED BEAKER – A conical or right cylinder, centerline with one source layer.
The simplified beaker will probably be the most useful template for normal laboratories. Simple cylindrical or conical beakers that are viewed from the end can be described by entering a few dimensions. Alternatively, a library of these beakers can be created in advance and just called up by name; most of the information required is already filled in.
The Custom templates allow complex beakers to be defined. Most sample containers do not have perfectly flat bottoms, or right circular sides. Instead they have concave bottoms and sloping sides as a part of the automated manufacturing process, and to allow stacking. These features can be quite important in the efficiency of a sample, since they are often the closest part to the detector. These templates allow the user to model all the features of any cylindrically symmetric object. These templates also have a 3D graphic preview display that allows the user to preview contours of the custom sample container prior to selection. The Beaker Editor is a new visual user interface that allows the user to create the custom contours.
USING THE LabSOCS CALIBRATION SOFTWARE To illustrate how these templates and their related sample parameters are used, a typical LabSOCS calibration will be described. It will be based upon the General Purpose Marinelli Beaker template.
After installation, the LabSOCS calibration software is accessed as a part of the Geometry Composer. The Geometry Composer can be launched separately or as a menu option in the Genie 2000 software.
Model S574 LabSOCS Calibration Software
4
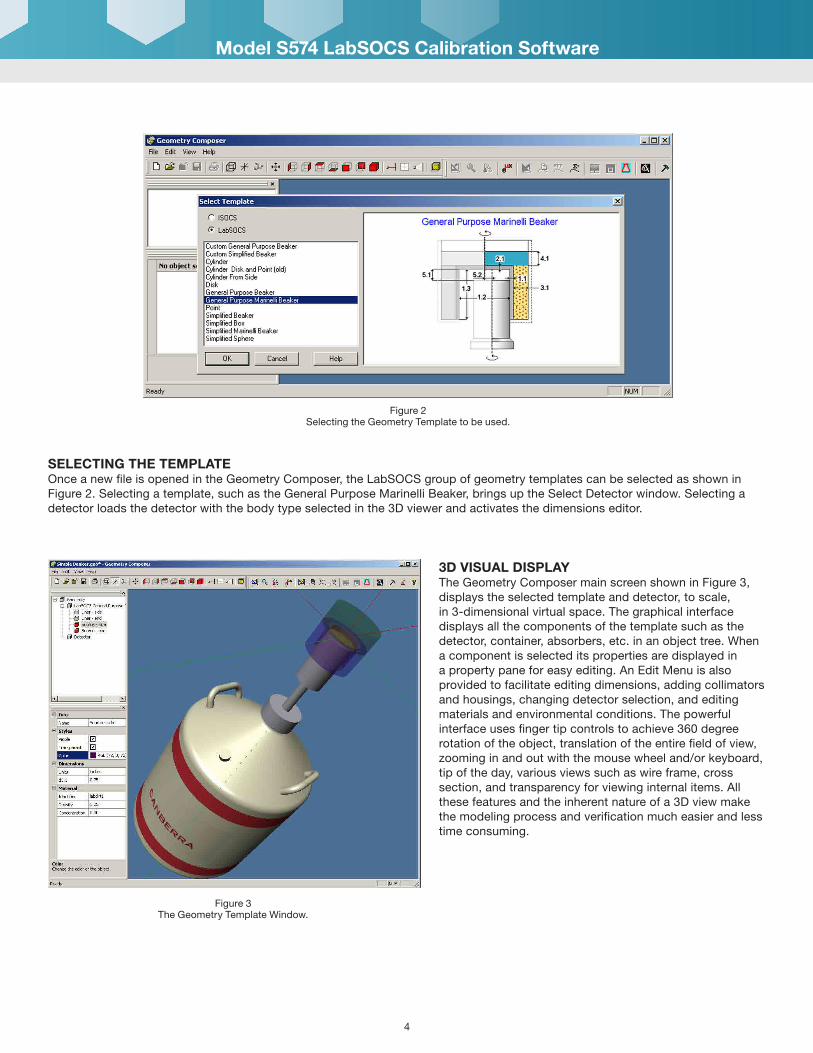
SELECTING THE TEMPLATE Once a new file is opened in the Geometry Composer, the LabSOCS group of geometry templates can be selected as shown in Figure 2. Selecting a template, such as the General Purpose Marinelli Beaker, brings up the Select Detector window. Selecting a detector loads the detector with the body type selected in the 3D viewer and activates the dimensions editor.
3D VISUAL DISPLAY The Geometry Composer main screen shown in Figure 3, displays the selected template and detector, to scale, in 3-dimensional virtual space. The graphical interface displays all the components of the template such as the detector, container, absorbers, etc. in an object tree. When a component is selected its properties are displayed in a property pane for easy editing. An Edit Menu is also provided to facilitate editing dimensions, adding collimators and housings, changing detector selection, and editing materials and environmental conditions. The powerful interface uses finger tip controls to achieve 360 degree rotation of the object, translation of the entire field of view, zooming in and out with the mouse wheel and/or keyboard, tip of the day, various views such as wire frame, cross section, and transparency for viewing internal items. All these features and the inherent nature of a 3D view make the modeling process and verification much easier and less time consuming.
Figure 3 The Geometry Template Window.
Model S574 LabSOCS Calibration Software
Figure 2 Selecting the Geometry Template to be used.
5
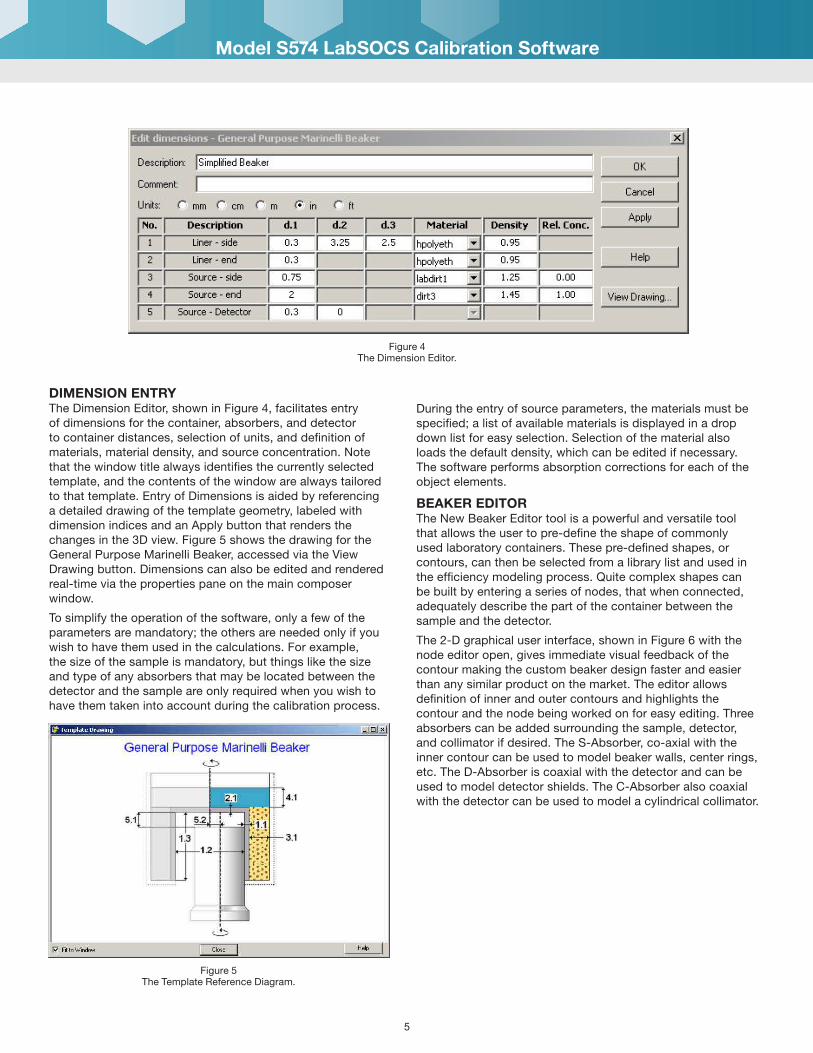
DIMENSION ENTRY The Dimension Editor, shown in Figure 4, facilitates entry of dimensions for the container, absorbers, and detector to container distances, selection of units, and definition of materials, material density, and source concentration. Note that the window title always identifies the currently selected template, and the contents of the window are always tailored to that template. Entry of Dimensions is aided by referencing a detailed drawing of the template geometry, labeled with dimension indices and an Apply button that renders the changes in the 3D view. Figure 5 shows the drawing for the General Purpose Marinelli Beaker, accessed via the View Drawing button. Dimensions can also be edited and rendered real-time via the properties pane on the main composer window.
To simplify the operation of the software, only a few of the parameters are mandatory; the others are needed only if you wish to have them used in the calculations. For example, the size of the sample is mandatory, but things like the size and type of any absorbers that may be located between the detector and the sample are only required when you wish to have them taken into account during the calibration process.
During the entry of source parameters, the materials must be specified; a list of available materials is displayed in a drop down list for easy selection. Selection of the material also loads the default density, which can be edited if necessary. The software performs absorption corrections for each of the object elements.
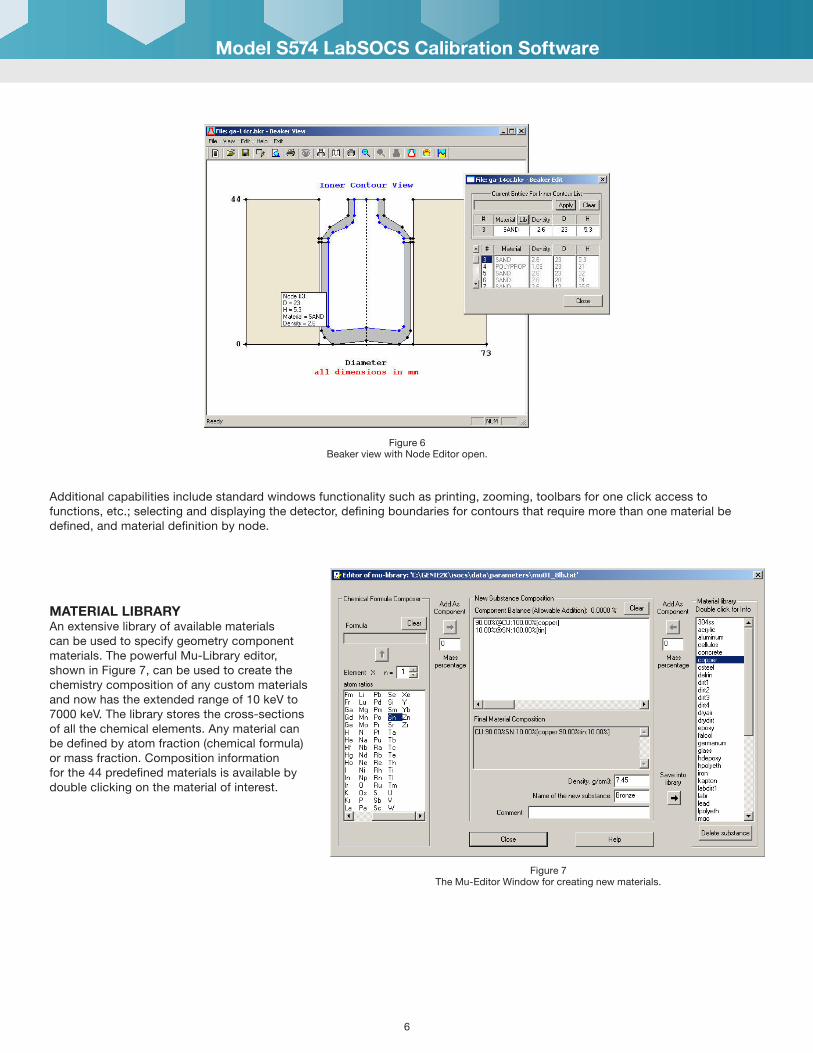
BEAKER EDITOR The New Beaker Editor tool is a powerful and versatile tool that allows the user to pre-define the shape of commonly used laboratory containers. These pre-defined shapes, or contours, can then be selected from a library list and used in the efficiency modeling process. Quite complex shapes can be built by entering a series of nodes, that when connected, adequately describe the part of the container between the sample and the detector.
The 2-D graphical user interface, shown in Figure 6 with the node editor open, gives immediate visual feedback of the contour making the custom beaker design faster and easier than any similar product on the market. The editor allows definition of inner and outer contours and highlights the contour and the node being worked on for easy editing. Three absorbers can be added surrounding the sample, detector, and collimator if desired. The S-Absorber, co-axial with the inner contour can be used to model beaker walls, center rings, etc. The D-Absorber is coaxial with the detector and can be used to model detector shields. The C-Absorber also coaxial with the detector can be used to model a cylindrical collimator.
Figure 5 The Template Reference Diagram.
Model S574 LabSOCS Calibration Software
Figure 4 The Dimension Editor.
6
Additional capabilities include standard windows functionality such as printing, zooming, toolbars for one click access to functions, etc.; selecting and displaying the detector, defining boundaries for contours that require more than one material be defined, and material definition by node.
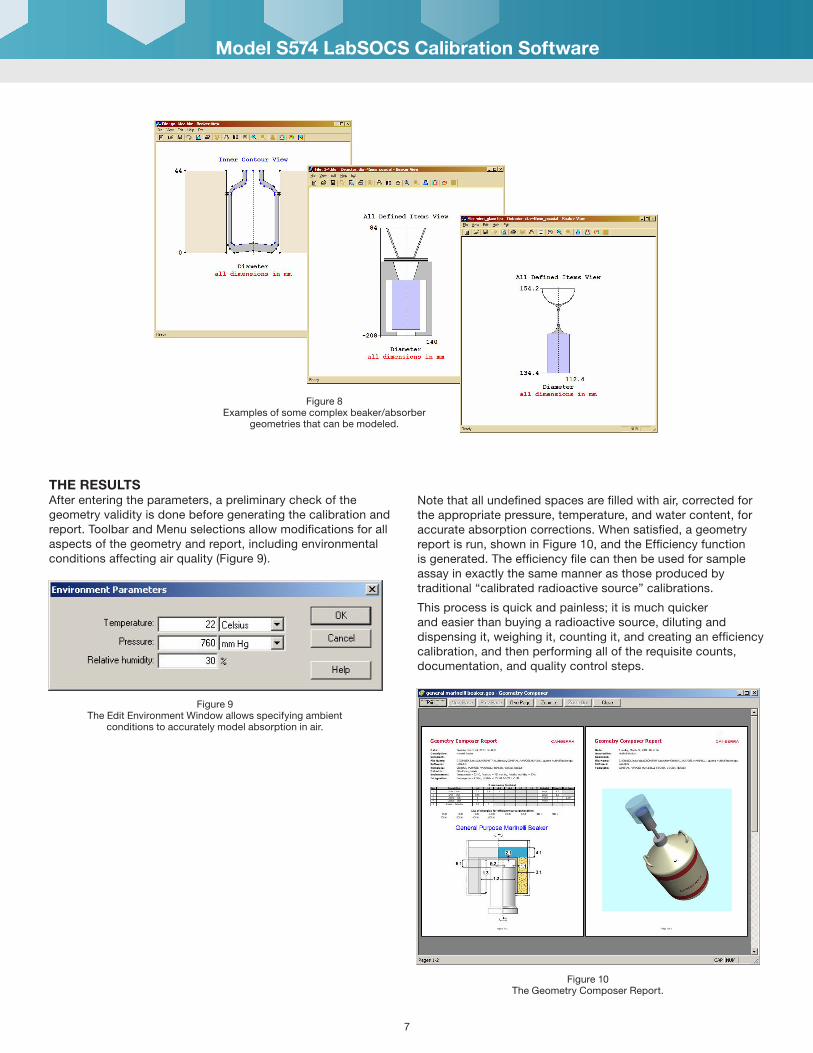
MATERIAL LIBRARY An extensive library of available materials can be used to specify geometry component materials. The powerful Mu-Library editor, shown in Figure 7, can be used to create the chemistry composition of any custom materials and now has the extended range of 10 keV to 7000 keV. The library stores the cross-sections of all the chemical elements. Any material can be defined by atom fraction (chemical formula) or mass fraction. Composition information for the 44 predefined materials is available by double clicking on the material of interest.
Model S574 LabSOCS Calibration Software
Figure 7 The Mu-Editor Window for creating new materials.
Figure 6 Beaker view with Node Editor open.
7
THE RESULTS After entering the parameters, a preliminary check of the geometry validity is done before generating the calibration and report. Toolbar and Menu selections allow modifications for all aspects of the geometry and report, including environmental conditions affecting air quality (Figure 9).
Note that all undefined spaces are filled with air, corrected for the appropriate pressure, temperature, and water content, for accurate absorption corrections. When satisfied, a geometry report is run, shown in Figure 10, and the Efficiency function is generated. The efficiency file can then be used for sample assay in exactly the same manner as those produced by traditional “calibrated radioactive source” calibrations.
This process is quick and painless; it is much quicker and easier than buying a radioactive source, diluting and dispensing it, weighing it, counting it, and creating an efficiency calibration, and then performing all of the requisite counts, documentation, and quality control steps.
Model S574 LabSOCS Calibration Software
Figure 10 The Geometry Composer Report.
Figure 8 Examples of some complex beaker/absorber
geometries that can be modeled.
Figure 9 The Edit Environment Window allows specifying ambient
conditions to accurately model absorption in air.
8
USING THE ISOCS/LabSOCS UNCERTAINTY ESTIMATOR TO DETERMINE THE ERROR LIMITS OF AN ASSAY AND REDUCE YOUR TMU Another major benefit of the LabSOCS software is the ability to easily determine the error limits of the calibration and the Total Propagated Uncertainty in the results of an in situ assay. Typically the uncertainty in the efficiency calibration is the largest contributor to the total uncertainty in the measurement. The deviation between the as-calibrated geometry and the as-measured geometry contribute to the total uncertainty. The IUE is a unique and powerful new tool that can be used in several different modes to evaluate these variations between the calibration and the measurement conditions and to improve the quality of the gamma spectroscopy uncertainty estimate. The IUE makes it now easier then ever to determine the uncertainty and provides documentation on how it was generated; all input parameters are stored in a file, and in a printed report for the project record.
“WHAT IF…?” ERRORS This classification covers questions such as “What if the container walls are thicker than we think?”, “What if the container level is not as high as we think?”, and “What if the material matrix is different than we assumed?”, “What if some of the source floats to the top or sinks to the bottom of the container?”, “What if the technician doesn’t exactly center the sample on the detector axis?”, “What if the next batch of containers is a little bit different in wall thickness, diameter, or shape of the bottom?”. It is these not-well-known (NWK) parameters that contribute to the uncertainty in the calibration efficiency. By varying these parameters between a maximum and minimum we can bound the problem.
To test the impact of these types of assumptions on the results, the IUE is used in its Uncertainty Analysis mode. To answer these questions in the past we used to have to generate a model and reanalyze the spectrum for each not-well-known parameter we varied. Now the IUE does this for you, for one parameter or more, by simultaneously and randomly varying all of the NWK input values within limits defined by the user, then propagates that uncertainty with the spectroscopic analysis results into the final results for the sample. In a matter of a few seconds (for standard geometries) you’ll see exactly what impact the new assumptions will have on the assay.
In a similar manner the IUE can estimate the uncertainty contribution from each individual input allowing you to identify which parameters have the largest contribution to the overall uncertainty. This is an especially useful diagnostic tool you can use in determining where to concentrate your effort towards reducing the total measurement uncertainty.
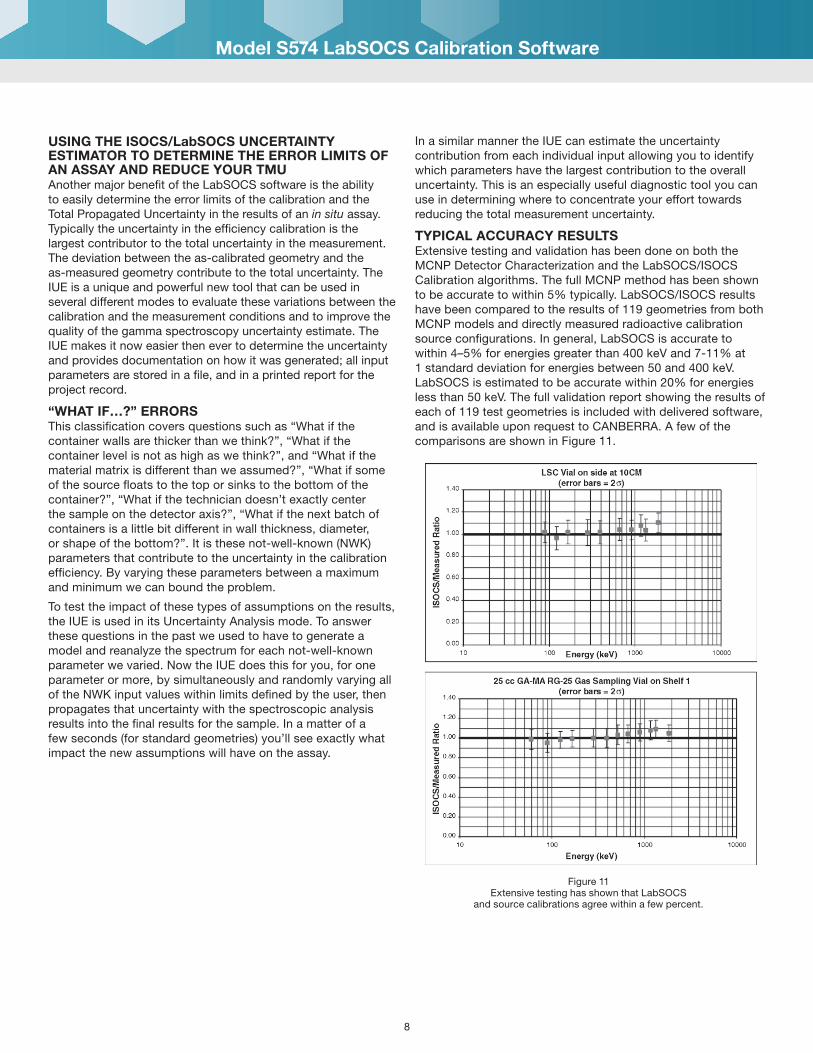
TYPICAL ACCURACY RESULTS Extensive testing and validation has been done on both the MCNP Detector Characterization and the LabSOCS/ISOCS Calibration algorithms. The full MCNP method has been shown to be accurate to within 5% typically. LabSOCS/ISOCS results have been compared to the results of 119 geometries from both MCNP models and directly measured radioactive calibration source configurations. In general, LabSOCS is accurate to within 4–5% for energies greater than 400 keV and 7-11% at 1 standard deviation for energies between 50 and 400 keV. LabSOCS is estimated to be accurate within 20% for energies less than 50 keV. The full validation report showing the results of each of 119 test geometries is included with delivered software, and is available upon request to CANBERRA. A few of the comparisons are shown in Figure 11.
Model S574 LabSOCS Calibration Software
Figure 11 Extensive testing has shown that LabSOCS
and source calibrations agree within a few percent.

9
Model S574 LabSOCS Calibration Software
In addition to this generic validation document, CANBERRA offers Model ISOXVRFY. With the purchase of this product, the customer’s Ge detector is used with the LabSOCS calibration process to analyze a series of typical laboratory radioactive standards, using the characterization file specific to this detector. A report of this process, demonstrating the accuracy of LabSOCS from 60 to 1836 keV for these sources, is provided to the customer.
ADDITIONAL INFORMATION Additional information on LabSOCS, relevant hardware and software components, and various applications may be found in the following publications, all of which are available from CANBERRA:
RELEVANT SPECIFICATION SHEETS AND MANUALS
• S500/S502/S504 Genie 2000 Basic Spectroscopy Software.
• S501 Genie 2000 Gamma Analysis Software.
• S574 LabSOCS Calibration Software Technical Reference Manual.
• 573/S574 ISOCS/LabSOCS Validation and Verification Manual, Part ICN 9231205e.
APPLICATION NOTE In Situ Gamma Spectroscopy with ISOCS, an In Situ Object Counting System, Canberra Industries.
PUBLICATIONS These may be obtained upon request from CANBERRA:
• Validation of the Accuracy of the LabSOCS Mathematical Efficiency Calibration for Typical Laboratory Samples, Bronson, F., CHP, Venkataraman, R., Ph.D., 46th Annual Conference on Bioassay, Analytical, and Environmental Radiochemistry, ’00.
• Probabilistic Uncertainty Estimator for Gamma-Spectroscopy Measurements, Bronson, F., Geurkov, G., Young, B., Atrashkevich, V., Journal of Radioanalytical and Nuclear Chemistry, Vol. 276, No. 3, 2008.
• Comparability of ISOCS Instrument in Radionuclide Characterization at Brookhaven National Laboratory, Kalb, P., Luckett, L., Miller, K., Milian, L. BNL-52607-01/04-Rev, 2008.
• Improved Detector Response Characterization Method in ISOCS and LabSOCS, Venkataraman, R., Bronson, F., Atrashkevich, V., Field, M., and Young, B., Journal of Radioanalytical and Nuclear Chemistry, Vol. 264, No. 1 (2005), 213-219.
• Mathematical Efficiency Calibration of Ge Detectors for Laboratory Sample Gamma Spectroscopy, Bronson, F., Venkataraman, R. Ph.D., Young, B., Ph.D., 44th Annual Conference on Bioassay, Analytical and Environmental Radiochemistry.
• Optimum Size and Shape of Laboratory Samples for Gamma Spectroscopy With Various Size and Shape Ge Detectors, Bronson, F. CHP, Venkataraman, R. Ph.D., Young, B., Ph.D., 44th Annual Conference on Bioassay, Analytical and Environmental Radiochemistry.
• Massemetric Efficiency Calibrations of Ge Detectors for Laboratory Applications, Bronson, F. CHP, Venkataraman, R. Ph.D., Young, B., Ph.D., 44th Annual Conference on Bioassay, Analytical and Environmental Radiochemistry.
• Mathematical Calibration Of Ge Detectors, and the Instruments That Use Them, Bronson, F., and Young, B., Canberra Industries, NDA/NDE Waste Characterization Conference ’97.
• LabSOCS vs. Source-Based Gamma-Ray Detector Efficiency Comparisons for Nuclear Power Plant Geometries, Stewart, John P., Groff, David, 48th Annual Radiobioassay & Radiochemical Measurements Conference, ’02.
• Mathematical Efficiency Calibration in Gamma Spectrometry – Dream or Future?, Kaminski, S., Wilhelm, Chr., Forschungszentrum Karlsruhe, Hauptabteilung Sicherheit.
• Genie 2000 Cascade Summing Correction Validation Testing, Bronson, F., Russ, W. R., Venkataraman, R., IRPA – 11 International Conference of the International Radiation Protection Association, ’04.
• The Use of In Situ Gamma Spectroscopy to Save Time, Dose, and Money in Operating Nuclear Facilities, Bronson, F., Canberra Industries, Health Physics Society Midyear Topical Meeting, 2001.
©2076 Canberra Industries, Inc. All rights reserved.
SYSTEM REQUIREMENTS FOR S574 LabSOCS To use the LabSOCS Calibration Software, the following minimum system configuration is required:
DETECTOR Any Germanium, 2x2 NaI, 3x3 NaI, 1.5x1.5 LaBr3 detector, characterized by CANBERRA. For each detector, order one of the following:
• ISOXCAL – Characterization for a new CANBERRA detector.
• ISOXCAL1 – Characterization a previously ordered CANBERRA detector.
• ISOXCAL2 – Characterization a non-CANBERRA detector.
• ISOXCALU – Re-characterization of a previously characterized detector.
• ISXCLF5K – Characterization for a Falcon 5000®.
• ISXCLNA2 – Characterization for 2X2 NaI Detectors.
• ISXCLNA3 – Characterization for 3X3 NaI Detectors.
• ISXCLNS2 – Characterization for the IPROS-2 2x2 NaI Stabilized Probe.
• ISXCLLA1 – Characterization for LaBr3 1.5x1.5.
The same characterization works for both ISOCS and LabSOCS software.
Note: a QA Calibration Check Source (ISOXSRC) comes with each characterization. This source is measured at the factory with the newly characterized detector as a baseline QC measurement and is recommended for use in the customers QC program.
SPECTROSCOPY SYSTEM Any CANBERRA PC-based MCA system running the following software as a minimum:
• S500 – Genie 2000 Basic Spectroscopy Software, V3.2.
• S501 – Genie 2000 Gamma Analysis Software, V3.2.
• S505 – Genie 2000 Quality Assurance Software, V1.3.
• S574 – LabSOCS Calibration Software, V4.2.
The PC should be a Pentium® 2.0 GHz or better. For fast computations of large or highly attenuating geometries, a high-end PC is recommended.
Model S574 LabSOCS Calibration Software
Genie, ISOCS, LabSOCS, APEX and Falcon 5000 are trademarks and/or registered trademarks of Mirion Technologies, Inc. and/or
its affiliates in the United States and/or other countries.
RECOMMENDED OPTIONS • S506 – Genie 2000 Interactive Peak Fit.
• ISOXVRFY – Verification Counts with Laboratory Standards.
• S700-S705 APEX® Gamma Desktop or Client/Server.
Model ISOXVRFY Verification Counts with Laboratory Standards is strongly recommended to provide proof of the validity of specific system results. When this model is ordered, the detector’s characterization and LabSOCS/ISOCS are used to create a series of efficiency calibrations. Then, four different laboratory reference calibration standards are counted in seven different positions and analyzed as “unknowns” using these efficiency calibrations. A report is generated comparing the reported activity to the known activity. The sample types are 2.8 liter Marinelli beaker, 20 cc liquid scintillation vial, 50 mm filter paper, and 350 cc cylindrical container. These are all counted close to the endcap, and (except for the Marinelli beaker) at 10 cm from the endcap.
NOTE: Genie-ESP users of the LabSOCS calibration software: the efficiency computations must be performed on a PC. The resultant calibration CAM file is then simply copied over to the appropriate calibration file location on the Genie-ESP system. It can then be specified for use just like any other calibration.
©2017 Canberra Industries, Inc. All rights reserved.
Copyright ©2017 Mirion Technologies, Inc. or its affiliates. All rights reserved. Mirion, the Mirion logo, and other trade names of Mirion products listed herein are registered trademarks or
trademarks of Mirion Technologies, Inc. or its affiliates in the United States and other countries. Third party trademarks mentioned are the property of their respective owners.
www.canberra.comC40167 - 04/13