Embed Size (px)
Citation preview
April 2012
NASA/TM–2012-217565
Modeled and Measured Dynamics of a Composite Beam with Periodically Varying Foam Core Randolph H. Cabell, Roberto J. Cano, and Noah H. Schiller Langley Research Center, Hampton, Virginia Gary D. Roberts Glenn Research Center, Cleveland, Ohio
https://ntrs.nasa.gov/search.jsp?R=20120007100 2019-04-04T23:02:31+00:00Z

NASA STI Program . . . in Profile
Since its founding, NASA has been dedicated to the advancement of aeronautics and space science. The NASA scientific and technical information (STI) program plays a key part in helping NASA maintain this important role.
The NASA STI program operates under the auspices of the Agency Chief Information Officer. It collects, organizes, provides for archiving, and disseminates NASA’s STI. The NASA STI program provides access to the NASA Aeronautics and Space Database and its public interface, the NASA Technical Report Server, thus providing one of the largest collections of aeronautical and space science STI in the world. Results are published in both non-NASA channels and by NASA in the NASA STI Report Series, which includes the following report types:
TECHNICAL PUBLICATION. Reports of
completed research or a major significant phase of research that present the results of NASA programs and include extensive data or theoretical analysis. Includes compilations of significant scientific and technical data and information deemed to be of continuing reference value. NASA counterpart of peer-reviewed formal professional papers, but having less stringent limitations on manuscript length and extent of graphic presentations.
TECHNICAL MEMORANDUM. Scientific
and technical findings that are preliminary or of specialized interest, e.g., quick release reports, working papers, and bibliographies that contain minimal annotation. Does not contain extensive analysis.
CONTRACTOR REPORT. Scientific and
technical findings by NASA-sponsored contractors and grantees.
CONFERENCE PUBLICATION. Collected
papers from scientific and technical conferences, symposia, seminars, or other meetings sponsored or co-sponsored by NASA.
SPECIAL PUBLICATION. Scientific,
technical, or historical information from NASA programs, projects, and missions, often concerned with subjects having substantial public interest.
TECHNICAL TRANSLATION. English-
language translations of foreign scientific and technical material pertinent to NASA’s mission.
Specialized services also include creating custom thesauri, building customized databases, and organizing and publishing research results. For more information about the NASA STI program, see the following: Access the NASA STI program home page at
http://www.sti.nasa.gov E-mail your question via the Internet to
[email protected] Fax your question to the NASA STI Help Desk
at 443-757-5803 Phone the NASA STI Help Desk at
443-757-5802 Write to:
NASA STI Help Desk NASA Center for AeroSpace Information 7115 Standard Drive Hanover, MD 21076-1320
National Aeronautics and Space Administration Langley Research Center Hampton, Virginia 23681-2199
April 2012
NASA/TM–2012-217565
Modeled and Measured Dynamics of a Composite Beam with Periodically Varying Form Core Randolph H. Cabell, Roberto J. Cano, and Noah H. Schiller Langley Research Center, Hampton, Virginia Gary D. Roberts Glenn Research Center, Cleveland, Ohio

Available from:
NASA Center for AeroSpace Information 7115 Standard Drive
Hanover, MD 21076-1320 443-757-5802
The use of trademarks or names of manufacturers in this report is for accurate reporting and does not constitute an official endorsement, either expressed or implied, of such products or manufacturers by the National Aeronautics and Space Administration.

Abstract
The dynamics of a sandwich beam with carbon fiber composite facesheets and foam corewith periodic variations in material properties are studied. The purpose of the study is tocompare finite element predictions with experimental measurements on fabricated beamspecimens. For the study, three beams were fabricated: one with a compliant foam core,a second with a stiffer core, and a third with the two cores alternating along the lengthof the beam to create a periodic variation in properties. This periodic variation producesa bandgap in the frequency domain where vibrational energy does not readily propagatealong the length of the beam. Mode shapes and natural frequenices are compared, as wellas frequency responses from point force input to velocity response at the opposite end ofthe beam.
1 Introduction
Periodic variations of the material or geometric properties of a structure can be used to tai-lor the dynamic response of the structure and create frequency regions where vibrationalenergy does not readily propagate. This well-known phenomenon is often called bandgapbehavior and has been studied for many years [1–6]. A frequency bandgap can be beneficialfor isolating localized disturbances in a structure by reducing the propagation of unwantedvibrations through the structure. This can be especially useful in helicopters, where me-chanical excitation from the main rotor transmission couples into the airframe and thenre-radiates into the passenger cabin as unwanted noise. A periodic structure with a bandgaptuned to the excitation frequencies of the main transmission could be used to reduce the vi-brational energy that eventually radiates into the cabin. Examples of this approach appliedto helicopters can be found in the literature [7–9].
Periodic property variations in two-dimensional structures such as plates offer addi-tional design possibilities due to the directional dependence of wave propagation in such astructure [5]. For example, properties could be varied in such a way as to direct flexuralenergy away from or toward specific regions of the structure [10]. This could be useful forconcentrating energy at a localized damper or isolating an attachment point from distur-bances.
Various methods have been described for analyzing and designing periodic structures.Many methods rely on a unit cell description of a structure, where the unit cell is the ba-sic repeating structural element that makes up the structure. A transfer matrix method isused to describe the dynamics of an assembly of unit cells, and wave propagation throughthe assembly is then expressed in terms of complex propagation constants [2, 11]. Wavescan be characterized as either freely propagating or attenuated, based on the wave prop-agation constants. For relatively simple unit cells, analytical expressions can be derivedfor the dynamic stiffness, and an eigenvalue problem can then be solved to determine thepropagation constants [6, 12]. This approach is sometimes referred to as a spectral elementtechnique [13]. For unit cells with more complicated dynamics, a finite element model canbe used to determine mass and stiffness matrices for the cell, from which wave propagationproperties can be determined, in what is referred to as a wave/finite element method [14].
In the present work, a more computationally intensive design approach is used whereby
1
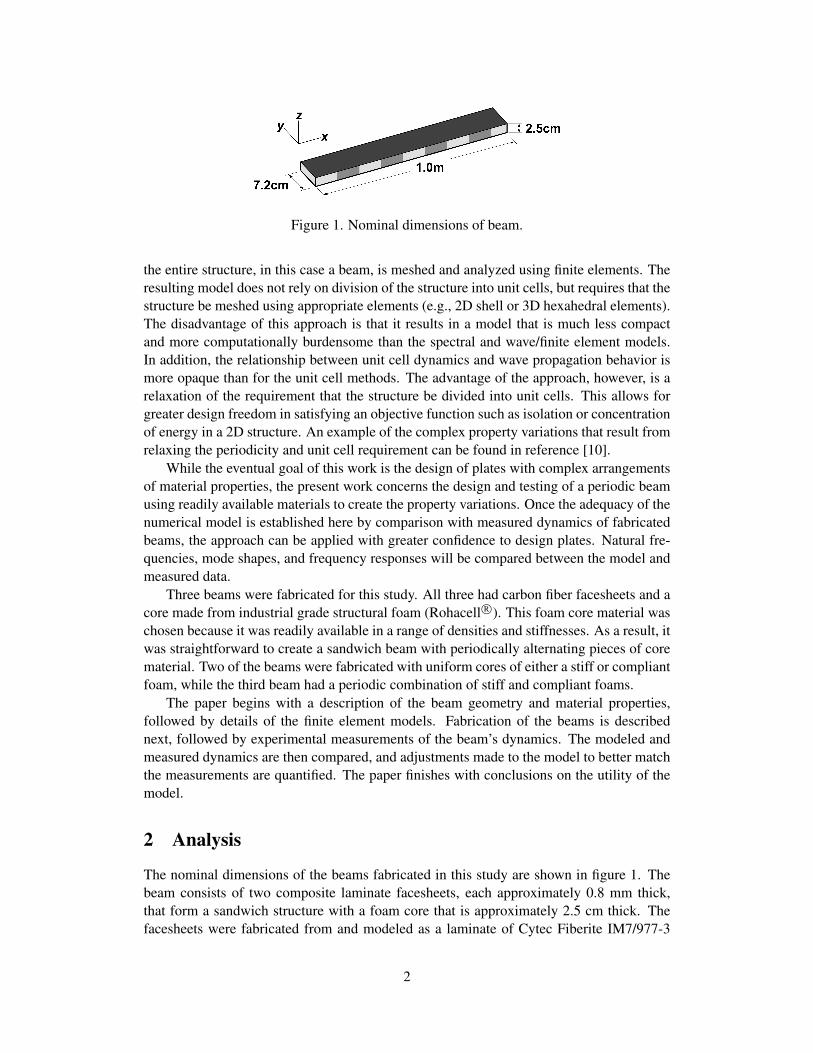
Figure 1. Nominal dimensions of beam.
the entire structure, in this case a beam, is meshed and analyzed using finite elements. Theresulting model does not rely on division of the structure into unit cells, but requires that thestructure be meshed using appropriate elements (e.g., 2D shell or 3D hexahedral elements).The disadvantage of this approach is that it results in a model that is much less compactand more computationally burdensome than the spectral and wave/finite element models.In addition, the relationship between unit cell dynamics and wave propagation behavior ismore opaque than for the unit cell methods. The advantage of the approach, however, is arelaxation of the requirement that the structure be divided into unit cells. This allows forgreater design freedom in satisfying an objective function such as isolation or concentrationof energy in a 2D structure. An example of the complex property variations that result fromrelaxing the periodicity and unit cell requirement can be found in reference [10].
While the eventual goal of this work is the design of plates with complex arrangementsof material properties, the present work concerns the design and testing of a periodic beamusing readily available materials to create the property variations. Once the adequacy of thenumerical model is established here by comparison with measured dynamics of fabricatedbeams, the approach can be applied with greater confidence to design plates. Natural fre-quencies, mode shapes, and frequency responses will be compared between the model andmeasured data.
Three beams were fabricated for this study. All three had carbon fiber facesheets and acore made from industrial grade structural foam (Rohacell R©). This foam core material waschosen because it was readily available in a range of densities and stiffnesses. As a result, itwas straightforward to create a sandwich beam with periodically alternating pieces of corematerial. Two of the beams were fabricated with uniform cores of either a stiff or compliantfoam, while the third beam had a periodic combination of stiff and compliant foams.
The paper begins with a description of the beam geometry and material properties,followed by details of the finite element models. Fabrication of the beams is describednext, followed by experimental measurements of the beam’s dynamics. The modeled andmeasured dynamics are then compared, and adjustments made to the model to better matchthe measurements are quantified. The paper finishes with conclusions on the utility of themodel.
2 Analysis
The nominal dimensions of the beams fabricated in this study are shown in figure 1. Thebeam consists of two composite laminate facesheets, each approximately 0.8 mm thick,that form a sandwich structure with a foam core that is approximately 2.5 cm thick. Thefacesheets were fabricated from and modeled as a laminate of Cytec Fiberite IM7/977-3
2

thickness E11 E22 G12 ν12 ρ
0.127 mm 162.47 GPa 9.52 GPa 6.09 GPa 0.37 1585 kg/m3
Table 1. Properties of IM7/977-3 cured prepreg ply. [15]
Elastic modulus, E Shear modulus, G Density, ρ Poisson’s ratio, νFoam (MPa) (MPa) (kg/m3) (computed)R31+ 36 13 32 0.38R110+ 160 50 110 0.60R110∗ 160 58 110 0.38
Table 2. Mechanical properties of industrial grade Rohacell R© foam (+ - values from man-ufacturer; ∗ - R110 with modified shear modulus)
carbon/epoxy, in a 6-layer layup with plies at angles of 60◦/0◦/ − 60◦/ − 60◦/0◦/60◦,where 0◦ corresponds to the long axis of the beam. Published properties of a single curedfacesheet ply are listed in table 1 [15].
The core material was Rohacell R© industrial grade foam, which is a structural poly-methacrylimide, closed-cell foam. This foam was available from the manufacturer in arange of densities and stiffnesses. A light, compliant foam, called R31, was selected asone core material, and a stiffer, denser foam, referred to as R110, was selected as the othercore material. Mechanical properties of these two foams, provided by the manufacturer, arelisted in the first two rows of table 2. The values in the table indicate the R110 foam isover 3 times denser and 4 times stiffer than the R31 foam. Assuming the foam is isotropic,Poisson’s ratio is given by ν = E/2G−1, and the corresponding values are listed in the lastcolumn of the table. The computed value of 0.6 for the R110 foam is unrealistically highfor an isotropic material, so the shear modulus used for that foam in the finite element mod-els was increased by 16%, as shown in the last row of the table, to obtain a Poisson’s ratioconsistent with the R31 foam. In the future, material testing of the foam may be needed todetermine a more accurate value of Poisson’s ratio or more appropriate material model.
A finite element model was used to evaluate different core configurations and createa bandgap region. The model, implemented in MSC Nastran, consisted of plate elements(CQUAD4) for the facesheets and hex elements (CHEXA) for the core. An example of thefinite element mesh of a beam with different core materials indicated by different colors isshown in figure 2. The nodes of the CQUAD4 facesheet elements and the outer CHEXAfoam elements were coincident in the model, hence the facesheet elements are not apparentin the figure. The neutral axis of each CQUAD4 element was offset by half the laminatethickness in the model. The element sizes varied slightly depending on the beam configura-tion, but the hex elements were approximately 6 mm on a side along the length and throughthe thickness of the beam, and either 6 mm or 7.2 mm along the beam’s width. This pro-vided 4 elements through the thickness of the beam, and either 10 or 12 elements along thewidth.
Designing the bandgap consisted of adjusting the lengths of R31 and R110 foam thatwere repeated along the length of the beam. The goal was to create a gap in the naturalfrequencies of the beam, as computed from the finite element model, near 1 kHz. This gapin natural frequencies would then correspond to a bandgap in the frequency response. A
3
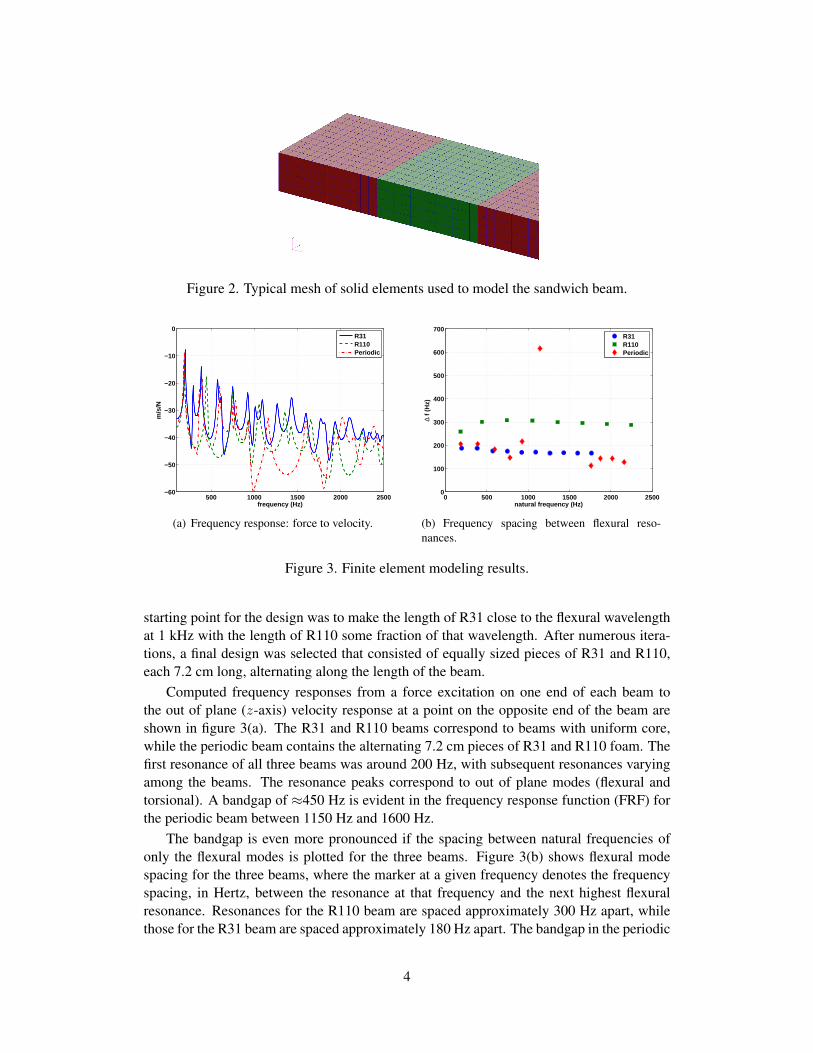
Figure 2. Typical mesh of solid elements used to model the sandwich beam.
500 1000 1500 2000 2500−60
−50
−40
−30
−20
−10
0
frequency (Hz)
m/s
/N
R31R110Periodic
(a) Frequency response: force to velocity.
0 500 1000 1500 2000 25000
100
200
300
400
500
600
700
natural frequency (Hz)
∆ f
(Hz)
R31R110Periodic
(b) Frequency spacing between flexural reso-nances.
Figure 3. Finite element modeling results.
starting point for the design was to make the length of R31 close to the flexural wavelengthat 1 kHz with the length of R110 some fraction of that wavelength. After numerous itera-tions, a final design was selected that consisted of equally sized pieces of R31 and R110,each 7.2 cm long, alternating along the length of the beam.
Computed frequency responses from a force excitation on one end of each beam tothe out of plane (z-axis) velocity response at a point on the opposite end of the beam areshown in figure 3(a). The R31 and R110 beams correspond to beams with uniform core,while the periodic beam contains the alternating 7.2 cm pieces of R31 and R110 foam. Thefirst resonance of all three beams was around 200 Hz, with subsequent resonances varyingamong the beams. The resonance peaks correspond to out of plane modes (flexural andtorsional). A bandgap of ≈450 Hz is evident in the frequency response function (FRF) forthe periodic beam between 1150 Hz and 1600 Hz.
The bandgap is even more pronounced if the spacing between natural frequencies ofonly the flexural modes is plotted for the three beams. Figure 3(b) shows flexural modespacing for the three beams, where the marker at a given frequency denotes the frequencyspacing, in Hertz, between the resonance at that frequency and the next highest flexuralresonance. Resonances for the R110 beam are spaced approximately 300 Hz apart, whilethose for the R31 beam are spaced approximately 180 Hz apart. The bandgap in the periodic
4
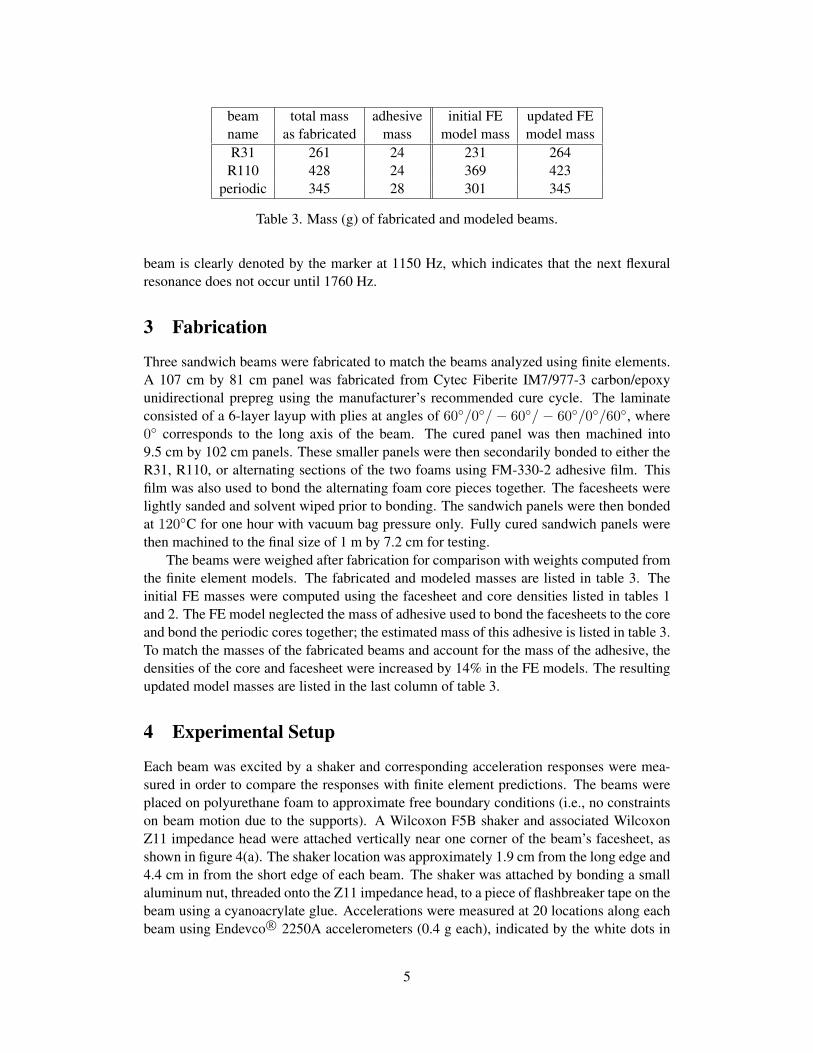
beam total mass adhesive initial FE updated FEname as fabricated mass model mass model massR31 261 24 231 264
R110 428 24 369 423periodic 345 28 301 345
Table 3. Mass (g) of fabricated and modeled beams.
beam is clearly denoted by the marker at 1150 Hz, which indicates that the next flexuralresonance does not occur until 1760 Hz.
3 Fabrication
Three sandwich beams were fabricated to match the beams analyzed using finite elements.A 107 cm by 81 cm panel was fabricated from Cytec Fiberite IM7/977-3 carbon/epoxyunidirectional prepreg using the manufacturer’s recommended cure cycle. The laminateconsisted of a 6-layer layup with plies at angles of 60◦/0◦/ − 60◦/ − 60◦/0◦/60◦, where0◦ corresponds to the long axis of the beam. The cured panel was then machined into9.5 cm by 102 cm panels. These smaller panels were then secondarily bonded to either theR31, R110, or alternating sections of the two foams using FM-330-2 adhesive film. Thisfilm was also used to bond the alternating foam core pieces together. The facesheets werelightly sanded and solvent wiped prior to bonding. The sandwich panels were then bondedat 120◦C for one hour with vacuum bag pressure only. Fully cured sandwich panels werethen machined to the final size of 1 m by 7.2 cm for testing.
The beams were weighed after fabrication for comparison with weights computed fromthe finite element models. The fabricated and modeled masses are listed in table 3. Theinitial FE masses were computed using the facesheet and core densities listed in tables 1and 2. The FE model neglected the mass of adhesive used to bond the facesheets to the coreand bond the periodic cores together; the estimated mass of this adhesive is listed in table 3.To match the masses of the fabricated beams and account for the mass of the adhesive, thedensities of the core and facesheet were increased by 14% in the FE models. The resultingupdated model masses are listed in the last column of table 3.
4 Experimental Setup
Each beam was excited by a shaker and corresponding acceleration responses were mea-sured in order to compare the responses with finite element predictions. The beams wereplaced on polyurethane foam to approximate free boundary conditions (i.e., no constraintson beam motion due to the supports). A Wilcoxon F5B shaker and associated WilcoxonZ11 impedance head were attached vertically near one corner of the beam’s facesheet, asshown in figure 4(a). The shaker location was approximately 1.9 cm from the long edge and4.4 cm in from the short edge of each beam. The shaker was attached by bonding a smallaluminum nut, threaded onto the Z11 impedance head, to a piece of flashbreaker tape on thebeam using a cyanoacrylate glue. Accelerations were measured at 20 locations along eachbeam using Endevco R© 2250A accelerometers (0.4 g each), indicated by the white dots in
5

(a) Shaker in vertical orientation at-tached to facesheet of beam.
(b) Accelerometer locations (white dots) on facesheet excited byshaker.
Figure 4. Shaker and accelerometer configuration for testing.
figure 4(b). Accelerometers were attached to the beam using accelerometer wax. To min-imize mass loading of each beam by the sensors, the response data were collected usingonly four accelerometers at a time, requiring five consecutive runs for the 20 measurementlocations.
It should be noted that the accelerometers and impedance head used to make the mea-surements were not calibrated using NIST-traceable standards. Instead, scale factors werecomputed for the accelerometers and impedance head using an accelerometer calibrator(PCB R© model 394C06) that produced nominally 1 g of acceleration at 159.2 Hz. The scalefactors ensured the sensors responded with uniform magnitude to the same excitation, butthe absolute level of that response cannot be traced to a calibrated standard. For this reason,the results here are discussed in terms of relative levels and computed quantities that are notdependent on absolute levels.
The coherence between the shaker force and the acceleration measured at the oppositeend of the beam is shown in figure 5(a) for the three beams. The coherence was gener-ally excellent away from resonances and above 100 Hz. Coherence values at the otheraccelerometer locations closely resembled the coherence shown in figure 5(a).
The uncalibrated power input to the beam by the shaker is shown in figure 5(b), in dBrelative to the maximum power input. The curves indicate that the power input at 2000 Hzwas nearly 40 dB below the maximum power input near 150 Hz for all three beams. Al-though the coherence from shaker to sensors remained high above 1500 Hz, the combina-tion of reduced power input and shorter structural wavelength made it increasingly difficultto interpret the beam’s response in terms of mode shapes above about 1500 Hz. In some
6

0 500 1000 1500 20000
0.1
0.2
0.3
0.4
0.5
0.6
0.7
0.8
0.9
1
frequency (Hz)
γ2
R31R110periodic
(a) Coherence, shaker input to end accelerometer.
0 500 1000 1500 2000−60
−50
−40
−30
−20
−10
0
frequency (Hz)
Wat
ts (
dB r
e m
ax)
R31R110periodic
(b) Relative magnitude of power input by shaker.
Figure 5. Measured coherence and input power.
cases, the response of all three beams above 1500 Hz was localized near the shaker attach-ment point. This made it difficult to interpret the beam’s response in terms of modes, anddifficult to judge the upper frequency end of the bandgap in the periodic core beam.
The accelerometer responses were post-processed to determine natural frequencies andassociated mode shapes of the beams. These measured frequencies and mode shapes werecompared with the finite element predictions in order to guide changes to material propertiesin the finite element models. The baseline material properties used in the model are listedin tables 1 and 2, although as discussed earlier, the densities of the foam and facesheet wereincreased by 14% so the modeled masses matched the fabricated masses.
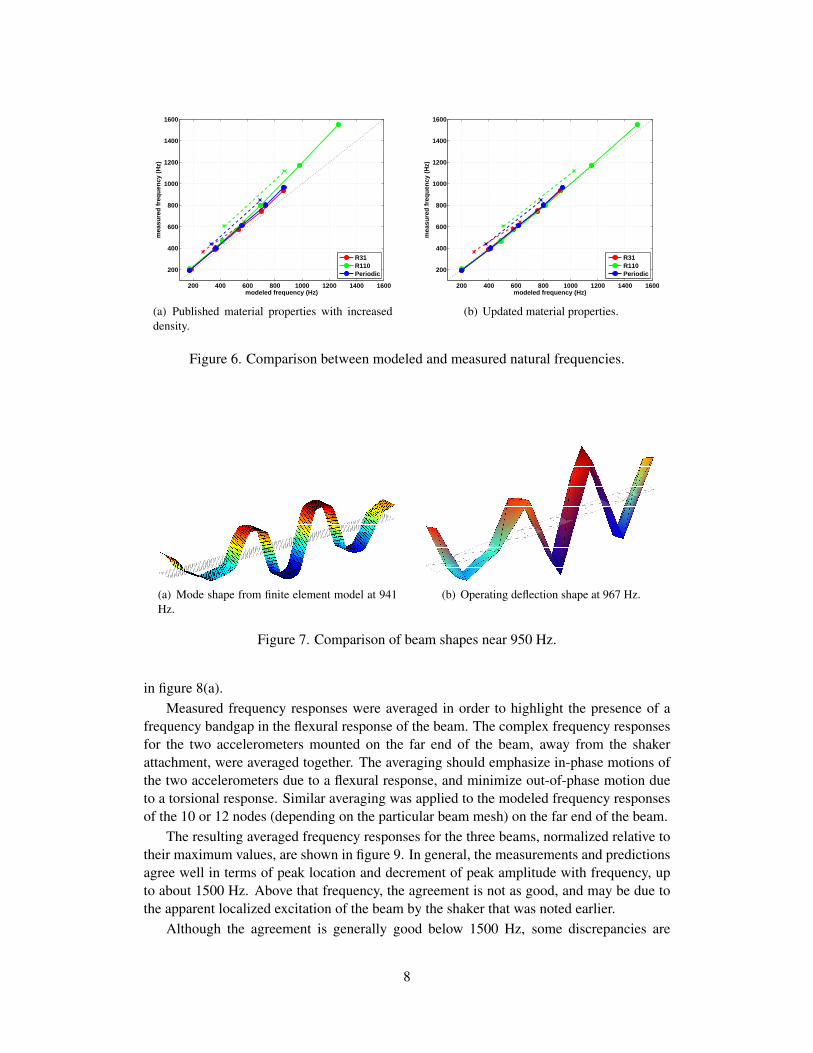
Modeled and measured natural frequencies are compared in figure 6 for the first fiveflexural modes and first two torsional modes. The solid curves with circles correspond toflexural modes and the dashed curves with x’s indicate torsional modes. Perfect agreementoccurs when the curves coincide with the dashed line at 45◦. In figure 6(a), the modelednatural frequencies were computed using the baseline material properties for the facesheetand core, including the 14% density increase. In figure 6(b), the material properties used inthe model were adjusted to obtain better agreement with the measured frequencies. Specif-ically, the moduli of the facesheets (E11, E22 and G12) and the elastic modulus of the R110core were increased 40% over their baseline values, and the elastic modulus of the R31 corewas increased by 15%. The result is better agreement between the modeled and measuredflexural modes, although the torsional modes are still underpredicted by the models.
There is no obvious physical justification for increasing the moduli, other than to obtainbetter agreement with the measured natural frequencies. For future modeling efforts, itwould be worthwhile to measure the mechanical properties of the structural components,such as the core, facesheets, and adhesive, instead of using published property values.
Figures 7 and 8 show good agreement between predicted mode shapes and measuredoperating deflection shapes. Although the measurements are coarsely spaced relative tothe fine finite element grid, the response data for these two modes agree well with themodeled mode shapes. In particular, the operating deflection shape in figure 7(b) displaysthe same asymmetry seen in the mode shape in figure 7(a). Similarly, the deflection shape at1152 Hz shown in figure 8(b) shows a decaying behavior seen in the mode shape prediction
7
200 400 600 800 1000 1200 1400 1600
200
400
600
800
1000
1200
1400
1600
modeled frequency (Hz)
mea
sure
d f
req
uen
cy (
Hz)
R31R110Periodic
(a) Published material properties with increaseddensity.
200 400 600 800 1000 1200 1400 1600
200
400
600
800
1000
1200
1400
1600
modeled frequency (Hz)
mea
sure
d f
req
uen
cy (
Hz)
R31R110Periodic
(b) Updated material properties.
Figure 6. Comparison between modeled and measured natural frequencies.
(a) Mode shape from finite element model at 941Hz.
(b) Operating deflection shape at 967 Hz.
Figure 7. Comparison of beam shapes near 950 Hz.
in figure 8(a).Measured frequency responses were averaged in order to highlight the presence of a
frequency bandgap in the flexural response of the beam. The complex frequency responsesfor the two accelerometers mounted on the far end of the beam, away from the shakerattachment, were averaged together. The averaging should emphasize in-phase motions ofthe two accelerometers due to a flexural response, and minimize out-of-phase motion dueto a torsional response. Similar averaging was applied to the modeled frequency responsesof the 10 or 12 nodes (depending on the particular beam mesh) on the far end of the beam.
The resulting averaged frequency responses for the three beams, normalized relative totheir maximum values, are shown in figure 9. In general, the measurements and predictionsagree well in terms of peak location and decrement of peak amplitude with frequency, upto about 1500 Hz. Above that frequency, the agreement is not as good, and may be due tothe apparent localized excitation of the beam by the shaker that was noted earlier.
Although the agreement is generally good below 1500 Hz, some discrepancies are
8
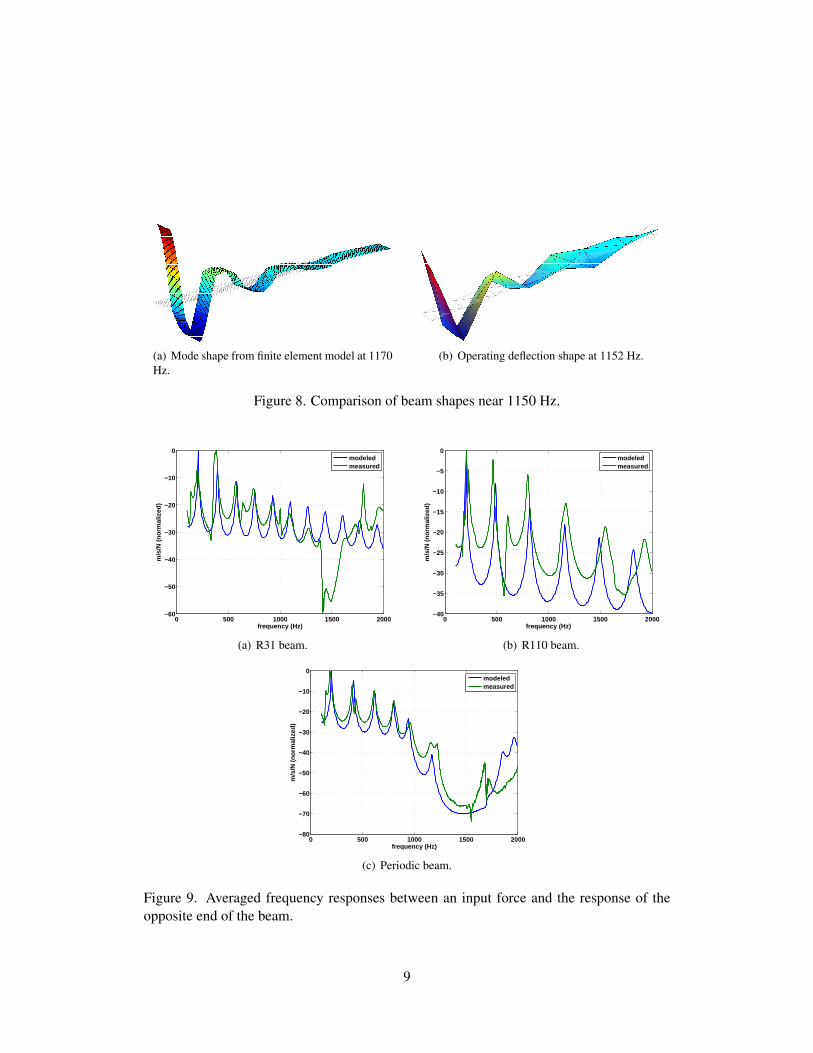
(a) Mode shape from finite element model at 1170Hz.
(b) Operating deflection shape at 1152 Hz.
Figure 8. Comparison of beam shapes near 1150 Hz.
0 500 1000 1500 2000−60
−50
−40
−30
−20
−10
0
frequency (Hz)
m/s
/N (
norm
aliz
ed)
modeledmeasured
(a) R31 beam.
0 500 1000 1500 2000−40
−35
−30
−25
−20
−15
−10
−5
0
frequency (Hz)
m/s
/N (
norm
aliz
ed)
modeledmeasured
(b) R110 beam.
0 500 1000 1500 2000−80
−70
−60
−50
−40
−30
−20
−10
0
frequency (Hz)
m/s
/N (
norm
aliz
ed)
modeledmeasured
(c) Periodic beam.
Figure 9. Averaged frequency responses between an input force and the response of theopposite end of the beam.
9

prominent. In figure 9(a), the measured frequency response for the R31 beam appearsto show a bandgap effect from just above 1400 Hz to 1600 Hz. However, this dip can betraced to two effects: the first is a torsional mode at 1410 Hz, which creates nearly equaland oppositely-phased responses at the two accelerometers. This symmetric response wasproduced even though the exciting force was offset from the beam’s centerline. The averageof the accelerometers’ responses to this symmetric response is numerically very small. Inaddition, the beam’s response is very low from 1450 to 1600 Hz, presumably due to poorexcitation from the shaker. In the R110 data, the peak near 600 Hz in the measured but notthe modeled data is due to a torsional mode at 610 Hz with a strongly asymmetric responseat the two accelerometers, thereby creating a peak in the averaged frequency response.
The data corresponding to the periodic beam, in figure 9(c), contains a significantbandgap of reduced response between ≈1000 and 1700 Hz. Some of this response re-duction, particularly above 1300 Hz, can be attributed to poor excitation of the beam bythe shaker. However, the balance of the response reduction, from 1000 to 1300 Hz, occursbecause the periodic core both creates a modal response, shown in figures 8(a) and 8(b),that allows high displacements at the driven end and minimal displacements at the oppositeend, and creates a gap in natural frequencies above 1000 Hz. The result is a reduction in themagnitude of the frequency response from shaker input to velocity response at the oppositeend of the beam.
5 Conclusions
Sandwich beams with composite facesheets and foam cores were fabricated and dynami-cally tested in order to evaluate the accuracy of finite element models of the beams. Threebeams were fabricated: one with a light, compliant foam core, a second with stiffer, denserfoam core, and a third with alternating pieces of the two foam cores. The alternating, orperiodic, core was designed to create a frequency bandgap where flexural waves did notpropagate along the beam. The finite element models used shell elements to model thefacesheets and hexahedral elements to model the foam core.
Comparisons between predicted and measured natural frequencies for the three beamswere generally good after material properties used in the models (densities and stiffnesses)were updated. Specifically, densities for the facesheet and foam cores were increased 14%to match the fabricated beam masses. In addition, the moduli of the facesheets and theheavier core were increased by 40% over published values, and the modulus of the lightercore was increased by 15% over its published value. With these new material properties,modeled and measured frequencies of the first five flexural modes of the beam agreed towithin 6% of one another, while torsional modes agreed to within 20%. These frequencydiscrepancies, combined with the large increases made to the material moduli in the models,suggest that future models should rely on measured material properties of the beam compo-nents before they are bonded together. There should also be some effort to account for themass of the adhesive used to bond the facesheets and periodic core pieces together. Mod-eled mode shapes and measured operating deflection shapes showed good agreement for theperiodic beam, with both showing similar asymmetries due to the periodic core material.
The generally good agreement between measurement and predictions suggests that fi-nite element models should be sufficiently accurate to further explore the approach of vary-
10

ing the core properties in order to tailor vibration response behavior of a beam or plate.
References
1. D.J. Mead. Free wave propagation in periodically-supported infinite beams. Journal ofSound and Vibration, 11(2):181–197, 1970.
2. D.J. Mead. Wave propagation and natural modes in periodic systems: I. Mono-coupledsystems. Journal of Sound and Vibration, 40(1):1–18, 1975.
3. D.J. Mead. Wave propagation in continuous periodic structures: Research contribu-tions from Southampton, 1964-1995. Journal of Sound and Vibration, 190(3):495–524,1996.
4. R.C. Engels. Response of infinite periodic structures. Journal of Sound and Vibration,69(2):181–197, 1980.
5. Massimo Ruzzene, Luca Mazzarella, Panagiotis Tsopelas, and Fabrizio Scarpa. Wavepropagation in sandwich plates with periodic auxetic cores. Journal of Intelligent Ma-terial Systems and Structures, 13:587–597, September 2002.
6. Massimo Ruzzene and Fabrizio Scarpa. Control of wave propagation in sandwichbeams with auxetic cores. Journal of Intelligent Material Systems and Structures,14:443–453, July 2003.
7. Filippo Casadei, Lorenzo Dozio, Massimo Ruzzene, and Kenneth A. Cunefare. Peri-odic shunted arrays for the control of noise radiation in an enclosure. Journal of Soundand Vibration, 329:3632–3646, 2010.
8. Joseph T. Szefi, Edward C. Smith, and George A. Lesieutre. Design and testing ofa compact layered isolator for high-frequency helicopter gearbox isolation. In 45thAIAA/ASME/ASCE/AHS/ASC Structures, Structural Dynamics & Materials Confer-ence, number AIAA-2004-1947, Palm Springs, April 2004.
9. S. Asiri, A. Baz, and D. Pines. Periodic struts for gearbox support system. Journal ofVibration and Control, 11:709–721, 2005.
10. Anders A. Larsen, Bogi Laksafoss, Jakob S. Jenson, and Ole Sigmund. Topologi-cal material layout in plates for vibration suppression and wave propagation control.Structural and Multidisciplinary Optimization, 37:585–594, 2009.
11. R.S. Langley and P. Bremner. A hybrid method for the vibration analysis of com-plex structural-acoustic systems. Journal of the Acoustical Society of America,105(3):1657–1671, March 1999.
12. R.S. Langley. Application of the dynamic stiffness method to the free and forced vi-brations of aircraft panels. Journal of Sound and Vibration, 135(2):319–331, 1989.
13. J.F. Doyle. Wave Propagation in Structures. Springer, 2nd edition, 1997.
11

14. Brian R. Mace and Elisabetta Manconi. Modelling wave propagation in two-dimensional structures using finite element analysis. Journal of Sound and Vibration,318:884–902, 2008.
15. C.T. Sun and C. Han. A method for testing interlaminar dynamic fracture toughness ofpolymeric composites. Composites: Part B, 35:647–655, 2004.
12

REPORT DOCUMENTATION PAGEForm Approved
OMB No. 0704-0188
2. REPORT TYPE
Technical Memorandum 4. TITLE AND SUBTITLE
Modeled and Measured Dynamics of a Composite Beam with Periodically Varying Foam Core
5a. CONTRACT NUMBER
6. AUTHOR(S)
Cabell, Randolph H.; Cano, Roberto, J.; Schiller, Noah H.; Roberts, Gary D.
7. PERFORMING ORGANIZATION NAME(S) AND ADDRESS(ES)
NASA Langley Research CenterHampton, VA 23681-2199
9. SPONSORING/MONITORING AGENCY NAME(S) AND ADDRESS(ES)
National Aeronautics and Space AdministrationWashington, DC 20546-0001
8. PERFORMING ORGANIZATION REPORT NUMBER
L-20116
10. SPONSOR/MONITOR'S ACRONYM(S)
NASA
13. SUPPLEMENTARY NOTES
12. DISTRIBUTION/AVAILABILITY STATEMENTUnclassified - UnlimitedSubject Category 71Availability: NASA CASI (443) 757-5802
19a. NAME OF RESPONSIBLE PERSON
STI Help Desk (email: [email protected])
14. ABSTRACT
The dynamics of a sandwich beam with carbon fiber composite facesheets and foam core with periodic variations in material properties are studied. The purpose of the study is to compare finite element predictions with experimental measurements on fabricated beam specimens. For the study, three beams were fabricated: one with a compliant foam core, a second with a stiffer core, and a third with the two cores alternating down the length of the beam to create a periodic variation in properties. This periodic variation produces a bandgap in the frequency domain where vibrational energy does not readily propagate down the length of the beam. Mode shapes and natural frequencies are compared, as well as frequency responses from point force input to velocity response at the opposite end of the beam.
15. SUBJECT TERMS
Composite beam; frequency bandgap; periodic structure
18. NUMBER OF PAGES
17
19b. TELEPHONE NUMBER (Include area code)
(443) 757-5802
a. REPORT
U
c. THIS PAGE
U
b. ABSTRACT
U
17. LIMITATION OF ABSTRACT
UU
Prescribed by ANSI Std. Z39.18Standard Form 298 (Rev. 8-98)
3. DATES COVERED (From - To)
5b. GRANT NUMBER
5c. PROGRAM ELEMENT NUMBER
5d. PROJECT NUMBER
5e. TASK NUMBER
5f. WORK UNIT NUMBER
877868.02.07.07.04.01.01
11. SPONSOR/MONITOR'S REPORT NUMBER(S)
NASA/TM-2012-217565
16. SECURITY CLASSIFICATION OF:
The public reporting burden for this collection of information is estimated to average 1 hour per response, including the time for reviewing instructions, searching existing data sources, gathering and maintaining the data needed, and completing and reviewing the collection of information. Send comments regarding this burden estimate or any other aspect of this collection of information, including suggestions for reducing this burden, to Department of Defense, Washington Headquarters Services, Directorate for Information Operations and Reports (0704-0188), 1215 Jefferson Davis Highway, Suite 1204, Arlington, VA 22202-4302. Respondents should be aware that notwithstanding any other provision of law, no person shall be subject to any penalty for failing to comply with a collection of information if it does not display a currently valid OMB control number.PLEASE DO NOT RETURN YOUR FORM TO THE ABOVE ADDRESS.
1. REPORT DATE (DD-MM-YYYY)
04 - 201201-


![JEffect of Measured Material ]Properties on the Finite ... · PDF fileJEffect of Measured Material ]Properties on the Finite ... finite element analysis of the OH-58 composite tail](https://img.pdfslide.net/doc/110x75/5ab416e17f8b9a1a048b922a/jeffect-of-measured-material-properties-on-the-finite-of-measured-material.jpg)