Embed Size (px)
Citation preview
Pervasive and Mobile Computing 71 (2021) 101334
D
nisIbo
ceu
Contents lists available at ScienceDirect
Pervasive andMobile Computing
journal homepage: www.elsevier.com/locate/pmc
Modeling an intelligent controller for predictive caching inAR/VR-enabled home scenariosSharare Zehtabian ∗, Siavash Khodadadeh, Ladislau Bölöni, Damla Turgutepartment of Computer Science, University of Central Florida, Orlando, FL, USA
a r t i c l e i n f o
Article history:Received 22 June 2020Received in revised form 3 November 2020Accepted 9 January 2021Available online 14 January 2021
Keywords:Intelligent systemsUser modelingPredictive caching for AR/VR
a b s t r a c t
In a possible future, pervasive augmented and/or virtual reality (AR/VR) might becomethe primary delivery method for audio-visual information. To achieve a high level ofuser satisfaction, such a system must answer user requests with high-quality contentdelivered with minimal lag. As bandwidth and latency limitations will still apply, thesystem must perform predictive caching of the content. In this paper, we investigateseveral strategies for predicting the information needs of a user in an AR/VR-enabledhome. The paucity of datasets is a major challenge in such studies. We are startingfrom the hypothesis that the user’s patterns of daily life guide the content consumptionregardless of the delivery medium. This allows us to synthetically generate realisticcontent requests starting from real-world databases of user activities in smart homes.Using these datasets, we develop techniques for demand prediction and content cachingthat aim to optimize the quality of user satisfaction while minimizing the cost of caching.We propose three algorithms: one based on probabilistic modeling, one based on longshort term memory (LSTM) networks, and one based on majority voting. Through aset of experimental studies, we show that our techniques outperform baseline cachingtechniques both in terms of user satisfaction and caching cost.
© 2021 Elsevier B.V. All rights reserved.
1. Introduction
Augmented/virtual reality (AR/VR) can apply to a wide range of in-home scenarios such as entertainment, training,avigation, storytelling, question-answering agents, and so on. People commonly use mobile devices to receive thisnformation; however, depending on the situation, they might prefer to see the content as dynamic 3D images on a bigcreen or through augmented/virtual reality devices. Max reality, for example, is a product of The Weather Company, anBM business aiming to deliver personalized and more interactive visualization of weather or traffic report to the users toetter understand travel conditions and plan for their commute. Their studies showed that Max reality appealed to 62%f participants and 64% will stay tuned in longer if Max reality is coming up in the next segment.1In this paper, we consider a system that provides information regarding various daily in-home scenarios. For example,
hecking the news for major sports events, weather or traffic report, parking status, and checking online information forveryday tasks such as appropriate cooking recipes through AR/VR devices or screens. In these scenarios, we assume thatsers’ satisfaction relies significantly on the quality level of the delivered information and how quickly it is delivered.
∗ Corresponding author.E-mail addresses: [email protected] (S. Zehtabian), [email protected] (S. Khodadadeh),
[email protected] (L. Bölöni), [email protected] (D. Turgut).1 Study conducted by the weather company research panel in March 2015
https://doi.org/10.1016/j.pmcj.2021.1013341574-1192/© 2021 Elsevier B.V. All rights reserved.
S. Zehtabian, S. Khodadadeh, L. Bölöni et al. Pervasive and Mobile Computing 71 (2021) 101334
cssditwa
t
2
asn
2
rmsnlacassr
2
in4aASiAd
The system needs to have sufficient computational resources, display capabilities, and fast and efficient access to theinformation required to deliver a high-quality experience.
The required data can be locally accessed (having been cached on the local device), downloaded from the web, oromputed (for instance, through local rendering). Downloading all the information from the web is not an optimal solutionince bandwidth is costly, especially when the highest quality is requested. Local computing is also burdensome for theystem and expensive in terms of energy expenditure. One ideal solution would be to have a locally cached copy of theata associated with the highest quality, on every device for all possible user experiences. However, this strategy cannvolve the problems mentioned above. Also, the device’s storage capacity might be limited and not sufficient for cachinghe higher quality format of all the experiences. A more intelligent strategy would be to predict what experience the userill request and in which time frame of the day this request will happen, so the system can cache the necessary data indvance to deliver that experience on the device.In this work, we implement an intelligent controller that aims to maximize the quality of experience while optimizing
he caching cost by predicting the user’s preferences in the future. Our main contributions can be summarized as follows:
• We simulate the user’s request in an AR/VR enabled home by building synthetic sequential datasets from two realdatasets, wireless sensor networks (WSNs) and CASAS, and two bigger Open Smart-Home simulated (OpenSHS)datasets of daily human activities.
• We propose a method based on long short term memory networks (LSTMs) and a probability-based approach topredict the user’s future requests at a specific time of the day. We suggest caching the required content based onthese strategies, and finally, we compare the results with three baseline caching strategies.
. Prior work
This paper is an extension of our previous work in which we aimed to model interactions between a user andn augmented/virtual reality agent system and showed how predictive caching improved the user experience in suchystems [1]. The proposed work described in this paper is related to several active research areas in user modeling andetworking.
.1. User modeling
Efficient delivery of experiences requires us to model the user based on his or her behavior to predict his/her futureequests. Observed sample results can be used to make predictions about a user in the context of predictive statisticalodels. Several techniques have been generated by machine learning and reasoning under uncertainty for predictivetatistical modelings such as decision trees, neural networks, classification and rule-induction methods, and Bayesianetworks [2]. Chen et al. [3] proposed a data mining approach to model user intention in which proper concepts ofinguistic features are extracted using rule association and classified with a Naive Bayes classifier. Guha et al. [4] deployeduser modeling system for Google Now personal assistant based on long-term user history with thousands of queries andlicks. They showed that identifying contexts such as users’ interests and habits is critical to building a useful personalssistant. Similarly, we use the user’s daily activities to create synthetic request data in an in-home assistant AR/VRcenario. The main difference in our user modeling system is that we build our synthetic data by considering a common-ense association between daily activities and potential requests. For example, it is more likely to check the weathereport when the user is getting dressed. Also, it is less likely for the user to request for traffic report before sleep.
.2. Networking requirement in AR/VR
Augmented/virtual reality applications require larger bandwidth, lower latency, and a reliable network. For instance,n reporting major sports events or music education, high-quality video streams should be transmitted via a very reliableetwork [5,6]. It gets even more challenging when many users are requesting the same content at the same time. CurrentG wireless systems have difficulty meeting the demands of high bandwidth and low latency requirements in AR/VRpplications. In order to overcome these challenges, even 5G network architectures should be ingeniously designed forR/VR applications [7]. In AR/VR applications, deciding what to cache and where to cache are crucial problems, and asukhmani et al. [8] argue, Quality of Experience (QoE) needs to work with Quality of Service (QoS). Westphal [9] suggestednformation-centric networks as a potential architecture to assist with the deployment of AR/VR. We propose a centralR/VR controller responsible for making decisions about the type and quality of the information required for caching toeliver at a specific time in the future.
2
S. Zehtabian, S. Khodadadeh, L. Bölöni et al. Pervasive and Mobile Computing 71 (2021) 101334
rtacc
cc
Cw
esfsdssa
3
3
sSmhsehdhts
Table 1Relative quality and caching cost levels of experience units and data chunk size for a 15 to 20 secondsexperience unit. To compute the relative cost, we consider the worst case for each type of format.Type Size of exp. unit Relative quality Relative cost
4K video 32.7 MB 1.00 205.66HD video (1080p) 10.6 MB 0.90 66.67low-res video MKV 483 KB 0.81 3.043GP low-res QCIF 159 KB 0.73 1.00sound-only – 0.66 –text-only – 0.59 –3D animation 2 MB–20 MB 1.00 125.79
2.3. Caching strategies for AR/VR
Content-centric/information-centric networking (CCN/ICN) models allow us to optimize the bandwidth utilization andeduce the delivery delay by using a caching function inside the intermediate network nodes. One possible approach is forhe nodes to cache all the content within the network and respond to the user request from their sources [10]. Anothervailable caching policy is Leave Copy Everywhere (LCE) [11,12], which recommends all the caching nodes to cache theontent data. The replacement policy of the Least Recently Used (LRU) algorithm updates locally saved content if theaching nodes do not have enough space.These policies are simple and easy to implement; however, unnecessary caching significantly increases the network
ost, bandwidth utilization, and storage consumption [13]. As a result, designing an appropriate caching strategy, reducingaching redundancy, and increasing cache hit is an active research area [14].Proactive caching has been demonstrated to outperform reactive policies such as LRU [7]. Koch et al. [15] used a
onvolutional Neural Network (ConvNet) to extract music features to predict the content more likely to be accessibleithin the next time.Chakareski [16] designed an optimization framework to maximize the reward that a multi-cellular system can
arn when serving AR/VR users by enabling the base stations to select cooperative caching/streaming/edge-computingtrategies. Du et al. [17] proposed a pre-fetching approach at the user end to preload videos before the user requestsrom a famous Swedish TV service provider by analyzing the request patterns over eleven weeks. Koch et al. [18]tudied the traditional caching strategies and designed a video category-aware caching algorithm, adaptive content-awareesigned cache (ACDC), that enables differentiating the caching strategies concerning the workloads and popularity. Theypecifically focused on the publicly available different YouTube video categories such as music, news, entertainment,ports, and so on. While these approaches have shown significant advantages, we believe that deep learning-basedlgorithms such as long short term memory networks (LSTMs) are compelling to learn the pattern in a sequential data.
. User modeling
.1. Problem statement
In this paper, we consider a set of household scenarios in which residents use AR/VR devices to request experiencesuch as (a) summary of the news, (b) weather report, (c) parking availability report, (d) traffic report, and (e) food recipe.tatistically, a given type of experience is more likely to be accessed at a specific time of the day. For instance, a useright more likely need a recipe during dinner preparation time, or a weather forecast can be most helpful before leavingome. The users in an AR/VR-enabled home go through a series of interactions split into experience units, a particularhort interaction with the AR/VR system, delivered through AR/VR devices. In our scenarios, we consider experiences thatach ‘‘unit of experience’’ is approximately 15 to 20 seconds long and can be delivered at different ‘‘level of quality’’ fromigh such as 4K videos or 3D animation to low such as 3GP low-resolution QCIF. For instance, a weather forecast can beelivered as a short text message, a dynamic 3D image on a big screen, or a dual-4K immersive visualization. Providing aigh-quality experience requires both networking and computing power. Therefore, it is limited by the (1) capabilities ofhe devices through which it is delivered and by the (2) signal limitations such as network delay and bandwidth. Table 1hows the quality levels we consider in this paper and the size of the data chunk necessary to deliver the experience unit.
Considering a particular experience e, we define the delay by dividing the size of the content in MB by externalbandwidth:
delaye =size(e)
external_bandwidth. (1)
One conventional approach to rate user satisfaction would be by evaluating objective metrics such as video definition(video quality), fluency (interruptions), response speed (initial delay) [19]. According to this, we estimate the ‘‘usersatisfaction’’ by the score as follows:
score = ddelaye · d (e) · max_score (2)
e d f3
S. Zehtabian, S. Khodadadeh, L. Bölöni et al. Pervasive and Mobile Computing 71 (2021) 101334
(
icc
DaRw(
in which dd is the discount factor for the delay, df (.) is the discount factor of quality of each experience shown in Table 1column of relative quality), and max_score is the value for the maximum quality. Notice that the value of dd and df (e)are between 0 and 1. In other words, more significant delay or lower quality both result in smaller score value. Otherthan user satisfaction, we have to consider the cost of caching. We calculate the cost of caching as cost = nc · rc , where ncs the number of cached items and rc is the relative cost of each type of content available in Table 1 (column of relativeost). Since the size of sound-only and text-only formats are very small, we do not consider cache cost for these types ofontent. We obtain relative cost by size
min_size , in which size is the content size for a 15 to 20 seconds experience unit basedon type, and min_size is the minimum content size for 3GP low-res QCIF type equals 159 KB. Eventually, the final scoreis computed as
final_score = α · score − β · cost (3)
where α and β are coefficients for score and cost value, respectively.
3.2. Modeling the users’ interaction with AR/VR devices
As we discussed earlier, our objective is to maximize the quality of the AR/VR experiences for the user by predictingwhen specific experiences will be requested and using this information for efficient predictive caching. The prediction ofthe requests is ultimately rooted in the regularities of everyday life. For instance, a user typically asks for a weather reportin the morning before leaving the house. However, we need to be aware that such predictions are inevitably probabilistic.On a given day, the same user might ask for the weather report in the evening or not ask for it for several days. As userpreferences are particular to the given user and household, we propose techniques through which they can be learnedfrom actual user data instead of engineering a user model from first principles.
One of the challenges of such an approach is the lack of existing datasets for AR/VR requests. As the AR/VR systemsare just starting to emerge, no extensive data is yet available. However, the design of the system would need exactly suchdata to learn the user model. To solve this challenging problem, we propose to generate training data starting from dailyuser behavior datasets already acquired in homes without AR/VR components. We can then extend these datasets withlogical assumptions about when the users would have requested experiences, should they have been available.
3.3. Real world and simulated datasets of user activities in homes
The emergence of sensor-augmented smart homes made it possible to acquire datasets that track certain aspects of theinhabitants’ behavior in the last several years. In general, tracking the personal life of users opens serious privacy issues.However, several projects captured and made publicly anonymized datasets of human behavior in the home, tracking theproject-specific collection of actions. In addition to a real-world dataset of daily activities in a smart home, in order tofacilitate the dataset building, simulation environments are designed as a smart home by which the users can simulatetheir daily activities and collect these actions. While these actions (in both real or simulated environments) might notdirectly map to AR/VR experience requests, they can anchor the generation of training data.
3.3.1. Real-world datasetsIn this paper, we started from two publicly available real-world datasets of Activities of Daily Livings (ADLs) in two
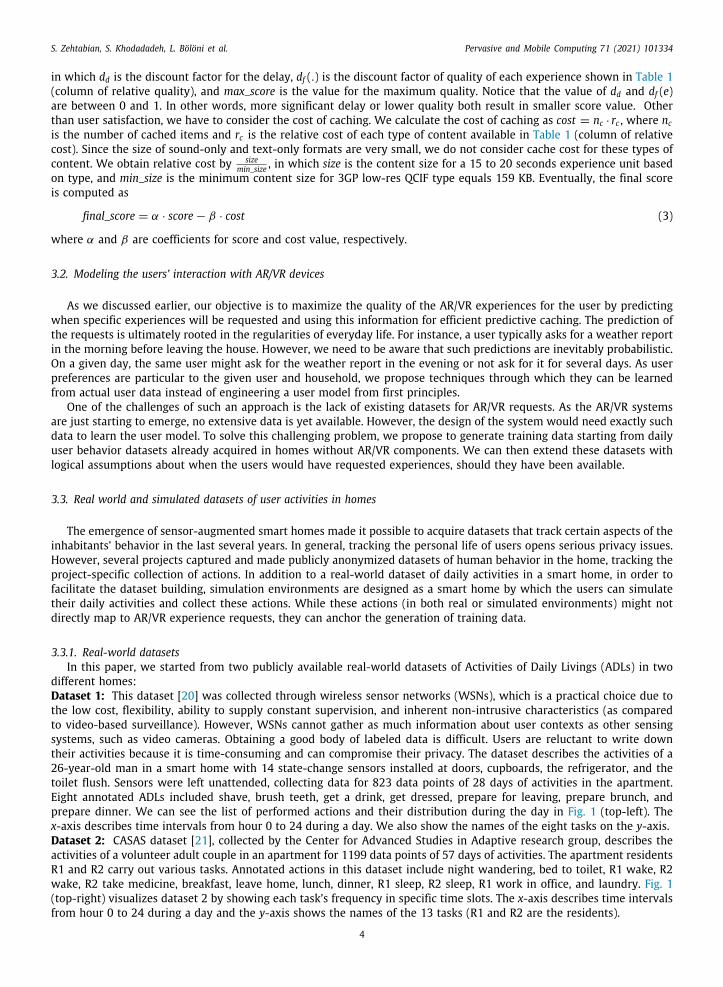
different homes:Dataset 1: This dataset [20] was collected through wireless sensor networks (WSNs), which is a practical choice due tothe low cost, flexibility, ability to supply constant supervision, and inherent non-intrusive characteristics (as comparedto video-based surveillance). However, WSNs cannot gather as much information about user contexts as other sensingsystems, such as video cameras. Obtaining a good body of labeled data is difficult. Users are reluctant to write downtheir activities because it is time-consuming and can compromise their privacy. The dataset describes the activities of a26-year-old man in a smart home with 14 state-change sensors installed at doors, cupboards, the refrigerator, and thetoilet flush. Sensors were left unattended, collecting data for 823 data points of 28 days of activities in the apartment.Eight annotated ADLs included shave, brush teeth, get a drink, get dressed, prepare for leaving, prepare brunch, andprepare dinner. We can see the list of performed actions and their distribution during the day in Fig. 1 (top-left). Thex-axis describes time intervals from hour 0 to 24 during a day. We also show the names of the eight tasks on the y-axis.ataset 2: CASAS dataset [21], collected by the Center for Advanced Studies in Adaptive research group, describes thectivities of a volunteer adult couple in an apartment for 1199 data points of 57 days of activities. The apartment residents1 and R2 carry out various tasks. Annotated actions in this dataset include night wandering, bed to toilet, R1 wake, R2ake, R2 take medicine, breakfast, leave home, lunch, dinner, R1 sleep, R2 sleep, R1 work in office, and laundry. Fig. 1top-right) visualizes dataset 2 by showing each task’s frequency in specific time slots. The x-axis describes time intervals
from hour 0 to 24 during a day and the y-axis shows the names of the 13 tasks (R1 and R2 are the residents).4
S. Zehtabian, S. Khodadadeh, L. Bölöni et al. Pervasive and Mobile Computing 71 (2021) 101334
Fig. 1. The action distributions for each day. The x-axis shows time in hours during a day of real-world dataset 1 (top-left), real-world dataset 2(top-right), simulated dataset 1 (bottom-left), and simulated dataset 2 (bottom-right).
3.3.2. Simulated dataset: Open Smart-Home simulated (OpenSHS)Since the number of data points in real-world daily activity datasets is limited, we also used simulated datasets of
everyday activities collected from the Open Smart Home Simulator (OpenSHS) [22], which is an open-source, cross-platform 3D smart home simulator for dataset generation. Data collection requires two entities: the researcher andthe participants. The researcher designs the environment, import the devices and sensors and assigns activities’ labels.The researcher is also responsible for creating contexts such as morning, evening, weekday or weekends. Participantsperformed the Activities of their Daily Livings (ADLs) for different contexts in a week, e.g., weekdays, weekends, andin a day, e.g., mornings and evenings, in this simulation environment [23]. The actions include work, eat, sleep, leisure,personal, and other. We chose two out of seven simulated datasets for our experiments. Dataset 1 (Fig. 1, bottom-left)and dataset 2 (Fig. 1, bottom-right) contain 77, 328, and 100, 544 data points, respectively. Both datasets include twomonths of activities simulated and collected with a time-margin equal to 0.
3.4. Creating synthetic datasets using common-sense association
We create realistic synthetic datasets of the user’s requests from the system using datasets of the users’ daily activitiesin their homes. We generate our synthetic scenarios by matching the statistical properties of the real-world and simulateddatasets. We probabilistically associate specific experiences with activities that are present in the dataset using common-sense associations. Creating synthetic datasets using common-sense has been applied to different problems in machinelearning, such as Question-Answering challenges [24] and visual reasoning [25].
The mappings we used to create the synthetic data are shown in Table 2. In these mappings, we made certainassumptions, such as the user is likely to request a recipe while preparing food. It is also more probable to check theweather news, traffic report, or parking status before leaving home or while the user is getting dressed. We assign aprobability of occurrence for each mapping from activity or task in the real and simulated datasets to the correspondingrequest. These probabilities are also set based on common-sense. For example, people usually leave their homes to workin the morning. Therefore, they are more likely to see the weather report while eating or preparing breakfast rather thanwatching a breakfast recipe.
4. Methods
In this section, we discuss our design for a predictive AR/VR controller, which, knowing the preferences and habitsof the user, makes intelligent decisions about what to cache. Also, we discuss three caching algorithms as the baselinecaching methods.
5
S. Zehtabian, S. Khodadadeh, L. Bölöni et al. Pervasive and Mobile Computing 71 (2021) 101334
4
Table 2Mapping approach from daily task to daily request of the users for real-world dataset 1 (top), real-worlddataset 2 (middle), and simulated dataset 1 and 2 (bottom).Task (Real-world Dataset 1) Corresponding request
Shave, Brush teeth, Get a drink Summary of newsGet dressed, Prepare for leaving (30% of the times) Weather reportPrepare for leaving (50% of the times) Traffic reportPrepare for leaving (20% of the times) Parking statusPrepare brunch, Prepare dinner Recipe
Task (Real-world Dataset 2) Corresponding request
R1 wake, R2 wake Summary of newsBreakfast (70% of the times), Leave home (30% of the times) Weather reportLeave home (50% of the times) Traffic reportLeave home (20% of the times) Parking statusBreakfast (30% of the times), Lunch, Dinner Recipe
Task (Simulated Datasets 1 and 2) Corresponding request
Other (50% of the times), Leisure (60% of the times) Summary of newsOther (15% of the times), Work (30% of the times) Weather reportOther (10% of the times), Work (50% of the times) Traffic reportOther (5% of the times), Work (20% of the times) Parking statusOther (20% of the times), Leisure (40% of the times), Eat Recipe
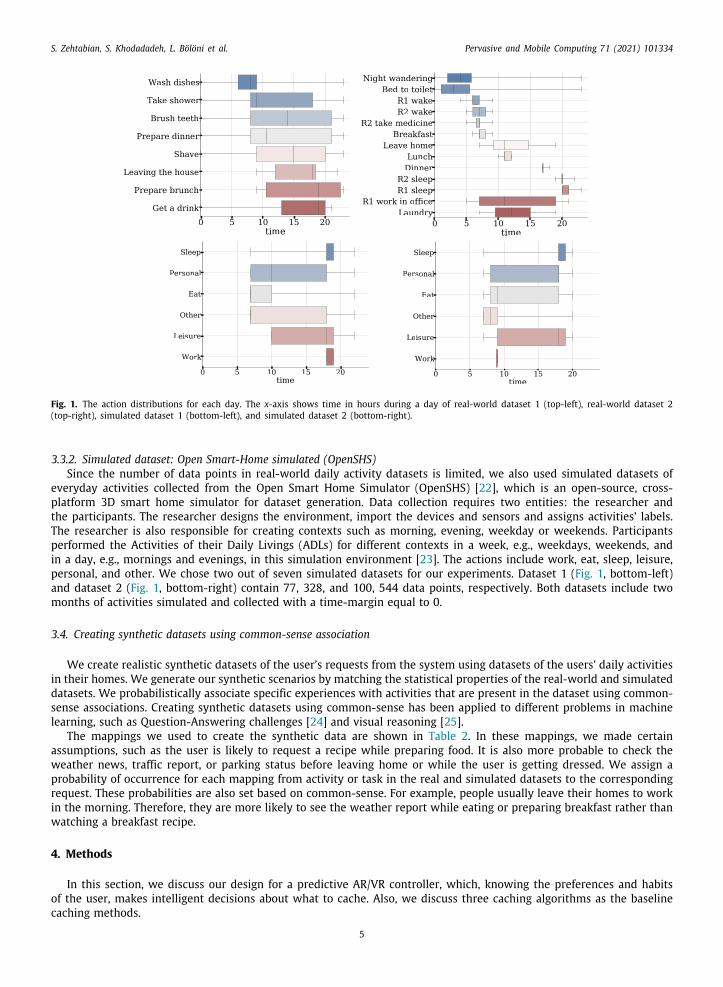
Fig. 2. The many-to-one neural network used in the LSTM-based caching algorithm.
.1. Predictive caching algorithms
Implemented caching strategies for the proposed AR/VR controller are as follows2:
4.1.1. Probability-based cachingWe define 24 intervals with the length of 1-hour for each day in the datasets. The proposed algorithm calculates the
probability of a specific request within a particular time interval by counting the data occurrences in the training set.Accordingly, the requests with a probability higher than a threshold are cached for each interval in each day. We validatethis approach on a different threshold for the number of request occurrence in a specific time interval. The best result onthe validation dataset is then applied to the test dataset.
4.1.2. LSTM-based cachingWe propose the LSTM-based caching algorithm, based on training a Long Short Term Memory (LSTM) [26] recurrent
neural network on the training dataset. We tried two different approaches for implementing the LSTM model: (i)many-to-one and (ii) many-to-many. The LSTM models are shown in Figs. 2 and 3.
2 The code is available here: https://github.com/sharare90/AR-VR-Research.
6
S. Zehtabian, S. Khodadadeh, L. Bölöni et al. Pervasive and Mobile Computing 71 (2021) 101334
NsiMatPutaooioMaa2aaTFuAa
4
osr
4
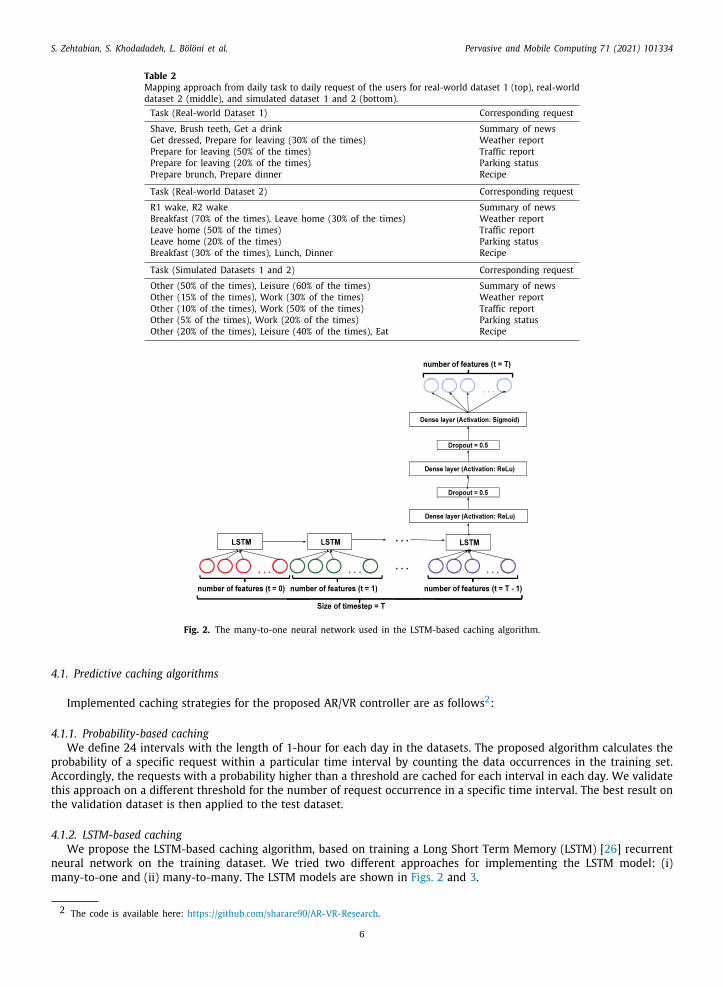
Fig. 3. The many-to-many neural network used in the LSTM-based caching algorithm.
Input data is a sequence of requests. We divide a day into 24 intervals, each with a fixed list of requests shown with0s and 1s. We have N different type of requests: {r1, r2, . . . , rN}. The data for each interval is a vector x of length N , and
is five in our experiments since we assumed having five types of requests (summary of news, weather report, parkingtatus, traffic report, food recipe). The value of element xi(i ∈ {1, 2, . . . ,N}) is 1 if the request ri has occurred in thenterval, otherwise its value is 0. Furthermore, the number of classes equals the number of valid requests.any-to-one LSTM based prediction: In this LSTM based prediction, the input is T = 24 hours history of request actions,nd the output is the request of the next interval (Fig. 2). For example, if we need to predict the action of the user duringhe time interval of 3:00 PM–4:00 PM, the sequence of input intervals will include 3:00 PM–4:00 PM yesterday, 4:00M–5:00 PM yesterday, and so on until 2:00 PM–3:00 PM today. The LSTM takes these intervals sequentially as input andpdates its hidden state based on this sequence. When all the intervals are processed, the LSTM layer outputs a vectorhat goes into the following fully connected and dropout layers. The dropout layers, in turn, help with generalization andre only active during training. In other words, they mask a part of input such that the network learns to predict theutput from a partial input. As a result, the network remains impartial to just one particular element in the output vectorf the LSTM. During testing, dropout layers are disabled. In other words, they act as an identity function and pass theirnput without masking any element to the next layer. Finally, the classification layer with as many neurons as the numberf activities predicts the probability of each activity by a number between 0 and 1.any-to-many LSTM based prediction: In this LSTM based prediction, the network processes each interval vector onet a time and outputs the occurrence probabilities of requests for the next interval (Fig. 3). In the first interval of the day,ll the input values are 0. We then concatenate this zeros vector with the lists of requests for interval 1 to 23, so we have4 lists of requests for T = 24 intervals of the day as the input of the network. The difference with the many-to-onepproach is that instead of processing all the intervals first and then output a vector, the LSTM layer outputs a vectors soon as it receives the first interval and outputs another vector once it receives the second input interval, and so on.hese vectors then go into dense and dropout layers, and for each of them, we predict the activity of the next interval.or example, at the time interval of 12:00 AM–1:00 AM, the LSTM predicts the action in time interval 1:00–2:00 AM andpdates its internal hidden states. After receiving the ground truth activities of what happened in time interval 1:00–2:00M and based on its updated hidden states, it predicts the activities in the next time interval, which is 2:00–3:00 AM,nd so on.
.1.3. Majority vote-based cachingMajority voting is one of the basic prediction/classification methods in which multiple classifiers predict the label based
n the majority vote of the classifiers [27,28]. We create N different LSTM models by altering various hyperparametersuch as learning rate, number of epochs, number of layers, or changing regularization method (dropout or l1 or l2egularization), initial weights, and so on. The majority voting hyperparameters are shown in Table 3.
Subsequently, we predict the label value: y = mode{y1, y2, . . . , yN}.
.2. Baseline caching algorithms
In this section, we explain the three baseline predictive caching algorithms.
7
S. Zehtabian, S. Khodadadeh, L. Bölöni et al. Pervasive and Mobile Computing 71 (2021) 101334
W
4
dc
4
c
5
Ao
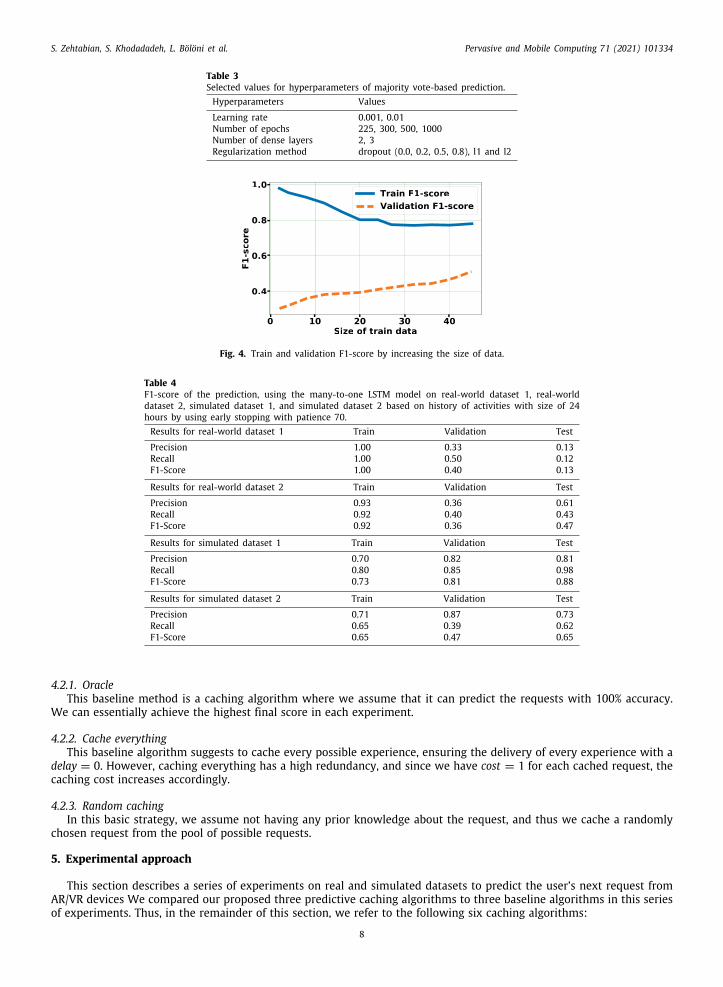
Table 3Selected values for hyperparameters of majority vote-based prediction.Hyperparameters Values
Learning rate 0.001, 0.01Number of epochs 225, 300, 500, 1000Number of dense layers 2, 3Regularization method dropout (0.0, 0.2, 0.5, 0.8), l1 and l2
Fig. 4. Train and validation F1-score by increasing the size of data.
Table 4F1-score of the prediction, using the many-to-one LSTM model on real-world dataset 1, real-worlddataset 2, simulated dataset 1, and simulated dataset 2 based on history of activities with size of 24hours by using early stopping with patience 70.Results for real-world dataset 1 Train Validation Test
Precision 1.00 0.33 0.13Recall 1.00 0.50 0.12F1-Score 1.00 0.40 0.13
Results for real-world dataset 2 Train Validation Test
Precision 0.93 0.36 0.61Recall 0.92 0.40 0.43F1-Score 0.92 0.36 0.47
Results for simulated dataset 1 Train Validation Test
Precision 0.70 0.82 0.81Recall 0.80 0.85 0.98F1-Score 0.73 0.81 0.88
Results for simulated dataset 2 Train Validation Test
Precision 0.71 0.87 0.73Recall 0.65 0.39 0.62F1-Score 0.65 0.47 0.65
4.2.1. OracleThis baseline method is a caching algorithm where we assume that it can predict the requests with 100% accuracy.e can essentially achieve the highest final score in each experiment.
.2.2. Cache everythingThis baseline algorithm suggests to cache every possible experience, ensuring the delivery of every experience with a
elay = 0. However, caching everything has a high redundancy, and since we have cost = 1 for each cached request, theaching cost increases accordingly.
.2.3. Random cachingIn this basic strategy, we assume not having any prior knowledge about the request, and thus we cache a randomly
hosen request from the pool of possible requests.
. Experimental approach
This section describes a series of experiments on real and simulated datasets to predict the user’s next request fromR/VR devices We compared our proposed three predictive caching algorithms to three baseline algorithms in this seriesf experiments. Thus, in the remainder of this section, we refer to the following six caching algorithms:
8
S. Zehtabian, S. Khodadadeh, L. Bölöni et al. Pervasive and Mobile Computing 71 (2021) 101334
ia
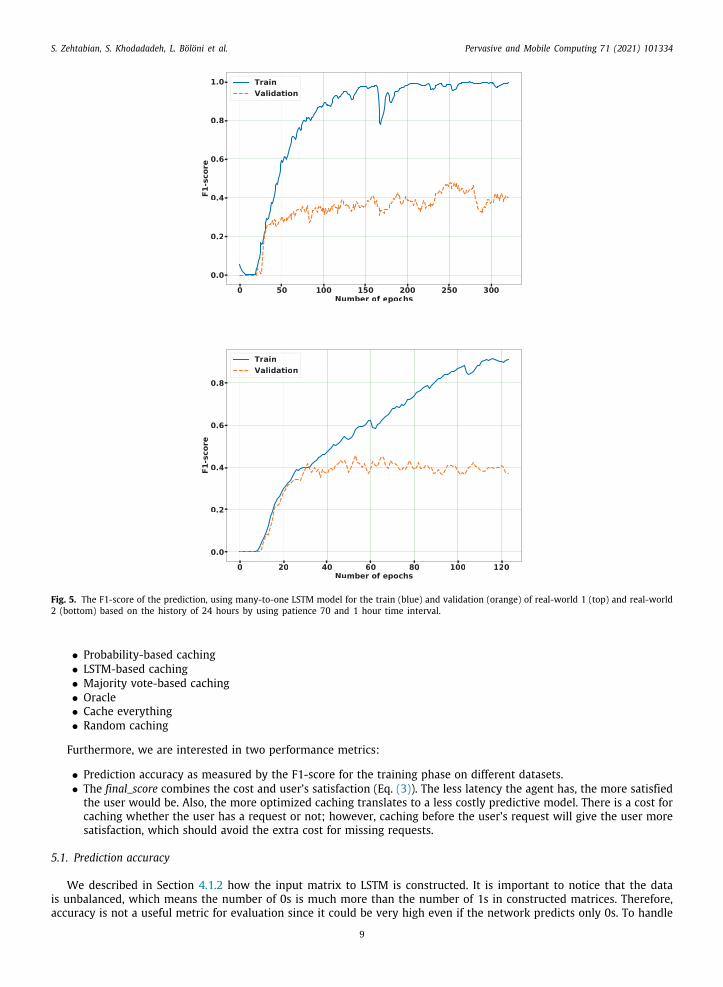
Fig. 5. The F1-score of the prediction, using many-to-one LSTM model for the train (blue) and validation (orange) of real-world 1 (top) and real-world2 (bottom) based on the history of 24 hours by using patience 70 and 1 hour time interval.
• Probability-based caching• LSTM-based caching• Majority vote-based caching• Oracle• Cache everything• Random caching
Furthermore, we are interested in two performance metrics:
• Prediction accuracy as measured by the F1-score for the training phase on different datasets.• The final_score combines the cost and user’s satisfaction (Eq. (3)). The less latency the agent has, the more satisfied
the user would be. Also, the more optimized caching translates to a less costly predictive model. There is a cost forcaching whether the user has a request or not; however, caching before the user’s request will give the user moresatisfaction, which should avoid the extra cost for missing requests.
5.1. Prediction accuracy
We described in Section 4.1.2 how the input matrix to LSTM is constructed. It is important to notice that the datas unbalanced, which means the number of 0s is much more than the number of 1s in constructed matrices. Therefore,ccuracy is not a useful metric for evaluation since it could be very high even if the network predicts only 0s. To handle
9
S. Zehtabian, S. Khodadadeh, L. Bölöni et al. Pervasive and Mobile Computing 71 (2021) 101334
1
ddaattd
1vt
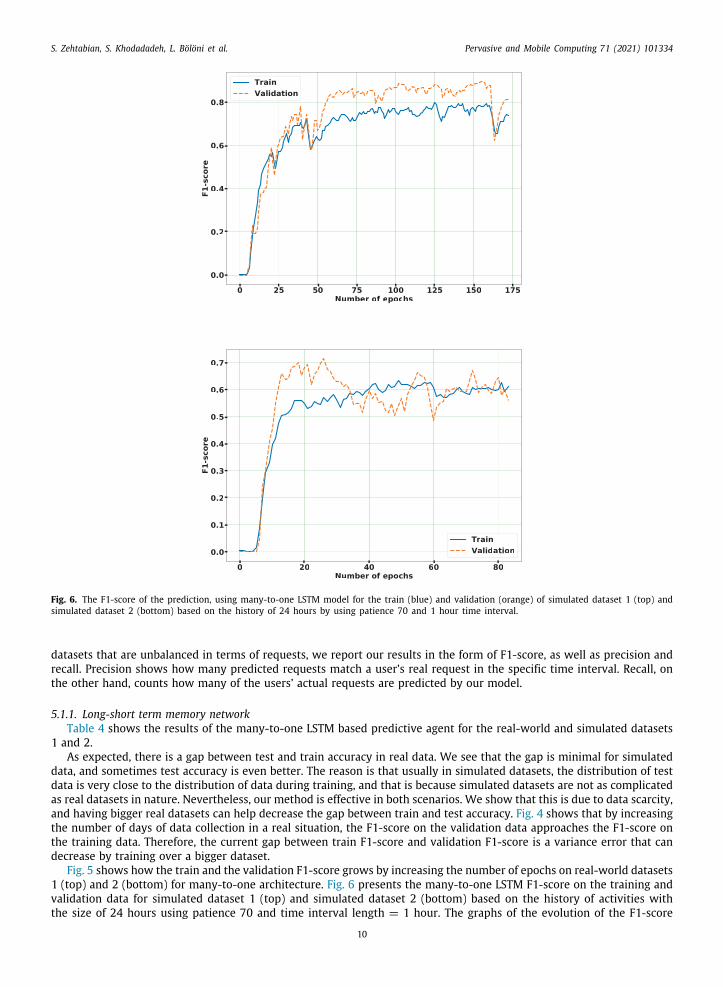
Fig. 6. The F1-score of the prediction, using many-to-one LSTM model for the train (blue) and validation (orange) of simulated dataset 1 (top) andsimulated dataset 2 (bottom) based on the history of 24 hours by using patience 70 and 1 hour time interval.
datasets that are unbalanced in terms of requests, we report our results in the form of F1-score, as well as precision andrecall. Precision shows how many predicted requests match a user’s real request in the specific time interval. Recall, onthe other hand, counts how many of the users’ actual requests are predicted by our model.
5.1.1. Long-short term memory networkTable 4 shows the results of the many-to-one LSTM based predictive agent for the real-world and simulated datasets
and 2.As expected, there is a gap between test and train accuracy in real data. We see that the gap is minimal for simulated
ata, and sometimes test accuracy is even better. The reason is that usually in simulated datasets, the distribution of testata is very close to the distribution of data during training, and that is because simulated datasets are not as complicateds real datasets in nature. Nevertheless, our method is effective in both scenarios. We show that this is due to data scarcity,nd having bigger real datasets can help decrease the gap between train and test accuracy. Fig. 4 shows that by increasinghe number of days of data collection in a real situation, the F1-score on the validation data approaches the F1-score onhe training data. Therefore, the current gap between train F1-score and validation F1-score is a variance error that canecrease by training over a bigger dataset.Fig. 5 shows how the train and the validation F1-score grows by increasing the number of epochs on real-world datasets
(top) and 2 (bottom) for many-to-one architecture. Fig. 6 presents the many-to-one LSTM F1-score on the training andalidation data for simulated dataset 1 (top) and simulated dataset 2 (bottom) based on the history of activities withhe size of 24 hours using patience 70 and time interval length = 1 hour. The graphs of the evolution of the F1-score
10
S. Zehtabian, S. Khodadadeh, L. Bölöni et al. Pervasive and Mobile Computing 71 (2021) 101334
cFt(
am
22a
5
tsrWms
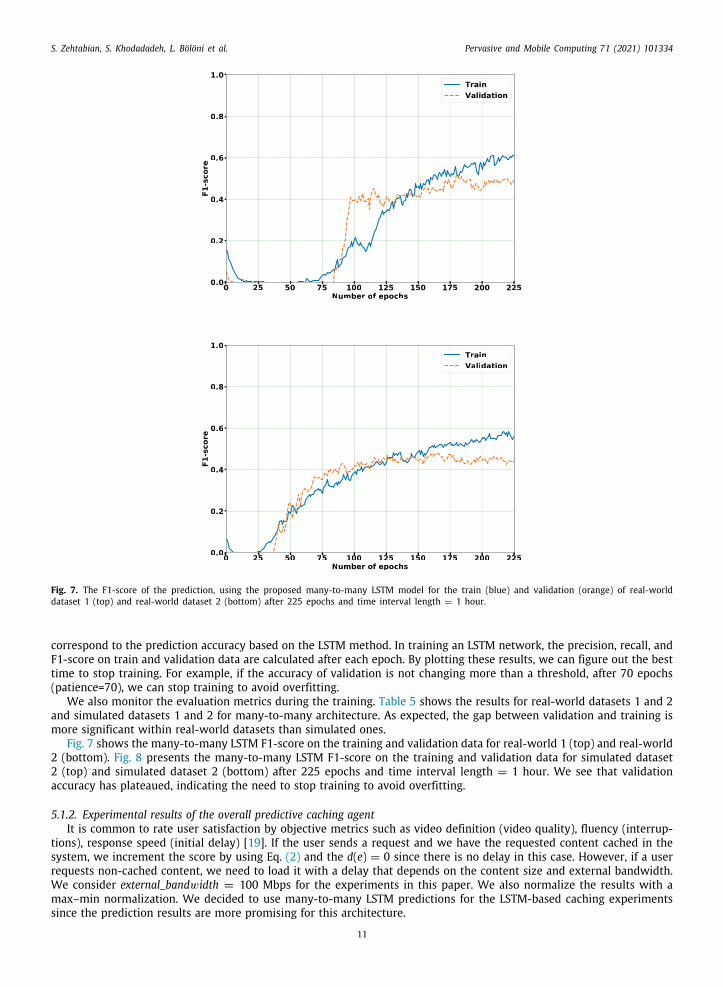
Fig. 7. The F1-score of the prediction, using the proposed many-to-many LSTM model for the train (blue) and validation (orange) of real-worlddataset 1 (top) and real-world dataset 2 (bottom) after 225 epochs and time interval length = 1 hour.
orrespond to the prediction accuracy based on the LSTM method. In training an LSTM network, the precision, recall, and1-score on train and validation data are calculated after each epoch. By plotting these results, we can figure out the bestime to stop training. For example, if the accuracy of validation is not changing more than a threshold, after 70 epochspatience=70), we can stop training to avoid overfitting.
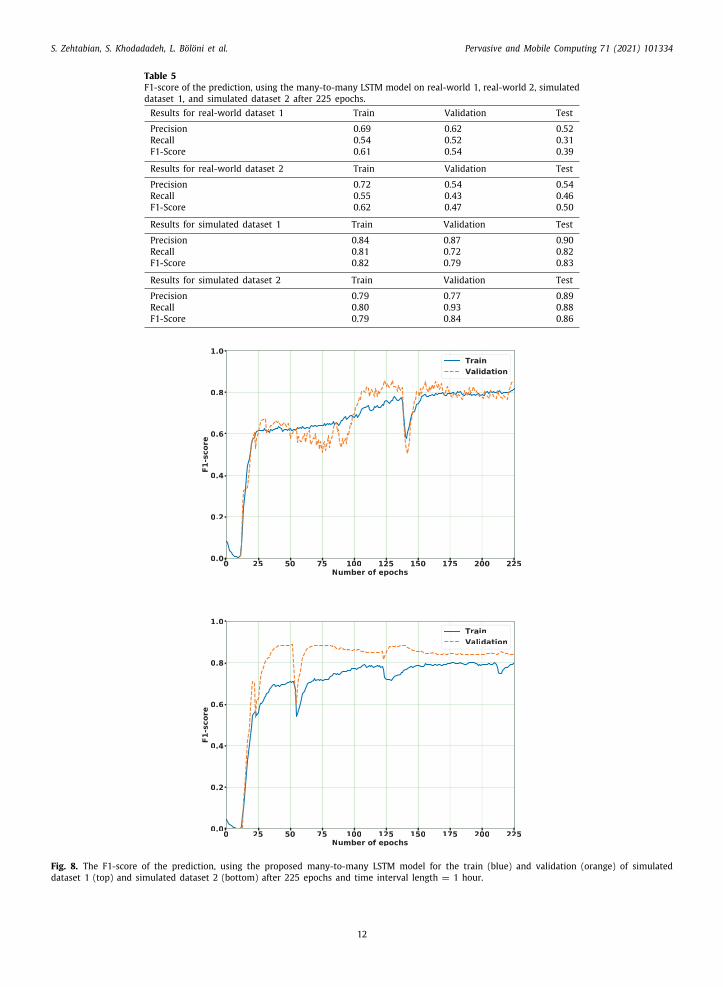
We also monitor the evaluation metrics during the training. Table 5 shows the results for real-world datasets 1 and 2nd simulated datasets 1 and 2 for many-to-many architecture. As expected, the gap between validation and training isore significant within real-world datasets than simulated ones.Fig. 7 shows the many-to-many LSTM F1-score on the training and validation data for real-world 1 (top) and real-world(bottom). Fig. 8 presents the many-to-many LSTM F1-score on the training and validation data for simulated dataset(top) and simulated dataset 2 (bottom) after 225 epochs and time interval length = 1 hour. We see that validationccuracy has plateaued, indicating the need to stop training to avoid overfitting.
.1.2. Experimental results of the overall predictive caching agentIt is common to rate user satisfaction by objective metrics such as video definition (video quality), fluency (interrup-
ions), response speed (initial delay) [19]. If the user sends a request and we have the requested content cached in theystem, we increment the score by using Eq. (2) and the d(e) = 0 since there is no delay in this case. However, if a userequests non-cached content, we need to load it with a delay that depends on the content size and external bandwidth.e consider external_bandwidth = 100 Mbps for the experiments in this paper. We also normalize the results with aax–min normalization. We decided to use many-to-many LSTM predictions for the LSTM-based caching experimentsince the prediction results are more promising for this architecture.
11
S. Zehtabian, S. Khodadadeh, L. Bölöni et al. Pervasive and Mobile Computing 71 (2021) 101334
Table 5F1-score of the prediction, using the many-to-many LSTM model on real-world 1, real-world 2, simulateddataset 1, and simulated dataset 2 after 225 epochs.Results for real-world dataset 1 Train Validation Test
Precision 0.69 0.62 0.52Recall 0.54 0.52 0.31F1-Score 0.61 0.54 0.39
Results for real-world dataset 2 Train Validation Test
Precision 0.72 0.54 0.54Recall 0.55 0.43 0.46F1-Score 0.62 0.47 0.50
Results for simulated dataset 1 Train Validation Test
Precision 0.84 0.87 0.90Recall 0.81 0.72 0.82F1-Score 0.82 0.79 0.83
Results for simulated dataset 2 Train Validation Test
Precision 0.79 0.77 0.89Recall 0.80 0.93 0.88F1-Score 0.79 0.84 0.86
Fig. 8. The F1-score of the prediction, using the proposed many-to-many LSTM model for the train (blue) and validation (orange) of simulateddataset 1 (top) and simulated dataset 2 (bottom) after 225 epochs and time interval length = 1 hour.
12
S. Zehtabian, S. Khodadadeh, L. Bölöni et al. Pervasive and Mobile Computing 71 (2021) 101334
d
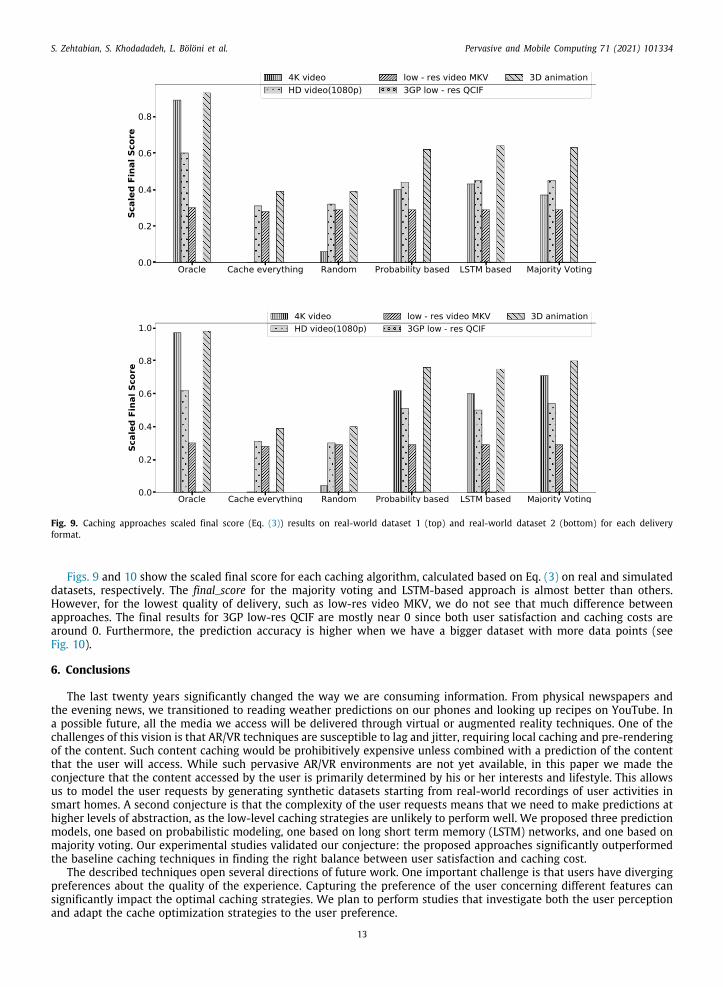
Fig. 9. Caching approaches scaled final score (Eq. (3)) results on real-world dataset 1 (top) and real-world dataset 2 (bottom) for each deliveryformat.
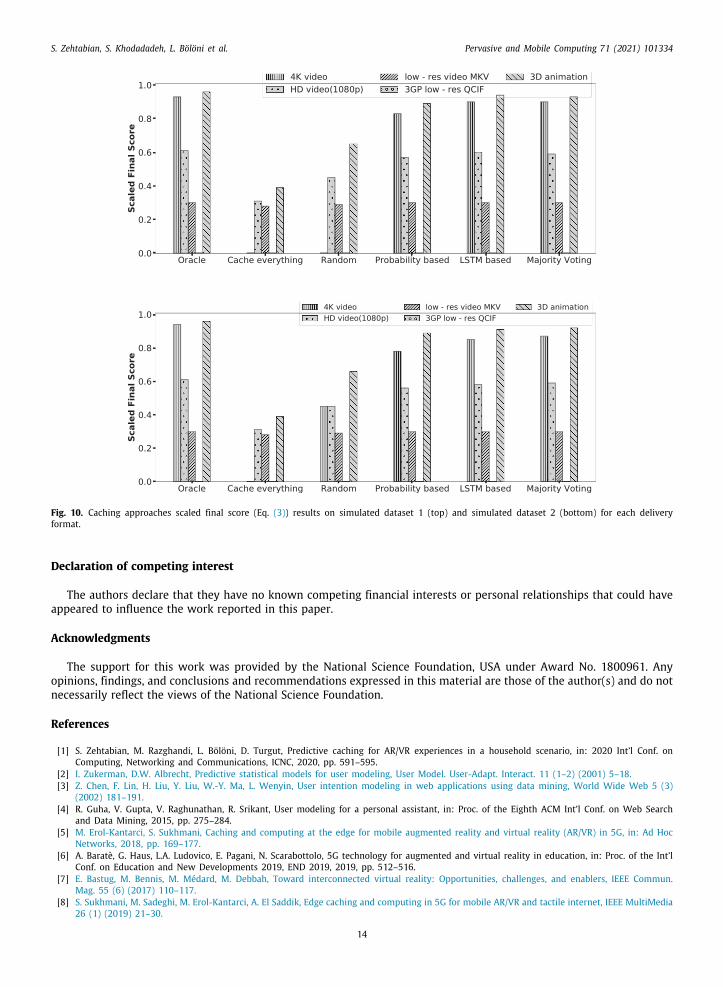
Figs. 9 and 10 show the scaled final score for each caching algorithm, calculated based on Eq. (3) on real and simulatedatasets, respectively. The final_score for the majority voting and LSTM-based approach is almost better than others.
However, for the lowest quality of delivery, such as low-res video MKV, we do not see that much difference betweenapproaches. The final results for 3GP low-res QCIF are mostly near 0 since both user satisfaction and caching costs arearound 0. Furthermore, the prediction accuracy is higher when we have a bigger dataset with more data points (seeFig. 10).
6. Conclusions
The last twenty years significantly changed the way we are consuming information. From physical newspapers andthe evening news, we transitioned to reading weather predictions on our phones and looking up recipes on YouTube. Ina possible future, all the media we access will be delivered through virtual or augmented reality techniques. One of thechallenges of this vision is that AR/VR techniques are susceptible to lag and jitter, requiring local caching and pre-renderingof the content. Such content caching would be prohibitively expensive unless combined with a prediction of the contentthat the user will access. While such pervasive AR/VR environments are not yet available, in this paper we made theconjecture that the content accessed by the user is primarily determined by his or her interests and lifestyle. This allowsus to model the user requests by generating synthetic datasets starting from real-world recordings of user activities insmart homes. A second conjecture is that the complexity of the user requests means that we need to make predictions athigher levels of abstraction, as the low-level caching strategies are unlikely to perform well. We proposed three predictionmodels, one based on probabilistic modeling, one based on long short term memory (LSTM) networks, and one based onmajority voting. Our experimental studies validated our conjecture: the proposed approaches significantly outperformedthe baseline caching techniques in finding the right balance between user satisfaction and caching cost.
The described techniques open several directions of future work. One important challenge is that users have divergingpreferences about the quality of the experience. Capturing the preference of the user concerning different features cansignificantly impact the optimal caching strategies. We plan to perform studies that investigate both the user perceptionand adapt the cache optimization strategies to the user preference.
13
S. Zehtabian, S. Khodadadeh, L. Bölöni et al. Pervasive and Mobile Computing 71 (2021) 101334
Fig. 10. Caching approaches scaled final score (Eq. (3)) results on simulated dataset 1 (top) and simulated dataset 2 (bottom) for each deliveryformat.
Declaration of competing interest
The authors declare that they have no known competing financial interests or personal relationships that could haveappeared to influence the work reported in this paper.
Acknowledgments
The support for this work was provided by the National Science Foundation, USA under Award No. 1800961. Anyopinions, findings, and conclusions and recommendations expressed in this material are those of the author(s) and do notnecessarily reflect the views of the National Science Foundation.
References
[1] S. Zehtabian, M. Razghandi, L. Bölöni, D. Turgut, Predictive caching for AR/VR experiences in a household scenario, in: 2020 Int’l Conf. onComputing, Networking and Communications, ICNC, 2020, pp. 591–595.
[2] I. Zukerman, D.W. Albrecht, Predictive statistical models for user modeling, User Model. User-Adapt. Interact. 11 (1–2) (2001) 5–18.[3] Z. Chen, F. Lin, H. Liu, Y. Liu, W.-Y. Ma, L. Wenyin, User intention modeling in web applications using data mining, World Wide Web 5 (3)
(2002) 181–191.[4] R. Guha, V. Gupta, V. Raghunathan, R. Srikant, User modeling for a personal assistant, in: Proc. of the Eighth ACM Int’l Conf. on Web Search
and Data Mining, 2015, pp. 275–284.[5] M. Erol-Kantarci, S. Sukhmani, Caching and computing at the edge for mobile augmented reality and virtual reality (AR/VR) in 5G, in: Ad Hoc
Networks, 2018, pp. 169–177.[6] A. Baratè, G. Haus, L.A. Ludovico, E. Pagani, N. Scarabottolo, 5G technology for augmented and virtual reality in education, in: Proc. of the Int’l
Conf. on Education and New Developments 2019, END 2019, 2019, pp. 512–516.[7] E. Bastug, M. Bennis, M. Médard, M. Debbah, Toward interconnected virtual reality: Opportunities, challenges, and enablers, IEEE Commun.
Mag. 55 (6) (2017) 110–117.[8] S. Sukhmani, M. Sadeghi, M. Erol-Kantarci, A. El Saddik, Edge caching and computing in 5G for mobile AR/VR and tactile internet, IEEE MultiMedia
26 (1) (2019) 21–30.
14
S. Zehtabian, S. Khodadadeh, L. Bölöni et al. Pervasive and Mobile Computing 71 (2021) 101334
[9] C. Westphal, Challenges in networking to support augmented reality and virtual reality, in: IEEE Int’l Conf. on Computing, Networking andCommunications, ICNC, vol. 54, (8) 2017.
[10] F. Li, K.-Y. Lam, L. Wang, Z. Na, X. Liu, Q. Pan, Caching efficiency enhancement at wireless edges with concerns on user’s quality of experience,Wirel. Commun. Mob. Comput. 2018 (2018).
[11] Z. Hu, Z. Zheng, T. Wang, L. Song, X. Li, Game theoretic approaches for wireless proactive caching, IEEE Commun. Mag. (2016) 37–43.[12] E. Zeydan, E. Bastug, M. Bennis, M.A. Kader, I.A. Karatepe, A.S. Er, M. Debbah, Big data caching for networking: Moving from cloud to edge,
IEEE Commun. Mag. 54 (9) (2016) 36–42.[13] F. Qazi, O. Khalid, R.N.B. Rais, I.A. Khan, A.u.R. Khan, Optimal content caching in content-centric networks, Wirel. Commun. Mob. Comput. 2019
(2019).[14] P. Hassanzadeh, A. Tulino, J. Llorca, E. Erkip, Cache-aided coded multicast for correlated sources, in: Proc. of the Int’l Symposium on Turbo
Codes and Iterative Information Processing, ISTC, 2016, pp. 360–364.[15] C. Koch, S. Werner, A. Rizk, R. Steinmetz, Mira: Proactive music video caching using convnet-based classification and multivariate popularity
prediction, in: 2018 IEEE 26th Int’l Symposium on Modeling, Analysis, and Simulation of Computer and Telecommunication Systems, MASCOTS,2018, pp. 109–115.
[16] J. Chakareski, VR/AR immersive communication: Caching, edge computing, and transmission trade-offs, in: Proc. of the Workshop on VirtualReality and Augmented Reality Network, 2017, pp. 36–41.
[17] M. Du, M. Kihl, Å. Arvidsson, C. Lagerstedt, A. Gawler, Analysis of prefetching schemes for tv-on-demand service, in: ICDT 2015: The TenthInternational Conference on Digital Telecommunications, 2015,
[18] C. Koch, J. Pfannmüller, A. Rizk, D. Hausheer, R. Steinmetz, Category-aware hierarchical caching for video-on-demand content on youtube, in:Proc. of the 9th ACM Multimedia Systems Conference, 2018, pp. 89–100.
[19] P. Juluri, V. Tamarapalli, D. Medhi, Measurement of quality of experience of video-on-demand services: A survey, IEEE Commun. Surv. Tutor.18 (1) (2016) 401–418.
[20] T.L. van Kasteren, G. Englebienne, B.J. Kröse, Human activity recognition from wireless sensor network data: Benchmark and software, in:Activity Recognition in Pervasive Intelligent Environments, 2011, pp. 165–186.
[21] D.J. Cook, A.S. Crandall, B.L. Thomas, N.C. Krishnan, CASAS: A smart home in a box, Computer (2013) 62–69.[22] N. Alshammari, T. Alshammari, M. Sedky, J. Champion, C. Bauer, Openshs: Open smart home simulator, Sensors 46 (7) (2017) 1003.[23] T. Alshammari, N. Alshammari, M. Sedky, C. Howard, SIMADL: Simulated activities of daily living dataset, Data 3 (2) (2018) 11.[24] A. Talmor, J. Herzig, N. Lourie, J. Berant, CommonsenseQA: A question answering challenge targeting commonsense knowledge, in: Proc. of the
Conf. of the North American Chapter of the Association for Computational Linguistics: Human Language Technologies, Volume 1 (Long andShort Papers), 2019, pp. 4149–4158.
[25] R. Zellers, Y. Bisk, A. Farhadi, Y. Choi, From recognition to cognition: Visual commonsense reasoning, in: The IEEE Conf. on Computer Visionand Pattern Recognition, CVPR, 2019,
[26] S. Hochreiter, J. Schmidhuber, Long short-term memory, Neural Comput. 9 (8) (1997) 1735–1780.[27] T.G. Dietterich, Ensemble methods in machine learning, in: Proc. of the Int’l Workshop on Multiple Classifier Systems, 2000, pp. 1–15.[28] Y. Guan, T. Plötz, Ensembles of deep LSTM learners for activity recognition using wearables, Proc. ACM Interact. Mob. Wearable Ubiquitous
Technol. 1 (2) (2017) 11.
15


![[MS-BPDP]: Background Intelligent Transfer Service (BITS ...... · Background Intelligent Transfer Service (BITS) Peer-Caching: Peer Discovery Protocol ... 01/16/2009 1.2.5 Editorial](https://img.pdfslide.net/doc/110x75/5f105e687e708231d448c473/ms-bpdp-background-intelligent-transfer-service-bits-background-intelligent.jpg)