Embed Size (px)
Citation preview

Georgia Southern UniversityDigital Commons@Georgia Southern13th IMHRC Proceedings (Cincinnati, Ohio. USA– 2014) Progress in Material Handling Research
2014
Modeling and Optimization of Radio FrequencyIdentification Networks for InventoryManagementAtipong SuriyaUbonratchathani University, [email protected]
Jose D. PorterOregon State University, [email protected]
Follow this and additional works at: https://digitalcommons.georgiasouthern.edu/pmhr_2014
Part of the Industrial Engineering Commons, Operational Research Commons, and theOperations and Supply Chain Management Commons
This research paper is brought to you for free and open access by the Progress in Material Handling Research at Digital Commons@Georgia Southern.It has been accepted for inclusion in 13th IMHRC Proceedings (Cincinnati, Ohio. USA – 2014) by an authorized administrator of DigitalCommons@Georgia Southern. For more information, please contact [email protected].
Recommended CitationSuriya, Atipong and Porter, Jose D., "Modeling and Optimization of Radio Frequency Identification Networks for InventoryManagement" (2014). 13th IMHRC Proceedings (Cincinnati, Ohio. USA – 2014). 28.https://digitalcommons.georgiasouthern.edu/pmhr_2014/28

1
XXVIII. MODELING AND OPTIMIZATION OF RADIO FREQUENCY IDENTIFICATION NETWORKS FOR INVENTORY
MANAGEMENT
Atipong Suriya Department of Electrical and Electronics Engineering
Ubonratchathani University, Thailand, 34190
J. David Porter School of Mechanical, Industrial and Manufacturing Engineering
Oregon State University, USA, 97331-6001
Abstract
Stock loss and out-of-stocks are outcomes of poorly designed inventory management systems and can lead to significant revenue losses. Inventory management systems (IMSs) based on radio frequency identification (RFID) have the potential to minimize these losses if they are properly designed and deployed. However, the placement of RFID readers to support IMSs is often done on a trial and error basis which is time consuming and results in less than optimal coverage. A methodology to find the optimal location and number of RFID readers in a warehouse facility to ensure a desired level of radio frequency signal coverage was developed in this research. The results show that the proposed methodology works very well when applied to small rectangular facilities and small inverted-T facilities. However, some limitations exist when the method is applied to large facilities.
1 Introduction
Radio frequency identification (RFID) is an automatic identification and data capture (AIDC) technology that has gained significant attention in recent years as a means of enhancing the traceability of items throughout the supply chain. Market trends indicate a rapid growth in the demand for RFID-based technologies, with an expected 18% compound annual growth rate for the three-year period 2011-2014, culminating in a projected $19.3 billion industry by the end of 2014 [1].

2
A basic RFID system includes four main components: a host computer system, a RFID reader, an antenna, and a transponder (or RFID tag). RFID technology, when properly implemented, has several benefits over more conventional AIDC technology (i.e., bar codes), including tracking physical objects in real time and reductions in process times, labor, and the amount of paperwork needed in day-to-day operations. Applications of RFID technology are becoming more common in the supply chain (and particularly in warehouse facilities) to enable product tracking and to support inventory management systems (IMSs) [2-4]. A RFID-based IMS can be designed to have localized coverage (e.g., RFID readers
installed just on receiving/shipping doors) or to cover the entire warehouse facility. A RFID-based IMS that covers the entire warehouse facility will result in several advantages when compared to one with localized coverage, including: • Real time inventory tracking. With entire warehouse facility coverage, an organization can monitor and track inventory levels in real time. A RFID system with localized coverage cannot track inventory levels in real time because it is unable to track inventory items when they are moving.
• Shrinkage and theft prevention. Ernst and Young [5] found that retailers lose $46 billion annually to inventory shrinkage including employee theft, shoplifting, administrative error and vendor fraud. A RFID-based IMS with entire warehouse facility coverage and continuous tracking has the potential to reduce shrinkage, theft, and loss of inventory.
• Localization. A RFID-based IMS with entire warehouse facility coverage can provide the capability of inventory/item localization and/or positioning.
• Travel time estimation and warehouse layout improvement. With comprehensive tracking, location, and identification, the movement history of tagged items can be obtained. Also, the average travel time it takes employees to get to the desired items during picking and put away operations can be calculated. Item movement history may also be useful for adjusting a route to access items with shortest path and improving the efficiency of the warehouse facility layout.
One of the most important decisions when designing RFID networks to support warehouse operations is where to locate the RFID readers. Locating RFID readers in a facility is referred in the literature as the RFID network planning (RNP) problem [6-9]. In practice, the placement of RFID readers is often done on a trial and error basis. This placement method is very time consuming and results in a less than optimal coverage of the facility area. Providing an optimal solution to the RNP problem is a complex task that may be
affected by several factors such as radio frequency (RF) signal coverage, RF signal propagation, and interference (i.e., both passive and active). Thus, a formal methodology to optimize the placement and number of RFID readers required to cover a facility is needed. Critical steps in such a methodology are the development of a mathematical

3
formulation and the selection of an appropriate optimization technique to ensure that quality solutions are obtained within a reasonable computation time.
Several researchers have attempted to solve the RNP problem. For example, Guan et al. [10] developed a computer-based model aimed at optimizing the placement of RFID readers under the assumptions of omnidirectional antenna coverage (i.e., circular signal coverage) and free space propagation. However, no physical obstacles were considered in the model. Chen et al. [11] developed a model considering circular antenna coverage and free space propagation. They did not model obstacles or the uplink communications channel either.
It is clear that there are several critical technical gaps and challenging issues to be addressed when developing models to solve the RNP problem. In this research, a methodology was developed to model and optimize the design of RFID networks for IMS which improves on the research done in [10] and [11]. The proposed methodology finds a solution that ensures complete RF coverage of a warehouse facility which would allow a RFID network to support real-time inventory tracking and localization.
The remainder of the manuscript is organized as follows. Section 2 describes the research methodology. Section 3 presents a proposed mathematical formulation to represent the RNP problem. Section 4 introduces the heuristic optimization algorithms used to find the solutions for RNP problem. Section 5 describes the experimental design used to identify factors that have the most significant effect on the quality of the solutions. The results and discussions are presented in Section 6. Finally, the main conclusions of this research are discussed in Section 7.
2 Methodology
The first step of the methodology involved a thorough review of the EPCglobal® class 1 generation 2 (C1G2) standard to identify the most critical parameters for RFID network planning for warehouse inventory management. These parameters were later used in the development and as inputs of the circular antenna coverage (CAC) mathematical formulation. The CAC mathematical formulation is based on the assumption that the antenna attached to the RFID reader generated a circular coverage area. When compared to prior work, the underlying assumptions that guided the development of the CAC mathematical formulation make the modeling of the RFID-based IMSs more realistic and applicable to warehouse environments. These important assumptions included the consideration of the uplink communication channel (i.e., tag-to-reader), the utilization of appropriate RF propagation models for the downlink and for the uplink communication channels, and the consideration of obstacles.
The heuristic optimization techniques particle swarm optimization (PSO) and genetic algorithm (GA) were used to find good solutions for the CAC mathematical formulation to ensure appropriate coverage for the warehouse facility, with less interference and within reasonable computation time. Several factors of the RNP problem

4
as well as specific parameters of each heuristic optimization technique were adjusted to improve the quality of the solutions. A designed experiment was conducted followed by a multi-factor analysis of variance (ANOVA) to identify those factors that had the most significant effect on the quality of the solutions. Finally, the most appropriate RFID network design settings were determined. When the specific facility shape, facility size, and location of obstructions are known, the developed research methodology can be applied to optimize both the number and the placement of RFID readers in the system.
3 The Circular Antenna Coverage Mathematical Formulation
3.1 Assumptions and Notation Several characteristics of the RFID system were incorporated into the CAC mathematical formulation, including critical operational parameters specific to the RFID reader, the RFID tag, and the RF signal propagation model. Also, the characteristics of the test facility, such as shape and size, were considered. The underlying assumptions made in the development of the CAC mathematical formulation were:
1. The shape and size of the warehouse facility and the location of obstacles within the warehouse facility are known. The area of the warehouse facility is discretized into grids of equal height and width.
2. The term RFID reader refers to the combination of a RFID interrogator and a single antenna.
3. The RFID reader and the RFID tags are compliant with the EPCglobal® C1G2 standard.
4. Only one type of RFID reader and RFID tag were utilized, i.e., all RFID readers and RFID tags have the same operating frequency, maximum transmitting power, minimum receiving power, antenna type, and antenna gain. Mixed brands of RFID systems and/or multiple detection frequencies were not considered.
5. The polarization and impedance of the antennas match perfectly. 6. Dipole antennas are used for both the RFID reader and the RFID tag. These
antennas produce a circular coverage area in a 2D representation. 7. The antenna for the RFID reader is placed at the center of a grid and in a manner
that maximizes signal coverage (e.g., on the ceiling of the warehouse facility). 8. The radius of the signal coverage area produced by the antenna is known and can
be calculated using a RF propagation model. a) The multipath propagation model is used for the downlink channel (i.e., reader-
to-tag). b) The radar cross section (RCS) propagation model is used for the uplink
channel (i.e., tag-to-reader). The notation used to represent the parameters of the RFID system in the CAC
mathematical formulation is described below.

5
n i
Number of grids in the system, n = C×R The index of a grid, i = 1, 2, ..., n
j The index of a grid where a RFID reader is placed, j = 1, 2, ..., n k The index of a grid where an interfering RFID reader is located, iISk∈
N Initial number of RFID readers
r Radius of the signal coverage area of the RFID reader’s antenna
W Width of the facility area
H Height of the facility area
C Total number of grid columns in the facility area
R Total number of grid rows in the facility area
iw Width of grid i
ih Height of grid i
FG
Set of forbidden grids, { }grid forbidden the isiiFG=
t Number of installed RFID readers
RS Set of installed RFID readers, { }1== jxjRS
FA Feasible area TA
jiD,
Total area Signal power levels received at grid i from the RFID reader located at grid j
(max)iD Set of maximum signal power levels received at grid i from the RFID reader
located at grid j, iNj∈ , ( ) ( ){ }jii DD ,maxmax =
iIS (max)iID
jiU,
(max)iU
(max)iIU
Set of RFID readers that generate interference at grid i, RCi ×= ...,,2,1
Set of maximum signal power levels received at grid i from the RFID reader located at gridj, and interfered by the neighboring RFID reader(s) located at
grid k, iISk∈ , ( ) ( )( ){ }kii DID maxmax=
Signal power levels (backscattered) received at the RFID reader located at grid j from grid i
Set of maximum signal power levels (backscattered) received at the RFID reader located at grid j from grid i , ( ){ }jii UU ,max(max)=
Set of maximum signal power levels (backscattered) received at the RFID reader located at grid j from grid i and interfered by neighboring RFID
readers located at grid k, ( ) ( )( ){ }kii UIU maxmax=
jx Binary decision variable to identify whether or not a RFID reader is located at grid j:
otherwise
jgridatlocatedisreaderRFIDanifxj
0
1=
iy Binary decision variable to identify whether or not grid i is covered by at least

6
one RFID reader:
iiii UDy βττ ××= Grid i is covered by the RFID reader located at grid j (yi = 1)
if and only if the following three requirements are satisfied: 1) The downlink communication from the RFID reader located at grid j to grid i is successfully established.
2) The uplink communication from grid i to the RFID reader located at grid j is successfully established.
3) Grid i is not a forbidden grid.
iDτ Successful transmission from the RFID reader located at grid j to grid i
−
−= 0,
(max)
(max)max
TDD
TDDD
i
iiτ
TD is the specific downlink power threshold (29 microwatts or -15.4 dBm)
iUτ Successful transmission from grid i
to the RFID reader located at grid j, i.e.,
the backscattered signal from the RFID tag to the RFID reader
−
−= 0,
(max)
(max)max
TUU
TUUU
i
iiτ
TU is the specific uplink power threshold (0.316 nanowatts or -95 dBm)
iβ Feasible coverage of grid i
otherwise
FGiifi
0
1 ∉=β
iN
The set of RFID readers ( RSj∈ ) that can cover grid i,
{ }FGirdjN iji ∉∩≤=
iDN
The set of signal power levels received at grid i from the RFID reader located
at grid j for downlink channel, { }ijii NjDDN ∈∀= ,
iUN
The set of signal power levels received at grid i from the RFID reader located
at grid j for uplink channel, { }ijii NjUUN ∈∀= ,
ijd The Euclidean distance from the center of grid j to the center of grid i
1W Weight assigned to the first objective, i.e., total coverage
2W Weight assigned to the second objective, i.e., total signal to interference ratio (SIR)
3W Weight assigned to the third objective, i.e., total cost
iC Cost of the RFID reader at grid i

7
3.2 CAC Mathematical Formulation The objective function and constraints of the CAC mathematical formulation are as follows:
∑
∑
=
=×=n
ii
n
iiy
WZimizeMax
1
11:
β
(Coverage) (1a)
( )( )
( )( ) ( )( )( )∑∑∑∑∑
∑∑
= ∈ ∈= ∈
= ∈
+
×+n
i Nj ISkkji
n
i Njji
n
i Njji
i ii
i
DD
D
W
1,
1,
1,
2
maxmax
max
(Downlink SIR) (1b)
( )( )
( )( ) ( )( )( )∑∑∑∑∑
∑∑
= ∈ ∈= ∈
= ∈
+
×+n
i Nj ISkkji
n
i Njji
n
i Njji
i ii
i
UU
U
W
1,
1,
1,
2
maxmax
max
(Uplink SIR) (1c)
Budget
tCBudgetW i )(3
×−×+
(Cost) (1d)
Subject to:
tyxy iNj
ji
i
×≤≤∑∈
i∀; { }FGirdjNwhere iji ∉∩≤= (2)
≈≤≤
22 2r
TANwhereNt
r
TA
π (3)
txn
jj=∑
=1
(4)
(5)
13
1
=∑=i
iW (6)
( ){ }jiiii DDiwattsyD ,max(max);4(max)0 =∀×≤≤ (7)
( ){ }kii
Njiiii DIDiDDNyID
i
(max)(max);(max)(max)0 =∀
−×≤≤ ∑
∈
(8)
BudgettCi ≤×

8
( ){ }jiiii UUiwattsyU ,max(max);4(max)0 =∀×≤≤ (9)
( ){ }kii
Njiiii UIUiUUNyIU
i
(max)(max);(max)(max)0 =∀
−×≤≤ ∑
∈
(10)
( ) { }njxj ...,,2,1;1,0 =∈
( ) { }niyi ...,,2,1;1,0 =∈
As equation 1 shows, the CAC mathematical formulation is a maximization problem
that consists of three objective functions combined using a weighted sum or linear combination with specific weight values. All objectives are normalized; therefore, their values range from zero to one. Equation 1a represents the first objective, which is to maximize the area of the facility
covered by the installed RFID reader network. The binary decision variable iy is
calculated as the product of three terms, i.e., iiii βUτDτy ××= . The term iDτ indicates
whether or not the downlink signal transmission from RFID reader j to grid i is successful. If the maximum signal power level received at grid i is greater than or equal to the downlink power threshold (i.e., 29 microwatts or -15.4 dBm), the communication
link is established successfully and the value of iDτ is set to one. Otherwise, it is equal
to zero. The term iUτ indicates whether or not the uplink signal transmission from grid i
to a RFID reader located at grid j is successful. If the maximum signal power level received at a desired RFID reader located at grid j is greater than or equal to the uplink power threshold (e.g., 0.316 nanowatts or -95 dBm), the communication link is
established successfully and the value of iUτ is set to one. Otherwise, it is equal to zero.
Finally, the term iβ indicates whether or not the RFID reader can be placed at grid i. If
grid i is not a forbidden grid, the value of iβ is equal to one; otherwise, it is set to zero.
Therefore, a particular grid i is considered as covered by a RFID reader if and only if the
decision variables iDτ , iUτ , and iβ are all equal to one.
The second objective, represented by equation 1b and equation 1c, is to minimize interference. Since the term signal-to-interference ratio (SIR) is used as the measure of interference, minimizing interference means maximizing SIR. Equation 1b reflects the SIR in the downlink channel, whereas equation 1c quantifies the SIR in the uplink channel. The total SIR is then calculated as the summation of the downlink SIR and the uplink SIR. The third objective is to minimize the implementation cost of the RFID network.
However, the overall objective function (or fitness function) seeks a maximization objective. To transform the objective of implementation cost into a maximization objective, the ratio of the budget minus the cost of the installed RFID readers divided by the budget can be used to calculate the cost of implementation, as shown in equation 1d.

9
Constraint (2) ensures that if ∑∈
≥iNjjx 1, at least one RFID reader in the set iN covers
grid i ( )1=iy . On the other hand, if φ=iN (i.e.,∑∈
=iNjjx 0), grid i will not be covered
( )0=iy . In addition, the number of RFID readers that cover grid i must not be greater
than the number of installed RFID readers in the system (i.e.,∑∈
×≤iNj
ij tyx ).
The lower bound and the upper bound for the total number of RFID readers installed is defined by constraint (3). This constraint allows the PSO and GA algorithms to search for the optimum number of RFID readers required in the system that would result in the best value of fitness. Constraint (4) implies that the number of grids where a RFID reader is installed must be equal to the total number of RFID readers installed. Constraint (5) specifies that the implementation cost of the RFID reader network must
be less than or equal to the available budget. Constraint (6) specifies that the linear combination of weights must not exceed one.
Constraint (7) ensures that if grid i is covered (i.e., 1=iy ), the maximum signal
power levels received at grid i from the RFID reader located at grid j must not be greater than the 4-watt EIRP limitation set by the Federal Communication Commission (FCC).
In constraint (8), the set ii Nj DN ∈∀ consists of the signal power levels received
at a particular grid i from the RFID readers located at the grid(s) iNj∈ for the
downlink communications channel. Only one signal power element in this set is
considered as the maximum signal power level (i.e., (max)iD ), whereas the other signal
power elements (if any) are considered as interference. Therefore, the maximum value of signal interference power affecting a particular grid i can be calculated by summing all
elements in the set iDN and then subtracting the maximum signal power level (max)iD .
Thus, constraint (8) specifies that if grid i is covered (i.e., 1=iy ), the level of
interference affecting this grid can vary between zero and ∑∈
−iNj
ii DDN (max).
Constraints (9) and (10) implement similar concepts as that of constraints (7) and (8) but applied to the uplink communications channel. In this case, the maximum signal power level and the signal power levels received at a particular grid i from the RFID
readers located at the grid(s) iNj∈ are represented as (max)iU and iUN, respectively.
4 Heuristic Optimization Algorithms
Finding solutions to the CAC mathematical formulation is an NP-hard problem. Therefore, an automated tool was developed in MATLAB to implement two heuristic optimization algorithms based on PSO and GA to find good solutions within a reasonable

10
computation time. Both PSO and GA have been applied previously to the RNP problem and have produced good solutions within reasonable computation time.
The PSO algorithm was developed as an inertia-weighted PSO algorithm [12]. Three major parameters must be set appropriately in an inertia-weighted PSO: inertia ( w ), the local cognitive component ( 1c ), and the global social component ( 2c ). If the values of w ,
1c , and 2c are set correctly, the particles in the inertia-weighted PSO can converge very well. Figure 1 shows the steps of the PSO algorithm implemented in this research.
Figure 1: Steps of the inertia-weighted PSO algorithm.
Initialization: # particles , # RFID readers, length of a
particle, stopping criteria, initial values of gbest and pbest
Determine the modified antenna coverage area and
evaluate the fitness function
Generate initial solutions with random positions and
velocities = 0
START
Set input parameters following EPC global standard and
propagation models. Calculate values for r, a, and b
Set level for factors facility shape, facility size, grid size, and
power levels
Fitness > pbest?pbest = fitness
Fitness > gbest?
pxbest = current
position
YES
gbest = fitness
gxbest = particle’s array
index and value
YES
NO
NO
x > LV?
Stopping
criteria
met ?
x < 1?
x = LV
x = 1
NO
NO
YES
YES
Display results
and plot graphs
STOP
YES
next iteration
i = i +1
Adjust the positions and velocities of particles
v(i,j)=w*v(i,j)+c1*rand*(gxbest(j)-x(i,j) +c2*rand*(pxbest-x(i,j)
x(i,j)=x(i,j)+v(i,j) : round up to nearest integer
NO

11
The required steps to apply the GA to the CAC mathematical formulation are summarized in the flowchart depicted in Figure 2.
Figure 2: Steps of the GA algorithm.

12
5 Experimental Design
A 2k full factorial experimental design was utilized to evaluate the effect that different factors have on the effectiveness of the developed PSO and GA algorithms to find the optimal number and location of RFID readers in a warehouse facility. The PSO and GA algorithms were implemented using MATLAB version 7.0.1. The effectiveness of the PSO and GA algorithms was measured by means of a value of fitness (i.e., the experimental response). Five factors (i.e., k = 5) were investigated in this experiment. Each factor was tested at two levels (i.e., high and low). The experimental factors and their levels are summarized in Table 1.
Table 1: Experimental controlled factors in the experimental design.
Factors Level of the Factor High (+) Low (-)
A. Facility Shape Non-rectangular shape Inverted-T (Ji's [13])
Rectangular shape (Tang's [14])
B. Facility Size Large Small C. Grid Size 1 meter 0.25 meter
D. Power Levels RFID readers have different power levels
RFID readers have the same power levels
E. Optimization Algorithm PSO GA
The high level for the main factor facility size used the original sizes for the facilities
obtained from [13] (i.e., 80 meters by 60 meters) and [14] (i.e., 75 meters by 30 meters). The small facility sizes (i.e., low level) were obtained by scaling down the original facility size while maintaining the facility shape. The size of the small facilities was approximately one-ninth of that of the large facilities.
A total of 32 treatment combinations were created using the different levels of the experimental factors. Three replications were performed for each treatment combination. Therefore, a total of 96 experimental runs were conducted in MATLAB.
6 Results and Discussion
6.1 Results of the Statistical Analyses based on Five RFID Network Design Factors
A multi-factor ANOVA was used to determine which main factors (i.e., the five RFID network design factors) and interactions had an effect on the quality of the fitness. The main factors and interactions were considered to be statistically significant if their p-

13
value was less than 0.05. The multi-factor ANOVA table for the value of fitness based on five RFID network design factors is shown in Table 2.
Table 2: Multi-factor ANOVA results based on five RFID network design factors.
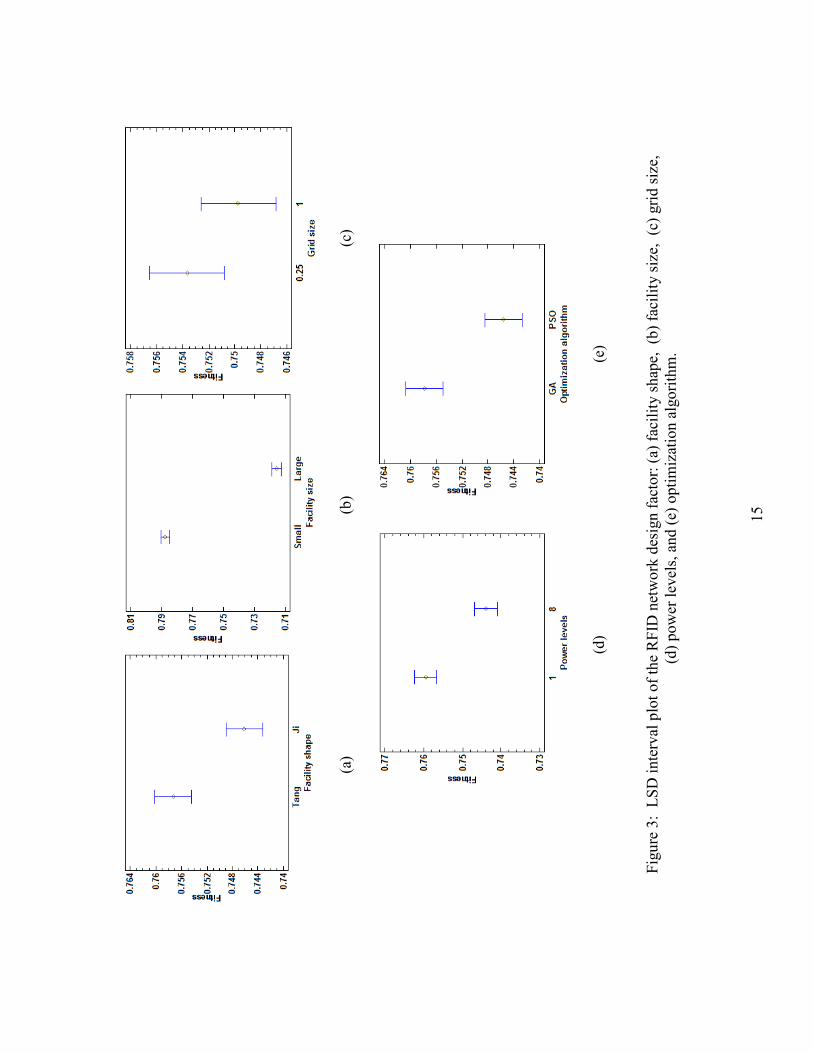
Source Sum of Squares Df Mean Square F-Ratio P-Value MAIN EFFECTS A: Facility shape 0.00302738 1 0.00302738 14.98 0.0002 B: Facility size 0.125809 1 0.125809 622.43 0.0000 C: Grid size 0.000373276 1 0.000373276 1.85 0.1780 D: Power levels 0.00587345 1 0.00587345 29.06 0.0000 E: Algorithm 0.00361499 1 0.00361499 17.88 0.0001
INTERACTIONS AB 0.000612565 1 0.000612565 3.03 0.0856 AC 0.000343905 1 0.000343905 1.70 0.1958 AD 0.00011638 1 0.00011638 0.58 0.4502 AE 0.000386003 1 0.000386003 1.91 0.1708 BC 0.00043648 1 0.00043648 2.16 0.1456 BD 0.00169428 1 0.00169428 8.38 0.0049 BE 0.00388494 1 0.00388494 19.22 0.0000 CD 0.000714496 1 0.000714496 3.53 0.0637 CE 0.000101888 1 0.000101888 0.50 0.4798 DE 0.000987525 1 0.000987525 4.89 0.0299
RESIDUAL 0.01617 80 0.000202125 TOTAL
(CORRECTED) 0.164147 95
Table 2 shows that the RFID network design factors facility shape, facility size,
power levels, and optimization algorithm have a statistically significant effect on the value of fitness (p-value < 0.05). The only RFID network design factor that does not have a statistically significant effect on the value of fitness is grid size. Figure 3 depicts Fisher’s least significant difference (LSD) interval plots (at a 95% confidence level) of all RFID network design factors to illustrate how they influence the performance of the system in terms of the value of fitness.
15
(a
)
(b)
(c
)
(d)
(e)
Figu
re 3
: LS
D in
terv
al p
lot o
f the
RFI
D n
etw
ork
desi
gn fa
ctor
: (a)
faci
lity
shap
e, (
b) fa
cilit
y si
ze,
(c) g
rid si
ze,
(d) p
ower
leve
ls, a
nd (e
) opt
imiz
atio
n al
gorit
hm.
16
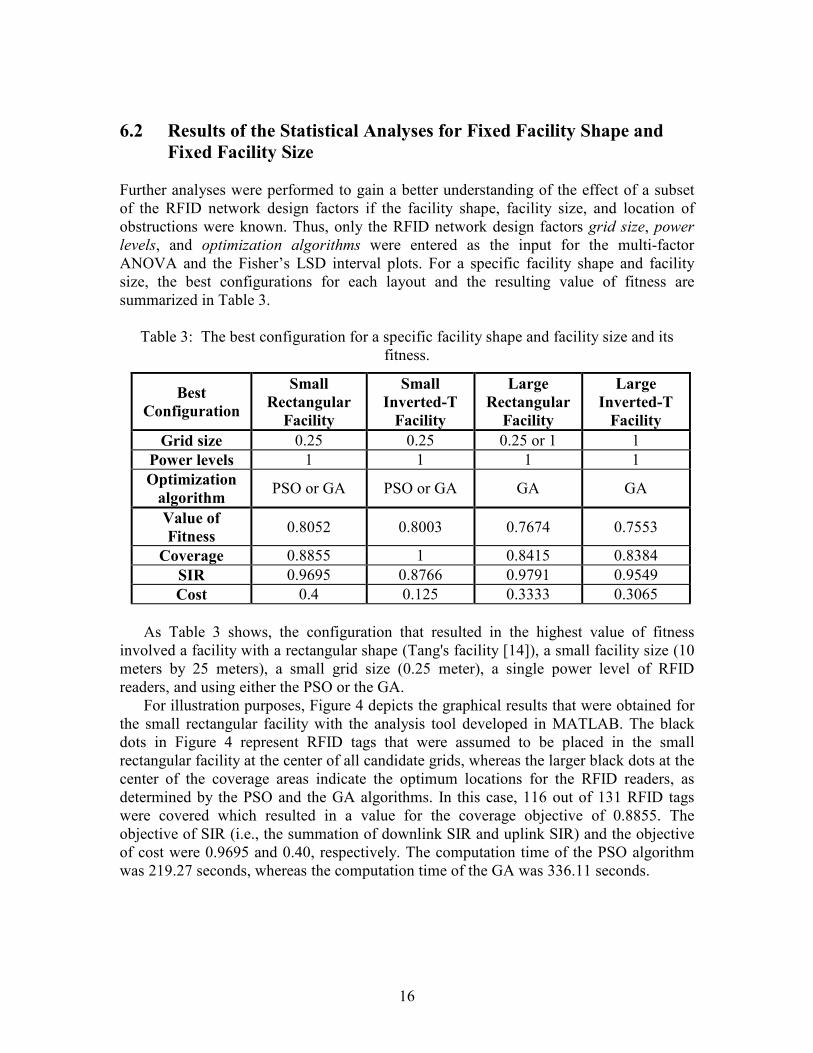
6.2 Results of the Statistical Analyses for Fixed Facility Shape and Fixed Facility Size
Further analyses were performed to gain a better understanding of the effect of a subset of the RFID network design factors if the facility shape, facility size, and location of obstructions were known. Thus, only the RFID network design factors grid size, power levels, and optimization algorithms were entered as the input for the multi-factor ANOVA and the Fisher’s LSD interval plots. For a specific facility shape and facility size, the best configurations for each layout and the resulting value of fitness are summarized in Table 3.
Table 3: The best configuration for a specific facility shape and facility size and its fitness.
Best Configuration
Small Rectangular
Facility
Small Inverted-T
Facility
Large Rectangular
Facility
Large Inverted-T
Facility Grid size 0.25 0.25 0.25 or 1 1
Power levels 1 1 1 1 Optimization
algorithm PSO or GA PSO or GA GA GA
Value of Fitness 0.8052 0.8003 0.7674 0.7553
Coverage 0.8855 1 0.8415 0.8384 SIR 0.9695 0.8766 0.9791 0.9549 Cost 0.4 0.125 0.3333 0.3065
As Table 3 shows, the configuration that resulted in the highest value of fitness
involved a facility with a rectangular shape (Tang's facility [14]), a small facility size (10 meters by 25 meters), a small grid size (0.25 meter), a single power level of RFID readers, and using either the PSO or the GA.
For illustration purposes, Figure 4 depicts the graphical results that were obtained for the small rectangular facility with the analysis tool developed in MATLAB. The black dots in Figure 4 represent RFID tags that were assumed to be placed in the small rectangular facility at the center of all candidate grids, whereas the larger black dots at the center of the coverage areas indicate the optimum locations for the RFID readers, as determined by the PSO and the GA algorithms. In this case, 116 out of 131 RFID tags were covered which resulted in a value for the coverage objective of 0.8855. The objective of SIR (i.e., the summation of downlink SIR and uplink SIR) and the objective of cost were 0.9695 and 0.40, respectively. The computation time of the PSO algorithm was 219.27 seconds, whereas the computation time of the GA was 336.11 seconds.

17
Figure 4 clearly shows that three RFID readers cannot provide entire coverage for the small rectangular facility. Therefore, the optimum location and optimum number of RFID readers needed to cover the entire small rectangular facility (i.e., coverage of the center of all candidate grids) were further investigated. The number of required RFID readers must be in the range between three to five, which is derived from constraint (3) of the CAC mathematical formulation. The improvement in coverage can increase the value of fitness. However, the cost objective decreases as the number of RFID readers increase and the interference tends to increase as well with more RFID readers because of a denser environment. Therefore, a configuration with complete coverage does not always guarantee the highest value of fitness.
Figure 4: The placement of RFID readers in a small rectangular facility (10 meters by 25
meters) using the best configuration of RFID network design factors. Figure 5 depicts an alternative placement of RFID readers in the small rectangular facility. In this particular case, five RFID readers was the optimum number to ensure entire coverage, which resulted in a value of fitness of 0.7740. The value for coverage was one; 0.8702 for SIR; and zero for cost. The zero cost means that no savings were realized with this RFID system since the maximum number of RFID readers allowed (i.e., five) were used in this scenario.

18
Figure 5: The placement of RFID readers in a small rectangular facility (10 meters by 25
meters) using the best configuration of RFID network design factors with entire coverage.
7 Conclusions The methodology developed to find the optimal location and number of RFID readers required in a warehouse facility to support inventory management worked very well with small rectangular facilities and small inverted-T facilities. The PSO and GA algorithms were able to obtain better values for the fitness function (i.e., maximize the RF coverage, minimize the level of interference and minimize the implementation cost) for a facility with a rectangular shape, a small size and a single power level of RFID readers. In general, the GA algorithm produced better values of fitness than the PSO algorithm. This might be due to the fact that the problem in this research is a discrete problem. Rounding the updated value of position (i.e., x) in the PSO algorithm to the nearest integer was the approach used to make it a discrete PSO. A more sophisticated discrete binary PSO may be needed to obtain better (or comparable) results than those obtained with the GA.
The PSO and GA algorithms (but especially the PSO) did not work very well with the large facility size scenarios used in this research. Some parameters of the algorithms, the weights of each objective, and the termination criteria will be further investigated to improve on these results.

19
References [1] RNCOS Industry Research Solutions., Global RFID Market Forecast to 2014.
Retrieved from http://www.rncos.com/Report/IM378.htm, (2012). [2] Angeles, R., “RFID Technologies: Supply-Chain Applications and Implementation
Issues,” Information Systems Management, 22, 51-65 (2005). [3] Chande, A., Dhekane, S., Hemachandra, N., and Rangaraj, N., “Perishable inventory
management and dynamic pricing using RFID technology,” Sadhana, 30, 2-3, 445-462 (2005).
[4] Jiahao, W., Zongwei, L., and Wong, E. C., “RFID-enabled tracking in flexible assembly line,” International Journal Of Advanced Manufacturing Technology, 46,1-4, 351-360 (2010).
[5] Ernst, and Young. “Ernst and Young Study Estimates Retailers Lose $46 Billion Annually to Inventory Shrinkage; Employee Theft Is Biggest Problem,” Business Wire, (2003).
[6] Giampaolo, E. D., Forni, F., and Marrocco, G., "RFID-Network Planning by Particle Swarm Optimization," Proceedings of the Fourth European Conference on Antennas and Propagation, April 12-16, Barcelona, Spain, 1-5 (2010).
[7] Gupta, N., and Iyer, S., “RFIDPlanner - A Coverage Planning Tool for RFID Networks. Asian Intl Mobile Computing Conference (AMOC 2007),” 1-8. Calcutta, India (2007).
[8] Bhattacharya, I., & Roy, U. K., “Optimal Placement of Readers in an RFID Network Using Particle Swarm Optimization,” International Journal of Computer Networks & Communications (IJCNC), 2, 6, 225-234 (2010).
[9] Reza, A. W., & Geok, T. K., “Investigation of Indoor Location Sensing via RFID Reader Network Utilizing Grid Covering Algorithm,” Wireless Personal Communications, 49, 1, 67-80 (2009).
[10] Guan, Q., Liu, Y., Yang, Y., and Yu, W., “Genetic Approach for Network Planning in the RFID Systems,” Sixth International Conference on Intelligent Systems Design and Applications (ISDA 2006), 567-572 (2006).
[11] Chen, H., Zhu, Y., Hu, K., and Ku, T., “RFID Network Planning using a Multi-Swarm Optimizer,” Journal of Network and Computer Applications, 34, 3, 888-901 (2011).
[12] Clerc, M., and Kennedy, J., "The particle swarm - explosion, stability, and convergence in a multi-dimensional complex space," IEEE Transactions on Evolutionary Computation, 6, 1, 58-73 (2002).
[13] Ji, Z., Sarkar, T. K., and Li, B.H., "Methods for optimizing the location of base stations for indoor wireless communications," IEEE Transactions on Antennas and Propagation, 10, 1481 – 1483 (2002).
[14] Tang, K. S., Man, K. F., and Ko, K. T., Wireless LAN Design using Hierarchical Genetic Algorithm. Proceedings of the Seventh International Conference on Genetic Algorithms, 629–635 (1997).