Embed Size (px)
Citation preview
Resource-Efficient Technologies 3 (2017) 365–377
Contents lists available at ScienceDirect
Resource-Efficient Technologies
journal homepage: www.elsevier.com/locate/reffit
Research paper
Modeling and performance simulation of 100 MW LFR based solar
thermal power plant in Udaipur India
✩
Deepak Bishoyi a , K. Sudhakar a , b , ∗
a Energy Centre, Maulana Azad National Institute of Technology, Bhopal, India b Faculty of Mechanical Engineering, Universiti Malaysia Pahnag, 26600 Pahang, Malaysia
a r t i c l e i n f o
Article history:
Received 20 January 2017
Revised 27 January 2017
Accepted 2 February 2017
Available online 1 March 2017
Keywords:
Linear Fresnel Reflector (LFR) solar thermal
power plant
SAM (System Advisor Model)
India
a b s t r a c t
Solar energy is the most abundant source of energy on the earth and considered as an important alter-
native to fossil fuels. Solar energy can be converted into electric energy by using two different processes:
photovoltaic conversion and the thermodynamic cycles. Lifetime and efficiency of PV power plant is lesser
as compared to the CSP technology. CSP technology is viewed as one of the most promising alternative
technology in the field of solar energy utilization. A 100 MW Linear Fresnel Reflector solar thermal power
plant design with 6 hours of thermal energy storage has been evaluated for thermal performance using
NREL SAM. A location receiving an annual DNI of 2248.17 kWh/m
2 /year in Rajasthan is chosen for the
technical feasibility of hypothetical CSP plant. The plant design consists of 16 numbers of solar collector
modules in a loop. HITEC solar salt is chosen as an HTF due to its excellent thermodynamic properties.
The designed plant can generate annual electricity of 263,973,360 kWh with the plant efficiency of 18.3
%. The capacity utilization of the proposed LFR plant is found to be 30.2%. The LFR solar thermal power
plant performance results encourage further innovation and development of CSP plants in India.
© 2017 Tomsk Polytechnic University. Published by Elsevier B.V.
This is an open access article under the CC BY-NC-ND license.
( http://creativecommons.org/licenses/by-nc-nd/4.0/ )
1
i
e
i
f
o
s
[
d
1
a
S
e
P
i
i
P
[
t
e
e
h
a
R
a
a
a
a
r
h
2
(
. Introduction
Power generation using solar energy is one of the most promis-
ng options in reduction of fossil fuel consumption and related CO 2
missions. In India, Solar PV based power generation is given more
mportance so as to increase the share of electricity production
rom renewable energy quickly. It is envisaged by the government
f India to generate 175 GW electricity from the renewable energy
ources by 2022 under Jawaharlal Nehru National Solar Mission
1] . The proposed target is five times the current electricity pro-
uction from the renewable energy sources. Out of 175 GW target,
00 GW of electricity is to be generated from solar energy alone,
nd the remaining will be from wind, biomass and small hydro.
olar PV based energy generation is land intensive as well as less
fficient. Presently installed capacity of Solar PV based power plant
✩ Peer review under responsibility of Tomsk Polytechnic University. ∗ Corresponding author. Faculty of Mechanical Engineering, Universiti Malaysia
ahnag, 26600 Pahang, Malaysia. Tel: +91-755-2670327; fax: +91-755-2670562.
E-mail address: [email protected] (K. Sudhakar).
o
s
l
t
o
ttps://doi.org/10.1016/j.reffit.2017.02.002
405-6537/© 2017 Tomsk Polytechnic University. Published by Elsevier B.V. This is an ope
http://creativecommons.org/licenses/by-nc-nd/4.0/ )
s 8.7 GW [1] . In the current scenario, 97.6% of solar based energy
s obtained from solar PV. The contribution of Concentrated Solar
ower (CSP) is only 2.4% of the total solar based power generation
2] . In India, the population density (382 persons/km
2 ) is so high
hat land should be used judiciously. Since PV based power gen-
ration requires more land, there can be a shortage of the land,
specially for housing and agriculture in the future. On the other
and, desert land (320,0 0 0 km
2 ) in the states of Rajasthan, Gujarat,
nd Haryana can be effectively used for solar-based technologies.
ajasthan has more desert area among Indian states. The desert
reas are marked as barren lands as they are not suitable for living
s well as agriculture. These regions are not preferred for solar PV
pplications because of high temperature and high DNI [3] . Also
fter 25 years of expected lifetime, the PV modules will be catego-
ized as e-waste.
Concentrating solar power (CSP) technology is considered as
ne of the most alternative solutions of power generation from
olar energy. In this technology, sunrays are focused onto a so-
ar receiver with the help of mirrors. The energy captured by
he receiver is converted to heat or electricity through a series
f process. It can operate continuously for up to 100 years. For
n access article under the CC BY-NC-ND license.
366 D. Bishoyi, K. Sudhakar / Resource-Efficient Technologies 3 (2017) 365–377
m
T
i
2
2
R
a
1
d
a CSP plant, higher DNI corresponds to higher electricity genera-
tion. As a rule of thumb, regions with low annual cloud shading
and Direct Normal Incidence (DNI) exceeding 20 0 0 kWh/m
2 /year
(5.5 kWh/m
2 /day) can generate more units of electricity per
area.
The linear Fresnel Reflector based CSP power plant is consid-
ered as one of the most promising technologies for arid and semi-
arid regions. This technology is capable of producing power rang-
ing from few kilowatts (remote power systems) to hundreds of
megawatts (grid-connected power plants). Linear Fresnel reflector
solar thermal power plants (LFRSTPP) mostly consist of a solar
field and power blocks. TES (thermal energy storage) system can
be used to enhance the system potential [4] . Presently installed ca-
pacity of CSP plant in India is about 503.5 MW [5] .
Simplest application of LFR technology is for the direct steam
generation eliminating the need of expensive thermo-oil and com-
plex heat exchangers. The superheated steam can be generated di-
rectly in the absorber of the concentrating collector.
Mills and Morrison [6] presented the first results from the lin-
ear Fresnel solar concentrating collector installation of 1MWth at
the Liddell power station. Direct steam generation with the solar
array was achieved and optical performance met the design speci-
fications.
Horn et al. presented an investment evaluation, determining the
NPV and the LEC of an integrated solar combined-cycle system in
Egypt [7] .
Hosseini et al. performed a comparative study of different tra-
ditional and solar power plants using the levelized electricity cost
as the reference metric [8] .
A comparison in terms of the LEC between linear Fresnel and
parabolic trough collector power plants was performed by Morin
et al. [9] .
Comparative analyses using the LEC among different renewable
electricity generation technologies have been developed by Varun
et al. [10] and by Giuliano et al. [3] .
Fig. 1. Schematic diagram of Linear Fre
However, feasibility of large scale CSP Technology in Indian cli-
atic condition has not been reported in the literature till date.
his work is just an attempt to address the research gap existing
n the field of large scale LFR CSP plants.
The main objectives of the research work are as follows:
1. Propose a suitable design of LFR CSP technology for renew-
able power generation in the identified sites of India.
2. Simulate the performance of a Linear Fresnel Reflective solar
thermal power plant with the help of SAM (system advisor
model) software and NREL weather data base.
3. Analyze the thermodynamic aspect and annual energy gen-
eration of the proposed Linear Fresnel Reflector solar ther-
mal power plant technology.
. Methodology
.1. Thermodynamic cycle
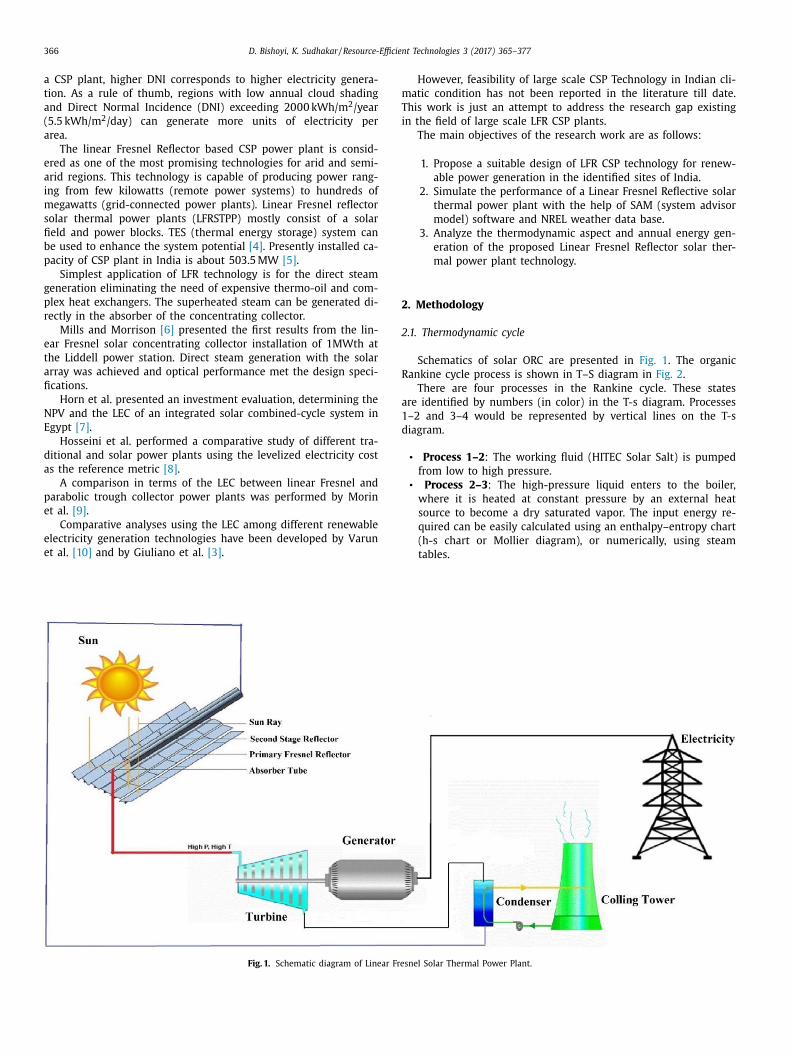
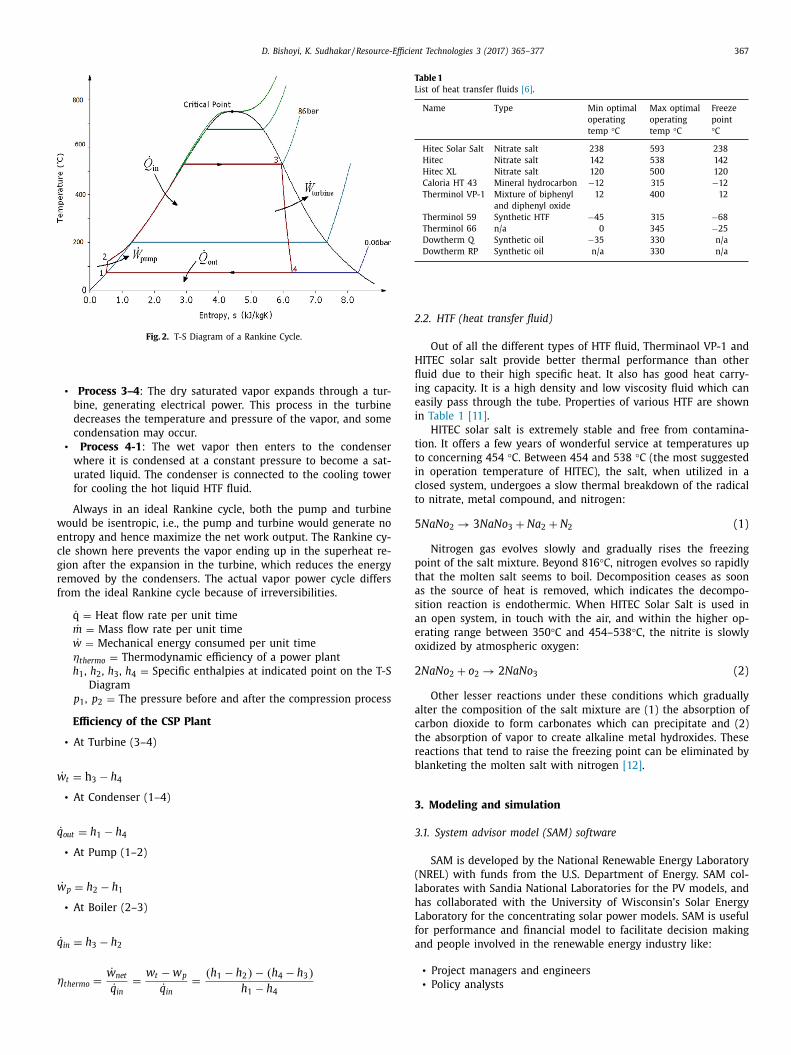
Schematics of solar ORC are presented in Fig. 1 . The organic
ankine cycle process is shown in T–S diagram in Fig. 2 .
There are four processes in the Rankine cycle. These states
re identified by numbers (in color) in the T-s diagram. Processes
–2 and 3–4 would be represented by vertical lines on the T-s
iagram.
• Process 1–2 : The working fluid (HITEC Solar Salt) is pumped
from low to high pressure.
• Process 2–3 : The high-pressure liquid enters to the boiler,
where it is heated at constant pressure by an external heat
source to become a dry saturated vapor. The input energy re-
quired can be easily calculated using an enthalpy–entropy chart
(h-s chart or Mollier diagram), or numerically, using steam
tables.
snel Solar Thermal Power Plant.
D. Bishoyi, K. Sudhakar / Resource-Efficient Technologies 3 (2017) 365–377 367
Fig. 2. T-S Diagram of a Rankine Cycle.
w
e
c
g
r
f
w
q
w
q
η
Table 1
List of heat transfer fluids [6] .
Name Type Min optimal
operating
temp °C
Max optimal
operating
temp °C
Freeze
point
°C
Hitec Solar Salt Nitrate salt 238 593 238
Hitec Nitrate salt 142 538 142
Hitec XL Nitrate salt 120 500 120
Caloria HT 43 Mineral hydrocarbon −12 315 −12
Therminol VP-1 Mixture of biphenyl
and diphenyl oxide
12 400 12
Therminol 59 Synthetic HTF −45 315 −68
Therminol 66 n/a 0 345 −25
Dowtherm Q Synthetic oil −35 330 n/a
Dowtherm RP Synthetic oil n/a 330 n/a
2
H
fl
i
e
i
t
t
i
c
t
5
p
t
a
s
a
e
o
2
a
c
t
r
b
3
3
(
l
h
L
f
a
• Process 3–4 : The dry saturated vapor expands through a tur-
bine, generating electrical power. This process in the turbine
decreases the temperature and pressure of the vapor, and some
condensation may occur.
• Process 4-1 : The wet vapor then enters to the condenser
where it is condensed at a constant pressure to become a sat-
urated liquid. The condenser is connected to the cooling tower
for cooling the hot liquid HTF fluid.
Always in an ideal Rankine cycle, both the pump and turbine
ould be isentropic, i.e., the pump and turbine would generate no
ntropy and hence maximize the net work output. The Rankine cy-
le shown here prevents the vapor ending up in the superheat re-
ion after the expansion in the turbine, which reduces the energy
emoved by the condensers. The actual vapor power cycle differs
rom the ideal Rankine cycle because of irreversibilities.
˙ q = Heat flow rate per unit time
˙ m = Mass flow rate per unit time
˙ w = Mechanical energy consumed per unit time
ηthermo = Thermodynamic efficiency of a power plant
h 1 , h 2 , h 3 , h 4 = Specific enthalpies at indicated point on the T-S
Diagram
p 1 , p 2 = The pressure before and after the compression process
Efficiency of the CSP Plant
• At Turbine (3–4)
˙ t = h 3 − h 4
• At Condenser (1–4)
˙ out = h 1 − h 4
• At Pump (1–2)
˙ p = h 2 − h 1
• At Boiler (2–3)
˙ in = h 3 − h 2
thermo =
˙ w net =
w t − w p =
( h 1 − h 2 ) − ( h 4 − h 3 )
˙ q in ˙ q in h 1 − h 4
.2. HTF (heat transfer fluid)
Out of all the different types of HTF fluid, Therminaol VP-1 and
ITEC solar salt provide better thermal performance than other
uid due to their high specific heat. It also has good heat carry-
ng capacity. It is a high density and low viscosity fluid which can
asily pass through the tube. Properties of various HTF are shown
n Table 1 [11] .
HITEC solar salt is extremely stable and free from contamina-
ion. It offers a few years of wonderful service at temperatures up
o concerning 454 °C. Between 454 and 538 °C (the most suggested
n operation temperature of HITEC), the salt, when utilized in a
losed system, undergoes a slow thermal breakdown of the radical
o nitrate, metal compound, and nitrogen:
N aN o 2 → 3 N aN o 3 + N a 2 + N 2 (1)
Nitrogen gas evolves slowly and gradually rises the freezing
oint of the salt mixture. Beyond 816 °C, nitrogen evolves so rapidly
hat the molten salt seems to boil. Decomposition ceases as soon
s the source of heat is removed, which indicates the decompo-
ition reaction is endothermic. When HITEC Solar Salt is used in
n open system, in touch with the air, and within the higher op-
rating range between 350 °C and 454–538 °C, the nitrite is slowly
xidized by atmospheric oxygen:
N aN o 2 + o 2 → 2 N aN o 3 (2)
Other lesser reactions under these conditions which gradually
lter the composition of the salt mixture are (1) the absorption of
arbon dioxide to form carbonates which can precipitate and (2)
he absorption of vapor to create alkaline metal hydroxides. These
eactions that tend to raise the freezing point can be eliminated by
lanketing the molten salt with nitrogen [12] .
. Modeling and simulation
.1. System advisor model (SAM) software
SAM is developed by the National Renewable Energy Laboratory
NREL) with funds from the U.S. Department of Energy. SAM col-
aborates with Sandia National Laboratories for the PV models, and
as collaborated with the University of Wisconsin’s Solar Energy
aboratory for the concentrating solar power models. SAM is useful
or performance and financial model to facilitate decision making
nd people involved in the renewable energy industry like:
• Project managers and engineers
• Policy analysts
368 D. Bishoyi, K. Sudhakar / Resource-Efficient Technologies 3 (2017) 365–377
Table 2
Shortlisted sites based on the high DNI [6] .
Rajasthan Gujarat Madhya Pradesh Karnataka Tamil Nadu
Udaipur Palanpur Bhopal Mysore Madurai
Jaipur Kutch Indore Tumakuru Coimbatore
Bikaner Mehsana Rewa Bengaluru Chennai
Table 3
Based on DNI rank wise shortlisted site [6] .
Rank Site Location Rank Site location
1 Udaipur, Rajasthan 9 Tumakuru, Karnataka
2 Palanpur, Gujarat 10 Coimbatore, Tamil Nadu
3 Mehsana, Gujarat 11 Madurai, Tamil Nadu
4 Kutch, Gujarat 12 Bengaluru, Karnataka
5 Jaipur, Rajasthan 13 Bhopal, Madhya Pradesh
6 Indore, Madhya Pradesh 14 Rewa, Madhya Pradesh
7 Bikaner, Rajasthan 15 Chennai, Tamil Nadu
8 Mysore, Karnataka
Table 4
Annual DNI values for different potential sites
[6] .
Name of the Site DNI kwh/m
2 /year
Udaipur, Rajasthan 2248.17 kWh/m
2 /year
Palanpur, Gujarat 2188.2 kWh/m
2 /year
Mehsana, Gujarat 2141.71 kWh/m
2 /year
Kutch, Gujarat 2076.74 kWh/m
2 /year
Table 5
Summary of the required parameters near the selected site of Udaipur, Ra-
jasthan.
Required Parameter Availability
Water resources ∗ Upper lakes: Lake Badi, Chhota Madar & Bada
Madar. ∗ City Lakes: Lake Pichola, Fateh Sagar Lake,
Swaroop Sagar,
Rang Sagar, Kumharia Talab, Goverdhan Sagar. ∗ Downstream Lake: Udaisagar Lake. ∗ River: Ahar River.
Transportation ∗ Air way- Dabok airport, also known as
Maharana Pratap Airport ∗ Railway- Udaipur City and Rana Pratap Nagar
railway station ∗ Road way- NH 76 and NH 8
3
3
d
i
3
a
c
f
S
3
s
d
b
Q
3
a
d
• Technology developers
• Researchers
SAM’s user interface makes it possible for people with no ex-
perience in developing computer models to build a model of a re-
newable energy project, and to make cost and performance projec-
tions based on model results. To describe the renewable energy re-
source and weather conditions at a project location, SAM requires
a weather data TMY file [6] .
3.2. Site selection and solar resource assessment
India lies in a region with medium solar radiation. On aver-
age, 4.5–6.5 kWh/m
2 /day of insolation exist in the country more
than 85% of the area. Most part of the country receives 8 to 10
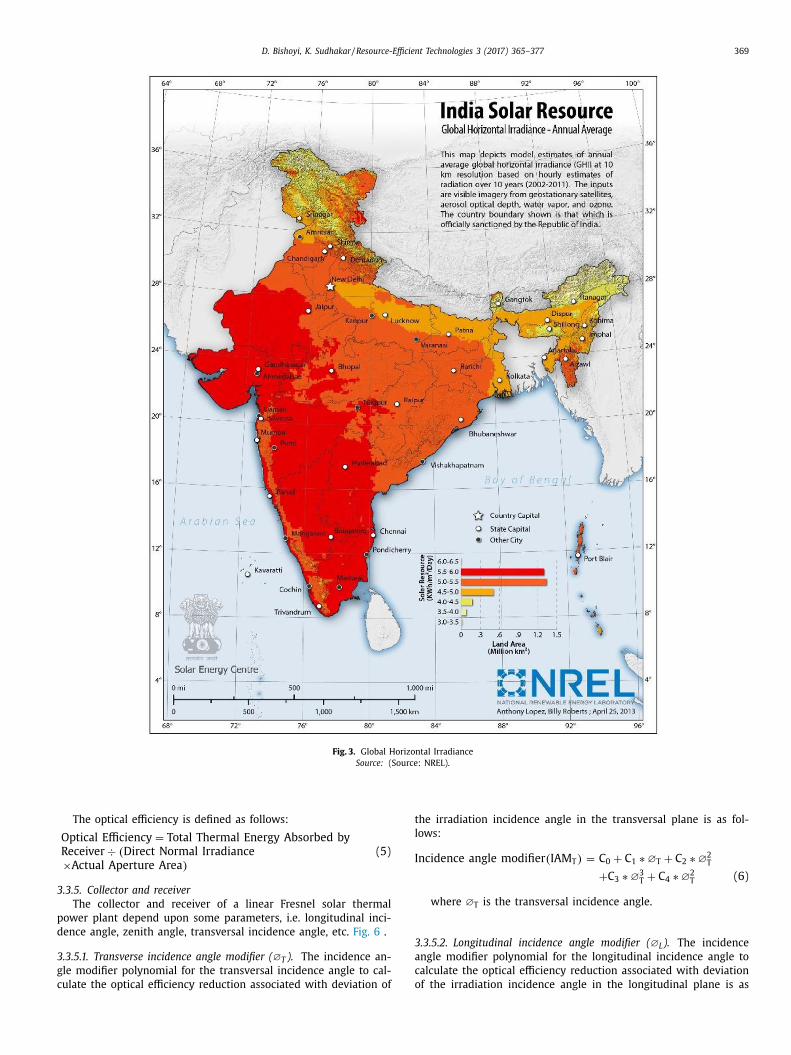
sunshine hours per day. Fig. 3 shows global horizontal irradiance
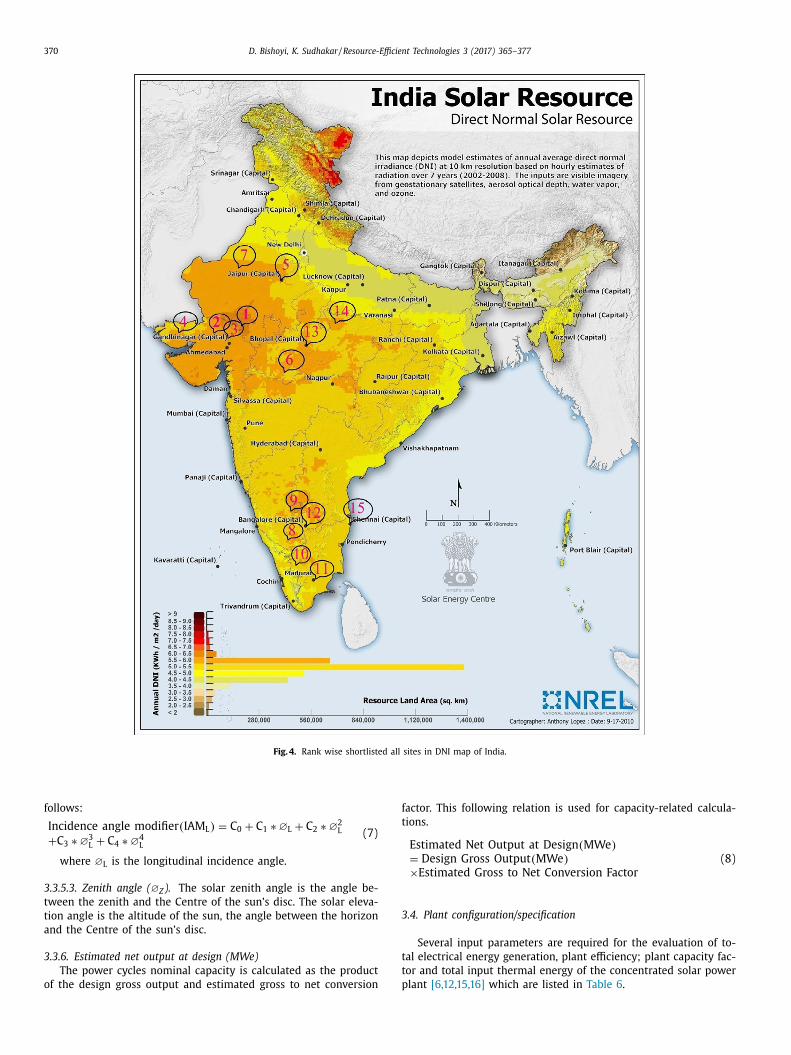
map of India [6] . Shown in Fig. 4 is the DNI map of India along
with appropriate site for constructing Linear Fresnel reflective solar
thermal power plant (LFRSTPP). The primary phase of a CSP power
plant is site selection. CSP based power plant can only be installed
where the DNI ≥ 5.5 kWh/m
2 /day (greater than 1800 kWh/m
2 /year)
[13] . For site selection, many factors are considered, i.e. water,
land, etc. In the secondary phase, some extra parameters are
required for installation of a solar thermal power plant; these
are water supply, transportation, grid connection, soil structure,
land cost, capital investment, environmental effect, etc. Indirectly,
the global horizontal irradiance also depends upon the power
generation.
Keeping in view the potential sites identified in Table 2 and the
availability of climatological data, the sites with the highest value
of annual DNI have been selected [14] . Based on the above site, se-
lection criteria and availability of the solar radiation ( Table 3 ), the
following four potential sites are shortlisted for LFRSTPP ( Table 4 ).
Hourly DNI values in a standard format, mostly TMY2, (Typical Me-
teorological Year version 2) are required as an input data for sim-
ulation.
Out of all these locations Udaipur, Rajasthan is chosen for the
feasibility study of the CSP plant because annual DNI of this lo-
cation is very high as compared to other locations in India. Thus,
this location fulfills all the site selection criteria for Installation of
CSP based power plant. The required parameters are summarized
in Table 5 .
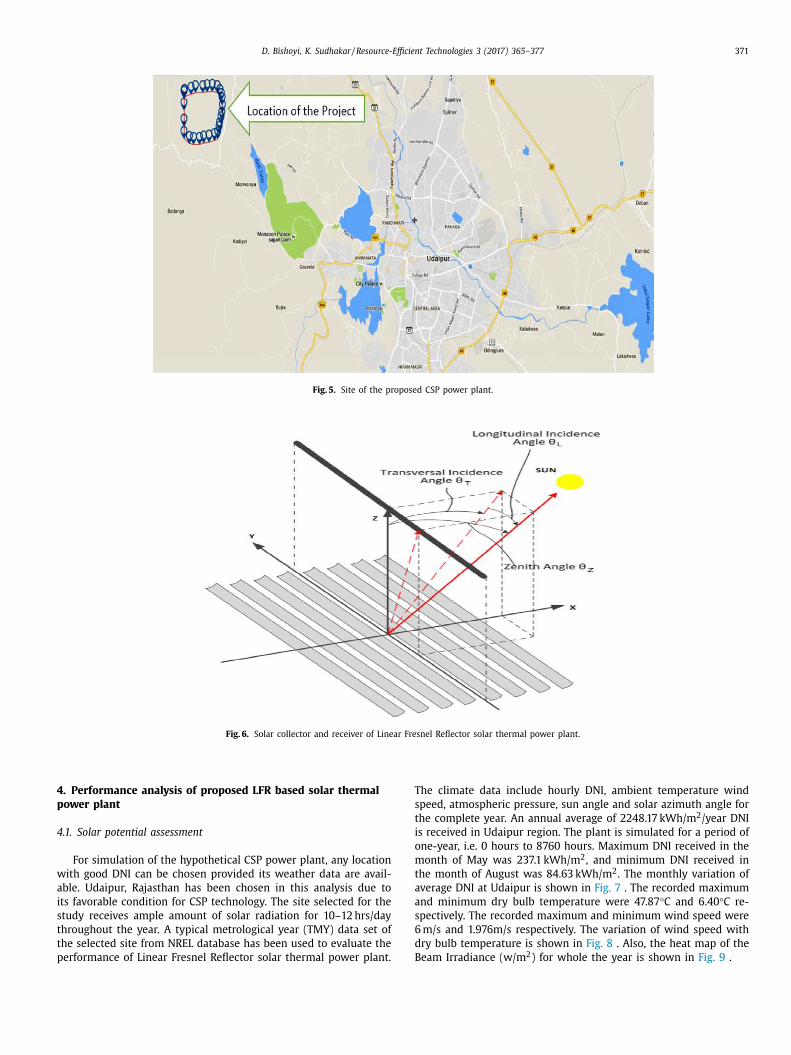
The site selected for the study is shown in Fig. 5 .
.3. Mathematical modeling and simulation
.3.1. Solar field
Solar field is the area where various solar radiation collecting
evices such as collector, absorber. etc. have to be installed. It is
nitial and first deciding parameter for the design of any CSP plant.
.3.2. Solar multiple
Solar multiple is defined as the field aperture area expressed
s a multiple of the aperture area required to operate the power
ycle at its design capacity. It is denoted as SM and mathematical
ormula is given below:
M =
power cycle capacity
solar field capacity (3)
.3.3. Solar field design output
It is the thermal energy delivered by the solar field under de-
ign conditions at the given solar multiple. The value of solar field
esign output is calculated at the interface of receiver and power
lock as the function of the solar multiple.
The equation for the solar field design output is:
sf , des =
W pb , des
ηdes
× SM (4)
where, Q sf, des = solar field design heat output
W pb, des = design work out from power block
ηdes = design efficiency
SM = Solar Multiple
.3.4. Loop optical efficiency
The optical efficiency when incident radiation is normal to the
perture plane, not including end losses or cosine losses. This value
oes not include thermal losses from piping and the receivers.
Loop Optical Efficiency = Collector Optical Efficiency at Design × Receiver Optical Derate
D. Bishoyi, K. Sudhakar / Resource-Efficient Technologies 3 (2017) 365–377 369
Fig. 3. Global Horizontal Irradiance
Source: (Source: NREL).
3
p
d
3
g
c
t
l
I
3
a
c
o
The optical efficiency is defined as follows:
Optical Efficiency = Total Thermal Energy Absorbed by Receiver ÷ ( Direct Normal Irradiance ×Actual Aperture Area )
(5)
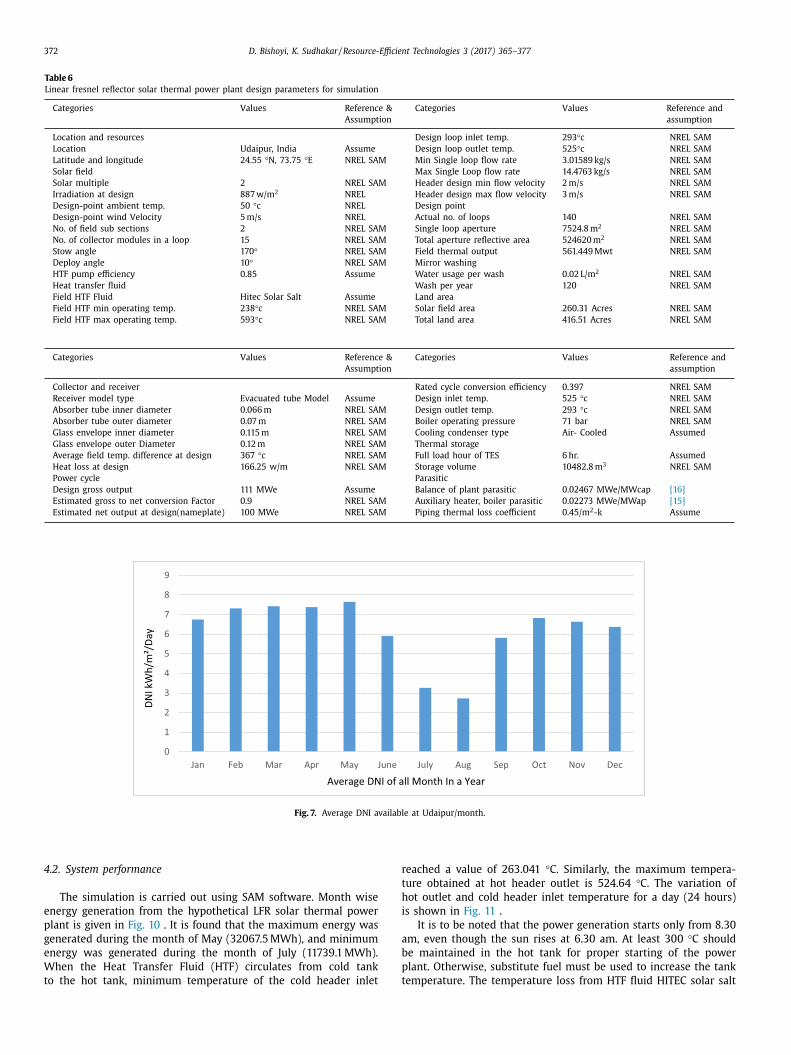
.3.5. Collector and receiver
The collector and receiver of a linear Fresnel solar thermal
ower plant depend upon some parameters, i.e. longitudinal inci-
ence angle, zenith angle, transversal incidence angle, etc. Fig. 6 .
.3.5.1. Transverse incidence angle modifier ( ∅ T ). The incidence an-
le modifier polynomial for the transversal incidence angle to cal-
ulate the optical efficiency reduction associated with deviation of
he irradiation incidence angle in the transversal plane is as fol-
ows:
ncidence angle modifier ( IAM T ) = C 0 + C 1 ∗ ∅ T + C 2 ∗ ∅
2 T
+ C 3 ∗ ∅
3 T + C 4 ∗ ∅
2 T (6)
where ∅ T is the transversal incidence angle.
.3.5.2. Longitudinal incidence angle modifier ( ∅ L ). The incidence
ngle modifier polynomial for the longitudinal incidence angle to
alculate the optical efficiency reduction associated with deviation
f the irradiation incidence angle in the longitudinal plane is as
370 D. Bishoyi, K. Sudhakar / Resource-Efficient Technologies 3 (2017) 365–377
Fig. 4. Rank wise shortlisted all sites in DNI map of India.
f
t
3
t
t
p
follows:
Incidence angle modifier ( IAM L ) = C 0 + C 1 ∗ ∅ L + C 2 ∗ ∅
2 L
+ C 3 ∗ ∅
3 L + C 4 ∗ ∅
4 L
(7)
where ∅ L is the longitudinal incidence angle.
3.3.5.3. Zenith angle ( ∅ Z ). The solar zenith angle is the angle be-
tween the zenith and the Centre of the sun’s disc. The solar eleva-
tion angle is the altitude of the sun, the angle between the horizon
and the Centre of the sun’s disc.
3.3.6. Estimated net output at design (MWe)
The power cycles nominal capacity is calculated as the product
of the design gross output and estimated gross to net conversion
actor. This following relation is used for capacity-related calcula-
ions.
Estimated Net Output at Design ( MWe ) = Design Gross Output ( MWe ) ×Estimated Gross to Net Conversion Factor
(8)
.4. Plant configuration/specification
Several input parameters are required for the evaluation of to-
al electrical energy generation, plant efficiency; plant capacity fac-
or and total input thermal energy of the concentrated solar power
lant [6,12,15,16] which are listed in Table 6 .
D. Bishoyi, K. Sudhakar / Resource-Efficient Technologies 3 (2017) 365–377 371
Fig. 5. Site of the proposed CSP power plant.
Fig. 6. Solar collector and receiver of Linear Fresnel Reflector solar thermal power plant.
4
p
4
w
a
i
s
t
t
p
T
s
t
i
o
m
t
a
a
s
6
d
B
. Performance analysis of proposed LFR based solar thermal
ower plant
.1. Solar potential assessment
For simulation of the hypothetical CSP power plant, any location
ith good DNI can be chosen provided its weather data are avail-
ble. Udaipur, Rajasthan has been chosen in this analysis due to
ts favorable condition for CSP technology. The site selected for the
tudy receives ample amount of solar radiation for 10–12 hrs/day
hroughout the year. A typical metrological year (TMY) data set of
he selected site from NREL database has been used to evaluate the
erformance of Linear Fresnel Reflector solar thermal power plant.
he climate data include hourly DNI, ambient temperature wind
peed, atmospheric pressure, sun angle and solar azimuth angle for
he complete year. An annual average of 2248.17 kWh/m
2 /year DNI
s received in Udaipur region. The plant is simulated for a period of
ne-year, i.e. 0 hours to 8760 hours. Maximum DNI received in the
onth of May was 237.1 kWh/m
2 , and minimum DNI received in
he month of August was 84.63 kWh/m
2 . The monthly variation of
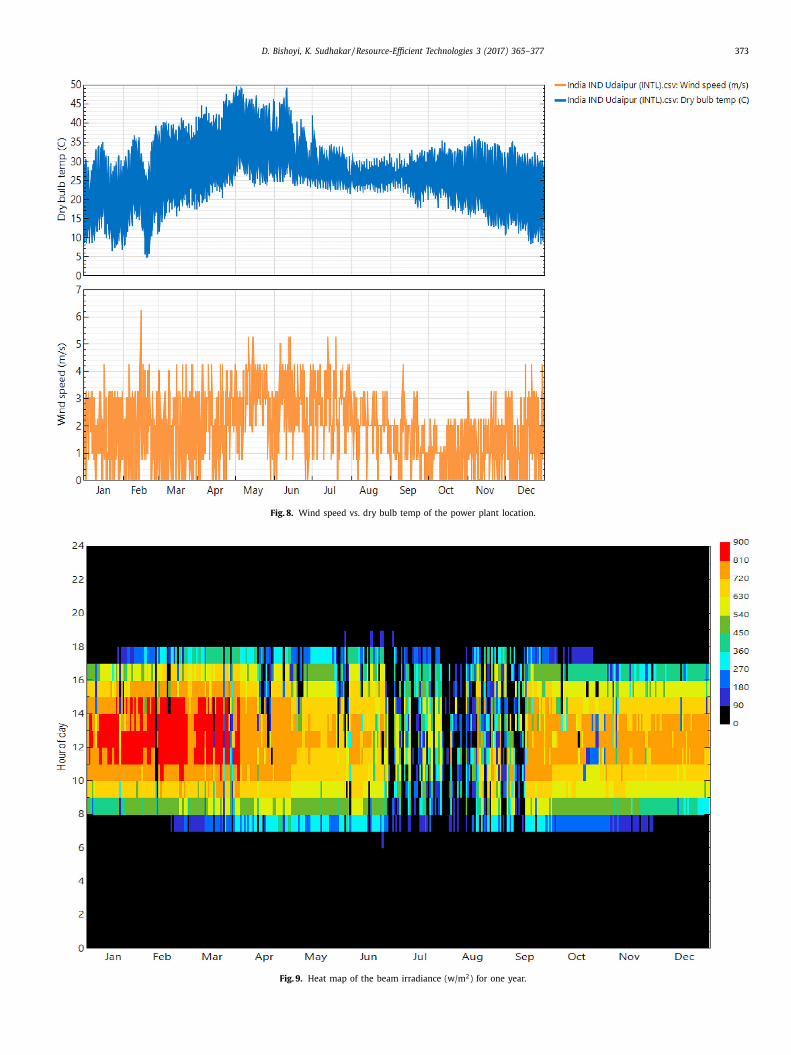
verage DNI at Udaipur is shown in Fig. 7 . The recorded maximum
nd minimum dry bulb temperature were 47.87 °C and 6.40 °C re-
pectively. The recorded maximum and minimum wind speed were
m/s and 1.976m/s respectively. The variation of wind speed with
ry bulb temperature is shown in Fig. 8 . Also, the heat map of the
eam Irradiance (w/m
2 ) for whole the year is shown in Fig. 9 .
372 D. Bishoyi, K. Sudhakar / Resource-Efficient Technologies 3 (2017) 365–377
Table 6
Linear fresnel reflector solar thermal power plant design parameters for simulation
Categories Values Reference &
Assumption
Categories Values Reference and
assumption
Location and resources Design loop inlet temp. 293 °c NREL SAM
Location Udaipur, India Assume Design loop outlet temp. 525 °c NREL SAM
Latitude and longitude 24.55 °N, 73.75 °E NREL SAM Min Single loop flow rate 3.01589 kg/s NREL SAM
Solar field Max Single Loop flow rate 14.4763 kg/s NREL SAM
Solar multiple 2 NREL SAM Header design min flow velocity 2 m/s NREL SAM
Irradiation at design 887 w/m
2 NREL Header design max flow velocity 3 m/s NREL SAM
Design-point ambient temp. 50 °c NREL Design point
Design-point wind Velocity 5 m/s NREL Actual no. of loops 140 NREL SAM
No. of field sub sections 2 NREL SAM Single loop aperture 7524.8 m
2 NREL SAM
No. of collector modules in a loop 15 NREL SAM Total aperture reflective area 524620 m
2 NREL SAM
Stow angle 170 ° NREL SAM Field thermal output 561.449 Mwt NREL SAM
Deploy angle 10 ° NREL SAM Mirror washing
HTF pump efficiency 0.85 Assume Water usage per wash 0.02 L/m
2 NREL SAM
Heat transfer fluid Wash per year 120 NREL SAM
Field HTF Fluid Hitec Solar Salt Assume Land area
Field HTF min operating temp. 238 °c NREL SAM Solar field area 260.31 Acres NREL SAM
Field HTF max operating temp. 593 °c NREL SAM Total land area 416.51 Acres NREL SAM
Categories Values Reference &
Assumption
Categories Values Reference and
assumption
Collector and receiver Rated cycle conversion efficiency 0.397 NREL SAM
Receiver model type Evacuated tube Model Assume Design inlet temp. 525 °c NREL SAM
Absorber tube inner diameter 0.066 m NREL SAM Design outlet temp. 293 °c NREL SAM
Absorber tube outer diameter 0.07 m NREL SAM Boiler operating pressure 71 bar NREL SAM
Glass envelope inner diameter 0.115 m NREL SAM Cooling condenser type Air- Cooled Assumed
Glass envelope outer Diameter 0.12 m NREL SAM Thermal storage
Average field temp. difference at design 367 °c NREL SAM Full load hour of TES 6 hr. Assumed
Heat loss at design 166.25 w/m NREL SAM Storage volume 10482.8 m
3 NREL SAM
Power cycle Parasitic
Design gross output 111 MWe Assume Balance of plant parasitic 0.02467 MWe/MWcap [16]
Estimated gross to net conversion Factor 0.9 NREL SAM Auxiliary heater, boiler parasitic 0.02273 MWe/MWap [15]
Estimated net output at design(nameplate) 100 MWe NREL SAM Piping thermal loss coefficient 0.45/m
2 -k Assume
0
1
2
3
4
5
6
7
8
9
Jan Feb Mar Apr May June July Aug Sep Oct Nov Dec
DNI k
Wh/
m²/
Day
Average DNI of all Month In a Year
Fig. 7. Average DNI available at Udaipur/month.
r
t
h
i
a
b
p
t
4.2. System performance
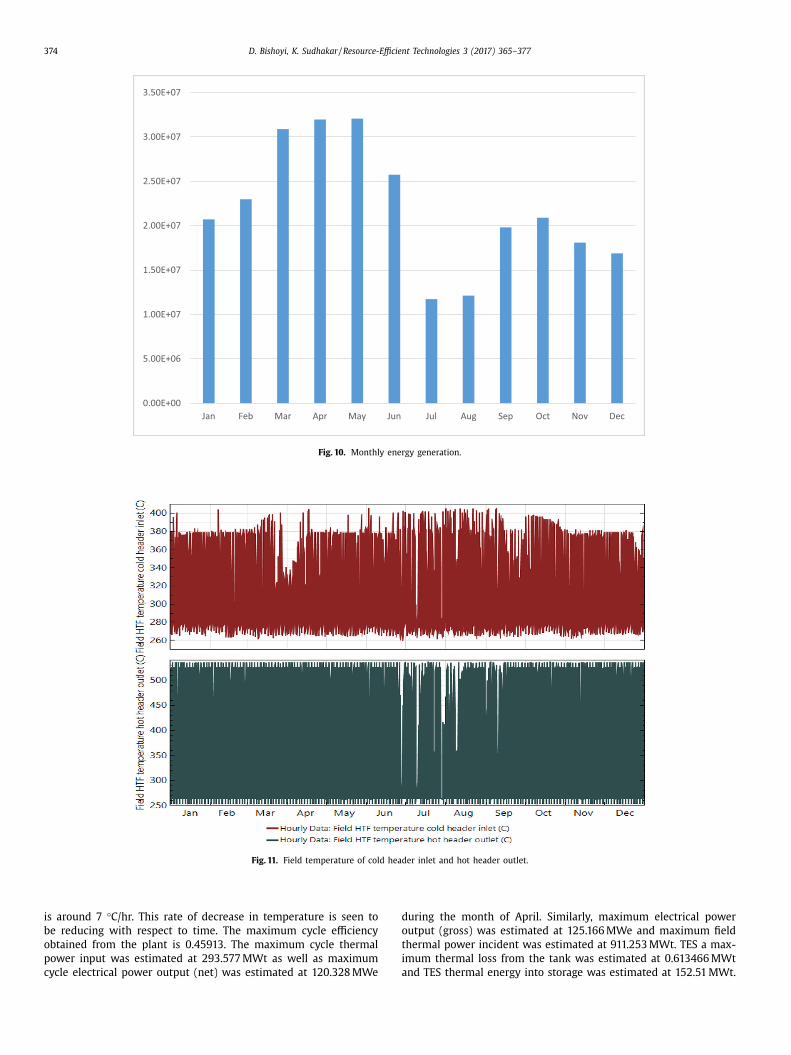
The simulation is carried out using SAM software. Month wise
energy generation from the hypothetical LFR solar thermal power
plant is given in Fig. 10 . It is found that the maximum energy was
generated during the month of May (32067.5 MWh), and minimum
energy was generated during the month of July (11739.1 MWh).
When the Heat Transfer Fluid (HTF) circulates from cold tank
to the hot tank, minimum temperature of the cold header inlet
eached a value of 263.041 °C. Similarly, the maximum tempera-
ure obtained at hot header outlet is 524.64 °C. The variation of
ot outlet and cold header inlet temperature for a day (24 hours)
s shown in Fig. 11 .
It is to be noted that the power generation starts only from 8.30
m, even though the sun rises at 6.30 am. At least 300 °C should
e maintained in the hot tank for proper starting of the power
lant. Otherwise, substitute fuel must be used to increase the tank
emperature. The temperature loss from HTF fluid HITEC solar salt
D. Bishoyi, K. Sudhakar / Resource-Efficient Technologies 3 (2017) 365–377 373
Fig. 8. Wind speed vs. dry bulb temp of the power plant location.
Fig. 9. Heat map of the beam irradiance (w/m
2 ) for one year.
374 D. Bishoyi, K. Sudhakar / Resource-Efficient Technologies 3 (2017) 365–377
0.00E+00
5.00E+06
1.00E+07
1.50E+07
2.00E+07
2.50E+07
3.00E+07
3.50E+07
Jan Feb Mar Apr May Jun Jul Aug Sep Oct Nov Dec
Fig. 10. Monthly energy generation.
Fig. 11. Field temperature of cold header inlet and hot header outlet.
d
o
t
i
a
is around 7 °C/hr. This rate of decrease in temperature is seen to
be reducing with respect to time. The maximum cycle efficiency
obtained from the plant is 0.45913. The maximum cycle thermal
power input was estimated at 293.577 MWt as well as maximum
cycle electrical power output (net) was estimated at 120.328 MWe
uring the month of April. Similarly, maximum electrical power
utput (gross) was estimated at 125.166 MWe and maximum field
hermal power incident was estimated at 911.253 MWt. TES a max-
mum thermal loss from the tank was estimated at 0.613466 MWt
nd TES thermal energy into storage was estimated at 152.51 MWt.
D. Bishoyi, K. Sudhakar / Resource-Efficient Technologies 3 (2017) 365–377 375
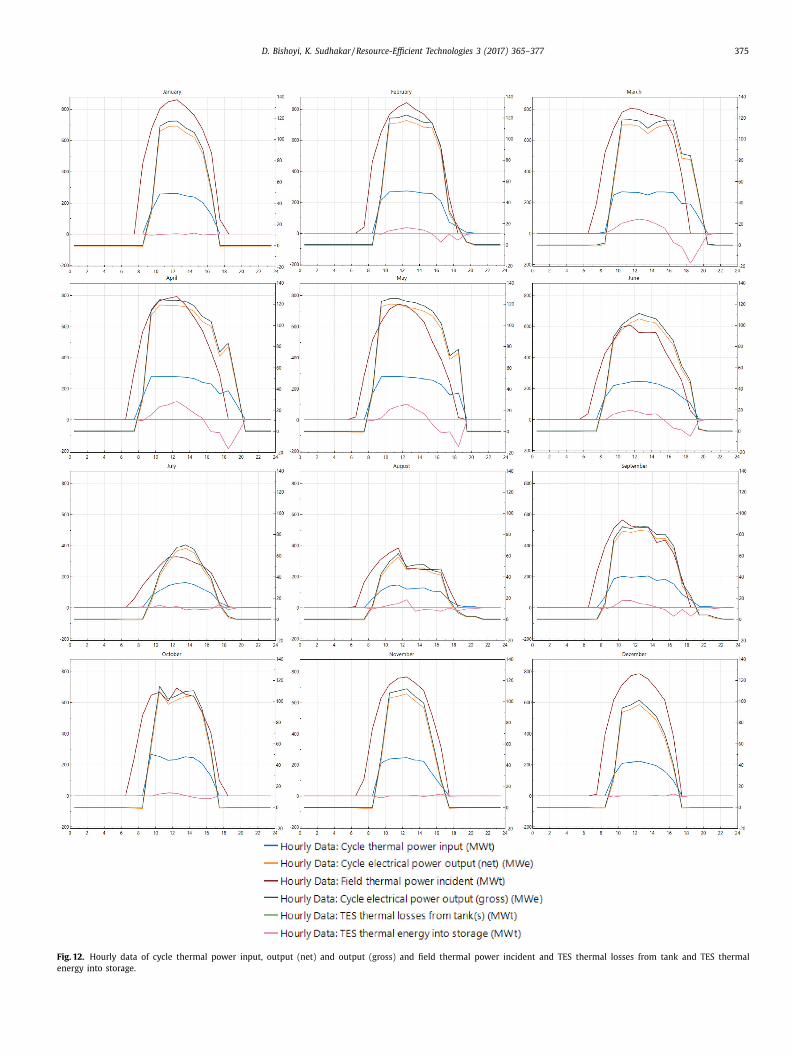
Fig. 12. Hourly data of cycle thermal power input, output (net) and output (gross) and field thermal power incident and TES thermal losses from tank and TES thermal
energy into storage.
376 D. Bishoyi, K. Sudhakar / Resource-Efficient Technologies 3 (2017) 365–377
0100020003000400050006000700080009000
10000
Jan Feb Mar Apr May Jun July Aug Sep Oct Nov Dec
Total Volume Hot Tank Cold Tank
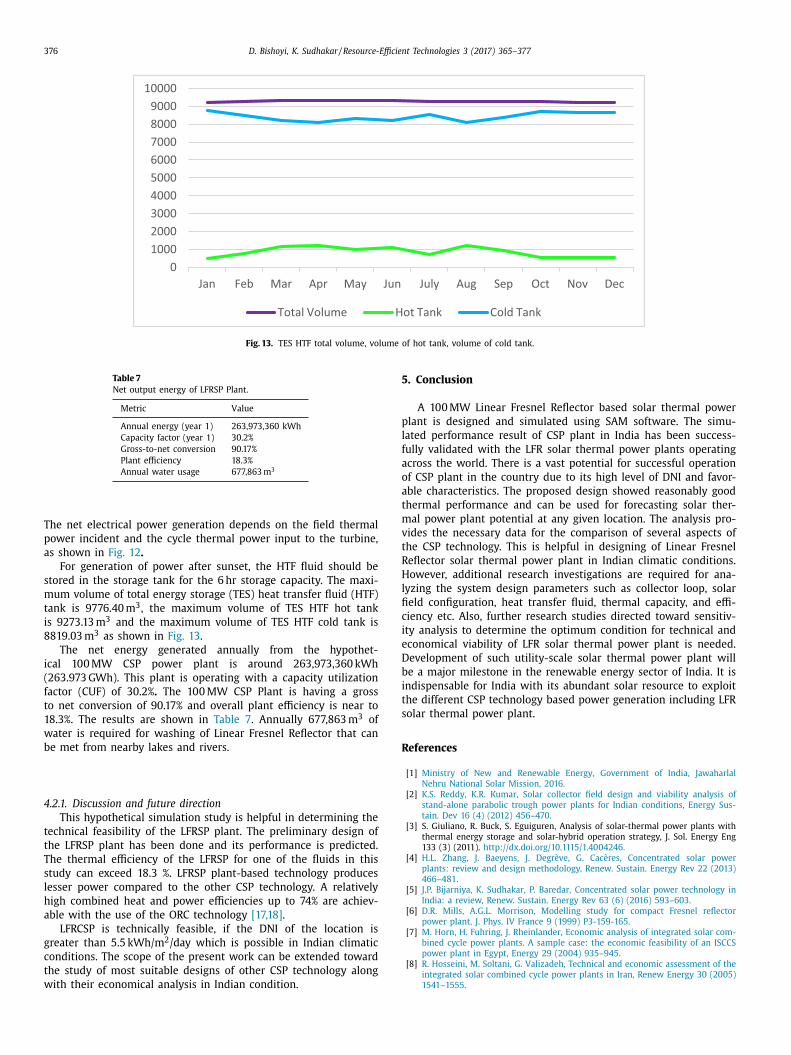
Fig. 13. TES HTF total volume, volume of hot tank, volume of cold tank.
Table 7
Net output energy of LFRSP Plant.
Metric Value
Annual energy (year 1) 263,973,360 kWh
Capacity factor (year 1) 30.2%
Gross-to-net conversion 90.17%
Plant efficiency 18.3%
Annual water usage 677,863 m
3
5
p
l
f
a
o
a
t
m
v
t
R
H
l
fi
c
i
e
D
b
i
t
s
R
The net electrical power generation depends on the field thermal
power incident and the cycle thermal power input to the turbine,
as shown in Fig. 12 .
For generation of power after sunset, the HTF fluid should be
stored in the storage tank for the 6 hr storage capacity. The maxi-
mum volume of total energy storage (TES) heat transfer fluid (HTF)
tank is 9776.40 m
3 , the maximum volume of TES HTF hot tank
is 9273.13 m
3 and the maximum volume of TES HTF cold tank is
8819.03 m
3 as shown in Fig. 13 .
The net energy generated annually from the hypothet-
ical 100 MW CSP power plant is around 263,973,360 kWh
(263.973 GWh). This plant is operating with a capacity utilization
factor (CUF) of 30.2% . The 100 MW CSP Plant is having a gross
to net conversion of 90.17% and overall plant efficiency is near to
18.3%. The results are shown in Table 7 . Annually 677,863 m
3 of
water is required for washing of Linear Fresnel Reflector that can
be met from nearby lakes and rivers.
4.2.1. Discussion and future direction
This hypothetical simulation study is helpful in determining the
technical feasibility of the LFRSP plant. The preliminary design of
the LFRSP plant has been done and its performance is predicted.
The thermal efficiency of the LFRSP for one of the fluids in this
study can exceed 18.3 %. LFRSP plant-based technology produces
lesser power compared to the other CSP technology. A relatively
high combined heat and power efficiencies up to 74% are achiev-
able with the use of the ORC technology [17,18] .
LFRCSP is technically feasible, if the DNI of the location is
greater than 5.5 kWh/m
2 /day which is possible in Indian climatic
conditions. The scope of the present work can be extended toward
the study of most suitable designs of other CSP technology along
with their economical analysis in Indian condition.
. Conclusion
A 100 MW Linear Fresnel Reflector based solar thermal power
lant is designed and simulated using SAM software. The simu-
ated performance result of CSP plant in India has been success-
ully validated with the LFR solar thermal power plants operating
cross the world. There is a vast potential for successful operation
f CSP plant in the country due to its high level of DNI and favor-
ble characteristics. The proposed design showed reasonably good
hermal performance and can be used for forecasting solar ther-
al power plant potential at any given location. The analysis pro-
ides the necessary data for the comparison of several aspects of
he CSP technology. This is helpful in designing of Linear Fresnel
eflector solar thermal power plant in Indian climatic conditions.
owever, additional research investigations are required for ana-
yzing the system design parameters such as collector loop, solar
eld configuration, heat transfer fluid, thermal capacity, and effi-
iency etc. Also, further research studies directed toward sensitiv-
ty analysis to determine the optimum condition for technical and
conomical viability of LFR solar thermal power plant is needed.
evelopment of such utility-scale solar thermal power plant will
e a major milestone in the renewable energy sector of India. It is
ndispensable for India with its abundant solar resource to exploit
he different CSP technology based power generation including LFR
olar thermal power plant.
eferences
[1] Ministry of New and Renewable Energy , Government of India , JawaharlalNehru National Solar Mission, 2016 .
[2] K.S. Reddy , K.R. Kumar , Solar collector field design and viability analysis ofstand-alone parabolic trough power plants for Indian conditions, Energy Sus-
tain. Dev 16 (4) (2012) 456–470 . [3] S. Giuliano, R. Buck, S. Eguiguren, Analysis of solar-thermal power plants with
thermal energy storage and solar-hybrid operation strategy, J. Sol. Energy Eng
133 (3) (2011). http://dx.doi.org/10.1115/1.4004246 . [4] H.L. Zhang , J. Baeyens , J. Degrève , G. Cacères , Concentrated solar power
plants: review and design methodology, Renew. Sustain. Energy Rev 22 (2013)466–481 .
[5] J.P. Bijarniya , K. Sudhakar , P. Baredar , Concentrated solar power technology inIndia: a review, Renew. Sustain. Energy Rev 63 (6) (2016) 593–603 .
[6] D.R. Mills , A.G.L. Morrison , Modelling study for compact Fresnel reflectorpower plant, J. Phys. IV France 9 (1999) P3-159-165 .
[7] M. Horn , H. Fuhring , J. Rheinlander , Economic analysis of integrated solar com-
bined cycle power plants. A sample case: the economic feasibility of an ISCCSpower plant in Egypt, Energy 29 (2004) 935–945 .
[8] R. Hosseini , M. Soltani , G. Valizadeh , Technical and economic assessment of theintegrated solar combined cycle power plants in Iran, Renew Energy 30 (2005)
1541–1555 .

D. Bishoyi, K. Sudhakar / Resource-Efficient Technologies 3 (2017) 365–377 377
[
[
[
[
[
[
[
[9] G. Morin , J. Derschb , W. Platzer , M. Eckd , A. Häberlee , Comparison of linearFresnel and parabolic trough collector power plants, Sol. Energy 86 (1) (2012)
1–12 . 10] Varun , I.K. Bhat , R. Prakash , Energy, economics and environmental impacts of
renewable energy systems, Renew. Sustain. Energy Rev 13 (2009) 2716–2721 . [11] M. Ashouri , F.R. Astaraei , R. Ghasempour , M.H. Ahmadi , M. Feidt , Thermody-
namic and economic evaluation of a small-scale organic Rankine cycle inte-grated with a concentrating solar collector, Int. J. Low-Carb. Tech (2015) 1–12 .
12] HITEC ® , Heat Transfer Salt Coastal Chemical. http://stoppingclimatechange.
com/MSR%20-%20HITEC%20Heat%20Transfer%20Salt.pdf , 2016 (Accessed 26 Au-gust 2016) .
13] K. Kaygusuz , Prospect of concentrating solar power in Turkey: the sustainablefuture, Renew. Sustain. Energy Rev 15 (2011) 808–814 .
14] . http://www.synergyenviron.com/tools/solar-irradiance , 2016 (Accessed 17 Au-gust 2016) .
15] H. Beltagy , D. Semmara , C. Lehautb , N. Saidc , Theoretical and experimentalperformance analysis of a Fresnel type solar concentrator, Renew Energy 101
(2017) 782–793 . 16] I. Bendato , L. Cassettari , M. Mosca , R. Mosca , Stochastic techno-economic as-
sessment based on Monte Carlo simulation and the Response Surface Method-ology: the case of an innovative linear Fresnel CSP (concentrated solar power)
system, Energy 101 (2016) 309–324 . [17] A.M. Elsafi, Exergy and exergoeconomic analysis of sustainable direct steam
generation solar power plants, Energy Convers. Manage 103 (2015) 338–347 .
18] C. Tzivanidis , E. Bellos , D. Korres , K.A. Antonopoulos , G. Mitsopoulos , Thermaland optical efficiency investigation of a parabolic trough collector, Case Stud.
Therm. Eng 6 (2015) 226–237 .


![RI *XWLpUUH] =DPRUD 0p[LFR](https://img.pdfslide.net/doc/110x75/61c53cd68a8082750a4980a4/ri-xwlpuuh-dprud-0plfr.jpg)