Embed Size (px)
Citation preview

Modeling and Simulation of Nuclear Medicine Patient ServiceManagement in DEVS
Eduardo Perez and Lewis Ntaimo∗
Department of Industrial and Systems EngineeringTexas A&M University
3131 TAMU, College Station, TX 77843, USA
Carla R. Bailey and Peter McCormackScott and White Clinic
2401 S. 31st Street Temple, Texas 76508, USA
Abstract
Increased demand for specialized health care services has been identified as one ofthe causes of increased health care costs in the U.S. Nuclear medicine, a sub-specialtyof radiology, uses relatively new technology to diagnose and treat patients. Procedures(tests) in nuclear medicine require the use of radiopharmaceuticals with a limited half-lifeand involve several steps that are constrained by strict time windows and require multipleresources for completion. Consequently, managing patient service in nuclear medicine is avery challenging problem with very little research attention. In this paper, we present adiscrete event system specification (DEVS) simulation model for nuclear medicine patientservice management that considers both patient and management perspectives. DEVSis a formal modeling and simulation framework based on dynamical systems theory andprovides well defined concepts for coupling components, hierarchical and modular modelconstruction, and an object oriented substrate supporting repository reuse. We report onsimulation results based on historical data using both patient and management performancemeasures. The results provide useful insights regarding the management of patient servicein nuclear medicine. While this work focuses on nuclear medicine, results will find generalityin other health care settings.
Keywords: Simulation, DEVS, health care, nuclear medicine, patient service, scheduling
1 Introduction
Health care costs in the U.S. have increased quickly in recent years and now exceed thosein other nations that provide similar, or better care for their citizens. Increased demandfor specialized services has been identified as one of the causes of this trend in U.S. healthcare costs. Speciality clinics such as nuclear medicine, a sub-specialty of radiology, use ap-pointment scheduling systems to manage patients. These clinics are affected by many factorssuch as patient behavior, staff experience, service time variability, equipment failures, andradiopharmaceutcals management, which have an impact on the way the appointment systemsperform. This paper focuses on patient service management in nuclear medicine, which usesnew technology to treat and diagnose patients. Nuclear medicine procedures/tests includePET CT scan, imaging test, heart stress and radiotherapy for lymphoma. Most of the testsrequire administering a radioactive isotope or radiopharmaceutical in order to take high qualityimages deep within the body and involve multiple scans during one day, or on multiple days.To successfully perform a nuclear medicine test, all the resources needed for each step of thetest must be available at specific times. If the test is not completed successfully, the patient
1
must be re-scheduled for another day. Therefore, scheduling patients, radiopharmaceuticals andresources to accommodate unforeseen disruptions (no-shows, late radiopharmaceutical delivery,breakdown of equipment, etc) is a very challenging problem for nuclear medicine departments.Furthermore, the characteristics of patient and resource management in nuclear medicine makeit a unique problem with little research work reported in the literature. The limitations imposedby the behavior and short life cycle of the radiopharmaceuticals, combined with the differenttypes of patient arrivals, random disruptions and resource availability, make the managementof patient service in nuclear medicine a complex problem.
The contributions of this research include the first (to the best of our knowledge) DEVSsimulation model for nuclear medicine patient service management. The model representsan advance toward improving patient service in health care with innovations in the way themodel is represented and implemented. The model incorporates both patient and resourcescheduling algorithms within the simulation framework. This in essence provides a noveldecision support system for assisting managers not only in patient and resource scheduling,but also in assessing their daily scheduling decisions and system performance. The simulationmodel enables system-level performance assessment, identification of potential bottlenecks, andintegration of scheduling and patient flow analysis. We report a computational study to quantifyimportant trade-offs among a patient and resource scheduling strategy currently used in areal nuclear medicine department and provide insights into the complexity of patient servicemanagement in nuclear medicine. While this paper focuses on nuclear medicine, we believe thatresults can be applied to many other systems that are not as complex as nuclear medicine, forexample, diagnostic imaging areas such as magnetic resonance imaging (MRI) and computedaxial tomography (CT scan).
In nuclear medicine, a typical test requires at least three resources: a radiopharmaceutical;technologist; gamma camera; and, sometimes, a nurse or EKG technician. Nuclear medicineequipment may cost up to a million dollars and therefore must be managed efficiently. Theschedule for radiopharmaceutical delivery, injecting the patient, and scanning must adhereto a specified protocol since radioactivity decays over time. For example, a scan made tooearly before the radiopharmaceutical has diffused adequately, or too late after excessive decayhas occurred, results in a poor image. If there is too much delay, the procedure must beterminated and repeated on another day, causing unnecessary exposure to radiation, poorutilization of resources, and increased cost. Furthermore, since relatively few pharmacies supplyradiopharmaceuticals, the dosages and delivery schedules depend on the lead time (hoursto days) required to supply the radiopharmaceuticals. A well designed system for patientservice management in nuclear medicine has to consider goals of both patients and departmentmanagers.
A viable approach to address the challenging problem of managing patient service in nuclearmedicine is modeling and simulation (M&S). In this paper, we consider a discrete event M&Sapproach for managing patient service in nuclear medicine. In particular, we use the discreteevent system specification (DEVS) formalism [1] to derive a generic simulation model for anuclear medicine patient service management that can be tailored to any real nuclear medicinedepartment. DEVS is a formal M&S framework based on dynamical systems theory andprovides well defined concepts for coupling components, hierarchical and modular model con-struction, and an object oriented substrate supporting repository reuse. Modular constructionis one of the most important characteristics of DEVS because it allows the modeler to designand construct each model independently for optimal efficiency. As long as models adhere to
2

certain protocols, they can interact which each other. In this work, we consider both the patientand management perspectives. Both points of view are very important for developing patientand resources scheduling policies, and for evaluating the performance of patient service andresource utilization. Patients are concerned with the level of service offered by the departmentwhile managers are also concerned with using their limited resources effectively.
The rest of the paper is organized as follows. In Section 2 we review closely relatedwork and provide preliminaries on DEVS in Section 3. We derive our simulation model anddescribe its hierarchical structure, operation and implementation in Section 4. We report ona computational study in Section 5 and end the paper with some concluding remarks anddirections for future research in Section 6.
2 Related Work
Medical facilities dedicated to the diagnosis and treatment of diseases are becoming morecritical in comprehensive health care systems. Mettler et al. [2] found that diagnostic medicalprocedures increased 5-to-6 fold whereas the U.S. population increased by approximately 50%.The increased demand for specialized services has been identified as one of the causes onincreases health care costs in the U.S. [3]. Hospital-based imaging facilities such as radiologydepartments are highly specialized and each may provide an unique set of services to patients.The equipment used for the diagnosis of diseases are usually very expensive and finding anefficient way of scheduling patients on these resources is a complex and dynamic task [4].Effective utilization of diagnostic facilities, which are used by almost every patient that entersa hospital, is a necessary condition for overall hospital efficiency [5].
Prior research on patient service management in nuclear medicine is very limited. Bothsimulation and optimization have been considered as viable approaches to patient and resourcescheduling in radiology. Most work in the literature seem to focus on scheduling outpatients[6, 7] without a focus on the complexities of nuclear medicine. In fact, Gupta and Denton [8]identified the problem of scheduling in health care highly constrained environments as a currentresearch open challenge. We refer the reader to recent surveys on outpatient appointmentscheduling by Cayirli and Veral [9] and Gupta and Denton [8].
Discrete event simulation [10, 1] has been used frequently to study this problem over thepast years; see Jun et al. [11]. This technique can be use to forecast the impact of changes inthe system, to examine resource needs or to investigate the relationships between variables ina system [12]. An early paper by Walter [13], built a simulation model of a hospital radiologydepartment to predict the effects of scheduling policies on the efficiency of the appointmentsystem, as measured by the average patient queueing time and doctor idle time during theday. Kho and Johnson [14] developed a computer model that simulates patient flow througha radiology facility that was used to identify causes of congestion and low productivity and topredict effects of changes in the system. Johannes and Wyskida [15] developed a model forscheduling patients and clinical instruments in a nuclear medicine department that minimizesthe equipment idle time. The authors used simulation to test the shortest-processing-time-first rule to schedule several patient classes in a nuclear medicine department. Only a limitednumber of procedures were studied and their heuristic assumes that the group of patientsrequiring service are known at the beginning of the day. Other work on the use of simulationto analyze staff allocations to improve patient flow in radiology departments include O’Kane[5], Klafehn [6], Centeno et al. [7], and Ramakrishnan et al. [16].
3

Several papers study variations of our problem using optimization techniques. For example,Conforti et al. [17] study optimization models for outpatient scheduling within a radiotherapydepartment, whereby patients have to visit the treatment center several times during the week.Green et al. [18] address the problem of scheduling randomly arriving patients of different typesin an MRI facility. They formulate the problem as a finite-horizon dynamic program for anappointment schedule that allows at most one patient per period and a single server, where onlyone patient can be served at a time. The authors derive properties of the optimal schedulingpolicies. Patrick et al. [19] study a similar problem but they characterize patients with differentpriorities. Patrick and Puterman [20] consider the problem of scheduling patients in a CT scandepartment. They formulate an optimization problem that returns a reservation policy thatminimizes the non-utilization of resources subject to an overtime constraint. Their approachassumes the use of a pool of patients that can be called to occupy unused time slots. Theauthors use simulation to demonstrate a reduction in outpatient waiting time. Standridge andSteward [21] propose a simulation model that includes a control logic for patient scheduling. Thesystem presented by the authors schedules patients within a simulation framework. Vermeulenet al. [4] devise an adaptive approach to automatic optimization of resource calendars in a CTscan facility. They implement a simulation model for a case analysis to demonstrate that theirapproach makes efficient use of resources’ capacity.
Patient satisfaction in outpatient clinics may be difficult to quantify since it depends on theway patients perceive the service received. Several performance measures have been identifiedin the literature as the most commonly used for evaluating patient service satisfaction in healthcare clinics. Waiting time Type 1, is the time a patient waits from the time he/she calls for anappointment until the date of the appointment [22, 23, 24]. Waiting time Type 2 is the timea patient waits from the time he/she arrives at the clinic to the time when service is started[22, 25, 26, 7]. The percentage of time a patient requests for an appointment and is satisfied[18, 27] and the time the patient spends in the system [28, 29] were the last ones identified.Besides patient satisfaction, health care managers are concerned with the profitability of thebusiness. In particular, nuclear medicine department managers understand that providing ahigh level of service to their patients is important for the business. But this requires improvingother areas such as human resource overtime [25, 26], resource utilization [22, 26, 7], and patientthroughput [16]. Those performance measurements have been used commonly in literature torepresent the management’s perspective.
3 Preliminaries
To provide a mathematical foundation for the proposed simulation models, we first reviewsome preliminaries on DEVS. The reader familiar with DEVS may skip this section. In thiswork we use the Parallel DEVS formalism [1] to construct the simulation model for a nuclearmedicine department. Parallel DEVS is a revision of the classical DEVS formalism [30]. Ituses a hierarchical approach to build complex models starting with the basic or atomic model,and then coupling the atomic models to create coupled (composite) models. An atomic modelhas to be in a defined state at any time and has input and output ports through which allinteraction with the environment is mediated. External events arising outside the model arereceived through the input ports, and the model description determines how the model respondsto them. All internal events arising within the model change its state and manifest themselvesas events on the output ports to be transmitted to other models. Communication between
4

models is enabled via the couplings.Unlike Classical DEVS, Parallel DEVS allows all imminent components to be activated and
send their outputs to other components of the system. DEVS has a well defined concept ofsystem modularity and component coupling to form coupled models. This leads to the propertyof closure under coupling which justifies treating coupled models as components and enableshierarchical model composition construct. Since several DEVS simulators have already beendevelopment and validated, the models developed in this work will be executed by the existingDEVS simulators. Consequently, the focus of this paper is on simulation modeling and notsimulation algorithms.
Let M denote an atomic model with a set of input ports IPorts, a set of input values(events) Xp, a set of output ports OPorts, and a set of output values (events) Yp. We denoteby (p, v) the port-value pair. Then a basic Parallel DEVS is a structure defined as follows [1]:
DEV S = (XM , YM , S, δext, δint, δcon, λ, ta) (1)
where,
XM = {(p, v)|p ∈ IPorts, v ∈ Xp} is the set of input ports and values, where IPorts isthe set of input ports;
YM = {(p, v)|p ∈ OPorts, v ∈ Yp} is the set of output ports and values;
S is the set of sequential states;
δext : Q × XbM → S is the external transition function, where Xb
M is a set of bags overelements in XM and Q is the set of total states;
δint : S → S is the internal state transition function;
δcon : Q×XbM → S is the confluent transition function;
λ : S → Y bM is the output function;
ta : S → R+0,∞ is the time advance function; and
Q := {(s, e)|s ∈ S, 0 ≤ e ≤ ta(s)} is the set of total states, where s is the state and e isthe elapsed time.
Note that a bag is a set with possible multiple occurrences of its elements. This allowsParallel DEVS to handle multiple inputs. Definition (1) can be interpreted as follows: At anytime the system is in some state s and if no external events occur, the system will not changestate for a time ta(s) ∈ [0,∞]. When this time expires the system outputs the value, λ(s),and changes to state s′ = δint(s). An output is only possible after an internal transition. If anexternal event x ∈ XM occurs when the system is total state (s, e) with e ≤ ta(s), i.e., beforeexpiration time, the system changes to state s′ = δext(s, e, x). The external transition functiondictates the system’s new state when an external event occurs, while the internal transitionfunction dictates the system’s new state when no events occurred since the last transition. Theconfluent function decides the next state in cases of collision between external and internalevents.
The DEVS formalism includes the means to construct models from components. Thespecification includes the external interface, the components (DEVS models), and the couplingrelations. Let EIC, EOC and IC denote the external input coupling, external output couplingand internal coupling, respectively. Then a coupled model N can be defined mathematically asfollows:
5

N = (X,Y, D, {Md | d ∈ D}, EIC, EOC, IC) (2)
where,X = {(p, v)|p ∈ IPorts, v ∈ Xp}
is the set of input ports and values and
Y = {(p, v)|p ∈ OPorts, v ∈ Yp}
is the set of output ports and values. D is the set of component names, and for each d ∈ D,
Md = (Xd, Yd, S, δext, δint, δcon, λ, ta)
is a DEVS model withXd = {(p, v)|p ∈ IPortsd, v ∈ Xp}
andYd = {(p, v)|p ∈ OPortsd, v ∈ Yp}.
The external input coupling, EIC, connect external inputs to component inputs:
EIC ⊆ {((N, ipN ), (d, ipd)) | ipN ∈ IPorts, d ∈ D, ipd ∈ IPortsd}. (3)
The external output coupling, EOC, connect external outputs to component outputs:
EOC ⊆ {((N, opd), (N, opN )) | opN ∈ OPorts, d ∈ D, opd ∈ OPortsd}. (4)
Lastly, the internal coupling, IC, connect component outputs to component inputs:
IC ⊆ {((a, opa), (b, ipb)) | a, b ∈ D, opa ∈ OPortsa, ipb ∈ IPortsb}. (5)
We should point out that in DEVS no output port of a component may be connected to an inputport of the same component, i.e., ((a, opa), (b, ipb) ∈ IC implies a 6= b. In other words, no directfeedback loops are allowed for each component. Armed with the above characterizations, weare now in a position to derive several atomic and coupled DEVS models for nuclear medicinepatient service management.
4 Simulation Model
The practical setting of a nuclear medicine department involves several resources, which includehumans and equipment, procedures/tests and performance measures. We start by describingthese entities in the context of model abstraction and then derive the corresponding atomic andcoupled models that constitute the nuclear medicine simulation model.
4.1 Model Abstraction
We conceptualize a nuclear medicine department model involving human and equipment re-sources, stations, and patients. We classify these entities by considering their roles and theinteractions they have within the model.
6

Human Resources
We distinguish between four types of human resources: technologists, nurses, physicians, andmanagers. We capture the behavior of each human resource by taking into account the expertiseand experience. Human resources that have been executing their tasks for several years areexpected to complete their tasks more rapidly compared to those human resources that havelesser experience. The set of activities each type of human resources can perform depends onthe expertise. Table 1 lists some of the activities that can be performed by each type of humanresource.
Table 1: Human resources responsibilities in nuclear medicineTechnologist Nurses Physicians Managers
IV access IV access IV access IV access
Radiopharmaceutical Radiopharmaceutical Radiopharmaceutical Radiopharmaceuticaladministration administration administration administration
Draw doses Draw doses Draw doses Draw doses
Radiopharmaceutical Radiopharmaceuticalpreparation preparation
In our simulation model we represent each human resource type as a separate atomicmodel, capable of receiving messages containing their schedules. A schedule includes times(and stations) when the human resource will serve patients. When it is time to serve a patientthe human resource travels to the appropriate station according to the schedule. Travel timefrom the human resource’s office to each station is known.
Procedures/Tests
Nuclear medicine procedures/tests are essential in medical specialties such as cardiology, pe-diatrics and psychiatry. The procedures are usually requested by physicians by calling thenuclear medicine clinic to ask for an appointment for their patients. The procedures providephysicians with information about structure and function of the human body (diagnosis) butare also used for disease treatment. Table 2 lists several nuclear medicine procedures and theircurrent procedural terminology (CPT) codes.
Table 2: Examples of nuclear medicine procedures.CPT Code Name
78465 Cardiovascular Event (CVE)Myocardial Imaging (SP-M)
78815 Positron Emission Tomography (PET)/Computed Tomography (CT) skull to thigh
78306 MSB-bone imaging (whole body)
78315 MSC-bone imaging (three phase)
78223 GIC-Hepatobiliary imaging
78472 CVJ-cardiac blood pool (muga)
78585 REB-Pulm perfusion / ventilation
78006 ENC-Thyroid imaging (upt. sing)
78195 HEE-Lymphatic imaging
78464 CVD-Myocardial img (SP-R ORS)
Each procedure images a specific organ and requires the administration of at least one
7

radiopharmaceutical. The number of steps for each procedure may range from 3 to 11. Theduration of each step may vary depending on the experience of the human resource in charge,however it must be completed within the time window stipulated by protocol for the procedure.As an example, the CVE/SP-M procedure is described in Table 3. This procedure involvesfour steps and require the use of two different radiopharmaceuticals. This procedure takesa minimum of 95 minutes to complete and requires the involvement of at least two humanresources. Table 4 shows the steps for the PET/CT procedure. In this procedure only oneradiopharmaceutical is needed.
Table 3: Procedure 78465: Cardiovascular Event (CVE) Myocardial Imaging (SP-M)Step Activity Time (min.) Station Human Resource
Technologists;1 I.V. Start 5 TRT 1, 2 & 3 Nurse;
Manager
2 Stress EKG 30 Treadmill 1 & 2; EKG Tech
3 Patient Wait 30-60 Waiting room
Axis 1, 2, & 3; Technologists;4 Imaging 30 P2000A & B, P3000 Nurse;
Manager
Table 4: Procedure 78815: Computed Tomography (CT) skull to thighStep Activity Time (min.) Station Human Resource
Technologists;1 IV Start 10 TRT 1, 2 & 3 Nurse;
Manager
Meridian; Technologists;2 Adm. Radioph. 5 TRT 1, 2 & 3; Nurse;
Axis 1, 2, & 3; ManagerP2000A & B
3 Patient Wait 60 Waiting room
Axis 1, 2, & 3; Technologists;4 Imaging 45 Meridian;
P3000, P2000A & B Manager
Stations and Equipment
A nuclear medicine department has separate stations for performing specific procedures/tests.We conceptualize stations as spaces where patients are served by human resources. Everystation has at most one type of nuclear medicine equipment. We classify stations based onthe type of equipment in the station. Nuclear medicine equipment includes different typesof gamma cameras and treadmills. Our simulation model incorporates an atomic model foreach equipment, an atomic model that represents a room, and a coupled model for a station.The station coupled model represents both the room space and the equipment in the station.Before starting any activity at any station, the model has to verify that all the entities neededto perform the procedure have arrived. For example, to administer a radiopharmaceutical thehuman resource, patient and the radiopharmaceutical needed to perform this activity must bein the station. The time spent by these entities in the station will depend on the protocol for
8

performing the procedure/test, experience of the human resource, and on the type of equipmentinvolved.
Patients
Patient service requests are usually managed by a call center. A receptionist is in charge oftaking care of these requests by finding an appointment for the patient. In the simulation modelwe represent the call center by a scheduler atomic model. This atomic model is in charge ofpatients’ schedules. We also have a call generator atomic model that generates patient servicerequests during the simulation. Patients will always ask for one procedure and, in some cases,they will also provide a day of preference for the appointment. The scheduling of patientsdepends on the algorithm or rules available in a given nuclear medicine department. Scheduleinformation is passed to all the models involved in the scheduling. First, human resources whoseschedules were affected by the inclusion of a new patient are notified. Secondly, notificationsare sent to the models that are in charge of generating patients and radiopharmaceuticals atthe time of the appointment.
Performance Measures
Since our nuclear medicine patient service management approach involves both patient andmanagement perspectives, we design the models so that important information pertaining toboth perspectives is captured during each simulation run. We derive a transducer atomicmodel, which is responsible for collecting this information and for computing statistics ofinterest to the modeler. In particular, we use performance measures that have been seenin the literature. Table 5 gives the selected performance measures that we used to evaluatepatient service satisfaction in health care clinics. Besides being concerned about the quality
Table 5: Performance measures for patient satisfaction in health care.Name Description References
Waiting time Time patient wait from the time of [22]type 1 calling for an appointment until the
date of the appointment
Preference Percentage of times patient request for [18]ratio an appointment is satisfied
Cycle time Time patient spent on the system [28],[29]
of service they provide to their patients, nuclear medicine managers have to watch for theprofitability and operation of the business. Their main concern is to provide a high quality ofservice but also make the best use of the available resources. Table 6 gives the performancemeasures that are commonly used in the literature from a management’s perspective in healthcare clinics. We use these measures in our simulation model to asses system performance of anuclear medicine department based on the patient and resource scheduling algorithm/rule usedby the department. Such scheduling algorithm/rule is discussed in detail in Section 5.
4.2 Atomic and Coupled Models
We derive several atomic and coupled models to build the simulation model. We derive anatomic model for each of the following human resources: Manager (MANGR), Technologist
9

Table 6: Managers performance measurements.Name Description References
Equipments’ Maximize utilization [22],utilization [26]
Human resources’ Most adequate number of human [26],utilization resources while maximizing [7]
utilization
Patient Number of patients served per day [16]throughput
(TECH), Nurse (NURSE), Receptionist (RCPST) and Physician (PHYS). Similarly, we derivean atomic model for Equipment (EQUIP) resources including Treadmill, Axis Gamma Camera,TRT Gamma Camera and P2000 Gamma Camera. We also derive an atomic model for nuclearmedicine department rooms (ROOM) such as the Waiting Room, Treadmill Room, Axis CameraRoom, TRT Camera Room and P2000 Camera Room. Note that the names of the rooms arebased on the equipment inside the room. So by coupling the ROOM and EQUIP atomic models,we build a nuclear medicine department station (STATION) coupled model. We should pointout that atomic models are generic representations of the different types of entities used innuclear medicine. So in the simulation the models are instantiated with different attributes torepresent the unique or different entities in nuclear medicine.
Next, we couple the above models to build a nuclear medicine department coupled modelcalled NMD. To model call requests, patient arrivals, and radiopharmaceutical arrivals, wederive atomic models for Call Generator (CGEN), Scheduler (SCHED), Scheduled PatientGenerator (PGENR), Radiopharmaceutical Generator (RPGENR) and Transducer (TRANSD).These models are coupled together to build an Experimental Frame (EF) coupled model. Theoverall simulation model results from coupling NMD and EF.
We are now in a position to provide mathematical descriptions of the models. However, dueto space limitation we focus only on three atomic models, TECH, EQUIP, and SCHED, whichare critical to the operation of a nuclear medicine department. In what follows, × denotes thecartesian product of sets and ∧ denotes the logic AND operation.
TECH Atomic Model
We consider a TECH atomic model having input and output ports as shown in Figure 1. Themodel has three basic input ports, namely; “in”, “set”, and “update”, and two types of outputports, namely; “out” and “roomx”. The number of output ports of type “roomx”, x = 1, · · · , n,depends on the number of rooms n in the nuclear medicine facility. The TECH atomic modelsreceives external input via the input ports and transmits output information via the outputports. The input port “in” is for receiving a message to make the model ready or active forwork at the beginning of the simulation. A new schedule for the technologist is sent throughthe “set” port, while any updates to the schedule are sent through the “update” port. The“out” output port allows for transmitting information to the TRANSD atomic model. The restof the output ports transmit information to the rooms associated with the technologist.
The TECH (technologist) atomic model has eight basic states, namely; idle, get schedule,waiting, update schedule, travel to, travel from, serve patient and wait here. We depict the be-havior of the atomic model using the state (transition) diagram shown in Figure 2. Mathematically,
10

in
set
update
out
station1
station2
.
.
.
stationn
TECH
Figure 1: A basic TECH (technologist) atomic model
get_schedule
idle waiting
update_schedule
travel_to
travel_from
serve_patient
wait_here
set sched update
if p ==
“update” if tw== 0
if tt== 0
if tpd== 0 &travel == false
if tpd== 0 &travel == true
if tt== 0
if tu== 0if tg== 0
initialize
if tw== 0
Figure 2: State transition diagram for TECH atomic model
the TECH atomic model can be defined in Parallel DEVS as follows:
DEV STECH = (XM , YM , S, δext, δint, δcon, λ, ta) (6)
where,
XM = {(p, v)|p ∈ IPorts, v ∈ Xp}is the set of input ports and values, where
IPorts = {“in”,“set”, “update”},and for p =“in”; Xin = V1; for p =“set”, Xset = V2; and for p =“update”, Xupdate = V3. Thesets V1, V2 and V3 are arbitrary sets. The set
YM = {(p, v)|p ∈ OPorts, v ∈ Yp}is the set of output ports and values, where
OPorts = {“out”,“station1”, “station2”, · · · , “stationn”}.The sets Yout, Ystation1, Ystation2, · · · , Ystationn are arbitrary sets. The set
S = {“idle”, “get schedule”, “waiting”, “travel to”, “serve patient”,
11

“wait here”, “travel from”} × <+,0 × V1 × V2 × V3
is the set of sequential states.
External Transition Function:
δext((phase, σ, sched), e, (p, v))
= (“idle”, ∞, sched), if p == “in”
= (“get schedule”, tg, sched), if phase == “idle” ∧ p == “set”mysched = computeEventDelays(sched);
= (“waiting”, tw, sched), if phase == “get schedule”tw = getWaitDelay();
= (“update schedule”, tu, sched), if phase == “waiting” ∧ p == “update”mysched = updateEventDelays(sched);
= (“idle”, ∞, sched), if phase == “waiting” ∧ mysched == ∅= (phase, σ − e, sched), otherwise.
Internal Transition Function:
δint((phase, σ, sched), e, (p, v))
= (“travel to”, tt, sched), if phase == “waiting” ∧ travel == true
tt = getTravelDelay();
stationID = getStationID();
= (“serve patient”, tpd, sched), if phase == “travel to”tpd = getProcedureDelay();
= (“wait here”, tw, sched), if phase == “serve patient” ∧ travel == false
tw = getWaitDelay();
= (“serve patient”, tpd, sched), if phase == “wait here”tpd = getProcedureDelay();
= (“travel from”, tf , sched), if phase == “serve patient” ∧ travel == true
tt = getTravelDelay();
= (“wait”, tw, sched), if phase == “travel from”tw = getWaitDelay().
Confluence Function:
δcon(s, ta(s), x) = δext(δint(s), 0, x).
Output Function:
λ(phase, σ, sched)
= (out, stats);
= (stationi, msgi) if phase == “travel to” ∧ stationID == i, where msgi is themessage to send to the Station coupled model for station i = 1, ..., n.
12

Time Advance Function:
ta(phase, σ, sched) = σ.
Observe that the confluent function performs an internal transition before the externaltransition. In other words, no preemptions are allowed. The operation of the TECH atomicmodel can be described as follows. When an input is received on the “set” input port, themodel transitions to the “get schedule” state, where a computeEventDelays() method is calledto retrieve the technologist’s schedule for the day. The model transitions to “waiting” stateafter obtaining the schedule. If an input is received on the “update” input port while themodel is in the “waiting” state, a transition to the “update schedule” state is performed andthe method updateEventsDelay() is called to update the technologist’s current schedule. Aftercompleting the schedule update the model transitions back to the “waiting” state. The modelgoes into the “travel to” state when its time to serve the next patient in the schedule, andremains in that state until the travel time to the patient location has elapsed. It then goes intothe “serve patient” state. The state “serve patient” involves performing a procedure based onthe nuclear medicine test prescribed for the patient.
As an example, suppose that a technologist has to perform the nuclear medicine test CPTCode 78465 (see Table 3) on a patient. This test involves the following activities: IV start(5minutes), stress EKG (30 minutes), patient wait (30-60 minutes), imaging (30 minutes), andcomputer process (15 minutes). Let us assume that the technologist has to perform IV start andimaging on the patient, and that the duration of each activity is deterministic. Then the TECHatomic model would transition from the “waiting” state to “travel to” state at the scheduledtime and remain in that state for a delay of tt minutes, which is the amount of time it takes toget to the IV room. Next, the model would transition to “serve patient” for IV start for a delayof ts = 5 minutes. After the delay elapses, the model would transition from “serve patient”to “travel from’ for a delay of tf minutes, that is, the amount if time it takes to travel fromthe IV room to the technologist’s office. Finally, the model transitions from “travel from” to“waiting”.
Depending on the technologist’s schedule, the TECH model either remains in the “waiting”for some delay tw, or repeats the process if another patient has to be served. However, whenits the scheduled time to travel to the imaging room, the model has to be in the “waiting”state, from where it would transition to “travel to” for a tf minutes delay, before moving to“serve patient”. This time to model goes into the “serve patient” state to perform imaging for adelay of tpd = 30 minutes. Upon completion of the delay, the model transitions to “travel from”for a delay of tf for the imaging room, and finally to the “waiting” state to wait for the nextactivity in the schedule.
EQUIP Atomic Model
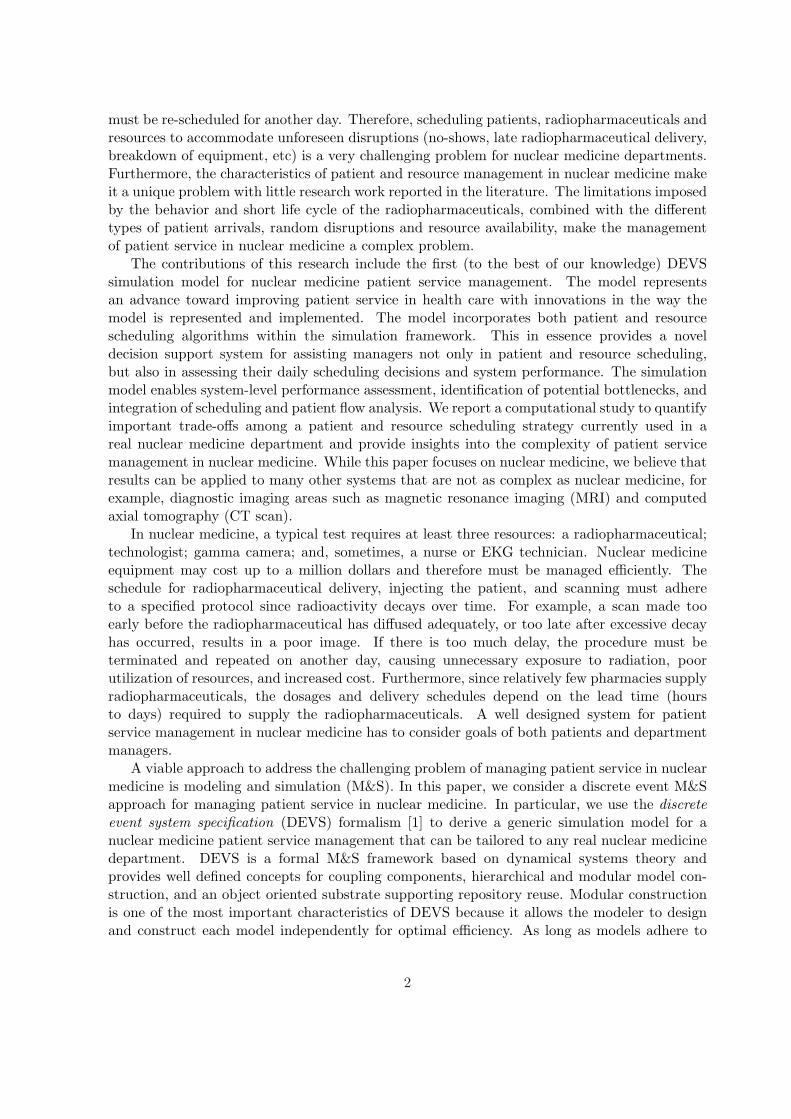
The EQUIP atomic model has one input port “in” and one output port “out” as shown inFigure 3. The EQUIP atomic model has two states, “idle” and “busy”. The behavior of thisatomic model is depicted in Figure 4.
The model is initialized in “idle” state and transitions to the “busy” state if an input isreceived via the “in” port. A method is called to compute the amount of time the model willstay “busy” just before transition. This amount of time will depend on the task the equipmenthas to perform. Let us call this method getTaskDuration() and we will use it in expressingthe model in parallel DEVS. When in “busy” state the model does not respond to any inputs,
13
in outEQUIP
Figure 3: A basic EQUIP (equipment) atomic model
idle
busy
if tp== 0if p==“in”
initialize
Figure 4: State transition diagram for EQUIP atomic model
implying that the equipment is busy. Once the amount of time has elapsed, the model returnsto the “idle” state. As we mentioned earlier, the EQUIP atomic model is coupled to a Room(ROOM) atomic model. The coupling between these two models will be discussed later in thepaper. The “out” port of the EQUIP atomic model is used to transmit information to theROOM atomic model. We can now define EQUIP in Parallel DEVS as follows:
DEV SEQUIP = (XM , YM , S, δext, δint, δcon, λ, ta) (7)
where,XM = {(p, v)|p ∈ IPorts, v ∈ Xp}
is the set of input ports and values, IPorts = {“in”}, and Xin = V1 is an arbitrary set. Theset
YM = {(p, v)|p ∈ OPorts, v ∈ Yp}is the set of output ports and values, OPorts = {“out”}, and Yout is an arbitrary set. The set
S = {“idle”, “busy”} × <+0 × V1
is the set of sequential states.
External Transition Function:
δext((phase, σ, task), e, (p, v))
= (“busy”, tp, task), if phase == “idle” ∧ p == “in”,tp = getTaskDuration(task);
= (phase, σ − e, task), otherwise.
Internal Transition Function:
δint((phase, σ, task), e, (p, v))
14

= (“idle”, ∞, task), if phase ==“busy” ∧ tp == 0
Confluence Function:
δcon(s, ta(s), x) = δext(δint(s), 0, x).
Output Function:
λ(phase, σ, task)
= (out, msg) if phase == “busy”, where msg is the message to send to the ROOMatomic model.
Time Advance Function:
ta(phase, σ, task) = σ.
SCHED Atomic Model
The SCHED atomic model is in charge of accommodating patients and resources into the systemschedule. We allow the modeler to use or implement a scheduling algorithm of their choice.The SCHED atomic model in shown in Figure 5. It has one input port “call in” and threetypes of output ports, namely; “patient out”, “radioph out” and “hres x out”. The numberof outport ports of type “hres x out” depends on the number of human resources available inthe nuclear medicine facility. The information transmitted by these ports is used to update thehuman resources’ schedules. The ‘patient out” and “radioph out” output ports are used to sendinformation to the Patient Generator (PGENR) atomic model and the RadiopharmaceuticalGenerator (RPGENR) atomic model, respectively.
call_in
patient_out
hres_1_out
hres_2_out.
.
.
hres_n_out
SCHED
radioph_out
Figure 5: A basic SCHED (scheduler) atomic model
The operation of the SCHED atomic model is depicted in Figure 6. The model has threebasic states: “idle”, “update schedule”, and “scheduling”. The model is initialized in the “idle”state. A transition to the “scheduling” state occurs when the model is in the “idle” state anda message is received at the “call in” input port. A method, getPatientSchedule(); takes theinformation provided by the patient and performs the scheduling using the algorithm chosenby the user. If the scheduling is successful, the model transitions to the “update schedule”state, where the schedules for the resources selected in serving the patient are updated. Aftercompleting the schedule updates, the model transitions to the “idle” state. Otherwise, ifscheduling is unsuccessful, the model transitions from “scheduling” state back to the “idle”state.
Mathematically, the SCHED atomic model can be expressed in Parallel DEVS as follows:
DEV SSCHED = (XM , YM , S, δext, δint, δcon, λ, ta) (8)
15

idle
update_schedule
scheduling
if search ==
false
initialize
if p ==
“call_in”
if search ==
true
done
Figure 6: State transition diagram for SCHED atomic model
where,XM = {(p, v)|p ∈ IPorts, v ∈ Xp}
is the set of input ports and values, IPorts = {“call in”}, and Xcall in = V1 is an arbitrary set.The set
YM = {(p, v)|p ∈ OPorts, v ∈ Yp}is the set of output ports and values, and OPorts = {“patient out”, “radioph out”, “hres 1 out”,“hres 2 out”, · · · , “hres n out”}, where Ypatient out, Yradioph out, Yhres 1 out, Yhres 2 out, · · · , Yhres n out
are arbitrary sets. The
S = {“idle”, “update schedule”, “busy”} × <+,0 × V1
is the set of sequential states.
External Transition Function:
δext((phase, σ, calli), e, (p, v))
= (“scheduling”, ts, calli), if phase == “idle” ∧ p == “call in”,appointment = getPatientSchedule(calli);
= (phase, σ − e, calli), otherwise.
Internal Transition Function:
δint((phase, σ, calli), e, (p, v))
= (“update schedule”, tu, calli), if phase == “scheduling” ∧ search = true;
= (“idle”, ∞, call i), if phase == “update schedule”;
= (“idle”, ∞, call i), if phase == “scheduling” ∧ search = false;
Confluence Function:
δcon(s, ta(s), x) = δext(δint(s), 0, x).
16

Output Function:
λ(phase, σ, calli)
= (patient out, patienti), if phase == “update schedule”, where patienti is themessage to send to PGENR;
= (radioph out, radiophi), if phase == “update schedule”, where radiopi is themessage to send to the RPGENR;
= (hres i out, msgi), if phase == “update schedule” ∧ hresID == i, where msgi
is the message to send to the atomic model for human resource i = 1, ..., n.
Time Advance Function:
ta(phase, σ, calli) = σ.
We omit the mathematical definitions for the rest of the atomic models, CGENR, PGENR,RPGENR and TRANSD, and instead devote the rest of this subsection to explain some ofthe coupled models used to create the simulation model. All the coupled models are coupledaccording to the three types of connections (EIC, EOC, and IC ) defined in Equations 3, 4 and5, respectively. We start with the STATION coupled model. As shown in Figure 7, the model iscreated by coupling EQUIP and ROOM. STATION has three input ports, namely; “patient in”,“radioph in”, and “hres in”. EICs exist between the input ports and the ROOM atomic model.Two ICs connect EQUIP with ROOM. Information is passed to EQUIP via ROOM when aninput has been received on STATION’s input ports. The STATION coupled model has twotypes of output ports, “patient out” and “hres n out”. The number of output ports of type“hres n out” depends on the number, n, of human resources in the nuclear medicine facility.The information transmitted by the outport ports is used to notify when a patient or humanresource has been released from the room. This only happens when the ROOM atomic modelreceives information from the EQUIP atomic model notifying the service performed on thepatient has been completed.
patient_in
patient_outEQUIP
patient_in
patient_out_e
ROOM hres_in
patient_out
hres_1_out
hres_2_out
.
.
.
hres_n_out
patient_out
radioph_in
patient_in
radioph_in
hres_in
patient_out
hres_1_out
hres_2_out
hres_n_out
STATION
Figure 7: The STATION coupled model
17

The next model is the NMD coupled model shown in Figure 8. This model is a representationof the nuclear medicine department (NMD) and is created by coupling the human resourceatomic models (TECH, NURSE, RCPST, PHYSN, MANGR) to STATION. In the figure weonly show human resource models TECH, NURSE and MANGR due to limitation in figuresize.
NMD
patient_in
radioph_in
hres_in
patient_out
hres_�
_out
hres_�_out
hres_�_out
STATION
in
set
update
out
station�TECH
in
set
update
out
station�NURSE
in
set
update
out
station�MANGR
��� hres_�_out
hres_�_out
patient_out
out
set
set
set
update
update
update
patient_in
radioph_in
update
From EF To EF
Figure 8: The NMD coupled model
The last coupled model is the Experimental Frame (EF) shown in Figure 9. The EF allowsthe modeler to specify the kind of experiments that should be performed on NMD to enableanswering questions of interest. Therefore, the EF is coupled to NMD (as depicted by thearrows) to create the overall simulation model for a nuclear medicine facility. The figure showsthe atomic models that are part of EF and the way they are connected. CGENR is an atomicmodel of a telephone call center and is in charge of generating telephone call messages for patientappointment requests. This model allows the user to specify the telephone call arrival rate andthe associated probability distribution. The generated appointment requests are received andprocessed by the SCHED atomic model. SCHED allows the user to select an algorithm forscheduling patients (and the needed resources) into the system. The schedule information ispassed from SCHED to the RPGENR and PGENR atomic models. RPGENR models theordering and arrival of radiopharmaceuticals at the facility at the scheduled time. PGENRmodels the actual arrival of patients to the nuclear medicine facility at their appointmenttimes. To compute the performance measures of interest (described in Section 4.1), we createdthe transducer (TRANSD) atomic model. The TRANSD atomic model collects informationfrom NMD and computes performance measures of interest.
4.3 NMD System Entity Structure
A system entity structure (SES) is used to plan, generate and evaluate design of simulation-based systems. This is a scheme that organizes a set of possible structures of a system. Alibrary of models is generated when all the components abstracted from the real system areimplemented. The SES is used to classify these components by their characteristics and toorganize them in a hierarchical composition. This representation allows the modeler to visualizethe system as a whole. The goal of the SES is to synthesize a simulation model by traversinga model hierarchical structure. A SES represents not a single model structure, but a family ofstructures from which a candidate entity structure can be selected.
18

CGENR SCHEDcall_in
TRANSD PGENR
radioph_out
hres_1_out
hres_2_out
patient_out
hres_in
equip_in
patient_in
EF
hres_in
equip_in
patient_in
hres_1_out
hres_2_out
radioph_out
patient_out
RPGENR
patient_in
From NMD
t
To NMD
Figure 9: The EF coupled model
The SES for the NMD simulation model is shown in Figure 10. At the top level, the scheme
EF_NMD
ef_nmd_dec
EF
ef_dec
GENR
genr_spec
CGENRPGENR
TRANSD
RPGENR
SCHED
NMD
nmd_dec
HR
STATION
hr_dec
TECHNURSE MANGR PHYS
tech_spec
NRTech EKGTech
station_dec
ROOM
EQUIP
equip_dec
GAMMC TREADM
gammc_spec
IMSPECT IMAG
room_spec
CAMERASTRESS WAIT
Figure 10: System Entity Structure
shows the two major coupled models that define the system structure. The Experimental Frame(EF) branch is decomposed into three branches that are assigned to the Transducer(TRANSD),Generator(GENR) and Scheduler(SCHED) atomic models. The double line under the GENRbranch means specialization. The Generator model is categorized into specialized entities suchas the Patient Generator(PGENR), Call Generator(CGENR) and the RadiopharmaceuticalGenerator(RPGENR). The NMD branch is decomposed into two branches: Human Resource(HR) and Station (STATION). The HR branch is decomposed into four branches, each definea different type of human resource existing in nuclear medicine. The Technologist (TECH)
19

can be specialized into Nuclear Radiology Technologist and EKG Technologist. The STATIONbranch is decomposed into two branches. A selection constraint, depicted as dotted arrowfrom Gamma Camera (GAMMC) and Treadmill (TREADM) specializes entities to ROOM.Specialization entities mean that those entities cannot be selected independently. Finally,GAMMC is specialized into image with SPEC capability (IMSPEC) and image (IMAG).
4.4 Model Implementation, Verification and Testing
We implemented the NMD simulation model in DEVSJAVA [31], a Java-based modeling andsimulation software implementation of DEVS formalisms such as Parallel DEVS. We tested andverified each atomic and coupled model using DEVSJAVA Simulation Viewer Version (SimView)1.0.4. SimView allows the modeler to visually inspect the behavior of each model created inDEVSJAVA. Atomic models were verified first because they serve as building blocks for coupledmodels. Every component is represented with their input and output ports. Couplings amongthe various models are also represented for coupled models.
Figure 11: SimView window
SimView has the advantage of having several convenient functionalities that include allowingthe user to start and stop the simulation at any time during the simulation run, fast-forwardingor slowing down the simulation, and being able to input user defined parameters created formodel verification and testing by simply clicking on a model’s input port and selecting thedesired option from the pop-up menu. To run a simulation, the user selects the appropriatemodel from the top menu on the SimView window and click the run button. During thesimulation run the simulation clock is displayed on the window. Parameters and statistics ofare displayed as well by positioning the mouse cursor on top of the model block.
20

5 Application
We applied the NMD simulation system to the nuclear medicine department of the Scottand White Health System in Temple, Texas. This nuclear medicine department is one ofthe largest fully-accredited nuclear laboratories for general nuclear imaging and non-imaging,nuclear cardiology and positron emission tomography (PET) scan in the country. This facilityoperates five days a week from 8:00 am to 5:00 pm, and is not open on weekends. There aresixteen fulltime physician support staff budgeted in this department. Every member of thegroup performs specific tasks that depend on the staff specialty. The department has eighttechnologists and two EKG technologists. This staff group has several responsibilities thatinclude the preparation and administration of the radiopharmaceuticals, drawing doses andimaging acquisition. Electrocardiogram (EKG) technicians perform stress exams for cardiactests. A nurse assists with the radiopharmaceutical administration and drawing doses. Thedivision manager can also assist with those activities in the absence of one of the regular staff.The department also has two fulltime nuclear medicine physicians, two radiology residents, anda staff cardiologist.
There are seven gamma cameras (one Philips PRISM 3000, two Philips PRISM 2000, threePhilips AXIS and one Philips Meridian). Five of these cameras are planar, and are capableof doing 2D whole-body imaging and 3D Single Photon Emission Computed Tomography(SPECT). The other two cameras are also planar, one is SPECT capable for a small fieldof view only and the other is for imaging only. The stress cardiac area comprises a nursestation and three stress rooms. Two of the stress rooms have treadmills. The third room isfor chemical stress testing for patients who cannot walk on a treadmill. All three are equippedwith EKG capability. In the PET facility, there is one PET imaging camera, three patientpreparation rooms for I.V. starts and waiting time, and a radiopharmaceutical receiving room.Around 60 different procedures are performed in this department. Table 2 (Section 4.1) showsthe procedures that were performed more frequently at the clinic during the year of our study.
Patient calls are answered by three receptionists. Patients may provide a preferred day inwhich they would like to come to the clinic. A search for an appointment is first done by tryingto satisfy that preference. However, if an appointment is found where the patient waits morethan a month to be served, the preference provided is disregarded and an alternative earlierappointment is provided. Resource scheduling is performed using a load balancing routine.Nevertheless some human resources (technologists) from the staff are fixed to specific stations.Human resources assigned to stations take care of the stations where the equipments utilizedthe most are located. Our nuclear medicine department fixes technologist 1 and technologist 2to station Axis1 and station Axis2 respectively. The rest of the staff is scheduled to the otherstations.
We conducted preliminary experiments to validate our simulation model and to gain man-agement insights into the impact of the existing scheduling approach on patient service. Theperformance measures identified in the literature (Section 4.1) were used to quantify servicelevels based on both patient and management perspectives. We used the following configurationfor the nuclear medicine department simulation model: 7 gamma cameras, 2 stress rooms, 1PET positron camera, 10 technologists, 1 nurse and 1 manager. Based on historical data weassumed Poisson arrivals for the patient appointment calls of about 90 calls per day on average.
In our computational study, we used historical information regarding patients who wereserved at the facility during a particular year. Appointment calls were received every 7 minutes
21

on average. About 70% of those calls were for outpatients, who made appointments in advancesince they did not require to be served immediately. The patients in this class are expected toarrive on time to their appointments but on average 1% of the time they arrived late, 1% of thetime they canceled their appointment, and 1% of the time they did not show up. The patientswho required to be served immediately comprised the other 30%, half of which were inpatientswho required to be served on the same day. The other half were emergency patients who neededto be served as soon as possible. To randomly generate a nuclear medicine procedure for eachpatient, we used an empirical distribution based on historical data for the procedures that wereperformed during that year.
5.1 Computation Results
This section reports the results of using simulation to investigate the behavior of the system ina variety of scenarios when the scheduling rules established by the nuclear medicine departmentto manage patients and resources are used. We conducted three sets of experiments that differin the number of patient calls the clinic receives per day. The appointment call interarrivalprocess is set to follow an exponential distribution. First we consider a scenario where theclinic receives a high volume of calls (HVC). In this scenario, the mean interarrival time forappointment calls is set at 5 minutes. For the second set of experiments we used historicaldata to obtain a mean interarrival time for each month of the year. In this scenario, the meaninterarrival times represent the real volume of calls (RVC) received at the clinic during a year.The values of these mean interarrival times range from 6 minutes to 10 minutes. Finally, a 10minutes mean interarrival time is used for the third set of experiments to observe the behaviorof the system under a low volume of appointment calls (LVC). We made 20 replications foreach simulation run and used a scheduling time horizon of 12 months with a warm-start periodof 3 months. To maintain independence among the replications, we used different seeds forthe random number generators in the simulation. All the computational experiments wereconducted on a DELL Optiplex GX620 with a Pentium D processor running at 3.0GHz with3.5GB RAM.
The simulation results are reported in the tables and figures below. All the results for theRVC set of experiments are within 15% of the actual results for that year, hence validating ourresults. Table 7 shows for each set of experiments the mean and standard deviation (STDEV)of the simulation CPU time, the total number of patients served, and patient throughput. Thetotal number of patients served and the type of procedures performed determine the revenueto the department. The simulation times for the NMD system are small, a desirable propertyof the simulation model especially when quick answers regarding the patient service operationsare needed. However, there is a noticeable difference between the HVC experiments and LVCexperiments which can be explained by the fact that more entities are handled by the systemwhen the interarrival times are lower. As expected the results show that the largest number ofpatients are served under the HVC experiment. Appointment calls will arrived more frequentlyand more patients are accommodated into the system.
The number of patients served per month for each experiment are reported in Figure 12.The results show a general trend of decreasing patient throughput throughout the year for theRVC set of experiments. This corresponds to the decrease in demand during that year basedon the actual records.
The corresponding utilization of nuclear medicine equipment for the year is given in Table 8and the mean values plotted in Figure 13. The graph shows that for the RVC experiments most
22

Table 7: Simulation time, patients served and system throughputHVC RVC LVC
Mean StDev Mean StDev Mean StDev
CPU Time (secs) 1213.09 27.09 685.45 11.20 324 0.21
Patients Served 16005.43 51.25 15020.30 109.97 8640 5.72
patients/day 66.69 0.21 62.58 0.46 36 0.02
Figure 12: Number of patients served per month
of the equipment is utilized around 70% of the time. Higher of utilization of the equipmentswas achieved under the HVC experiments but the numbers were close to those in the RVCexperiments.
Table 8: Equipment percent (%) utilizationHVC RVC LVC
Mean StDev Mean StDev Mean StDev
Treadmill(1) 75.91 0.68 71.84 0.93 41.20 0.42
Treadmill(2) 75.98 0.61 71.85 0.98 41.18 0.38
TRT(1) 41.08 0.69 36.56 0.83 17.53 0.40
TRT(2) 35.17 0.69 32.15 0.84 16.09 0.23
TRT(3) 32.77 0.64 30.28 0.58 15.25 0.47
Axis(1) 80.11 0.49 77.04 0.56 49.55 0.39
Axis(2) 80.03 0.58 77.01 0.45 49.86 0.31
Axis(3) 84.63 0.69 78.78 0.75 43.95 0.34
P2000(1) 84.68 0.56 78.55 0.80 43.81 0.41
P2000(2) 84.51 0.67 78.69 0.78 43.55 0.44
P2000(3) 79.90 0.66 74.00 0.86 39.91 0.36
Meridian(1) 83.48 0.42 81.04 0.47 50.97 0.48
The utilization of human resources is reported in Table 9 and plotted in Figure 14. Weincluded a load balancing routine so that assignment of human resources to patients is evenly
23

Figure 13: Equipment percent (%) utilization
done. However, the manager decides on which human resources to fix to specific stationsand thus load balancing is only done for those resources that are not fixed. Consequently,the utilization of Technologist 1 and Technologist 2 is relatively higher for all experiments.As mentioned earlier, these two technologists are fixed to specific stations (management’spreference) where most of the procedures were actually scheduled. Also, observe that on thecontrary, the utilization of Technologist 8, Manager and Nurse are significantly reduced. Theworkload of theses three human resources is take up by Technologists 1 and 2.
Table 9: Human resource percent (%) utilizationHVC RVC LVC
Mean StDev Mean StDev Mean StDev
Technologist(1) 80.07 0.49 49.53 0.39 77.02 0.55
Technologist(2) 79.99 0.58 49.85 0.31 76.99 0.44
Technologist(3) 74.69 0.79 41.34 0.63 70.92 0.78
Technologist(4) 74.07 0.63 40.69 0.53 70.57 0.61
Technologist(5) 73.94 0.71 41.03 0.59 70.42 0.67
Technologist(6) 74.14 0.84 41.39 0.34 70.78 0.66
Technologist(7) 74.05 0.73 40.77 0.39 70.34 0.78
Technologist(8) 67.19 0.52 33.58 0.33 62.19 0.76
Technologist(9) 76.20 0.68 41.36 0.42 72.12 0.93
Technologist(10) 76.28 0.61 41.34 0.39 72.13 0.98
Nurse(1) 32.75 0.50 12.00 0.43 28.32 0.78
Manager(1) 49.58 1.37 17.05 0.61 41.06 1.08
Table 10 shows the average number of days a patient has to wait from the day of the call tothe day of the appointment (waiting time Type 1 ). As expected, patients wait less under theLVC experiments with a waiting time of about three days. The HVC experiments reported anaverage wait of about 39 days, which is caused by the higher demand for service and for not
24

Figure 14: Human resource percent (%) utilization
having the resources needed at the nuclear medicine department to satisfy such demand.Finally, Table 11 reports on the preference ratio (Section 4.1), that is, the percentage of
time the preference asked by the patient was satisfied. The HVC set of experiments reporteda 9% of preference ratio which is significantly low. This result is explained by noticing thatschedules are mostly full during the year and patients end up scheduled in the limited spacesavailable.
Table 10: Average waiting time days (Type 1 ) from patient call to appointmentHVC RVC LVC
Mean StDev Mean StDev Mean StDev
39.24 0.33 7.72 0.36 2.76 0.02
Table 11: Percentage (%) of time patient preference is satisfiedHVC RVC LVC
Mean StDev Mean StDev Mean StDev
9 5.14 80.76 0.63 97.06 0.06
6 Conclusion
Managing patient service in nuclear medicine is a very challenging problem with very littleresearch attention. In this paper, we use the discrete event system specification (DEVS)formalism to derive a generic simulation model for nuclear medicine patient service managementthat takes both patient and management perspectives. DEVS is a formal M&S framework basedon dynamical systems theory and provides well defined concepts for coupling components,
25

hierarchical and modular model construction, and an object oriented substrate supportingrepository reuse. We implement and validate the simulation model based on a real nuclearmedicine setting and report computational results based on a scheduling algorithm and severalpatient and management performance measures. The results provide useful insights into patientservice management in nuclear medicine. For example, a higher demand for service cannegatively affect the level of service provided to the patient if resources are not managedefficiently. Thus it is up to the nuclear medicine clinic to alter their resource capacity fora given demand and patient preferences in order to maintain a high level of service.
While this work focuses on nuclear medicine, we believe that results will find generalityin patient service management in other health care settings. It also provides several futureresearch directions. For example, the current simulation model can be extended to a stochasticone using stochastic DEVS (SDEVS), which allows for modeling atomic model state transitionsas a stochastic process. One can also envision stochastic optimization algorithms for schedulingpatients and resources, which can be based on mathematical programming or stochastic onlineoptimization. Finally, the current work can be extended to a simulation-optimization setting,whereby the simulation model provides feedback to stochastic optimization scheduling algo-rithms with the objective of making optimal decisions based patient and the nuclear medicinemanagement perspectives.
Acknowledgments. The first two authors are grateful to Mr. Wayne Stockburger (Scott andWhite Hospital) for his interest in this work and for providing access to the historical data forvalidating the models and algorithms. They also thank Dr. Wilbert W. Wilhelm for usefulfeedback on an earlier version of the paper.
References
[1] B.P. Zeigler, T.G. Kim, and H. Praehofer. Theory of Modeling and Simulation. AcademicPress, Inc. Orlando, FL, USA, 2000.
[2] F.A. Mettler, M. Bhargavan, B.R. Thomadsen, D.B. Gilley, J.A. Lipoti, M. Mahesh,J. McCrohan, and T.T. Yoshizumi. Nuclear medicine exposure in the united states, 2005-2007: Preliminary results. In Seminars in Nuclear Medicine, volume 38, pages 384–391.Elsevier, 2008.
[3] J. Zhang. Growth in u.s. health-care spending slows again. The Wall Street Journal, A2,2007. January 9.
[4] I.B. Vermeulen, S.M. Bohte, S.G. Elkhuizen, H. Lameris, P.J.M. Bakker, and H.L. Poutre.Adaptive Resource Allocation for Efficient Patient Scheduling. Artificial Intelligence InMedicine, pages 1–22, 2008.
[5] P.C. O’Kane. A Simulation Model of a Diagnostic Radiology Department. EuropeanJournal of Operational Research, 6:38–45, 1981.
[6] K.A. Klafehn. Impact Points in Patient Flows through a Radiology Department providedthrough Simulation. In Proceedings of the 19th conference on Winter simulation, pages914–918, 1987.
26

[7] M.A. Centeno, C. Albacete, D.O. Terzano, M. Carrillo, and T. Ogazon. A SimulationStudy of the Radiology Department at JMH. In Proceedings of the 2000 Winter SimulationConference, volume 2, pages 1978–1984, 2000.
[8] D. Gupta and B. Denton. Appointment Scheduling in Health Care: Challenges andOpportunities. IIE Transactions, 40(9):800–819, 2008.
[9] T. Cayirli and E. Veral. Outpatient Scheduling in Health Care: A Review of Literature.Production and Operations Management, 12(4):519–549, 2003.
[10] A.M. Law and W.D. Kelton. Simulation Modeling and Analysis. McGraw-Hill HigherEducation, 1997.
[11] J.B. Jun, S.H. Jacobson, and J.R. Swisher. Application of Discrete-Event Simulation inHealth Care Clinics: A Survey. Journal of the Operational Research Society, 50(2):109–123,1999.
[12] L. Moreno, RM Aguilar, CA Martin, JD Pineiro, JI Estevez, JF Sigut, and JL Sanchez.Patient-centered simulation to aid decision-making in hospital management. Simulation,74(5):290, 2000.
[13] S.D. Walter. A Comparison of Appointment Schedules in a Hospital RadiologyDepartment. British Journal of Preventive and Social Medicine, 27(3):160–167, 1973.
[14] J.W. Kho and G.M. Johnson. Computer Simulation of Hospital Health Care DeliverySystem. In Proceedings of the 1976 Winter Simulation Conference. Association forComputing Machinery, 1976.
[15] J.D. Johannes and R.M. Wyskida. A Nuclear Medicine Patient/Instrument SchedulingModel. The International Journal of Management Science, 6(6):523–530, 1978.
[16] S. Ramakrishnan, K. Nagarkar, M. DeGennaro, M. Srihari, A.K. Courtney, and F. Emick.A Study of the CT Scan Area of a Healthcare Provider. In Proceedings of the 2004 WinterSimulation Conference, volume 2, 2004.
[17] D. Conforti, F. Guerriero, and R. Guido. Optimization Models for Radiotherapy PatientScheduling. 4OR: A Quarterly Journal of Operations Research, 6(3):263–278, 2007.
[18] L.V. Green, S. Savin, and B. Wang. Managing Patient Service in a Diagnostic MedicalFacility. Operations Research, 54(1):11–25, 2006.
[19] J. Patrick, M.L. Puterman, and M. Queyranne. Dynamic multi-priority patient schedulingfor a diagnostic resource. Operations Research, 56(6):1507, 2008.
[20] J. Patrick and M.L. Puterman. Improving Resource Utilization for Diagnostic Servicesthrough Flexible Inpatient Scheduling: A Method for Improving Resource Utilization.Journal of the Operational Research Society, 58(2):235–245, 2007.
[21] C.R. Standridge and D. Steward. Using Expert Systems for Simulation Modeling of PatientScheduling. Simulation, 75:148–156, 2000.
27

[22] T.R. Rohleder and K.J. Klassen. Rolling Horizon Appointment Scheduling: A SimulationStudy. Health Care Management Science, 5(3):201–209, 2002.
[23] J. Atlason, M.A. Epelman, and S.G. Henderson. Call center staffing with simulation andcutting plane methods. Annals of Operations Research, 127(1):333–358, 2004.
[24] J. Atlason, M.A. Epelman, and S.G. Henderson. Optimizing call center staffing usingsimulation and analytic center cutting plane methods. Management Science Forthcoming,page 15, 2007.
[25] P.M. Vanden Bosch and D.C. Dietz. Minimizing Expected Waiting in a MedicalAppointment System. IIE Transactions, 32(9):841–848, 2000.
[26] B.T. Denton, A.S. Rahman, H. Nelson, and A.C. Bailey. Simulation of a Multiple OperatingRoom Surgical Suite. Proceedings of the 2006 Winter Simulation Conference, pages 414–424, 2006.
[27] D. Gupta and L. Wang. Revenue Management for a Primary-Care Clinic in the Presenceof Patient Choice. Operations Research, 56(3):576, 2008.
[28] V. Podgorelec and P. Kokol. Genetic Algorithm Based System for Patient Scheduling inHighly Constrained Situations. Journal of Medical Systems, 21(6):417–427, 1997.
[29] T.R. Rohleder and K.J. Klassen. Using Client-variance Information to Improve DynamicAppointment Scheduling Performance. Omega, 28(3):293–302, 2000.
[30] B.P. Zeigler. Theory of Modeling and Simulation. Wiley Interscience, New York, USA,1976.
[31] B.P. Zeigler and H. Sarjoughian. Introduction to DEVS modeling &simulation withJAVATM: Developing Component-based Simulation Models. Tucson/Tempe, Arizona, USA,2003. Accessed from http://www.acims.arizona.edu.
28