Embed Size (px)
DESCRIPTION
Robert Muir-Wood, Chief Research Officer at RMS, shares his research and insight into natural catastrophes in Southeast Asia, and the complex issue of modeling insured exposures in the region.
Citation preview

MODELLING INSURED EXPOSURES AGAINST THE NEXT SOUTHEAST ASIAN CATASTROPHE
Robert Muir-Wood, RMS Bangkok March 20th 2013

©2013 Risk Management Solutions, Inc.
THE LAST BIG SOUTH EAST ASIAN CATASTROPHE: 2011 THAI RIVER FLOODS
• 1,215 factories across 33 provinces submerged
A shock for many people: • Thai government • Facility owners • CROs of companies dependent on supplies • insurers • reinsurers • Cat modelers
- $46Bn economic loss - 9% decline in 2011 Q4 GDP

©2013 Risk Management Solutions, Inc.
WERE THE 2011 THAI FLOODS MANMADE?
The Dam Ambiguity
•Is a dam being operated to conserve water or to prevent floods?
•As droughts are more common water conservation tends to win – as in 2011
•Can only operate for both with sophisticated algorithms taking into consideration long range forecasts
•For next few years in Thailand - dam operators will be more concerned with flood prevention!
9 major dammed river catchments in Thailand

©2013 Risk Management Solutions, Inc.
REACTIVE RISK MANAGEMENT: RAISED FLOOD DEFENCES AT THE PARKS
•
Bangkadi Bang-Pa
Rojana Navanakorn

©2013 Risk Management Solutions, Inc.
• In 2011 unreinforced earth embankments around industry parks failed through piping and breaching
• Reinforced defences now raised (c 1.5m) at all the principal industrial estates flooded in 2011
• New defences have reduced Thai river flood insured losses at these industrial estates dramatically – single site flood is now beyond 500 year RP
REACTIVE RISK MANAGEMENT: RAISED FLOOD DEFENCES AT THE PARKS

©2013 Risk Management Solutions, Inc.
THE ‘SHUTTING THE STABLE DOOR AFTER THE HORSE HAS BOLTED’ CAT MODELING AGENDA
•As a result of the new flood walls the next major insured catastrophe loss in SE Asia will not be Thai river flood
•Do we need probabilistic catastrophe models of all relevant perils and regions?
•Is there another way in which to comprehend the correlated risk?

©2013 Risk Management Solutions, Inc.
MICHAEL PORTER’S 1990 COMPETITIVE ADVANTAGE OF BUSINESS CLUSTERS
•Professor at Harvard Business School. Leading thinker around international business strategy
•Studied how sectoral ‘business clusters’ in developed countries had fostered competitive advantage by increasing productivity through proximity
•forcing competitive innovation
•stimulating the creation of new businesses
Widely adopted in SE Asia

©2013 Risk Management Solutions, Inc.
INDUSTRY PARKS IN SE ASIA
Since 1990 many rapidly growing countries without primary resources have employed the sectoral cluster model as their principal tool for driving development The initial role of the Government is:
•to identify the target sector •develop the initial infrastructure on an extendable site •create tax incentives •invite anchor ‘sogoshosha’ firms (who will bring other suppliers in their ‘keiretsu’)

©2013 Risk Management Solutions, Inc.
WHAT IS THE CHANCE MULTIPLE INDUSTRIAL PARKS ARE AFFECTED BY THE SAME CAT?
0 20 40 60 80
Saha Rattana Nakorn
Rojana
Wangnoi (Factory Land)
Hi-Tech
Bangpa-In
Navanakorn
Bangkadi
Number of days closed
•Flat (for production lines) •Cheap •Not previously built on •Expandable site
= Floodplain

©2013 Risk Management Solutions, Inc.
Industry Parks
•Large concentrations of industry sector linked manufacturers •Can cover many km2 •Commonly in the hinterland of principal city •High insurance penetration •Often in flood plains •Several parks may be in the same hazard footprint
THE CHARACTERISTICS OF SE ASIA INSURANCE RISK
International Supply Chains
Critical supply chain linkages to major manufacturers far away in Japan, US or Germany. •Separation distance irrelevant • However goods pass through critical seaports/airports •Industry sector -specific linkages not related to spatial proximity
City Centres and CBDs Tourist Centers
•Major business offices, hotels and shopping malls •International companies and hotel chains •In the largest capital cities •Concentrated around the CBD

©2013 Risk Management Solutions, Inc.
THE TOPOLOGY OF INSURED EXPOSURE IN SE ASIA
<2% of all properties are
insured • However these are the highest value properties • And highly concentrated
Need to understand the motivations for exposure concentration And the degree to which the ‘concentrators’ relate to risk
Value deciles
Insurance penetration
US
Thailand
Normalized insured exposure separation
distance
Log distance km
US
SE Asia
0.1 1 10 100

©2013 Risk Management Solutions, Inc.
New Orleans 2005
Rapidly sinking delta Large areas of city below sea level Over extraction of groundwater Poorly maintained surge flood defences In the path of frequent tropical cyclone storm surges Home to 450,000 people Well rehearsed evacuation plans
A TALE OF TWO CITIES
Bangkok 2015
Rapidly sinking delta Large areas of city below sea level Over extraction of groundwater Inadequate surge flood defences In the path of infrequent tropical cyclone storm surges Home to 8.5 million people No evacuation plans

©2013 Risk Management Solutions, Inc.
STORM SURGE FLOOD IN MYANMAR 2008 NARGIS
•No-one had previously considered this track •One of two ‘worst case’ storms/tracks for Irrawaddy delta •No similar storm surge observed over past Century •No education around the risk •No evacuation plan •No forecast passed on to the people •More than 100,000 died
Bangkok

©2013 Risk Management Solutions, Inc.
GUANDONG & PEARL RIVER DELTA STORM SURGE
Areas below sea level in purple
•120 million people •13.45% average growth since 1978 •9 major cities •Shenzen – biggest port in China after Shanghai

©2013 Risk Management Solutions, Inc.
TSUNAMI FROM LUZON ARC SUBDUCTION ZONE
• business was locate dhere
•Luzon Arc Mw9.3 event •Maximum tsunami heights •Da Nang, Vietnam (952,000 population)

©2013 Risk Management Solutions, Inc.
THE MANILA RISK CONCENTRATION
•Major concentration of risks in Manila
•Volcanoes to the north, west and south
•Flood zones in and around city and Laguna de Bay
•Potential storm surge for slow moving track to the north of the city
•Local M7 earthquake on Valley Fault
•M9 earthquake and accompanying tsunami on Luzon Arc subduction zone

©2013 Risk Management Solutions, Inc.
PRINCIPAL INDUSTRIAL CLUSTERS IN SE ASIA
•For each cluster we know the specific companies and industry sectors in the park •Intelligence that can support locating the exposure

©2013 Risk Management Solutions, Inc.
Example #1: Pukou, Jiangsu - west of Shanghai High tech and machinery manufacture on Yangtze river
SIGNIFICANCE OF KNOWING WHERE THE SPECIFIC INDUSTRY IS SITUATED: RMS TYPHOON FLOOD MODELLING
Example #2 : Pearl River Delta (Guangdong)
Multiple parks engaged in hi-tech assembly, large portion of Foxconn (Apple) industry, right on the coast
Jiangsu Coordinate Province AAL 0.07 0.01
100 y RPL 2.10 0.47
Guangzhou Coordinate Province AAL 0.06 0.02
100 y RPL 1.30 0.60

©2013 Risk Management Solutions, Inc.
LOSS ACCUMULATION MANAGEMENT
•Multiple views of risk available & multiple PMLs can be applied •Capacity management at aggregate zone-level
Country Resolution Resolution Value
Building PML
Content PML
BI PML
Thailand Postcode 10250 15% 10% 5%
Thailand Postcode 10510 15% 15% 5%
Thailand Postcode 25190 15% 10% 5%
Thailand Postcode 10560 15% 15% 5%
Thailand Postcode 25000 20% 10% 5%
Thailand Postcode 25130 20% 50% 5%
Thailand Postcode 12170 20% 50% 5%

©2013 Risk Management Solutions, Inc.
Geolocation Significance •VRG hazard consistently higher than province level hazard •Results for a nationwide survey of 10 industrial parks •Industrial parks often situated in fluvial and coastal flood zones
IMPACT OF LOCATION DATA ON RISK

©2013 Risk Management Solutions, Inc.
• Definition of Risk = Probability of an event occurring and the impact of that event
– 10-day downtime once per year, and 10-day downtime once per 100 years are very different levels of risk.
• Both Toyota and Nissan Motors recently announced their ‘acceptable impact threshold’…
– Nissan system to recover within 2 weeks, supplier’s to recover within 4 weeks
– What risk level is managed? Four weeks per year, per 100 years, per 1000 years?
– How to monitor & evaluate effectiveness of actions?
SUPPLY CHAIN DISRUPTION – FIRST OF ALL A PROBLEM FOR CORPORATE RISK MANAGEMENT
Strategic planning requires the company to answer, “What is acceptable risk?” Challenge to management is to determine an acceptable probability of a minimum tolerable system downtime.

ANALYSIS FRAMEWORK OF SUPPLY-CHAIN INTERRUPTION RISK
Site 1
Site 2
Distribution
Downtime
Days
Network Downtime
Days
Downtime
Days
Days Overall Network
Site 2
Assembly Plant
Site 4
Site 3
Site 4
Downtime
Days
Site 1
Downtime
Days
Site 3
Downtime
Assembly
Supply-chain disruption due to any earthquake event anywhere in Japan

©2013 Risk Management Solutions, Inc.
EXPOSURE CENTRIC RISK MANAGEMENT
The last big SE Asian loss was a Thai river flood The next big one could be: •An earthquake •A storm surge •A tsunami •An eruption •A toxic release •A Riot/occupation •Or a large river flood
•Are you really prepared against what will happen?
Understand the motivation behind the accumulation Manage accumulations against a wide range of potential catastrophes
©2013 Risk Management Solutions, Inc.
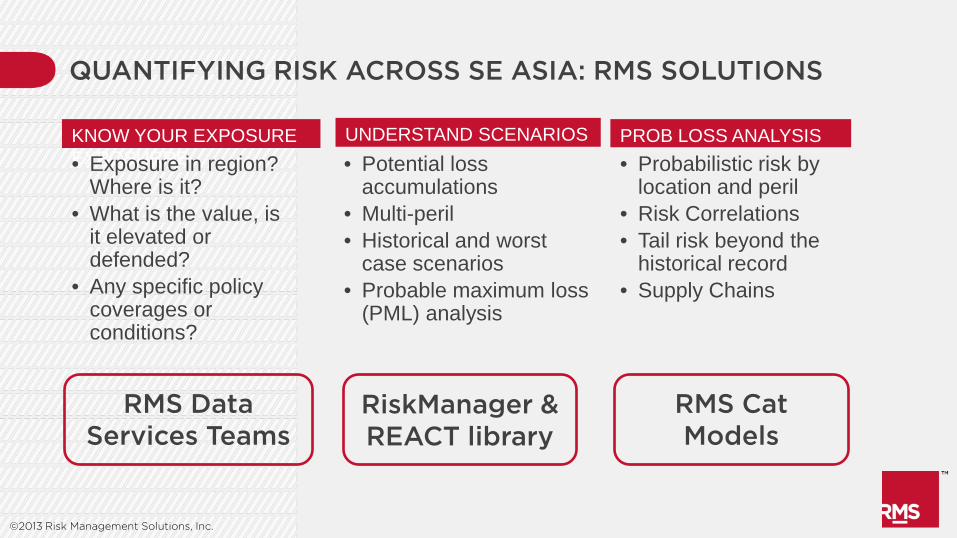
KNOW YOUR EXPOSURE EXPOSURRE • Exposure in region?
Where is it? • What is the value, is
it elevated or defended?
• Any specific policy coverages or conditions?
QUANTIFYING RISK ACROSS SE ASIA: RMS SOLUTIONS
UNDERSTAND SCENARIOS • Potential loss
accumulations • Multi-peril • Historical and worst
case scenarios • Probable maximum loss
(PML) analysis
PROB LOSS ANALYSIS • Probabilistic risk by
location and peril • Risk Correlations • Tail risk beyond the
historical record • Supply Chains
RMS Data Services Teams
RiskManager & REACT library
RMS Cat Models