Embed Size (px)
Citation preview

Engineering, 2014, 6, 355-364 Published Online June 2014 in SciRes. http://www.scirp.org/journal/eng http://dx.doi.org/10.4236/eng.2014.67038
How to cite this paper: Jia, Q., Al-Ansari, N. and Knutsson, S. (2014) Modeling of Wind Erosion of the Aitik Tailings Dam Us-ing SWEEP Model. Engineering, 6, 355-364. http://dx.doi.org/10.4236/eng.2014.67038
Modeling of Wind Erosion of the Aitik Tailings Dam Using SWEEP Model Qi Jia, Nadhir Al-Ansari*, Sven Knutsson Department of Civil, Environmental and Natural Resources Engineering, Lulea University of Technology, Lulea, Sweden Email: [email protected], *[email protected], [email protected] Received 14 April 2014; revised 14 May 2014; accepted 21 May 2014
Copyright © 2014 by authors and Scientific Research Publishing Inc. This work is licensed under the Creative Commons Attribution International License (CC BY). http://creativecommons.org/licenses/by/4.0/
Abstract Waste impoundments are usually not protected by any growing crops, soil roughness, or wind barriers, and dust due to wind erosion of the surface waste material can be a major environmental problem. The tailings dam in Aitik is highly susceptible to wind erosion when it is dry and windy. Strong dust storms may occur during dry seasons. These events are short-lived but may transport a huge amount of particulate matter and adversely impact air quality in downwind areas. This study estimated material loss from the Aitik tailings dam using SWEEP model. The simulated total material loss, saltation and creep loss, suspension loss and PM10 loss were 4.4941 kg/m2, 0.042 kg/m2, 4.4559 kg/m2, 0.264057 kg/m2 respectively. To control the dust generation, wind breaks could be suggested to be installed at 800 m downwind the west side edge of the tailings dam to reduce the saltation and creep and it would in turn reduce suspended emission. The measured to-tal suspended material for five days by exposure profiling method was 0.475 kg/m2, which had a big difference with a simulate value of 4.4559 kg/m2. Many reasons contributed to the disagree-ment of simulated value and measured value in this study. In order to use the model for mining industry, more tests are needed to validate the modeling result, and calibration methods could be useful in adjusting the internal coefficients and empirical equations.
Keywords Dust, Wind Erosion, Tailings Dam, SWEEP Model
1. Introduction Wind erosion occurs whenever the wind speed is over the threshold required to erode the soil. Waste impound-
*Corresponding author.

Q. Jia et al.
356
ments are usually not protected by any growing crops, soil roughness, or wind barriers, and dust due to wind erosion of the surface waste material can be a major environmental problem. Such dust dispersion can be a nuisance and a health hazard to inhabitants and animals in nearby settlements. It also pollutes soil, surface water and ground water. Slope length, slope angle, together with surface shear strength or surface hydraulic roughness had been confirmed as key parameters of erosion by the study of erosion of gold tailings impoundments in South Africa [1]-[3]. Blight [4] gave a brief review on waste impoundment wind erosion issues and provided some de-tails on the mechanics of how wind erodes the surfaces.
The Universal Soil Loss Equation (USLE) [5] [6] used to predict erosion from agriculture fields for many years. It was later updated to be Wind Erosion Equation (WEQ) [7], and further improved to be Revised Wind Erosion Equation (RWEQ) [8] [9]. Combining the technology of these erosion equations with databases and computers, the equations are replaced by Wind Erosion Prediction System (WEPS). The Wind Erosion Prediction System (WEPS) is a process-based, continuous model that simulates creep, saltation, and suspension processes for agri-culture soils under a wide range of environmental conditions and managements [10]. Single-event Wind Erosion Evaluation Program (SWEEP) is a standalone version of WEPS, and it simulates material loss for a single wind erosion event. The models have been tested and validated in many agriculture fields [11]-[13]. Very few studies have been done to use the models for non-agriculture fields [14]. This study used SWEEP to model wind erosion from the tailings dam which is the waste impoundment from Aitik copper mine located in Northern Sweden.
The tailings dam in Aitik is highly susceptible to wind erosion when it is dry and windy. Strong dust storms may occur during dry seasons. These events are short-lived but may transport a huge amount of particulate mat-ter and adversely impact air quality in downwind areas. Though sediment traps have been installed and are col-lecting deposited mass over the whole mining area, no assessment was made on PM emission from the tailings dam. This paper used SWEEP model to simulate material loss due to wind erosion from the Aitik tailings dam. The field measurement of dust production has also been done by exposure-profiling method, and the modeled result and measurement result were compared.
2. Materials and Methods 2.1. The Aitik Tailings Dam Aitik, owned by Boliden Mineral AB, is a copper mine which is located near Gällivare in northern Sweden. The Aitik mine is the largest open pit mine in Sweden. The annual production of Aitik mine in 1968 was 2 million tonnes of ore and this production was increased to 34.3 million tonnes in 2012. The waste materials are depo-sited in the tailings dam (Figure 1). The impoundment is spread over an area of 12 km2. Strong dust storms of-ten occur when it is dry and windy. The measurement of dust generation was done by Big Spring Number Eight (BSNE) sampler.
Figure 1. Left: the map of Sweden; Right: the Aitik Tailings dam.

Q. Jia et al.
357
2.2. Big Spring Number Eight (BSNE) Big Spring Number Eight (BSNE) samplers were designed by Fryrear [15]. Because it is a passive sampler and requires no power supply, it is cheap and widely used in field experiments. By far, it is the most popular passive sampler in Aeolian research [16]. Figure 2 shows a picture and the design of BSNE sampler. The sampler is constructed of 28-gauge galvanized metal, galvanized 18-mesh screen, and stainless steel 60-mesh screen. Dust-laden air enters through the opening, which has an area of 20*50 mm2, and discharges through the 60- mesh screen. The air speed is slowed down inside the sampler because of enlarged space, and it allows the dust to settle in the collection pan. The 18-mesh screen helps to reduce the breakdown of deposited material and loss of very fine particles by reducing the movement of collected material. A wind vane attached at the rear allows the opening to face into wind direction.
BSNE sampler is very robust and able to collect a large amount of sediments, up to tens of grams or more [16]. The flow speed near through the opening is only about 5% lower than that of undisturbed flow, and thus can be considered approximately isokinetic [17]. Efficiency of BSNE has been studied by [15], Stout and Fryrear [18], Shao et al. [17], Goossens and Offer [19], Goossens et al. [20], Sharrat et al. [21], Sharrat [22] and Goossens and Buck [16], for a wide range of wind velocity and grain size. Most of them came into the similar conclusion. The efficiency of BSNE decreases with decreasing particle size because fine grains easily follow the slight wind deflection at the sampler opening. Another reason is fine particles are prone to escape from the meshes where the inflow gets out of the sampler. For coarse grains, the efficiency is rather high. Goosseens and Offer [16] measured the overall efficiency between 86% - 96% for sand, and about 40% for 30 µm particle. Goossens and Buck [16] used efficiency of 17.5% for PM10 which is the average of Sharrat et al.’s [21] measurement between 10% and 25%. In this research, the efficiencies which used to correct the measurement are: 90% for particles > 30 µm, 40% for particles between 30 µm and 10 µm, and 17.5% for PM10. Also, researchers have noticed a slight decrease in efficiency due to increasing weed speed and this slight decrease can be neglected.
2.3. Experiment Layout The measurement was done by exposure-profiling method and the collected dust particles were total Suspended Particulate matter (TSP). The method measures the passage of airborne particulate matter immediately down-wind from the source by simultaneous, multipoint sampling of particulate concentration over the effective cross section of the dust cloud. The statistics of wind direction for the year 2001-2010 in Aitik show the wind was dominantly from west (Figure 3). Therefore, the BSNEs were installed along the downwind dam section (dam A-B in Figure 4). Due to the limited number of samplers, the measurement was done for only half length of dam A-B and the dust generation for other half dam was assumed to be the same as the measured values.
To measure the horizontal variation of dust concentration, five BSNEs (sampler a, b, c, d, e) were installed at the height of 1.5 m along dam A-B from the middle to the end dam A-B (Figure 4). The distances between BSNEs were 103 m, 115 m, 350 m, and 500 m. At the same location of the middle BSNE, two more BSNEs (sampler f and g) were installed at the height of 2.5 m and 3.5 m to measure the vertical variation of dust con-centration. The collectors were faced into the tailings dam perpendicular to dam A-B, and the wind from NW-W
(a) (b)
Figure 2. The BSNE sampler. (a) Closed sampler; (b) Opened sampler [16].

Q. Jia et al.
358
Figure 3. Wind rose in Gällivare 2001-2010 [23].
Dam
A-B
Weather station
BSNE
b
c
d
e
a,f,g
Figure 4. Experiment layout.
was required to drive the dust into the collectors. It was assumed to be none dust collection when wind direction was beyond 45 degrees to the both sides of NW-W direction. A weather station was installed as well to monitor the wind direction and speed. The measurement was done for the period of 2013-10-12 to 2013-10-29. The tem-plate is used to format your paper and style the text.
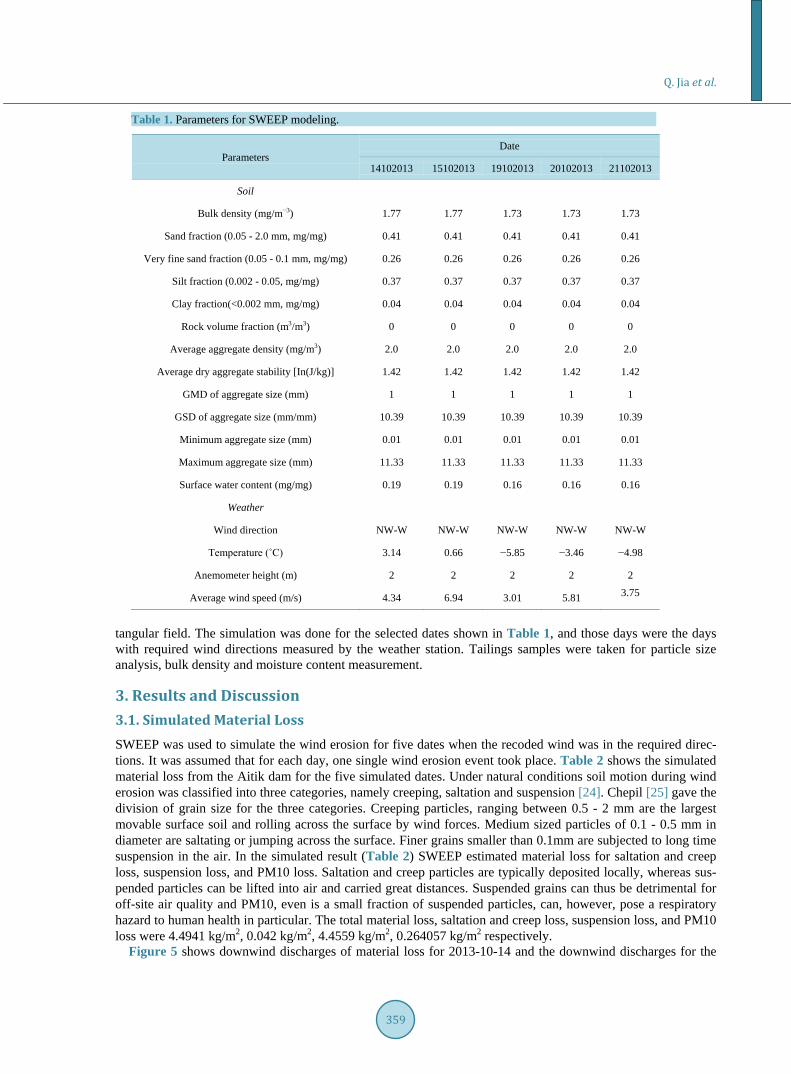
2.4. Single-Event Wind Erosion Evaluation Program (SWEEP) SWEEP is a process-based computer model coupled with a simple graphical user interface that simulates wind erosion for a single day storm event. The model estimates threshold friction velocity and starts the simulation of wind erosion when friction velocity exceeds the threshold. Friction velocity is calculated from log-law wind speed velocity and aerodynamic roughness. Aerodynamic roughness depends on oriented roughness, random roughness, and leaf and stem area. Threshold friction in SWEEP is defined as the velocity at which numerous aggregates begin to saltate [21]. It depends on soil aggregate, aggregate density, crust cover, loss material on crust, surface roughness, bio mass, soil moisture content and soil wilting point water content. All the input pa-rameters are classified to field dimension, crop parameters, soil parameters, and weather factors. Since the tail-ings dam is a mining waste impoundment, crop parameters do not need to be considered in the modeling. Table 1 lists the input parameters for SWEEP model, and the Aitik tailings dam was assumed to be a 2*6 km2 rec-
Q. Jia et al.
359
Table 1. Parameters for SWEEP modeling.
Parameters Date
14102013 15102013 19102013 20102013 21102013
Soil
Bulk density (mg/m−3) 1.77 1.77 1.73 1.73 1.73
Sand fraction (0.05 - 2.0 mm, mg/mg) 0.41 0.41 0.41 0.41 0.41
Very fine sand fraction (0.05 - 0.1 mm, mg/mg) 0.26 0.26 0.26 0.26 0.26
Silt fraction (0.002 - 0.05, mg/mg) 0.37 0.37 0.37 0.37 0.37
Clay fraction(<0.002 mm, mg/mg) 0.04 0.04 0.04 0.04 0.04
Rock volume fraction (m3/m3) 0 0 0 0 0
Average aggregate density (mg/m3) 2.0 2.0 2.0 2.0 2.0
Average dry aggregate stability [In(J/kg)] 1.42 1.42 1.42 1.42 1.42
GMD of aggregate size (mm) 1 1 1 1 1
GSD of aggregate size (mm/mm) 10.39 10.39 10.39 10.39 10.39
Minimum aggregate size (mm) 0.01 0.01 0.01 0.01 0.01
Maximum aggregate size (mm) 11.33 11.33 11.33 11.33 11.33
Surface water content (mg/mg) 0.19 0.19 0.16 0.16 0.16
Weather
Wind direction NW-W NW-W NW-W NW-W NW-W
Temperature (˚C) 3.14 0.66 −5.85 −3.46 −4.98
Anemometer height (m) 2 2 2 2 2
Average wind speed (m/s) 4.34 6.94 3.01 5.81 3.75
tangular field. The simulation was done for the selected dates shown in Table 1, and those days were the days with required wind directions measured by the weather station. Tailings samples were taken for particle size analysis, bulk density and moisture content measurement.
3. Results and Discussion 3.1. Simulated Material Loss SWEEP was used to simulate the wind erosion for five dates when the recoded wind was in the required direc-tions. It was assumed that for each day, one single wind erosion event took place. Table 2 shows the simulated material loss from the Aitik dam for the five simulated dates. Under natural conditions soil motion during wind erosion was classified into three categories, namely creeping, saltation and suspension [24]. Chepil [25] gave the division of grain size for the three categories. Creeping particles, ranging between 0.5 - 2 mm are the largest movable surface soil and rolling across the surface by wind forces. Medium sized particles of 0.1 - 0.5 mm in diameter are saltating or jumping across the surface. Finer grains smaller than 0.1mm are subjected to long time suspension in the air. In the simulated result (Table 2) SWEEP estimated material loss for saltation and creep loss, suspension loss, and PM10 loss. Saltation and creep particles are typically deposited locally, whereas sus-pended particles can be lifted into air and carried great distances. Suspended grains can thus be detrimental for off-site air quality and PM10, even is a small fraction of suspended particles, can, however, pose a respiratory hazard to human health in particular. The total material loss, saltation and creep loss, suspension loss, and PM10 loss were 4.4941 kg/m2, 0.042 kg/m2, 4.4559 kg/m2, 0.264057 kg/m2 respectively.
Figure 5 shows downwind discharges of material loss for 2013-10-14 and the downwind discharges for the

Q. Jia et al.
360
Figure 5. Material loss from the Aitik dam.
Table 2. SWEEP simulated material loss from the Aitik dam.
Date
Total loss for 5 days 14102013 15102013 19102013 20102013 21102013
Total soil loss, kg/m2 0.5086 1.6116 0.4178 1.2825 0.6736 4.4941
Saltation and creep loss, kg/m2 0.0043 0.0161 0.0034 0.0124 0.0058 0.042
Suspension loss, kg/m2 0.5043 1.5995 0.4143 1.2701 0.6677 4.4559
PM10 loss, kg/m2 0.02767 0.099261 0.022431 0.077249 0.037446 0.264057
other days had similar patterns. The typical behavior of downwind discharge of a wind eroded field is that the suspension keeps increasing with downwind distance, even though saltation and creep reach a maximum capac-ity at a certain downwind point. This is because under a certain wind speed, there is a maximum capacity for saltation and creep fraction that uses up all the wind force under the wind speed. Whereas suspended particles are released by impacts of the jumping and rolling saltation and creeping grains and as long as downwind fine sized particles are not depleted completely the suspension continues increasing. As can be seen from Figure 5, saltation and creep loss reached the maximum capacity approximately at 800 m downwind the upwind edge of the tailings dam. Since suspension is released by the impacting of saltation and creeping particles, to control the dust generation wind breaks could be suggested to be installed at this distance to reduce the saltation and creep and it would in turn reduce the suspended emission. Figure 6 shows the simulated loss, wind speed and mois-ture content for the simulated days.

Q. Jia et al.
361
Figure 6. Smulated materil loss, wind speed and moisture content.
Since the moisture content was nearly constant, the dust generation was mainly affected by wind speeds and
the higher the speed was the more dust generated.
3.2. Measured Material Loss The BSNEs were continuously collecting dust particle during the period 2013-10-12 to 2013-10-29. Wind was the driving force for the collectors to receive dust particles. The collectors were facing to the NW-W direction. Thus, the wind from NW-W was the required diving force for dust collection. In this test, BSNEs were assumed not to collect dust when wind was beyond 45 degrees to both sides of NW-W direction. The weather station mo-nitored the following dates with required wind directions: 2013-10-14, 2013-10-15, 2013-10-19, 2013-10-20, and 2013-10-21. BSNEs were not collecting any dust for the other days because of unfavorable wind directions. BSNE collected the suspended particulate matter. Figure 7 shows the particle size distribution of the collected dust particles. The majority was below the size of 0.1 mm and the dust particles were slightly finer than the tail-ings particles. Figure 8 shows the mass of dust particles collected in BSNEs. It indicates that the dust mass was

Q. Jia et al.
362
Figure 7. Particle size distribution of dust samples and tailings particles.
(a) (b)
Figure 8. Collected dust mass in BSNEs. (a) Horizontal BSNEs a, b, c, d, e, and the distances between them were 103 m, 115 m, 350 m, and 500 m; (b) Vertical BSNEs a, f, g, and the heights above the ground were 1.5 m, 2.5 m and 3.5 m.
relatively high in the middle of the dam edge and diminished with height and to the end of the edge. Therefore, approximately the cross section of the dust cloud had a height of 4m and the width close to the length of dam A-B. The total dust generated for the five days was calculated by integrating dust masses over the cross section of the dust cloud. Since the number of installed collector was limited some assumptions were needed in order to carry out the integration. The assumptions were that 1) dust masses for the other half length of the dam was the same as the dust masses for the measured half dam; 2) horizontal variations of the dust mass had the same pat-tern at different heights; 3) vertical variation of the dust mass had the same pattern at different distances. The integrated value was then corrected with sampler efficiency and the sub-variation of wind directions during the five days. The total suspended loss from the Aitik dam for the five days was 2300812.5 kg, which divided by the area of the tailings of the dam of 12 km2 resulted in 0.475 kg/m2.
The value had a big difference with simulated total suspended loss for the five days (4.4559 kg/m2 in Table 2). Even though Hagen (2004) evaluated WEPS model in cropland and concluded the simulated values were in reasonable agreement with the measured ones, the model has never been evaluated for fields other than agricul-ture land. Many reasons contributed to the disagreement of simulated value and measured value in this study.

Q. Jia et al.
363
The measurement of wind erosion of a vacant area by exposure profiling method requires enough number of collectors to cover the cross section of dust cloud. However, in this study the number of the collector was very limited and only small area of the cross section was sampled. A lot of assumptions had to be done to calculate the total suspended loss and this could result in tremendous inaccuracy. Also a considerable number of samples might have lost since the machinery works interrupted the measurement and destroyed some of the collector during the measuring. In addition, although in the SWEEP model the input parameters are important to estimate the erosion losses, the internal empirical coefficients and equations may affect the simulation resulting in an overestimation or underestimation result. In order to use the model for mining industry more tests are needed to validate the modeling result and calibration methods could be useful in adjusting the internal coefficients and empirical equations.
4. Conclusion SWEEP is a process-based computer model which simulates single wind erosion event and estimates the materi-al loss in three categories. Each category has specific effects. Saltation and creep particles are deposited locally and don’t impact the far-off areas. Suspended particles, which are carried for a long distance, can be detrimental for off-site air quality and PM10, and even a small fraction of suspended particles, can however pose a respira-tory hazard to human health in particular. This study simulated the material loss from the Aitik tailings dam us-ing SWEEP model for the following dates: 2013-10-14, 2013-10-15, 2013-10-19, 2013-10-20, and 2013-10-21. The total material loss, saltation and creep loss, suspension loss, and PM10 loss were 4.4941 kg/m2, 0.042 kg/m2, 4.4559 kg/m2, 0.264057 kg/m2 respectively. During the simulation, saltation and creep loss reached the maxi-mum capacity at 800 m downwind the west side edge of the tailings dam. Since suspension is released by the impacting of saltation and creeping particles, to control the dust generation, wind breaks could be suggested to be installed at this distance to reduce the saltation and creep and it would in turn reduce the suspended emission. The measured total suspended material for five days by exposure profiling method was 0.475 kg/m2, which had a big difference with a simulate value of 4.4559 kg/m2. Many reasons contributed to the disagreement of simu-lated value and measured value in this study. The measurement of wind erosion of a vacant area by exposure profiling method requires an enough number of collectors to cover the cross section of dust cloud. However, in this study the number of the collector was very limited and only small area of the cross section was sampled. A lot of assumptions had to be done to calculate the total suspended loss and this could result in tremendous inac-curacy. Also a considerable number of samples might have lost since the machinery works interrupted the mea-surement and destroyed some of the collectors during the measuring. In addition, although in the SWEEP model the input parameters are important to estimate the erosion losses, the internal empirical coefficients and equa-tions may affect the simulation resulting in an overestimation or underestimation result. In order to use the mod-el for mining industry, more tests are needed to validate the modeling result and calibration methods could be useful in adjusting the internal coefficients and empirical equations.
Acknowledgements The authors gratefully acknowledge Boliden Mineral AB for supporting the field experiment in Aitik tailings dam. Special thanks are given to Åsa Sjöblom and Peter Marthin for data acquisition.
References [1] Blight, G.E. (1989) Erosion Losses from the Surfaces of Gold-Tailings Dams. Journal of the South African Institute of
Mining and Metallurgy, 89, 23-29. [2] Blight, G.E. (1991) Erosion and Anti-Erosion Measures for Abandoned Gold-Tailings Dams. Oaks, R.W. and Bowder,
J., Eds., Proceedings of Reclamation 2000: Technologies for Success, Eight National Meeting of American Society Surface Mining and Reclamation, Durango, American Society for Surface Mining and Reclamation, Princeton, 323- 330.
[3] Blight, G.E. and Amponsah-da, C.F. (2004) Towards the 1000 Year Erosion Free Tailings Dam Slope—A Study in South Africa. In: Barker, D.H., Watson, A.J., Sombatpanit, S., Northcut, B. and Maglinao, A.R., Eds., Ground and Water Bioengineering for Erosion Control and Slope Stabilization, Science Publishers, 365-377.
[4] Blight, G.E. (2008) Wind Erosion of Waste Impoundments in Arid Climates and Mitigation of Dust Pollution. Waste Management & Research, 26, 523-533. http://dx.doi.org/10.1177/0734242X07082027

Q. Jia et al.
364
[5] USDA (Agriculture Research Service) (1961) A Universal Equation for Measuring Wind Erosion. USDA-ARS, 22-69. [6] Evans, W.R. and Kalkanis, G. (1977) Use of the Universal Soil Loss Equation in California. Proceedings of National
Soil Erosion Conferences, Soil Conservation Society of America, Washington DC, 33-40. [7] Woodruff, N.P. and Siddoway, F.H. (1965) A Wind Erosion Equation. Soil Science Society of America, Proceedings,
29, 602-608. [8] Fryrear, D.W., Saleh, A., Bilbro, J.D., Schomberg, H.M., Stout, J.E. and Zobeck, T.M. (1998) Revised Wind Erosion
Equation (RWEQ). Wind Erosion and Water Conservation Research Unit. USDA-ARS, Southern Plains Area Crop-ping Systems Research Laboratory.
[9] Fryrear, D.W., Sutherland, P.L., Davis, G., Hardee, G. and Dollar, M. (2001) Wind Erosion Estimates with RWEQ and WEQ. Stott, D.E., Mohtar, R.H. and Steinhardt, G.C., Eds., 10th International Soil Conservation Organization Meeting, Washington DC, 24-29 May 1999, 760-765.
[10] Hagen, L.J. (1991) A Wind Erosion Prediction System to Meet User Needs. Journal of Soil and Water Conservation, 46, 106-111.
[11] Hagen, L.J. (2004) Evaluation of the Wind Erosion Prediction System (WEPS) Erosion Submodel on Cropland Fields. Environmental Modelling & Software, 19, 171-176. http://dx.doi.org/10.1016/S1364-8152(03)00119-1
[12] Zobeck, T.M., Van Pelt, S., Stout, J.E. and Popham, T.W. (2001) Validation of the Revised Wind Erosion Equation (RWEQ) for Single Events and Discrete Periods. Proceedings of International Symposium on Soil Erosion Research for the 21st Century, Honolulu, 3-5 January 2001, 471-474.
[13] Feng, G. and Sharratt, B. (2009) Evaluation of the SWEEP Model during High Winds on the Columbia Plateau. Earth Surface Processes and Landforms, 34, 1461-1468. http://dx.doi.org/10.1002/esp.1818
[14] Chung, S.H., Herron-Thorpe, F.L., Lamb, B.K., Van Reken, T.M., Vaughan, J.K., Gao, J., Wagner, L.E. and Fox, F. (2013) Application of the Wind Erosion Preduction System in the Airpact Regional Air Quality Modeling Framework. American Society of Agriculture and Biological Engineers, 56, 625-641.
[15] Fryrear, D.W. (1986) A Field Dust Sampler. Journal of Soil and Water Conservation, 41, 117-120. [16] Goossens, D. and Buck, B.J. (2012) Can BSNE (Big Spring Number Eight) Samplers Be Used to Measure PM10, Res-
pirable Dust, PM2.3 and PM1.0? Aeolian Research, 5, 43-49. http://dx.doi.org/10.1016/j.aeolia.2012.03.002 [17] Shao, Y., McTainsh, G.H., Leys, J.F. and Raupach, M.R. (1993) Efficiencies of Sediment Samplers for Wind Erosion
Measurement. Australian Journal of Soil Research, 31, 519-532. http://dx.doi.org/10.1071/SR9930519 [18] Stout, J.E. and Fryrear, D.W. (1989) Performance of a Windblown Particle Sampler. Transactions of the ASAE, 32,
2041-2045. http://dx.doi.org/10.13031/2013.31260 [19] Goossens, D. and Offer, Z.Y. (2000) Wind Tunnel and Field Calibration of Six Aeolian Dust Samplers. Atmospheric
Environment, 34, 1043-1057. http://dx.doi.org/10.1016/S1352-2310(99)00376-3 [20] Goossens, D., Offer, Z.Y. and London, G. (2000) Wind Tunnel and Field Calibration of Five Aeolian Sand Traps.
Geomorphology, 35, 233-252. http://dx.doi.org/10.1016/S0169-555X(00)00041-6 [21] Sharrat, B., Feng, G. and Wendling, L. (2007) Loss of Soil and PM10 from Agricultural Fields Associated with High
Winds on the Columbia Plateau. Earth Surface Processes and Landforms, 32, 621-630. http://dx.doi.org/10.1002/esp.1425
[22] Sharrat, B. (2011) Size Distribution of Windblown Sediment Emitted from Agriculture Fields in the Columbia Plateau. Soil Science Society of America Journal, 75, 1054-1060. http://dx.doi.org/10.2136/sssaj2010.0337
[23] Aitik Meteorological Report (2010). [24] Bagnold, R.W. (1943) The Physics of Blown Sand and Desert Dunes. Methuen, London. [25] Chepil, W.S. (1945) Dynamics of Wind Erosion: 1. Nature of Movement of Soil by Wind. Soil Science, 60, 305-302.
http://dx.doi.org/10.1097/00010694-194510000-00004