Embed Size (px)
Citation preview

University of Arkansas, FayettevilleScholarWorks@UARK
Theses and Dissertations
8-2012
Modeling the Adoption of Identification StandardsWithin the Healthcare Supply ChainAngelica BurbanoUniversity of Arkansas, Fayetteville
Follow this and additional works at: http://scholarworks.uark.edu/etd
Part of the Equipment and Supplies Commons, and the Industrial Technology Commons
This Dissertation is brought to you for free and open access by ScholarWorks@UARK. It has been accepted for inclusion in Theses and Dissertations byan authorized administrator of ScholarWorks@UARK. For more information, please contact [email protected], [email protected].
Recommended CitationBurbano, Angelica, "Modeling the Adoption of Identification Standards Within the Healthcare Supply Chain" (2012). Theses andDissertations. 435.http://scholarworks.uark.edu/etd/435

MODELING THE ADOPTION OF IDENTIFICATION STANDARDS WITHIN THE
HEALTHCARE SUPPLY CHAIN

MODELING THE ADOPTION OF IDENTIFICATION STANDARDS WITHIN THE HEALTHCARE SUPPLY CHAIN
A dissertation submitted in partial fulfillment Of the requirements for the degree of
Doctor of Philosophy in Industrial Engineering
By
Angélica Burbano Collazos Universidad Javeriana
Ingeniería Industrial, 1994 Universidad Icesi
Especialización Gerencia de Producción, 1999 Universidad Icesi
Maestría en Administración, 2001
August 2012 University of Arkansas

ABSTRACT
The adoption of identification standards and its associated technology in the healthcare supply
chain has been slow over the past twenty five years, despite the evidence of the benefits that can
be achieved. The widespread use of identification standards in the form of barcode labeled
medical products can contribute to the reduction of point of care errors and can increase the
efficiency of healthcare supply chain related processes. This research is focused on the analysis
of the adoption of identification standards in the healthcare supply chain with a particular focus
on the healthcare provider adoption challenges. The research is divided into two phases.
The first phase develops an extensive literature review on technology adoption with a particular
focus on data standards. This adoption process is compared with the adoption of Electronic
Health Records (EHR) and Electronic Data Interchange (EDI); main conclusions from the
identification standards literature are presented, and a conceptual model to explain the
identification-standards adoption process is proposed.
The second phase proposes a model for identification standards adoption using a system
dynamics modeling approach. The model builds on previous findings associated to the factors
affecting identification standards adoption and relates the specific elements to the adoption rate
via a causal loop diagram (CLD). The model is formulated in two stages. In the first stage, the
Bass Diffusion Model (BDM) of technology adoption is adapted to simulate the adoption of
identification standards supporting technologies. The second stage uses most of the factors
defined in the CLD to develop a simulation model. A sensitivity analysis identifies relevant
model parameters that facilitated the design of interventions to move the adoption process

forward. Finally, the effects of some possible interventions are simulated using the validated
model. The model provides an illustration of the use of system dynamics models and diffusion
theory to understand an important policy problem reported in the literature and not yet solved.
Also this research informs real world practitioners and the academic community on issues like
the lack of data and other challenging aspects of empirical research that can be addressed with
the proposed model and methodology.

This dissertation is approved for recommendation to the Graduate Council.
Dissertation Director:
______________________________________________
(Dr. Ronald Rardin)
Dissertation Committee:
______________________________________________
(Dr. Ed Pohl)
______________________________________________
(Dr. Nebil Buyurgan)
______________________________________________
(Dr. Bill Hardgrave)

DISSERTATION DUPLICATION RELEASE
I hereby authorize the University of Arkansas Libraries to duplicate this dissertation when needed for research and/or scholarship.
Agreed_________________________________
(Angelica Burbano Collazos)
Refused_________________________________
(Angelica Burbano Collazos)

ACKNOWLEDGMENTS
I want to especially thank Dr. Ronald Rardin for his support and guidance. Without his support,
this dissertation would not have been possible. My work at the Center for Innovation on
Healthcare Logistics (CIHL) was fulfilling and gave me a new perspective about my profession
and my role as a researcher. I want to thank Dr. Edward Pohl, who was an important part in this
process because his comments and suggestions kept me moving in the right direction. I also
want to thank my committee members Dr. Nebil Buyurgan and Dr. Bill Hardgrave for their
support.
I want to thank my sponsor institution Universidad Icesi and Fulbright Colombia as well as
LASPAU. At the University of Arkansas, I especially want to thank the Office of Sponsored
Student Programs and my writing tutor at the Quality Writing Center, Amy Hodges. One way or
another, they made me feel that I was not alone in this endeavor and encouraged me to keep
working hard.
I want to express my deepest gratitude to my family: my parents Nelly and Jorge and my bothers
Adrian and Adolfo, as well as my cousin David. Their love and constant support made the road
easier to walk. And last but not least, I want to thank the companions on my journey: Ignacio,
Juan Pablo and Ana Sofia, for they deserve a lot of credit for this work. They mean the world to
me and I will always be thankful to them for allowing me to achieve my dream.

DEDICATION
This dissertation is dedicated to my beloved husband Ignacio and my two little ones Juan Pablo
and Ana Sofia. It took a lot of effort on my side but also a lot of patience and support from their
side. We grew together in the process, and I am sure we will keep wonderful memories about
this journey forever.

TABLE OF CONTENTS
1. INTRODUCTION .................................................................................................................... 1
1.1 Motivation and Brief Research Topic Description .............................................................. 1
1.2 Background ............................................................................................................................. 2
1.2.1 Healthcare supply chain ..................................................................................................... 2
1.2.2 Identification Standards ..................................................................................................... 5
1.2.3 Several attempts and initiatives ......................................................................................... 9
1.3 Research Problem ................................................................................................................. 10
1.3.1 Research questions ........................................................................................................... 11
1.3.2 Methodology .................................................................................................................... 13
1.3.3 Summary of expected contributions ................................................................................ 15
1.3.4 Research importance ........................................................................................................ 16
1.4 Dissertation document structure ......................................................................................... 17
2. LITERATURE REVIEW ..................................................................................................... 18
2.1 Category 1 (Non Healthcare) ............................................................................................... 22
2.2.1 IOS ................................................................................................................................... 22
2.1.2 EDI ................................................................................................................................... 23
2.1.3 MRP/ERP ......................................................................................................................... 26
2.1.4 Others ............................................................................................................................... 26
2.1.5 Conceptual models elements and mathematical modeling (specific findings) ................ 27

2.2 Category 2 (Healthcare) ....................................................................................................... 30
2.2.1 Medical technology .......................................................................................................... 30
2.2.2 Assisting technology ........................................................................................................ 31
2.2.3 Electronic Health Records - EHR .................................................................................... 31
2.2.4 Health Information Technology - HIT ............................................................................. 33
2.2.5 Conceptual model elements and mathematical modeling (specific findings) ................. 35
2.3 Theoretical findings .............................................................................................................. 36
2.3.1 Technology adoption conceptual models ......................................................................... 36
2.3.2 Mathematical models ....................................................................................................... 40
2.4 Comparative analysis (barriers, conceptual models and adoption determinants) ......... 41
2.4.1 Non healthcare adoption process (IOS/EDI) ................................................................... 42
2.4.2 Healthcare adoption process (Electronic Health Records) .............................................. 42
2.4.3 Adoption determinants ..................................................................................................... 44
2.5 Summary of findings ............................................................................................................ 45
2.5.1 Non healthcare vs. Healthcare (timing) ........................................................................... 45
2.5.2 Estimation of benefits ...................................................................................................... 46
2.5.3 Conceptual models (characterization) .............................................................................. 46
2.5.4 Modeling approach .......................................................................................................... 47
2.6 Conclusion ............................................................................................................................. 47
3. FACTORS AFFECTING IDENTIFICATION STANDARDS ADOPTION .................... 49
3.1 Data standards related literature review ............................................................................ 49

3.1.1 Findings by category ........................................................................................................ 51
3.1.2 Findings by topic.............................................................................................................. 61
3.2 Comparison EDI/EHR (conceptual models and barriers) ................................................ 63
3.2.1 General comments ........................................................................................................... 64
3.2.2 Barriers ............................................................................................................................. 64
3.3 Conceptual model for identification standards adoption .................................................. 66
3.3.1 Basic definitions ............................................................................................................... 66
3.3.2 Factors affecting the identification standards adoption process ...................................... 69
3.3.3 Conceptual model validation ........................................................................................... 71
3.4 Mathematical modeling approach for identification standards adoption ....................... 72
3.5 Conclusions ............................................................................................................................ 73
4. MODELING APPROACH .................................................................................................... 74
4.1 Literature review .................................................................................................................. 75
4.2 Modeling approach for identification standards adoption ............................................... 76
4.2.1 Causal loop diagram ........................................................................................................ 78
4.2.2 Model formulation ........................................................................................................... 78
4.2.3 Model implementation and validation ............................................................................. 78
4.2.4 Model analysis and results ............................................................................................... 79
4.3 Causal loop diagram ............................................................................................................. 79
4.3.1 Section one (environment) ............................................................................................... 81

4.3.2 Section two (technology) ................................................................................................. 84
4.3.3 Section three (organization) ............................................................................................. 85
4.4 Definition (Identification Standards) .................................................................................. 86
4.4.1 Related definitions ........................................................................................................... 88
4.4.2 Conceptual definition (proposed definition) .................................................................... 88
4.5 Model formulation ................................................................................................................ 94
4.5.1 Mathematical formulation ................................................................................................ 96
4.5.2 Bass Diffusion Model parameters and CLD factors ...................................................... 102
4.5.3 Formulation stages ......................................................................................................... 103
4.6 Stage 1 – model formulation, implementation and validation ........................................ 106
4.6.1 Model formulation (Stage 1) .......................................................................................... 106
4.6.2 Parameter estimation - analogy approach ...................................................................... 107
4.6.3 Parameter estimation - supporting technology approach ............................................... 110
4.7 Conclusion ........................................................................................................................... 114
5. MODEL FORMULATION, IMPLEMENTATION AND VALIDATION (STAGE 2) 118
5.1 Model formulation (Stage 2) .............................................................................................. 118
5.1.1 Simulation model structure ............................................................................................ 119
5.1.2 Model components (formulation) .................................................................................. 123
5.1.3 Generic model structure ................................................................................................. 138
5.2 Model formulation structure implementation.................................................................. 141
5.2.1 Implementation steps ..................................................................................................... 141
5.2.2 Base run development .................................................................................................... 142
5.2.3 Validation ....................................................................................................................... 143
5.2.4 Simulation results (base run) ......................................................................................... 145
5.3 Model analysis ..................................................................................................................... 149
5.3.1 Sensitivity analysis and SD models ............................................................................... 149
5.3.2 Model analysis – evaluation of different approaches .................................................... 152
5.3.3 Sensitivity Analysis ....................................................................................................... 154
5.4 Model interventions (design and implementation) .......................................................... 160
5.4.1 Review ........................................................................................................................... 160
5.4.2 Interventions within the present research model ........................................................... 162
5.4.3 Interventions by component (design and implementation) ............................................ 163
5.4.4 Interventions by scenario definition ............................................................................... 172
5.5 Conclusions .......................................................................................................................... 175
6. CONCLUSIONS ................................................................................................................... 179
6.1 Contributions....................................................................................................................... 179
6.2 In general (research questions, limitations and challenges) ........................................... 182
6.3 Research opportunities ....................................................................................................... 184
REFERENCES .......................................................................................................................... 186
Appendix A. Literature review supporting information ...................................................... 195

Appendix B. Parameter estimation ........................................................................................ 197
Appendix C. Formulation ....................................................................................................... 209
Appendix D. Sensitivity analysis results ................................................................................ 218
Appendix E. Policy design and testing ................................................................................... 226
LIST OF FIGURES
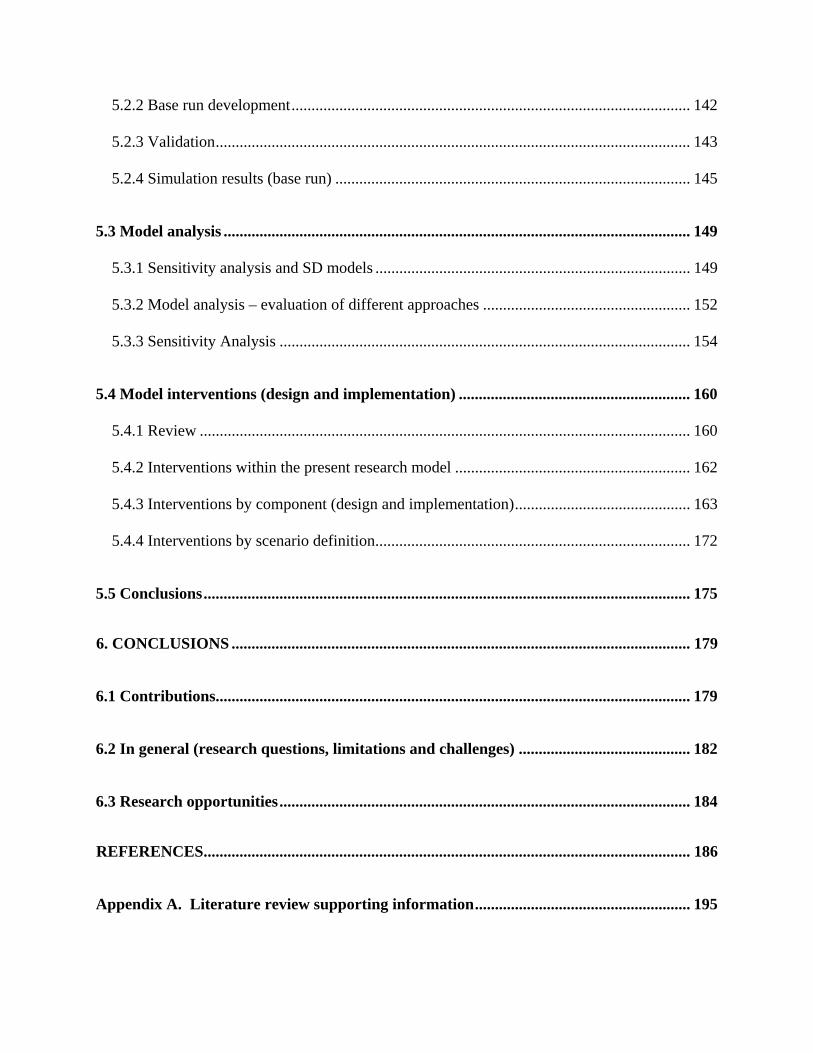
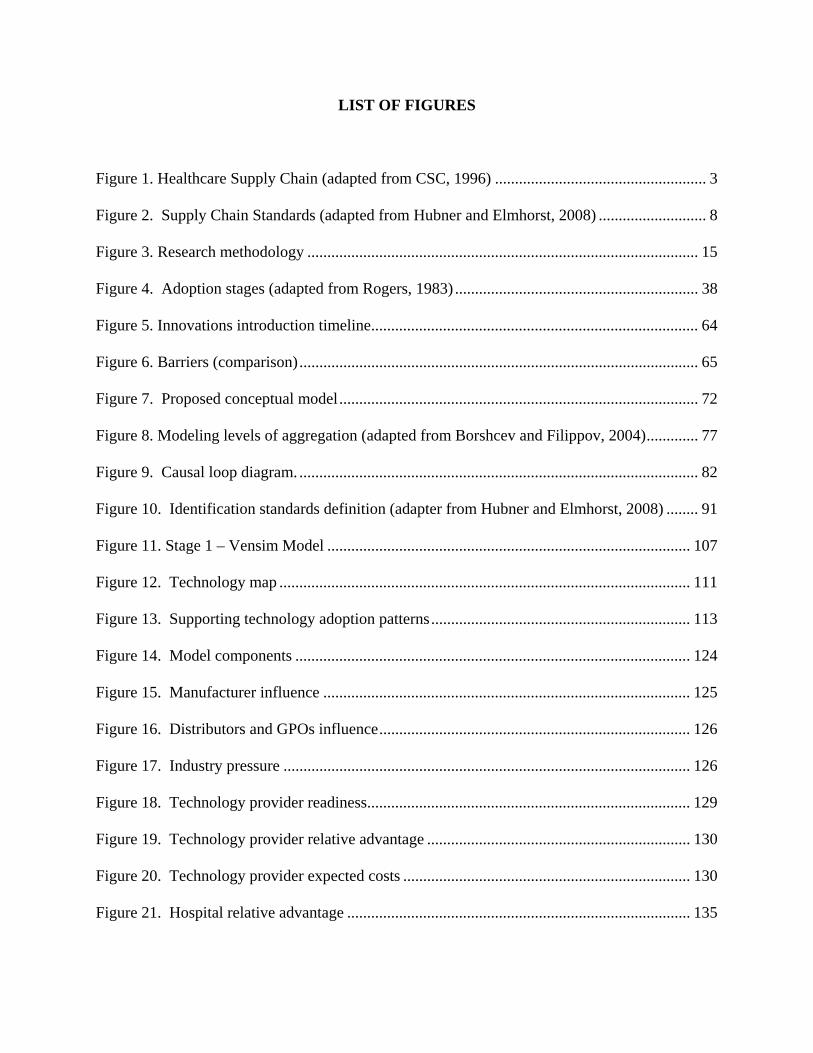
Figure 1. Healthcare Supply Chain (adapted from CSC, 1996) ..................................................... 3
Figure 2. Supply Chain Standards (adapted from Hubner and Elmhorst, 2008) ........................... 8
Figure 3. Research methodology .................................................................................................. 15
Figure 4. Adoption stages (adapted from Rogers, 1983) ............................................................. 38
Figure 5. Innovations introduction timeline .................................................................................. 64
Figure 6. Barriers (comparison) .................................................................................................... 65
Figure 7. Proposed conceptual model .......................................................................................... 72
Figure 8. Modeling levels of aggregation (adapted from Borshcev and Filippov, 2004) ............. 77
Figure 9. Causal loop diagram. .................................................................................................... 82
Figure 10. Identification standards definition (adapter from Hubner and Elmhorst, 2008) ........ 91
Figure 11. Stage 1 – Vensim Model ........................................................................................... 107
Figure 12. Technology map ....................................................................................................... 111
Figure 13. Supporting technology adoption patterns ................................................................. 113
Figure 14. Model components ................................................................................................... 124
Figure 15. Manufacturer influence ............................................................................................ 125
Figure 16. Distributors and GPOs influence .............................................................................. 126
Figure 17. Industry pressure ...................................................................................................... 126
Figure 18. Technology provider readiness ................................................................................. 129
Figure 19. Technology provider relative advantage .................................................................. 130
Figure 20. Technology provider expected costs ........................................................................ 130
Figure 21. Hospital relative advantage ...................................................................................... 135

Figure 22. Productivity improvement factor .............................................................................. 136
Figure 23. Process fraction ........................................................................................................ 137
Figure 24. Hospital IdS use ........................................................................................................ 138
Figure 25. Simulation Model ..................................................................................................... 140
Figure 26. Simulation base run results (output measures) ......................................................... 146
Figure 27. Sensitivity analysis results (Vensim graph) ............................................................. 156
Figure 28. Correlation coefficient plot (test 5) .......................................................................... 159
Figure 29. Policies Component 1 (C1) ...................................................................................... 165
Figure 30. Policy Component 2 (C2) ......................................................................................... 166
Figure 31. Policy Component 3 (C3) ......................................................................................... 168
Figure 32. Policy combinations graphical output Vensim ......................................................... 172
Figure 33. Scenarios Vensim output .......................................................................................... 175

LIST OF TABLES
Table 1. Category 1 literature review ........................................................................................... 20
Table 2. Category 2 literature review ........................................................................................... 21
Table 3. Category 1 findings ......................................................................................................... 29
Table 4. Category 2 Findings ........................................................................................................ 37
Table 5. Comparison .................................................................................................................... 43
Table 6. Adoption determinants ................................................................................................... 44
Table 7. Identification standards literature review Part A ........................................................... 52
Table 8. Identification standards literature review Part B ........................................................... 53
Table 9. Identification standards barriers ..................................................................................... 63
Table 10. Proposed adoption determinants ................................................................................... 71
Table 11. Causal Loop Diagram factors ....................................................................................... 80
Table 12. Identification standards operational definition ............................................................ 89
Table 13. Identification standards operational definition EHCR ................................................. 93
Table 14. Identification standards ideal definition ...................................................................... 95
Table 15. Analogy approach results........................................................................................... 109
Table 16. Databases (information sources) ................................................................................ 112
Table 17. Supporting technology approach ............................................................................... 114
Table 18. Transition table .......................................................................................................... 120
Table 19. Generic model ............................................................................................................ 122
Table 20. Identification standards costs and benefits ................................................................ 134
Table 21. Model baserun ............................................................................................................ 143

Table 22. Simulation baserun results ......................................................................................... 145
Table 23. Sensitivity analysis parameters .................................................................................. 154
Table 24. Sensitivity analysis results ......................................................................................... 158
Table 25. Policy implementation summary ............................................................................... 169
Table 26. Policy combinations ................................................................................................... 170
Table 27. Policy combinations results ....................................................................................... 171
Table 28. Parameters and levels for scenario analysis ............................................................... 173
Table 29. Scenarios .................................................................................................................... 173
Table 30. Scenario results .......................................................................................................... 174

LIST OF ACRONYMS
American Hospital Association (AHA) .......................................................................................... 8
Association for Healthcare Resource and Materials Management (AHRMM) .............................. 4
Auto Identification and Data Capture technologies (Auto ID DC) ................................................ 7
Barcode Medication Administration (BCMA) ............................................................................. 60
Bass Diffusion Model (BDM) ...................................................................................................... 74
Bedside Point of Care (BPOC) ....................................................................................................... 9
Causal Loop Diagram (CLD) ........................................................................................................ 74
Computarized Physician Order Entry (CPOE) ............................................................................. 31
Consumer Packaged Goods (CPG) ................................................................................................. 4
Correlation Coefficient (CC) ...................................................................................................... 152
Customer Relationship Management (CRM) ............................................................................... 31
Data Base Machines (DBM). ........................................................................................................ 22
Department of Defense (DoD) ........................................................................................................ 4
Diffusion of Innovations (DOI) .................................................................................................... 22
Efficient Consumer Response (ECR) ............................................................................................. 9
Efficient Healthcare Consumer Response (EHCR) ........................................................................ 9
Electronic Data Interchange (EDI) ............................................................................................... 19
Electronic Health Records (EHR) ................................................................................................. 19
Electronic Medical Record (EMR) ............................................................................................... 34
Electronic Product Code (EPC) .................................................................................................... 57
Enterprise Resource Planning (ERP) ............................................................................................ 22
Food and Drug Administration (FDA) ........................................................................................... 4

Global Data Synchronization Network (GDSN) .......................................................................... 10
Global Trade Identification Numbers (GTIN) .............................................................................. 10
Group Purchasing Organizations (GPO) ........................................................................................ 3
Health Industry Business Communication Council (HIBCC) ........................................................ 6
Health Industry Distributors Association (HIDA) ...................................................................... 125
Health Information Technology (HIT) ......................................................................................... 30
Health Purchasing News (HPN) ................................................................................................... 49
Healthcare Financial Management Association (HFMA) ............................................................ 49
Healthcare Information and Management Systems Society (HIMSS) ........................................... 4
HIMSS Data Base (DB) .............................................................................................................. 113
Identification Standards (IdS) ....................................................................................................... 64
Integrated Delivery Networks (IDNs) .......................................................................................... 54
Inter Organizational Systems (IOS) .............................................................................................. 22
Journal of the Healthcare Information and Management Systems Society (JHIMS) ................... 49
Latin Hypercube Sampling (LHS) .............................................................................................. 151
Management of Technology (MOT) ............................................................................................. 18
Manufacturing Resource Planning (MRP) .................................................................................... 22
Materials Management Information System (MMIS) .................................................................... 7
Maximum likelihood estimation (MLE) ..................................................................................... 100
Micro Soft Office MSO .............................................................................................................. 112
Modern Materials Handling (MMH) ............................................................................................ 49
National Drug Code (NDC) ............................................................................................................ 5
Nonlinear least squares (NLS) .................................................................................................... 100

of Customer-based Inter Organizational Systems (CIOS) ............................................................ 23
Ordinary least squares (OLS) ...................................................................................................... 100
Personal Health Records adoption (PHR) ..................................................................................... 34
Point of Sale (POS) ......................................................................................................................... 5
Product Data Utility (PDU) .......................................................................................................... 10
Radio Frequency Identification (RFID) .......................................................................................... 7
Return on Investment (ROI) ......................................................................................................... 65
Strategic Marketplace Initiative (SMI) ........................................................................................... 4
Technology Acceptance Model (TAM) ........................................................................................ 26
Technology, Organization, and Environment (TOE) ................................................................... 25
Unique Device Identification (UDI) ............................................................................................. 57
Universal Product Code (UPC) ....................................................................................................... 1
Universal Product Number (UPN) .................................................................................................. 5

1
1. Introduction
1.1 Motivation and Brief Research Topic Description
Data standards also referred to as identification standards, have been around since 1974 when the
Universal Product Code (UPC) was developed within the grocery industry. Since then other
industries have tried to adopt similar standards in order to realize the benefits achieved by the
grocery industry with the UPC adoption, which according to (Garg, Jones, & Sheedy, 1999) have
been estimated to be approximately 17 billion dollars.
Currently the healthcare supply chain lacks identification standards for the products that flow
through the supply chain and for the locations associated with this product flow. Several benefits
regarding identification standards adoption associated with supply chain process efficiency and
patient safety improvements have been identified in many studies. The broad benefits of
adopting identification standards include efficient traceability (Rosenfeld & Stelzer, 2006),
improved ordering, invoicing and receiving processes (CSC, 1996), reduced data cleansing
efforts (Accenture, 2006), ability to better monitor product recalls, track expiration dates and
product authentication (Hefflin, 2005) among others.
Despite the estimated benefits of identification standards adoption the healthcare industry is
moving at a slow pace. As reported by (Simpson & Kleinberg, 2009) the main contributors for
the slow adoption include market drivers and technology issues. There is a major "chicken
versus egg" problem on unit of use bar coding (i.e printing a barcode label at the smallest unit of
use on every pharmaceutical and medical supply). Initially manufacturers were unwilling to
barcode their products since they knew hospitals did not have the scanners to read them and

2
hospitals were reluctant to invest in barcode scanning technology if the products did not come
labeled with barcodes. In the technology side, major healthcare information systems vendors
have lagged behind in providing robust barcode enabled applications to support supply chain
processes.
This research project investigated the identification standards adoption process within the
healthcare supply chain and developed a theoretical model based technology diffusion theory; a
system dynamics modeling approach was used to model this process. The model allowed for the
identification of the factors affecting the identification standards adoption process, also
facilitated the understanding of the system (healthcare supply chain) behavior and allowed for
the design and test of policies to move the system forward.
In Section 1.2 background information on relevant elements related to this research topic are
provided. The research problem is defined in Section 1.3 along with the research questions. The
document overview is presented on Section 1.4.
1.2 Background
1.2.1 Healthcare supply chain
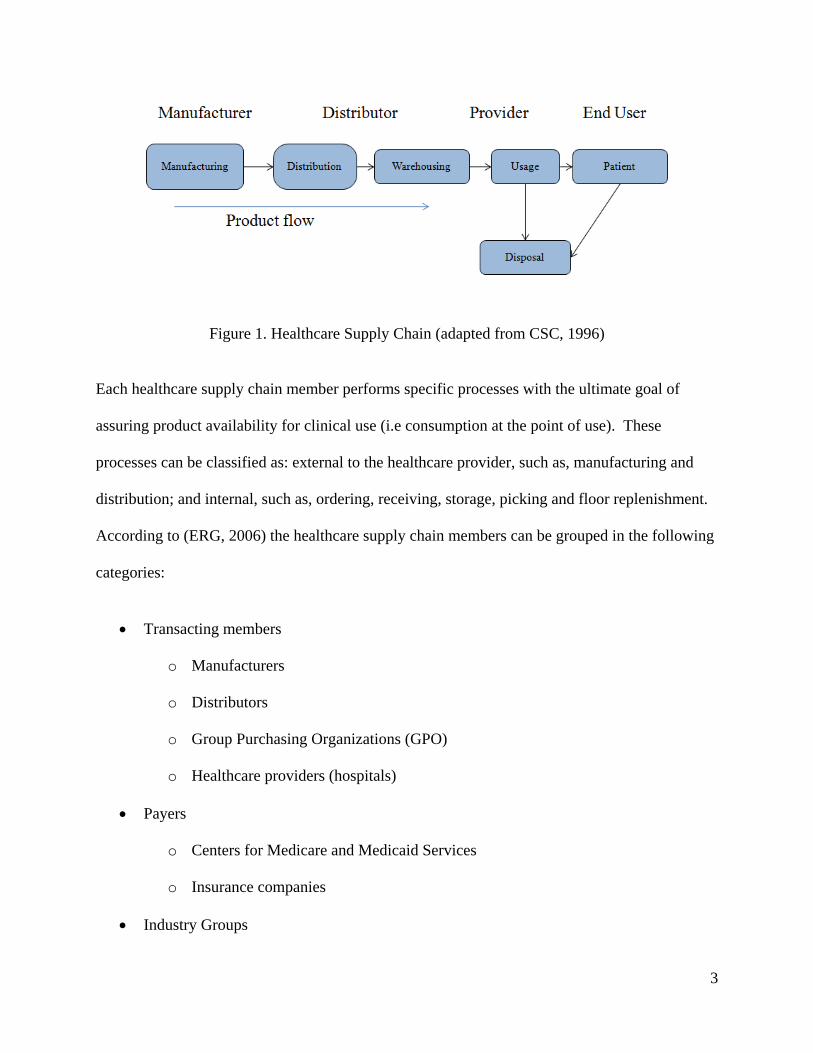
The healthcare supply chain includes a variety of members, including manufacturers,
distributors, transportation companies, hospital receiving and materials management
departments, nursing units, hospital floors and finally the patient. Figure 1 below illustrates the
basic product flow within the healthcare supply chain.
3
Figure 1. Healthcare Supply Chain (adapted from CSC, 1996)
Each healthcare supply chain member performs specific processes with the ultimate goal of
assuring product availability for clinical use (i.e consumption at the point of use). These
processes can be classified as: external to the healthcare provider, such as, manufacturing and
distribution; and internal, such as, ordering, receiving, storage, picking and floor replenishment.
According to (ERG, 2006) the healthcare supply chain members can be grouped in the following
categories:
Transacting members
o Manufacturers
o Distributors
o Group Purchasing Organizations (GPO)
o Healthcare providers (hospitals)
Payers
o Centers for Medicare and Medicaid Services
o Insurance companies
Industry Groups

4
o Association for Healthcare Resource and Materials Management (AHRMM)
o GS1 Healthcare User Group (HUG)
o Healthcare Information and Management Systems Society (HIMSS)
o Department of Defense (DoD)
o Strategic Marketplace Initiative (SMI)
Food and Drug Administration (FDA)
Technology providers
Transacting members differentiate from other members because they are directly involved in the
transactions required to move the product from the manufacturing plant to the point of use at the
hospital location.
The healthcare supply chain can be compared to other supply chains. There are a number of
important distinctions as presented by (Simpson & Kleinberg, 2009), (CTL, 2006) between the
healthcare supply chain and other supply chains like the Consumer Packaged Goods (CPG) that
represent a challenge for identification standards adoption, those include:
The fragmentation of the healthcare supply chain. There are no dominant players to drive
favorable changes in industry practices, to force investment in new technology and to
promote process change.
The segregation of product, information and money flow. The actual user or consumer of
the products is not the payer in most cases; also the decision maker (e.g. doctor or a
nurse) is neither the consumer of the product nor the payer (insurance or government).
This makes product, information and money flow along disjointed paths as opposed to
paralleling each other.

5
1.2.2 Identification Standards
Identification standards as defined by (Hubner & Elmhorst, 2008) are a building block for the
efficient product flow and its associated transactions for a given supply chain. The issue of lack
of data standards has been reported in a recent survey (Nachtmann & Pohl, The State of
Healthcare Logistics: Cost and Quality, 2009) as a major challenge to achieve supply chain
excellence in the healthcare sector. Two types of identification standards will be addressed
within this research: product identification standards and location identification standards.
Product Identification Standards
For healthcare supply chain management purposes, having a unique identifier at the smallest unit
of use would streamline pharmaceutical and medical supply chain processes and payment
systems. This could also make point of care scanning possible (Simpson & Kleinberg, 2009).
The point of care scanning concept is similar to the retail store Point of Sale (POS) checkout
process where every product leaving the store must be checked out for billing purposes. The
same concept should be transferable to the hospital setting.
Different identification standards exist within the healthcare supply chain which means no
standard is really in place. Pharmaceutical products have used the National Drug Code (NDC)
since 1974 due to specific Food and Drug Administration (FDA) regulations. The most recent
regulation requiring manufacturers labeling pharmaceutical products at the smallest unit of use
have forced most pharmaceutical manufacturers to print NDC numbers in linear barcode (one
dimensional) format. For medical devices and general medical surgical supplies the use of the
Universal Product Number (UPN) since 1995 has been the norm because of the efforts of the

6
Department of Defense on various internal pilot projects. About 75% of medical products carry
a UPN (Hefflin, 2005).
GS1 standards (formerly EAN UCC) and Health Industry Business Communication Council
(HIBCC) standards are also identification standards used by some healthcare supply chain
members. A survey referenced by (Bix, Clarke, Lockhart, Twede, & Spink, 2007) reports 59%
of the respondents using GS1 standards and 39% using HIBCC standards. One major difference
between GS1 standards and HIBCC standards is that the former is a global standard used in
many other industries and HIBCC standards were developed specifically for the healthcare
industry. As of today the issue of having a unique identifier at the smallest unit of measure, unit-
dose for pharmaceuticals and unit-of-use for medical products, has not been solved.
Location Identification Standards
Location identification standards are referred to as the unambiguous identification of every
supply chain transacting member in order to facilitate ordering, contract pricing and rebate
processing. Currently supply chain members are identified by customer account numbers issued
by each transacting member (e.g. each health care provider can assign a different number to
describe the same manufacturer). Under these conditions is not possible to uniquely identify any
supply chain transacting member. The lack of unique location identifiers generates supply chain
process inefficiencies which can be reduced by the proper use of the standards.
Technology
Technology plays an important role in identification standards adoption and implementation
(Langabeer, 2005). The level of current process automation at the healthcare provider level or

7
any other transacting member in the healthcare supply chain will have an impact on how
identification standards can be adopted.
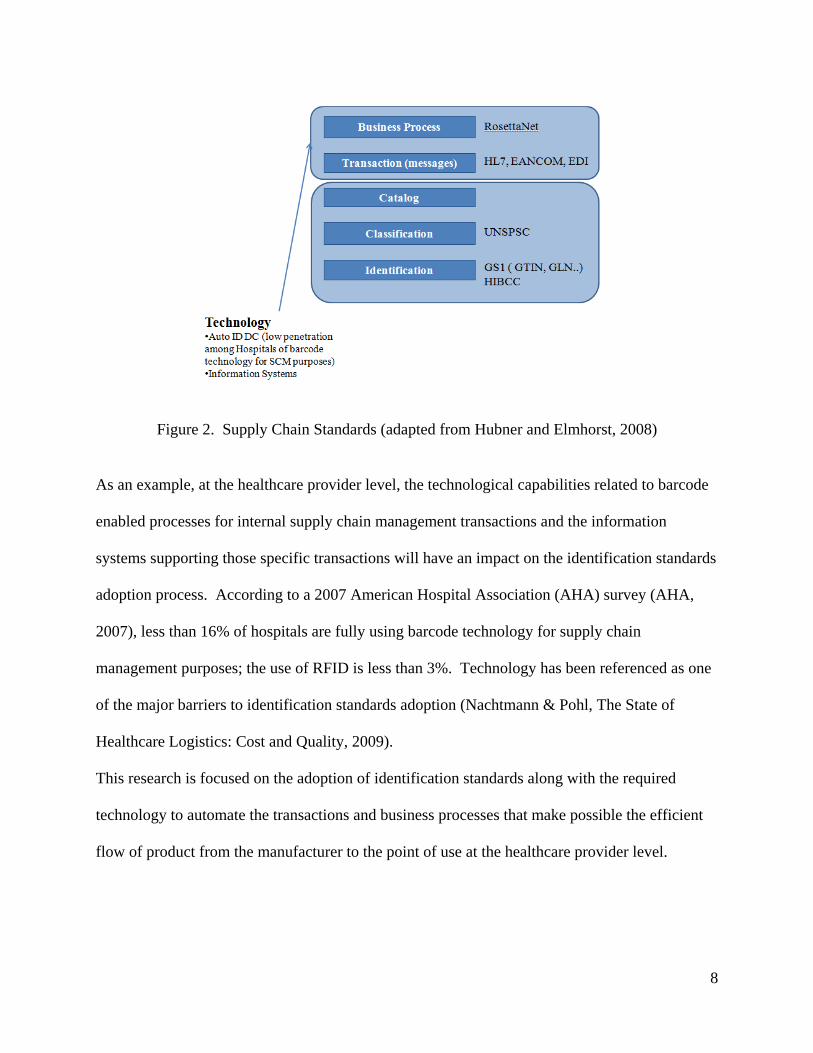
Technology allows for capturing the product related information as it moves through the supply
chain and also helps to store and process product related information as well as the transactions
associated with it. Figure 2 illustrates the relationship between identification standards and
technology.
The technology associated with identification standards, which should be implemented by any
given transacting member within the healthcare supply chain in order to adopt identification
standards, can be classified in two groups:
Auto Identification and Data Capture technologies (Auto ID DC). Auto ID DC
technologies such as barcode or Radio Frequency Identification (RFID) technology, can
increase process efficiency, reduce data entry errors and free staff to perform more value
added functions.
Information systems (supply chain, materials management or purchasing systems).
Information systems such as Materials Management Information System (MMIS) are
applications used to support internal and external supply chain processes within a given
supply chain member.
8
Figure 2. Supply Chain Standards (adapted from Hubner and Elmhorst, 2008)
As an example, at the healthcare provider level, the technological capabilities related to barcode
enabled processes for internal supply chain management transactions and the information
systems supporting those specific transactions will have an impact on the identification standards
adoption process. According to a 2007 American Hospital Association (AHA) survey (AHA,
2007), less than 16% of hospitals are fully using barcode technology for supply chain
management purposes; the use of RFID is less than 3%. Technology has been referenced as one
of the major barriers to identification standards adoption (Nachtmann & Pohl, The State of
Healthcare Logistics: Cost and Quality, 2009).
This research is focused on the adoption of identification standards along with the required
technology to automate the transactions and business processes that make possible the efficient
flow of product from the manufacturer to the point of use at the healthcare provider level.

9
1.2.3 Several attempts and initiatives
The adoption of identification standards and barcode technology began within the grocery
industry around the mid seventies. The sequence of relevant events documented by (HIMSS,
2003) illustrates how the healthcare industry has tried to adopt identification standards but have
not been successful, those events include among others:
In 1983 the Health Industry Business Communications Council (HIBCC) was established
to promote the adoption of identification standards. The standards developed by HIBCC
where specific for the healthcare industry and where adopted mainly by manufacturers.
In 1989 the use of barcode technology for point of care applications was promoted among
hospitals.
In 1995 the Efficient Consumer Response (ECR) in grocery industry was defined as the
reference point to determine how ECR practices could apply to healthcare supply chain,
since major industry parallels between grocery and healthcare industry were identified.
The result from this effort is the Efficient Healthcare Consumer Response (EHCR) (CSC,
1996) study, which identified more than six billion in potential savings for barcode
technology adoption within the hospital supply chain.
In 2000 the Institute of Medicine presented a report (Kohn, Corrigan, & Donaldson,
2000) which estimated that up to 98,000 lives are lost a year due to preventable medical
errors. Many of these errors could likely be avoided by the use of technology such as
barcode technology, in particular for the purpose of Bedside Point of Care (BPOC)
scanning.

10
The 2004 FDA rule for human drug and blood products mandated that manufacturers
print a barcode (one dimensional) on every product at the unit of use addressing the issue
of lack of unique identifiers and suggesting the use of either GS1 or HIBCC standards.
In September 27 2007, the FDA Amendments Act of 2007 was signed into law; this Act
includes the establishment of a unique device identification system. This new system
when implemented will require the label of a device to bear a unique identifier. This
unique identifier must be able to identify the device through distribution and use.
In 2008 (25 years after the first attempt) an industry movement towards GS1 standards
system adoption was initiated. Currently the industry is building consensus regarding the
adoption of GS1 standards.
Results from pilot projects developed at the Department of Defense (DoD) which go back to
1995 have demonstrated the benefits of a Product Data Utility (PDU) and unique identifiers such
as the UPN. The current DoD pilot project is testing the GS1 Global Data Synchronization
Network (GDSN) as a PDU for healthcare industry using the Global Trade Identification
Numbers (GTIN) as the unique identifier for products flowing through the healthcare supply
chain. The industry established deadlines for the adoption of the different standards; the
deadline for the location identifiers adoption was December 31st of 2010 and the deadline of the
product identifiers adoption is December 31st of 2012.
1.3 Research Problem
The adoption of identification standards and it associated technology in the healthcare supply
chain has been slow over the past twenty five years despite empirical evidence of the benefits
that can be achieved. The first movement towards identification standards adoption was initiated

11
in the year 1983 as referenced by (HIMSS, 2003). The EHCR initiative (CSC, 1996) identified
in 1996 more than six billion in potential savings for barcode technology use within the hospital
supply chain. Today, more than twenty five years after the first attempt to identification
standards adoption, the standards are not widely adopted and the benefits are still to be realized.
This slow adoption process is preventing the healthcare supply chain from reaching the benefits
and process efficiencies other industries have realized, and, most importantly, it is affecting the
healthcare delivery process since identification standards are known to be useful on preventing
medical errors (e.g. wrong dose to right patient, right dose to wrong patient) and facilitating the
recall process of pharmaceuticals, medical supplies and devices.
As reported by (Simpson & Kleinberg, 2009) the main contributors for the slow adoption include
market drivers and technology issues. There is a major "chicken versus egg" problem on unit of
use bar coding (i.e printing a barcode label at the smallest unit of use on every pharmaceutical
and medical supply). Initially manufacturers were unwilling to barcode their products since they
knew the hospitals did not have the scanners to read them and hospitals were reluctant to invest
in barcode scanning technology if the products did not come labeled with barcodes. In the
technology side, major healthcare information systems vendors have lagged behind in providing
robust barcode enabled applications to support supply chain processes.
1.3.1 Research questions
The main research questions to be addressed with this research project are the following:
1. How does the identification standards adoption process compare with the same or similar
adoption process in other industries such as retail?
12
2. How does the identification standards adoption and diffusion process compare with the
adoption of other technologies within the healthcare industry in general. (e.g. the
diffusion of medical technologies or Electronic Health Records EHR)?
3. What is preventing healthcare supply chain members and healthcare providers in
particular from adopting identification standards and it supporting technologies? What
are the major barriers?
4. How could existing diffusion models be extended or modified to model the healthcare
identification standards adoption process?
5. What are the cost implications and benefits for the healthcare supply chain members and
stakeholders to adopt identification standards?
6. What actions (strategies, incentives and policies) are required to increase the number of
healthcare supply chain members and healthcare providers adopting identification
standards?
In order to answer the proposed research questions, this research is divided in two phases. Phase
I is related to questions 1, 2 and 3. Phase II is related to questions 4, 5 and 6. Each phase
develops a main objectives and a main hypothesis as explained in the following paragraphs.
Phase I
Main objective. To identify the main barriers affecting the data standards adoption process
(research question number 3) in order to explain the adoption process from the technology
adoption perspective, and to develop a conceptual model.

13
Main hypothesis. The identification standards adoption process can be understood, explained
and improved with information related to similar adoption processes within and outside of the
healthcare domain.
Phase II
Main objective. To develop a theoretical model to investigate the dynamics of the adoption of
identification standards in the U.S healthcare supply chain (research question number 4). The
model will be based on the diffusion of innovations theory; a systems dynamics modeling
approach will be used to model this process.
Main hypothesis. Technology diffusion models can help to explain and model the adoption of
identification standards. Classic diffusion models can be extended to model identification
standards adoption; the developed model will facilitate the understanding of the system
(healthcare supply chain) behavior and allows for the design and test of policies to move the
system forward.
1.3.2 Methodology
Phase I
An extensive literature review followed by a comparative analysis is the methodology to be used
to answer the research questions related to this phase. An extensive review of the literature on
data standards adoption, healthcare and non healthcare related adoption processes is developed.
The most relevant conceptual models for factor identification and adoption modeling are
explained. The literature review provides the necessary information to identify the factors that
are affecting the identification standards adoption process, a conceptual model is proposed.

14
Phase II
The second phase is related to the model development and is based on the system dynamics
methodology. As defined by (Coyle, 1983), system dynamics is a rigorous method of system
description, which facilitates feedback analysis, usually via a continuous simulation model of the
effects of alternative system structures and control policies on system behavior.
As implied by the system dynamics methodology, the purpose of a model is to understand the
structure of the system and to provide insights into the possible solutions to the existing
problems.
The basic steps of the system dynamics methodology are the following:
Definition of the real world symptoms to be understood and improved
System description by the use of a Causal Loop Diagram
Model formulation
Model verification and validation
Simulation experiments, leading to improved understanding on the problem underlying
the symptoms
Redesign and implement change on system structures or policies in order to improve its
dynamic behavior
15
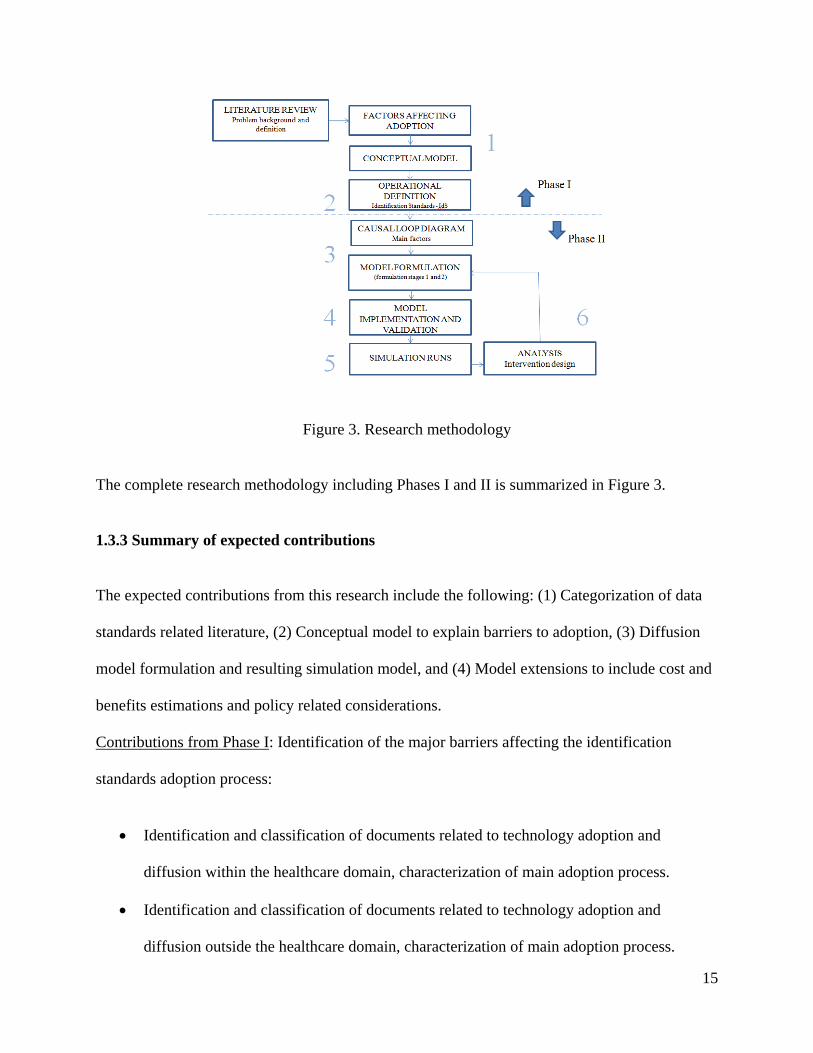
Figure 3. Research methodology
The complete research methodology including Phases I and II is summarized in Figure 3.
1.3.3 Summary of expected contributions
The expected contributions from this research include the following: (1) Categorization of data
standards related literature, (2) Conceptual model to explain barriers to adoption, (3) Diffusion
model formulation and resulting simulation model, and (4) Model extensions to include cost and
benefits estimations and policy related considerations.
Contributions from Phase I: Identification of the major barriers affecting the identification
standards adoption process:
Identification and classification of documents related to technology adoption and
diffusion within the healthcare domain, characterization of main adoption process.
Identification and classification of documents related to technology adoption and
diffusion outside the healthcare domain, characterization of main adoption process.

16
Identification and classification of documents related to data standards adoption.
Comparative analysis of findings and development of a conceptual model to explain data
standards adoption.
Contributions from Phase II: Development and implementation of a modeling approach for data
standards adoption:
Identification and classification of documents related to technology adoption modeling
within and outside the healthcare domains, identification of main methods.
Diffusion model formulation to model data standards adoption.
Simulation model implementation and experimentation.
Model extensions to include the cost and benefits estimations and policy interventions.
1.3.4 Research importance
The study of the data standards adoption process provides an opportunity to enhance the
understanding of the adoption process by exploring related adoption processes that could lead to
the analysis from an academic perspective of previous failed data standards adoption attempts.
A similar standards movement was started in 1983 with no successful outcome.
Technology adoption and diffusion are important challenges as revealed by (Sheng, R., Jen Hwa,
Wei, Higa, & A., 1998). The adoption and diffusion of technology within healthcare is
important since its widespread use can contribute to the reduction of costs, through the increase
of efficiency and most important improvements in patient safety (Kohn, Corrigan, & Donaldson,
2000).

17
1.4 Dissertation document structure
This document is divided into six chapters. The background information, the description of the
research problem, the research questions along with the description of the methodology are
introduced in Chapter 1. A literature review, related to non-healthcare and healthcare related
adoption processes, is presented in Chapter 2. In this chapter the findings related to the main
conceptual models and adoption determinants are explained. The literature review related to data
standards literature with specific focus on barriers is presented in Chapter 3 along with the
development of the proposed conceptual model to explain the identification standards adoption
process. The model formulation and development is presented in Chapter 4, this chapter
includes the development of the causal loop diagram along with the proposed formulation stages.
The model implementation, sensitivity analysis and interventions design is presented in Chapter
5. The conclusions and future work are presented in Chapter 6.

18
2. Literature Review
The goal of this chapter is to answer the following research questions as established in Chapter 1:
How does the identification standards adoption process compare with the same adoption
process in other industries such as retail?
How does the identification standards adoption and diffusion process compare with the
adoption of other technologies within the healthcare industry in general (e.g. the
diffusion of medical technologies or Electronic Health Records EHR)?
The characterization of a main adoption process within the non healthcare and healthcare
domains was established. A literature review was conducted in order to achieve that goal. The
main findings of the literature review are presented in this chapter. The comparison of the
identification standards adoption process and healthcare and non healthcare adoption processes is
developed in Chapter 3.
The Management of Technology (MOT) approach (Gaimon, 2008), is defined as a key element
of the literature review. Under this approach researchers attempt to explain a given adoption
process by defining conceptual models that could lead to generalizations. Since the goal if this
research is to understand the identification standards adoption process the MOT approach was
found suitable for this purpose. In this research it was assumed that findings related to specific
adoption processes could help to understand the identification standards adoption process under
study. Adoption processes within the healthcare and non healthcare domains were explored.

19
For non healthcare related adoption processes, the initial technology used in the search was
Electronic Data Interchange (EDI). For healthcare related adoption processes, the search started
by focusing on the adoption of Electronic Health Records (EHR). The search was conducted
using various search engines such as Engineering Village, EBSCO and Pro Quest. In order to
start the search the terms EDI and EHR were used. For Engineering Village data base the terms
EDI and EHR plus the term adoption and United States as a location element to conduct the
search were used. The starting date for the search was 1980; the goal was to include the research
work developed over the past three decades. For the Pro Quest and EBSCO databases the search
was conducted with the terms EDI and EHR plus adoption, conceptual model and mathematical
model using the same date range and location parameters. The initial goal was to keep the search
just for US adoption processes but some outside cases were considered. As a result 85
documents were reviewed (title and abstract) and reduced to 41 documents divided in two
categories. Category 1, non-healthcare related documents and category 2, healthcare related
documents as shown in Tables 1 and 2.
For both categories the documents were classified in the following document types: Journal (J),
Dissertation (D), Book chapter (B), Conference proceedings (C) and Report (R). In total, there
are 27 Journals, 3 Dissertations, 3 Book chapters, 3 Conference proceedings and 5 Reports. The
journals are mainly from the areas of information systems (12), decision sciences (4) and
engineering management fields (4), and the remaining (7) belong to healthcare related
publications.
20
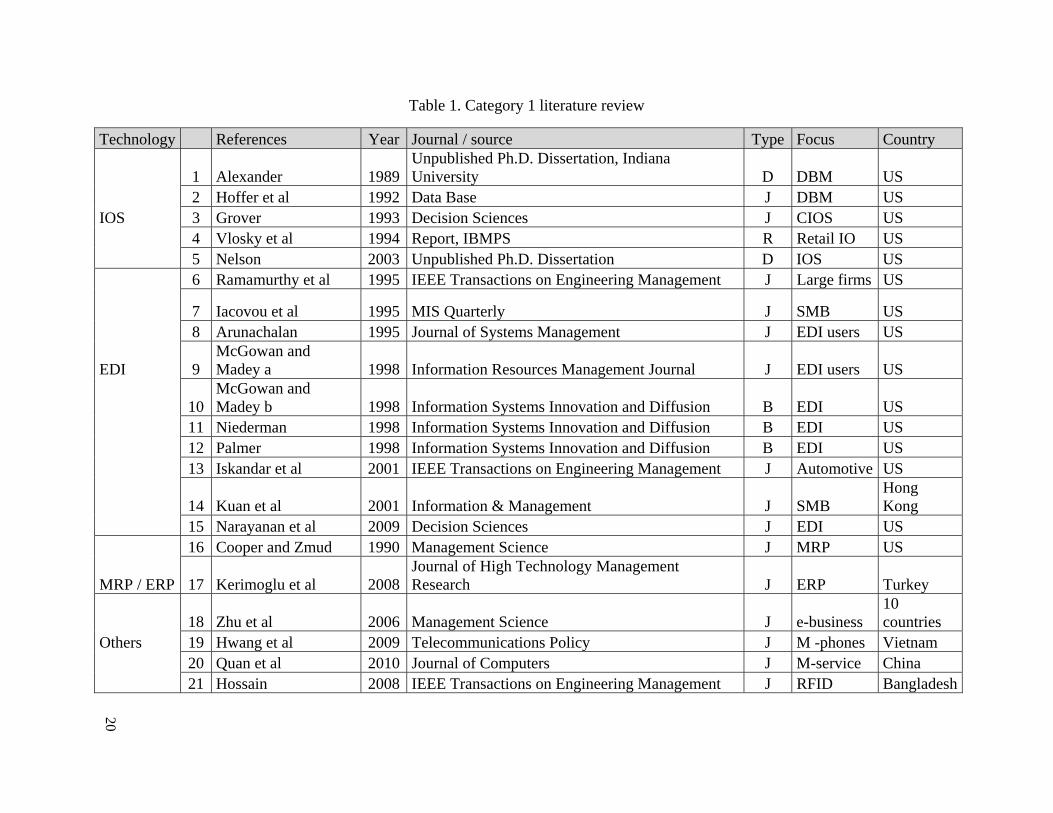
Table 1. Category 1 literature review
Technology References Year Journal / source Type Focus Country
1 Alexander 1989Unpublished Ph.D. Dissertation, Indiana University D DBM US
2 Hoffer et al 1992 Data Base J DBM US IOS 3 Grover 1993 Decision Sciences J CIOS US 4 Vlosky et al 1994 Report, IBMPS R Retail IO US 5 Nelson 2003 Unpublished Ph.D. Dissertation D IOS US 6 Ramamurthy et al 1995 IEEE Transactions on Engineering Management J Large firms US
7 Iacovou et al 1995 MIS Quarterly J SMB US 8 Arunachalan 1995 Journal of Systems Management J EDI users US
EDI 9 McGowan and Madey a 1998 Information Resources Management Journal J EDI users US
10 McGowan and Madey b 1998 Information Systems Innovation and Diffusion B EDI US
11 Niederman 1998 Information Systems Innovation and Diffusion B EDI US 12 Palmer 1998 Information Systems Innovation and Diffusion B EDI US 13 Iskandar et al 2001 IEEE Transactions on Engineering Management J Automotive US
14 Kuan et al 2001 Information & Management J SMB Hong Kong
15 Narayanan et al 2009 Decision Sciences J EDI US 16 Cooper and Zmud 1990 Management Science J MRP US
MRP / ERP 17 Kerimoglu et al 2008Journal of High Technology Management Research J ERP Turkey
18 Zhu et al 2006 Management Science J e-business 10 countries
Others 19 Hwang et al 2009 Telecommunications Policy J M -phones Vietnam 20 Quan et al 2010 Journal of Computers J M-service China 21 Hossain 2008 IEEE Transactions on Engineering Management J RFID Bangladesh

21
Table 2. Category 2 literature review
Technology References Year Journal / source Type Focus CountryMedical technology 1 Greer 1985 Intl. journal of technology assessment in health care J
12 technologies US
Assisting 2 Sheng et al 1998 Journal of Organizational Computing J Telemedicine Hong Kong
technology 3 Paul et al 1999 IEEE Transactions on Engineering Management J Telemedicine US 4 Hung et al 2009 Decision Support System J CRM Taiwan 5 Miller and Sim 2004 Health Affairs J EMR US
6 Ash and Bates 2005Journal of the American Medical Informatics Association J EHR US
7 Middleton et al 2005Journal of the American Medical Informatics Association J EHR US
EHR 8 Woodside 2007 JHIM HIMSS J EHR US 9 Chang et al 2007 Decision Support System J e-signature Taiwan 10 Erdil 2008 SD 2008 Conference proceedings C EHR US 11 Erdil a 2009 SD 2009 Conference proceedings C EHR US 12 Erdil b 2009 Unpublished Ph.D Dissertation D EHR US 13 Hillestad et al 2005 Health Affairs J HIT / EMR US HIT / EHR 14 Shortliffe 2005 Health Affairs J HIT US 15 Bower 2005 RAND report R HIT/EHR US
16 Fonkych and Taylor 2005 RAND report R HIT US
17 Girosi et al 2005 RAND report R HIT/EHR US 18 Conklin et al 2009 RAND report R RFID Europe
19 Daim et al 2008Proceedings of the 41st Hawaii Intl. Conference on System Sciences C HIT US
20 Daim et al 2009 Int. Journal of Behavioural and Healthcare Research J PHR US

22
2.1 Category 1 (Non Healthcare)
The documents (21) were fully reviewed and classified according to the year of publication,
document type and focus. Among the non-healthcare related adoption documents the following
technologies were identified: Inter Organizational Systems (IOS), Electronic Data Interchange
(EDI), Manufacturing Resource Planning (MRP), Enterprise Resource Planning (ERP) and a
category of others. The documents were also reviewed according to the scope, modeling
approach and factor identification methods. The date range was from the year 1989 to the year
2010. The summary of the documents within category one is shown in Table 1.
2.2.1 IOS
The study of Inter Organizational Systems (IOS) was initiated with the work of (Alexander, The
Adoption and Implementation of Computer Technology in Organizations: The Example of
Database Machines, 1989) and (Grover, 1993). In his work (Alexander, The Adoption and
Implementation of Computer Technology in Organizations: The Example of Database Machines,
1989) the author developed a conceptual model in order to explain the adoption and
implementation of Data Base Machines (DBM). This work considered the organizational
perspective and was based on Diffusion of Innovations (DOI) theory. The sample size of the
survey was expanded by (Hoffer & Alexander, 1992). The authors proposed ten factors are
related to the implementation of database machines those were: compatibility, relative
advantage, complexity, training, vendor involvement, organization structure, management
support, planning, champions and awareness of technology. In a more generic way (Grover,
1993) developed a conceptual model to explain the adoption of Customer-based Inter

23
Organizational Systems (CIOS). This conceptual model was tested with a sample of industry
leaders. Among the main findings was the development of a composite model which included
organizational factors, policy factors, environmental factors and technology specific factors; and
the identification of a proactive technological orientation and the internal push for the system as
the two most relevant factors affecting adoption.
The adoption of IOS was also studied by (Volsky & Wilson, 1994) using the relationship
between a buyer and a seller in the retail context. The model developed four hypotheses which
were tested with a survey. Among the most relevant findings was the fact that channel
relationship deterioration occurs during the early stages of IOS technology adoption, mainly due
to the low value perceived relative to the investments made by the parties involved.
The adoption and diffusion of Inter Organizational System standards and process innovations
was studied by (Nelson, 2003). The author developed a conceptual model which linked the
adoption and diffusion (deployment) to three main constructs which are organizational,
technology and environment factors. The author found a difference between the factors affecting
adoption and the factors affecting deployment.
2.1.2 EDI
The results of a survey on the use of EDI among 900 firms were presented by (Arunachalam,
1995). The survey identified the main reasons for adopting EDI, the perceived barriers and
realized benefits. According to the survey some of the main reasons to adopt EDI were: to
remain competitive, customer's request, provide better customer service and to reduce
paperwork. The perceived barriers were related to the lack of awareness of EDI benefits, lack of

24
automation, high costs and training. According to the survey, most customers were able to
improve customer service and reduce transaction errors. In the same way, the work developed
by (Ramamurthy & Premkumar, 1995) introduced a conceptual model based on DOI to explain
the implementation of EDI in large firms and its impact on the business performance. The
results from testing the conceptual model among industry leaders in the form of a survey
indicated that the greater internal and external diffusion of EDI facilitated the achievement of
improved organizational outcomes. The work of (Iacovou, Benbasat, & Dexter, 1995) presented
a conceptual model to study the EDI adoption on small and medium businesses. This model
described the effect of three explanatory factors (perceived benefits, organizational readiness and
external pressure) on the adoption of EDI. The authors tested the model with the use of case
studies and recommended the establishment of a long term EDI partner expansion plan and the
individual assessment of each partner preparedness level, as key elements in the adoption
process.
Similarly, the work of (McGowan & Madey, Adoption and implementation of Electronic Data
Interchange, 1998) started with the definition of a conceptual model for EDI adoption and
implementation based on DOI using a case study approach; four organizations were studied. The
results of the study suggested that the factors that influence the adoption decision might be
different from the factors influencing the extent of the EDI implementation within the
organization. Among one of the main factors affecting the adoption was the customer influence.
On a subsequent work (McGowan & Madey, The influence of organization structure and
organizational learning factors on the extent of EDI implementation in U.S. firms, 1998)
developed a survey to establish the aspects related to the EDI implementation and diffusion
within the organization. The EDI implementation extent was assessed through the volume,

25
diversity and sophistication of EDI use within the organization. The results showed that the size
of the organization explains much of the extent of EDI implementation which could be related to
resource availability. The EDI adoption was reviewed by (Niederman, 1998) from the diffusion
of innovations perspective and the author suggested the introduction of risk and critical mass as
factors to be considered when analyzing technology adoption. The conceptual model developed
by (Palmer, 1998) was used to study the adoption and diffusion of EDI under a quick response
strategy. The study findings suggested that the factors affecting the adoption might be different
from the factors affecting implementation. Firm size was confirmed as a key factor affecting
adoption, however, the results regarding implementation were inconclusive.
The adoption and integration of EDI within the automotive industry was studied by (Iskandar,
Kurokawa, & LeBlanc, 2001), the authors proposed a conceptual model and developed a survey
in order to gather information to test the proposed hypothesis. The results from the study
indicated that the factors affecting the adoption are different from the factors affecting the
implementation even though both can be considered simultaneously taking into consideration a
short implementation period.
The work developed by (Kuan & Patrick, 2001) included the development of a conceptual model
to study the adoption of EDI among small and medium businesses. The proposed conceptual
model was based on the Technology, Organization, and Environment (TOE) model previously
developed by (Tornatzky & Fleisher, 1990). The model differentiated among adopters and non
adopters. Some of the main findings included the fact that direct benefits were perceived to be
higher by adopter firms compared to non-adopter firms and the indirect benefits did not reveal
any difference among the two groups. The work developed by (Narayanan, Marucheck, &
26
Handfield, 2009) summarized the findings on EDI adoption and implementation research over
the past 20 years. The study synthesized the EDI literature and with the development of a meta-
analysis of findings, the authors were able to clarify some conflicting results regarding EDI
adoption and implementation benefits. In this paper the authors established that no unified
model exist to analyze the adoption and implementation of EDI. No agreement on results from
adoption and implementation has been reached and most of the results related to the estimation
of the benefits are inconclusive.
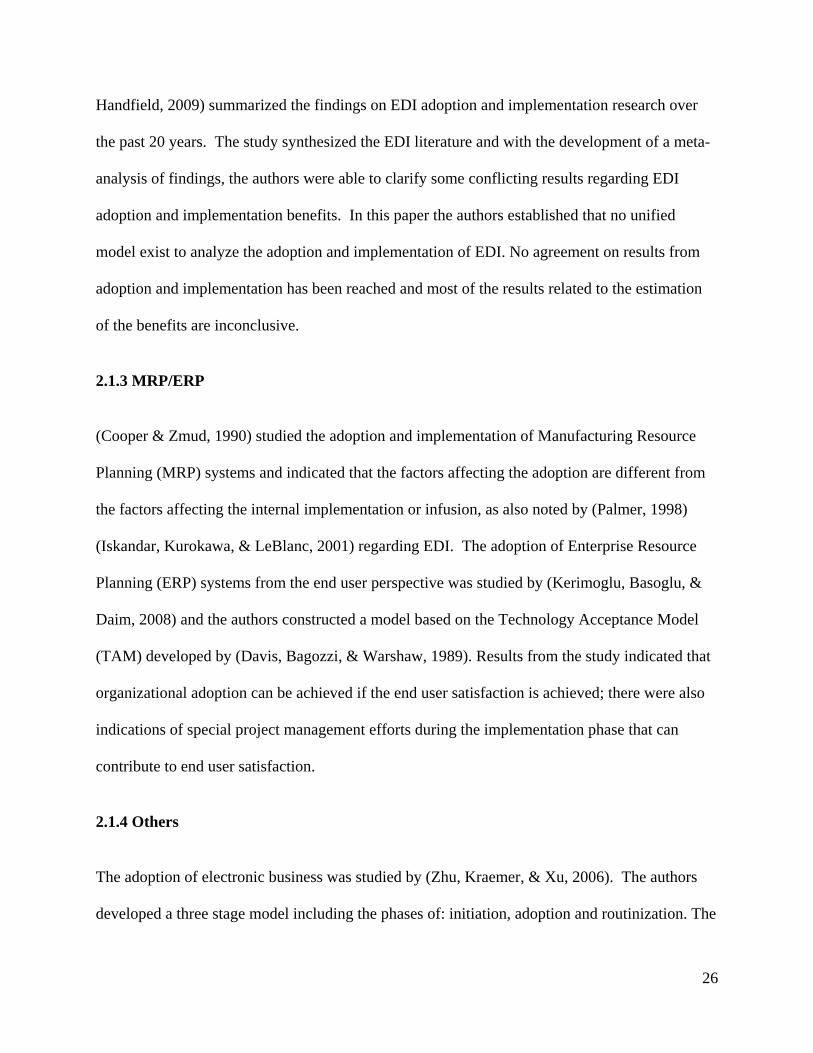
2.1.3 MRP/ERP
(Cooper & Zmud, 1990) studied the adoption and implementation of Manufacturing Resource
Planning (MRP) systems and indicated that the factors affecting the adoption are different from
the factors affecting the internal implementation or infusion, as also noted by (Palmer, 1998)
(Iskandar, Kurokawa, & LeBlanc, 2001) regarding EDI. The adoption of Enterprise Resource
Planning (ERP) systems from the end user perspective was studied by (Kerimoglu, Basoglu, &
Daim, 2008) and the authors constructed a model based on the Technology Acceptance Model
(TAM) developed by (Davis, Bagozzi, & Warshaw, 1989). Results from the study indicated that
organizational adoption can be achieved if the end user satisfaction is achieved; there were also
indications of special project management efforts during the implementation phase that can
contribute to end user satisfaction.
2.1.4 Others
The adoption of electronic business was studied by (Zhu, Kraemer, & Xu, 2006). The authors
developed a three stage model including the phases of: initiation, adoption and routinization. The
27
model was based on the TOE model (Tornatzky & Fleisher, 1990) and some of the findings
indicated that competition positively affects adoption and initiation, and that resource availability
had an impact on initiation. The analysis of the telecommunication services in Vietnam was
performed by (Hwang, Cho, & Long, 2009) with the use of a diffusion model. The findings of
the model implementation suggested that a regulation that could guarantee competition could be
a factor to positively influence the diffusion process. An extension of TAM (Davis, Bagozzi, &
Warshaw, 1989) was developed by (Quan, Hao, & Jianxin, 2010) in order to study the adoption
of mobile services. The authors did so by introducing the perceived credibility and perceived
constructs into the model. The adoption of RFID from the end user perspective was studied by
(Hossain & Prybutok, 2008), the authors developed a model based on TAM and proposed that
convenience, culture, privacy, regulation and security were important factors related to the RFID
adoption among end users.
2.1.5 Conceptual models elements and mathematical modeling (specific findings)
A conceptual model was identified in 17 documents as shown in Table 3. The most widely used
technique to test a proposed conceptual model and its related hypothesis was a survey or industry
panel. The main adopting unit (U) referenced in most of the documents is the organization (O)
in contrast to the end user perspective (E). There are 9 documents related to both adoption and
implementation, 9 documents with a specific focus on adoption and 2 dealing with only
implementation. The exploration of the benefits (B) was found in 5 documents. There is one
document related to the development of a mathematical diffusion model. The summary of the
findings is presented in Table 3.

28
For the conceptual models the dominant approach is the Diffusion of Innovations (DOI), about
half of the identified documents used that approach. The Technology, Organization and
Environment (TOE) model was also present, both DOI and TOE are used to analyze the adoption
from the organizational point of view, as in the case of database machines, EDI, MRP and
electronic business. The Technology Acceptance Model (TAM) was used to study the adoption
of technology from the end user perspective as in the case of ERP, RFID and mobile services.
The realization of the benefits comes after the implementation phase. As described by
(Narayanan, Marucheck, & Handfield, 2009) , (McGowan & Madey, Adoption and
implementation of Electronic Data Interchange, 1998), (Nelson, 2003) there is a difference
between the factors affecting adoption and the factors related to the implementation. In general,
the adoption phase is the early stage of the adoption process while the implementation requires
the continued use of the technology within the organization.
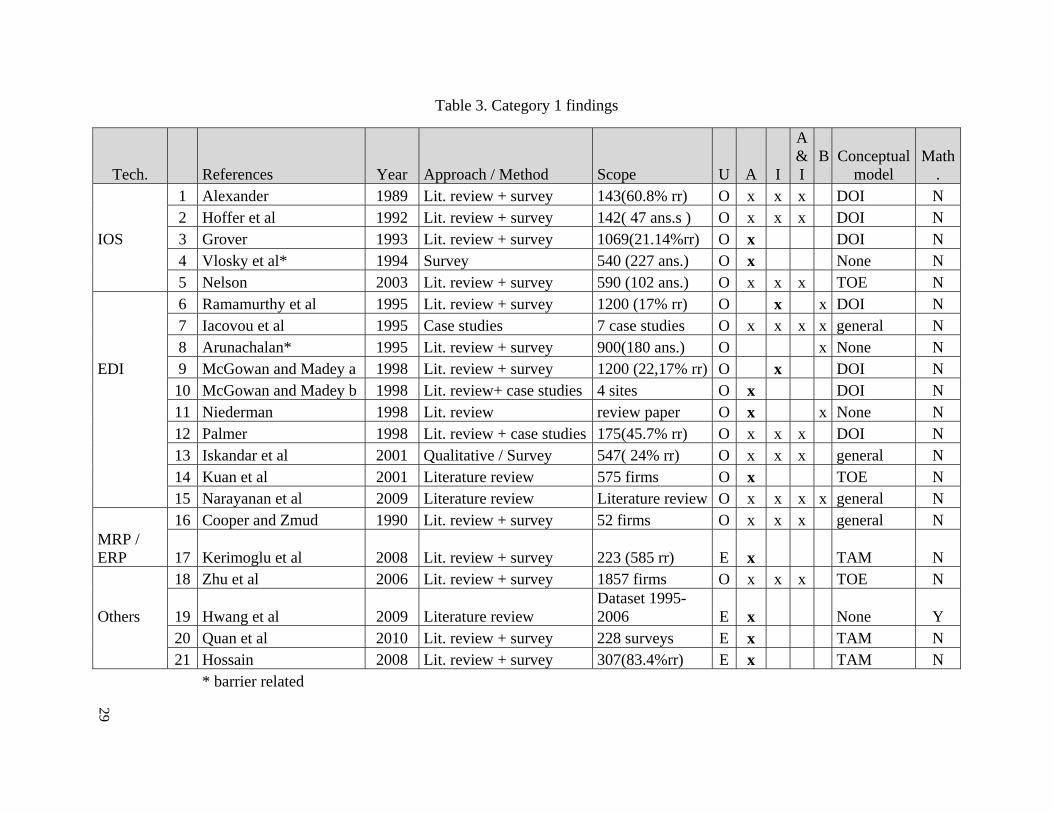
29
Table 3. Category 1 findings
Tech. References Year Approach / Method Scope U A I
A&I
B
Conceptualmodel
Math.
1 Alexander 1989 Lit. review + survey 143(60.8% rr) O x x x DOI N 2 Hoffer et al 1992 Lit. review + survey 142( 47 ans.s ) O x x x DOI N IOS 3 Grover 1993 Lit. review + survey 1069(21.14%rr) O x DOI N 4 Vlosky et al* 1994 Survey 540 (227 ans.) O x None N 5 Nelson 2003 Lit. review + survey 590 (102 ans.) O x x x TOE N 6 Ramamurthy et al 1995 Lit. review + survey 1200 (17% rr) O x x DOI N 7 Iacovou et al 1995 Case studies 7 case studies O x x x x general N 8 Arunachalan* 1995 Lit. review + survey 900(180 ans.) O x None N EDI 9 McGowan and Madey a 1998 Lit. review + survey 1200 (22,17% rr) O x DOI N 10 McGowan and Madey b 1998 Lit. review+ case studies 4 sites O x DOI N 11 Niederman 1998 Lit. review review paper O x x None N 12 Palmer 1998 Lit. review + case studies 175(45.7% rr) O x x x DOI N 13 Iskandar et al 2001 Qualitative / Survey 547( 24% rr) O x x x general N 14 Kuan et al 2001 Literature review 575 firms O x TOE N 15 Narayanan et al 2009 Literature review Literature review O x x x x general N 16 Cooper and Zmud 1990 Lit. review + survey 52 firms O x x x general N MRP / ERP 17 Kerimoglu et al 2008 Lit. review + survey 223 (585 rr) E x TAM N 18 Zhu et al 2006 Lit. review + survey 1857 firms O x x x TOE N
Others 19 Hwang et al 2009 Literature review Dataset 1995-2006 E x None Y
20 Quan et al 2010 Lit. review + survey 228 surveys E x TAM N 21 Hossain 2008 Lit. review + survey 307(83.4%rr) E x TAM N
* barrier related

30
According to the mathematical models explored, (Hwang, Cho, & Long, 2009) developed a
diffusion model to investigate the factors affecting the diffusion of mobile telephone services in
Vietnam. The logistic regression model was found to perform better as a descriptive tool for the
period under study (1995-2006) and it was used to determine the factors affecting the speed of
diffusion. The findings suggest that a regulation that could guarantee competition in the market
is one of the most important factors for a positive diffusion process.
2.2 Category 2 (Healthcare)
There were 20 healthcare related adoption documents in total. The documents were fully
reviewed and classified according to the document type and focus. The healthcare related
documents were grouped in the following categories: medical technology, assisting technology,
Electronic Health Records (EHR) and Health Information Technology (HIT). The documents
were also reviewed according to the scope, modeling approach and factor identification methods;
most of the documents were within the present decade. The summary of the documents within
category two is shown in Table 2.
2.2.1 Medical technology
The work developed by (Greer, 1985) reported on the findings of the analysis of adoption of 12
medical technologies among 25 healthcare institutions. The author found that within the
explored healthcare institutions there were three decision systems involved in the adoption
decision (medical-individualistic, fiscal-managerial and strategic-institutional). With the use of
case studies the author found that each technology was related to a specific system. This finding
highlights the importance of establishing the distinction among technologies in order to analyze

31
the adoption process. For example there are technologies that require the end user (physician) to
be comfortable to use, while others that could serve the purpose of improving the efficiency of a
given department do not require physician involvement; then a different system would be
considered in the decision process.
2.2.2 Assisting technology
In the case of telemedicine, (Paul, Pearlson, & McDaniel, 1999) explored the technological
barriers to its adoption by the use of case studies. The authors found that end user training was
one of the most relevant barriers. The work developed by (Sheng, R., Jen Hwa, Wei, Higa, &
A., 1998) introduced a conceptual model for the internal adoption of telemedicine and described
the individual-organizational space in which the adoption takes place. The adoption of Customer
Relationship Management (CRM) systems in the hospital setting was studied by (Hung, Hung,
Tsai, & Jian, 2009) the authors proposed a conceptual model based on TOE (Tornatzky &
Fleisher, 1990) and found that hospital size, capabilities of staff, innovation of senior executives,
knowledge management capabilities and relative advantage have significant influence on CRM
systems adoption.
2.2.3 Electronic Health Records - EHR
The study developed by (Miller & Sim, 2004) focused on the identification of barriers to EHR
adoption among physicians. The study was based on interviews with healthcare professionals.
Among the identified barriers are the high initial cost, uncertain financial benefits, inadequate
support and lack of incentives. According to (Ash & Bates, 2005) the barriers to Computarized
Physician Order Entry (CPOE) can be grouped in four factors, organizational, technical,

32
environmental and end user related. Among the recommendations to promote EHR adoption,
(Middleton, Hammond, Brenan, & Cooper, 2005) discussed five options, expand the Health
Information Technology HIT research agenda, establish financial benefits to stimulate the EHR
marketplace, coordinate HIT standards development, establish enabling policy and promote
educational activities.
The research conducted by (Chang, Hwang, Hung, Lin, & Yen, 2007) studied the adoption of
electronic signature among hospitals and developed a conceptual model based on TOE. The
authors reported that there are four significant factors that distinguish adopters from non
adopters: hospital size, adequate resources, vendor support and government policy.
(Woodside, 2007) developed a model based on game theory to explain the EHR adoption. In this
model the author assumed the EHR adoption as a zero sum game with three players, the payer,
the healthcare provider and the consumer; all players were assumed to act rationally which
means all players tended to maximize their payoffs. The model identified the payoffs for each
player as well as the stages of the game in order to reach equilibrium or recommended path.
Two equilibriums were reached during the game. The first one, when the payer subsidizes the
provider to the extent that it is profitable and the second one, when the payer subsidizes the
provider indirectly through the consumer, to the extent that it is profitable.
The research developed by (Erdil & Emerson, Modeling the dynamics of Electronic Health
Records adoption in the U.S healthcare system, 2008) was related to the study of EHR adoption.
The research started with the identification of the barriers to EHR adoption in the form of a
causal loop diagram. The causal loop diagram captured the cause and effect relationship in the
form of feedback loops amongst the factors influencing the EHR adoption process. Then, the
33
structure of the causal loop diagram is used to construct a model to simulate the hospital's EHR
adoption rate over time (Erdil & Emerson, Simulation modeling of electronic health records
adoption in the U.S healthcare system, 2009). Cost was identified as one of the main factors
affecting adoption. The details of the model development and preliminary findings are presented
in the dissertation (Erdil, Systems analysis of Electronic Health Record adoption in the U.S.
healthcare system, 2009).
2.2.4 Health Information Technology - HIT
The work developed by RAND Corporation on the adoption of Health Information Technology
HIT was associated in particular to the adoption of HIT in the context of Electronic Health
Records. As reported by (Bower, The Diffusion and Value of Healthcare Information
Technology, 2005) the penetration of EHR can be approximated by measuring the number of
hospitals having a set of applications such as clinical decision support systems, computerized
patient records and a clinical data repository. Using that definition the author was able to
establish that the penetration of EHR by the year 2002 was about 32%. An assessment of causal
diffusion variables was developed and seven variables were identified: relative advantage to
clinicians, compatibility, complexity, external influence, social pressure, network effects and
specialization. The potential value of system wide HIT diffusion was estimated by defining
different scenarios for productivity gains related to EHR adoption. The intervention of the
government in order to speed up diffusion was also discussed. The analysis of the pattern of HIT
adoption among for profit and non for profit hospitals was developed by (Fonkych & Taylor,
2005), the report findings suggest there is high heterogeneity in HIT adoption across HIT
applications and types of hospitals.

34
The report by (Girosi, Meili, & Scoville, 2005) identified the cost and benefits of HIT. The
potential health and financial benefits of health information technology HIT adoption were
examined by (Hillestad, et al., 2005). In order to do that, a comparison of the use of IT in
healthcare with the use of IT in other industries was developed; additionally the potential savings
and costs of widespread adoption of Electronic Medical Record (EMR) systems were estimated.
The authors concluded that effective EMR implementation could save more than 81 billion
annually by improving health care efficiency and safety. Some of the identified factors affecting
adoption were: the high starting and implementation costs, the slow and uncertain payoffs and
the disruption of current practice. The work developed by (Shortliffe, 2005) described the
current opportunities and challenges of medical records automation; among the challenges,
cultural barriers, business case absence and structural barriers were identified.
Another HIT report by RAND Corporation (Oranje-Nassau, Schindler, Valeri, Vilamovska,
Hatziandreau, & Conklin, 2009) commented on the identification of drivers and barriers of RFID
adoption in healthcare. Among the main barriers to RFID adoption are organizational issues such
as change management and end user resistance; technical issues such as scalability, integration
and market maturity; and security and privacy issues such as data integrity and reliability.
The work by (Daim, Tarman, & Basoglu, Exploring Barriers to Innovation Diffusion in
Healthcare Service Organizations: An issue for effective integration of service architecture and
information technologies, 2008) focused on HIT adoption in general. The main barriers to
adoption were identified through a literature review and an initial conceptual model was
proposed. The assessment of the barriers related to Personal Health Records adoption (PHR)
35
were explored by (Daim, Chan, Amer, & Aldhaban, 2009), this assessment was developed using
the TAM conceptual model.
2.2.5 Conceptual model elements and mathematical modeling (specific findings)
A conceptual model was identified within 6 documents. There were 7 documents associated to
the identification of barriers. There were 4 documents related to the estimation of the benefits,
most of those are RAND reports, based on the estimation of the value of HIT and EHR in
particular. The summary of the findings is presented in Table 4. Among the conceptual models
there was no dominant approach. The unit of analysis in the case of healthcare related
technology adoption processes included the end user (E), which could be the physician or the
nurse. The end user perspective was not present in the non-healthcare related technology
adoption (IOS/EDI) documents. The adoption and implementation studies (5) were found in the
review but there were no specific studies related to the specific implementation phase. This issue
can be associated to the lack of studies linked to the estimation of the benefits of EHR adoption.
This can be an indication of the early stage of this adoption process according to the phases
defined by Rogers (Rogers E. M., 1983).
The two specific mathematical modeling efforts are summarized in the work developed by
(Erdil, Systems analysis of Electronic Health Record adoption in the U.S. healthcare system,
2009) and (Woodside, 2007). These authors explored the use of game theory and system
dynamics modeling to understand the EHR adoption process.

36
2.3 Theoretical findings
2.3.1 Technology adoption conceptual models
The documents referenced in this section belong to the group of 23 documents associated to
specific conceptual models as shown in Tables 3 and 4. There were 17 documents related to a
conceptual model within the category 1 reviewed documents and there were 6 documents related
to a conceptual model within the category 2 reviewed documents. The main conceptual models
identified through the literature review were Diffusion of Innovations (DOI), Technology
Organization and Environment (TOE) model and Technology Acceptance Model (TAM).
DOI
The work initiated by (Rogers, Diffusion of Innovations, 1983) developed most of the foundation
for the diffusion of innovations approach. The author defined the different adoption stages and
how the characteristics of the innovation influence the adoption process. The adoption stages are
illustrated in Figure 4. According to (Rogers, Diffusion of Innovations, 1983), there are different
factors affecting the adoption rate. Those factors are mostly related to the characteristics of the
technology and the most relevant ones include: relative advantage, complexity and compatibility.
This conceptual model was present in 8 of the 23 documents included in the analysis of
conceptual models.

37
Table 4. Category 2 Findings
Technology References Year Focus Approach / Method U A IA&
I B Conceptual model Math.
Medical technology 1 Greer 1985
12 technologies Case studies O x None N
Assisting 2 Sheng et al 1998 Telem. Case studies E,O x x x General N technology 3 Paul et al* 1999 Telem. Site visits + interv. O x None N 4 Hung et al 2009 CRM Surveys + H. testing O x TOE N 5 Miller and Sim* 2004 EMR Experts opinion E,O x None N 6 Ash and Bates* 2005 EHR Experts opinion O x None N 7 Middleton et al 2005 EHR Experts opinion O x None N EHR 8 Woodside 2007 EHR Model O x x x None Y
9 Chang et al 2007 e-sign. Lit. review + surveys O x TOE N
10 Erdil* 2008 EHR Lit. review O x None N 11 Erdil a 2009 EHR Lit. review O x x x None Y 12 Erdil b 2009 EHR Lit. review + survey O x None Y 13 Hillestad et al 2005 HIT / EMR Report summary O x x x x None N
HIT/ EHR 14 Shortliffe* 2005 HIT Lit. review + opinion O x None N
15 Bower 2005 HIT/EHR Lit. review + interv. O x x DOI N
16 Fonkych and Taylor* 2005 HIT Report summary O x None N
17 Girosi et al 2005 HIT/EHR Report summary O x x x x None N 18 Conklin et al* 2009 RFID Lit. review + interv. O x x None N 19 Daim et al 2008 HIT Lit. review + interv. O x TAM N 20 Daim et al 2009 PHR Lit.review + survey E x TAM N
* barrier related document

38
According to (Niederman, 1998) the first goal of diffusion theory is to develop a general
understanding of individual and organizational reactions to the introduction of new technologies.
This general understanding includes the identification of factors that can influence the processes
or outcomes of the innovation project to varying degrees under varying circumstances. The
second goal of diffusion theory is to provide a method of analyzing the characteristics of a
proposed new technology in order to forecast likely patterns of diffusion within and or outside
the organization as well as to anticipate problems and intervene in positive ways to overcome
these problems. The analysis of an adoption process requires the definition of a unit of adoption
or perspective.
Figure 4. Adoption stages (adapted from Rogers, 1983)
From the DOI perspective the unit of adoption can be defined as the end user (E) or the
organization (O). The work developed by (Wolfe, 1994) introduced the concept of
organizational innovation and presented a conceptual model for its understanding.
39
TOE
The Technology, Organization, Environment (TOE) model was proposed by (Tornatzky &
Fleisher, 1990) in order to explain the factors that influence an organization's adoption process.
This conceptual model is consistent with (Rogers, Diffusion of Innovations, 1983) theory of
innovation adoption but adds the organizational and environment factors to the analysis of the
adoption process. Under the DOI approach the factors affecting the adoption can be related to
the characteristics of the technology, however there are other factors to be considered such as
organization and external related factors. This model was present in 5 of the 23 documents
related to conceptual models. The TOE conceptual model (Tornatzky & Fleisher, 1990) has
been examined by a number of empirical studies on technology adoption, in particular on the
adoption of EDI.
TAM
The Technology Acceptance Model (TAM) (Davis, Bagozzi, & Warshaw, 1989) is used to
explain the adoption of technology from the end user perspective. According to TAM there are
two key determinants of end user adoption; those are the perceived usefulness and the perceived
ease of use. The perceived usefulness is defined as the degree to which a person believes that
using a particular technology would increase his or her job performance, while the perceived
ease of use is defined as the degree to which the end user expects the technology to be free of
effort. The model provides strong empirical evidence on the contribution of these two variables
in the end user adoption decision. This conceptual model has been widely applied to explain
different end user related innovations, such as the adoption of Personal Health Records (PHR)

40
and ERP systems. There are 5 of the 23 documents related to conceptual models using this
approach.
2.3.2 Mathematical models
From the complete set of reviewed documents (41), 4 documents are related to a mathematical
modeling approach. Those are described in the following paragraphs.
Diffusion curves
The research developed by (Teng, Grover, & Guttler, 2002) on diffusion curves and
mathematical modeling provided evidence of the relationship between factors affecting a
diffusion process and the diffusion pattern. The authors used adoption related data from 21
technologies and established that the mixed influence diffusion model was one of the models that
best fit the available data. Based on that information, a classification of the different
technologies was made by using some of the parameters of the model.
Game theory
The adoption of EHR was explained by (Woodside, 2007), this work illustrated game theory as a
modeling approach for EHR. In this model the author assumed the EHR adoption as a zero sum
game with three players: the payer, the healthcare provider and the consumer. In the game all
players were assumed to act rationally which means all players will tend to maximize their
payoffs. The model identified the payoffs for each player as well as the stages of the game in
order to reach equilibrium or recommended path. Two equilibriums were reached during the
game. The first one was reached when the payer subsidizes the provider to the extent that it is

41
profitable and the second one, when the payer subsidizes the provider indirectly through the
consumer to the extent that it is profitable.
System dynamics
The research developed by (Erdil & Emerson, Modeling the dynamics of Electronic Health
Records adoption in the U.S healthcare system, 2008) was associated to the study of Electronic
Health Records EHR adoption initiated with the identification of the barriers to EHR adoption in
the form of a causal loop diagram. The causal loop diagram captured the cause and effect
relationship in the form of feedback loops amongst the factors influencing the EHR adoption
process. Following a system dynamics methodology (Erdil & Emerson, Simulation modeling of
electronic health records adoption in the U.S healthcare system, 2009) and by using the structure
of the causal loop diagram, a model to simulate the hospital's EHR adoption rate evolution over
time was developed. Cost was identified as one of the main barriers to EHR adoption. The
details of the model development and preliminary findings are presented in the dissertation
(Erdil, Systems analysis of Electronic Health Record adoption in the U.S. healthcare system,
2009).
2.4 Comparative analysis (barriers, conceptual models and adoption determinants)
For the comparative analysis two technologies were considered: IOS/EDI and EHR.
The comparative analysis included the analysis of the main conceptual model elements
(including barriers) among the selected technologies, 26 documents were reviewed as shown in
Table 5. This analysis led to the identification of the main adoption determinants.

42
2.4.1 Non healthcare adoption process (IOS/EDI)
From the main set of non healthcare related adoption documents 13 documents associated with
IOS/EDI adoption and implementations were reviewed. As noted by (Narayanan, Marucheck, &
Handfield, 2009) there was no single model to explain the adoption and implementation of EDI
from an organizational perspective, however, the main conceptual model is DOI and the
adopting unit is the organization. The factors related to the adoption were classified into three
groups (organizational factors, technology related factors and external or environmental factors)
those groups can be identified in the work developed by (Grover, 1993) and (Nelson, 2003).
External factors, internal factors, organization related factors, expected benefits and inter
organizational factors are among the factors affecting the adoption. The implementation and the
expected outcomes are related to the intensity of the internal integration. The barriers to EDI
adoption were explored by (Arunachalam, 1995).
2.4.2 Healthcare adoption process (Electronic Health Records)
As shown in Table 5 there are 13 documents related to the adoption of EHR. There are 2
documents related to conceptual models and 5 related to the identification of barriers to adoption.
Compared to IOS/EDI adoption, there are fewer adoption and implementation studies for EHR.
Most of the studies are related to adoption, fewer documents are related to EHR implementation
which gives an indication of the current EHR’s adoption stage. Among the revised documents,
the exploration of the barriers to EHR adoption is more predominant. This could be an
explanation to the absence of a conceptual model for identification standards. The barriers can
be considered in the absence of a conceptual model.

43
Table 5. Comparison
Category Reference/ Author Year Type Focus Unit Conceptual model ApproachGrover + 1993 J CIOS O Conceptual model DOI & ISVlosky et al 1994 R Retail IO O None None Nelson + 2003 D IOS O Conceptual model TOE Ramamurthy et al + 1995 J Large firms O Conceptual model DOI Iacovou et al + 1995 J SMB O Conceptual model general
1 Arunachalan 1995 J EDI users O Findings report None McGowan and Madey b 1998 B EDI O Conceptual model DOI Niederman 1998 B EDI O Literature review findings DOI Palmer + 1998 B EDI O Conceptual model DOI McGowan and Madey a + 1998 J EDI users O Conceptual model DOI Iskandar et al 2001 J Automotive O Conceptual model general Kuan et al + 2001 J SMB O Conceptual model TOE Narayanan et al + 2009 J EDI O Conceptual model general Miller and Sim 2004 J EMR E,O Identification of barriers None Ash and Bates 2005 J EHR O Identification of barriers None Middleton et al 2005 J EHR O Recommendations None Woodside 2007 J EHR O None None Chang et al + 2007 J e-signature O Conceptual model TOE
2 Erdil 2008 C EHR O Identification of barriers SD-CLD Erdil a 2009 C EHR O Simulation model SD Erdil b 2009 D EHR O Report on model findings SD Hillestad et al 2005 J HIT / EMR O None None Shortliffe 2005 J HIT O Identification of barriers None Bower 2005 R HIT/EHR O Conceptual model DOI Fonkych and Taylor 2005 R HIT O Identification of barriers None Girosi et al 2005 R HIT/EHR O None None + adoption determinant related document

44
2.4.3 Adoption determinants
In order to identify the adoption determinants, 9 documents were selected, eight of those
documents were related to IOS/EDI and one was related to EHR adoption. The findings from
each document related to the explored and empirically tested relationships between a given
factor and adoption was analyzed; this way the main adoption determinants were identified. A
detailed summary of the reviewed documents is presented in Appendix A. he summary of
adoption determinants is presented in Table 6.
Table 6. Adoption determinants
TOE categories Determinants References
T Compatibility Grover (1993); Ramamurthy et al. (1995); Narayanan et al.(2009)
T Complexity Grover (1993)
T Direct benefits Iacovou et al. (1995); Kuan et al. (2001); Narayanan et al. (2009)
T Indirect benefits Iacovou et al. (1995); Ramamurthy et al. (1995); Narayanan et al. (2009)
T Relative advantage Grover (1993); McGowan and Madey (1998a) O Adequate resources Chang et al. (2009) O Championship Grover (1993) O Cost Kuan et al. (2001)
O Hospital size Chang et al. (2009); McGowan and Madey (1998a); Palmer (1998);Narayanan et al.(2009)
O Technical competence Kuan et al. (2001)
O Top management support Grover (1993); Nelson (2003); Ramamurthy et al. (1995);McGowan and Madey (1998a)
E Competitive pressure Iacovou et al. (1995); Narayanan et al. (2009) E Customer influence McGowan and Madey (1998a) E Government policy Chang et al. (2009) E Imposition by partners Iacovou et al. (1995) E Industry influence Narayanan et al.(2009) E Vendor support Chang et al. (2009)

45
Those determinants were grouped according to the TOE model categories. In the organizational
category are: hospital size, top management support, adequate resources, championship, cost and
technical competence. In the category of technology related factors are: compatibility, direct
benefits, indirect benefits, relative advantage and complexity. In the category of environment
related factors are: competitive pressure, vendor support, government policy, imposition by
partners, customer influence and industry influence.
2.5 Summary of findings
This section presents a summary of the findings from the literature review related to technology
adoption within healthcare and non healthcare domains.
2.5.1 Non healthcare vs. Healthcare (timing)
The adoption of technology to support basic manufacturing processes started at the end of the
1980s, and there is lag compared with the adoption of technology to support healthcare supply
chain processes. Based on the date range of the documents in both groups, there is a difference
of about 15 years, between the time EDI started to penetrate in the manufacturing setting and the
initial time for EHR adoption initiation. According to the adoption phases defined by (Rogers E.
M., 1983) the EDI adoption process includes both, adoption an implementation phases
(Narayanan, Marucheck, & Handfield, 2009), however the EHR adoption is in an early stage.
No implementation phase for EHR was found or documented in any of the reviewed documents.
46
2.5.2 Estimation of benefits
During early stages of the adoption process the benefits were estimated usually by comparison
with similar industries. In the case of the healthcare supply chain a comparison with retail
industry was usually referenced. An example of this fact is the work developed by RAND
Corporation on Health Information Technology HIT. In the case of EDI the results of the meta
analysis developed by (Narayanan, Marucheck, & Handfield, 2009) show inconclusive results
regarding the benefits of EDI adoption.
2.5.3 Conceptual models (characterization)
As defined by the MOT approach, a conceptual model is used to explain a given adoption
process. The explanation (characterization) of the adoption process is associated to the nature of
the conceptual model (e.g DOI, TOE, TAM), the unit of adoption defined for the analysis (e.g.
end user, organization), the phases (e.g. adoption, implementation) and the main adoption
determinants or the barriers, in the absence of a conceptual model.
The non healthcare related adoption processes explored through the literature review can be
characterized by the IOS/EDI adoption. The most relevant approach used to develop a
conceptual model is the Diffusion of Innovations (DOI) approach. In the case of DOI the
adopting unit can be defined as the organization. There are different stages of adoption as
described by (Rogers, Diffusion of Innovations, 1983). The work developed by (Ramamurthy &
Premkumar, 1995) and (Narayanan, Marucheck, & Handfield, 2009) in the case of EDI illustrate
the different phases and its relationship between implementation and outcomes. Factors
affecting adoption are different from implementation factors, the work of (McGowan & Madey,

47
Adoption and implementation of Electronic Data Interchange, 1998), (Nelson, 2003),(Iskandar,
Kurokawa, & LeBlanc, 2001), and (Palmer, 1998) provide an indication of that fact even though
some authors note that the difference is not significant when a short implementation time is
considered.
The healthcare related adoption processes explored through the literature review can be
characterized by EHR adoption. There is no dominant conceptual model among the healthcare
related adoption processes explored in Section 2.2, however the TAM model was useful in
explaining adoption from the end user perspective as in the case of (Daim, Chan, Amer, &
Aldhaban, 2009) for Personal Health Records PHR, where an individual is making the decision
or whether or not to adopt PHR. During the initial stage of an adoption process usually the
barriers to adoption are explored as in the case of EDI (Arunachalam, 1995) and EHR (Ash &
Bates, 2005), (Miller & Sim, 2004).
2.5.4 Modeling approach
As explained in Section 2.3.2, among the reviewed documents there is no dominant approach to
model an adoption process. The relevant findings are related to techniques used in isolation. The
more predominant technique was diffusion curves in particular for the non-healthcare related
adoption processes. The use of game theory and system dynamics modeling was used to model
EHR adoption.
2.6 Conclusion
The characterization of adoption process within the healthcare and non-healthcare domains was
established, conceptual models were identified, as well as the adoption determinants and main

48
barriers. The findings presented a conceptualization of a given adoption process within
healthcare and outside of the healthcare domain. This is a partial answer for the two research
questions initially proposed. The need for the review of the data standards related literature in
order to establish a comparison was evident; the comparison is developed in the next chapter.
49
3. Factors affecting identification standards adoption
The goal of this chapter is to answer the following research question as established in Chapter 1:
What is preventing healthcare supply chain members and healthcare providers in
particular from adopting identification standards and its supporting technologies? What
are the major barriers?
This chapter reports on a literature review associated to data standards related literature in order
to identify the main factors affecting the adoption process. Based on the findings from this
literature review and the findings from the previous chapter, a comparison of the identification
standards adoption process and the adoption of Electronic Data Interchange (EDI) and Electronic
Health Records (EHR) was developed. A conceptual model to explain the factors affecting the
identification standards adoption process was proposed. The link between the proposed
conceptual model with subsequent modeling efforts is explained along with the implications of
current findings.
3.1 Data standards related literature review
The literature review was initiated with the review of the documents available through the main
trade journals (periodicals). The following periodicals were explored: Health Purchasing News
(HPN), Modern Materials Handling (MMH), Healthcare Financial Management Association
(HFMA) Journal and the Journal of the Healthcare Information and Management Systems
Society (JHIMS). The ProQuest data base was used for the HFMA journal and for the MMH
and HPN periodicals. The HFMA journal had full coverage since 1987, MMH had full coverage
since 2004 and HPN had full coverage since 2001. The JHIMS was accessed from the

50
Healthcare Information and Management Systems Society (HIMSS) website, and the issues since
2005 were reviewed by topic, title and abstract. The basic terms for the search were data
standards and health care supply chain; 93 articles matched the criteria. The initial set of
documents was reviewed in order to establish if any of those documents had an explicit
relationship to data standards adoption in total 27 articles were identified.
The 27 articles were fully reviewed and the review process led to the identification of 33
additional documents. A total 60 documents were identified and those documents were grouped
in the following categories:
Trade journals (27)
Surveys and studies (8)
Industry reports and white papers (13)
GS1 related documents (6)
Others (6)
The final set of documents was grouped by category in two parts A and B as shown in Tables 7
and 8 respectively. The classified documents were fully reviewed in order to establish the
barriers to data standards adoption; the terms conceptual model and mathematical modeling were
also included in the review. The results from the review by category are presented in the
following section.

51
3.1.1 Findings by category
Trade journals
The industry perception of the identification standards adoption movement can be explained
through the trade literature documentation. 27 documents were reviewed as shown in Table 7.
The Department of Defense (DoD) pilot showed promising results for synchronizing data in
healthcare, (Garvin, 2006) and the use of a Product Data Utility (PDU) as a centralized and
standardized source of product related information. The concept of data synchronization was
initially embraced by the DoD pilot. The results demonstrated the concept of a PDU for
healthcare as a feasible one (Levine, 2007).
The efficiency of supply chain processes is clearly reduced due to the lack of a standardized or a
unique numbering scheme. The FDA in 2004 established a rule requiring the labeling of drugs
using the National Drug Code (NDC) number which was created to help reduce medication
errors. However, medical devices were excluded from this barcode rule due to the lack of a
unique numbering system for medical devices and supplies (Barlow, Sync or swim: Who should
blink first and why?, 2007). The FDA’s current authority only applies to device manufacturers;
it cannot reach the provider side (Barlow, FDA Negotiates through device data standards
stalemate, 2010). The FDA also presents the option of multiple standards and not to endorse a
particular one. They believe the industry would benefit more with the presence of multiple
standards since it could leave the door open for the development of options that could address
identification issues that neither GS1 nor HIBCC can adequately address (e.g. ISBT 128 standard
for tissues).

52
Table 7. Identification standards literature review Part A
Category Author Date Journal or Document Title Topic Garvin* may-06 Healthcare Purchasing News Data synchronization Barlow abr-07 Healthcare Purchasing News Sync or swim+ Levine abr-07 Healthcare Purchasing News DoD Pilot results Barlow f jun-08 Healthcare Purchasing News Data Standards precautions Barlow d* abr-09 Healthcare Purchasing News Stimulus package Barlow e may-09 Healthcare Purchasing News Premier Perrin sep-09 Healthcare Purchasing News Supply chain standards Barlow* dic-09 Healthcare Purchasing News Year end Barlow c feb-10 Healthcare Purchasing News FDA viewpoint Barlow b* feb-10 Healthcare Purchasing News VHA viewpoint - Alliance Barlow a* feb-10 Healthcare Purchasing News Deadlines Langabeer 2005 JHIMS Supply Chain IT
Trade Thompson et al. 2007 JHIMS Benefits EHR+ Literature Murphy* 2008 JHIMS HIT adoption
Blachowicz et al. 2008 JHIMS Future EHR ROI Krohn 2009 JHIMS Interoperability Burke et al. 2009 JHIMS Best of Breed strategies Edwards et al. 2010 JHIMS Barriers related to HIE and EHR Berling and Geppi 1989 Healthcare Financial Management Early supply chain concepts Moynihan 1997 Healthcare Financial Management EHCR related - EDI adoption+ Brennan 1998 Healthcare Financial Management EHCR related+ Brody 2007 Healthcare Financial Management Data synchronization Belkoski* 2008 Healthcare Financial Management Retail model+ Kowalsky 2009 Healthcare Financial Management Strategic approach Burke 2008 Materials Management in Healthcare DoD Pilot lessons learned Burke 2008 Materials Management in Healthcare DoD Pilot lessons learned De John 2008 Materials Management in Healthcare Standards in motion+
* barrier related document + benefits related document

53
Table 8. Identification standards literature review Part B
Category Author Date Journal or Document Title Topic EHCR 1996 Improving the efficiency of the healthacare supply chain Supply Chain Strategies+ AHA Survey* 2005 Forward Momentum HIT = EHR most of the time
Surveys AHA Report 2006 Adopting Technological Innovations in Hospitals focus HIT and AHA Survey* 2007 Continued Progress focus HIT in general
Studies HFMA Survey 2005 HFMA 2005 healthcare supply chain benchmarking survey Opportunities+ HFMA Survey 2008 HFMA 2008 healthcare supply chain survey Opportunities+ CHIL Survey* 2009 The State of Healthcare Logistics Barriers to IdS adoption HIMSS report* 2010 E-procurement for supply chain management EDI adoption Garg et al 1999 17 Billion Reasons to Say Thanks Cost and benefits UPC+ HIMSS report* 2003 Guide for the Use of BC Technology in Healthcare Focus on drug administration McKesson white paper 2004 Healthcare supply chain management and the internet eCommerce focus+ ATKS report 2004 Connect the dots EPC and GDS focus+
Industry Hefflin (ECRI)* 2005 Automatic Identification of Medicel Devices UDI challenges Reports ERG* 2006 Unique identification for medical devices UDI challenges+
Rosenfeld 2006 Data Synchronization in Healthcare: A Solvable Problem GDSN Healthcare roadmap+ Accenture 2006 Synchronization GDSN benefits (retail)+ Shemm et al 2007 Global Data Synchronization GDSN trends+ MIT CTL report 2006 Transforming the Healthcare Supply Chain HCSC problems+ The academy study 2008 SCM Practices of the Largest Health Systems Best practices+ Lawson white paper 2008 Getting Started with Standards Based Operating Procedures Implementation road map+ Simpson and Kleinberg 2009 Implementation Guide to Bar Coding ain Healthcare Pharmaceutical adm. Related Bix et al 2007 Global Data Standards in the Healthcare Supply Chain Costs and benefits+ DoD Pilot Report 2007 Results from DoD HealthcareGDSN Pilot Phase IIA Lessons learned GDSN pilot+
GS1 GS1 and HCSC 2009 GS1 Standards in the Healthcare Supply Chain Definitions+ related Seton 2009 A GS1 Healthcare US Success Story Perfect order definition
GS1 System of standards 2010 The Value and Benefits of the GS1 System of Standards Definitions ChES HIGPA Survey* 2009 Putting the Pieces Together IT solution provider focus
* barrier related document + benefits related document

54
Some Integrated Delivery Networks (IDNs) have called for the government to support the use of
GS1 standards as they support and promote the use of Electronic Medical Records (EMR)
(Barlow, Alliance subgroup throws down device data standards gauntlet, 2010). According to
the authors there is no sense if a hospital has an EMR and still has to key in the product numbers
due to the lack of standards and automation at the point of use.
The Efficient Healthcare Consumer Response (EHCR) initiative (CSC, 1996) was referenced as
the main starting point addressing the issues such as: the lack of unique identifiers for products
and locations, the lack of EDI capabilities at the healthcare provider level and the low
penetration of point of use barcode enabled technology (Moynihan, 1997). However, just until
2007 standards movement started to take shape. This movement was followed by the positive
results from the Department of Defense (DoD) pilot (Burke, Hospitals lessons in data
synchronization, 2008), (Burke, Progressive Pilots, 2008) on testing the Product Data Utility
(PDU) as a feasible concept for the healthcare industry.
Industry groups are collaborating to promote data standards adoption (Barlow, Alliance subgroup
throws down device data standards gauntlet, 2010). The FDA is also working on the draft of a
UDI regulation for medical devices and supplies. Technology adoption plays an important role
on data standards adoption as explained by (Langabeer, 2005). This is a key issue to be
addresses in this research, the relationship between technology adoption and adoption of
standards at the healthcare provider level. It is assumed that the underlying technology should be
installed and running for identification standards adoption and use.

55
Surveys and studies
Within the surveys and studies category, 8 relevant documents were identified. The initial study
(CSC, 1996) identified three main strategies and four main enablers for healthcare supply chain
improvement. Among the strategies were efficient product movement, the efficient order
management and the efficient information sharing. The four enablers were categorized in
strategic and tactical. At the strategic level: partnerships and alliances, and change management.
At the tactical level: information technologies and activity based costing. Within the information
technologies enablers, the critical technologies identified were: unique identifiers, bar code
labeling and EDI. The main elements on the third strategy include solution sets directly related
to the implementation and use of identification standards and its supporting technologies.
The surveys developed by the American Hospital Association (AHA) (AHA, 2006),(AHA,
2007), (AHA, 2005) were related to the adoption of HIT for clinical and non clinical purposes by
US hospitals. From these documents the current status of one of the most important clinical
applications, the EHR, was inferred. The penetration rate for EHR is about 32%. The barriers to
adoption were also explicitly mentioned but those barriers were usually associated with the
adoption of HIT in the context of Electronic Health Records. The main barriers were: the initial
costs, ongoing costs, interoperability with current systems, acceptance by clinical staff,
availability of trained IT staff and the inability of technology to meet the process requirements.
The survey developed by (Nachtmann & Pohl, The State of Healthcare Logistics: Cost and
Quality, 2009) referenced the technological component as one of the main barriers to data
standards adoption. Among the other barriers were the lack of resources, supply chain partners,
56
universal acceptance, lack of knowledge, system diversity, management buy-in, data issues,
organization size, government, low priority and cultural resistance.
The surveys showed that the data standards movement initiated in 2007 had an impact on
industry perceptions. The HFMA surveys of 2005 and 2008 (HFMA, 2005), (HFMA, 2008)
provided an indication of that fact. The HFMA survey of 2005 did not show data standardization
as an explicit opportunity for improvement, but it appeared in the 2008 survey as a significant
one. The survey developed by (Nachtmann & Pohl, The State of Healthcare Logistics: Cost and
Quality, 2009) also indicated that data standards are a major issue, labeling it as one of the main
challenges to achieve supply chain excellence. Some confusion still exists regarding the
definition of data standards, as pointed out by (Kohn, Corrigan, & Donaldson, 2000). The data
standards concept is too broad. It could mean: standardization within the hospital, process
standardization or the use of standard identifiers for products and locations. A specific reference
to the definition of data standards in the context of the explored surveys was not found.
Industry reports
Within the industry reports category, 13 relevant documents were identified. The report by
(Garg, Jones, & Sheedy, 1999) described the methodology followed in order to establish the
gains of the Universal Product Code (UPC) adoption by the grocery industry; the gains were
estimated to be approximately 17 billion dollars. Hard savings and soft savings were initially
estimated and the report showed how most of the gains can be attributed to hard savings,
however, the soft savings are still to be realized.

57
The report by (HIMSS, 2003) referred to the use of barcode technology in healthcare but is
directly related to drug administration. This report highlighted the importance of the National
Drug Code (NDC) as an identifier for most of pharmaceutical products but calls the attention of
most of the healthcare supply chain players on its proper use. Following the report by HIMSS,
two reports were published. The first one, developed by (McKesson, 2004) related to electronic
commerce and the second one developed by ATKS (ATKS, 2004), related to Electronic Product
Code (EPC) adoption. Both reports highlighted the importance of standards for electronic
transactions and identified the critical elements required for electronic commerce in healthcare.
The Unique Device Identification (UDI) initiative was discussed by (ERG, 2006) and (Hefflin,
2005). Among the main barriers to UDI implementation were the lack of a unique identifier for
medical devices and supplies and the low technology (auto identification and data capture)
penetration at the healthcare provider level in particular at the point of use.
The report by Accenture (Accenture, 2006) described the benefits of data synchronization in the
retail context and presented an estimation of benefits of its adoption within healthcare. The
report by (Shemm, Legner, & Otto, 2007) discussed the Global Data Synchronization Network
(GDSN) from a global perspective. The report by (Rosenfeld & Stelzer, 2006) described the
synchronization concept in healthcare and compared it with what has been done in retail.
According to the authors, the gains from data synchronization could be significant, if healthcare
industry moves in that direction. The report also presented some tools to estimate the benefits of
data synchronization in healthcare.
The (CTL, 2006) report described the main problems identified within the healthcare supply
chain, in fact, some of the identified problems were: cost growth, lack of a big player at the end

58
of the chain, process inefficiency and lack of integration of the last echelon; from the receiving
dock to the doctor. The lack of a unique identifier for healthcare products is also highlighted as
one on the major challenges. The study developed by (The Academy and Broadlane, 2008)
revealed a set of practices common among the best performer hospitals. Among the best
practices were: leadership and corporate office presence for supply chain related issues,
existence of system wide policies and physician engagement. The report by (Lawson, 2008)
described a roadmap for data standards implementation along with a check list for information
technology and system readiness. The book by (Simpson & Kleinberg, 2009) was related to the
implementation of barcode technology in clinical and supply chain applications. This book made
explicit reference to the need of a standard for product identification and revealed the
implications of its absence for all healthcare supply chain players.
The retail industry was used as a reference point to estimate data synchronization benefits. The
UDI initiative was presented as a possible solution to fix the problem of the lack of unique
identifiers for medical devices and supplies. The main problems related to healthcare supply
chain are associated to the lack of a unique identifier as a main source of process inefficiencies.
In this regard, having a unique identifier for products and locations would help to increase supply
chain related processes efficiency and also facilitate information exchange and synchronization
among healthcare supply chain members.
GS1 documentation
Within the GS1 related documentation category, 6 documents were identified. The effort on data
standardization within the medical surgical supply chain was initiated by the Department of
Defense (DoD, 2007). The conceptualization of the Universal Product Number (UPN) as a

59
unique identifier for medical surgical supplies (including devices) and the development of the
PDU concept as a unique repository for product related information were among the main
contributions of the initial phases of the DoD pilot. This pilot in recent versions involved major
healthcare supply chain players and it was proving the Global Data Synchronization Network
(GDSN) as a feasible concept for the healthcare industry. The study developed by (Bix, Clarke,
Lockhart, Twede, & Spink, 2007) was an extensive study on the costs and benefits of standards
adoption. It gave basic definitions regarding the hospital supply chain and presented a
compilation of previous studies dealing with cost benefit estimation of automation within the
healthcare supply chain.
Basic definitions about standards and health care supply chain are given by (GS1, 2009), (GS1,
2010). The main source for GS1 data standards related information is the official GS1
Healthcare US website. Specific deadlines for product and location identification standards
adoption have been established by the industry. The deadline for location identifiers adoption
was December 31st 2010 and the deadline for product identifiers is December 31st 2012.
Currently the healthcare industry is moving towards the readiness assessment of the different
healthcare supply chain players, but adoption remains low. The readiness assessment is
voluntary and GS1 healthcare US is providing tools for healthcare supply chain members who
would like to assess their current adoption level. The assessment of technology solution
providers (ChEs HIGPA GS1, 2009) revealed that most of the technology solution providers
could at least store the identifiers; however, the transaction capabilities are still an issue to be
resolved.

60
The documents reviewed in this section included documents related to key definitions, however,
case studies were not considered. The review of those cases is out of scope for this research but
its importance is acknowledged. The GS1 system of standards is currently the standard being
promoted, but it could be any standard, for analysis purposes, as long as it is unique. The focus
of this research is not GS1 standards; it is the concept of product and location identifiers
standards adoption along with the required technology to make use of the standards. It is
assumed that technology plays a key role in identification standards adoption.
Others
Within this category a brief exploration of the identification standards adoption concept among
the pharmaceutical supply chain was developed; 6 documents were identified. An earlier
document dated 1996 (Bedard, 1996) presented the fact that even though the barcode technology
was present, it was not widely deployed within healthcare industry, this problem is still
persistent. The GS1 documentation is related to the traceability and electronic pedigree
initiatives within the pharmaceutical supply chain (GS1 US, 2010). The pharmaceutical supply
chain related documentation is a reference point for Bedside Point of Care (BPOC) systems and
Barcode Medication Administration (BCMA) adoption. The report developed by (Grotting,
Yang, Kelly, Brown, & Trohimovich, 2002), presented the benefits and barriers of BPOC
systems in the context of patient safety through the use of case studies. The workarounds to
BCMA adoption are explained by (Koppel, Wetterneck, Telles, & Karsh, 2008) and among the
possible causes is the lack of medications with a barcode. The adoption of BCMA from the end
user perspective is explained by (Patterson, Chapman, Render, & Rogers, 2006), the authors
found that when workaround strategies were used in order to increase efficiency, new potential
61
paths for adverse drug events were generated. The end user perspective was studied by (Tian,
Duffy, Birk, Abel, & Hultgren, 2009), in this work the authors use the TAM model to explain
BCMA adoption within hospitals. The penetration of BCMA among hospitals remains low; it is
reported as 10% (Cummings, Ratko, & Matuszewski, 2005).
3.1.2 Findings by topic
This section summarizes the findings related to the benefits and barriers, being the most common
topics referenced in the literature. No conceptual model related document was found. Other
topics such as the healthcare provider perspective and the identification standards definition will
be referenced through the development of the conceptual model.
Benefits of data standards adoption
From the set of identified documents, 22 documents were related to data standards adoption
benefits. The broad benefits of adopting identification standards were related to the increase of
supply chain processes efficiencies and the increase of patient safety. Among these benefits
were: efficient traceability (Rosenfeld & Stelzer, 2006); improved ordering, invoicing and
receiving processes (CSC, 1996); reduced data cleansing efforts (Accenture, 2006); ability to
better monitor product recalls; track expiration dates and product authentication (Hefflin, 2005)
and reduction on medication administration errors (Kohn, Corrigan, & Donaldson, 2000). Most
of the estimations were based on industry predictions and by developing a comparison with the
retail industry. As explained in Chapter 2, when an adoption process is in its early stage, the
benefits are estimated by comparison with other industries and case specific findings (pilot
studies).

62
In the case of EDI adoption, the adoption and implementation phases were developed
(Narayanan, Marucheck, & Handfield, 2009), but most of the implementation studies showed
inconclusive results regarding the benefits achieved from its adoption. The adoption of EHR is
in a similar stage as data standards adoption; benefits have been estimated but currently not
realized. In the case of EHR, (Thompson, Osheroff, Classen, & Sittig, 2007) points out that
there is no widely standardized method to estimate or measure EHR adoption benefits. The
authors provided a summary of an analysis conducted on the topic with more than 100 hospitals.
The different methods used estimate the benefits are vendor supplied data, comprehensive
studies, logical modeling, focused studies and site visits; the first option is the most common
one. The authors proposed the development of a national database where hospitals can self-
report best practices, lessons learned as well and costs and benefits. This will take time to
develop but it could ensure the compilation of the information for further use. A similar
structure could be developed for identification standards adoption assessment.
Barriers and challenges
From the set of initial documents, 15 documents were directly related to the barriers or
challenges of data standards adoption. Those documents were fully reviewed and an initial list
of barriers was developed, 34 items were identified. The barriers are grouped in 9 categories as
shown in Table 9. No explicit document dealing with the barriers of data standards adoption was
found.
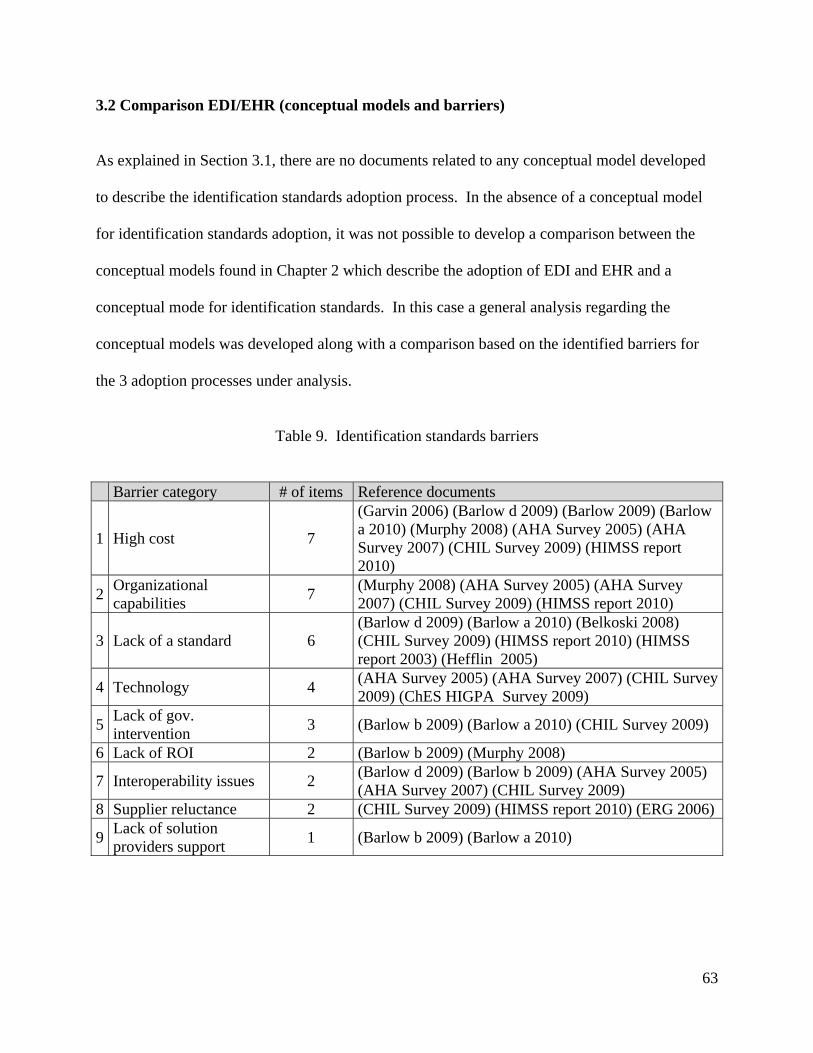
63
3.2 Comparison EDI/EHR (conceptual models and barriers)
As explained in Section 3.1, there are no documents related to any conceptual model developed
to describe the identification standards adoption process. In the absence of a conceptual model
for identification standards adoption, it was not possible to develop a comparison between the
conceptual models found in Chapter 2 which describe the adoption of EDI and EHR and a
conceptual mode for identification standards. In this case a general analysis regarding the
conceptual models was developed along with a comparison based on the identified barriers for
the 3 adoption processes under analysis.
Table 9. Identification standards barriers
Barrier category # of items Reference documents
1 High cost 7
(Garvin 2006) (Barlow d 2009) (Barlow 2009) (Barlow a 2010) (Murphy 2008) (AHA Survey 2005) (AHA Survey 2007) (CHIL Survey 2009) (HIMSS report 2010)
2 Organizational capabilities
7 (Murphy 2008) (AHA Survey 2005) (AHA Survey 2007) (CHIL Survey 2009) (HIMSS report 2010)
3 Lack of a standard 6 (Barlow d 2009) (Barlow a 2010) (Belkoski 2008) (CHIL Survey 2009) (HIMSS report 2010) (HIMSS report 2003) (Hefflin 2005)
4 Technology 4 (AHA Survey 2005) (AHA Survey 2007) (CHIL Survey 2009) (ChES HIGPA Survey 2009)
5 Lack of gov. intervention
3 (Barlow b 2009) (Barlow a 2010) (CHIL Survey 2009)
6 Lack of ROI 2 (Barlow b 2009) (Murphy 2008)
7 Interoperability issues 2 (Barlow d 2009) (Barlow b 2009) (AHA Survey 2005) (AHA Survey 2007) (CHIL Survey 2009)
8 Supplier reluctance 2 (CHIL Survey 2009) (HIMSS report 2010) (ERG 2006)
9 Lack of solution providers support
1 (Barlow b 2009) (Barlow a 2010)

64
3.2.1 General comments
The EDI adoption process was characterized by the use of DOI theory. This adoption process
has been mostly studied from the organizational perspective. The adoption and implementation
phases were present on most of the studies. The initial EDI adoption related studies were
conducted in the late eighties.
The review of the EHR adoption process did not show any relevant conceptual model. However
it included the end user (clinician or nurse) perspective when analyzing the adoption problem.
The EHR adoption process is in the initial stage, most of the adoption studies are dated
beginning of 2004.
The identification standards adoption process is in a similar stage as the adoption of EHR,
however, according to the literature the identification standards adoption process started in 2008.
The timeline for EDI, EHR and Identification Standards (IdS) adoption is illustrated in Figure 5.
Figure 5. Innovations introduction timeline
3.2.2 Barriers
As established in Section 2.4, the EDI barriers are summarized in the work of (Arunachalam,
1995), among the barriers to EDI adoption are the interoperability related issues, the lack of a

65
standard, technology issues and the lack of ROI. The EHR barriers are cited by (Miller & Sim,
2004),(Ash & Bates, 2005) and (Erdil & Emerson, Modeling the dynamics of Electronic Health
Records adoption in the U.S healthcare system, 2008), among the main barriers to EHR adoption
are the high costs, technology issues and the lack of ROI. There were common facts that appear
along the three adoption processes. Among those were the following: organizational capabilities,
lack of Return on Investment (ROI) and technology related issues. There were some unique
facts related only to identification standards adoption: the lack of government intervention and
solution provider support. The results of the comparison are summarized in Figure 6.
Figure 6. Barriers (comparison)
The review showed that in contrast to the EDI and EHR adoption processes described in Chapter
2, there are no documents related to a conceptual model or mathematical modeling approach for
the identification standards adoption process, or at least those documents were not found.

66
Through the literature review the need of a perspective to analyze the identification standards
adoption problem and the need for an operational definition for the concept of data standards
were identified. These two issues are addressed in Section 3.3.1. A conceptual model for data
standards adoption is proposed in Section 3.3.
3.3 Conceptual model for identification standards adoption
As mentioned in Section 3.2 the need for a perspective and an operational definition was
identified in order to proceed with the analysis of the identification standards process and the
development of a conceptual model. This need was also supported by the findings in Chapter 2
that indicate that such definitions are a pre requisite for a conceptual model definition.
The justification of the healthcare provider perspective and the operational definition for data
standards in the context of this research is presented in the following paragraphs.
3.3.1 Basic definitions
Healthcare Provider Perspective
The chicken and egg problem of technology adoption described by many authors such a
(Simpson & Kleinberg, 2009) and (Barlow, Alliance subgroup throws down device data
standards gauntlet, 2010) can be analyzed if a perspective is considered. A specific view point is
required to analyze the problem and would be useful when solutions to the problem are
proposed.
For identification standards adoption, the healthcare provider perspective was defined as the
main element to drive the adoption process; it is assumed that there is a pull effect from the

67
healthcare provider to the manufacturer which can speed up adoption. The healthcare provider
perspective is supported by (Barlow, Crafting the supply chain stimulus package, 2009) and
(Burke, Hospitals lessons in data synchronization, 2008). As pointed out in (HIMSS, 2003)
some of the most significant implications of barcode labeling at the point of care and throughout
the supply chain are: the need for industry standards to define the format of the label; the need
for manufacturers and distributors to support barcode labels at the unit required for transactional
purposes; and healthcare providers to implement processes to utilize the barcode products and
systems to improve patient care.
Technology is a key issue in data standards adoption and implementation. Given the fact that
hospitals devote more resources to technologies that support patient care than to the supply chain
(Kowalski, 2009), the problem is even more relevant. Related to supply chain technology two
types of investments are clearly defined: information systems such as a specialized supply chain
module or an ERP supply chain module and also automation technology which could include
point of use systems that track inventory on hand, storage carousels, and warehouse management
systems. According to (Langabeer, 2005), there is a significant gap between healthcare and the
evolution of information systems to support supply chain management processes in other
industries such as retail or manufacturing and healthcare industry.
Operational definition (identification standards)
In the context of this research the terms data standards and identification standards are
equivalent. As explained by (Krohn, 2009), the data standards definition is too broad, so a
definition was needed as an initial step in the analysis of the adoption process. An operational
definition such as the one given by (Bower, The Diffusion and Value of Healthcare Information

68
Technology, 2005) in the case of EHR and by (Narayanan, Marucheck, & Handfield, 2009) in
the case of EDI is required. For example, (Bower, The Diffusion and Value of Healthcare
Information Technology, 2005) in his work defined that a healthcare provider had EHR if it has
purchased a set of applications (i.e Clinical decision support systems, Computarized patient
records and Clinical data repository), within a given period of time.
For identification standards the operational definition includes a process-technology based
approach. Three types of processes are defined. Processes type I are external supply chain
processes associated with external supply chain partners. Processes type II are internal supply
chain processes. Processes type III are supply chain processes related to the final product
delivery which includes the patient. The adoption within processes type I is associated to the
presence of the required systems (supporting technologies) to operate with the standards, for
example EDI or a MMIS. For processes type II a level of automation is required this includes
supply chain solutions with barcode enabled capabilities. For processes type III the required
technology is automation at the point of use.
The concept of perfect order as defined by (GS1, 2009) was used as an initial reference point to
define identification standards adoption within the conceptual model scope. The concept of the
perfect order has been around since 2008 and it has its roots in the work of the manufacturer BD
within the scope of the DoD pilot. A perfect order is defined as a purchase order processed
electronically from order to payment without human intervention, delivered to the right location,
on time, undamaged, at the right price, in the desired quantity on the first attempt. According to
this definition a healthcare provider (hospital) with the capability of sending and receiving an

69
EDI order which includes product and location identifiers would be recognized as an adopter of
identification standards.
3.3.2 Factors affecting the identification standards adoption process
The proposed conceptual model for identification standards was based on the findings from the
literature review developed in Chapter 2 and the findings of the literature review on data
standards conducted in this chapter. It was assumed that factors which have been found relevant
to other technological innovations (adoption determinants) could help to explain the adoption
process under study.
A conceptual model for identification standards adoption needs to consider the factors that affect
the adoption and use of the innovation (data standards). The extensive literature review
developed in Chapter 2 suggested that the Technology Organization and Environment (TOE)
conceptual model (Tornatzky & Fleisher, 1990) is appropriate to define and study the factors that
influence identification standards adoption.
This conceptual model defines three aspects of an organization that influence the adoption of a
given innovation. The technological context describes the characteristics of the innovation to be
adopted in relationship with the readiness level of the organization. The organizational context
is related to the characteristics of the organization such as size and top management involvement.
The environmental context is related to the external factors that influence adoption, such as
government and industry players. The TOE model is consistent with the innovation diffusion
theory (Rogers E. M., 1983) which defines technological characteristics and both, the internal
and external characteristics of the organization as drivers for technology adoption and diffusion.

70
In order to develop the conceptual model, the barriers for identification standards were compared
with the list of adoption determinants established in Chapter 2. An association between the
identification standards adoption barriers shown in Table 6 and the adoption determinants listed
in Table 9 was developed. After the analysis, 8 of the adoption determinants were considered
along with new elements related only to identification standards adoption (identified through the
literature review). The specific elements related to identification standards adoption were
associated to the readiness level of the organization (healthcare provider) process and technology
wise; and the readiness level of the technology solution provider. The final set of eleven factors
that are associated to identification standards adoption was grouped by TOE category as shown
in Table 10.
The proposed conceptual model is illustrated in Figure 7. Each factor within the model is related
to the healthcare provider adoption decision. The factors are grouped by TOE category. The
technology related factors are relative advantage, complexity, compatibility and the
organizational readiness factor in terms of the technological capabilities. These factors are
directly associated with the characteristics of the technology (innovation) under study and the
preparedness of the organization related to its infrastructure to support the adoption. The relative
advantage represents in aggregate terms the gain from its adoption. The environment related
factors are industry pressure, government intervention, vendor support and the technology
solution provider readiness factor in terms of its ability to support the technology to be adopted
by the healthcare provider. These factors are outside of the control of the healthcare provider.
The organization related factors are size, top management support, and organizational readiness
factor. These factors are directly related to key characteristics of the organization (e.g size) and
also to basic elements of the project and team required to lead the adoption process.

71
Table 10. Proposed adoption determinants
TOE
category Factors 1 T Relative advantage 2 T Compatibility 3 T Complexity 4 T Organization readiness (technology based) 5 O Top management support 6 O Hospital size 7 O Organization readiness (process based) 8 E Industry influence 9 E Vendor support
10 E Government policy 11 E IT Vendor readiness
3.3.3 Conceptual model validation
The conceptual model was validated with the use of industry expert’s interviews. Two experts
from a medium size medical center; the information technology IT Vice President and the supply
chain manager were interviewed in order to validate the factors proposed by the conceptual
model. The categorization of factors using the TOE model structure was understood and it was
found relevant. Regarding the organization related factors, the top management support and
organizational readiness factors were highlighted as important ones. The organization size was
not perceived as a major factor affecting adoption. The organizational readiness was directly
related to the technological infrastructure and the maturity level of the solution (i.e. data
standards). The return on investment from the adoption of data standards is not seen as an
immediate fact but a result of the collaboration among supply chain partners. According to the
experts that is one of the reasons why healthcare providers have to start pulling in order to drive
the adoption process.
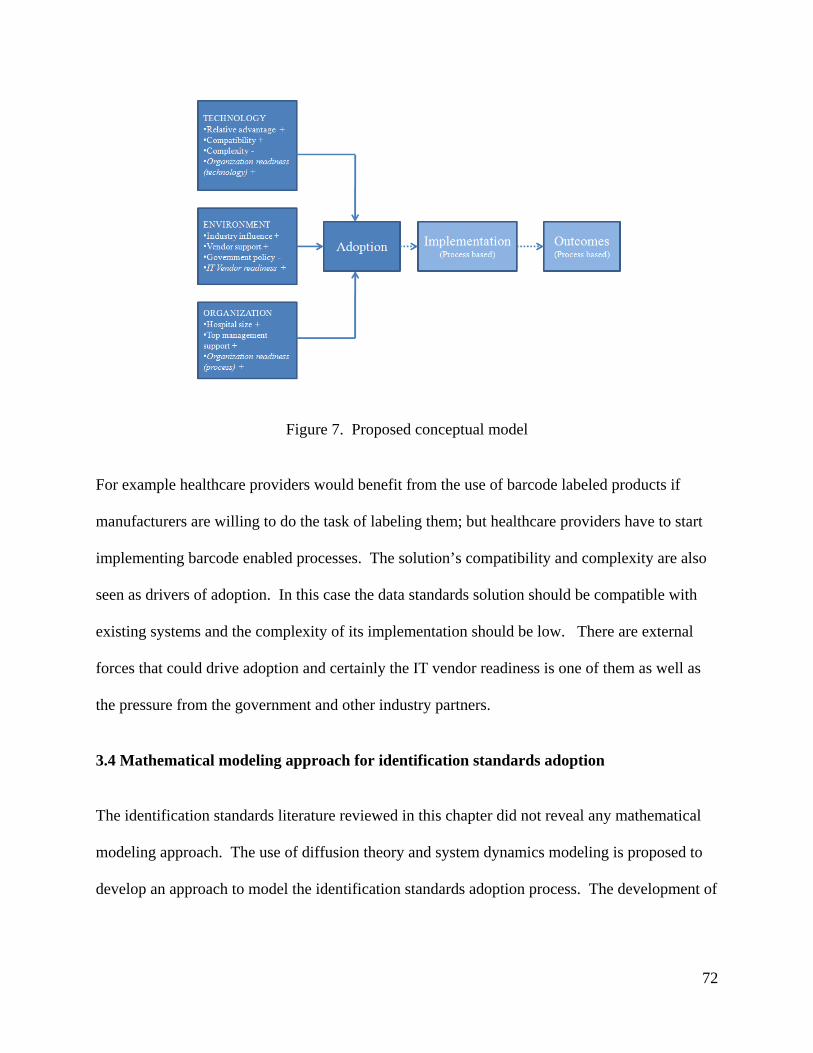
72
Figure 7. Proposed conceptual model
For example healthcare providers would benefit from the use of barcode labeled products if
manufacturers are willing to do the task of labeling them; but healthcare providers have to start
implementing barcode enabled processes. The solution’s compatibility and complexity are also
seen as drivers of adoption. In this case the data standards solution should be compatible with
existing systems and the complexity of its implementation should be low. There are external
forces that could drive adoption and certainly the IT vendor readiness is one of them as well as
the pressure from the government and other industry partners.
3.4 Mathematical modeling approach for identification standards adoption
The identification standards literature reviewed in this chapter did not reveal any mathematical
modeling approach. The use of diffusion theory and system dynamics modeling is proposed to
develop an approach to model the identification standards adoption process. The development of

73
the model includes the transition from the conceptual modeling phase to the mathematical
modeling of the adoption process.
The factors identified through the conceptual model are used in the causal loop diagram and
simulation model development. The initial mathematical model is proposed as an extension of
the Bass diffusion model and will be used to simulate the behavior of the hospital population
over time and to observe the impact of the external and internal diffusion coefficients in the
adoption rate. The simulation model will allow for the analysis and design of policies to move
the adoption process forward. The development of the modeling approach for identification
standards is presented in Chapter 4.
3.5 Conclusions
This chapter presented the identification standards adoption process from an academic
perspective using the elements provided by the literature review on management of technology
MOT and current findings from data standards adoption literature. The exploration and
identification of the factors affecting the identification standards adoption process is the initial
step toward understanding the adoption of data standards.
The conceptual model proposed in this paper was developed based on an extensive literature
review related to the identification standards adoption literature as well as technology adoption
literature. The conceptual model for identification standards adoption is proposed as a way to
answer the research question defined at the beginning of this chapter and to fulfill the goal of
Phase I.

74
4. Modeling Approach
The goal of this chapter is to answer the following research question as established in Chapter 1:
How could existing diffusion models be extended or modified to model the identification
standards adoption process?
A systems dynamics modeling approach is used to model this process. The model is based on
the diffusion of innovations theory; the main factors identified on Chapter 3 are used to develop
the Causal Loop Diagram (CLD). For the model formulation it is assumed that classic diffusion
models can be extended to model identification standards adoption. The developed model will
facilitate the understanding of the system (healthcare supply chain) behavior and allow for the
design and test of policies to move the system forward.
The use of technology diffusion models, such as the Bass Diffusion Model (BDM), for the model
formulation presents some limitations which are explained and a way to overcome those
limitations is presented. One of the most important limitations is the need of data on past
adoptions which is lacking in the case of identification standards. Among the solutions to
overcome this issue is the staged formulation proposed in this chapter. Two model stages are
proposed. The Stage 1 or initial model formulation stays close to the basic BDM and is used to
simulate the behavior of the hospital population over time and to observe the impact of the
external and internal diffusion coefficients in the adoption rate of identification standards’
supporting technologies. The implementation of the formulation for stage 1, the estimation of
the base run, and the model validation are explained in this chapter.

75
The Stage 2 of the model formulation includes the process followed to formulate the model
based on the CLD taking into consideration the proposed identification standards definition and
the lessons learned from Stage 1. The model is based on system dynamics and diffusion theory
and provides a model to understand and test interventions to promote adoption of Identification
Standards (IdS). The implementation of the formulation for Stage 2, the estimation of the base
run as well as model validation is explained in the next chapter. The model development and
implementation fulfills the goal established for phase II of the research methodology as
presented in Chapter 1.
4.1 Literature review
The literature review presented in this section compiled information from three different sources.
The first one, the literature review developed in Chapter 2 which was related to technology
adoption within the healthcare and non-healthcare domains. Among the identified documents an
exploration of mathematical approaches to model adoption was performed; within the 41
documents identified in the literature review, 4 documents described a mathematical approach to
technology adoption and diffusion. The main topics identified were the following: diffusion
curves, system dynamics, game theory and agent based modeling (See Section 2.3.2).
The second source, the literature review developed in Chapter 3, which was related to the
identification standards literature, concluded that no modeling approach was found within the
identification standards literature and that there was an absence of a clear definition of the
identification standards concept. These two particular issues are addressed in this chapter. The
proposed modeling approach for identification standards adoption and the proposed definition
are developed in order to explain the identification standards adoption process.

76
The third source, a specific search on System Dynamics SD methodology was extended through
the development of Chapters 4 and 5. The SD methodology and technology diffusion
perspective were also explored in order to understand and justify the methodology. Some of the
references are: the diffusion modeling book by (Mahajan, Muller, & Wind, New Product
Diffusion Models, 2000) provided useful information associated with the estimation of model
parameters. The papers on sensitivity analysis (Ford & Flynn, 2005), (Hekimoglu & Barlas,
2010) describe how sensitivity analysis of system dynamics models can be performed in order to
identify main parameters and key issues. The design of interventions was documented by the
work of (Fisher, Norvell, Sonka, & Nelson, 2000), (Daim, Rueda, Martin, & Gerdsri, 2006) and
(Cui, Zhao, & Ravichandran, 2011).
4.2 Modeling approach for identification standards adoption
As implied by the System Dynamics (SD) methodology described by (Coyle, 1983), the purpose
of a model is to understand the structure of the system and to provide an insights into the
possible solutions to the existing problems. The system dynamics methodology is suitable in the
study of complex systems, where the interaction among factors is the possible cause of the
problematic situation. As explained by (Sterman, 2000) it allows researchers to model the
system at an aggregated level as shown in Figure 8. This level of aggregation facilitates the
understanding and formal analysis of the system under study (Borshchev & Filippov, 2004).

77
Figure 8. Modeling levels of aggregation (adapted from Borshcev and Filippov, 2004)
The system dynamics methodology is followed to model the identification standards adoption
process using the steps described below:
1. Definition of the real world symptoms to be understood and improved
2. System description by the use of a causal loop diagram
3. Model formulation and simulation model development (structure)
4. Model implementation and validation
5. Simulation experiments
6. Analysis and results
The steps are followed sequentially but once the model is formulated and Step 6 is reached the
process goes back to Step 3 until a satisfactory level of analysis is achieved. The complete
sequence of the research methodology for Phase II is illustrated in Figure 3.

78
4.2.1 Causal loop diagram
The causal loop diagram is a formalization of the findings regarding the possible causes for the
slow adoption process and it contributes to the identification of the feedback structure of the
system under analysis. A causal loop diagram consists of factors connected by arrows denoting
the causal influences amongst them. The causal loop diagram is another representation of the
factors affecting the adoption process, and it is one of the initial steps in the system dynamics SD
methodology. The causal loop diagram was developed to identify the relationships among the
different factors affecting the healthcare provider adoption, and it is a bridge between the
conceptual model proposed in Chapter 3 and the mathematical model proposed to simulate the
identification standards adoption rate.
4.2.2 Model formulation
The Bass diffusion model is defined as the basic formulation for the model. The model
formulation follows a two stage process. Stage 1, or initial approach, in which the Bass
Diffusion Model (BDM) is used to mathematically describe the adoption process. Stage 2 is
based on the causal loop diagram (CLD) and includes most of the empirical relationships within
the factors defined in the CLD.
4.2.3 Model implementation and validation
The model formulation was implemented in Vensim modeling software (version PLE Plus).
This tool was used in this research to develop the causal loop diagram and to implement the
model formulation. The Vensim model or simulation model facilitated the exploration of the
impact of the different factors on the adoption rate over a specified period of time. The

79
simulation model was validated using the methods defined by the system dynamics SD
methodology according to (Sterman, 2000). Available industry data was also used to the extent
that was feasible and possible. The model was calibrated to reproduce meaningful results
according to the theoretical development.
4.2.4 Model analysis and results
The sensitivity analysis facilitated the identification of the relevant model parameters. The main
purpose of this phase was to test the impact of different interventions (parameter changes) on the
model in order to improve the system behavior.
This chapter includes the development of the causal loop diagram and the model formulation and
implementation for Stage 1. The model formulation and implementation for Stage 2 is
developed in Chapter 5.
4.3 Causal loop diagram
The causal loop diagram included the main elements identified as factors affecting the adoption.
These factors were identified through an extensive literature review on data standards literature
which was explained in Chapter 3. The factors included in the causal loop diagram are brought
from the conceptual model. The transition from the initial list of factors defined in the
conceptual model including the grouping of the different elements according to the TOE
framework in order to develop the causal loop diagram is explained in this section. The factors
are grouped in three categories: environment, technology and organization. Within the
environment section, the external factors affecting the adoption are considered. Since the model
takes into consideration two perspectives (technology provider and healthcare provider), the

80
relative advantage is considered for both stakeholders as well as the readiness. There are two
known positive relationships not included directly (but indirectly) in the causal loop digram, the
size and the top management support; these relationships are considered within the organization
section but as part of the organization readiness. The causal loop diagram provides an
explanation of the factors affecting the healthcare provider adoption rate. The main elements of
the causal loop diagram are shown in Table 11.
Table 11. Causal Loop Diagram factors
Section CLD Factors Environment Vendor support: the support from suppliers and distributors
related to the initiative of identification standards
Government intervention: intervention in the form of a regulation related to identification standards adoption
Industry pressure: pressure from different industry groups to adopt identification standards
Technology Technology provider readiness: readiness level of the technology solution provider towards adoption
Relative advantage (Technology provider): the relative gain cost/benefit that can be obtained from adoption
Complexity: complexity of the technology Interoperability: the ease of integration of the adopting technology to existing systems
Organization Organization readiness (P): readiness level of the healthcare provider related to the processes and the scope of the adoption Organization readiness (T): readiness level of the healthcare provider related to the technological capabilities associated with the adoption
Relative advantage (Hospital): the relative gain cost/benefit that can be obtained from adoption
The basic structure of the causal loop diagram is the stock flow representation of the healthcare
provider population. The healthcare provider population is divided into adopters and potential

81
adopters, and the transition between the two groups is represented by the adoption rate. Around
the adoption rate a word of mouth model (Sterman, 2000) better known as technology diffusion
model approach is followed to exemplify the structure of the problem. The arrows and its signs
depict the relationships among the factors within the diagram. A positive sign illustrates a
proportional change; a negative sign illustrates the opposite relationship (an increase in one
factor would have a diminishing impact on the other). As mentioned before, the causal loop
diagram takes into consideration two perspectives the healthcare provider perspective and the
technology solution provider perspective, and how they both interact with the environment. The
sections within the causal loop diagram CLD are identified with three colors as shown in Figure
9. The color blue represents section one; the color green represents section two and the color
orange represents section three.
4.3.1 Section one (environment)
Industry pressure
The industry pressure comes from the Group Purchasing Organizations and industry groups. As
pointed out by (Barlow, Premier CIO conducting data synchrony. Alliance pushes harder for
supply chain data standards, 2009) the pressure from the different industry groups could
contribute to speed up the adoption process by increasing the pressure for solution provider
readiness. The industry pressure could increase the awareness of the different stakeholders in
particular healthcare providers through educational programs about the benefits and ways to
adopt the standards.

82
Figure 9. Causal loop diagram.
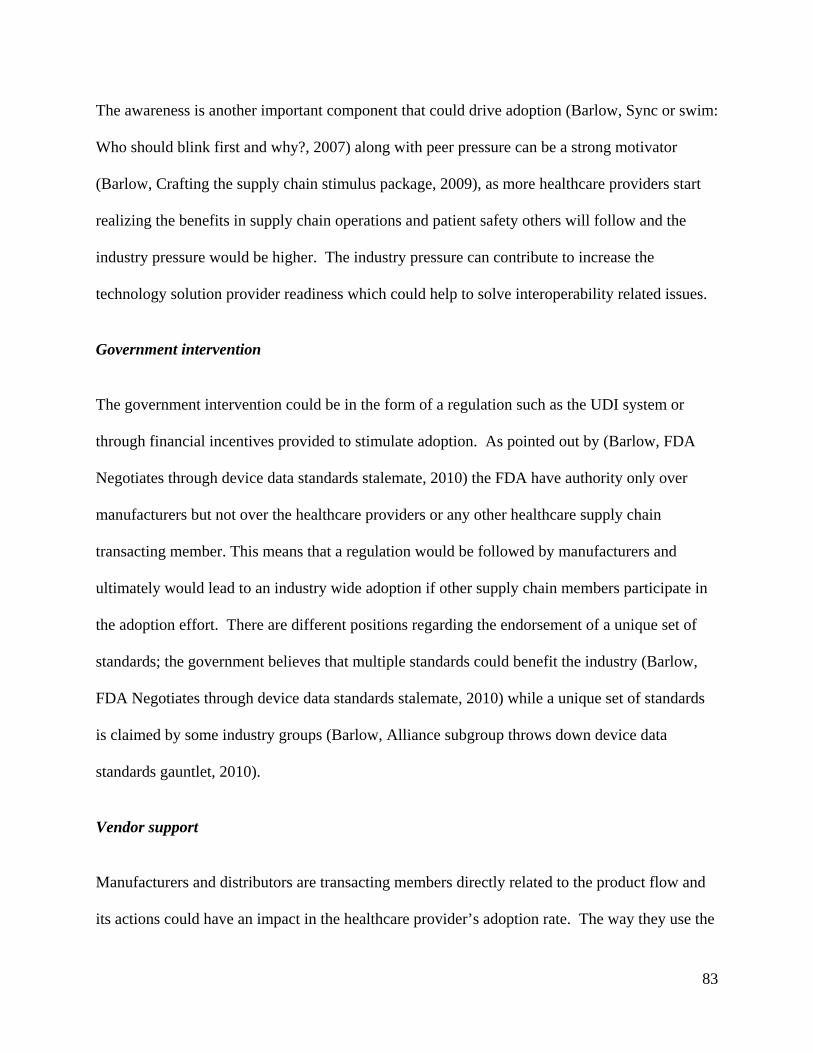
83
The awareness is another important component that could drive adoption (Barlow, Sync or swim:
Who should blink first and why?, 2007) along with peer pressure can be a strong motivator
(Barlow, Crafting the supply chain stimulus package, 2009), as more healthcare providers start
realizing the benefits in supply chain operations and patient safety others will follow and the
industry pressure would be higher. The industry pressure can contribute to increase the
technology solution provider readiness which could help to solve interoperability related issues.
Government intervention
The government intervention could be in the form of a regulation such as the UDI system or
through financial incentives provided to stimulate adoption. As pointed out by (Barlow, FDA
Negotiates through device data standards stalemate, 2010) the FDA have authority only over
manufacturers but not over the healthcare providers or any other healthcare supply chain
transacting member. This means that a regulation would be followed by manufacturers and
ultimately would lead to an industry wide adoption if other supply chain members participate in
the adoption effort. There are different positions regarding the endorsement of a unique set of
standards; the government believes that multiple standards could benefit the industry (Barlow,
FDA Negotiates through device data standards stalemate, 2010) while a unique set of standards
is claimed by some industry groups (Barlow, Alliance subgroup throws down device data
standards gauntlet, 2010).
Vendor support
Manufacturers and distributors are transacting members directly related to the product flow and
its actions could have an impact in the healthcare provider’s adoption rate. The way they use the

84
technology and the identification standards within their processes and within the processes
related to the healthcare provider can drive the adoption at the healthcare provider level. The
vendor support element has a direct impact on the influence factor and is directly affected by the
industry pressure and government intervention factors.
4.3.2 Section two (technology)
Technology solution provider readiness
Technology solution providers include the MMIS vendor providers and the EDI vendors (for
type I processes). The technology solution provider readiness element is influenced by the
adopters influence and the industry pressure. The developments of the organization (healthcare
provider) regarding its technological capabilities can affect the technology solution provider
readiness.
As pointed out by (Barlow, Alliance subgroup throws down device data standards gauntlet,
2010), (Perrin, 2009) this is one of the most critical links preventing adoption: technology
solution providers are not ready because hospitals are not requesting the fields to be active or to
be transacting with the identifiers, so technology providers are just going to wait. On the other
hand, hospitals will not do it because they do not see the direct benefits of its adoption. The
technology solution provider readiness is related to the complexity and interoperability factors.
In this regard, the technology provider readiness is affected by how complex the solution is to
implement; the more complex the less ready the technology provider is. Likewise, the more
interoperability issues to be solved, the less ready the technology provider can be.

85
Relative advantage technology solution provider
The relative advantage of the technology solution provider is influenced by the expected benefits
from adoption and the technology development costs. The relative advantage has a direct impact
on the influence factor and also on the relative advantage of the healthcare provider.
4.3.3 Section three (organization)
The healthcare provider readiness is defined from the process and technology perspectives.
Organizational readiness (P)
The organizational readiness (P) is the level of readiness of the healthcare provider from the
process perspective. It is influenced by the cultural barriers, awareness, the healthcare provider
size, the information technology budget and the top management support. The organizational
readiness (P) has impact on the organizational readiness (T) (Murphy, 2008).
Organizational readiness (T)
The organizational readiness (T) is the level of readiness of the healthcare provider from the
technology perspective. It is associated with the technological capabilities of the organization
towards adoption. It is influenced by the organizational readiness (P) and the percentage of
supporting technology penetration (Shortliffe, 2005).
Relative advantage healthcare provider
The relative advantage is influenced by the expected benefits from adoption and the associated
implementation and development costs (Levine, 2007). The relative advantage of the technology

86
solution provider is also an important factor since the technology providers would benefit by the
investments made by adopting healthcare providers. The relative advantage of the healthcare
provider has a direct impact on the influence factor.
The causal loop diagram considers two main stakeholders: the healthcare provider (healthcare
provider and hospital are equivalent terms) and the technology solution provider. The impacts of
the different elements in the adoption rate along with the relationships among them are illustrated
in the causal loop diagram and the main hypotheses are explicitly presented. For example it is
assumed that the technological readiness level of the healthcare provider defined as the
organizational readiness (T) will have an impact in the technology solution provider readiness,
and this element will also increase the relative advantage for the technology solution provider.
The causal loop diagram is the systemic explanation of the adoption process. It is similar in its
goal to the conceptual model. The CLD provides the starting point for the model formulation
and the simulation model development.
4.4 Definition (Identification Standards)
The literature review developed in Chapter 3 revealed that there is not a clear or formal
definition related to identification standards, neither there is a consensus related to what adoption
means or how an adopter could be defined. The absence of a clear definition could be explained
because the identification standards process is a recent adoption process, started in 2008, and
also because of the nature of the concept and the complexity associated to its definition. In
addition to process changes, the adoption of identification standards accounts for the adoption of
a set of technologies, not the adoption of a single technological component.

87
This section establishes the absence of a clear definition of identification standards. In addition,
reference points from the literature are discussed, including the definition of Electronic Health
Records EHR. Major similarities and differences between identification standards adoption and
EHR adoption are presented. Finally, the proposed definition for Identification Standards (IdS)
is explained.
Some examples of the identification standards definitions found from the literature sources are:
A 2% adoption is given by (DeJohn, 2008) but the author does not specify any definition.
The survey by (Nachtmann & Pohl, 2009) summarized information related to adoption of
identification standards but no specific details about the definition used to gather the data
was given in the report.
The report by (Pohl & Nachtmann, 2011) referred to a system of standards, but no
specific definition was given.
Readiness data was provided on the GS1 website. The website presented the result of the
voluntary assessment data dated November 2011 (625 adopting members).
The literature review showed that identification standard was usually referred to as a system of
standards. The system of standards concept can be understood as a set of standards that includes
the location and product identifiers that are used within a given set of processes. In order to be
able to measure to some extent the adoption of identification standards, a clear definition at a
specific level of aggregation and process scope has to be established. The level of aggregation is
related to the perspective, in this case the healthcare provider, and the process scope is related to
the type of processes under analysis.

88
4.4.1 Related definitions
The adoption of Electronic Health Records (EHR) can be used as a reference point to analyze the
identification standards situation. In the case of EHR many authors have agreed that in order to
measure the progress of EHR adoption, a consensus must be reached among the main
stakeholders and a clear definition should be established (Jha, DesRoches, Kralovec, & Joshi,
2010). The authors defined a basic EHR as a set of 10 clinical functions deployed in at least one
hospital unit. According to this definition the data was collected and analyzed. A 9.2%
penetration of a basic EHR among hospitals was reported.
There are some similarities, and differences between EHR adoption and identification standards
adoption. Both adoption processes are in the same setting, healthcare, but the healthcare
provider is at the lead of EHR adoption due to its nature. EHR is a software application
exclusive to the healthcare provider. This means that the healthcare provider is the only one
responsible for capturing and storing the EHR related information. This is not the case for
identification standards adoption where any supply chain member could adopt it. Moreover, the
identification standards concept is built into existing software applications used throughout the
supply chain; it cannot be defined as a standalone application. This issue in particular represents
a challenge related its justification from the ROI perspective (Menachemi & Brooks, 2006).
4.4.2 Conceptual definition (proposed definition)
The definition of identification standards in the context of the present research is a process-
technology based definition as it was initially proposed in Section 3.3.1. This definition is based
on the assumption that the supporting technology required to make use of the product and

89
location identifiers would have a key role in explaining the adoption of identification standards.
This implies that the adoption of identification standards would be limited by the presence of the
required infrastructure to perform the supply chain transactions within a process of a given
process scope.
From the healthcare provider perspective it is assumed that there is a specific set of processes
performed within the organization using the identifiers. Those processes can be grouped
according to its scope as shown in Table 12. It is assumed that each process is composed of a set
of transactions. Each transaction is supported by a given technological infrastructure, and each
transaction makes use of the identifiers.
Table 12. Identification standards operational definition
Process type
Scope List of processes / cycles Supporting technology
I External link Ordering MMIS, EDI II Internal Storeroom operations Barcode enabled SCM III Patient link Medication administration
including supplies BCMA, BPOC
Processes type I. These processes are performed by the healthcare provider in the context of the
external environment. The processes with trading partners include contract/pricing
administration and the purchase order to payment cycle, among others. The transactions are
assumed to be performed by electronic means with the support of EDI and an application such as
the MMIS. The adoption of identification standards in processes Type I assume location and
product identifiers use within the relevant processes related to the external ordering cycle,
contract management and rebates.

90
Processes type II. These processes are performed within the healthcare provider and do not
involve any trading partner or patient. These processes are associated to inventory management
control activities within the main storeroom and the hospital floors. The transactions are assumed
to be facilitated by the supporting technology such as a barcode enabled supply chain
management application (BC SCM). The adoption of identification standards in processes type
II assume location and product identifiers use within the relevant processes related to the hospital
internal supply chain.
Processes type III. These processes are related to transactions within the healthcare provider
and directly related to patient care at the point of use. The transactions are assumed to be
facilitated by the use of the supporting technology such as a BPOC or Barcode Medication
Administration (BCMA) application. The adoption of identification standards in processes type
III assume location and product identifiers use within the relevant processes related to the
administration of pharmaceuticals and the use of medical supplies at the point of care.
The concept of the process technology based definition is illustrated in Figure 10. According to
the figure a business process is based on a given set of transactions and within those transactions
the corresponding identifiers are used. An adopter is a healthcare provider performing a given
transaction using the identifiers and the supporting technology (See dashed line in Figure 10).
The operational definition implies that adoption of identification standards can be modeled as the
diffusion (external diffusion) of the bundle identification standards-technology across a given
population.

91
Figure 10. Identification standards definition (adapter from Hubner and Elmhorst, 2008)
This definition has the following implications regarding the model scope. According to classic
diffusion theory, the members of a population interact with each other and with the external
environment. One of the underlying assumptions of technology diffusion models is that
technology acceptance is an imitation process. The members of the population get in contact
with each other and with the environment and exchange information related to the innovation
(Majahan & Wind, 1986). The technology is first adopted by a select group of innovators who in
turn, influence others to adopt it. The innovation (technology) is defined in this case as the
supporting technology required to facilitate a set of supply chain related processes within the
healthcare provider.
The behavior of the total population as a whole was considered as opposed to a single hospital.
There is not a detailed process description but the aggregated population behavior over the
proposed set of processes is given. The model does not provide specific details on the identifiers
(product and location) but the projection of the use of identifiers among the processes and

92
transactions performed by healthcare providers is estimated. In an aggregated form (by process
group) the adoption of identification standards will be limited to the used of anchored identifiers
as defined by (Buyurgan, Rardin, Jayaraman, Varghese, & Burbano, 2011) within the main
transactions along the medical-surgical supply chain. The aggregation by process group type is
associated to the characteristics of the supporting technology.
As an example of the proposed aggregation, a detail list of processes, basic requirements and
transactions for processes within group type I is shown in Table 13. This table is based on the
EHCR report (CSC, 1996). As of 1996 the need for location and product identification was
explicit, also the basic technological requirements were outlined. For example EDI and MMIS
were defined as basic requirements to support supply chain related processes within processes
type I as well as the need for location and product identifiers.

93
Table 13. Identification standards operational definition EHCR
Process set Basic requirements EDI transactions
Contract/Pricing Administration Electronic Customer Identification 816 Organizational Relationships
cycle Electronic Product Identification 832 Price/Sales Catalog EDI Transactions Sets 836 Procurement Notices Policy and process comprehension 840 Request for Quotation
Member Eligibitily 843Response to Request for Quotation
Negotiations 845 Price Authorization Type
I Electronic Contract/Pricing Notice 867Product Transfer and Resale Report
Electronic Sales/Rebate Reporting Performance Measures Activity based Costing
Purchase Order to Payment Electronic Customer Identification 810 Invoice
cycle Electronic Product Identification 812 Credit/Debit Adjustment EDI Transaction Sets 820 Payment Order Electronic Order Management 822 Account Analysis
Electronic Shipping and Receiving 832 Price/Sales Catalog
Electronic Billing 850 Purchase Order
Electronic Funds Transfer 855Purchase Order Acknowledgment
Activity based Costing 856 Ship Notice/Manifest
Performance Measures 861Receiving Advice/Acceptance Certificate
Sales Activated Settlement Electronic Customer Identification 810 Invoice
Electronic Product Identification 816 Organizational Relationships EDI Transactions Sets 820 Payment Order Contract Membership Eligibility 832 Price/Sales Catalog Electronic Contract/Pricing Notice 845 Price Authorization Shared Databases 856 Ship Notice/Manifest
Performance Measures 867Product Transfer and Resale Report
Activity Based Costing

94
It could be possible to track adoption over time or progress regarding the identification standards
adoption among hospitals, but a longitudinal study to measure adoption in terms of the previous
definition would be necessary. For example, the perfect order definition could be used, but other
definitions among the finite set of transactions and processes must be defined. Adoption could
be measured by process, taking into consideration how many processes and transactions are
using identification standards. The proposed identification standards definition is ideal because
adoption data related to each one of the processes and its corresponding transactions is currently
unavailable. The ideal definition development and data gathering can be based upon a process
matrix like the one shown in Table 14. Gathering adoption data would require the specification
of the scope of the processes being surveyed along with the longitudinal data (at least 3 years).
A study of such kind is out of the scope of the current research and modeling efforts.
4.5 Model formulation
Following the system dynamics methodology for phase II, a classical technology diffusion model
was selected as the initial model to formulate the adoption process under study. The Bass
Diffusion Model (BDM) is used to represent the adoption process and to mathematically
describe the adoption rate. The model is focused on the time pattern of the spread of innovation.
The BDM and its revised forms have been successfully demonstrated and applied in retail
service, industrial technology, agricultural, educational and consumer durable markets (Majahan
& Wind, 1986). It has been also recognized that one of the most useful inputs to decision
makers, planners and researchers is the temporal pattern of the diffusion process (Sharif &
Ramanathan, 1981).

95
Table 14. Identification standards ideal definition
Process type Cycle
Basic requirements Process/area Tr. Sets or documents (electronic) GLN GTIN Both used
Purchase Order to Payment
MMIS in place Purchasing 812 Credit/Debit Adjustment
can be used
can be used TBD
Order to 820 Payment Order/Remittance Advice
can be used
can be used TBD
Type I Payment EDI in place Accounts payable 822 Account Analysis
can be used
can be used TBD
832 Price/Sales Catalog can be used
can be used TBD
Materials management 850 Purchase Order
can be used
can be used
Perfect order
855 Purchase Order Acknowledgment
can be used
can be used TBD
856 Ship Notice/Manifest can be used
can be used TBD
861 Acceptance Certificate can be used
can be used TBD

96
4.5.1 Mathematical formulation
The fundamental diffusion model (Mahajan & Peterson, Models for innovation diffusion:
Quantitative applictions in the social sciences, 1985) can be expressed as the differential
equation:
(1)
With the boundary condition , where.
= cumulative number of adopters at time
= non cumulative number of adopters at time t, which means
= total number of potential adopters in the system at time t (also equal m)
= rate of diffusion at time t
= diffusion coefficient
= cumulative number of adopters at time
The diffusion coefficient is usually expressed as a function of the number of previous adopters
as:
+....
According to the expression above, the diffusion coefficient can be expressed as:

97
Three diffusion models can be obtained by using the previous expressions:
The external influence diffusion model:
(2)
The internal influence diffusion model:
(3)
The mixed influence diffusion model:
(4)
The coefficients and are known as coefficients of external and internal influence
respectively. The coefficient of external influence represents the influence from outside the
system, not related to previous adoptions. The coefficient of internal influence , represents the
influence of the previous adoptions in the form of a contagion rate, and it also represents the
interaction of prior adopters with potential adopters. Coefficients and also appear in some
diffusion models notations as coefficients and , but its meaning is the same.

98
The mixed influence diffusion model described in Equation (4) is also known as the Bass
Diffusion model BDM (Sterman, 2000). The work developed by (Teng, Grover, & Guttler,
2002) illustrates the use of the BDM in order to analyze the diffusion of 20 technological
innovations and the relationship of technology characteristics in the different diffusion patterns.
A resemblance to the mathematical structure of this model is found in (Erdil & Emerson,
Simulation modeling of electronic health records adoption in the U.S healthcare system, 2009),
but no explicit reference to it is made by the authors. The BDM model is also used by (Bower,
2005), in the analysis of EHR adoption. In this work the author illustrates the potential use of the
model but does not proceed with any mathematical estimation of the parameters; instead, the
author uses the model to describe the qualitative approximation developed to represent the main
forces affecting EHR adoption.
The BDM and conventional parameter estimations
An equation similar to (1) was presented by (Majahan & Wind, 1986) and is suggested for
parameter estimation purposes. The equation can be used to represent a given diffusion process
as:
(5)
Where is the cumulative number of adopters at time , is the ceiling, is the coefficient
of innovation and is the coefficient of imitation. Assuming / , where is
the fraction of potential adopters who adopt the product by time , the BDM can be restated as:

99
1
(6)
If 0 0, then simple integration of Equation (6) gives the following distribution
function to represent the time dependent aspect of the diffusion process.
1
1
(7)
Equation (7) yields the s-shaped diffusion curve captured by the BDM. For this curve the point
of inflection, which is the maximum penetration rate , occurs when:
∗ 12 2
(8)
∗ 1ln
(9)
And also the equation:
∗
∗
4 2 4
(10)
Hence, if , and are known for a particular product, equations (7) – (10) can be used to
represent the product growth curve.
A number of estimation procedures have been used for estimating the model parameters
(Majahan & Wind, 1986).

100
Ordinary least squares (OLS)
Maximum likelihood estimation (MLE)
Nonlinear least squares (NLS)
Algebraic estimation
A detailed description of each one of the procedures is presented in (Majahan & Wind, 1986).
The NLS estimation procedure is the one that gives better predictions compared to OLS and
MLS (Mahajan, Muller, & Wind, New Product Diffusion Models, 2000). The Algebraic
Estimation procedure is explained in the following paragraphs as an illustration on how to
estimate the model parameters. This procedure can be used in the absence of sufficient data as in
the case of identification standards adoption.
Algebraic Estimation procedure
This method can generate rough estimates of the parameters from knowledge on the occurrence
of the point of inflection, as described in the equations listed below.
If the BDM is stated as:
1
(11)
Since 0 0, integration of equation (1) yields to:
1
1
(12)
And by definition

101
(13)
If , and are known for a particular product, then equations (12) and (13) can be used to
represent the product’s cumulative adoption over time. Equation (12) yields the S-shaped
cumulative adoption (diffusion) curve captured by the BDM. The point of inflection for this
curve occurs at time ∗ and corresponds to the maximum penetration rate .
For simplicity, the case of annual sales data is considered so that (Majahan & Wind,
1986). The non cumulative number of adopters at the point of inflection ∗ is defined as ∗ and
the cumulative number of adopters at ∗ is defined as ∗. Given those definitions equations (8) –
(10) can be rewritten as:
∗ 12 2
(14)
∗ 1ln
(15)
∗
4 2 4
(16)
If ∗, ∗ and ∗ are known, then equations (14)-(16) can be re written as:
∗ 2 ∗
∗ (17)
∗
∗ (18)
∗∗
2 ∗ ln2 ∗
(19)

102
This way, equation (19) can be used to find m numerically. Once m is known, equations (17)
and (18) can be used to estimate p and q. On the other hand if ∗ and ∗and m are known, then
equation (19) can be solved to find N*; finally p and q can be estimated from equations (17) and
(18).
The algebraic estimation procedure is conceptually simple, but it requires information regarding
the point of inflection. Researchers (Majahan & Wind, 1986) suggest that in the absence of any
data, management can make educated guesses about t*, n* and m (or N*) based on analogous
products so that diffusion curves can be developed for the technology under study.
4.5.2 Bass Diffusion Model parameters and CLD factors
The classic diffusion models represent a way to understand the diffusion process but are limited
by the need for data on past adoptions (Nelson M. J., 1998), (Mahajan & Peterson, Models for
innovation diffusion: Quantitative applictions in the social sciences, 1985). Classic diffusion
models work under the assumption that enough data on past adoptions is available in order to
feed closed forms and thus estimate the parameters following conventional estimation
procedures (Mahajan, Muller, & Wind, New Product Diffusion Models, 2000). This represents a
challenge from the identification standards perspective.
For identification standards (based on the definition given in the previous section) the adoption
data is currently unavailable. In order to collect the information, it would be necessary develop
and deploy and instrument for data collection in order to construct the data set. This research
contributes to the understanding of the identification standards adoption process by proposing a
way to address the problem of lack of adoption data and a consensus on a clear definition. The

103
formulation stages are proposed as a way to overcome those challenges and the operational
definition given in the previous section is proposed as a way to guide modeling efforts, in
particular for Stage 2.
The use of system dynamics in diffusion modeling has been attempted in previous studies.
Initial explorations of the use of the methodology are presented by (Finkelstein, Homer, &
Sondik, 1984). The work developed by (Maier, 1998) is specifically related to Stage 1 and the
work developed (Erdil & Emerson, Simulation modeling of electronic health records adoption in
the U.S healthcare system, 2009) and (Nelson, 1998) is related to Stage 2.
4.5.3 Formulation stages
The formulation stages were developed to learn about the behavior of the model parameters and
to overcome the challenges related to the identification standards definition and also the lack of
data on past adoptions. The model formulation follows a two stage process. Stage 1, or initial
approach, in which the BDM is used to mathematically describe the adoption process. Stage 2,
or second stage includes the relationships as established in the CLD and represents the empirical
relationships within all the factors defined in the CLD.
Stage 1 - Initial approach
The initial approach works under the assumption that the diffusion of the supporting
technologies can help to explain identification standards adoption and diffusion.
The goal of this stage is to estimate the BDM parameters, p and q, for the given set of supporting
technologies associated to the identification standards definition. The discrete version of the

104
formulation BDM is used to estimate the model parameters and to solve the model analytically
with methods described in Section 4.5.1. It is important to note that the CLD described
relationships are not used in this approach, just the model parameters associated to the internal
and external diffusion coefficients p and q.
Stage 2 – CLD relationships based model
The empirical development of the relationships between the factors and the BDM coefficients
was established, and then the formulation of the factors was developed; in this case, no
mathematical or closed solution exists.
The goal of this stage is to develop a model that simulates the adoption rate over time (diffusion)
and to observe the impact of the internal and external influence coefficients in the adoption rate.
The model is developed to simulate the diffusion of identification standards across the hospital
population over time. The sum (cumulative) adoption through time represents the diffusion. It
has been reported that the estimation of the exact nature of the interactions between the different
factors can be very difficult in many situations (Maier, 1998), (Sharif & Ramanathan, 1981).
Scope
Healthcare provider perspective is considered and a specific definition of the technology to be
defined as “adopted” has to be assumed. In the context of this research (stage 1) adoption is
defined as the level of penetration of a given technology (supporting technology) and diffusion is
defined as the widespread adoption of the technology among the members of a given population.
For stage 2, the level of penetration or adoption (identification standards-technology bundle) has
105
to be established using available industry data and the diffusion process is modeled via
simulation.
Limitations/assumptions
The advantages and limitations of the system dynamics modeling approach and the BDM
diffusion model as the basic structure of the model formulation have to be considered. As for the
modeling approach, there is not a detailed level of granularity at the healthcare provider level,
but an aggregation at the population level is assumed. A further breakdown into smaller sets
(large and small hospitals) could be considered, along with the inclusion of additional supply
chain members (e.g. population of distributors and manufacturers).
As for the BDM diffusion model, the healthcare provider population was considered as the main
component of the model. The healthcare population was divided between adopters and potential
adopters, also the impact of the external and internal influence coefficients in the adoption rate
was assumed. The existence of past data (Stage 1) is assumed based on the supporting
technologies due to the lack of data on identification standards past adoptions. The model goal
(Stage 2) is to conceptualize the adoption process of identification standards in a higher level of
abstraction; some of the structural components of the model are presented in an aggregated form.
The advantages of the systems dynamics approach over traditional linear models are that the
model captures the impact of the interventions, it helps to represent the system along with the
causes, and it provides an insight on the behavior of the adoption rate. The purpose is not to
forecast but to understand the system behavior. As explained by (Majahan & Wind, 1986), one
of the most important uses of diffusion models is to provide an analytical approach to describe

106
the spread of diffusion phenomena. As such, they can be used in exploratory mode to test
specific diffusion based hypothesis or to explore system interventions.
4.6 Stage 1 – model formulation, implementation and validation
Due to the lack of data on identification standards past adoptions, the supporting technology
approach is used to understand the identification standards adoption process. The healthcare
provider is considered as the population under study for modeling purposes. It is assumed that
the behavior of the diffusion of the technology that supports identification standards use is key to
understand identification standards adoption and diffusion.
4.6.1 Model formulation (Stage 1)
For Stage 1 the basic structure of the Bass Diffusion Model BDM is used. The BDM depicts the
rate of change in the number of adopters over time, and it illustrates the impact of the internal
and external diffusion coefficients in the adoption rate.
The model allows for an analysis of the evolution of the adoption rate over time. Based on the
analysis of this path, the peak (inflection point) can be established as well as the growth and
stabilization periods. The impact of the diffusion coefficients it is also subject to analysis. An
illustration of the model in Vensim is presented in Figure 11. The adoption rate represents the
flow between the potential adopters and the adopters (population under study), and the external
and internal diffusion coefficients are represented by p and q respectively.

107
Figure 11. Stage 1 – Vensim Model
Parameter estimation
There are different strategies that can be followed in order to estimate the model parameters. For
this formulation stage, two strategies were followed in order to obtain information related to the
model parameters:
a. By analogy, following the work developed by (Teng, Grover, & Guttler, 2002) and
(Mahajan, Muller, & Wind, New Product Diffusion Models, 2000).
b. With data on adoption of supporting technologies by process (healthcare) and then
following estimation procedures previously defined, using the discrete analog of the
BDM.
4.6.2 Parameter estimation - analogy approach
The analogy approach is based on the assumption that analog technologies could provide an
starting point for parameter estimation due to the lack of available data on identification
standards past adoptions. In order to estimate the model parameters (base run) the parameter
values described by (Teng, Grover, & Guttler, 2002) for technologies within cluster two were
108
used. For this type of technologies the average values of p are low (0.003) and the average
values of q are higher (0.38). For the current model p is 0.003 and q is assumed to be 0.25 which
is the median value in the table of page 22 from the reference document (Teng, Grover, &
Guttler, 2002).
The model formulation was implemented in Vensim, and the output results were obtained using
the report options. In order to use the BDM the adopting population was assumed as the total
number of hospitals registered in the AHA (5500 hospitals). The population was considered
homogenous, and no new hospitals were going in or out of the system. The periods within the
model were defined as years. The starting year was assumed as 2008, and the horizon was
defined as 50 periods (years). The values for p and q were used to test the model under for
different scenarios. Scenario 1 (S1) considered the 2% adoption rate given by (DeJohn, 2008)
with an initial population of 110 healthcare providers. Scenario 2 (S2) did not contemplate any
initial population. Scenarios 3 and 4 were variations of the initial year for analysis purposes.
Scenario 3 (S3) included the initial year as 1996 which was the year of the publication of the
EHCR report. This report marked a point in healthcare industry which brought awareness and
established the importance of the required technological infrastructure and identification
standards to improve the supply chain related processes. Scenario 4 (S4) included the initial year
as 2011.
The only relevant difference among scenarios is the change in the time it takes for the adoption
rate to peak. One of the most important observations also is that under the assumed conditions
the current deadlines established by the industry cannot be met. There is a deadline for year

109
2012 on product identifiers adoption and the location identifiers deadline adoption of 2010
already passed. The summary of results is presented in Table 15.
By using the parameters (p,q) based on analog technologies and available literature sources it
was observed that the model could be used to assess the current deadlines for data standards
adoption. It would take at least 15 years to reach the saturation point and a critical mass of
approximately 2871 healthcare providers. The critical mass concept was referenced by some
authors (Barlow, Crafting the supply chain stimulus package, 2009), (DeJohn, 2008). According
to (Rogers, Diffusion of Innovations, 1983), the critical mass occurs at the point at which enough
individuals in a system have adopted an innovation so that the innovation's further adoption rate
becomes self-sustaining; under current conditions it was possible to establish what would be the
critical mass for identification standards adoption.
Table 15. Analogy approach results
Analogy approach
Source initial
(DeJohn) no A0 EHCR date
from today
Scenario Label S1 S2 S3 S4 Y0 2008 2008 1996 2011 Horizon 50 50 50 50 Main N 5500 5500 5500 5500 inputs A0 110 0 0 0 P 5390 5500 5500 5500 p 0.003 0.003 0.003 0.003 q 0.25 0.25 0.25 0.25 Inf. Point (year) 2022 2026 2014 2029
Main Years to AR
peak 15 19 19 19
Outputs AR max (H/year) 350.97 352.05 352.05 352.05
Critical mass
(H) 2871 2723 2723 2723
110
The current results are limited because of the assumptions made regarding the relationship
among the technologies described in (Teng, Grover, & Guttler, 2002). The technologies under
cluster two are not directly related to healthcare but the results from this approach give an
estimate of the time it could take for identification standards adoption to reach a critical mass.
Also provides an indication of the number of healthcare providers per period that would be
required to join the initiative in order to keep the adoption process on track.
4.6.3 Parameter estimation - supporting technology approach
The model parameters (p,q) can be also estimated by the use of analog technologies within the
healthcare domain. The operational definition indicates the required technological infrastructure
to support data standards adoption and use within the healthcare provider. In this section, the
adoption of the technologies required to support supply chain related processes were studied;
those technologies are illustrated in Figure 12.
Each process group type has a set of technologies. For example, processes type I can make use
of EDI, processes type II can make use of barcode enabled applications and processes type III
can make use of BPOC technology. The MMIS is the underlying platform for technology
integration along the internal healthcare provider supply chain.

111
Figure 12. Technology map
Baserun values
The data available through the HIMSS academic agreement which gave access the Dorenfest
Institute Data Base was explored. The goal was to estimate the BDM parameters for the
supporting technologies related to each process group type.
The available information was analyzed and categorized according to the similarities of the
explored databases. The information related to technology adoption among hospitals was
collected with an annual survey. It was observed that as the number and scope of questions in
the annual survey was expanded some modifications in the compilation of the information was
required. For example the earliest versions of the database included information related to the
hospital population when the population size was about 3000 hospitals. It was also observed that
the information associated to technology availability by database was also different. These

112
differences led to the categorization of the data bases as shown in Table 16. A detailed list of the
available databases is provided in Appendix B.
Table 16. Databases (information sources)
Data base description Date range Main characteristics
3000+ DB 1986 -1994 Two sub sets of data, MM year of adoption not software provider information
IHDS DB 1998-2004 Data on several hospital applications, MM year of adoption not software provider information
Complete DB 2005-2007 MM year of adoption and software provider information 2008 DB 2008 Auto identification use/adoption information
After reviewing the available information and classifying the available databases, Micro Soft
Office (MSO) Access routines were developed in order to design queries that allowed for the
construction of the specific data sets so that BDM model parameters could be estimated. One
data set per technology, according to the technology map given in Figure 12 was developed. The
tool presented in Chapter 12 of the book by (Mahajan, Muller, & Wind, New Product Diffusion
Models, 2000) was used to estimate the BDM parameters. The model parameters were estimated
using Nonlinear Least Squares (NLS) method. The tool is a free student version of ME software
which runs as an MSO Excel add on. A description of the tool and the supporting information
associated with the estimation of the parameters are included in Appendix B.
The model formulation was implemented in Vensim using the model parameters obtained for
each technology in order to model the adoption rate behavior. The Stage 1 Vensim formulation
of the model is described in Appendix C. Patterns for each technology were obtained and the
results are shown in Figure 13.

113
Figure 13. Supporting technology adoption patterns
The model check and units check testing functionality of Vensim was used to validate the
models.
The estimation of the model parameters was more reliable for the MMIS technology since there
was enough information to develop more than one data set as shown in Table 17. According to
(Mahajan & Peterson, Models for innovation diffusion: Quantitative applictions in the social
sciences, 1985) at least three data points are required for parameter estimation purposes. The
information related to the use of Auto identification technologies for supply chain management
purposes among hospitals was relevant after the 2005 HIMSS Data Base (DB) version. Previous
versions did not include that type of information. Among the available databases, the 2008
HIMSS DB was the one with the most complete source of information related to the use of Auto
ID DC (barcode and RFID) within the hospital population under study. For the adoption of
technologies that build upon the MMIS, such as BPOC, the available information was not
enough, as there were just three data points available for parameter estimation. Those data
points correspond to the data obtained from the 2008 HIMSS DB.
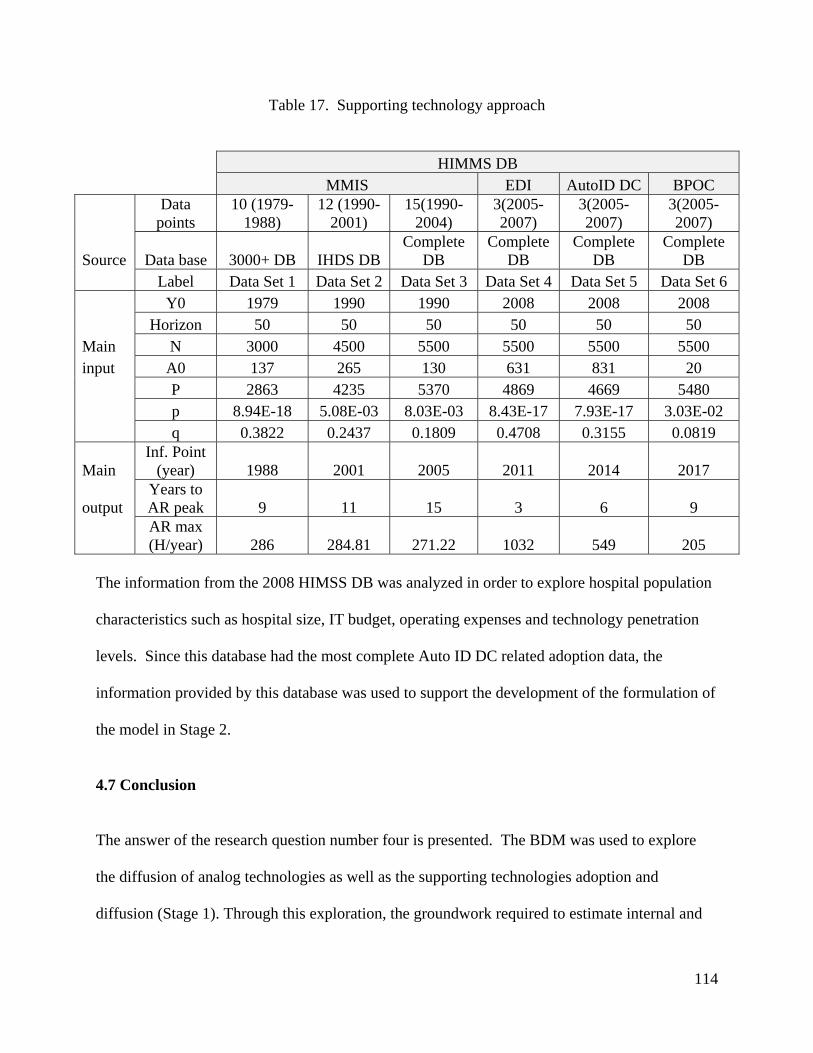
114
Table 17. Supporting technology approach
HIMMS DB MMIS EDI AutoID DC BPOC
Data
points 10 (1979-
1988) 12 (1990-
2001) 15(1990-
2004) 3(2005-2007)
3(2005-2007)
3(2005-2007)
Source Data base 3000+ DB IHDS DB Complete
DB Complete
DB Complete
DB Complete
DB Label Data Set 1 Data Set 2 Data Set 3 Data Set 4 Data Set 5 Data Set 6 Y0 1979 1990 1990 2008 2008 2008 Horizon 50 50 50 50 50 50 Main N 3000 4500 5500 5500 5500 5500 input A0 137 265 130 631 831 20 P 2863 4235 5370 4869 4669 5480 p 8.94E-18 5.08E-03 8.03E-03 8.43E-17 7.93E-17 3.03E-02 q 0.3822 0.2437 0.1809 0.4708 0.3155 0.0819
Main Inf. Point
(year) 1988 2001 2005 2011 2014 2017
output Years to AR peak 9 11 15 3 6 9
AR max (H/year) 286 284.81 271.22 1032 549 205
The information from the 2008 HIMSS DB was analyzed in order to explore hospital population
characteristics such as hospital size, IT budget, operating expenses and technology penetration
levels. Since this database had the most complete Auto ID DC related adoption data, the
information provided by this database was used to support the development of the formulation of
the model in Stage 2.
4.7 Conclusion
The answer of the research question number four is presented. The BDM was used to explore
the diffusion of analog technologies as well as the supporting technologies adoption and
diffusion (Stage 1). Through this exploration, the groundwork required to estimate internal and
115
external diffusion coefficient parameter ranges is provided in order to move into the
development of the simulation model in the next chapter (Stage 2). Some of the limitations with
the use of diffusion models such as the BDM are the need of extensive amount of data on past
adoptions to better estimate the parameter values and also the need of a clear definition of the
technology to be adopted. A proposed solution to the lack of definition was the operational
definition by process type based on supporting technology assumption. Additionally, the
formulation stages 1 and 2 were proposed to overcome the lack of past data on identification
standards adoptions.
Following the results from the Stage 1 formulation, the adoption patterns for the main
technologies for each supporting technology at each process type grouping were found.
The behavior patterns were developed using the data from the HIMSS DB. This database
provided information related to the state of technology use by healthcare providers. It was
possible to extract relevant data from it by using the tables and designing queries in MSO
Access. The data was analyzed further using MSO Excel. The estimation of the model
parameters followed the Nonlinear Least Squares NLS estimation procedure. The values of the
internal and external diffusion coefficients vary, but certainly p is low and q is higher. The
numerical ranges are close to zero for p and the q range is [0.18-0.38]. There are limitations with
current data for technologies different than MMIS as there are fewer data points which mean that
the results from the parameter estimation are less reliable.
Each one of the supporting technologies exhibits a different adoption pattern or behavior. As
shown in Figure 13a, the MMIS diffusion pattern exhibits a peak at year 15. This timeline is
close to the ten year timeline estimated by (Langabeer II, 2008) for the diffusion of healthcare

116
supply chain technologies. Based upon the assumption that an analogy between identification
standards and MMIS technology can be established, it can be inferred that the adoption of
identification standards could take as long as it took hospitals to adopt its main supporting
technology. According to Figure 13b the supporting technologies for processes type I adopt at a
higher rate than the supporting technologies for processes type III. Thus, identification standards
could be adopted sooner within processes Type I compared to processes type III.
A partial answer to research question number five was also addressed in this chapter. As
presented by (Finkelstein, Homer, & Sondik, 1984), the cost is not a relevant issue in the present
model due to the fact that the main technology investment has already been made (supporting
technologies) and it only requires an upgrade. In contrast, the analysis presented by (Erdil &
Emerson, Simulation modeling of electronic health records adoption in the U.S healthcare
system, 2009) for EHR adoption presented the cost as one of the most relevant issues. The
model developed in this research maintains the assumption presented by (Finkelstein, Homer, &
Sondik, 1984), meaning that the costs associated with identification standards adoption are also
associated with investments that were already made by hospitals, in particular the MMIS
investment. There is a challenge in the estimation of the ROI of most healthcare related
investments as presented by (Menachemi & Brooks, 2006). The purpose of the model is to
understand the adoption process over a time horizon (50 years) taking into consideration the
aggregated benefits that could be obtained from identification standards use within processes at
the healthcare provider level.
This research extends the work of (Erdil & Emerson, Simulation modeling of electronic health
records adoption in the U.S healthcare system, 2009) related to the adoption of EHR, in the sense

117
that presents a formal treatment to the mathematical structure that supports the model
development. It introduces the system dynamics SD methodology using the information from
the conceptual model and develops the mathematical structure of the model based on the
available data and the proposed identification standards definition, which poses a challenge.
This research brings the results of phase I into a model for phase II, which is a first model of its
kind.

118
5. Model formulation, implementation and validation (Stage 2)
5.1 Model formulation (Stage 2)
The purpose of the model in this formulation stage is to gain insight into the factors that might
influence the pattern of identification standards diffusion among healthcare providers
(population) and how that pattern could be modified or influenced, as opposed to making
predictions or forecasting the future. According to (Rogers, Diffusion of Innovations, 1983)
adoption is defined as specific point in time measurement of technology use (usually percentage
of adopters), and diffusion is generally understood as the widespread use over time. The goal of
the simulation model is to simulate the diffusion (assumed implementation and use over time) of
the proposed definition of identification standards. In the context of this research, identification
standards adoption is defined as the adoption of location and product identifiers within
transactions and processes at the healthcare provider level according to the definition given in
Section 4.4. The use of such identifiers would improve the process efficiency; which means less
error and fewer resources would be devoted to the processes. There could be also an increase in
patient safety due to an improved product administration.
Data in numerical form, industry experts’ knowledge and the author’s experience are important
elements in the formulation development. The primary source of data is the HIMSS DB (2008
version) and information from the literature review on identification standards adoption
developed in Chapter 3. That information was used to develop the model assumptions in the
form of graphical functions with the support of Vensim functionality. That information was also
used to develop the input parameters (base run) as described in the model implementation
section.
119
5.1.1 Simulation model structure
There is a connection between the factors defined in the causal loop diagram (CLD) and the main
elements of the simulation model, as shown in Table 18. The factors defined in the CLD were
used as a main guideline for the formulation of each simulation model component. For example,
the formulation of Component 1 (C1) represents an interpretation of the factors within the
environment section which attempts to mathematically express the effect of the external factors
on the adoption rate. There are four model components. The factors from the environment
section of the CLD were used to formulate Component 1 (C1) of the simulation model. In a
similar way, the factors within the technology section were used to formulate Component 2 (C2)
and the organizational factors were used to formulate Component (C3). The basic structure of
the simulation model is the healthcare population which was included in the model as
Component (C4).
Generic model
The generic model is illustrated in Table 19. The formulation of each component was developed
taking into consideration the main relationships within the model elements which can be adjusted
according to the specific requirements of the population to be analyzed (e.g. hospitals within a
network or single hospitals). The models in Stage 1 were developed taking into consideration a
single population and each one of the technologies within each process group type. For example,
one model for EDI was developed based on BDM parameters estimated as explain in Section
4.6.1. For Stage 2, two populations can be considered although just one of the populations
(H>2) is considered for model development and analysis purposes, the assumption of the
population size is considered within Component 4 (C4). Component 1 (C1) represents the
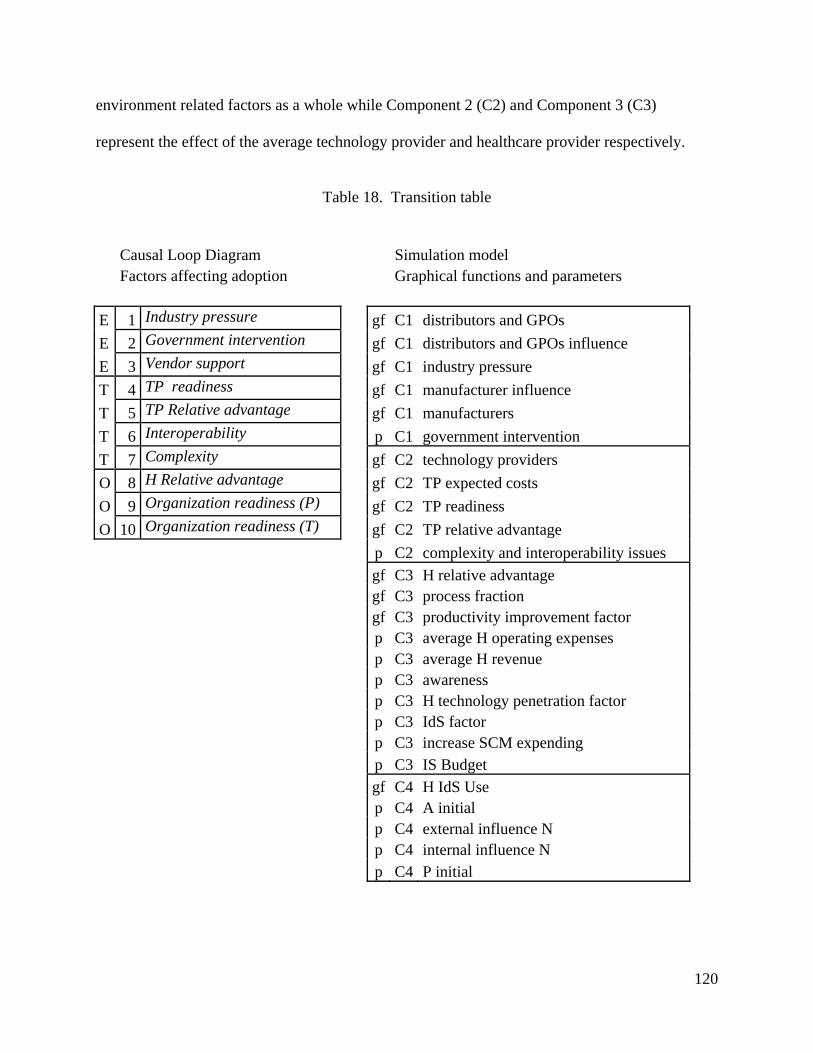
120
environment related factors as a whole while Component 2 (C2) and Component 3 (C3)
represent the effect of the average technology provider and healthcare provider respectively.
Table 18. Transition table
Causal Loop Diagram Simulation model Factors affecting adoption Graphical functions and parameters
E 1 Industry pressure gf C1 distributors and GPOs
E 2 Government intervention gf C1 distributors and GPOs influence
E 3 Vendor support gf C1 industry pressure
T 4 TP readiness gf C1 manufacturer influence
T 5 TP Relative advantage gf C1 manufacturers
T 6 Interoperability p C1 government intervention
T 7 Complexity gf C2 technology providers
O 8 H Relative advantage gf C2 TP expected costs
O 9 Organization readiness (P) gf C2 TP readiness
O 10 Organization readiness (T) gf C2 TP relative advantage p C2 complexity and interoperability issues
gf C3 H relative advantage gf C3 process fraction gf C3 productivity improvement factor p C3 average H operating expenses p C3 average H revenue p C3 awareness p C3 H technology penetration factor p C3 IdS factor p C3 increase SCM expending p C3 IS Budget
gf C4 H IdS Use p C4 A initial p C4 external influence N p C4 internal influence N p C4 P initial
121
Challenging issues with data
Currently there is no data on past adoptions for identification standards nor information related to
the factors as defined in the CLD. The data on past adoptions of identification standards could
be used to estimate the BDM parameters (Stage 1) but since the data is not available the
estimation and quantification of the model (Stage 2) initial conditions was supported by literature
sources and available data. This process was difficult due to the qualitative nature of some of the
factors identified in the CLD and in general the data availability (Glöber, Thun, & Milling,
2008). For this reason, gathering and finding qualitative and quantitative data to support the
factors in order to describe them in a mathematical form was challenging.
This modeling stage presented a way to analyze the identification standards adoption process,
taking into consideration the challenges posed by the data availability, and then proposed a way
to overcome those challenges. Since there is no data on the factors, the main factors were
transformed into graphical functions (variables) defining a set of parameters to conceptualize and
develop the simulation model with the use of the Vensim functionality. The information
required to specify the shape and the values for the graphical functions can be obtained from
different sources such as industry reports, fieldwork and expert interviews (Sterman, 2000). The
graphical functions and parameters are shown in Table 18.

122
Table 19. Generic model
Stage 1 Models Assumptions Parameters BDM Proxy= IdS
one p MMIS as the underying
MMIS population q infrastructure one p proxy type I EDI population q EDI one p proxy type II BC SCM population q BC SCM one p proxy type III BPOC population q BPOC
Stage 2 (generic) Model Model components and assumptions IdS C4 C1 (General)
H>2 N=3056 C2 (Average tech. provider)
C3 (Average hospital ) assumptions = gf IdS C4 C1 (General)
H=1 N=2112 C2 (Average tech. provider)
C3 (Average hospital )

123
A cross sectional analysis (survey), at one point in time, could be used to validate the proposed
functional relationships (graphical functions) and the model parameters but a questionnaire based
on the qualitative nature of the factors could be developed along with the transformation of such
qualitative information into a numerical form via fuzzy logic as proposed by (Liu, Triantis, &
Sarangi, 2011). Such a project is out of the scope of the current research. A preliminary
validation of the proposed model structure and the behavior of the main functional relationships
was performed with industry experts. In general the model structure was found coherent and no
factors were considered out of the scope.
5.1.2 Model components (formulation)
In this section each component, its main variables (graphical functions), intermediate variables
and important parameters are explained. The process followed to implement the simulation
model is described in the next section. The main model components are illustrated in Figure 14.
The graphical functions and parameters within each component are shown. The description of
the graphical functions and parameters is given in Appendix C. The components are used to
illustrate the implicit relationships of the CLD factors with the adoption rate.

124
Figure 14. Model components
Component 1 – Environment
This model component is related to the external forces affecting the adoption; it is also related to
the stakeholders that make decisions that are out of the control of the healthcare provider.
According to Table 18, the main factors of the environment section in the CLD diagram are the
following: vendor support, industry pressure, and government intervention. Those factors are
considered within this component as 3 main graphical functions and one parameter. There are
two additional graphical functions which are used to represent the manufacturer and the
distributor and GPOs populations.
According to the CLD, the vendor support is related to the support of the identification standards
initiative from the trading partners such as manufacturers, distributors and GPOs. The vendor
support is formulated as a function of the number of healthcare supply chain members adopting
the solution. For the simulation model, two separate functions were defined. The first one, is the

125
manufacturer influence and the second one, is the distributor and GPOs influence. This was
done due to the fact that the manufacturer population is the only one to be directly affected by
any government regulation and the other supply chain members have the option to follow the
regulation or to wait until manufacturers implement the required changes. This way the
manufacturer population can be affected by a government intervention since manufacturers are
the only supply chain members that the government can affect directly via a FDA regulation.
Figure 15. Manufacturer influence
It is assumed that the number of vendors increases over time and so does the influence. The data
to support the population size for the manufacturers, the distributors and GPOs was gathered
from the Health Industry Distributors Association (HIDA) website and it represents the general
medical surgical supply chain. There are about 7000 companies within the US medical
equipment and supplies industry, and there are about 200 distributors and GPOs. An increase in
the output (influence) was estimated as the number of members joining the initiative increases.
The influence is formulated as an increasing function over time but never reaching the limit of 1
as a total output.

126
Figure 16. Distributors and GPOs influence
The industry pressure reflects the impact that the pressure of industry groups could have on the
healthcare provider adoption. It is formulated as a graphical function in Vensim using the
influence exerted by distributors and GPOs as the main input. The industry pressure is
formulated as an increasing function related to the influence exerted by the distributors and
GPOs.
Figure 17. Industry pressure

127
The government intervention factor is related to the pressure that can be exerted through a FDA
regulation. Such regulation will have a direct impact on the manufacturers but an indirect impact
on healthcare providers via vendors and industry groups.
Currently, the FDA UDI rule is pending. This rule would require the identification of the
product in the form of a barcode using either standard (GS1 or HIBCC) and it should also be
human readable. This regulation will have an impact only on manufacturers. To notice also that
the effect of the regulation would make manufacturers work on product identifiers by product
class, starting with the most critical ones. The change will not happen overnight, even if the
ruling is released in the near future, it would take time for the manufacturers to comply. It is
assumed that even if product identifiers could be available tomorrow (product shipped out of the
manufacturer’s warehouse with product identifier labels), it will take as long as it took healthcare
providers to adopt the supporting technology (MMIS), for identification standards to be used at
the healthcare provider level. This assumption is based on the association identification standards
- supporting technology which was made in order to analyze the adoption process since no data
associated to identification standards past adoptions exists.
The government intervention is formulated as a STEP function in Vensim. This function is
defined with two parameters the size of the jump and the period. It is assumed in the model that
the regulation will be in effect within the next 5 years.
Component 2 - Technology
This model component is related to the technology solution provider and the technologies they
provide (supporting technologies) and how the implementation of these technologies would

128
affect the adoption of identification standards. Identification standards is not a standalone
application but a complex concept that requires the incorporation of a set of technologies among
a given set of processes at the healthcare provider level as explained in the identification
standards definition (Section 4.4).
According to Table 18, the main factors of the technology section within the CLD diagram are
the following: technology provider readiness, technology provider relative advantage,
complexity and interoperability.
Those factors are considered within this component and formulated using four graphical
functions and one parameter. The graphical functions are associated with the technology
provider readiness (TP readiness), the technology provider relative advantage (TP relative
advantage), the technology provider expected costs (TP expected costs) and the technology
provider population (technology providers). The complexity and interoperability factor defined
in the CLD is formulated as one parameter affecting the technology provider readiness (TP
readiness).
The technology provider readiness (TP readiness) is defined as the preparedness level from the
technology solution provider perspective. This factor is related to the willingness to implement
the requests made by healthcare providers regarding product enhancements and improvements
related to transaction capabilities using identification standards. TP readiness is formulated as a
function of the number of technology providers joining the initiative over time. It is assumed
that the number of technology providers joining the identification standards initiative increases
over time and in the same way the readiness increases. The data to support the technology
provider population size was gathered from the analysis of the reports developed using

129
information extracted from the 2008 HIMSS DB. There were about 70 technology solution
providers according to the report of solution providers within the supply chain related technology
market.
Figure 18. Technology provider readiness
From the technology provider perspective, the technology provider relative advantage is related
to the costs and benefits that could be obtained when delivering technology products that meet
the requirements associated with identification standards use in the industry. The costs are
related to the development costs. It is expected that the costs of development decrease with time.
The benefits are related to upgrades of IT products offered to healthcare providers. It is expected
that the benefits increase with time. It is assumed that the benefit for the technology provider is
the implementation cost for the healthcare provider.
In general the relative advantage is associated with the expected gain that the technology
provider could obtain from the delivery of products meeting the requirements. As the gain

130
increases, the relative advantage increases as well. The gain is defined as the difference between
the benefits and the costs.
Figure 19. Technology provider relative advantage
The expected costs for the technology provider are assumed to decrease as the hospital use of
identification standards increases over time. This assumption considers the costs of the upgrades
and maintenance of the applications associated with identification standards adoption and use.
Figure 20. Technology provider expected costs
131
Complexity and interoperability are considered as a single element in the simulation model to
represent the level of commitment of technology solution providers in addressing complexity and
interoperability related issues. It is assumed that initially those issues are not addressed by
technology providers but as the adoption process moves forward, the issues are solved in order to
support adoption. This factor, complexity and interoperability issues, was defined as a parameter
within the model using a numerical scale to represent low or high effort from the technology
provider to solve these issues.
Component 3 - Organization
According to Table 18, the main factors of the organization section within the CLD are the
following: organization readiness (P), organization readiness (T) and hospital relative advantage.
Within this component those factors are considered using 3 graphical functions and 7 parameters.
The graphical functions represent the hospital relative advantage (H relative advantage), the
fraction of processes within the hospital using the identifiers (process fraction) and the level of
improvement due to identification standards adoption and use (productivity improvement factor).
The parameters are used to support the formulation of the hospital relative advantage and the
organization readiness as it is explained in the following paragraphs.
From the healthcare provider perspective, the relative advantage includes the difference between
the gains and the costs associated with the adoption and use of identification standards. For this
factor, as the gain increases, the relative advantage also increases. The gain is related to the
difference between the benefits and the costs of adopting identification standards.
132
The benefits are associated with the reduction of process inefficiencies, increased productivity
and reduction of errors due to the use of identification standards. The costs are associated with
the implementation and maintenance costs incurred when adopting identification standards
(CSC, 1996). The benefits and implementation costs are different by process group type but it
can be aggregated as shown in Table 20.
The following are the assumptions associated to the cost benefit estimation:
There are challenges on measuring ROI on health IT related investments (Menachemi &
Brooks, 2006). Identification standards adoption builds over already existing
infrastructure and the IT investment has been completed, in particular for healthcare
providers. The adoption of identification standards would require upgrades to the current
infrastructure given the fact that more than 95% of the hospitals have an MMIM in place.
The replacement of such an application is not assumed.
It is assumed that adopting identification standards is beneficial.
Cost is not as big of an issue for identification standards adoption as it is for EHR
adoption, for which large investments in IT solutions have to be budgeted. The cost of
the upgrade is assumed.
The supply chain perspective is considered, in particular, the processes within the MMIS
scope.
According to the generic model shown in Table 19, an average healthcare provider is considered
in order to define the benefits and the costs in aggregated terms since specific data on benefits
and implementation costs by process type was not available. Data from the HIMSS DB 2008
related to the hospital revenue and operating costs as well as the IS Budget allocation proportion

133
was used to support parameter development. The following parameters were developed in order
to formulate the hospital relative advantage (H relative advantage):
- average H revenue and average H operating expenses, representing the available
resources at the healthcare provider level.
- IS Budget, representing the proportion of the revenue allocated to information technology
related investments.
- IdS factor, representing the allocation of the available resources to the identification
standards initiative.
- H SCM operating costs, representing the costs associated to internal supply chain related
processes.
- H IdS implementation costs, representing the costs associated to the upgrades to the
current technological infrastructure to support identification standards adoption and use.

134
Table 20. Identification standards costs and benefits
Process Cost Anticipated Outcomes Group Anticipated Outcomes (benefits) Implementation summary
Improved fill rates Investment costs Effective communication Increased customer satisfaction Increased data accuracy Maintenance costs Eliminated paperwork Increased productivity Reduced costs Improved fill rates Reduced cycle time Improved productivity Reduced errors Reduced paperwork Increased customer satisfaction I Reduced product returns Increased data accuracy Reduced rework Increased productivity Increased reliability Improved productivity Investment costs Lower inventory levels Increased customer satisfaction Increased data accuracy Maintenance costs Reduced back orders Increased reliability Reduced costs Lower inventory levels Reduced cycle time Overall process improvement Reduced errors Reduced back orders Reduced labor Reduced cycle time Reduced mis-picks Reduced labor Reduced paperwork Reduced mis-picks Reduced product returns II Reduced paperwork Reduced rework Reduced product returns Reduced rework Overall process improvement Effective communication Investment costs Eliminated paperwork Improved productivity Maintenance costs Increased customer satisfaction
III Increased data accuracy Reduced cycle time Reduced product returns
Source: EHCR Report 1996
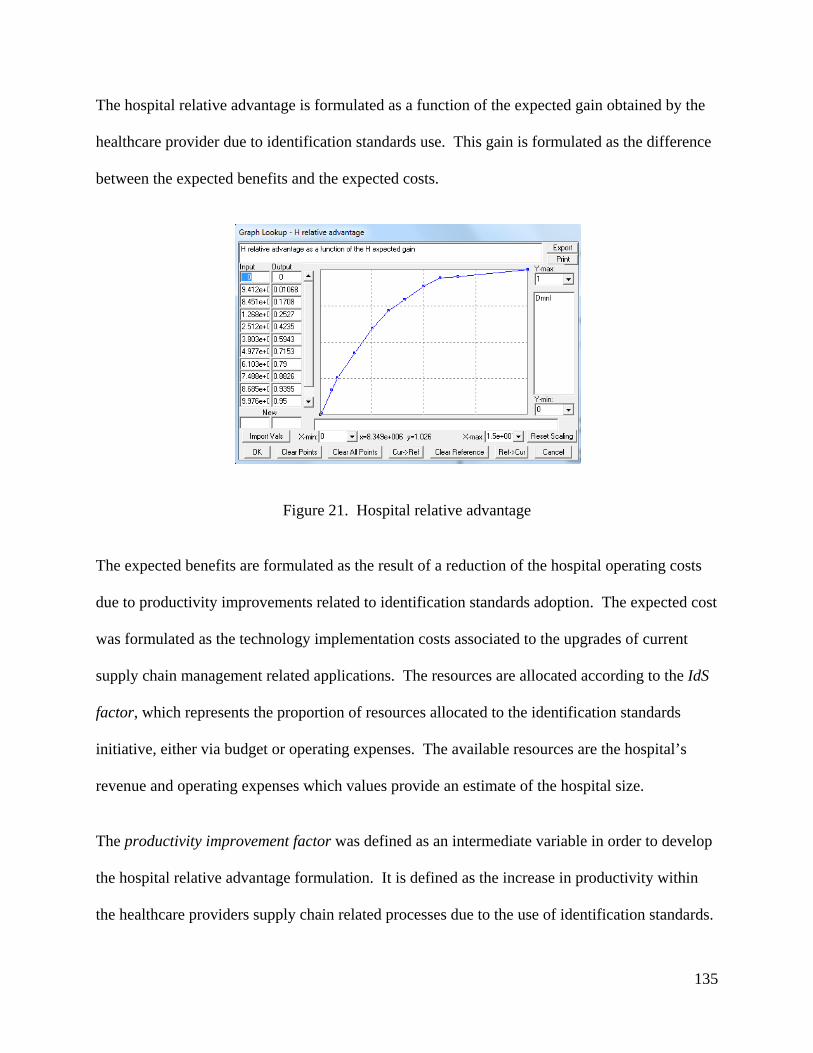
135
The hospital relative advantage is formulated as a function of the expected gain obtained by the
healthcare provider due to identification standards use. This gain is formulated as the difference
between the expected benefits and the expected costs.
Figure 21. Hospital relative advantage
The expected benefits are formulated as the result of a reduction of the hospital operating costs
due to productivity improvements related to identification standards adoption. The expected cost
was formulated as the technology implementation costs associated to the upgrades of current
supply chain management related applications. The resources are allocated according to the IdS
factor, which represents the proportion of resources allocated to the identification standards
initiative, either via budget or operating expenses. The available resources are the hospital’s
revenue and operating expenses which values provide an estimate of the hospital size.
The productivity improvement factor was defined as an intermediate variable in order to develop
the hospital relative advantage formulation. It is defined as the increase in productivity within
the healthcare providers supply chain related processes due to the use of identification standards.

136
Figure 22. Productivity improvement factor
In general, readiness is defined as the level of preparedness of the healthcare providers towards
identification standards adoption. The organizational readiness (T) is associated to the
technology penetration (supporting technology) and the number of processes using the
identifiers. It is assumed that a healthcare provider would be more or less ready, depending
primarily upon the penetration of the supporting technology and the internal use of the
identifiers. The internal use of the identifiers is formulated as the organizational readiness (P).

137
Figure 23. Process fraction
The organizational readiness (P) is defined as a function of the process fraction which is defined
as the fraction of processes within the healthcare provider using the identifiers according to the
identification standards definition. This process fraction is assumed to increase over time. The
process fraction is affected by the awareness. The awareness is associated to the number of
pilots or industry initiatives that can increase the willingness of the healthcare provider to initiate
projects related to identification standards use within internal processes. This parameter is
defined on a low to high numerical scale.
Component 4 – Basic population structure
The healthcare provider population is divided among adopters and non-adopters. It is assumed
that once a hospital adopts it does not reverse the decision. The adoption rate represents the flow
of hospitals from non-adopters to adopters. The basic population structure follows a similar
structure as the BDM. The intermediate variable H IdS Use is defined as the increase over time
on hospital use of identification standards due to the evolution of the hospital population
(adopter influence).

138
Figure 24. Hospital IdS use
The H IdS use variable plays a key role in the integration of Component 3 (C3) and Component 2
(C2) since this variable represents the incremental use of identification standards of the average
healthcare provider considered within the generic model. The productivity improvement factor
and the process fraction at the healthcare provider level, and the cost for the technology provider
(TP costs) are related to this variable.
5.1.3 Generic model structure
As described in the BDM formulation a given population (healthcare provider) is influenced by
external and internal factors (Maier, 1998). The external factors are out of their control and not
directly related to the healthcare provider population. The internal factors are related directly to
the healthcare provider population and are influenced by the adoption of other population
members. The model components are related to the internal and external diffusion coefficients
in the following way. As shown in Figure 25, Component (C1) is related to the external
diffusion coefficient and Components (C2) and (C3) are related to the internal diffusion

139
coefficient. The main parameters within Component 4 (C4) are the ones related to the
population and the initial values of the diffusion coefficients that are to be affected by the
formulation of the different factors by component. Those initial values were estimated based on
the analysis of the model parameters developed in Stage 1. In the simulation model each
component is defined by a set of multipliers which have an effect on the hospital adoption rate.
Within each component the average effect of the multipliers is considered. The adoption rate is
formulated as the sum of the external and internal influences. The generic model structure is
illustrated in Figure 25.

140
Figure 25. Simulation Model

141
5.2 Model formulation structure implementation
This section describes the process followed in order to implement the model formulation
structure proposed in the previous section. This implementation was performed using the
simulation tool Vensim PLE Plus version 5.11A.
5.2.1 Implementation steps
The simulation model was developed by first testing each component (including graphical
functions and parameters) individually and then adding one at a time trying to stay close to the
reference model pattern. The MMIS adoption pattern developed in Section 4.6 was followed as a
reference model. The testing and addition sequence in Vensim started with the organization
component (Component 3); this component was added to the basic structure of the simulation
model (Component 4) trying to develop a stable model close to the reference model. The same
step was followed for Components 2 and 1. The parameters within Component 4 (C4) remained
unchanged during the testing and development process.
The graphical functions and parameters listed in Appendix C are part of the final version of the
model. During the model development ten integrated test models were developed and tested by
comparing the exhibited behavior for the main output variable to the reference model. For
example earlier model versions included the integration of Component 4 (C4) with Component 3
(C3), once the fitting to the reference model was achieved another component was added to the
test model. A sequential adjustment (testing and development) process was performed until a
stable model behavior related to the reference model was obtained. During the testing and
development process, different types of adjustments were identified. There were adjustments

142
related to the range and function shape of the graphical functions, adjustments related to the
range of the parameters; and adjustments related to the formulation of each one of the component
multipliers. Each one of those changes was addressed component by component until a final
integrated model formulation was developed. The model that fitted the reference model more
closely was selected as the model baserun. At each step of the model implementation, the model
was verified using the Vensim PLE Plus tools: model check and units check in order to identify
and correct any errors.
5.2.2 Base run development
One of the main challenges developing the base run was to obtain data to feed the model. For
the reference model (Stage 1) it was not difficult to collect and analyze the data directly from the
HIMSS DB in order to estimate the model parameters; however, for the model in Stage 2 the
parameter estimation was not as straightforward and the only way to obtain reference data for the
model base run was to rely on the available sources, such as the HIMSS DB, literature sources,
expert’s interviews and the researcher’s judgment. This approach to parameter estimation is
supported by (Glöber, Thun, & Milling, 2008). Some of the parameter definitions of similar
models, such as the ones described in (Maier, 1998) and (Erdil & Emerson, 2009), were revised
in order to guide the model adjustment. The model base run values were developed in parallel
while developing and implementing the model structure.
The model initial conditions consist of a set of conditions that can be grouped in two categories:
graphical functions and parameters. The graphical functions guide the behavior of the
components and those were described in Section 5.1. The graphical functions are the model
assumptions and were used to configure the model parameters. The parameters are classified

143
into four groups according to their characteristics and numerical values. The first group includes
the parameters related to the external forces that affect the adoption rate. The parameters that are
related to the availability of resources at the healthcare provider level are included in group two.
The third group of parameters includes those related to values that control the allocation of
resources as well as the technology availability. The last group includes the parameters directly
related to the composition of the healthcare population. The classification of the parameters and
the base run values are presented in Table 21.
Table 21. Model baserun
group parameter IM Baserun
initial 1 governmentintervention 1
complexity and interoperabilityissues 1
awareness 1 2 average H operating expenses 262,364,000 average H revenue 270,826,000 IS Budget 0.03 3 H technologypenetration factor 0.4 IdS factor 0.05 increase SCM expending 0.01 4 A initial 500 externalinfluence N 0.02 internalinfluence N 0.32 P initial 2500
The complete model formulation is presented in Appendix C.
5.2.3 Validation
Validation can be viewed as a process of establishing confidence in both the behavior and the
structure of a model (Finkelstein, Homer, & Sondik, 1984). The validation process was
144
performed using the base run values defined in the previous section and considering the
assumptions contained in the graphical functions. The model was tested under the following
validation tests (Sterman, 2000):
Behavior reproduction
Dimensional consistency
Parameter assessment
Sensitivity analysis (See section 5.3)
Behavior reproduction
The model’s main output was compared with one or more historical data series available for
similar adoption processes. In this particular case the MMIS reference model is followed. It was
also useful to compare the different patterns obtained under different input assumptions with
diffusion patterns of similar technologies. The model was able to produce outputs that
corresponded to past historical trends (Stage 1 reference model), and the results were within a
reasonable range.
Dimensional consistency
The model was tested for dimensional consistency by using the Vensim model check and units
check options. The model was verified for consistency at each step of the implementation
process, and the corresponding adjustments were made until consistency was achieved and no
errors were reported.

145
Parameter assessment
The different model components were used to test each one of the parameters within the
component. The components were used as submodels to test the consistency and also to partially
test and adjust the parameters. The parameter assessment was followed at each step of the model
implementation process, and the adjustments to the model parameters were made until a stable
model behavior was achieved.
5.2.4 Simulation results (base run)
The numerical results of the output of the simulation are presented in Table 22. The model was
run over a period of 40 years, with the year 2008 as the initial year. This starting year was
selected since it was the year that the main initiative related to identification standards adoption
started (DeJohn, 2008).
Table 22. Simulation baserun results
Baserun results Y0 2008 Main Horizon 40 input N 3000 A0 500 P 2500 p 0.02 q 0.32 Main Years to AR peak 14 output Inf. Point (year) 2022 AR max (H/year) 185 Critical mass (H) 2014
Saturation point
(year) 2038 End year 2048
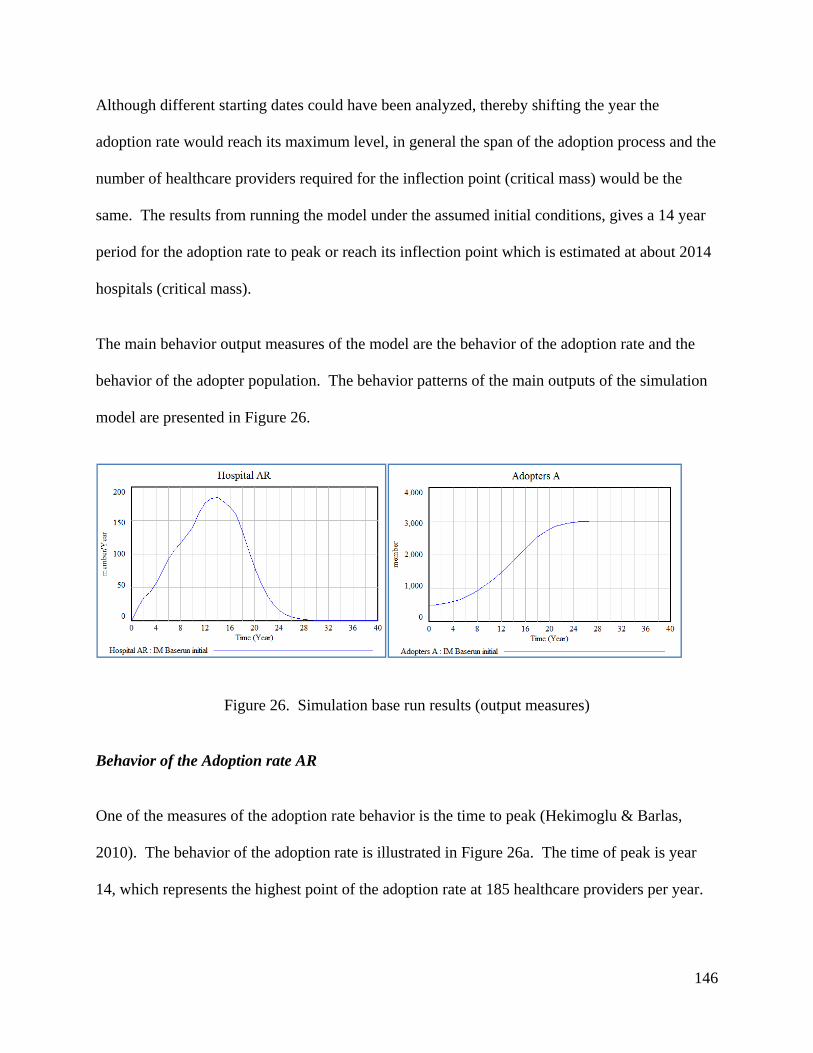
146
Although different starting dates could have been analyzed, thereby shifting the year the
adoption rate would reach its maximum level, in general the span of the adoption process and the
number of healthcare providers required for the inflection point (critical mass) would be the
same. The results from running the model under the assumed initial conditions, gives a 14 year
period for the adoption rate to peak or reach its inflection point which is estimated at about 2014
hospitals (critical mass).
The main behavior output measures of the model are the behavior of the adoption rate and the
behavior of the adopter population. The behavior patterns of the main outputs of the simulation
model are presented in Figure 26.
Figure 26. Simulation base run results (output measures)
Behavior of the Adoption rate AR
One of the measures of the adoption rate behavior is the time to peak (Hekimoglu & Barlas,
2010). The behavior of the adoption rate is illustrated in Figure 26a. The time of peak is year
14, which represents the highest point of the adoption rate at 185 healthcare providers per year.
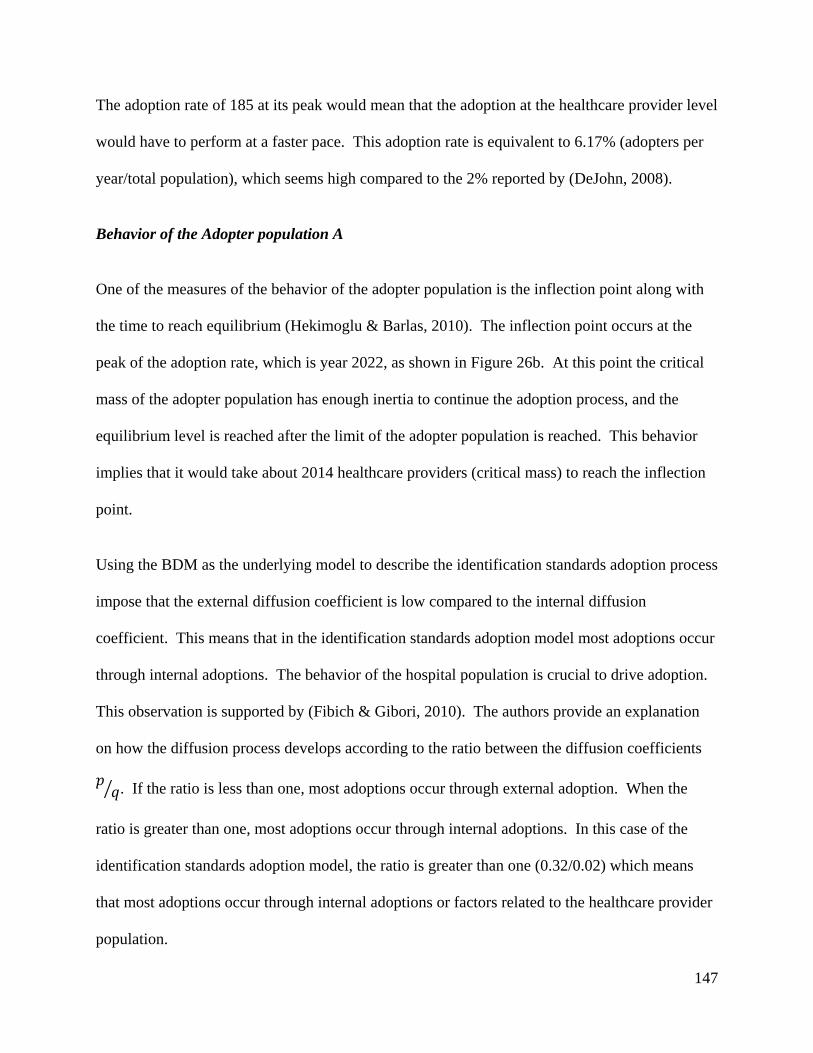
147
The adoption rate of 185 at its peak would mean that the adoption at the healthcare provider level
would have to perform at a faster pace. This adoption rate is equivalent to 6.17% (adopters per
year/total population), which seems high compared to the 2% reported by (DeJohn, 2008).
Behavior of the Adopter population A
One of the measures of the behavior of the adopter population is the inflection point along with
the time to reach equilibrium (Hekimoglu & Barlas, 2010). The inflection point occurs at the
peak of the adoption rate, which is year 2022, as shown in Figure 26b. At this point the critical
mass of the adopter population has enough inertia to continue the adoption process, and the
equilibrium level is reached after the limit of the adopter population is reached. This behavior
implies that it would take about 2014 healthcare providers (critical mass) to reach the inflection
point.
Using the BDM as the underlying model to describe the identification standards adoption process
impose that the external diffusion coefficient is low compared to the internal diffusion
coefficient. This means that in the identification standards adoption model most adoptions occur
through internal adoptions. The behavior of the hospital population is crucial to drive adoption.
This observation is supported by (Fibich & Gibori, 2010). The authors provide an explanation
on how the diffusion process develops according to the ratio between the diffusion coefficients
. If the ratio is less than one, most adoptions occur through external adoption. When the
ratio is greater than one, most adoptions occur through internal adoptions. In this case of the
identification standards adoption model, the ratio is greater than one (0.32/0.02) which means
that most adoptions occur through internal adoptions or factors related to the healthcare provider
population.

148
Under the given baseline, the projected timeline for identification standards adoption is 29 years
with a peak at year 14. This information can provide an assessment for the proposed industry
deadline of December 2012 for product identifiers. By comparing the timeline given by the
model, it can be inferred that the deadline is not going to be met.
Even though no data on past adoptions was found, the literature review provides an indication of
the current situation regarding identification standards adoption. According to (DeJohn, 2008)
the penetration of identification standards in 2008 was about 2%. A report by (O'Daffer, Shaffer,
& Lefebure, 2011) provided an estimate of 625 members joining the identification standards
initiative in 2011 but it did not provide an estimate by supply chain member category. The
survey by (Pohl & Nachtmann, 2011) shows an increasing participation of all healthcare supply
chain members in the identification standards initiative in particular for location identifiers. The
use of such identifiers among healthcare providers grew from 10% in 2010 to 22% in 2011. The
use of product identifiers was reported as 5% in 2011 mainly by large healthcare providers. The
GS1 readiness reports posted in the GS1 website (GS1, 2012) provide an estimate of the number
of healthcare providers committed to the identification standards initiative which in 2011 was
745 healthcare providers able to transact using a location identifier in a purchase order via EDI.
The analysis of the previous facts indicates that there is a trend in the evolution of identification
standards reported use. The current trend can be compared to the baserun output (See Appendix
E). The current trend results are similar compared to the trend indicated by the baserun which
gives an estimated timeline of 14 years. These findings provide an indication about the adoption
pattern for identification standards and highlight the importance of understanding the factors that

149
could drive the change and accelerate the process. The sensitivity analysis developed on the next
section provides an indication of those factors.
5.3 Model analysis
Sensitivity analysis is important to establish the parameters to which the model output is
sensitive; this could lead to improvements in the model formulation, increased data collection
efforts and definition of policies to change the model behavior pattern (Ford & Flynn, 2005).
This section presents a review on the different methods used for sensitivity analysis of system
dynamic models and explains the proposed approach for the sensitivity analysis of the
identification standards adoption model (Stage 2).
5.3.1 Sensitivity analysis and SD models
A preliminary step in developing policies is the identification of high leverage parameters and
structures which determine the influential model components that could drive the system
behavior. There are different methods for sensitivity analysis of system dynamic models, among
the most important ones (Hekimoglu & Barlas, 2010) are:
- One at a time approach
- Multivariate approach
o Statistical screening
o Behavior pattern analysis
o Taguchi methods (Design of experiments)

150
One at a time approach
The variation of one parameter at a time is the most commonly used sensitivity analysis method
(Erdil & Emerson, 2009), (Nelson, 1998). It is performed by selecting a critical set of
parameters and identifying an output measure. Then by varying each parameter, one at a time,
the changes on the output measure are observed. Critical issues are identified, but the analysis is
limited because just one parameter is allowed to vary and the other parameters remain fixed.
Statistical screening
Statistical screening (Ford & Flynn, 2005) allows for the identification of high leverage model
parameters for further analysis and policy development. Statistical screening is developed in six
steps as described below:
1. Select a specific set of model parameters and a performance measure (output variable).
Define the range, the percentage of variation and the distribution function for the model
parameters.
2. Perform statistical screening of the model to calculate the correlation coefficients. Plot
the correlation coefficients and the behavior of the performance measure for all
simulations in another graph.
3. Select a time period for analysis by examining the time series of the correlation
coefficients and the performance measure behavior.
4. Identify high influence parameter(s) during the selected period as those with the highest
magnitude of correlation coefficient values.

151
5. Identify high level model structures (components) as those that are directly driven by the
high influence parameter(s) identified in the previous step.
6. Use additional structure-behavior analysis methods to explain how the high leverage
model structures identified in step 5 which drive behavior.
High leverage parameters identified by the use of statistical screening can be used to design
policies. However, a better use of statistical screening is to exploit the results to identify the link
between the identified parameters and specific model structures that can be further analyzed,
decomposed or expanded in order to improve the model validity. That information can also be
used to improve the understanding of how the model structure drives behavior and how potential
extensions improve model validity and policy testing (Ford & Flynn, 2005).
Behavior pattern sensitivity
Behavior pattern sensibility is focused on examining the effect that changing the value of defined
model inputs could have in the output patterns of the model (Hekimoglu & Barlas, 2010).
As with most of the sensitivity analysis methods, the selection of the model parameters to be
analyzed and the distribution function for each one must be defined. Then a sampling strategy
must be selected (e.g random sampling or Latin Hypercube Sampling) in order to run the model
and collect the data related to the output pattern. A multiple regression model can be used to
estimate the regression coefficients and to establish the relationships between the selected
parameters and the output measure. One of the limitations of this approach relies on the
assumption of the linear relationship between the output measure and the regression coefficients.

152
Taguchi methods
According to (Clemson, Tang, Pyne, & Unal, 1995) Taguchi methods provide a more systematic
way to conduct experimentation for sensitivity analysis purposes, but it would require the
estimation of a single measure as the output of the simulation model. The authors compare
Taguchi methods and Latin Hypercube Sampling (LHS). For a full factorial approach a ten
parameter model with 3 levels would require 310 trials (59,047). The LHS scheme ensures that
all regions for the sample space are represented. LHS combines many of the advantages of
simple random sampling and full factorial designs but requires far fewer trials. As an alternative,
Taguchi methods of experimental design could provide a more efficient way to conduct the
experiment. In this case, the ten parameter model with three levels can be studied with 27 trials
using a Taguchi L27 orthogonal array.
5.3.2 Model analysis – evaluation of different approaches
After the review of different methods, it was observed that for most models the sensitivity
analysis was performed by varying parameters one at a time. The one at a time approach would
not be useful for the model developed in this chapter because it was assumed that there are
different parameters interacting.
Taguchi and regression models used in behavior pattern sensitivity analysis methods would
require the estimation of a single output measure as a result of each simulation run. In the case
of the present model, the estimation of a quantitative value related to the total output of the
simulation is not feasible (or would not prove useful), since the goal of the model is not to
estimate a total output but to describe an adoption pattern.

153
For the sensitivity analysis of the present model, a combination of statistical screening (Ford &
Flynn, 2005) and behavior pattern sensitivity (Hekimoglu & Barlas, 2010) is proposed. The
statistical screening facilitates the analysis of the behavior over time of an output variable due to
changes in a given set of parameters. The analysis is performed via the estimation of the
correlation coefficient between a given parameter and the output variable at each step of the
simulation (Ford & Flynn, 2005). The Correlation Coefficient (CC) ranges from -1 to +1 and
illustrates the strength of the relationship between two variables without accounting for other
variables that could be influential. The formula of the correlation coefficient is:
∑
∑ ∑
(20)
For example, if a model is run for a period of 10 years and there are 3 parameters and 1 output
variable, the correlation coefficient for each parameter with the output variable would need to be
estimated for each one of the time periods.
The steps proposed by the statistical screening method (Ford & Flynn, 2005) are followed and
complemented by the definition of the model output measures as behavior patterns. As
explained by (Hekimoglu & Barlas, 2010), the behavior patterns of model variables are more
important than their numerical values. In the specific case of this research, the identification
standards simulation model exhibits an S-shaped growth for the adopter population; in this case
the exact value of the variable at a specific time is not as important as it is the inflection point,
the equilibrium level or the time to equilibrium. This is the reason why the behavior pattern of
the adopter population is considered as one of the main output measures of the model for
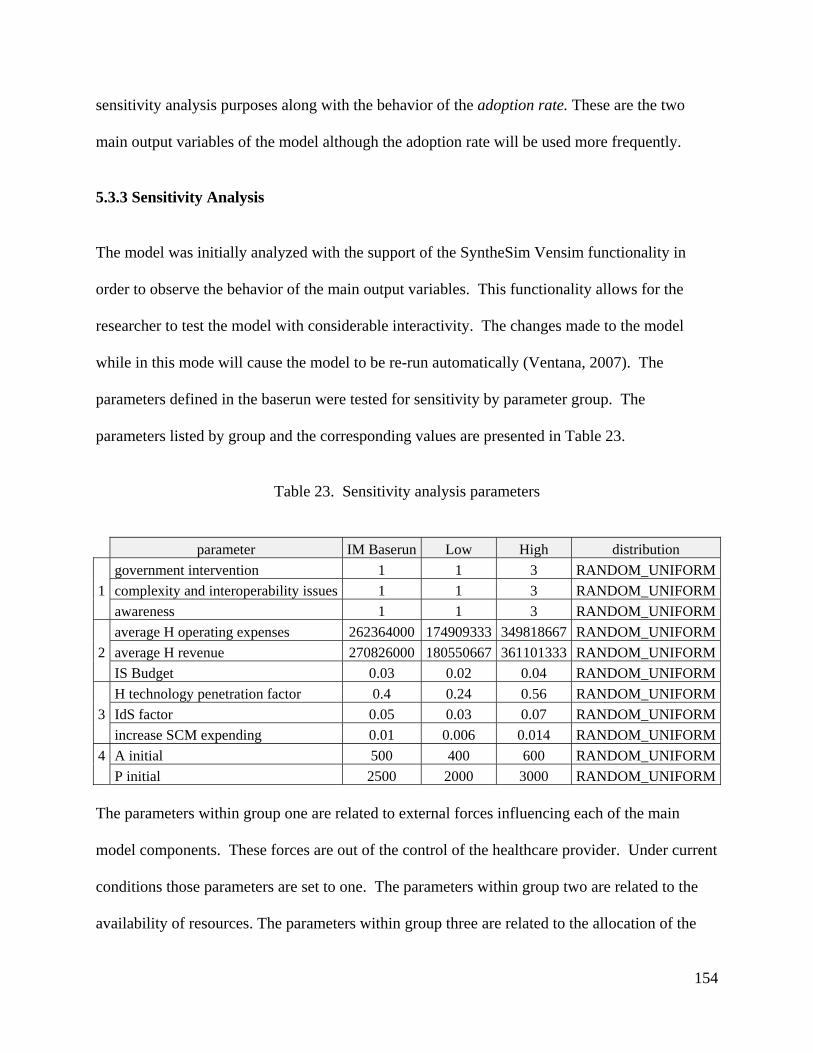
154
sensitivity analysis purposes along with the behavior of the adoption rate. These are the two
main output variables of the model although the adoption rate will be used more frequently.
5.3.3 Sensitivity Analysis
The model was initially analyzed with the support of the SyntheSim Vensim functionality in
order to observe the behavior of the main output variables. This functionality allows for the
researcher to test the model with considerable interactivity. The changes made to the model
while in this mode will cause the model to be re-run automatically (Ventana, 2007). The
parameters defined in the baserun were tested for sensitivity by parameter group. The
parameters listed by group and the corresponding values are presented in Table 23.
Table 23. Sensitivity analysis parameters
parameter IM Baserun Low High distribution
government intervention 1 1 3 RANDOM_UNIFORM
1 complexity and interoperability issues 1 1 3 RANDOM_UNIFORM
awareness 1 1 3 RANDOM_UNIFORM
average H operating expenses 262364000 174909333 349818667 RANDOM_UNIFORM
2 average H revenue 270826000 180550667 361101333 RANDOM_UNIFORM
IS Budget 0.03 0.02 0.04 RANDOM_UNIFORM
H technology penetration factor 0.4 0.24 0.56 RANDOM_UNIFORM
3 IdS factor 0.05 0.03 0.07 RANDOM_UNIFORM
increase SCM expending 0.01 0.006 0.014 RANDOM_UNIFORM
4 A initial 500 400 600 RANDOM_UNIFORM
P initial 2500 2000 3000 RANDOM_UNIFORM
The parameters within group one are related to external forces influencing each of the main
model components. These forces are out of the control of the healthcare provider. Under current
conditions those parameters are set to one. The parameters within group two are related to the
availability of resources. The parameters within group three are related to the allocation of the

155
resources and technology infrastructure. The parameters within group four are related to the
population size.
A period of 30 years was defined as the horizon to run the model sensitivity analysis tests. For
each parameter group a sensitivity analysis test was performed leaving the parameters within the
other groups unchanged. Four tests were performed:
Test 1, sensitivity analysis test for parameters within group 1, remaining parameters were
kept unchanged.
Test 2, sensitivity analysis test for parameters within group 2, remaining parameters were
kept unchanged.
Test 3, sensitivity analysis test for parameters within group 3, remaining parameters were
kept unchanged.
Test 4, sensitivity analysis test for parameters within group 4, remaining parameters were
kept unchanged.
The following steps were followed to perform each sensitivity analysis test:
1. Define the range, variation and distribution function for the parameters under analysis.
2. Load parameters into the Vensim PLE Plus sensitivity analysis module.
3. Select the sampling strategy (LHS) and the number of runs (50 runs).
4. Run sensitivity analysis for each output measure (behavior patterns) and save the data.
5. Export data to MSO Excel and develop correlation coefficient (CC) plots according to the
template provided by (Ford & Flynn, 2005).

156
6. Analyze. The period of analysis for the adoption rate pattern was defined as the period
before the adoption rate peak. This period was used because the goal is to establish the
main parameters influencing the adoption rate and the identification of main model
components of greater leverage in order to speed up the adoption process. For the
sensitivity analysis of the adopter population, the complete span of the simulation was
considered.
The Vensim sensitivity analysis reporting functionality offers the option of displaying sensitivity
analysis graphs as the ones shown in Figure 27. For example Figure 27 shows the sensibility
analysis graph for the adoption rate which includes the results of the simulation runs in the form
of confidence bounds; the 50% region includes all the runs that felt within that range. This
illustration provides an indication of the variation of the output variable regarding the parameters
associated with a given sensitivity analysis test.
Figure 27. Sensitivity analysis results (Vensim graph)
157
After exporting the Vensim sensitivity analysis results to MSO Excel, the main parameters were
identified by analyzing the threshold range (Ford & Flynn, 2005) for the Correlation Coefficient
(CC) plots which is (+0.2, -0.2). The parameters that fall outside of the threshold range are
considered to have an impact in the output measure under analysis.
After analyzing the results of the sensitivity analysis (CC plots) for the adoption rate behavior
pattern and the adopter population pattern, it was found that the relevant parameters within each
test are the same for both output measures. This can be explained by reviewing the discrete
version of the BDM (See Equation 5) in which the adoption rate is formulated as a function of
the cumulative number of adopters.
Within test 1, the result of the analysis of the CC plots shows that complexity and
interoperability issues is a relevant parameter. Within test 2, the analysis of the CC plots shows
that the IS Budget and the Average H revenue are relevant parameters. Within test 3, the analysis
of the CC plots shows that the IdS factor is a relevant parameter. Within test 4, the analysis of
the CC plots confirmed what is already known about the impact of this type of parameters. The
analysis showed that the P initial parameter has an increasing correlation and the A initial
parameter has a decreasing correlation; these results were expected as they confirmed what is
already known about the impact of these type of parameters (Ford & Flynn, 2005). For the main
component (C4), changes related to the parameters can have an impact on the adoption rate
however those changes are not considered for sensitivity analysis purposes since only one
population size is considered in the simulation model.
After reviewing the results of the tests, a fifth test (test 5) that includes the combination of the
parameters within groups 1, 2 and 3 is proposed. The analysis of the results of test 5 indicated

158
that the following factors have a correlation with the adoption rate: IdS factor, average H
operating expenses, complexity and interoperability issues and awareness. For group one
parameters such as the awareness and the complexity and interoperability issues at the healthcare
provider and the technology provider level respectively, can play a role in facilitating
identification standards adoption. For parameters within groups 2 and 3, these results indicate
that the availability and allocation of resources at the healthcare provider level considering that
the average H operating expenses and the IdS factor may have an impact on the adoption
process. The results for the sensitivity analysis are summarized in Table 24.
Table 24. Sensitivity analysis results
group Relevant parameters test 5 1 government intervention complexity and interoperability issues awareness 2 average H operating expenses average H revenue IS Budget 3 H technology penetration factor IdS factor increase SCM expending
As the underlying BDM formulation suggests, the internal adoption influence is stronger than
external influence. An analysis of the relevant parameters by component shows that for
Component 1 (C1) the parameter government intervention did not appear on any of the aspects
of the analysis as a relevant parameter, so the contribution of Component 1 (C1) is low. For
Component 2 (C2) the parameter complexity and interoperability issues appear as a relevant
parameter, which indicates that actions directed to solve those types of issues could have an
impact in the adoption rate. For Component 3 (C3), there are three parameters that can play a
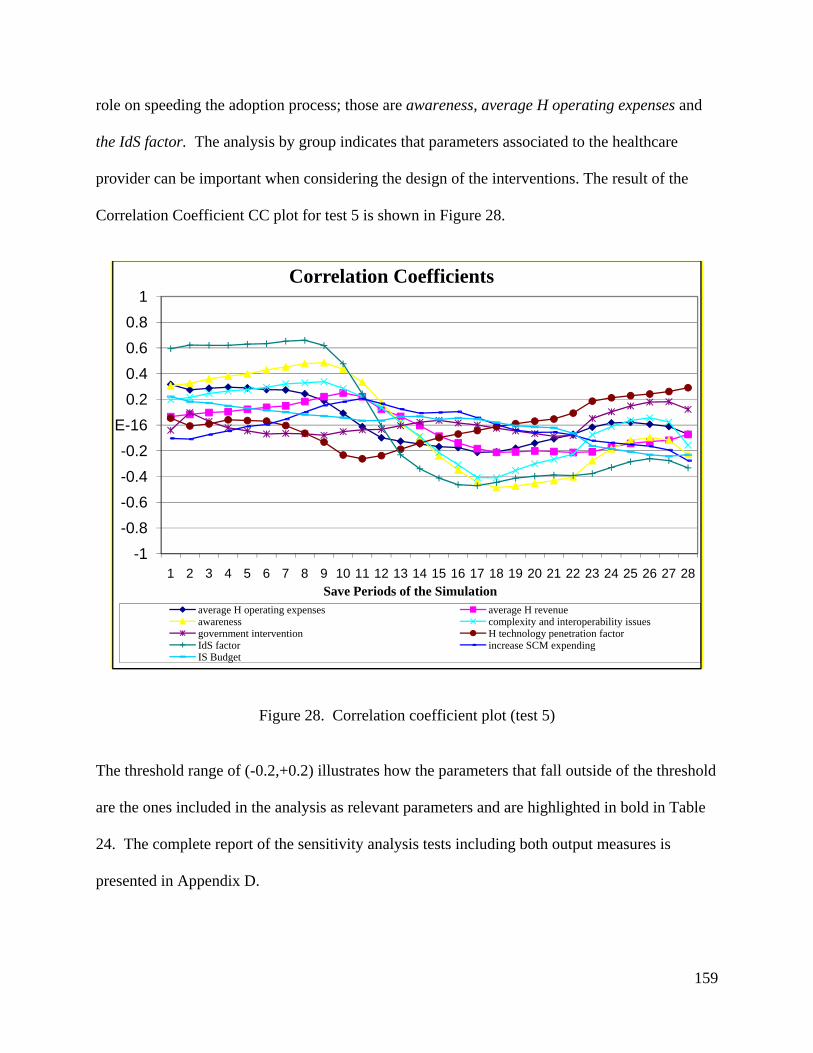
159
role on speeding the adoption process; those are awareness, average H operating expenses and
the IdS factor. The analysis by group indicates that parameters associated to the healthcare
provider can be important when considering the design of the interventions. The result of the
Correlation Coefficient CC plot for test 5 is shown in Figure 28.
Figure 28. Correlation coefficient plot (test 5)
The threshold range of (-0.2,+0.2) illustrates how the parameters that fall outside of the threshold
are the ones included in the analysis as relevant parameters and are highlighted in bold in Table
24. The complete report of the sensitivity analysis tests including both output measures is
presented in Appendix D.
-1
-0.8
-0.6
-0.4
-0.2
E-16
0.2
0.4
0.6
0.8
1
1 2 3 4 5 6 7 8 9 10 11 12 13 14 15 16 17 18 19 20 21 22 23 24 25 26 27 28Save Periods of the Simulation
Correlation Coefficients
average H operating expenses average H revenueawareness complexity and interoperability issuesgovernment intervention H technology penetration factorIdS factor increase SCM expendingIS Budget

160
The results of the sensitivity analysis provide an indication of the relevant model parameters. It
also provides information related to the model behavior and how the model can be improved.
The improvements can lead to the evaluation of data collection efforts and the definition of
policies to change the model behavior pattern. Based on this information, an interpretation of
those results in the context of real world can be developed but the interpretation will be limited
by the assumptions and scope of the model. The model does not attempt to make a prediction of
what is going to happen in the future but to provide a test bed for interventions testing.
5.4 Model interventions (design and implementation)
This section presents the answer to the following research question:
What actions are required to increase the number of healthcare supply chain members and
healthcare providers adopting identification standards?
The answer to this research question is presented under the scope of the model defined and
analyzed in this chapter. The model includes the hospital population, but other members besides
the technology providers were not explicitly considered due to the limitations on data
availability. A literature review regarding policy design interventions development for system
dynamics models in the form of policy design or scenario testing is presented, and then the
proposed interventions for the present model are developed.
5.4.1 Review
For system dynamics models, the interventions or changes in the system are usually introduced
in the form of policies or scenarios.

161
Policy design
The adoption of Electronic Health Records (EHR) modeled by (Erdil & Emerson, 2009), using a
system dynamics model, presented 4 policies. These policies were related to the cost, which was
identified as one of the main factors affecting the EHR adoption. The policies included the
addition of subsections to the original model in order to reflect the policy intervention in the
form of subsidies, free grant products, a tax break and paying for performance. The model
developed by (Otto & Simon, 2009) on EHR adoption, illustrated how policies can be defined as
a set of changes on parameter values. The policies were defined as a 20% variation on the
selected parameters (financial incentives, awareness and education) to show the impact in the
adopter population.
Scenario testing
The adoption of technologies in agricultural business was studied by (Fisher, Norvell, Sonka, &
Nelson, 2000), and the scenarios tested different combinations of profit levels to observe the
impact on the speed of diffusion. The adoption of food safety technologies was studied by
(Daim, Rueda, Martin, & Gerdsri, 2006), and the scenarios were used to establish the most likely
set of parameters that could explain the adoption process within a reasonable timeframe. The
scenarios developed by (Cui, Zhao, & Ravichandran, 2011) for the new product launch allowed
researchers to test a combination of launch strategies and market size in order to evaluate the
speed of diffusion of a new product.

162
5.4.2 Interventions within the present research model
Intervention design
For the present model the interventions are defined as a set of policies and scenarios. The
interventions are designed based on the following sources: the sensibility analysis results from
the previous section and a set of future events.
The results from the sensitivity analysis emphasize the importance of the organization related
Component (C3) and suggest that the external Component (C1) is not so relevant. The fact that
the Component 1 (C1) is not relevant can be understood under the BDM model structure
assumption since the external diffusion coefficient is small and it drives that portion of the
adoption process which has a small impact in the adoption rate. As for Component 2 (C2), the
complexity and interoperability issues parameter was found as a relevant one. As for
Component 3 (C3), the IdS Factor and the average H operating expenses were relevant
parameters which are associated with the resource allocation and availability. Also for this
component the awareness was found as a relevant parameter which is directly linked to the
organizational readiness factor. Policies and scenarios that include these model parameters
could have an impact in the main output measure (Hospital adoption rate).
There are a set of future events that could have an impact in the current model. The design of the
interventions considered the following: the impact of the FDA UDI regulation, the impact of the
enforcement of the minimum use requirements for hospital EHR implementation and the impact
of the increased participation of the technology providers in the identification standards adoption

163
process. These events were identified through the extensive literature review developed in
Chapters 2 and 3.
Intervention evaluation
The model allows for the testing responsiveness of the main variable such as the hospital
adoption rate to the proposed interventions. The impact of the intervention (policy or scenario)
is measured as the shift of the adoption rate curve relative to the baseline (adoption rate peak),
the adoption rate (adopters per year at the peak) increase, and the critical mass change.
5.4.3 Interventions by component (design and implementation)
Based on the sensitivity analysis results and the events related to a given model component a set
of policies for each component is proposed.
Component 1
As revealed by the sensitivity analysis of the parameters within group 1 and the combined
analysis (test 5), none of the parameters within Component 1 (C1) were relevant. The different
factors defined within the external environment could have an impact in the adoption rate. The
values that those parameters represent are the current status of the system if no other change is
introduced.
Assuming that the UDI regulation could take place at the end of 2012, the model would consider
that the regulation has an effect at the manufacturer level. The model takes into consideration
the members of a given population; it does not consider the granular effect of products flowing
through the system. Under the current model the number of manufacturers joining the initiative
164
is considered. The model assumed a parallel development from the manufacturer side on the
deployment of barcode labels for all product classes.
The configuration of the model by product would require distinguishing among the three product
classes. Such a model could provide an estimation of the evolution of the number of product
identifiers over time but not of the use of product identifiers within the processes and
transactions at the healthcare provider level, as the current model does. The immediate pressure
for UDI adoption would be for manufacturers of products Class III. Products Class III are the
ones that could represent a potential risk to the patient, while products Class I represent no harm
(Hefflin, 2005). It is estimated by the industry that it would take about two years for
manufacturers of products Class III to fully comply with the regulation. It could take five years
or more for manufacturers of products Class I to fully comply with the FDA regulation. Even if
the product came with barcodes from the manufacturer to the hospital, the technology, processes
and procedures required to make use of those identifiers would have to be in place. This means
that, even if the UDI rule effect is immediate, and product identifiers are available tomorrow on
all products in the form of the GTIN minimum level of AIDC marking (GS1 Healthcare US,
2010), which does not consider secondary information, it will take hospitals as long as it took
them to adopt the underlying technological infrastructure, to use identification standards within
the described processes under the identification standards definition.
As shown in Figure 25, Component 1 (C1) is linked to the adoption rate via the external
diffusion coefficient. For policy 1a, a change in this structure is proposed in the form of a single
coefficient. Policy 1a was defined as a change in the model structure to illustrate the impact of
the consolidation of the internal and external diffusion coefficients into a single one. The impact

165
of this change is significant given the fact that the adoption rate peak gets delayed to year 20
when the Component 1 (C1) effect is considered jointly.
Policy 1b is defined as a change in the manufacturers function (gf), representing one third of the
population members adopting by year 15 and a STEP function for the government intervention
parameter with a height of 5 and a step of 2. The details of policy development are shown in
Appendix E. This policy shifts the adoption rate peak from year 14 to year 11. The result of the
implementation of both policies is shown in Figure 29.
Figure 29. Policies Component 1 (C1)
In the context of the real world the implementation of Policy 1b indicates that increasing the
number of manufacturers joining the initiative as well as introducing an intervention by the
government could help to shift the adoption rate curve to the left. This policy can be associated
to the effect of the UDI FDA rule over manufacturers.

166
Component 2
The technology provider plays a role in identification standards adoption by facilitating the
upgrades required for the supporting technology currently in place at the healthcare provider
level. The complexity and interoperability issues parameter appears as a relevant one in the
sensitivity analysis; this means that changes in this factor could have an impact on the adoption
rate. The policies related to the technology provider can be aimed to increase the technology
provider readiness (TP readiness) in order to solve complexity and interoperability issues
associated to identification standards adoption. The results of the policy implementation are
shown in Figure 30.
Figure 30. Policy Component 2 (C2)
Policy 2 was defined as a change in the technology provider readiness to illustrate the impact that
the number of technology providers joining the initiative could have on the adoption process. It
167
was assumed that one third of the technology providers were joining the initiative by year 10.
The details of policy development are shown in Appendix E. It can be observed that the
adoption rate peak shifted from year 14 to year 10 and the number of healthcare providers per
year (at the peak) also increased from 184 to 234.
In the context of the real world the implementation of Policy 2 represents a shift of the adoption
rate curve to the left due to the increased involvement of the technology providers in the
identification standards initiative.
Component 3
According to the results from the sensitivity analysis, awareness is a relevant parameter in the
model, as well as IdS Factor and average H operating expenses, which means that changes in
those parameters could have an impact in the adoption rate. An increase in the awareness would
represent an increase in the healthcare provider readiness. An increase in the IdS Factor would
represent the fact that more resources are allocated to the identification standards initiative.
Changes in resource availability are not included in this policy since the average H operating
expenses factor which is linked to the resource availability, thus the size, is associated in the
present model to one population size (H>2).
Although the H technology penetration factor did not show a significant impact, it can play a
role in identification standards adoption. The model takes into consideration only the supporting
infrastructure from the supply chain perspective but other technological components have to be
integrated, especially as the product flows through different units within the hospital and are
used at the point of care. Additionally, the presence of EHR minimum use requirements in the

168
form of financial incentives could represent a way to drive the adoption. An increase in the H
technology penetration factor is proposed as a way to represent the required technological
integration to meet the EHR minimum use requirements and its associated incentives.
For Policy 3, it is assumed that in order to increase the healthcare provider readiness, the event of
an increase in the level of technological integration can be represented by a value of 0.8 for the H
technology penetration factor and an increase in the awareness can be represented by a value of
3 for this parameter. The IdS factor is set to 0.06 to represent an increase in the resource
allocation and the average H operating expenses was kept unchanged. The implementation of
this policy gives a shift of the adoption rate peak from year 14 to year 9.
Figure 31. Policy Component 3 (C3)
In the context of the real world the implementation of Policy 3 represents the effect of an
increase in the healthcare provider readiness due to an increase in the awareness which can be
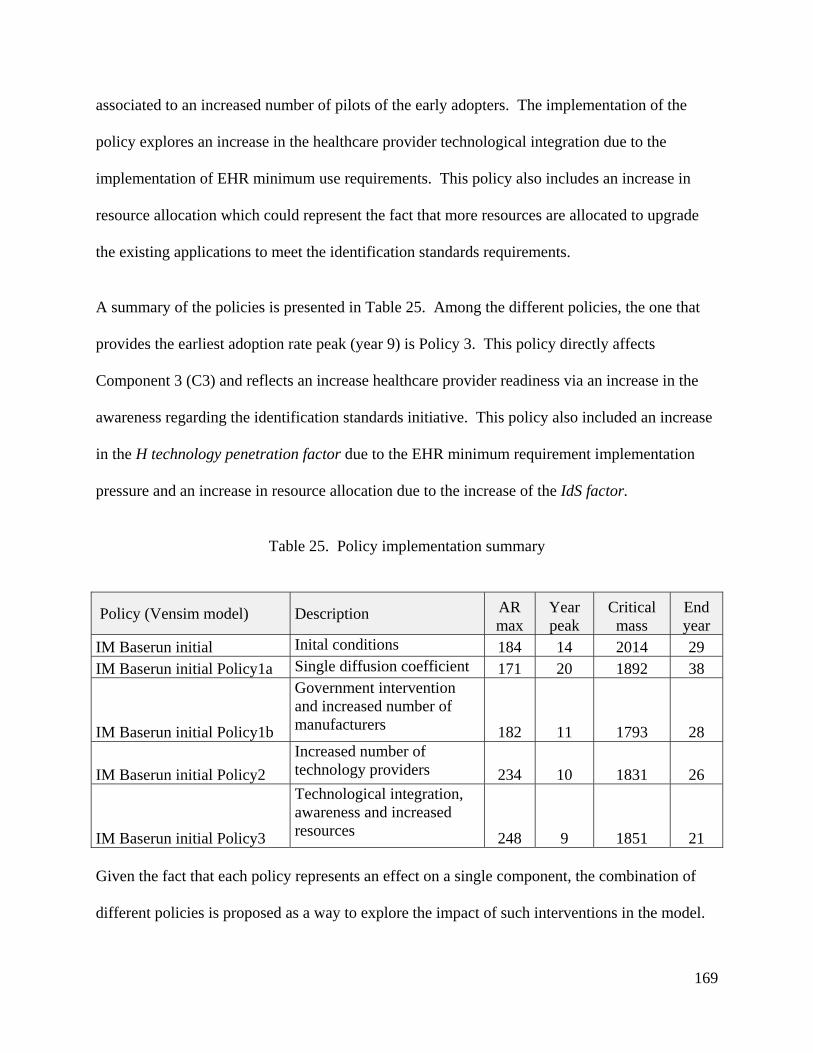
169
associated to an increased number of pilots of the early adopters. The implementation of the
policy explores an increase in the healthcare provider technological integration due to the
implementation of EHR minimum use requirements. This policy also includes an increase in
resource allocation which could represent the fact that more resources are allocated to upgrade
the existing applications to meet the identification standards requirements.
A summary of the policies is presented in Table 25. Among the different policies, the one that
provides the earliest adoption rate peak (year 9) is Policy 3. This policy directly affects
Component 3 (C3) and reflects an increase healthcare provider readiness via an increase in the
awareness regarding the identification standards initiative. This policy also included an increase
in the H technology penetration factor due to the EHR minimum requirement implementation
pressure and an increase in resource allocation due to the increase of the IdS factor.
Table 25. Policy implementation summary
Policy (Vensim model) Description AR max
Year peak
Critical mass
End year
IM Baserun initial Inital conditions 184 14 2014 29 IM Baserun initial Policy1a Single diffusion coefficient 171 20 1892 38
IM Baserun initial Policy1b
Government intervention and increased number of manufacturers 182 11 1793 28
IM Baserun initial Policy2
Increased number of technology providers 234 10 1831 26
IM Baserun initial Policy3
Technological integration, awareness and increased resources 248 9 1851 21
Given the fact that each policy represents an effect on a single component, the combination of
different policies is proposed as a way to explore the impact of such interventions in the model.
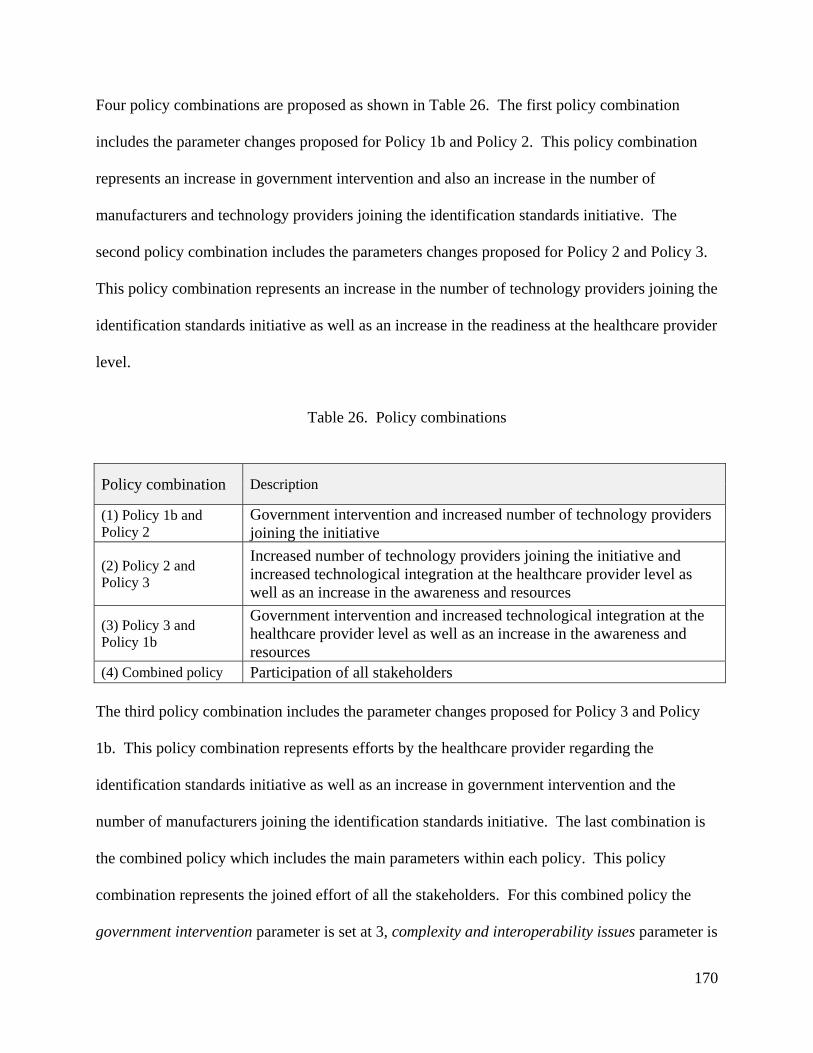
170
Four policy combinations are proposed as shown in Table 26. The first policy combination
includes the parameter changes proposed for Policy 1b and Policy 2. This policy combination
represents an increase in government intervention and also an increase in the number of
manufacturers and technology providers joining the identification standards initiative. The
second policy combination includes the parameters changes proposed for Policy 2 and Policy 3.
This policy combination represents an increase in the number of technology providers joining the
identification standards initiative as well as an increase in the readiness at the healthcare provider
level.
Table 26. Policy combinations
Policy combination Description
(1) Policy 1b and Policy 2
Government intervention and increased number of technology providers joining the initiative
(2) Policy 2 and Policy 3
Increased number of technology providers joining the initiative and increased technological integration at the healthcare provider level as well as an increase in the awareness and resources
(3) Policy 3 and Policy 1b
Government intervention and increased technological integration at the healthcare provider level as well as an increase in the awareness and resources
(4) Combined policy Participation of all stakeholders
The third policy combination includes the parameter changes proposed for Policy 3 and Policy
1b. This policy combination represents efforts by the healthcare provider regarding the
identification standards initiative as well as an increase in government intervention and the
number of manufacturers joining the identification standards initiative. The last combination is
the combined policy which includes the main parameters within each policy. This policy
combination represents the joined effort of all the stakeholders. For this combined policy the
government intervention parameter is set at 3, complexity and interoperability issues parameter is

171
set at 2, awareness parameter is set at 3, the hospital technology penetration factor is set at 0.6
and the IdS factor is set at 0.07. As proposed by (Glöber, Thun, & Milling, 2008) the values for
the different parameter changes can be supported by information gathered through literature
sources, sensitivity analysis testing and the researcher’s experience.
The result of the implementation policy combinations is shown in Table 27. The policy
combinations that provide the earliest adoption rate peak are policy combination (2) and (4). By
analyzing the information provided in Table 27, it can be observed that the interventions that are
associated with Policy 3 provide a better performance regarding the adoption rate peak as well as
the duration of the adoption process.
Table 27. Policy combinations results
Policy combinations (Vensim model) AR max
Year peak
Critical mass
End year
(1) IM Baserun initial Policy1b and 2 242 9 1871 24 (2) IM Baserun initial Policy2 and 3 353 7 2007 17 (3) IM Baserun initial Policy3 and 1b 263 8 1799 21 (4) IM Baserun initial combined policy 352 7 1819 16
The Vensim graph for the policy combinations is shown in Figure 32. The implementation of
policy combinations (2) and (4) generate an adoption rate peak at year 7.
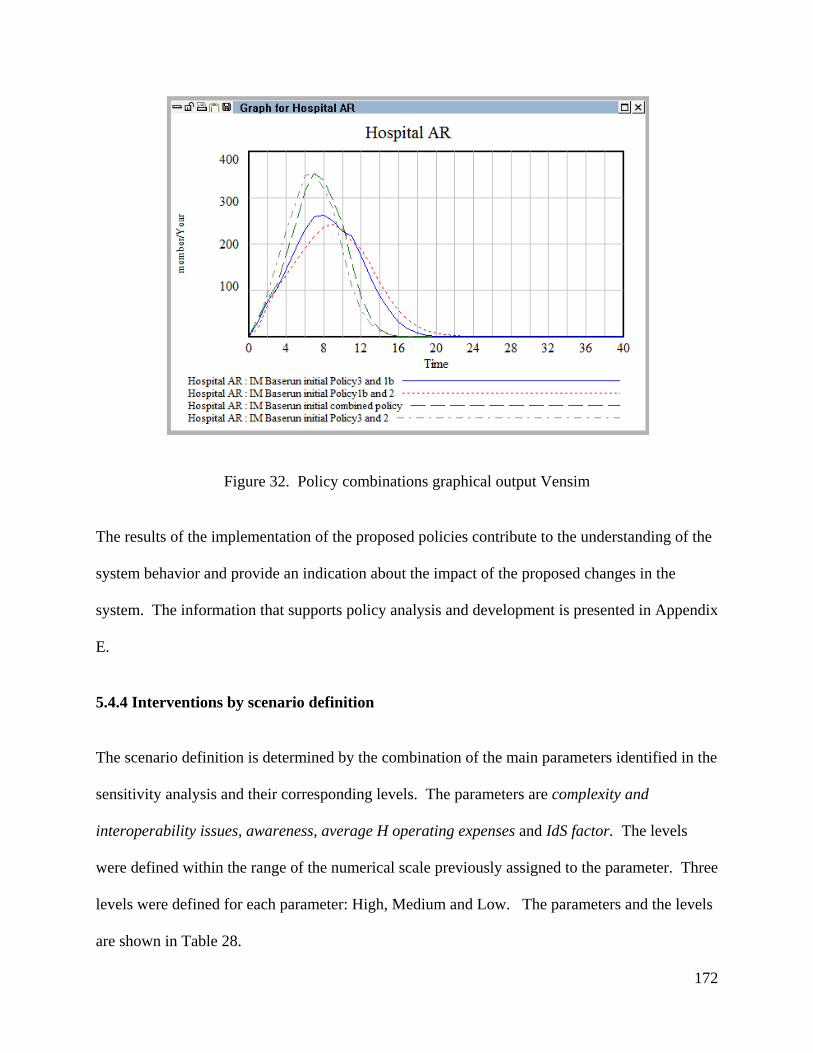
172
Figure 32. Policy combinations graphical output Vensim
The results of the implementation of the proposed policies contribute to the understanding of the
system behavior and provide an indication about the impact of the proposed changes in the
system. The information that supports policy analysis and development is presented in Appendix
E.
5.4.4 Interventions by scenario definition
The scenario definition is determined by the combination of the main parameters identified in the
sensitivity analysis and their corresponding levels. The parameters are complexity and
interoperability issues, awareness, average H operating expenses and IdS factor. The levels
were defined within the range of the numerical scale previously assigned to the parameter. Three
levels were defined for each parameter: High, Medium and Low. The parameters and the levels
are shown in Table 28.

173
Table 28. Parameters and levels for scenario analysis
Level Parameter label 1 2 3 complexity and interoperability issues A 1 2 3 awareness B 1 5 10 average H operating expenses C 174,909,333 262,364,000 349,818,666IdS factor D 0.03 0.05 0.07
In order to test the different combinations of model parameters, the basic structure of an
orthogonal array was defined (Clemson, Tang, Pyne, & Unal, 1995). In this case the orthogonal
array represents a matrix that ensures a balanced comparison of levels of any parameter (factor).
A L9 (34) experiment for 9 tests, 4 factors and 3 levels was used. There are nine scenarios
according to the L9 (34) experiment template as shown in Table 29.
The scenarios were tested in Vensim PLE Plus, and the output of the simulations were saved and
analyzed in MSO Excel. There were two experimental results that were not considered within
the analysis because the lack of stability of the results (Scenarios 8 and 9).
Table 29. Scenarios
Scenarios A B C D 1 1 1 174,909,333 0.03 2 1 5 262,364,000 0.05 3 1 10 349,818,667 0.07 4 2 1 262,364,000 0.07 5 2 5 349,818,667 0.03 6 2 10 174,909,333 0.05 7 3 1 349,818,667 0.05 8 3 5 174,909,333 0.07 9 3 10 262,364,000 0.03
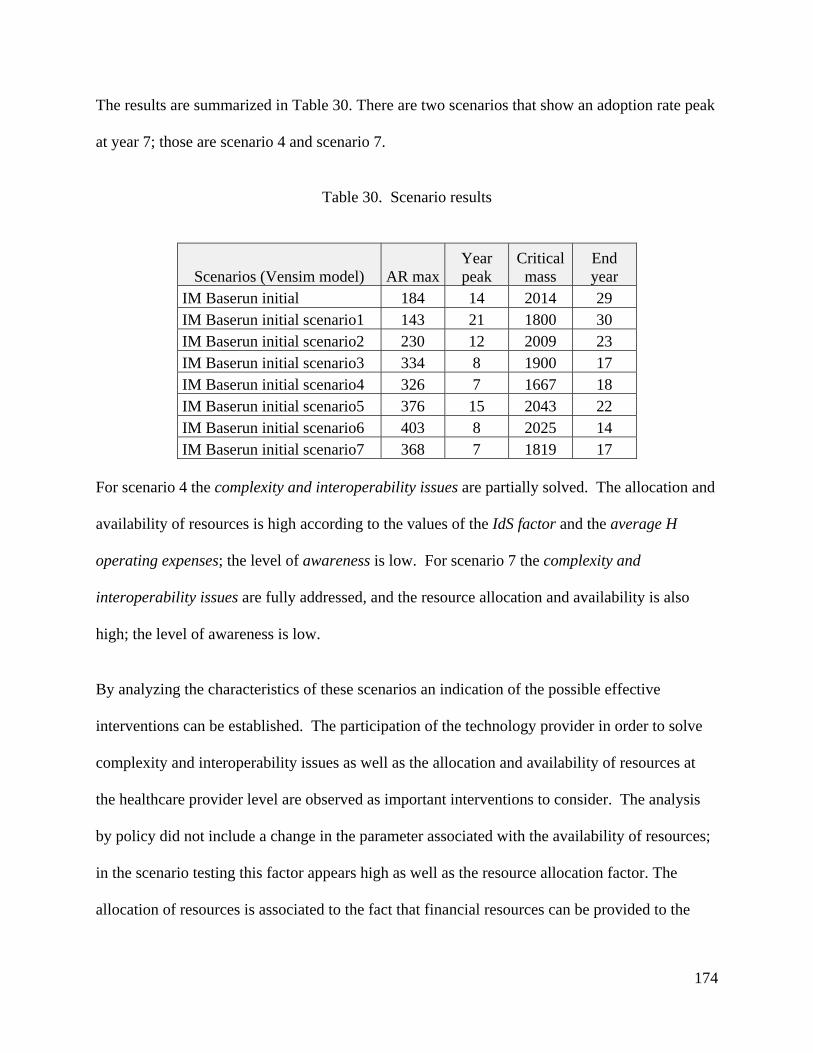
174
The results are summarized in Table 30. There are two scenarios that show an adoption rate peak
at year 7; those are scenario 4 and scenario 7.
Table 30. Scenario results
Scenarios (Vensim model) AR maxYear peak
Critical mass
End year
IM Baserun initial 184 14 2014 29 IM Baserun initial scenario1 143 21 1800 30 IM Baserun initial scenario2 230 12 2009 23 IM Baserun initial scenario3 334 8 1900 17 IM Baserun initial scenario4 326 7 1667 18 IM Baserun initial scenario5 376 15 2043 22 IM Baserun initial scenario6 403 8 2025 14 IM Baserun initial scenario7 368 7 1819 17
For scenario 4 the complexity and interoperability issues are partially solved. The allocation and
availability of resources is high according to the values of the IdS factor and the average H
operating expenses; the level of awareness is low. For scenario 7 the complexity and
interoperability issues are fully addressed, and the resource allocation and availability is also
high; the level of awareness is low.
By analyzing the characteristics of these scenarios an indication of the possible effective
interventions can be established. The participation of the technology provider in order to solve
complexity and interoperability issues as well as the allocation and availability of resources at
the healthcare provider level are observed as important interventions to consider. The analysis
by policy did not include a change in the parameter associated with the availability of resources;
in the scenario testing this factor appears high as well as the resource allocation factor. The
allocation of resources is associated to the fact that financial resources can be provided to the
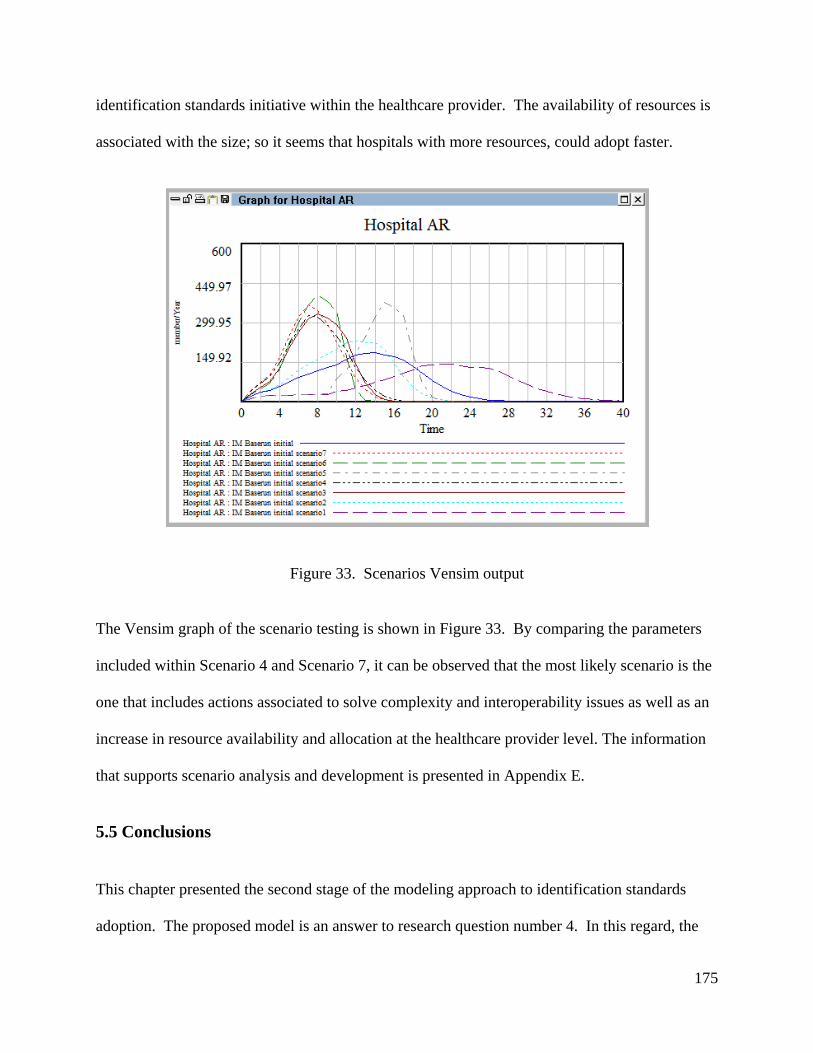
175
identification standards initiative within the healthcare provider. The availability of resources is
associated with the size; so it seems that hospitals with more resources, could adopt faster.
Figure 33. Scenarios Vensim output
The Vensim graph of the scenario testing is shown in Figure 33. By comparing the parameters
included within Scenario 4 and Scenario 7, it can be observed that the most likely scenario is the
one that includes actions associated to solve complexity and interoperability issues as well as an
increase in resource availability and allocation at the healthcare provider level. The information
that supports scenario analysis and development is presented in Appendix E.
5.5 Conclusions
This chapter presented the second stage of the modeling approach to identification standards
adoption. The proposed model is an answer to research question number 4. In this regard, the

176
challenges posed by the use of classical diffusion models which were discussed in the previous
chapter were addressed. The proposed model developed in this chapter is an answer to those
challenges. The model uses the information configured in the model parameters and graphical
functions to show the current status of the system and to project the adoption pattern of
identification standards diffusion over time. Under the initial conditions it would take 14 years
for identification standards adoption to reach its peak and 29 years to complete the adoption
process. The model results are limited to the available information and model assumptions but it
provides a way to assess current industry deadlines for identification standards adoption and
provides an answer to the problem described in Chapter 1. As explained in Section 4.5.3 the
goal of the model is not to forecast but to provide an explanation of the current situation and to
understand the system behavior.
Within this modeling stage, the answer to research question number 5 is developed. The answer
to this question is incorporated within the formulation of the main elements of Component 3
(C3) (See section 5.1.2). It is assumed that the adoption of identification is beneficial for the
healthcare provider and the productivity improvements will represent a gain for the healthcare
provider. Since ROI data was not available the justification of identification standards benefits
or the estimation of the ROI is out of the scope of this research
The sensitivity analysis of the model allowed for the identification of the factors affecting the
identification standards adoption process; it also facilitated the understanding of the system
behavior and allowed for the design and test of interventions to move the system forward.
Among the relevant parameters are the ones associated with Component 3. Since the baserun

177
results indicate that the industry deadline of December 2012 is not going to be met, the
sensitivity analysis results provide information to guide interventions design.
Finally, the model analysis presented in this chapter contributes to answer the research question
number 6. The question is related to the required interventions to increase the number of
healthcare providers adopting identification standards. The proposed interventions were
designed in accordance to the results from the sensitivity analysis and the most likely future
events. Two types of interventions were considered: policies and scenarios.
Among the different policies, when analyzed independently the ones that act directly over
Component 3 (C3) are the most effective, producing an adoption rate peak at year 9. The
implementation of policy combinations (2) and (4) produce an adoption rate peak at year 7 as
well as implementation of Scenarios 4 and 7.
Given the results of the implementation of the proposed interventions, the adoption (adoption
rate peak) of identification standards can be shifted to year 7 if the conditions proposed by the
policy combinations (2) or (4) or the Scenarios 4 or 7 are assumed.
The policy combinations associated to the earliest adoption rate peak are characterized by efforts
at the healthcare provider level. Policy combination (2) included a joined effort from technology
providers as well as healthcare providers; similarly policy combination (4) included a joined
effort of all stakeholders.
The scenarios associated to the earliest adoption rate peak (Scenarios 4 and 7), are characterized
by a low level of awareness and high level of resource allocation and availability at the

178
healthcare provider level. The participation of the technology providers in order to solve
complexity and interoperability issues is also a characteristic of these scenarios.
This model provides an illustration of the use of system dynamics models and diffusion theory to
understand a problem reported in the literature and not yet solved. This model is an
approximation of the real world system that allows the identification of the main factors affecting
the system and facilitates the design and testing of policies to explore the change in the system
behavior. This approximation is proposed as a way to understand the problem and shed light to
real world practitioners and also to the academic community on issues like the lack of data and
other challenging aspects of empirical research which can be addressed with the proposed model
and methodology.
179
6. Conclusions
6.1 Contributions
The contributions from this research are related to each one of the expected contributions
presented in Chapter 1.
The contributions from Phase I are associated with the classification of the major barriers
affecting the identification standards adoption process. The literature review related to
technology adoption and diffusion within the healthcare domain was developed, and the adoption
of Electronic Health Records (EHR) was identified as one of the main adoption processes within
that category. The literature review related to the technology adoption and diffusion outside the
healthcare domain was developed, and the adoption of Electronic Data Interchange (EDI) was
identified as one of the main adoption processes within that category. The results of the
literature review on identification standards literature illustrated the lack of academic literature
related to identification standards adoption and supported the need for a conceptual model to
explain it.
The researcher developed a conceptual model that is an original contribution to the literature.
The classification of the factors identified through the extensive literature review provided the
basis for the development of the conceptual model for identification standards adoption. The
conceptual model illustrates the factors affecting the adoption of identification standards from
the healthcare provider perspective (Burbano, Rardin, & Pohl, Exploring the Factors Affecting
the Identification Standards Adoption Process, 2011). Those are categorized as environment,
technology and organization related factors.

180
The technology related factors are relative advantage, complexity, compatibility and the
organizational readiness factor in terms of the technological capabilities. These factors are
directly associated with the characteristics of the technology (innovation) under study and the
preparedness of the organization related to its infrastructure to support the adoption. The relative
advantage represents the benefit associated with the technology, and it is used instead of the cost
in order to express the gain from technology adoption in aggregate terms. The environment
related factors are industry pressure, government intervention, vendor support and the
technology solution provider readiness factor in terms of its ability to support the technology to
be adopted by the healthcare provider. These factors are outside of the control of the healthcare
provider. The organization related factors are size, top management support, and organizational
readiness factor. These factors are directly related to key characteristics of the organization (e.g
size) and also to basic elements of the project and team required to lead the adoption process.
The contributions from Phase II are associated with the development and implementation of the
proposed modeling approach for identification standards adoption. This research makes a first
attempt to model identification standards adoption by bringing system dynamics modeling and
diffusion theory together. The proposed model provides insights on relevant factors affecting the
adoption process and illustrates how policies and scenarios are designed to modify the system’s
behavior.
The initial step of the proposed modeling approach is the Causal Loop Diagram (CLD). This
CLD is another representation of the factors affecting the adoption process, identified in the
conceptual model, but in the form of a relationship (Burbano, Pohl, & Rardin, Modeling the
Adoption of Identification Standards in US Hospitals: A Systems Dynamics Approach, 2011).
181
The CLD was used to conceptualize the model formulation. The use of classical diffusion
models was explored as a way to mathematically formulate the model, and the Bass Diffusion
Model (BDM) was proposed as the underlying structure for the formulation. Due to the lack of
information on past adoptions related to identification standards, a staged model formulation was
proposed.
The first stage of the model formulation used the BDM to analyze the adoption of the technology
required to support identification standards use. It was assumed that the analysis of the adoption
of supporting technologies for identification standards such as the MMIS could provide valuable
information to model the identification standards adoption process, since identification standards
cannot be used in isolation but require the existence of an underlying platform to be of any value
for the organization. This stage facilitated the estimation of the model coefficients for each of the
supporting technologies, according to the identification standards definition. It also facilitated
the characterization of the diffusion curves for MMIS, BPOC and EDI for the hospital
population using the HIMSS DB available data.
The second stage of the model used most of the factors defined in the CLD to develop a
simulation model, which was validated using the steps suggested by the system dynamics
methodology. The sensitivity analysis identified the relevant model parameters that facilitated
the design of interventions to move the adoption process forward. This model provides an
illustration of the use of system dynamics models and diffusion theory to understand a problem
reported in the literature and not yet solved. This model is an approximation of the real world
system that identified the main factors the system and facilitated the design and testing of
policies to explore the change in the system behavior. This approximation is proposed as a way

182
to understand the problem and inform real world practitioners and also the academic community
on issues like the lack of data and other challenging aspects of empirical research that can be
addressed with the proposed model and methodology.
6.2 In general (research questions, limitations and challenges)
As presented in Chapter 1, the research questions were grouped into two phases. Phase I was
related to questions 1, 2 and 3. Phase II was related to questions 4, 5 and 6. For each phase the
main objective was achieved and the research questions were answered.
For Phase I the main objective was to identify the main barriers affecting the data standards
adoption process (research question number 3). The barriers were identified and the adoption
process was explained via a conceptual model. The research shows that the identification
standards adoption process can be understood and explained using the information provided in
the comparative analysis of findings and the proposed conceptual model. The findings of Phase I
are limited to the scope of the literature review, which was extensive and covered more than 100
papers, but it cannot be assumed that all the available documentation was revised.
For Phase II the main objective was to develop a theoretical model to investigate the dynamics of
the adoption of identification standards in the U.S healthcare supply chain (research question
number 4). The model was developed and tested. A systems dynamics modeling approach was
used to model this process, and the model was based on technology diffusion theory. The
research showed that technology diffusion models can be used to explain and model the adoption
of identification standards, but with certain limitations. Classic diffusion models such as the
BDM are limited to data availability and the definition of the technology to be adopted.

183
To overcome those limitations, a two stage formulation was proposed. The first stage comprised
the modeling of identification standards supporting technologies, such as MMIS, BPOC and
EDI, by using the BDM. It was established that the adoption of at least the underlying platform,
the MMIS, was necessary to support identification standards adoption and further use. The
second stage comprised the model formulation, implementation and testing using the
assumptions developed in Section 5.1.
According to the results of the sensitivity analysis the following factors were found to have a
positive correlation with the adoption rate: IdS factor, average Hospital operating expenses,
complexity and interoperability issues and awareness. These results indicate that the availability
and allocation of resources at the healthcare provider level considering the average H operating
expenses and the IdS factor may have an impact on the adoption process. The implementation of
the interventions defined in Section 5.4 indicated that the adoption rate for identification
standards can be accelerated up to year 7.
The model (Stage 2) allowed the researcher to model interactions and facilitated the development
of assumptions when no data exists or is available yet. The model provides a platform or test
bed that can be extended to include other healthcare supply chain stakeholders. Even though
there are different stakeholders in the healthcare supply chain, this model’s main focus is the
healthcare provider and its interaction with technology providers. The findings from this phase
are limited to the validity of the model parameters and assumptions.
The development of the first phase was challenging due to the lack of a consensus on
identification standards adoption definition. An operational definition was proposed. The
development of the second phase of the research was challenging due to the fact that classical

184
diffusion models rely on the existence of enough data on past adoptions in order to estimate
model parameters. Since identification standards were defined as a recent adoption process
(2008), the lack of data on past adoptions represented a challenge for modeling purposes. The
staged formulation was proposed as a way to overcome this challenge.
6.3 Research opportunities
Some of the challenges described in the previous section represent an opportunity for further
research and exploration.
The study of the identification standards adoption process from the Management of Technology
(MOT) perspective provided an opportunity to enhance the understanding of the adoption
process by exploring related adoption processes such as EDI and EHR. That exploration led to
the development of the conceptual model for identification standards adoption at the healthcare
provider level. The extension of this work in order to develop a conceptual model for other
healthcare supply chain members such as distributors, Group Purchasing Organizations GPOs
and manufacturers could be considered. These conceptual models can be tested ona broader
scale with a data collection technique (survey). A longitudinal study can be developed based on
the operationalization of the conceptual model (survey results). This study can be done over a
three to five year period to collect data on adoption and follow up on the industry evolution.
The simulation model (Stage 2) can be improved with the refinement of the data gathering and
validation process. The use of fuzzy set theory in order to operationalize the qualitative variables
of the model is an avenue for future exploration.

185
The generic simulation model structure can be further developed to include the specific
characteristics of the healthcare population (size, revenue) and also to consider other industries
for example the pharmaceutical supply chain.
The methodology used to develop the simulation model can be revised, and Agent Based
Modeling ABM can be applied to study individual entities instead of a population. These entities
can be modeled as individual hospitals, and spatial considerations associated with geographical
characteristics can be considered as well as network membership.
In general, the proposed modeling approach of Stage 2 and the groundwork information provided
in Stage 1 can be followed and improved in the study of adoption processes with similar
characteristics in a different setting, for example a different country.

186
References
Accenture. (2006). Synchronization: The Next Generation of Business Partnering. FMI, GMA, Wegmans Food Markets and 1SYNC.
AHA. (2006). Adopting Technological Innovation in Hospitals: Who Pays and Who Benefits? American Hospital Association.
AHA. (2007). Continued Progress: Hospital Use of Information Technology. American Hospital Association.
AHA. (2005). Forward Momentum: Hospital Use of Information Technology. AHA. American Hospital Association.
Alexander, M. B. (1989). The Adoption and Implementation of Computer Technology in Organizations: The Example of Database Machines. Ph.D Dissertation . Indiana University.
Arunachalam, V. (1995). EDI: An analysis of adoption, uses, benefits and barriers. Journal of Systems Management , 46 (2), 60-64.
Ash, J., & Bates, D. (2005). Factors and forces affecting EHR system adoption: Report of a 2004 ACMI Discussion. Journal of the American Medical Informatics Association , 12 (1), 8-12.
ATKS. (2004). Connet the dots: Harnessing Collaborative Technologies to deliver better value to customers. A.T. Kearney and Kurt Salmon Associates.
Barlow, R. D. (2010, February). Alliance subgroup throws down device data standards gauntlet. Healthcare Purchasing News , pp. 12-13.
Barlow, R. D. (2009, April). Crafting the supply chain stimulus package. Healthcare Purchasing News , pp. 8-11.
Barlow, R. D. (2010, February). FDA Negotiates through device data standards stalemate. Healthcare Purchasing News , pp. 14-16.
Barlow, R. D. (2009, May). Premier CIO conducting data synchrony. Alliance pushes harder for supply chain data standards. Healthcare Purchasing News , 33 (5), p. 46.
Barlow, R. D. (2007, April). Sync or swim: Who should blink first and why? Healthcare Purchasing News , 31 (4), pp. 10-14.
Bedard, J. (1996). Development in International Identification and Codification Standards. In M. R. Institute (Ed.), Proceedings: Toward and Electronic Patient Record '96, 12, pp. 424-426. San Diego.

187
Bix, L., Clarke, R., Lockhart, H., Twede, D., & Spink, J. (2007). The Case for Global Data Standards. GS1 Global Healthcare Users Group.
Borshchev, A., & Filippov, A. (2004). From System Dynamics and Discrete Event to Practical Agent Based Modeling: Reasons, Techniques, Tools. International Conference of the System Dynamics Society. Oxford, England.
Bower, A. (2005). The Diffusion and Value of Healthcare Information Technology. RAND Health. RAND Corporation.
Burbano, A., Pohl, E., & Rardin, R. (2011). Modeling the Adoption of Identification Standards in US Hospitals: A Systems Dynamics Approach. Reno, NV: Proceedings of the 2011 Industrial Engineering Research Conference.
Burbano, A., Rardin, R., & Pohl, E. (2011). Exploring the Factors Affecting the Identification Standards Adoption Process. Portland Industrial Conference on Management of Engineering and Technology PICMET. Portland, OR.
Burke, E. (2008, April). Hospitals lessons in data synchronization. Materials Management in Health Care , pp. 15-18.
Burke, E. (2008, March). Progressive Pilots. Materials Management in Heatlh Care , pp. 15-18.
Buyurgan, N., Rardin, R., Jayaraman, R., Varghese, V., & Burbano, A. (2011). A Novel GS1 Data Standard Adoption Roadmap for Healthcare Providers. International Journal of Healthcare Information Systems and Informatics , 6, 41-58.
Chang, I., Hwang, H., Hung, M., Lin, M., & Yen, D. (2007). Factors affecting the adoption of electronic signature. Decision support systems , 44, 350-359.
ChEs HIGPA GS1. (2009). Report on the Survey and Assessment of MMIS Readiness. GS1.
Clemson, B., Tang, Y., Pyne, J., & Unal, R. (1995). Efficient methods for sensitivity analysis. System dynamics review , 11 (1), 31-49.
Cooper, R. B., & Zmud, R. W. (1990). Information technology implementation research: A technological diffusion approach. Management Science , 36 (2), 123-139.
Coyle. (1983). The technical elements of the sytem dynamics approach. European Journal of Operational Research , 14, 259-370.
CSC. (1996). Improving the Efficiency of the Healthcare Supply Chain. American Hospital Association, AHA.
CTL. (2006). Transforming the Healthcare Supply Chain: CTL Rountable Proceedings. MIT.

188
Cui, A. S., Zhao, M., & Ravichandran, T. (2011). Market Uncertainty and Dynamic New Product Launch Strategies: A System Dynamics Model. IEEE Transactions on Engineering Management , 58 (3), 530-550.
Cummings, J., Ratko, T., & Matuszewski, K. (2005). Barcoding to Enhace Patient Safety. Patient Safety & Quality Healthcare .
Daim, T. U., Rueda, G., Martin, H., & Gerdsri, P. (2006). Forecasting emerging technologies: Use of bibliometrics and patent analysis. Technological Forecasting and Social Change , 73, 981-1012.
Daim, T., Chan, L., Amer, M., & Aldhaban, F. (2009). Assessment and adoption of web based health information systems. International Journal of Behavioural and Healthcare Research , 1 (3), 274-292.
Daim, T., Tarman, T., & Basoglu, N. (2008). Exploring Barriers to Innovation Diffusion in Healthcare Service Organizations: An issue for effective integration of service architecture and information technologies. Proceedings of the 41st Hawaii International Conference on System Sciences.
Davis, F., Bagozzi, R., & Warshaw, P. R. (1989). User acceptance of computer technology: a comparison of two theoretical models. Management Science , 35 (8), 982-1003.
DeJohn, P. (2008, July). Standards in Motion. Materials Management in Healthcare , pp. 30-34.
DoD. (2007). Results from DoD Healthcare GDSN Pilot Phase IIA. DoD/VA Data Synchronization Program.
Erdil, N. (2009). Systems analysis of Electronic Health Record adoption in the U.S. healthcare system. Ph.D Dissertation . State University of New York, Binghamton.
Erdil, N., & Emerson, R. (2008). Modeling the dynamics of Electronic Health Records adoption in the U.S healthcare system. Proceedings International Conference of the System Dynamics Society. Athens, Greece.
Erdil, N., & Emerson, R. (2009). Simulation modeling of electronic health records adoption in the U.S healthcare system. Proceeding International Conference of the System Dynamics Society. Albuquerque, NM.
ERG. (2006). Unique Identification for Medical Devices, Final Report. ERG.
Fibich, G., & Gibori, R. (2010). Aggregate Diffusion Dynamics in Agent Based Models with Spatial Structure. Operations Research , 58 (5), 1450-1468.
Finkelstein, Homer, & Sondik. (1984). Modeling the dynamics of decision making for emerging medical technologies. R&D Management , 175-191.

189
Fisher, D. K., Norvell, J., Sonka, S., & Nelson, M. J. (2000). Understanding technology adoption through system dynamics modeling: implications for agribusiness management. International Food and Agribusiness Management Review , 3, 281-296.
Fonkych, K., & Taylor, R. (2005). The State and Pattern of Health Information Technology Adoption. RAND Health. RAND Corporation.
Ford, A., & Flynn, H. (2005). Statistical screening of system dynamics models. System Dynamics Review , 21 (4), 273-303.
Gaimon, C. (2008). The Management of Technology: A Production and Operations Management Perspective. Production and Operations Management , 17 (1), 1-11.
Garg, V., Jones, C., & Sheedy, C. (1999). 17 Billion reasons to say thanks, the 25th anniversary of the U.P.C and it's impact on the grocery industry. Price Water House Coopers.
Garvin, K. (2006, May). The time is right for the healthcare supply chain to reap the benefits of data synchronization. Healthcare Purchasing News , pp. 48-49.
Girosi, F., Meili, R., & Scoville, R. (2005). Extrapolating the evidence of health information technology savings and costs. RAND Health. RAND Corporation.
Glöber, A., Thun, J., & Milling, P. (2008). System Dynamics as a Structural Theory in Operations Management. Production and Operations Management , 17 (3), 37-384.
Greer, A. L. (1985). Adoption of Medical Technology. International Journal of Technology Assessment in Health Care , 1 (3), 669-680.
Grotting, J. B., Yang, M., Kelly, J., Brown, M. M., & Trohimovich, B. (2002). The Effect of Barcode-Enabled Point of Care Technology on Patient Safety. Bridge Medical, Inc.
Grover, V. (1993). An empirically derived model for the adoption of customer based interorganizational systems. 24 (3).
GS1. (2009). GS1 Standards in the Healthcare Supply Chain. GS1 Global.
GS1 Healthcare US. (2010). AIDC Healthcare Implementation Guide. GS1.
GS1. (2009). Seton Family of Hospitals and BD Use GS1 Standards and Processes to Reduce EDI Errors in Pursuit of Perfect Orders. GS1.
GS1. (2010). The Value and Benefits of the GS1 System of Standards. GS1.
GS1 US. (2010). 2015 Readiness Program. Lawrenceville, NJ: Corporate Headquarters.
GS1, H. U. (2012). GTIN Industry Readiness Report. GS1 Healthacare US.
190
Hefflin. (2005). Automatic Identification of Medical Devices. ECRI.
Hekimoglu, M., & Barlas, Y. (2010). Sensitivity analysis of system dynamic models by behavior pattern measures. Proceedings of the 28th International Conference of the Systems Dynamics Society. Seoul, Korea.
HFMA. (2005). Managing Resources to Achieve Improved Economic Outcomes and High Quality of Care. Healthcare Financial Management Association and McKesson.
HFMA. (2008). Opportunities for supply chain improvement. Healthcare Financial Management Association and Amerinet.
Hillestad, R., Bigelow, J., Bower, A., Girosi, F., Meili, R., Scoville, R., et al. (2005). Can Electronic Health Record Systems Transform Healthcare? Potential Healthcare Benefits, Savings and Costs. Health Affairs , 24 (5), 1103-1117.
HIMSS. (2003). Implementation guide for the use of barcode technology in healthcare. HIMSS.
Hoffer, J. A., & Alexander, M. B. (1992). The Diffusion of Database Machines. Data Base , Spring (1), 13-19.
Hossain, M. M., & Prybutok, V. R. (2008). Consumer acceptance of RFID Technology: An Exploratory Study. IEEE Transactions on Engineering Management , 55 (2), 316-328.
Hubner, U., & Elmhorst, M. A. (2008). eBusiness in Healthcare. From eProcurement to Supply Chain Management (Health Informatics Series ed.). London: Springer Verlag.
Hung, S., Hung, W., Tsai, C., & Jian, S. (2009). Critical factors of hospital adoption on CRM systems: Organizational and information system perspectives. Decision Support Systems , 48 (4), 592-603.
Hwang, J., Cho, Y., & Long, N. V. (2009). Investigation of factors affecting the diffusion of mobile telephone services. Telecommunications Policy , 33, 534-543.
Iacovou, C. L., Benbasat, I., & Dexter, A. S. (1995). Electronic Data Interchange and Small Organizations: Adoption and Impact of Technology. MIS Quarterly , 19 (4), 465-485.
Iskandar, B. Y., Kurokawa, S., & LeBlanc, L. J. (2001). Adoption of Electronic Data Interchange: The Role of Buyer - Supplier Relationships. IEEE Transactions on Engineering Management , 48 (4), 505-517.
Jha, A. K., DesRoches, C. M., Kralovec, P. D., & Joshi, M. S. (2010, October). A Progress Report on Electronic Health Records in U.S. Hospitals. Health Affairs , p. 1951.

191
Kerimoglu, O., Basoglu, N., & Daim, T. (2008). Organizational adoption of information technologies: Case of enterprise resource planning systems. Journal of High Technology Management Research , 19 (1), 21-35.
Kohn, L. T., Corrigan, J. M., & Donaldson, M. (2000). To Err is Human: Building a Safer Health System. Institute of Medicine.
Koppel, R., Wetterneck, T., Telles, J. L., & Karsh, B. (2008). Workarounds to Barcode Medication Administration Systems: Their Occurrences, Causes, and Threats to Patient Safety. Journal of the American Medical Informatics Association , 15 (4), 408-423.
Kowalski. (2009, June). Needed: A Strategic Approach to Supply Chain Management. Healthcare Financial Management , 63 (6), p. 90.
Krohn, R. (2009). Tower of Babble. Can Data Standards Drive Healthcare Interoperability. Journal of Health Information Management , 23 (1), 12-13.
Kuan, K., & Patrick, C. (2001). A perception based model for EDI adoption on small businesses using a technology-organization-environment framework. Information and Management , 38, 507-521.
Langabeer II, J. R. (2008). Health Care Operations Management. London: Jones and Barlett Publishers International.
Langabeer, J. (2005). The Evolving Role of Supply Chain Technology Management in Healthcare. Journal of Healthcare Information Management , 19 (2), 27-33.
Lawson. (2008). Getting Started with Standards Based Operating Procedures for Optimal Enterprise-wide Supply Chain Management Performance . HPN.
Levine, L. (2007, April). In sync: Getting the supply chain act together. Healthcare Purchasing News , 31 (4), p. 14.
Liu, S., Triantis, K. P., & Sarangi, S. (2011). Representing Qualitative Variables and Their Interactions With Fuzzy Logic In System Dynamics Modeling. Systems Research and Behavioral Science , 245-263.
Mahajan, V., & Peterson, R. (1985). Models for innovation diffusion: Quantitative applictions in the social sciences. Sage.
Mahajan, V., Muller, E., & Wind, Y. (2000). New Product Diffusion Models. Norwell, MA: Kluwer Academic Publishers.
Maier, H. F. (1998). New product diffusion models in innovation management - a system dynamics perspective. System Dynamic Review , 14, 285-308.
192
Majahan, V., & Wind, Y. (1986). Innovation Diffusion Models of New Product Acceptance. Cambridge, MA: Ballinger Publishing Company.
McGowan, M., & Madey, G. (1998). Adoption and implementation of Electronic Data Interchange. In T. J. Larsen, & E. McGuire, Information systems innovation and diffusion : Issues and directions (pp. 116-140). Hersey,PA: Idea Group Publishing.
McGowan, M., & Madey, G. (1998). The influence of organization structure and organizational learning factors on the extent of EDI implementation in U.S. firms. Information Resources Management Journal , 11, 17.
McKesson. (2004). Healthcare Supply Chain Management and the Internet. McKesson.
Menachemi, N., & Brooks, R. G. (2006). Reviewing the Benefits and Costs of Electronic Health Records and Associated Patient Safety Technologies. Journal of Medical Systems , 30, 159-168.
Middleton, B., Hammond, W. E., Brenan, P. F., & Cooper, G. F. (2005). Accelerating U.S. EHR Adoption. Journal of the American Medical Informatics Association , 12 (1), 13-19.
Miller, R., & Sim, I. (2004). Physicians' Use of Electronic Medical Records: Barriers and Solutions. Health Affairs , 23 (2), 116-126.
Moynihan. (1997, March). Improving the healthcare supply chain using EDI. Healthcare Financial Management , 51 (3), p. 78.
Murphy, J. (2008). Delay of Game. If Healthcare IT Is So Great, Why Is It Taking So Long to Adopt? Journal of Health Information Management , 22 (1), 10-11.
Nachtmann, H., & Pohl, E. (2009). The State of Healthcare Logistics: Cost and Quality. Center for Innovation on Healthcare Logistics, CIHL, University of Arkansas.
Narayanan, S., Marucheck, A. S., & Handfield, R. B. (2009). Electronic Data Interchange: Research Review and Future Directions. Decision Sciences , 40 (1), 121-163.
Nelson, M. J. (1998). A Dynamic Simulation Model on the Diffusion of Yield Monitoring and Mapping Technologies. Master Thesis . University of Illinois at Urbana - Champaign.
Nelson, M. L. (2003). The adoption and diffusion of inter-organizational system standards and process innovations. Ph.D Dissertation . University of Illinois at Urbana-Champaign.
Niederman. (1998). The Diffusion of Electronic Data Interchange Technology. In T. J. Larsen, & E. McGuire, Information systems innovation and diffusion: Issues and directions (pp. 141-160). Hersey, PA: Idea Group Publishing.
O'Daffer, E., Shaffer, V., & Lefebure, S. (2011). GS1 Standards gain traction toward improving healthcare and life science supply chains. Gartner group.

193
Oranje-Nassau, C., Schindler, H., Valeri, L., Vilamovska, A., Hatziandreau, E., & Conklin, A. (2009). Study of the requirements and options for RFID application in healthcare. RAND Europe.
Otto, P., & Simon, M. (2009). Coordinating quality of care: A policy model to simulate adoption of electronic health records. The 27th International Conference of the System Dynamics Society. Albuquerque, NM.
Palmer, J. W. (1998). The Adoption and Diffusion of Quick Response Technologies in Specialty Retailing. In T. Larsen, & E. McGuire, Information systems innovation and diffusion: Issues and directions (pp. 179-192). Hersey, PA: Idea Group Publishing.
Patterson, E., Chapman, R., Render, M., & Rogers, M. (2006). Compliance with Intended Use of Bar Code Medication Administration in Acute and Long-Term Care: An Observational Study. Human Factors , 48 (1), 15-22.
Paul, D. L., Pearlson, K. E., & McDaniel, R. R. (1999). Assesing technological barriers to telemedicine: technology management implications. IEEE Transactions on Engineering Management , 46 (3), 279-288.
Perrin, R. A. (2009, September). Supply Chain Standards - GS1 Sunrise dates approaching rapidly. Healthcare Purchasing News , pp. 64-66.
Pohl, E., & Nachtmann, H. (2011). GS1 Dta Standards Adoption Survey. Center for Innovation on Healthcare Logistics.
Quan, S., Hao, C., & Jianxin, Y. (2010). Factors influencing the adoption of mobile service in China. Journal of Computers , 5 (5), 279-288.
Ramamurthy, K., & Premkumar, G. (1995). Determinants and outcomes of Electronic Data Interchange Diffusion. 42 (4), 332-351.
Rogers, E. M. (1983). Diffusion of Innovations (5th Edition ed.). New York: Free Press.
Rosenfeld, & Stelzer. (2006). Data Syncronization in Healthcare: A Solvable Problem. Sterling Commerce.
Sharif, M. N., & Ramanathan, K. (1981). Polynomial innovation diffusion models. Technological Forecasting and Social Change , 301-323.
Shemm, J., Legner, C., & Otto, B. (2007). Global Data Synchronization: Current Status and Future Trends. Institute of Information management. University of St. Gallen.
Sheng, L., R., O., Jen Hwa, P., Wei, C., Higa, K., & A., G. (1998). Adoption and diffusion of telemedicine technology in healthcare organizations. Journal of Organizational Computing and Electronic Commerce , 8 (4), 247-275.

194
Shortliffe, T. (2005). Strategic Action in Health Information Technology: Why the obvious has taken so long? Health Affairs , 24 (5), 1222-1233.
Simpson, N., & Kleinberg, K. (2009). Implementation Guide to Bar Coding and Auto-ID in Healthcare: Improving Quality and Patient Safety. HIMSS.
Sterman, J. (2000). Business Dynamics. McGraw Hill.
Teng, J., Grover, V., & Guttler, W. (2002). Information Technology Innovations: General Diffusion Patterns and its Relationships to Innovation Characteristics. IEEE Transactions on Engineering Management , 49 (1), 13-27.
The Academy and Broadlane. (2008). Large Health Systems Supply Chain Management Practices Survey. The Academy.
Thompson, D. I., Osheroff, J., Classen, D., & Sittig, D. F. (2007). A Review of Methods to Estimate the Benefits of Electronic Medical Records in Hospitals and the Need for a National Benefits Database. Journal of Healthcare Information Management , 21 (1).
Tian, R., Duffy, V., Birk, C., Abel, S. R., & Hultgren, K. (2009). The Performance of BCMA Aided Healthcare Service: Implementation Factors and Results. Lecture Notes in Computer Science , 560-568.
Tornatzky, L., & Fleisher, M. (1990). The process of technological innovation. Lexington Books.
Ventana, S. (2007). Vensim user's guide Version 5. Ventana Systems Inc.
Volsky, R. P., & Wilson, D. T. (1994). Interorganizational Information System Technology Adoption Effects on Buyer Seller Relationships in Retailer-Supplier Channel: An Exploration Analysis. The Pennsylvania State University, ISBM.
Wolfe, R. (1994). Organizational Innovation: Review, critique and suggested research directions. Journal of Management Studies , 31 (3), 405-431.
Woodside, J. (2007). Economic Externalities of Health Information Technology: A Game Theoretic model for the Electronic Health Record adoption. Journal of Healthcare Information Management , 21 (4), 25-31.
Zhu, K., Kraemer, K., & Xu, S. (2006). The process of innovation assimilation by different firms in different countries: A technology diffusion perspective on electronic business. Management Science , 52 (1), 1557-1576.
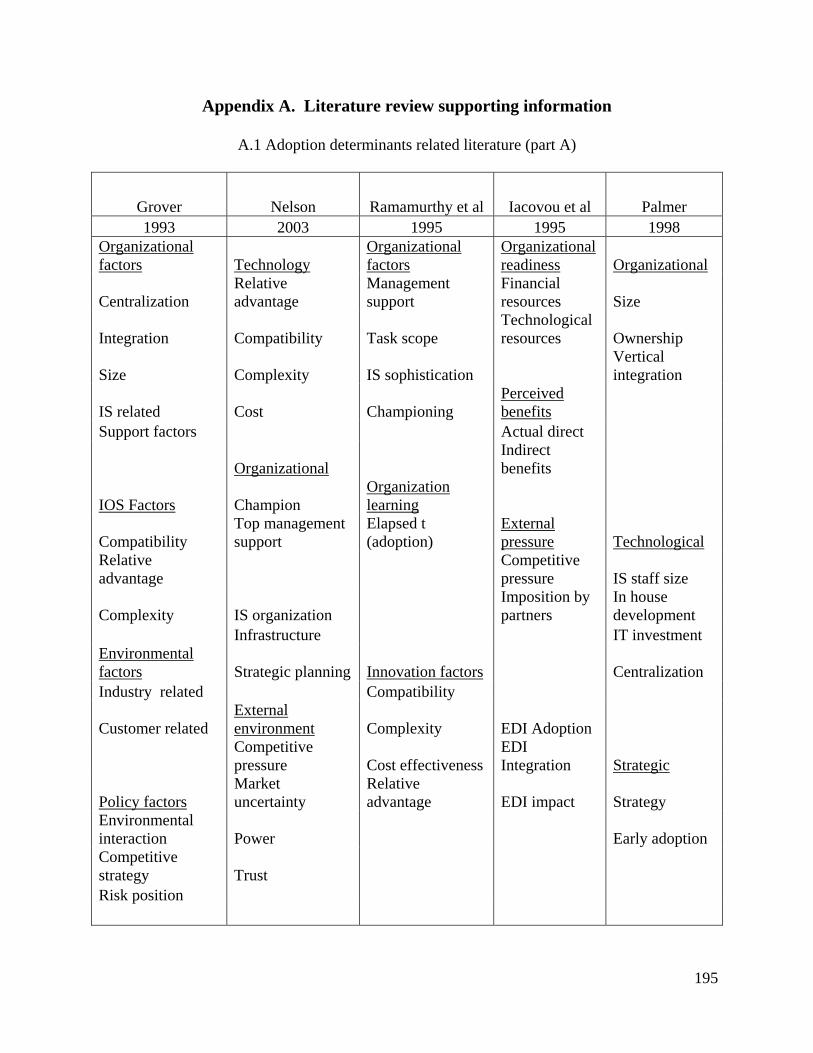
195
Appendix A. Literature review supporting information
A.1 Adoption determinants related literature (part A)
Grover Nelson Ramamurthy et al Iacovou et al Palmer 1993 2003 1995 1995 1998
Organizational factors Technology
Organizational factors
Organizational readiness Organizational
Centralization Relative advantage
Management support
Financial resources Size
Integration Compatibility Task scope Technological resources Ownership
Size Complexity IS sophistication Vertical integration
IS related Cost Championing Perceived benefits
Support factors Actual direct
Organizational Indirect benefits
IOS Factors Champion Organization learning
Compatibility Top management support
Elapsed t (adoption)
External pressure Technological
Relative advantage
Competitive pressure IS staff size
Complexity IS organization Imposition by partners
In house development
Infrastructure IT investment Environmental factors Strategic planning Innovation factors Centralization Industry related Compatibility
Customer related External environment Complexity EDI Adoption
Competitive pressure Cost effectiveness
EDI Integration Strategic
Policy factors Market uncertainty
Relative advantage EDI impact Strategy
Environmental interaction Power Early adoption Competitive strategy Trust Risk position

196
A.2 Adoption determinants related literature (part B)
McGowan and Madey a Kuan et al Narayanan et al Chang et al
1998 2001 2009 2007
Organization Organization Adoption determinants Organizational characteristics
Size Financial cost External factors User involvement
Management support Technical competence Internal factors Adequate resources
Champion Firm operations Hospital size Technical expertise Anticipated benefits Internal need
Training Supplier-buyer relationships
Centralization Technology Functional differentiation Direct benefits
Technology characteristics
External communications Indirect benefits EDI integration Security protection Internal integration System complexity Innovation External integration Compatibility
Complexity Realized outcomes Environment characteristics
Relative advantage Environment Vendor support Industry pressure Government policy
Environment Government pressure
Customer influence Supplier influence Industry cooperation Vendor support
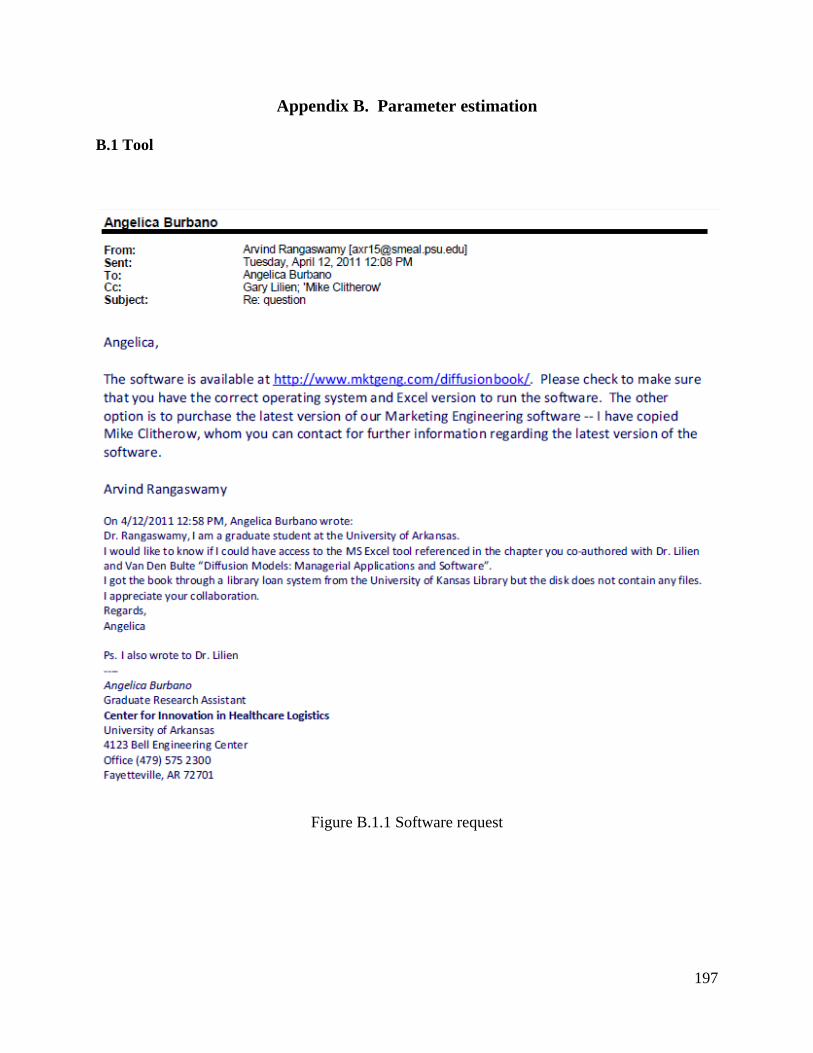
197
Appendix B. Parameter estimation
B.1 Tool
Figure B.1.1 Software request

198
Figure B.1.2 Software access page

199
B.2 Available information
Figure B.2.1 HIMSS Dorenfest Data Base agreement

200
Figure B.2.2 Access to the Dorenfest Institute
B.2.3 List of available information
Library of Dorenfest 3000+ Databases™ and Dorenfest Integrated Healthcare Delivery System Databases™ for the period 1986 through 2006 http://www.himss.org/DorenfestInstitute/DatabaseListing.aspx Last access 4/14/2011 4:58 PM 2008 HIMSS Analytics Database (derived from the Dorenfest IHDS+ Database) (Access 2003)
Demographic and IT data from over 33,000 facilities: o 5,168 Hospitals o 2,733 Sub Acute Care Facilities o 21,796 Ambulatory Facilities o 2,293 Home Health Care Facilities o 177 Free Standing Data Centers
Market share and purchasing plan data for over 95 software applications and technologies New for 2008:
o Applications: Bed Management, Single Sign-On o Statistics o Number of Births o Number of Outpatient Visits at the Hospital o Total Number of Discharges o Total Number of Patient Days

201
o New Types of Physicians (both the hospitals and systems) o Number of Hospitalists o Number of Residents o New IT FTEs o RCM Support o EMR Support o Chief Medical Officers, Chief Nursing Heads, HR Head and OB Head Contacts o CPOE Usage Details By Order Type o % of Medical Records that are Electronic o % of Physicians Using Structured Templates in the CDSS o Use of Consumer Dashboards o By Component of a Dashboard the % of Physicians Accessing o Patient Revenue By Percentage at the Hospital o Consolidation of Bar Coding and RFID Data o Details about Items Tagged for Medication Administration o Details on Systems Taking Advantage of the Relaxation In the Stark Law To
Offer o EMRs to Non-Owned Clinics o Software Being Remote Hosted (e.g. Perot is remote hosting the Mckesson
software) 2007 HIMSS Analytics Database (derived from the Dorenfest IHDS+ Database) (Access 2003)
Demographic and IT data from over 33,000 facilities: o 5,073 Hospitals o 2,940 Sub Acute Care Facilities o 50,458 Ambulatory Facilities o 2,128 Home Health Care Facilities o 178 Free Standing Data Centers
Market share and purchasing plan data for over 90 software applications and technologies New for 2007:
o Applications: Radiology - Orthopedic, Single Sign-On o IT Director and Quality Head o Next Generation RCM o Construction Plans o IV Pump Safety Software o Plans for Telecommunication
2006 HIMSS Analytics Database (derived from the Dorenfest IHDS+ Database) (Access 2003)
Demographic and IT data from over 32,000 facilities: o 5,082 Hospitals o 3,017 Sub Acute Care Facilities o 19,714 Ambulatory Facilities o 2,055 Home Health Care Facilities o 286 Free Standing Data Centers
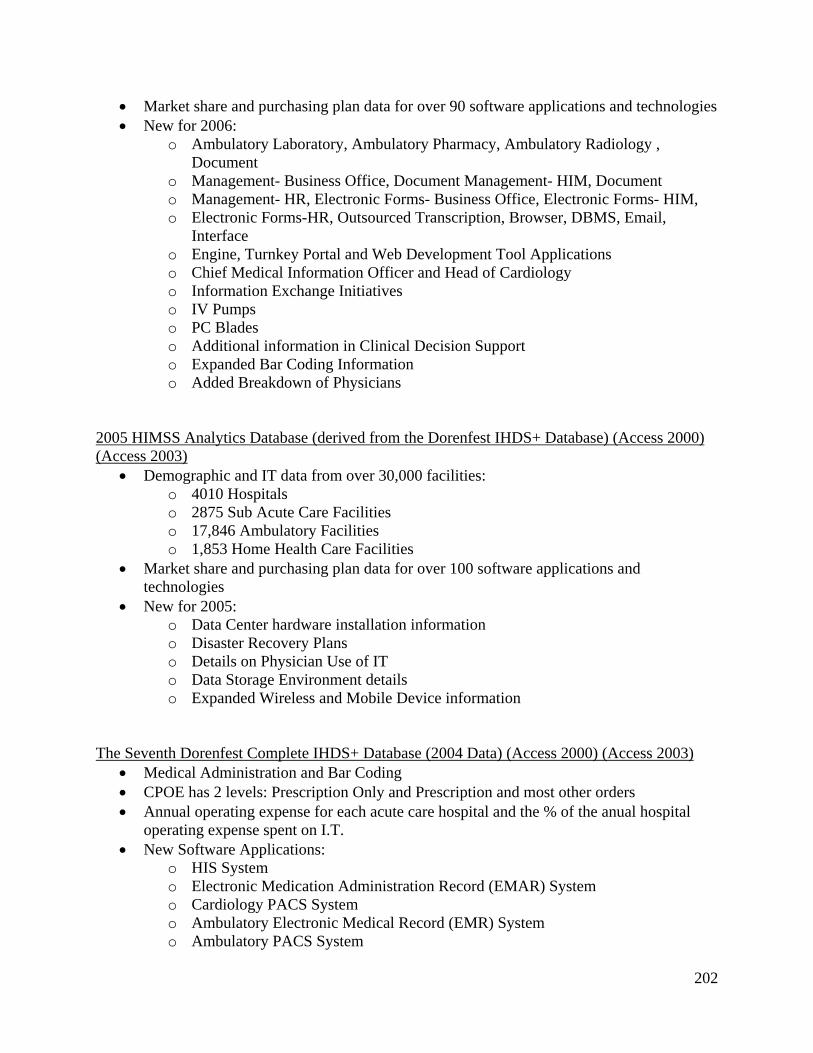
202
Market share and purchasing plan data for over 90 software applications and technologies New for 2006:
o Ambulatory Laboratory, Ambulatory Pharmacy, Ambulatory Radiology , Document
o Management- Business Office, Document Management- HIM, Document o Management- HR, Electronic Forms- Business Office, Electronic Forms- HIM, o Electronic Forms-HR, Outsourced Transcription, Browser, DBMS, Email,
Interface o Engine, Turnkey Portal and Web Development Tool Applications o Chief Medical Information Officer and Head of Cardiology o Information Exchange Initiatives o IV Pumps o PC Blades o Additional information in Clinical Decision Support o Expanded Bar Coding Information o Added Breakdown of Physicians
2005 HIMSS Analytics Database (derived from the Dorenfest IHDS+ Database) (Access 2000) (Access 2003)
Demographic and IT data from over 30,000 facilities: o 4010 Hospitals o 2875 Sub Acute Care Facilities o 17,846 Ambulatory Facilities o 1,853 Home Health Care Facilities
Market share and purchasing plan data for over 100 software applications and technologies
New for 2005: o Data Center hardware installation information o Disaster Recovery Plans o Details on Physician Use of IT o Data Storage Environment details o Expanded Wireless and Mobile Device information
The Seventh Dorenfest Complete IHDS+ Database (2004 Data) (Access 2000) (Access 2003)
Medical Administration and Bar Coding CPOE has 2 levels: Prescription Only and Prescription and most other orders Annual operating expense for each acute care hospital and the % of the anual hospital
operating expense spent on I.T. New Software Applications:
o HIS System o Electronic Medication Administration Record (EMAR) System o Cardiology PACS System o Ambulatory Electronic Medical Record (EMR) System o Ambulatory PACS System

203
The Sixth Dorenfest Complete IHDS+ Database (2003 Data) (Access 97) (Access 2000) 5 Additional Contact Names and Email Addresses for each IHDS 17 Additional Contact Names and Email Addresses for each Hospital Software Installation Information for 8 PACS Modalities, including imaging volume,
data storage and purchase plans Strategies surrounding CPOE, Patient Safety, and HIPAA
The Fifth Dorenfest Complete IHDS+ Database (2002 Data) (Access 97) (Access 2000)
Updated Records From 2001 HIPAA Compliance Patient Safety Initiatives Physician Usage of IT
The Fourth Dorenfest Complete IHDS+ Database (2001 Data) (Access 97) (Access 2000)
Updated Records From 2000 Location of Hardware Technological (LAN/WAN) Plans Telemedicine
The Third Dorenfest Complete IHDS+ Database (2000 Data) (Access 97) (Access 2000)
Updated Records From 1999 Additional Information on IT Budgets and FTEs
The Second Dorenfest Complete IHDS+ Database (1999 Data) (Access 97) (Access 2000)
Updated Records From 1998 Additional Information on the Parent-Child Relationship Handheld Devices
The First Dorenfest Complete IHDS+ Database (1998 Data) (Access 97) (Access 2000)
Updated Records From 1994-1995 Parent-Child Relationships between approximately 1500 IHDS and 35,000 Facilities Collaborative Relationships Additional Demographic Information Enterprise-wide Systems Servers IT Department Data (Budget, FTEs, etc.)
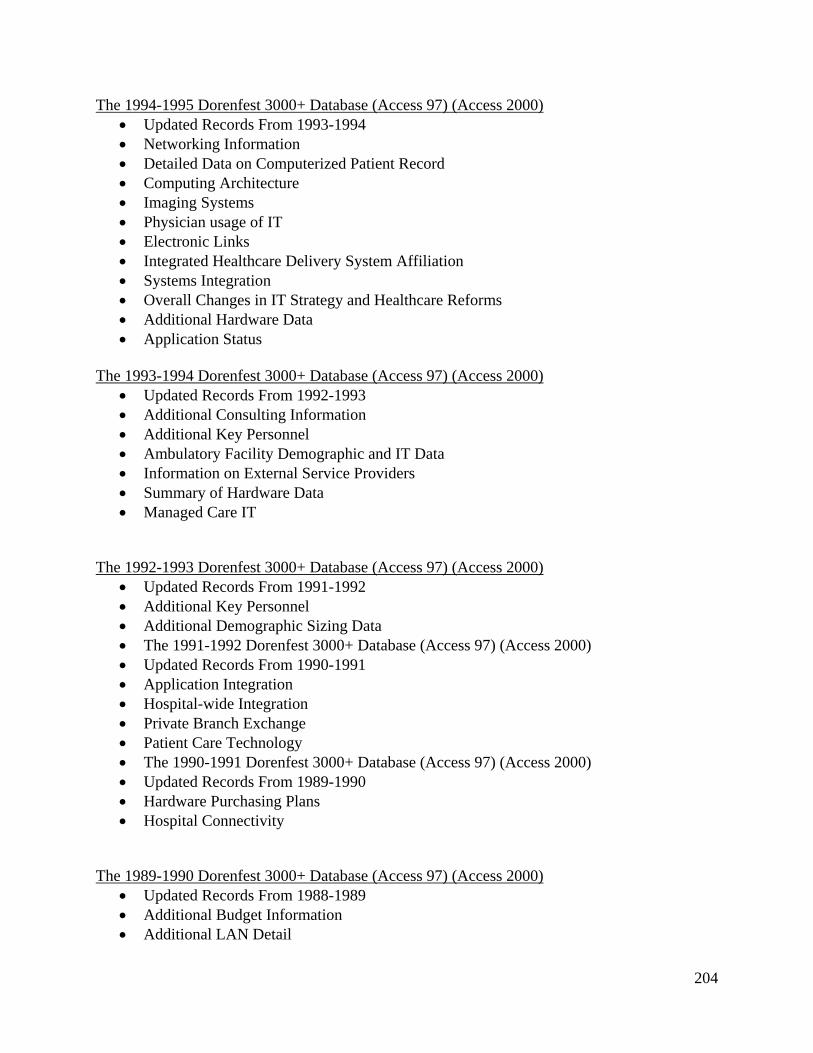
204
The 1994-1995 Dorenfest 3000+ Database (Access 97) (Access 2000) Updated Records From 1993-1994 Networking Information Detailed Data on Computerized Patient Record Computing Architecture Imaging Systems Physician usage of IT Electronic Links Integrated Healthcare Delivery System Affiliation Systems Integration Overall Changes in IT Strategy and Healthcare Reforms Additional Hardware Data Application Status
The 1993-1994 Dorenfest 3000+ Database (Access 97) (Access 2000)
Updated Records From 1992-1993 Additional Consulting Information Additional Key Personnel Ambulatory Facility Demographic and IT Data Information on External Service Providers Summary of Hardware Data Managed Care IT
The 1992-1993 Dorenfest 3000+ Database (Access 97) (Access 2000)
Updated Records From 1991-1992 Additional Key Personnel Additional Demographic Sizing Data The 1991-1992 Dorenfest 3000+ Database (Access 97) (Access 2000) Updated Records From 1990-1991 Application Integration Hospital-wide Integration Private Branch Exchange Patient Care Technology The 1990-1991 Dorenfest 3000+ Database (Access 97) (Access 2000) Updated Records From 1989-1990 Hardware Purchasing Plans Hospital Connectivity
The 1989-1990 Dorenfest 3000+ Database (Access 97) (Access 2000)
Updated Records From 1988-1989 Additional Budget Information Additional LAN Detail

205
The 1988-1989 Dorenfest 3000+ Database (Access 97) (Access 2000) Updated Records From 1987-1988 Additional Key Personnel Detailed Software Plan Data LAN Use
The 1987-1988 Dorenfest 3000+ Database (Access 97) (Access 2000)
Updated Records From 1986-1987 Names and Titles of Key Personnel Names and Titles of Steering Committee Members Computers and Printers in Use The 1986-1987 Dorenfest 3000+ Database (Access 97) (Access 2000) Demographic Information for Approximately 3000 Hospitals Software Vendors and Products in Use or Planned Use Hardware Data Consultants Used
[email protected] | © HIMSS Foundation 2010 | 312-915-9523 Database Listing http://www.himss.org/DorenfestInstitute/DatabaseListing.aspx Last access 4/14/2011 4:58 PM
B.3 Results ME for Excel output
The tables are associated to the Data Sets shown in Table 17.
Figure B.3.1 Parameter estimation Data Set 1

206
Figure B.3.2 Parameter estimation Data Set 2
B.3.3 Table for parameter estimation Data Set 3

207
B.3.4 Table for parameter estimation Data Set 4
B.3.5 Table for parameter estimation Data Set 5

208
B.3.6 Table for parameter estimation Data Set 6

209
Appendix C. Formulation
C.1 Vensim model formulation output – Stage 1 Formulation for MMIS diffusion model Data Set 3 (01)Adopters A= INTEG (Hospital AR, Initial adopters) Units: member (02)Adopters influence Type I=Adopters A/Total Population N Units: 1 (03)external influence=p coefficient*Potential Adopters P Units: member/Year (04)Hospital AR= external influence + internal influence Units: member/Year (05)Initial adopters= INITIAL(130) Units: member (06)internal influence=Adopters influence Type I*q coefficient*Potential Adopters P Units: member/Year (07)p coefficient=0.0080293 Units: 1/Year (10)Potential Adopters P= INTEG (-Hospital AR,Total Population N-130) Units: member (11)q coefficient=0.180904 Units: 1/Year (12)Total Population N=5500 Units: member C.2 Vensim model formulation output – Stage 2 (01) A initial=500 Units: member [0,3000,150] (2) adopter influence=Adopters A/Total Population N Units: 1
210
(3) Adopters A= INTEG (Hospital AR,A initial) Units: member (4)average H IS budget=IS Budget*average H revenue Units: dollars/Year (5) average H operating expenses=2.62364e+008 Units: dollars/Year (6) average H revenue=2.7e+008 Units: dollars/Year [0,2e+009,1e+006] (7) awareness=1 Units: Dmnl [0,10,1] (8) complexity and interoperability issues=1 Units: Dmnl [0,3,1] (9) distributors and GPOs = WITH LOOKUP (Time,([(0,0)-(50,200)],(0,0),(0,0),(1,5),(3,23),(11,89),(15,120),(20,150),(25,160),(30,170),(40,180),(50,190) )) Units: 1 [0,?] (10) distributors and GPOs influence = WITH LOOKUP (distributors and GPOs,([(0,0)-(200,1)],(0,0),(1,0.2),(14.6789,0.5),(50,0.7),(100,0.75),(150,0.8),(200,0.9) )) Units: Dmnl (11) expected gains by process=productivity improvement factor*H SCM operating costs Units: dollars/Year (12) external factors influence=(m5+m6)/2 Units: Dmnl (13) external influence N=0.02 Units: 1/Year [0,1,0.01] (14) external source=external factors influence*external influence N*Potential Adopters P Units: member/Year (15) government intervention=1 Units: 1 [0,10,1] (16) H expected benefits=expected gains by process Units: dollars/Year (17) H expected costs=H IdS implementation costs*EXP(increase SCM expending*Time ) Units: dollars/Year
211
(18) H expected gain=H expected benefits-H expected costs Units: dollars/Year (19) H IdS implementation costs=IdS factor*average H IS budget Units: dollars/Year (20) H IdS Use = WITH LOOKUP (adopter influence,([(0,0)-(1,1)],(0,0),(0,0),(0,0),(0.25,0.3),(0.5,0.5),(0.7,0.6),(1,1) )) Units: Dmnl (21) "H organizational readiness (P)"=process fraction*awareness Units: Dmnl (22) "H organizational readiness (T)"=("H organizational readiness (P)"+H technology penetration factor)/2 Units: Dmnl (23) H relative advantage= WITH LOOKUP (H expected gain,([(0,0)-(1.5e+007,1)],(0,0),(94117.6,0.0106762),(845066,0.170819),(1.2676e+006,0.252669),(2.51172e+006,0.423488),(3.8028e+006,0.594306),(4.9765e+006,0.715302),(6.10325e+006,0.790036),(7.48822e+006,0.882562),(8.6854e+006,0.939502),(9.97647e+006,0.95),(1.5e+007,1) )) Units: Dmnl (24) H SCM operating costs=average H operating expenses*IdS factor Units: dollars/Year (25) H technology penetration factor=0.4 Units: Dmnl [0,1,0.05] (26) Hospital AR=external source+internal source Units: member/Year [0,?] (27) IdS factor=0.05 Units: Dmnl [0,1,0.01] (28) increase SCM expending=0.01 Units: 1/Year [0,1,0.01] (29) industry pressure = WITH LOOKUP (distributors and GPOs influence,([(0,0)(1,1)],(0,0), (0.189602,0.307018),(0.3,0.45),(0.400612,0.539474),(0.5,0.7),(0.620795,0.789474),(1,0.9) )) Units: Dmnl (30) internal influence N=0.32 Units: 1/Year [0,1,0.01]

212
(31) internal source=internal influence N*Potential Adopters P*organization related factors influence*technology related factors influence Units: member/Year (32) IS Budget=0.03 Units: Dmnl [0,1,0.01] (33) m1="H organizational readiness (T)" Units: Dmnl (34) m2=H relative advantage Units: Dmnl (35) m3=TP relative advantage Units: Dmnl (36) m4=TP readiness*complexity and interoperability issues Units: Dmnl (37) m5=industry pressure Units: Dmnl (38) m6=government intervention*manufacturer influence Units: Dmnl (39) manufacturer influence = WITH LOOKUP (manufacturers,([(0,0)-(7000,1)],(0,0),(0,0),(214.067,0.267544),(1000,0.4),(3000,0.5),(3831.8,0.605263),(4067.28,0.653509),(4752.29,0.701754),(6000,0.780702),(7000,0.9))) Units: Dmnl (40) manufacturers = WITH LOOKUP (Time,([(0,0)-(50,6000)],(0,0),(1,5),(2,150), (4,160),(10,236),(15,368),(20,1000),(25,2000),(32,3631.58),(50,6000) )) Units: 1 (41) organization related factors influence=((m1)+m2)/2 Units: 1 (42) P initial=2500 Units: member [0,3000,150] (43) Potential Adopters P= INTEG (-Hospital AR,P initial) Units: member (44) process fraction = WITH LOOKUP (H IdS Use,([(0,0)-(1,0.6)],(0,0),(0.1,0.005),(0.2,0.01), (0.3,0.1),(0.4,0.15),(0.5,0.2),(0.6,0.3),(0.7,0.4),(1,0.5) )) Units: Dmnl

213
(45) productivity improvement factor = WITH LOOKUP (H IdS Use,([(0,0)-(1,0.8)],(0,0),(0,0), (0.1,0.02),(0.251765,0.116726),(0.348235,0.182206),(0.404706,0.239146),(0.458824,0.301779), (0.496471,0.335943),(0.536471,0.387189),(0.6,0.449822),(0.649412,0.492527), (0.703529,0.543772),(0.762353,0.600712),(0.858824,0.680427),(1,0.8) )) Units: 1 (46) technology providers = WITH LOOKUP (Time,([(0,0)-(50,80)],(0,0),(0,0),(0,0),(1,1),(3,2),(5,4),(10,8),(13,13),(18,23),(27,42),(40,60),(50,70) )) Units: member (47) technology related factors influence=(m3*m4) Units: 1 (48) Total Population N=Adopters A+Potential Adopters P Units: member (49) TP expected benefits=H expected costs Units: dollars/Year (50) TP expected costs = WITH LOOKUP (H IdS Use,([(0,0)-(1,1e+006)],(0,1e+006), (0.0447059,832740),(0.202353,302491),(0.334118,231317),(0.44,199288),(0.607059,160142), (0.717647,131673),(0.809412,124555),(0.882353,124555),(1,100000) )) Units: dollars/Year (51) TP expected gain=TP expected benefits-TP expected costs Units: dollars/Year (52) TP readiness = WITH LOOKUP (technology providers,([(0,0)-(70,6)],(0,0),(5,1),(10,1.5),(18.4098,2.18421),(30,3),(40,3.5),(50,4),(60,4.5),(70,5) )) Units: Dmnl (53) TP relative advantage= WITH LOOKUP (TP expected gain,([(0,0)-(2e+006,1)],(0,0),(10000,0.1),(20000,0.1),(50000,0.2),(100000,0.3),(200000,0.4), (564706,0.654804),(1.00235e+006,0.779359),(2e+006,0.9) )) Units: 1 C.3 Formulation description
C.3.1 Graphical functions (by model component)
The graphical functions are the main model assumptions regarding the main variables within the
simulation model. For each graphical function different function shapes and distributions were
tested following the steps described in Section 5.2. For example the range for the graphical

214
functions associated with the manufacturer population as well as distributors and technology
providers was supported by industry reports from HIDA.
Component 1 graphical functions (40) manufacturers = WITH LOOKUP (Time,([(0,0)-(50,6000)],(0,0),(1,5),(2,150), (4,160),(10,236),(15,368),(20,1000),(25,2000),(32,3631.58),(50,6000) )) Units: 1 (9) distributors and GPOs = WITH LOOKUP (Time,([(0,0)-(50,200)],(0,0),(0,0),(1,5),(3,23),(11,89),(15,120),(20,150),(25,160),(30,170),(40,180),(50,190) )) Units: 1 [0,?] (10) distributors and GPOs influence = WITH LOOKUP (distributors and GPOs,([(0,0)-(200,1)],(0,0),(1,0.2),(14.6789,0.5),(50,0.7),(100,0.75),(150,0.8),(200,0.9) )) Units: Dmnl (29) industry pressure = WITH LOOKUP (distributors and GPOs influence,([(0,0)(1,1)],(0,0), (0.189602,0.307018),(0.3,0.45),(0.400612,0.539474),(0.5,0.7),(0.620795,0.789474),(1,0.9) )) Units: Dmnl (39) manufacturer influence = WITH LOOKUP (manufacturers,([(0,0)-(7000,1)],(0,0),(0,0),(214.067,0.267544),(1000,0.4),(3000,0.5),(3831.8,0.605263),(4067.28,0.653509),(4752.29,0.701754),(6000,0.780702),(7000,0.9))) Units: Dmnl Component 2 graphical functions (46) technology providers = WITH LOOKUP (Time,([(0,0)-(50,80)],(0,0),(0,0),(0,0),(1,1),(3,2),(5,4),(10,8),(13,13),(18,23),(27,42),(40,60),(50,70) )) Units: member (50) TP expected costs = WITH LOOKUP (H IdS Use,([(0,0)-(1,1e+006)],(0,1e+006), (0.0447059,832740),(0.202353,302491),(0.334118,231317),(0.44,199288),(0.607059,160142), (0.717647,131673),(0.809412,124555),(0.882353,124555),(1,100000) )) Units: dollars/Year (52) TP readiness = WITH LOOKUP (technology providers,([(0,0)-(70,6)],(0,0),(5,1),(10,1.5),(18.4098,2.18421),(30,3),(40,3.5),(50,4),(60,4.5),(70,5) )) Units: Dmnl

215
(53) TP relative advantage= WITH LOOKUP (TP expected gain,([(0,0)-(2e+006,1)],(0,0),(10000,0.1),(20000,0.1),(50000,0.2),(100000,0.3),(200000,0.4), (564706,0.654804),(1.00235e+006,0.779359),(2e+006,0.9) )) Units: 1 Component 3 graphical functions (44) process fraction = WITH LOOKUP (H IdS Use,([(0,0)-(1,0.6)],(0,0),(0.1,0.005),(0.2,0.01), (0.3,0.1),(0.4,0.15),(0.5,0.2),(0.6,0.3),(0.7,0.4),(1,0.5) )) Units: Dmnl (23) H relative advantage= WITH LOOKUP (H expected gain,([(0,0)-(1.5e+007,1)],(0,0),(94117.6,0.0106762),(845066,0.170819),(1.2676e+006,0.252669),(2.51172e+006,0.423488),(3.8028e+006,0.594306),(4.9765e+006,0.715302),(6.10325e+006,0.790036),(7.48822e+006,0.882562),(8.6854e+006,0.939502),(9.97647e+006,0.95),(1.5e+007,1) )) Units: Dmnl (45) productivity improvement factor = WITH LOOKUP (H IdS Use,([(0,0)-(1,0.8)],(0,0),(0,0), (0.1,0.02),(0.251765,0.116726),(0.348235,0.182206),(0.404706,0.239146),(0.458824,0.301779), (0.496471,0.335943),(0.536471,0.387189),(0.6,0.449822),(0.649412,0.492527), (0.703529,0.543772),(0.762353,0.600712),(0.858824,0.680427),(1,0.8) )) Units: 1 Component 4 graphical functions (20) H IdS Use = WITH LOOKUP (adopter influence,([(0,0)-(1,1)],(0,0),(0,0),(0,0),(0.25,0.3),(0.5,0.5),(0.7,0.6),(1,1) )) Units: Dmnl C.3.2 Parameters (by model component)
The parameters are the simulation model initial conditions. For each parameter different range
values were tested following the steps described in Section 5.2. The parameters were developed
based on industry reports and information extracted from the 2008 HIMSS DB. For example the
information associated to the hospital revenue and operating expenses extracted from the 2008
HIMSS DB was used to develop parameters (5) and (6). Technology penetration data also
extracted from this database was used to estimate the value of the parameter (25). The
216
parameters within Component 4 (C4) were based on previous results from Stage 1 and
information provided in AHA reports.
Component 1 (15) government intervention=1 Units: 1 [0,10,1] Component 2 (8) complexity and interoperability issues=1 Units: Dmnl [0,3,1] Component 3 (5) average H operating expenses=2.62364e+008 Units: dollars/Year (6) average H revenue=2.7e+008 Units: dollars/Year [0,2e+009,1e+006] (7) awareness=1 Units: Dmnl [0,10,1] (25) H technology penetration factor=0.4 Units: Dmnl [0,1,0.05] (27) IdS factor=0.05 Units: Dmnl [0,1,0.01] (28) increase SCM expending=0.01 Units: 1/Year [0,1,0.01] (32) IS Budget=0.03 Units: Dmnl [0,1,0.01] Component 4 (13) external influence N=0.02 Units: 1/Year [0,1,0.01] (30) internal influence N=0.32 Units: 1/Year [0,1,0.01]

217
(01) A initial=500 Units: member [0,3000,150] (42) P initial=2500 Units: member [0,3000,150]
218
Appendix D. Sensitivity analysis results
D1. Sensitivity analysis tests
The sensitivity analysis was developed based on a series of tests. Four tests were initially
developed and a fifth one completed the set. The steps followed to perform the sensitivity
analysis tests are described in Section 5.3.3 and include the following tests:
Test 1, sensitivity analysis test for parameters within group 1, remaining parameters were
kept unchanged.
Test 2, sensitivity analysis test for parameters within group 2, remaining parameters were
kept unchanged.
Test 3, sensitivity analysis test for parameters within group 3, remaining parameters were
kept unchanged.
Test 4, sensitivity analysis test for parameters within group 4, remaining parameters were
kept unchanged.
Test 5, sensitivity analysis test for parameters within groups 1,2 and 3 remaining
parameters were kept unchanged.
D.2 Vensim sensitivity analysis output
The results for the Adopters A (output variable) for tests 1, 2 and 3 are shown in the following
figures.

219
Figure D.2.1 Sensitivity analysis graph test 1
Figure D.2.2 Sensitivity analysis graph test 2

220
Figure D.2.3 Sensitivity analysis graph test 3
D.3 Correlation Coefficient plots
The data associated to each one of the sensitivity analysis tests was exported to MSO Excel in
order to develop the CC plots. The CC plots for both output measures, the adoption rate and the
adopter population are included in this section.

221
Figure D.3.1 Correlation Coefficient plot for Adopter population – test 1
Figure D.3.2 Correlation Coefficient plot for Adoption Rate – test 1
-1
-0.8
-0.6
-0.4
-0.2
E-16
0.2
0.4
0.6
0.8
1
1 2 3 4 5 6 7 8 9 10 11 12 13 14 15 16 17 18 19 20 21 22 23 24 25 26 27 28 29 30Save Periods of the Simulation
Correlation Coefficients
awareness complexity and interoperability issues government intervention
-1
-0.8
-0.6
-0.4
-0.2
0
0.2
0.4
0.6
0.8
1
1 2 3 4 5 6 7 8 9 10 11 12 13 14 15 16 17 18 19 20 21 22 23 24 25 26 27 28 29 30
Save Periods of the Simulation
Correlation Coefficients
awareness complexity and interoperability issues government intervention

222
Figure D.3.3 Correlation Coefficient plot for Adopter population – test 2
Figure D.3.4 Correlation Coefficient plot for Adoption Rate – test 2
-1
-0.8
-0.6
-0.4
-0.2
0
0.2
0.4
0.6
0.8
1
1 2 3 4 5 6 7 8 9 10 11 12 13 14 15 16 17 18 19 20 21 22 23 24 25 26 27 28 29 30Save Periods of the Simulation
Correlation Coefficients
average H operating expenses average H revenue IS Budget
-1
-0.8
-0.6
-0.4
-0.2
0
0.2
0.4
0.6
0.8
1
1 2 3 4 5 6 7 8 9 10 11 12 13 14 15 16 17 18 19 20 21 22 23 24 25 26 27 28 29 30Save Periods of the Simulation
Correlation Coefficients
average H operating expenses average H revenue IS Budget

223
Figure D.3.5 Correlation Coefficient plot for Adopter population – test 3
Figure D.3.6 Correlation Coefficient plot for Adoption Rate – test 3
-1
-0.8
-0.6
-0.4
-0.2
0
0.2
0.4
0.6
0.8
1
1 2 3 4 5 6 7 8 9 10 11 12 13 14 15 16 17 18 19 20 21 22 23 24 25 26 27 28 29 30
Save Periods of the Simulation
Correlation Coefficients
H technology penetration factor IdS factor increase SCM expending
-1
-0.8
-0.6
-0.4
-0.2
0
0.2
0.4
0.6
0.8
1
1 2 3 4 5 6 7 8 9 10 11 12 13 14 15 16 17 18 19 20 21 22 23 24 25 26 27 28 29 30Save Periods of the Simulation
Correlation Coefficients
H technology penetration factor IdS factor increase SCM expending
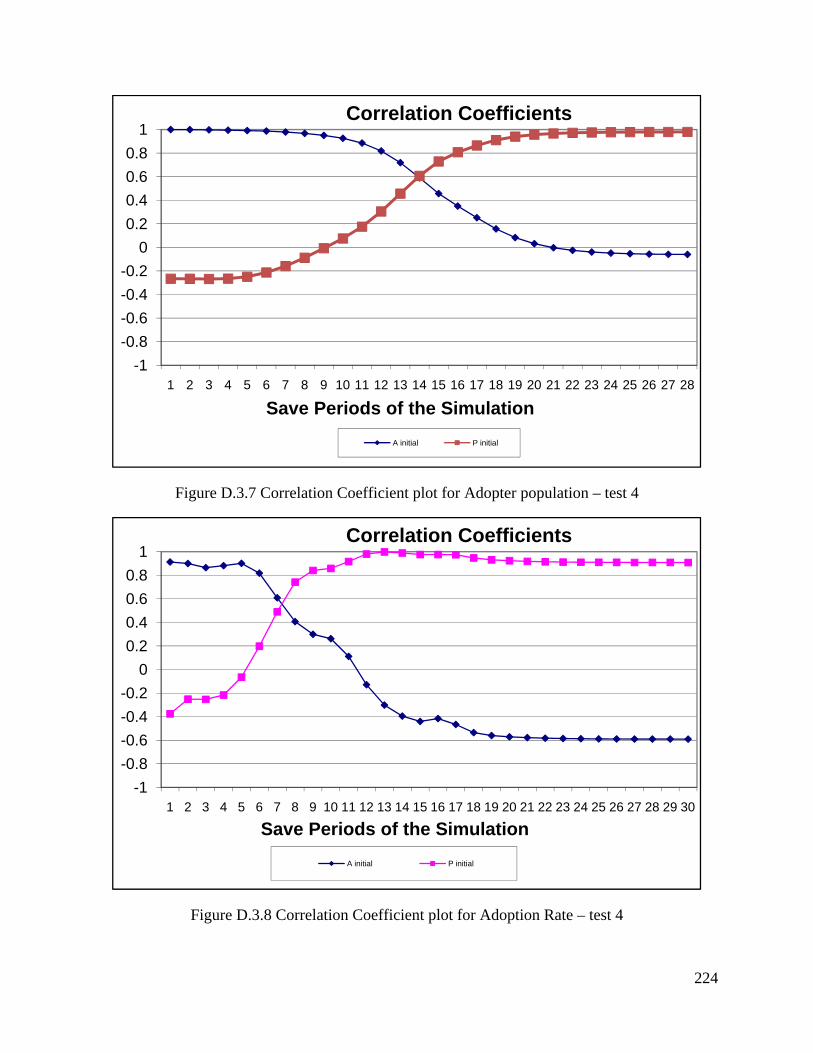
224
Figure D.3.7 Correlation Coefficient plot for Adopter population – test 4
Figure D.3.8 Correlation Coefficient plot for Adoption Rate – test 4
-1
-0.8
-0.6
-0.4
-0.2
0
0.2
0.4
0.6
0.8
1
1 2 3 4 5 6 7 8 9 10 11 12 13 14 15 16 17 18 19 20 21 22 23 24 25 26 27 28
Save Periods of the Simulation
Correlation Coefficients
A initial P initial
-1
-0.8
-0.6
-0.4
-0.2
0
0.2
0.4
0.6
0.8
1
1 2 3 4 5 6 7 8 9 10 11 12 13 14 15 16 17 18 19 20 21 22 23 24 25 26 27 28 29 30
Save Periods of the Simulation
Correlation Coefficients
A initial P initial

225
Figure D.3.9 Correlation Coefficient plot for Adopter population – test 5
Figure D.3.10 Correlation Coefficient plot for Adoption Rate – test 5
-1
-0.8
-0.6
-0.4
-0.2
0
0.2
0.4
0.6
0.8
1
1 2 3 4 5 6 7 8 9 10 11 12 13 14 15 16 17 18 19 20 21 22 23 24 25 26 27Save Periods of the Simulation
Correlation Coefficients
average H operating expenses average H revenue awareness
complexity and interoperability issues government intervention H technology penetration factor
IdS factor increase SCM expending IS Budget
-1
-0.8
-0.6
-0.4
-0.2
0
0.2
0.4
0.6
0.8
1
1 2 3 4 5 6 7 8 9 10 11 12 13 14 15 16 17 18 19 20 21 22 23 24 25 26 27 28Save Periods of the Simulation
Correlation Coefficients
average H operating expenses average H revenue awareness
complexity and interoperability issues government intervention H technology penetration factor
IdS factor increase SCM expending IS Budget

226
Appendix E. Policy design and testing
E.1 Policies proposed changes
Table E.1.1
Intervention Policy (Vensim
model) Proposed changes
Policy 1 IM Baserun initial
Policy1b Government intervention STEP function (5,2) and
change in manufacturer’s graphical function
Policy 2 IM Baserun initial
Policy2 Change in technology provider’s graphical function
Policy 3 IM Baserun initial
Policy3
H technology penetration factor = 0.8 Awareness = 3
IdS Factor = 0.06
Policy combination 1
IM Baserun initial Policy1b and 2
Includes changes for Policy 1b and Policy 2
Policy combination 2
IM Baserun initial Policy2 and 3
Includes changes for Policy 2 and Policy 3
Policy combination 3
IM Baserun initial Policy3 and 1b
Includes changes for Policy 3 and Policy 1b
Policy combination 4
IM Baserun initial combined policy
H technology penetration factor = 0.6 Awareness = 3
IdS factor = 0.07 Government intervention = 3
Complexity and interoperability issues = 2
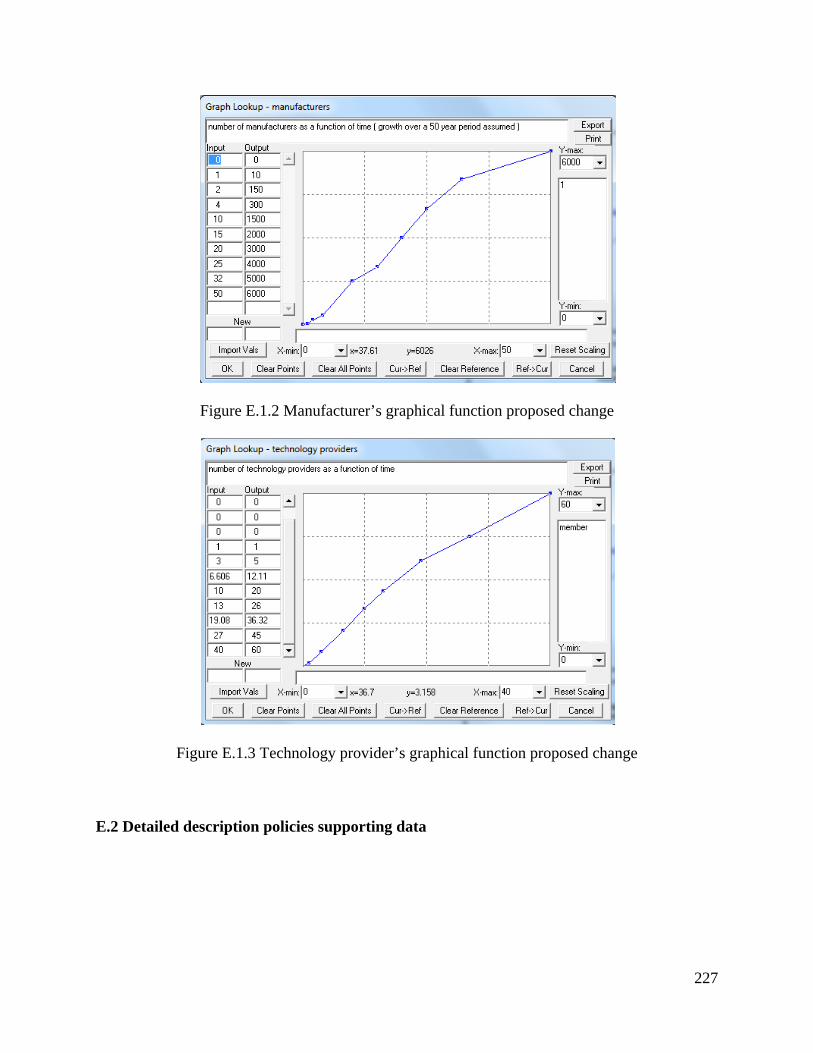
227
Figure E.1.2 Manufacturer’s graphical function proposed change
Figure E.1.3 Technology provider’s graphical function proposed change
E.2 Detailed description policies supporting data
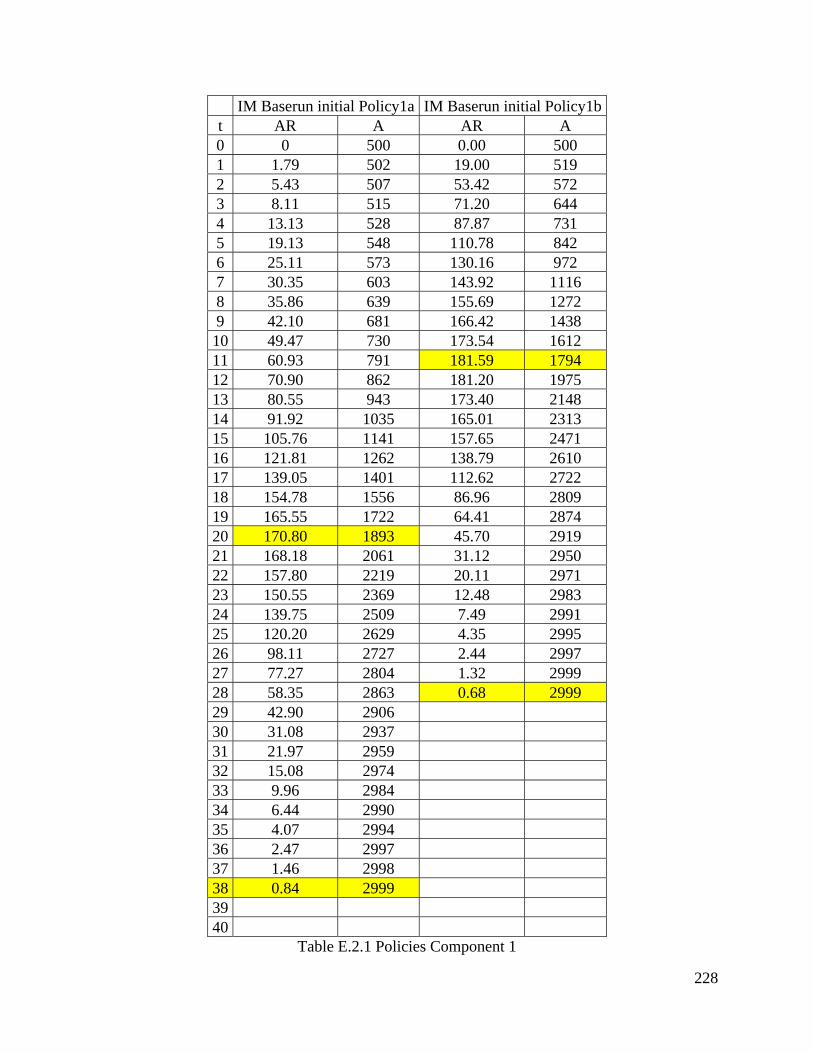
228
IM Baserun initial Policy1a IM Baserun initial Policy1b t AR A AR A 0 0 500 0.00 500 1 1.79 502 19.00 519 2 5.43 507 53.42 572 3 8.11 515 71.20 644 4 13.13 528 87.87 731 5 19.13 548 110.78 842 6 25.11 573 130.16 972 7 30.35 603 143.92 1116 8 35.86 639 155.69 1272 9 42.10 681 166.42 1438 10 49.47 730 173.54 1612 11 60.93 791 181.59 1794 12 70.90 862 181.20 1975 13 80.55 943 173.40 2148 14 91.92 1035 165.01 2313 15 105.76 1141 157.65 2471 16 121.81 1262 138.79 2610 17 139.05 1401 112.62 2722 18 154.78 1556 86.96 2809 19 165.55 1722 64.41 2874 20 170.80 1893 45.70 2919 21 168.18 2061 31.12 2950 22 157.80 2219 20.11 2971 23 150.55 2369 12.48 2983 24 139.75 2509 7.49 2991 25 120.20 2629 4.35 2995 26 98.11 2727 2.44 2997 27 77.27 2804 1.32 2999 28 58.35 2863 0.68 2999 29 42.90 2906 30 31.08 2937 31 21.97 2959 32 15.08 2974 33 9.96 2984 34 6.44 2990 35 4.07 2994 36 2.47 2997 37 1.46 2998 38 0.84 2999 39 40
Table E.2.1 Policies Component 1

229
IM Baserun initial
Policy2 IM Baserun initial
Policy3 t AR A AR A 0 0 500 0 500 1 19.16 519 32.62 533 2 48.22 567 56.77 589 3 73.65 641 75.31 665 4 95.32 736 111.84 777 5 122.77 859 157.71 934 6 146.48 1006 194.45 1129 7 169.5 1175 226.07 1355 8 197.06 1372 247.96 1603 9 224.39 1597 248.95 1852 10 234.47 1831 237.7 2089 11 227.19 2058 228.44 2318 12 206.78 2265 215.61 2533 13 191.7 2457 167.94 2701 14 163.2 2620 121 2822 15 124.91 2745 80.51 2903 16 89.45 2834 48.51 2951 17 61.17 2895 26.21 2978 18 40.37 2936 12.87 2990 19 25.8 2962 5.815 2996 20 15.88 2977 2.389 2999 21 9.552 2987 0.8868 3000 22 5.634 2993 23 3.261 2996 24 1.852 2998 25 1.033 2999 26 0.5653 2999 27 28 29 30
Table E.2.2 Policies Components 2 and 3
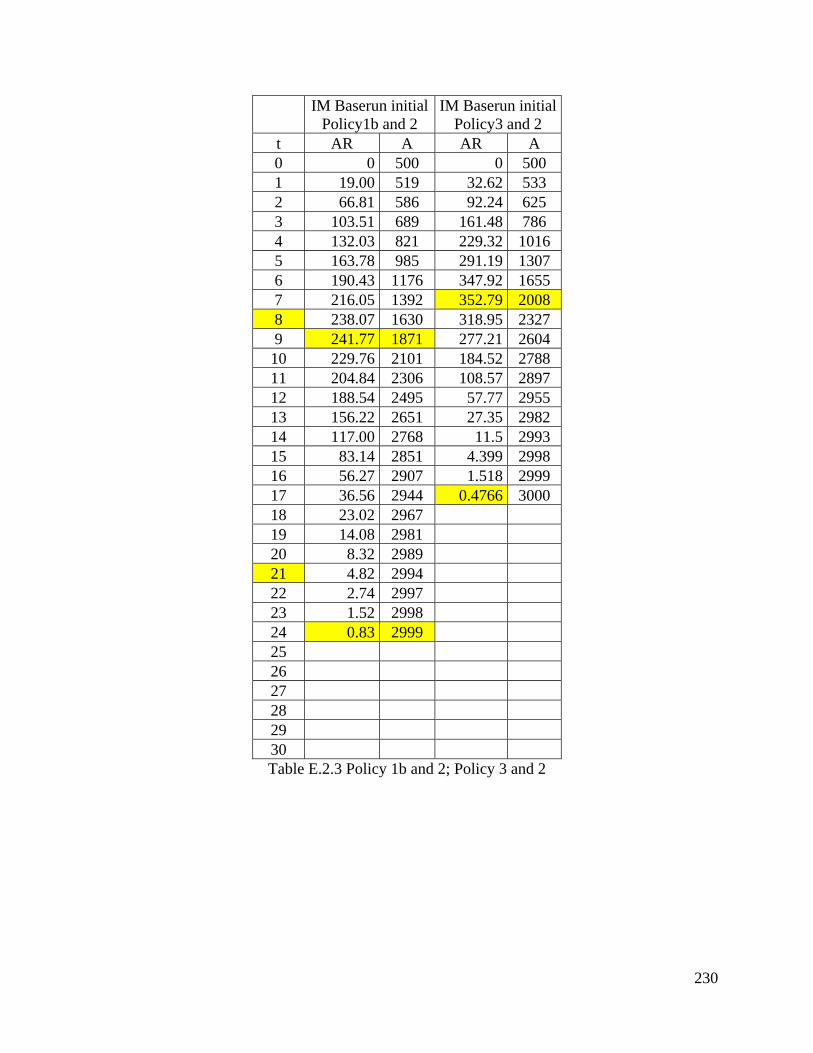
230
IM Baserun initial
Policy1b and 2 IM Baserun initial
Policy3 and 2 t AR A AR A 0 0 500 0 500 1 19.00 519 32.62 533 2 66.81 586 92.24 625 3 103.51 689 161.48 786 4 132.03 821 229.32 1016 5 163.78 985 291.19 1307 6 190.43 1176 347.92 1655 7 216.05 1392 352.79 2008 8 238.07 1630 318.95 2327 9 241.77 1871 277.21 2604 10 229.76 2101 184.52 2788 11 204.84 2306 108.57 2897 12 188.54 2495 57.77 2955 13 156.22 2651 27.35 2982 14 117.00 2768 11.5 2993 15 83.14 2851 4.399 2998 16 56.27 2907 1.518 2999 17 36.56 2944 0.4766 3000 18 23.02 2967 19 14.08 2981 20 8.32 2989 21 4.82 2994 22 2.74 2997 23 1.52 2998 24 0.83 2999 25 26 27 28 29 30 Table E.2.3 Policy 1b and 2; Policy 3 and 2

231
IM Baserun initial
Policy3 and 1b IM Baserun initial combined policy
t AR A AR A 0 0 500 0 500 1 32.46 532 40.66 541 2 75.27 608 81.05 622 3 104.20 712 112.24 734 4 144.81 857 176.24 910 5 190.73 1047 244.58 1155 6 230.70 1278 312.97 1468 7 258.63 1537 352.19 1820 8 262.87 1800 336.11 2156 9 250.31 2050 294.64 2451 10 226.34 2276 241.95 2693 11 217.14 2493 159.18 2852 12 175.81 2669 87.55 2939 13 127.82 2797 39.89 2979 14 87.75 2885 15.14 2994 15 55.22 2940 4.48 2999 16 31.40 2971 0.97 3000 17 16.03 2987 18 7.47 2995 19 3.20 2998 20 1.24 2999 21 0.43 3000 22 23 24 25 26 27 28 29 30
Table E.2.4 Policy 3 and 1b and combined policy
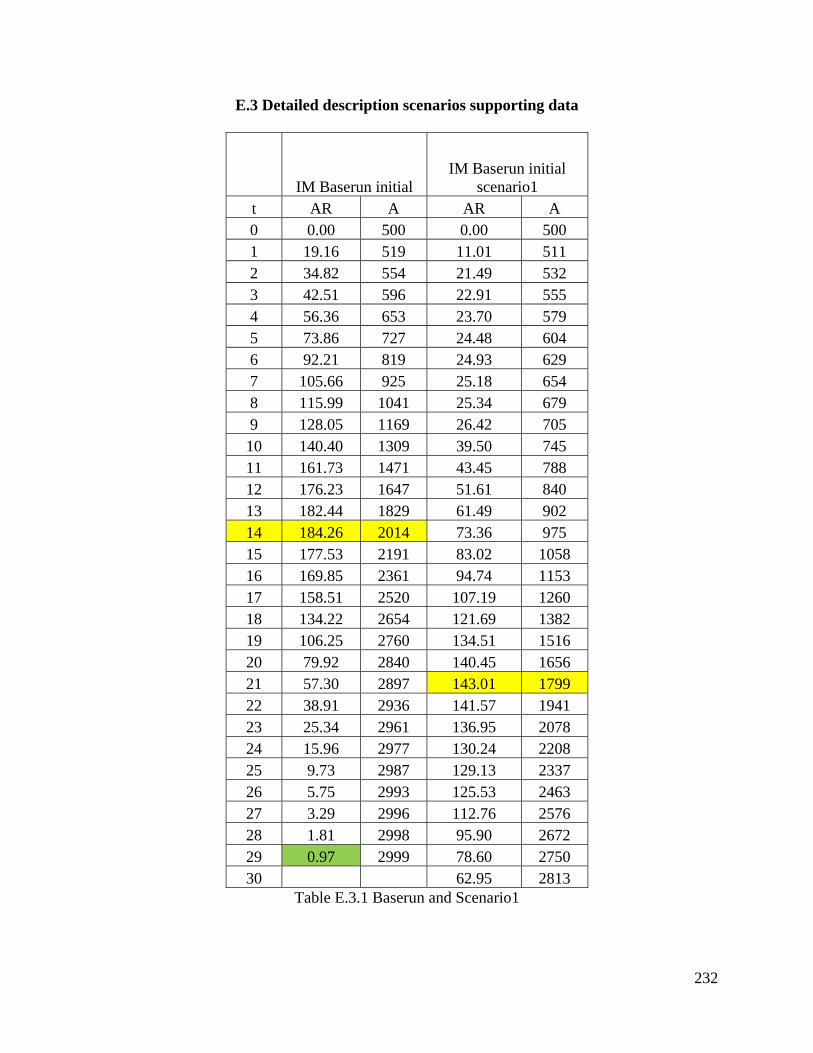
232
E.3 Detailed description scenarios supporting data
IM Baserun initial IM Baserun initial
scenario1 t AR A AR A 0 0.00 500 0.00 500 1 19.16 519 11.01 511 2 34.82 554 21.49 532 3 42.51 596 22.91 555 4 56.36 653 23.70 579 5 73.86 727 24.48 604 6 92.21 819 24.93 629 7 105.66 925 25.18 654 8 115.99 1041 25.34 679 9 128.05 1169 26.42 705 10 140.40 1309 39.50 745 11 161.73 1471 43.45 788 12 176.23 1647 51.61 840 13 182.44 1829 61.49 902 14 184.26 2014 73.36 975 15 177.53 2191 83.02 1058 16 169.85 2361 94.74 1153 17 158.51 2520 107.19 1260 18 134.22 2654 121.69 1382 19 106.25 2760 134.51 1516 20 79.92 2840 140.45 1656 21 57.30 2897 143.01 1799 22 38.91 2936 141.57 1941 23 25.34 2961 136.95 2078 24 15.96 2977 130.24 2208 25 9.73 2987 129.13 2337 26 5.75 2993 125.53 2463 27 3.29 2996 112.76 2576 28 1.81 2998 95.90 2672 29 0.97 2999 78.60 2750 30 62.95 2813
Table E.3.1 Baserun and Scenario1

233
IM Baserun initial
scenario2 IM Baserun initial
scenario3 t AR A AR A 0 0.00 500 0.00 500 1 19.63 520 29.87 530 2 36.11 556 54.36 584 3 45.64 601 77.08 661 4 63.94 665 127.09 788 5 89.86 755 200.68 989 6 120.87 876 264.27 1253 7 141.47 1018 312.91 1566 8 159.97 1177 333.62 1900 9 179.97 1357 318.32 2218 10 199.23 1557 291.53 2510 11 221.76 1778 240.73 2750 12 230.41 2009 142.92 2893 13 223.50 2232 69.56 2963 14 222.20 2455 27.14 2990 15 197.39 2652 7.99 2998 16 144.45 2796 1.68 3000 17 93.94 2890 0.23 3000 18 55.41 2946 19 29.67 2975 20 14.40 2990 21 6.34 2996 22 2.51 2999 23 0.91 3000 24 25 26 27 28 29 30
Table E.3.2 Scenario 2 and Scenario 3

234
IM Baserun initial
scenario4 IM Baserun initial
scenario5 t AR A AR A 0 0 500 0 500 1 39.33 539 11.01 511 2 68.94 608 21.49 532 3 95.08 703 22.91 555 4 148.75 852 23.70 579 5 212.52 1065 24.48 604 6 276.11 1341 24.93 629 7 325.70 1666 25.18 654 8 321.02 1987 25.34 679 9 287.45 2275 29.69 709 10 248.23 2523 86.25 795 11 193.98 2717 120.37 915 12 129.51 2847 183.31 1099 13 78.41 2925 245.69 1344 14 42.78 2968 323.26 1668 15 20.22 2988 375.66 2043 16 8.17 2996 355.85 2399 17 2.77 2999 331.12 2730 18 0.80 3000 177.89 2908 19 70.64 2979 20 17.95 2997 21 2.97 3000 22 0.30 3000 23 24 25 26 27 28 29 30
Table E.3.3 Scenario 4 and Scenario 5
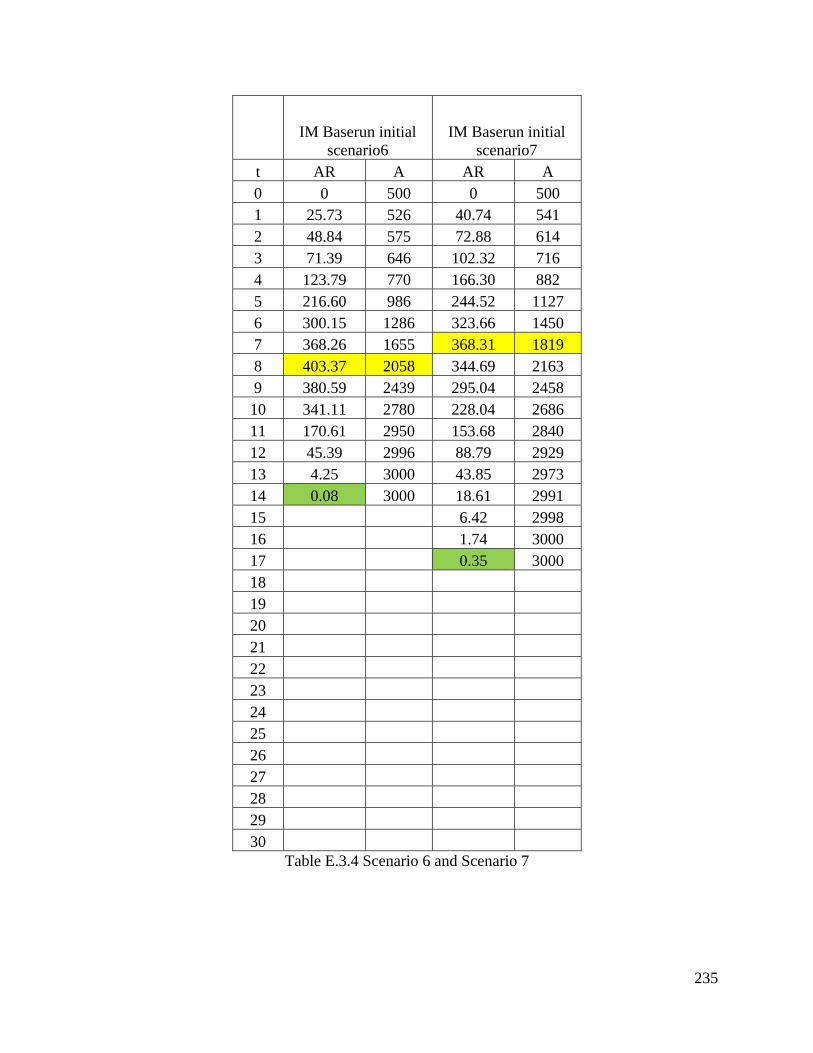
235
IM Baserun initial
scenario6 IM Baserun initial
scenario7 t AR A AR A 0 0 500 0 500 1 25.73 526 40.74 541 2 48.84 575 72.88 614 3 71.39 646 102.32 716 4 123.79 770 166.30 882 5 216.60 986 244.52 1127 6 300.15 1286 323.66 1450 7 368.26 1655 368.31 1819 8 403.37 2058 344.69 2163 9 380.59 2439 295.04 2458 10 341.11 2780 228.04 2686 11 170.61 2950 153.68 2840 12 45.39 2996 88.79 2929 13 4.25 3000 43.85 2973 14 0.08 3000 18.61 2991 15 6.42 2998 16 1.74 3000 17 0.35 3000 18 19 20 21 22 23 24 25 26 27 28 29 30
Table E.3.4 Scenario 6 and Scenario 7