Embed Size (px)
Citation preview

April 2003
Modeling the Effects of Food Handling Practices on the
Incidence of Foodborne Illness
Final Report Contract No. 223-01-2466, Task Order 1
Prepared for
Angela Ritzert FDA/CFSAN
5100 Paint Branch Parkway Room 2D036
Washington, DC 20740
Prepared by
David Kendall Catherine Viator
Shawn Karns Becky Durocher
RTI International Health, Social, and Economics Research
Research Triangle Park, NC 27709
RTI Project Number 08184.001

*RTI International is a trade name of Research Triangle Institute.
RTI Project Number 08184.001
Modeling the Effects of Food Handling Practices on the
Incidence of Foodborne Illness
Final Report Contract No. 223-01-2466, Task Order 1
April 2003
Prepared for
Angela Ritzert FDA/CFSAN
5100 Paint Branch Parkway Room 2D036
Washington, DC 20740
Prepared by
David Kendall Catherine Viator
Shawn Karns Becky Durocher
RTI International* Health, Social, and Economics Research
Research Triangle Park, NC 27709

iii
Contents
1. Introduction and Background 1-1
1.1 Purpose and Objectives of Task Order 1 .............................1-1
1.2 Overview of the Project Task Plan.......................................1-2
2. Overview of the Food Handling Practices Model 2-1
2.1 Description of the Conceptual Model..................................2-1
2.2 Mathematical Description of the Food Handling Practices Model ..................................................................2-4
2.3 Overview of the Operational Food Handling Practices Model ...............................................................................2-13
3. Calibration of the Food Handling Practices Model 3-1
3.1 Overview of Calibration Requirements................................3-1
3.2 Overview of Sources For Calibration...................................3-7 3.2.1 Secondary Data.......................................................3-7 3.2.2 Expert Elicitation .....................................................3-9
3.3 National Baseline Calibration Estimates ............................3-17 3.3.1 Source Contamination Stage..................................3-17 3.3.2 Retail and Household Contamination Stage...........3-23 3.3.3 Retail and Household Pathogen Control Stage.......3-30 3.3.4 Foodborne Illness Stage.........................................3-35
4. Using the Food Handling Practices Model 4-1
4.1 Calibrating Baseline and Change Scenarios.........................4-1 4.1.1 Defining a Baseline Scenario...................................4-2

iv
4.1.2 Calibrating a Baseline Scenario ...............................4-3 4.1.3 Defining a Change Scenario ....................................4-3 4.1.4 Calibrating for a Change Scenario ...........................4-4
4.2 Advanced Use of the FHPM................................................4-5
4.3 Potential Applications of the FHPM.....................................4-5
References R-1
Appendixes
Appendix A: Letter of Invitation, Background Information, and Instructions Sent to Panelists........................................ A-1
Appendix B: Summary of Statements from Panelists during the Teleconference Session for the Expert Elicitation ...........B-1
Appendix C: Parameters Estimated by Expert Elicitation ............. C-1
Appendix D: All Parameters Estimated for the National Baseline Calibration...........................................................D-1

v
Figures
Figure 2-1 Simplified Schematic of the FHPM...............................................2-3
Figure 3-1 Elicitation Form A: Retail Contamination Stage .........................3-12 Figure 3-2 Elicitation Form B: Retail Contamination Stage .........................3-14 Figure 3-3 Venn Diagram of Untreated and Medically Treated
Foodborne Illness.......................................................................3-37 Figure 3-4 Venn Diagram for Partitioning Medically Treated Foodborne
Illness ........................................................................................3-37

vi
Tables
Table 2-1 Variables and Parameters of the Food Handling Practices Model ..........................................................................................2-5
Table 2-2 Output of the FHPM Variable Name ..........................................2-14
Table 3-1 Parameters Requiring External Estimates for the FHPM.................3-2 Table 3-2 Categories of Food, Pathogens, Contributing Factors, and
Severities of Illness.......................................................................3-5 Table 3-3 Food Items, Pathogens, and Prevalence of Contamination for
which No Annual Consumption Data Are Available ..................3-20

1-1
Introduction and 1 Background
In September 2001, the Food and Drug Administration’s Center for Food Safety and Applied Nutrition (FDA/CFSAN) contracted with RTI to develop a quantitative model that FDA can use to estimate the effects of retail and household food handling practices on the incidence of foodborne illness (FBI). RTI conducted this work under Contract No. 233-01-2466, Task Order 1. This final report documents activities and results of Task Order 1.
1.1 PURPOSE AND OBJECTIVES OF TASK ORDER 1 The purpose of Task Order 1, Modeling the Effects of Food Handling Practices on the Incidence of Foodborne Illness, is to develop quantitative methods for estimating potential public health benefits associated with changes in food handling practices in retail and household establishments. For this purpose, we define public health benefits to be potentially avoidable cases of FBI that could be expected, given implemented changes in food handling practices. To achieve this purpose, FDA defined the following objectives for the project:
Z develop quantitative methods to estimate the potential cases of foodborne illness that could be avoided if all retail food service establishments and households followed safe food handling and preparation practices,
Z gather the experimental or secondary data that are available to quantify the relationships between FBI and risky food handling and preparation practices in retail food service establishments and households,

Modeling the Effects of Food Handling Practices on the Incidence of Foodborne Illness
1-2
Z conduct a demonstration case to estimate the potential reduction in annual cases of FBI resulting from a change in safe food handling and preparation practices, and
Z identify additional data that would be necessary to estimate reductions in FBI associated with changes in food handling and preparation practices.
1.2 OVERVIEW OF THE PROJECT TASK PLAN To begin the project, RTI met with members of the FDA project team in October 2001 in FDA’s Washington, DC, offices to discuss project objectives and establish a schedule for accomplishing each objective of Task Order 1. RTI and FDA also conducted several discussions by telephone and e-mail throughout November and December 2001 to clarify FDA’s needs and requirements for Task Order 1. Based on those discussions, RTI prepared and FDA approved a final work plan, which comprised the following five tasks:
Z Task 1—Manage Project Tasks and Deliverables
Z Task 2—Estimate Baseline Foodborne Illnesses for a Demonstration Case
Z Task 3—Conduct Analysis for a Demonstration Case
Z Task 4—Elicit Expert Opinion on Results of the Demonstration Case
Z Task 5—Develop the Stochastic Simulation Model and Documentation
FDA established the original project time line for Task Order 1 to begin October 2001 and conclude in October 2002. Deliverables for the project were the following:
Z final work plan;
Z first draft report;
Z second draft report;
Z final model, data, and user’s guide; and
Z final report.
RTI and FDA worked closely together to define an appropriate demonstration case study for the project and to identify data that would be sufficient to conduct such a case study. After expending considerable time and effort exploring the potential with state public health departments for using state-level data for the case study, FDA and RTI reluctantly concluded that no state-level data

Section 1 — Introduction and Background
1-3
were available that could support the planned demonstration case study. Because of project delays incurred exploring possibilities for the demonstration case study, RTI and FDA agreed to a no-cost extension of the project time line through April 2003. FDA and RTI also agreed to abandon plans for a demonstration case study, reallocating project resources to developing the model, estimating an initial baseline calibration of the model, and conducting an expert elicitation to develop data for the model that could not be found in secondary sources.
This final report documents activities and results of Task Order 1. Section 1 provides an introduction and overview of the project RTI conducted under Task Order 1. Section 2 provides a description of the Food Handling Practices Model (FHPM) that RTI designed and developed for the project. Section 3 describes how RTI estimated parameters for an initial national baseline calibration of the FHPM. Section 4 describes how to use the FHPM.


2-1
Overview of the Food Handling 2 Practices Model
Using Monte Carlo simulation methods, the FHPM simulates logical sequences of events required for the occurrence of FBI. First, food must become contaminated with one or more pathogens by the final manufacturing source, by retail establishments, or by households. Second, pathogens contaminating food must survive and multiply to levels sufficient to cause illness in humans. Third, ingestion of pathogen-contaminated food must cause a noticeable illness.
2.1 DESCRIPTION OF THE CONCEPTUAL MODEL The FHPM is a stochastic simulation model that allows users to estimate changes in annual cases of FBI, given one or more changes in the prevalence of food handling practices used in retail food establishments or in households. Food handling practices represented in the model are contributing factors of two types:
Z contributing factors that may contaminate food and
Z contributing factors that may allow survival and growth of pathogens in food.
The FHPM operates by simulating, tracking, and counting servings of food that become contaminated with one or more pathogens, followed by survival and growth of pathogens, followed by ingestion that causes noticeable illness. The model does not track or count servings of food that are not contaminated with pathogens.
The FHPM includes four modeling stages organized in two distinct channels, as summarized below. Each modeling stage includes several random variables associated with the incidence of FBI.

Modeling the Effects of Food Handling Practices on the Incidence of Foodborne Illness
2-2
I. Source Contamination Stage (10 random variables)
II. Contamination Stage: Contributing Factors that May Contaminate Food
1) Retail channel (18 random variables)
2) Household channel (10 random variables)
III. Pathogen Control Stage: Contributing Factors that May Allow Survival and Growth of Pathogens in Food
1) Retail channel (18 random variables)
2) Household channel (10 random variables)
IV. Foodborne Illness Stage
1) Retail channel (4 random variables)
2) Household channel (4 random variables)
Figure 2-1 provides a simplified schematic of relationships among the source contamination stage and the retail and household channels. The retail channel simulates a sequence of events resulting in FBI for food prepared by retail or institutional food service establishments. The household channel simulates a sequence of events resulting in FBI for food prepared by households, after it is purchased from retail food stores or acquired from noncommercial sources such as home gardens, direct farm sales, hunting, or fishing.
In the FHPM, retail food stores are part of the retail channel. The retail and household channels are linked, because households purchase about 75 percent (by weight) of their food from retail food stores. Because cases of FBI can occur through either channel and the two channels interact, the FHPM includes both, even though FDA’s primary regulatory responsibilities focus on the retail channel.
Each of the four modeling stages in Figure 2-1 comprises one or more binomial probability distributions. In the actual FHPM, each modeling stage includes several binomial random variables to incorporate multiple food category/pathogen combinations, multiple retail establishment types, multiple household types, and multiple contributing factors. Mathematically, the FHPM is a series of cascading binomial random variables, each of which counts servings of pathogen-contaminated food. The binomial random variables are interlinked according to logical sequences of events that are necessary but not sufficient to produce cases of FBI. Note

Section 2 — Overview of the Food Handling Practices Model
2-3
Figure 2-1. Simplified Schematic of the FHPM
SC = Source ContaminationRC = Retail ContaminationHC = Household Contamination
PCDR = Retail Pathogen Control
FBI = Ingestion Causes Illness
X1~B(N, p1) OR AND AND
OR AND AND
FBIR Ingestion Causes Illness
Retail Channel
RC Contributing Factors that Contaminate
X2~B(c[N-X1], p2)
X3~B([1-c][N-X1]+[1-b][cN-X1], p3)
X4~B(cX1+bX2, p4)
X5~B([1-c]X1+[1-b]X2+X3, p5)
X6~B(X4, p6)
X7~B(X5, p7)
HC Contributing Factors that Contaminate
PCDRContributing Factors that Promote Survival & Growth
PCDRContributing Factors that Promote Survival & Growth
FBIH Ingestion Causes Illness
Household Channel
SC Final
Manufacturing Source
PCDH = Household Pathogen Control
in Figure 2-1, for example, that the random variable X1 appears in the term expression for the first parameter of the distributions of the random variables X2, X3, X4 and X5.
In summary, the FHPM captures the potential for contamination of food with pathogens by the final manufacturing source, by retail food establishments, and by households. Contamination by retail establishments and households occur as a result of handling practices such as inappropriate bare-hand contact with ready-to-eat (RTE) food and inappropriate sanitation or cleaning of cutting boards or other cutting surfaces. Once food is contaminated, pathogens in the food may multiply to levels sufficient to cause human illness, if growth is allowed by handling practices such as inappropriate time and temperature for hot holding and inappropriate time and temperature for cold holding, or if pathogens in food are not destroyed because of inappropriate time and temperature for heating. If pathogens are not controlled or destroyed, ingestion of the food may cause human illness of varying levels of severity or even death.

Modeling the Effects of Food Handling Practices on the Incidence of Foodborne Illness
2-4
Associated with each stage of the FHPM is a set of parameters that characterize the distributions of binomial random variables in the model. For example, in the source contamination stage, X1~B(N, p1), N is annual servings of food consumed and the parameter p1 denotes the probability that a serving of food is contaminated with a pathogen at the final manufacturing source. The random variable X1 counts the annual servings of food that are contaminated at the final manufacturing source, of N annual servings of food consumed. The two parameters, N and p1, completely describe the distribution of the binomial random variable X1. The binomial random variable is appropriate in the FHPM because in each stage of the model, necessary events required to produce a case of FBI either occur or they do not. The FHPM does not address variation in the levels of pathogen contamination. Section 2.2 provides a complete mathematical specification of the FHPM.
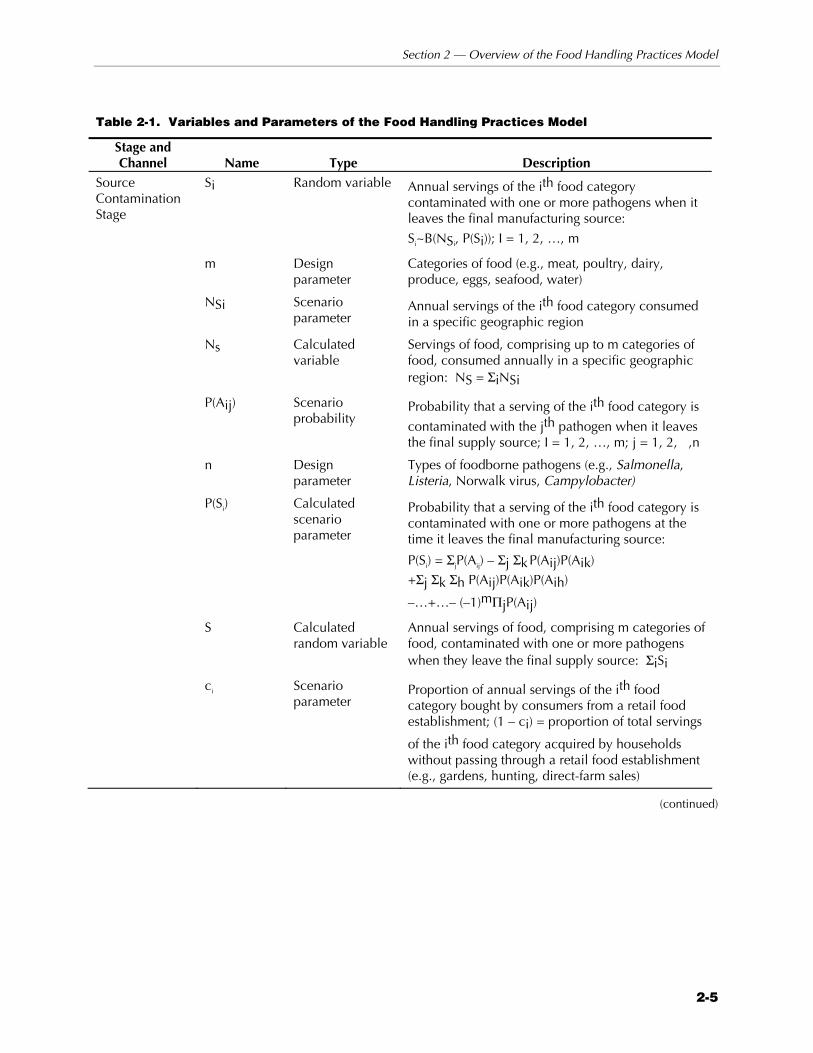
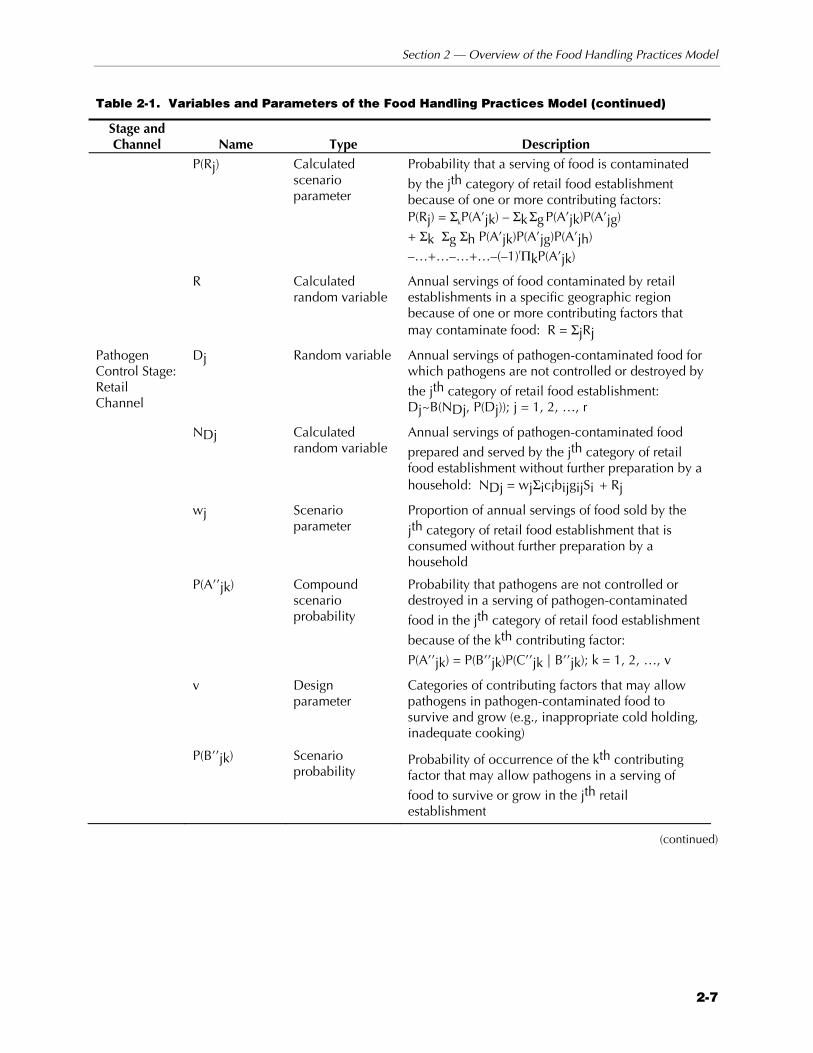
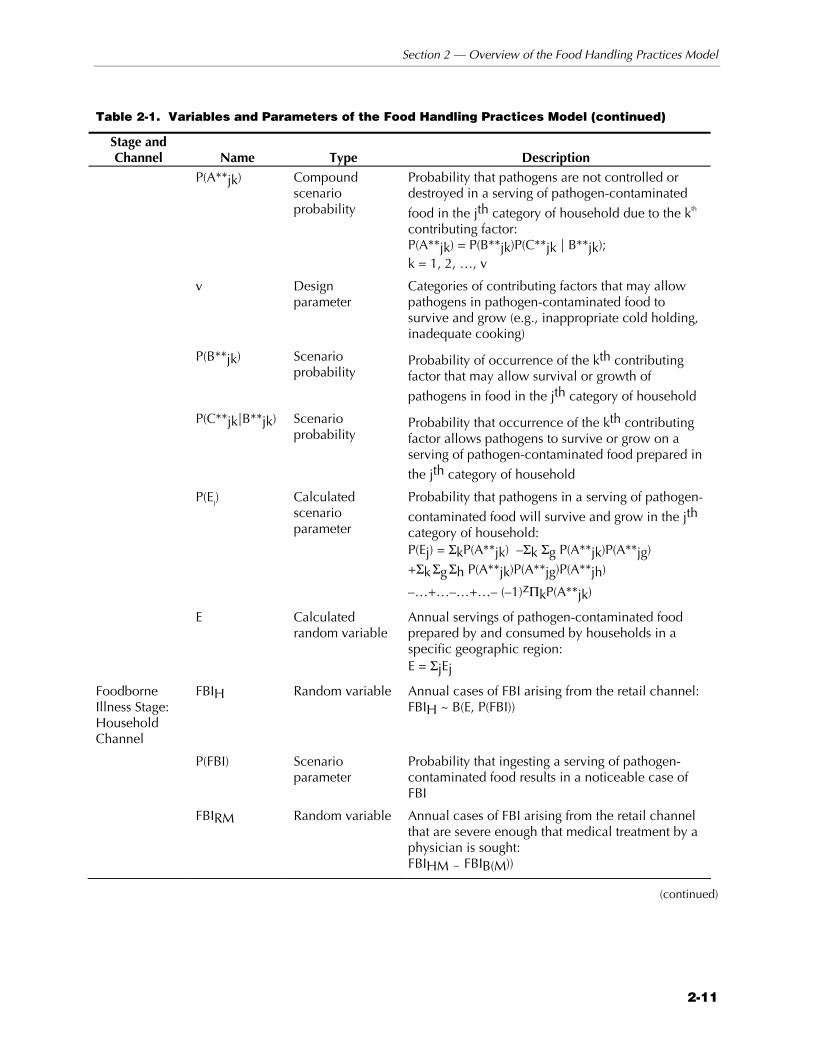
2.2 MATHEMATICAL DESCRIPTION OF THE FOOD HANDLING PRACTICES MODEL In this section, we describe the FHPM mathematically. Table 2-1, which is organized by stage and channel of the model, identifies and defines each variable and parameter of the FHPM.
Random variables in the model count servings of pathogen-contaminated food at each stage of the model. Design parameters are simply maximum values for index variables such as i, j, and k. For example, in the source contamination stage, “m” is the number of food categories included in the FHPM; in the retail contamination stage, “r” is the number of categories of retail establishments in the model. Scenario parameters and scenario probabilities are inputs that users must specify to define a baseline scenario or a change scenario. Calculated scenario parameters are values the FHPM calculates internally, based on scenario parameters and scenario probabilities specified by the user. Section 2.3 provides an overview of the operation of the FHPM.
Section 2 — Overview of the Food Handling Practices Model
2-5
Table 2-1. Variables and Parameters of the Food Handling Practices Model
Stage and Channel Name Type Description
Source Contamination Stage
Si Random variable Annual servings of the ith food category contaminated with one or more pathogens when it leaves the final manufacturing source:
Si~B(NSi, P(Si)); I = 1, 2, …, m
m Design parameter
Categories of food (e.g., meat, poultry, dairy, produce, eggs, seafood, water)
NSi Scenario parameter
Annual servings of the ith food category consumed in a specific geographic region
Ns Calculated variable
Servings of food, comprising up to m categories of food, consumed annually in a specific geographic region: NS = ΣiNSi
P(Aij) Scenario probability
Probability that a serving of the ith food category is
contaminated with the jth pathogen when it leaves the final supply source; I = 1, 2, …, m; j = 1, 2, ,n
n Design parameter
Types of foodborne pathogens (e.g., Salmonella, Listeria, Norwalk virus, Campylobacter)
P(Si) Calculated scenario parameter
Probability that a serving of the ith food category is contaminated with one or more pathogens at the time it leaves the final manufacturing source:
P(Si) = ΣjP(Aij) – Σj Σk P(Aij)P(Aik) +Σj Σk Σh P(Aij)P(Aik)P(Aih)
–…+…– (–1)mΠjP(Aij)
S Calculated random variable
Annual servings of food, comprising m categories of food, contaminated with one or more pathogens when they leave the final supply source: ΣiSi
ci Scenario parameter
Proportion of annual servings of the ith food category bought by consumers from a retail food establishment; (1 – ci) = proportion of total servings
of the ith food category acquired by households without passing through a retail food establishment (e.g., gardens, hunting, direct-farm sales)
(continued)

Modeling the Effects of Food Handling Practices on the Incidence of Foodborne Illness
2-6
Table 2-1. Variables and Parameters of the Food Handling Practices Model (continued)
Stage and Channel Name Type Description
Contamination Stage: Retail Channel
Rj Random variable Annual servings of food contaminated by the jth category of retail food establishment: Rj~B(NRj, P(Rj)); j=1, 2, …, r
r Design parameter
Categories of retail establishments (e.g., restaurants, hospitals, school cafeterias)
NRj Calculated scenario parameter
Annual servings of food served or sold by the jth category of retail food establishment: NRj = wjΣicibijgij(NSi – Si)
bij Scenario parameter
Proportion of annual servings of the ith food category that are served or sold to consumers by
the jth category of retail food establishment; Σjbij = 1
gij Scenario parameter
Proportion of annual servings of the ith food
category bought by consumers from the jth category of retail food establishment for further preparation by households, which have been further handled or repackaged by the retail establishment
wj Scenario parameter
Proportion of annual servings of food sold by the
jth category of retail food establishment that is consumed without further preparation by a household
NR Calculated variable
Annual servings of food prepared and served or sold by retail establishments comprising r categories of retail food service establishments in a specific geographic region: NR = ΣjNRj
P(A’jk) Compound scenario probability
Probability that a serving of food is contaminated in
the jth category of retail food establishment due to
the kth contributing factor that may contaminate food: P(A’jk)=P(B’jk)P(C’jk | B’jk); k=1, 2, …, f
f Design parameter
Categories of contributing factors that may contaminate food with pathogens (e.g., poor hygienic or sanitation practices)
P(B’jk) Scenario probability
Probability of occurrence of the kth contributing
factor that may contaminate food in the jth retail establishment
P(C’jk|B’jk) Scenario probability
Probability that an occurrence of the kth contributing factor contaminates a serving of food
in the jth category of retail establishment
(continued)
Section 2 — Overview of the Food Handling Practices Model
2-7
Table 2-1. Variables and Parameters of the Food Handling Practices Model (continued)
Stage and Channel Name Type Description
P(Rj) Calculated scenario parameter
Probability that a serving of food is contaminated
by the jth category of retail food establishment because of one or more contributing factors: P(Rj) = ΣkP(A’jk) – Σk Σg P(A’jk)P(A’jg) + Σk Σg Σh P(A’jk)P(A’jg)P(A’jh) –…+…–…+…–(–1)rΠkP(A’jk)
R Calculated random variable
Annual servings of food contaminated by retail establishments in a specific geographic region because of one or more contributing factors that may contaminate food: R = ΣjRj
Pathogen Control Stage: Retail Channel
Dj Random variable Annual servings of pathogen-contaminated food for which pathogens are not controlled or destroyed by
the jth category of retail food establishment: Dj~B(NDj, P(Dj)); j = 1, 2, …, r
NDj Calculated random variable
Annual servings of pathogen-contaminated food
prepared and served by the jth category of retail food establishment without further preparation by a household: NDj = wjΣicibijgijSi + Rj
wj Scenario parameter
Proportion of annual servings of food sold by the
jth category of retail food establishment that is consumed without further preparation by a household
P(A’’jk) Compound scenario probability
Probability that pathogens are not controlled or destroyed in a serving of pathogen-contaminated
food in the jth category of retail food establishment
because of the kth contributing factor:
P(A’’jk) = P(B’’jk)P(C’’jk | B’’jk); k = 1, 2, …, v
v Design parameter
Categories of contributing factors that may allow pathogens in pathogen-contaminated food to survive and grow (e.g., inappropriate cold holding, inadequate cooking)
P(B’’jk) Scenario probability
Probability of occurrence of the kth contributing factor that may allow pathogens in a serving of
food to survive or grow in the jth retail establishment
(continued)

Modeling the Effects of Food Handling Practices on the Incidence of Foodborne Illness
2-8
Table 2-1. Variables and Parameters of the Food Handling Practices Model (continued)
Stage and Channel Name Type Description
P(C’’jk|B’’jk) Scenario probability
Probability that occurrence of the kth contributing
factor in the jth retail establishment allows pathogens to survive or grow on a serving of pathogen-contaminated food
P(Dj) Calculated scenario parameter
Probability that pathogens in a serving of pathogen-
contaminated food will survive and grow in the jth category of retail food establishment: P(Dj) = ΣkP(A’’jk) – Σk Σg P(A’’jk)P(A’’jg) +Σk Σg Σh P(A’’jk)P(A’’jg)P(A’’jh)
–…+…–…+…– (–1)rΠkP(A’’jk)
D Calculated random variable
Annual servings of pathogen-contaminated food prepared and served or sold by retail establishments in a specific geographic region: D = ΣjDj
Foodborne Illness Stage: Retail Channel
FBIR Random variable Annual cases of FBI arising from the retail channel: FBIR ~ B(D, P(FBI))
P(FBI) Scenario parameter
Probability that ingestion of a serving of pathogen-contaminated food results in noticeable case of FBI
FBIRM Random variable Annual cases of FBI arising from the retail channel that are severe enough that medical treatment by a physician is sought: FBIRM ~ B(FBIR, P(FBIM))
P(FBIM) Scenario parameter
Probability that ingestion of a serving of pathogen-contaminated food results in a case of FBI sufficiently severe that treatment by a physician is sought
FBIRU Calculated random variable
Annual cases of FBI arising from the retail channel for which medical treatment by a physician is not sought FBIRU = FBIR – FBIRM
FBIRH Random variable Annual cases of FBI arising from the retail channel that are sufficiently severe that hospitalization is required: FBIRH ~ B(FBIRM, P(FBIH | FBIM))
P(FBIH|FBIM) Scenario parameter
Probability that a case of FBI that requires professional medical treatment becomes sufficiently severe to require hospitalization P(FBIH|FBIM) = P(FBIH)/P(FBIM) P(FBIH) = FBIH/FBI
(continued)

Section 2 — Overview of the Food Handling Practices Model
2-9
Table 2-1. Variables and Parameters of the Food Handling Practices Model (continued)
Stage and Channel Name Type Description
FBIRD Random variable
Annual cases of FBI arising from the retail channel that are sufficiently severe that death occurs: FBIRD ~ B(FBIRH, P(FBID|FBIH))
P(FBID|FBIH) Scenario parameter
Probability that a case of FBI that requires medical treatment by a physician becomes sufficiently severe that death occurs: P(FBID|FBIH) = P(FBID)/P(FBIH) P(FBID) = FBID/FBI
FBIRH~D Calculated random variable
Annual cases of FBI arising from the retail channel that result in hospitalization, but do not result in death: FBIRH~D = FBIRH – FBIRD
FBIRM~H~D Calculated random variable
Annual cases of FBI arising from the retail channel that are sufficiently severe that medical treatment by a physician is sought, but they do not result in hospitalization or death: FBIRM = FBIRM – FBIRH
Contamination Stage: Household Channel
Hj Random variable
Annual servings of food contaminated by the jth category of household: Hj ~ B(NHj P(Hj)); j = 1, 2, …, z
z Design parameter
Categories of households (e.g., single males, married couples with children)
1–gij Scenario parameter
Proportion of annual servings of the ith food category bought by consumers from the jth category of retail food establishment, as packaged by the final manufacturing source, without further preparation by the retail establishment
NHj Calculated scenario parameter
Annual servings of food prepared by the jth category of household: NHj = uj[Σi(1 – ci)(NSi –Si)+
Σk(1-wk)Σicibik(1-gik)(NSi–Si)]
1-ci Scenario parameter
Proportion of total servings of the ith food category acquired by final consumers without passing through a retail food establishment (e.g., gardens, direct farm sales, game from hunting)
1-wj Scenario parameter
Proportion of annual servings of food sold by the
jth retail food service establishment that is further prepared by households before consumption
(continued)

Modeling the Effects of Food Handling Practices on the Incidence of Foodborne Illness
2-10
Table 2-1. Variables and Parameters of the Food Handling Practices Model (continued)
Stage and Channel Name Type Description
uj Scenario parameter
Proportion of annual servings of food that are
prepared by the jth category of household; Σjuj = 1
NH Calculated check variable
Annual servings of food prepared by households in a specific geographic region: NH=ΣjNHj=Σjuj[Σi(1-ci)Nsi + Σj(1-wj)NRj]
P(A*jk) Compound scenario probability
Probability that a serving of food is contaminated in
the jth category of household due to the kth contributing factor: P(A*jk) = P(B*jk)P(C*jk | B*jk); k = 1, 2, …, f
f Design parameter
Categories of contributing factors that lead to contamination of food with pathogens (e.g., poor hygienic or sanitation practices)
P(B*jk) Scenario probability
Probability of the occurrence of the kth
contributing factor in the jth category of household
P(C*jk|B*jk) Scenario probability
Probability that an occurrence of the kth contributing factor actually contaminates a serving
of food in the jth category of household
P(Hj) Calculated scenario parameter
Probability that a serving of food is contaminated
by the jth category of household: P(Hj) = ΣkP(A*jk) – Σk Σg P(A*jk)P(A*jg) +Σk Σg Σh P(A*jk)P(A*jg)P(A*jh) –…+…–…+…–(–1)zΠkP(A*jk)
H Calculated random variable
Servings of food contaminated annually with one or more pathogens by households in a specific geographic region: H = ΣjHj
Pathogen Control Stage: Household Channel
Ej Random variable Annual servings of pathogen-contaminated food for which pathogens are not controlled or destroyed by
the jth category of household: Ej ~ B(NEj, P(Ej)); j = 1, 2, …, z
NEj Calculated random variable
Annual servings of pathogen-contaminated food
prepared by the jth category of household: NEj = uj[Σi(1–ci)Si+Σk(1–wk)Σicibik(1-gik)Si]+Hj
(continued)
Section 2 — Overview of the Food Handling Practices Model
2-11
Table 2-1. Variables and Parameters of the Food Handling Practices Model (continued)
Stage and Channel Name Type Description
P(A**jk) Compound scenario probability
Probability that pathogens are not controlled or destroyed in a serving of pathogen-contaminated
food in the jth category of household due to the kth contributing factor: P(A**jk) = P(B**jk)P(C**jk | B**jk); k = 1, 2, …, v
v Design parameter
Categories of contributing factors that may allow pathogens in pathogen-contaminated food to survive and grow (e.g., inappropriate cold holding, inadequate cooking)
P(B**jk) Scenario probability
Probability of occurrence of the kth contributing factor that may allow survival or growth of
pathogens in food in the jth category of household
P(C**jk|B**jk) Scenario probability
Probability that occurrence of the kth contributing factor allows pathogens to survive or grow on a serving of pathogen-contaminated food prepared in
the jth category of household
P(Ej) Calculated scenario parameter
Probability that pathogens in a serving of pathogen-
contaminated food will survive and grow in the jth category of household: P(Ej) = ΣkP(A**jk) –Σk Σg P(A**jk)P(A**jg) +Σk Σg Σh P(A**jk)P(A**jg)P(A**jh)
–…+…–…+…– (–1)zΠkP(A**jk)
E Calculated random variable
Annual servings of pathogen-contaminated food prepared by and consumed by households in a specific geographic region: E = ΣjEj
Foodborne Illness Stage: Household Channel
FBIH Random variable Annual cases of FBI arising from the retail channel: FBIH ~ B(E, P(FBI))
P(FBI) Scenario parameter
Probability that ingesting a serving of pathogen-contaminated food results in a noticeable case of FBI
FBIRM Random variable Annual cases of FBI arising from the retail channel that are severe enough that medical treatment by a physician is sought: FBIHM - FBIB(M))
(continued)

Modeling the Effects of Food Handling Practices on the Incidence of Foodborne Illness
2-12
Table 2-1. Variables and Parameters of the Food Handling Practices Model (continued)
Stage and Channel Name Type Description
P(FBIM) Scenario parameter
Probability that ingesting a serving of pathogen-contaminated food results in a case of FBI sufficiently severe that treatment by a physician is sought
FBIHU Calculated random variable
Annual cases of FBI arising from the household channel for which medical treatment by a physician is not sought: FBIHU = FBIH – FBIHM
FBIHH Random variable Annual cases of FBI arising from the household channel that are sufficiently severe that hospitalization is required: FBIHH ~ B(FBIHM, P(FBIH | FBIM))
P(FBIH|FBIM) Scenario parameter
Probability that a case of FBI that requires professional medical treatment becomes sufficiently severe to require hospitalization: P(FBIH|FBIM) = P(FBIH)/P(FBIM) P(FBIH) = FBIH/FBI
FBIHD Random variable Annual cases of FBI arising from the household channel that are sufficiently severe that death occurs: FBIHD ~ B(FBIHH, P(FBID|FBIH))
P(FBID|FBIH) Scenario parameter
Probability that a case of FBI that requires medical treatment by a physician becomes sufficiently severe that death occurs: P(FBID|FBIH) = P(FBID)/P(FBIH) P(FBID) = FBID/FBI P(FBIH) = FBIH/FBI
FBIHH~D Calculated random variable
Annual cases of FBI arising from the household channel that are sufficiently severe that medical treatment by a physician is sought, but they do not result in hospitalization or death: FBIHM = FBIHM – FBIHH
FBIHM~H~D Calculated random variable
Annual cases of FBI arising from the household channel that are sufficiently severe that medical treatment by a physician is sought, but they do not require hospitalization or result in death: FBIHM = FBIHM – FBIHH
FBI Calculated random variable
Total annual cases of FBI arising from the retail and household channels: FBI = FBIR+FBIH

Section 2 — Overview of the Food Handling Practices Model
2-13
2.3 OVERVIEW OF THE OPERATIONAL FOOD HANDLING PRACTICES MODEL The operational FHPM is a software model that allows users to estimate changes in annual cases of FBI, given one or more changes in food handling practices in retail food establishments or in households.
The FHPM operates using Microsoft Excel combined with Microsoft Access and the add-in application software @Risk. Using visual basic programming, RTI designed the model to operate through a user-friendly interface that allows users who may be unfamiliar with Excel, Access, or @Risk to operate the model effectively and efficiently. The model also allows users who are familiar with Excel, Access, and @Risk to access the model’s spreadsheets and database and to make full use of the graphical and analytical features of the @Risk software without using the user interface.
To use the model, users select an initial baseline scenario from a menu of baseline scenarios previously saved in the baseline scenarios database. A particular baseline scenario comprises specific settings of the model’s 1,546 parameters. Users may modify the selected baseline scenario as needed and save the modified scenario to the baseline scenario database, which creates a new record in the database. With a baseline scenario selected, users may run a baseline simulation.
The model runs a Monte Carlo simulation using Excel and @Risk, creating distributions for 78 random variables included in the model. Upon simulation, the model creates an output file for each random variable, providing graphical displays and tabled values that describe the output distributions. Users may save the baseline output file for later examination and analysis.
After running a baseline simulation, users may modify one or more parameters that define the baseline scenario to create a change scenario. In the FHPM, a change scenario is a complete set of calibration values for parameters in the model, which the user changes compared to the baseline scenario, to express changes in parameter values that the user expects to occur because of implementing of a regulation, rule, or any other change under analysis.

Modeling the Effects of Food Handling Practices on the Incidence of Foodborne Illness
2-14
After recalibrating the model for a change scenario, users initiate a second Monte Carlo simulation, called the change simulation, and the model creates the resulting output. Output from the change simulation is a set of side-by-side graphical distributions of the model’s 78 random variables—baseline scenario distributions displayed side by side with change scenario distributions. The model also creates the output shown in Table 2-2 for each of the random variables. Users may save the model’s output to a named file for later examination and analysis.
Statistic Baseline Scenario
Change Scenario Delta
Mean
Standard deviation
Minimum
Maximum
5th percentile
95th percentile
Table 2-2. Output of the FHPM Variable Name

3-1
Calibration of the Food Handling 3 Practices Model
The operational, computer-based FHPM comprises 78 binomial random variables and up to 1,546 parameters or deterministic input variables. RTI estimated national baseline values for each of the parameters and deterministic input variables needed to operate the model. In this section, we identify parameters needed to operate the FHPM and explain how we estimated values for each parameter and input variable of the national baseline scenario.
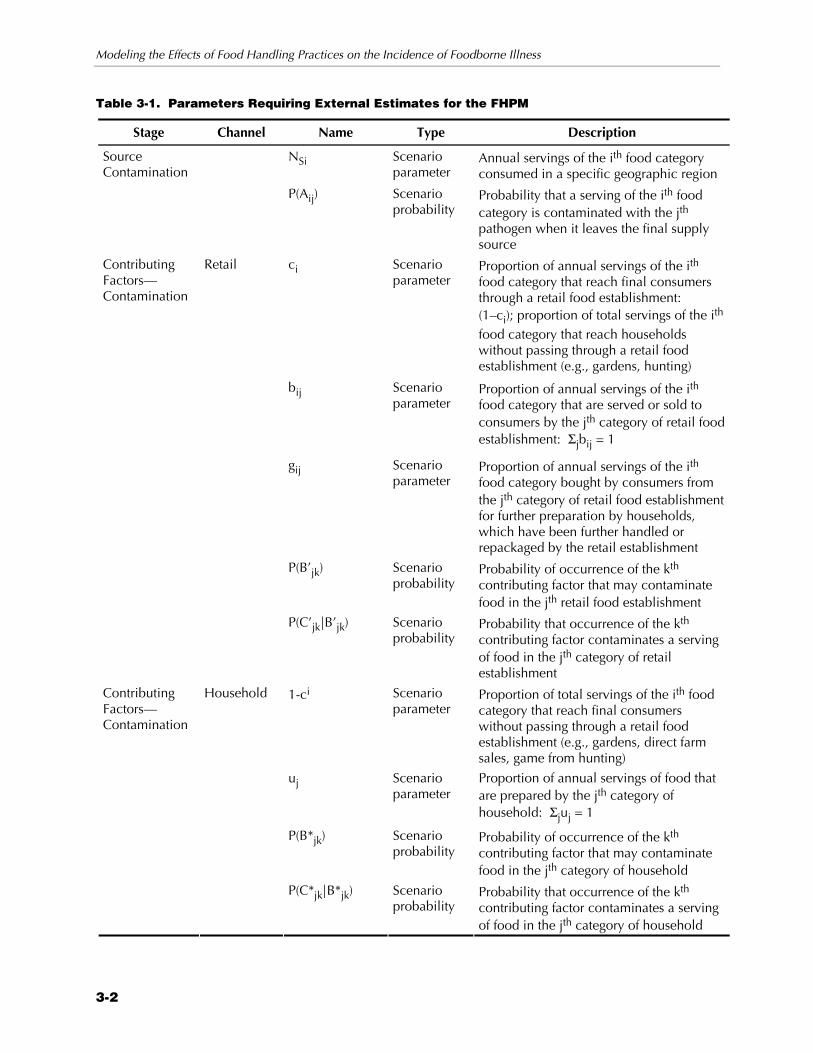
3.1 OVERVIEW OF CALIBRATION REQUIREMENTS As described in Section 2, the FHPM includes four stages: source contamination stage, contamination stage (retail and household channels), pathogen control stage (retail and household channels), and foodborne illness stage (retail and household channels). Associated with each stage of the FHPM is a set of parameters that characterize the distributions of binomial random variables in the model. Table 3-1 identifies all “scenario parameters” and “scenario probabilities” in the FHPM that RTI estimated using either primary or secondary sources.
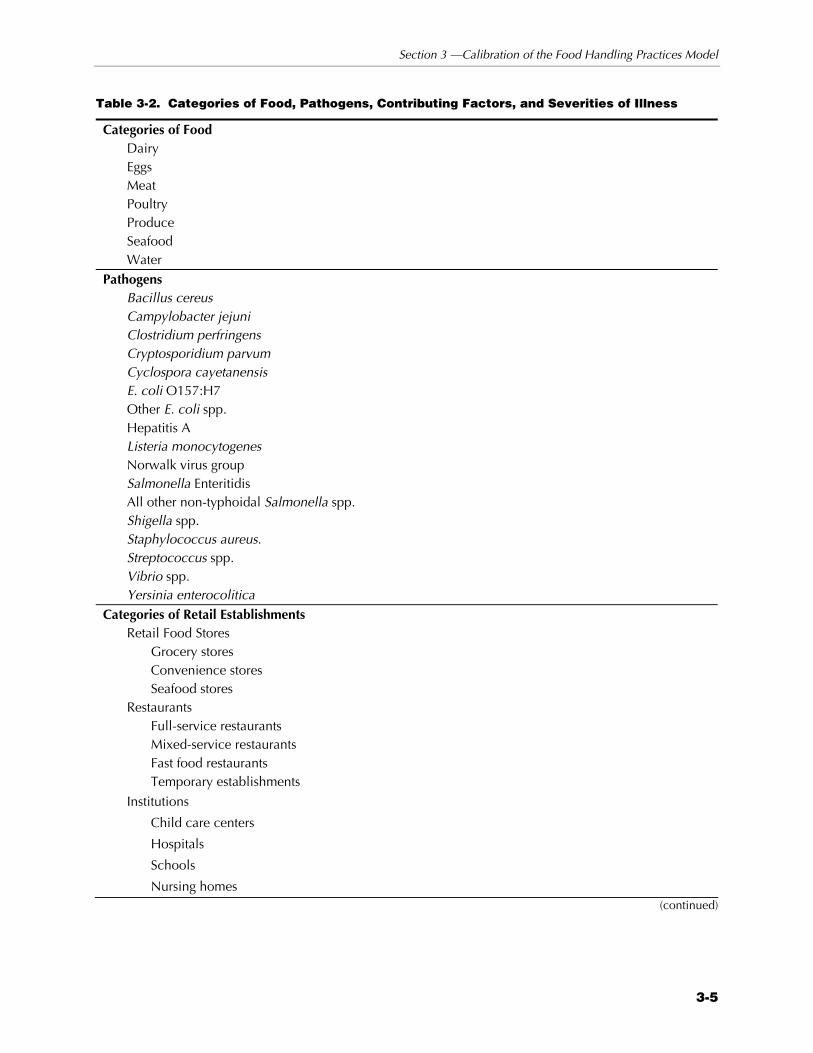
The FHPM includes random variables and modeling relationships for the categories of food, pathogens, contributing factors, and severities of illness listed in Table 3-2. FDA and RTI collaborated in determining the specifications of these categories.
Modeling the Effects of Food Handling Practices on the Incidence of Foodborne Illness
3-2
Table 3-1. Parameters Requiring External Estimates for the FHPM
Stage Channel Name Type Description
NSi Scenario parameter
Annual servings of the ith food category consumed in a specific geographic region
Source Contamination
P(Aij) Scenario probability
Probability that a serving of the ith food category is contaminated with the jth pathogen when it leaves the final supply source
ci Scenario parameter
Proportion of annual servings of the ith food category that reach final consumers through a retail food establishment: (1–ci); proportion of total servings of the ith food category that reach households without passing through a retail food establishment (e.g., gardens, hunting)
Retail
bij Scenario parameter
Proportion of annual servings of the ith food category that are served or sold to consumers by the jth category of retail food establishment: Σjbij = 1
gij Scenario parameter
Proportion of annual servings of the ith food category bought by consumers from the jth category of retail food establishment for further preparation by households, which have been further handled or repackaged by the retail establishment
P(B’jk) Scenario probability
Probability of occurrence of the kth contributing factor that may contaminate food in the jth retail food establishment
Contributing Factors—Contamination
P(C’jk|B’jk) Scenario probability
Probability that occurrence of the kth contributing factor contaminates a serving of food in the jth category of retail establishment
1-ci Scenario parameter
Proportion of total servings of the ith food category that reach final consumers without passing through a retail food establishment (e.g., gardens, direct farm sales, game from hunting)
uj Scenario parameter
Proportion of annual servings of food that are prepared by the jth category of household: Σjuj = 1
P(B*jk) Scenario probability
Probability of occurrence of the kth contributing factor that may contaminate food in the jth category of household
Contributing Factors—Contamination
Household
P(C*jk|B*jk) Scenario probability
Probability that occurrence of the kth contributing factor contaminates a serving of food in the jth category of household

Section 3 —Calibration of the Food Handling Practices Model
3-3
(continued)

Modeling the Effects of Food Handling Practices on the Incidence of Foodborne Illness
3-4
Table 3-1. Parameters Requiring External Estimates for the FHPM (continued)
Stage Channel Name Type Description
wj Scenario parameter
Proportion of annual servings of food sold by the jth category of retail food establishment that is consumed without further preparation by a household
P(B’’jk) Scenario probability
Probability of occurrence of the kth contributing factor that may allow pathogens in a serving of food to survive or grow in the jth retail establishment
Contributing Factors—Pathogen Control
Retail
P(C’’jk|B’’jk) Scenario probability
Probability that an occurrence of the kth contributing factor in the jth retail establishment allows pathogens to survive or grow on a serving of pathogen-contaminated food
1-wj Scenario parameter
Proportion of annual servings of food sold by the jth retail food service establishment that is further prepared by households before consumption
1-gij Scenario parameter
Proportion of annual servings of the ith food category bought by consumers from the jth category of retail food establishment, as packaged by the final manufacturing source, without further preparation by the retail establishment
P(B**jk) Scenario probability
Probability of occurrence of the kth contributing factor that may allow survival or growth of pathogens in food in the jth category of household
Contributing Factors—Pathogen Control
Household
P(C**jk|B**jk) Scenario probability
Probability that occurrence of the kth contributing factor allows pathogens to survive or grow on a serving of pathogen-contaminated food prepared in the jth category of household
P(FBI) Scenario parameter
Probability that ingesting a serving of pathogen-contaminated food results in a noticeable case of FBI
P(FBIM) Scenario parameter
Probability that ingesting a serving of pathogen-contaminated food results in a case of FBI sufficiently severe that treatment by a physician is sought
P(FBIH|FBIM) Scenario parameter
Probability that a case of FBI that requires professional medical treatment becomes sufficiently severe to require hospitalization: P(FBIH|FBIM) = P(FBIH)/P(FBIM) P(FBIH) = FBIH/FBI
Foodborne Illness
P(FBID|FBIH) Scenario parameter
Probability that a case of FBI that requires medical treatment by a physician becomes sufficiently severe that death occurs: P(FBID|FBIH) = P(FBID)/P(FBIH) P(FBID) = FBID/FBI P(FBIH) = FBIH/FBI
Section 3 —Calibration of the Food Handling Practices Model
3-5
Table 3-2. Categories of Food, Pathogens, Contributing Factors, and Severities of Illness
Categories of Food Dairy Eggs Meat Poultry Produce Seafood Water
Pathogens Bacillus cereus Campylobacter jejuni Clostridium perfringens Cryptosporidium parvum Cyclospora cayetanensis E. coli O157:H7 Other E. coli spp. Hepatitis A Listeria monocytogenes Norwalk virus group Salmonella Enteritidis All other non-typhoidal Salmonella spp. Shigella spp. Staphylococcus aureus. Streptococcus spp. Vibrio spp. Yersinia enterocolitica
Categories of Retail Establishments Retail Food Stores
Grocery stores Convenience stores Seafood stores
Restaurants Full-service restaurants Mixed-service restaurants Fast food restaurants Temporary establishments
Institutions
Child care centers
Hospitals
Schools
Nursing homes (continued)

Modeling the Effects of Food Handling Practices on the Incidence of Foodborne Illness
3-6
Table 3-2. Categories of Food, Pathogens, Contributing Factors, and Severities of Illness (continued)
Contributing Factors that May Contaminate Food
Inappropriate hand washing
Inappropriate bare-hand contact with RTE foods
Inappropriate bare-hand contact with ready-to-cook (RTC) foods
Inappropriate gloved-hand contact with RTE foods
Inappropriate gloved-hand contact with RTC foods
Inappropriate sanitation or cleaning of cutting boards and other surfaces
Food handling by ill person
Food handling by colonized, asymptomatic carrier
Inappropriate sanitation of equipment or utensils
Contributing Factors that Allow Pathogen Growth
Inappropriate time or temperature for cooking
Inappropriate time or temperature for reheating
Inappropriate time or temperature for cooling
Inappropriate time or temperature for cold holding
Inappropriate advance preparation
Inappropriate time or temperature for hot holding
Food kept at room temperature too long
Inappropriate thawing of frozen foods
Food served raw or lightly cooked
Categories of Households
Single female
Single male
Single parent with children
Couple without children
Couple with children
Senior male
Senior female
Categories of Severity of Illness
Untreated illnesses
Physician-treated illnesses
Hospitalizations
Deaths

Section 3 —Calibration of the Food Handling Practices Model
3-7
3.2 OVERVIEW OF SOURCES FOR CALIBRATION RTI used both primary and secondary data sources to estimate parameters needed for a national baseline calibration of the FHPM. To estimate probability parameters associated with contributing factors, we conducted an expert elicitation via teleconference. For some probability parameters needed in the FHPM, our only source of estimates was the expert elicitation. For other probability parameters, we compiled probability estimates gleaned from the scientific literature. For still other probability parameters, we used both estimates from the scientific literature and from the expert elicitation. For such parameters, we calculated averages that combine estimates from the scientific literature with results from the expert elicitation. We discuss these methods in greater detail below.
3.2.1 Secondary Data
Government sources provide a majority of secondary data collected for the FHPM. RTI used various publications from the U.S. Department of Agriculture’s Economic Research Service (ERS) and Food Safety and Inspection Service (FSIS) and the U.S. Department of Human Health Services’ Food and Drug Administration (FDA) and Centers for Disease Control and Prevention (CDC). In addition to research reports published by these agencies, the U.S. government sponsors several ongoing surveys of consumers that were helpful (e.g., FDA’s Food Safety Survey, USDA’s Continuing Survey of Food Intakes by Individuals [CSFII]).
RTI also used data from peer-reviewed scientific literature to calibrate the FHPM for a national baseline scenario. For example, to estimate source contamination probabilities, we used data from several studies that estimate the prevalence of pathogen contamination in food. In some cases, RTI found independent estimates from multiple studies. For such cases, we calculated a weighted average estimate, using study sample size as the basis for weighting.
We also used secondary data published on the web sites of the International Bottled Water Association, the Food Marketing Institute, and the National Association of Convenience Stores to estimate some parameters required for the national baseline scenario.

Modeling the Effects of Food Handling Practices on the Incidence of Foodborne Illness
3-8
Challenges and Issues
As anticipated, data needed to calibrate the FHPM for a national baseline scenario were not readily available in the proper form. For example, the basic metric of the model is annual servings of food; however, secondary sources typically report annual consumption measured in pounds or grams. Thus, to calculate annual servings of each food type (Nsi), we divided annual consumption figures by an estimate of average serving size.
The categories of households and retail establishments typically reported in the secondary literature did not match those defined in the FHPM. For instance, households with senior citizens are often grouped into one category, while the FHPM splits senior households by gender. To address these issues, we aggregated data, left parameters blank for specific categories, or reanalyzed primary datasets. We also used not-otherwise-listed (NOL) categories for groups of households or institutions not defined in the model.
Similarly, contributing factors reported in the scientific literature do not always match those defined in the FHPM. For example, RTI found no studies that reported the prevalence of food handling by colonized, asymptomatic food handlers, nor did we find studies that reported prevalence of inappropriate handling of food with gloved hands.
Ideally, share parameters defined as proportions would be based on volume data. But secondary data needed to estimate share parameters are often reported in terms of annual sales. Lacking volume data, we were forced to use sales data in some instances, as noted in Section 3.3.
As mentioned previously, RTI used the USDA CSFII survey dataset to calculate several parameters needed in the FHPM. However, CSFII data may not be an ideal source of information for calibrating the FHPM. The primary objective of the CSFII is to monitor dietary status of the national population, particularly the low-income population (USDA, 2000b). Because the FHPM requires estimates of food consumption in terms of annual servings for various categories of food prepared by retail establishments or household, estimating parameter values for the FHPM using CFSII data requires considerable manipulation and calculation.

Section 3 —Calibration of the Food Handling Practices Model
3-9
3.2.2 Expert Elicitation
RTI used results from the expert elicitation to help create an initial national baseline calibration of the FHPM. This section of the report summarizes methods we used for the expert elicitation and discusses challenges and issues.
Summary of Expert Elicitation
In consultation with FDA, RTI identified candidates for the expert panel through literature review, web search, and RTI’s network of contacts with food safety experts. RTI extended invitations to two academicians with specific expertise in food handling practices of households; two food safety consultants with specific expertise in food handling practices of retail food establishments; and one corporate professional who has food safety responsibilities for a large, well-known chain of hotels and restaurants and specific expertise in food handling practices of restaurants. A sixth candidate who did not feel comfortable estimating the probabilities we required declined our invitation to join the panel. A seventh candidate did not respond to our letter of invitation to join the panel. The following people were members of the expert panel:
Z Janet B. Anderson, R.D, M.S., Clinical Associate Professor, Dietetics Program, Nutrition and Food Sciences Department, Utah State University, Logan, UT
Z Dr. Christine M. Bruhn, Center for Consumer Research, University of California, Davis
Z Roy Costa, R.S., M.S., Hospitality and Tourism Institute, Valencia Community College, Orlando, FL
Z John F. Schulz, Director of Quality Assurance, Marriott International, Washington, DC
Z Dr. O. Peter Snyder, Jr., Hospitality Institute of Technology and Management, St. Paul, MN
Appendix A provides the invitation letter, background information, and instructions sent to the panelists. RTI conducted the expert elicitation in the following four stages spanning a period of about 4 weeks:
Z Elicit an initial round of estimates via Excel worksheets.
Z Aggregate and summarize the initial round of estimates; provide aggregate estimates to panelists.
Z Conduct a teleconference session with the panelists to discuss initial-round estimates.

Modeling the Effects of Food Handling Practices on the Incidence of Foodborne Illness
3-10
Z Elicit a final round of estimates via Excel worksheets.
For the initial round of estimates, panelists provided three types of estimates:
Z relative likelihoods of occurrence of specific contributing factors;
Z relative likelihoods of contamination of food; given the occurrence of specific contributing factors, and
Z a single probability estimate for the MOST likely event listed on each elicitation worksheet.
After RTI received the initial estimates from all panelists via return email of the Excel worksheets, we created aggregated summary results and provided them to the expert panel for review and contemplation before conducting the teleconference session with the panel. To create the aggregated summary results, RTI converted all relative likelihood estimates to probabilities, based on the single probability estimate we elicited for the MOST likely event listed on each elicitation form. We then computed the simple arithmetic average across all panelists who provided estimates for each elicitation form. Consequently, on the aggregated summary worksheets, panelists could review only average probabilities; they could not identify their own estimates or any other panelist’s separate estimates.
RTI conducted the teleconference session via a commercial telephone conferencing service. Appendix B provides a summary of statements by panelists during the teleconference session. Following the teleconference session, RTI sent via email attachment a second set of Excel forms to elicit the panelists’ “best-and-final” estimates—this time directly as probabilities instead of relative likelihoods. The electronic forms we used for the final round of elicitation were sorted and ordered using average values computed across panelists from highest to lowest to allow panelists to more easily compare average probability estimates across different retail establishments, household categories, and contributing factors. The forms also provided the low, mean, and high estimates from the panel. Consequently, for the final round of probability estimates, panelists had considerably more information on which to base their best and final estimates. Panelists also had the benefit of having participated in the teleconference session, which enabled them to

Section 3 —Calibration of the Food Handling Practices Model
3-11
hear and share observations about the aggregated results from the initial round of estimates.
Following receipt via return email attachment of all panelists’ best and final probability estimates, RTI calculated aggregated results by computing the simple arithmetic average across all panelists who provided best and final estimates on each electronic elicitation form. These estimates are provided in Appendix C.
Sample Elicitation Forms and an Example of the Elicitation Tasks. Figure 3-1 provides a sample elicitation form for contributing factors that may contaminate food in the retail sector. The sample form shows a hypothetical example for the retail establishment category “convenience stores.”
The sample form in Figure 3-1 shows that the hypothetical expert panelist who filled it out thinks that “inappropriate gloved-hand contact with ready-to-cook foods” is the contributing factor that is LEAST likely to occur in convenience stores. The same expert said that “inappropriate hand washing” is the contributing factor that is MOST likely to occur, and moreover, it is 1,500 times more likely than the least likely factor. Note also that this hypothetical panelist estimated that “inappropriate bare-hand contact with ready-to-cook foods” and “food handling by ill worker” are equally likely events, and that both are 100 times more likely to occur in convenience stores than “inappropriate gloved-hand contact with ready-to-cook foods.”
In the example, the expert panelist also estimated that the most likely contributing factor, “inappropriate hand washing,” occurs 50,000 times out of every 100,000 opportunities for it to occur, which is to say the event has 1 to 1 odds of occurring, or a 0.50 probability of occurring. If the expert panelist who completed the elicitation form in Figure 3-1 thought that all nine contributing factors were equally likely to occur in convenience stores, the panelist would have entered “1” for all nine contributing factors. If the hypothetical panelist estimated that the most frequently occurring contributing factor in convenience stores had 1 to 3 odds for occurring, the panelist would have written 25,000 for Item 4,

Modeling the Effects of Food Handling Practices on the Incidence of Foodborne Illness
3-12
Figure 3-1. Elicitation Form A: Retail Contamination Stage
Contributing Factors that Contaminate Food
Retail Establishment Category: Convenience Stores—Small retail food stores that offer a limited selection of high-convenience items; open long hours to provide convenient access. Estimates Omitted ❏ Please Complete the Following Steps in Order:
1. Identify the contributing factor below that you judge to occur LEAST frequently; type in the number “1” in the table below to designate its relative likelihood of occurrence.
2. Identify the contributing factor below that you judge to occur MOST frequently; type in a number in the table below to quantify the likelihood of occurrence of the most frequently occurring contributing factor, relative to the least frequently occurring.
3. For each remaining contributing factor, type in a number in the table below to quantify your judgment of the likelihood of occurrence, relative to the least frequent and most frequent; the relative likelihood numbers you type may be the same or different for each contributing factor, depending on your judgment of relative likelihood.
4. Focus on the contributing factor you judge to occur MOST frequently; of 100,000 opportunities for that contributing factor to occur in convenience stores, type in the cell to the right the number of times you think it is likely to occur.
50,000
Contributing Factor Relative Likelihood Inappropriate hand washing 1,500
Inappropriate bare-hand contact with read-to-eat foods 500 Inappropriate bare-hand contact with ready-to-cook foods 100 Inappropriate gloved-hand contact with ready-to-eat foods 267 Inappropriate gloved-hand contact with ready-to-cook foods 1
Inappropriate sanitation of cutting boards or cutting surfaces 820
Food handling by ill worker 100
Food handling by asymptomatic worker 50
Inappropriate sanitation of equipment or utensils 600
instead of 50,000.1 If the expert panelist had too little experience or knowledge to complete the form, the expert would have checked the “Estimates Omitted” box and left the entire rest of the form blank.
We anticipated that the likelihood of occurrence of contributing factors could vary by categories of retail establishments and households. Therefore, we asked members of the expert panel to complete 18 separate elicitation forms like the sample in Figure 3-1,
1In general, the statement that the odds are r to s in favor of an event E occurring is
equivalent to the statement that P(E) = r/(r+s). Definition: If P(E) = p, the odds in favor of the event E occurring are r to s (often written r: s) where r/s = p/(1-p). If r and s are given, then p can be found by using the equation p = r/(r + s).

Section 3 —Calibration of the Food Handling Practices Model
3-13
using a separate form for each of the 11 categories of retail establishments and seven categories of households included in the FHPM. Panelists also completed 18 separate forms for contributing factors that may permit pathogen growth in food.
We were hopeful that all members of the expert panel would provide estimates for each category of retail establishment and household. But we also anticipated that one or more panelists might feel they had insufficient knowledge or experience to make estimates for one or more categories, which in fact was the case. In such cases, we asked that panelists leave the elicitation form blank, except for checking the “Estimates Omitted” box on the form to indicate that no estimates were made.
Figure 3-2 provides a sample elicitation form for the second step of the elicitation tasks we asked panelists to complete. This figure continues with the same example shown in Figure 3-1 for the retail establishment category “convenience stores.”
The example in Figure 3-2 shows that the hypothetical expert panelist thinks that “inappropriate sanitation of equipment or utensils” is the LEAST likely contributing factor to result in contamination of a serving of food in convenience stores, given that the contributing factor occurs. Note especially that the same panelist did not think that “inappropriate sanitation of equipment or utensils” was the least likely contributing factor to occur (see Figure 3-1) but did think that the likelihood that a serving of food will actually be contaminated, given the occurrence of the contributing factor, is much lower than for the other eight contributing factors. The same hypothetical expert said that the MOST likely event in convenience stores is “Given that food handling by an ill worker occurs, a serving of food is contaminated with one or more pathogens.” Evidently, the hypothetical expert panelist in the example believes that it is highly likely that a serving of food will be contaminated, if the serving is handled by an ill worker. In fact, the panelist believes that, when food handling by an ill worker occurs, it is 10,000 times more likely to contaminate a serving of food than when inappropriate sanitation of equipment or utensils occurs.
Note also that this hypothetical panelist estimates that “inappropriate bare-hand contact with ready-to-cook foods” and

Modeling the Effects of Food Handling Practices on the Incidence of Foodborne Illness
3-14
Figure 3-2. Elicitation Form B: Retail Contamination Stage
Contributing Factors that Contaminate Food
Retail Establishment Category: Convenience Stores—Small retail food stores that offer a limited selection of high-convenience items; open long hours to provide convenient access. Estimates Omitted ❏ Please Complete the Following Steps in Order:
1. Identify the event below that you judge to occur LEAST frequently; type in the number “1” in the table below to designate its relative likelihood of occurrence.
2. Identify the event below that you judge to occur MOST frequently; type in a number in the table below to quantify the likelihood of occurrence of the most frequently occurring contributing factor, relative to the least frequently occurring.
3. For each remaining event, type in a number in the table below to quantify your judgment of the likelihood of occurrence, relative to the least frequent and most frequent; the relative likelihood numbers you type may be the same or different for each contributing factor, depending on your judgment of relative likelihood.
4. Focus on the event you judge to occur MOST frequently; of 100,000 opportunities for that event to occur in convenience stores, type in the cell to the right the number of times you think it is likely to occur.
95,000
Event Relative Likelihood Given that inappropriate hand washing occurred, a serving of food is contaminated with one or more pathogens
1,000
Given that inappropriate bare-hand contact with read-to-eat foods occurred, a serving of food is contaminated with one or more pathogens
250
Given that inappropriate bare-hand contact with ready-to-cook foods occurred, a serving of food is contaminated with one or more pathogens
10
Given that inappropriate gloved-hand contact with ready-to-eat foods occurred, a serving of food is contaminated with one or more pathogens
250
Given that inappropriate gloved-hand contact with ready-to-cook foods occurred, a serving of food is contaminated with one or more pathogens
10
Given that inappropriate sanitation of cutting boards or cutting surfaces occurred, a serving of food is contaminated with one or more pathogens
1,000
Given that food handling by ill worker occurred, a serving of food is contaminatedwith one or more pathogens
10,000
Given that food handling by asymptomatic worker occurred, a serving of food is contaminated with one or more pathogens
50
Given that inappropriate sanitation of equipment or utensils occurred, a serving of food is contaminated with one or more pathogens
1
“inappropriate gloved-hand contact with ready-to-cook foods” are equally likely to result in contamination of a serving of food when they occur, and that both are 10 times more likely to result in a contaminated serving of food than inappropriate sanitation of equipment or utensils.
In the example, the expert panelist estimates that 95,000 times out of every 100,000 opportunities for it to occur, food handling by an

Section 3 —Calibration of the Food Handling Practices Model
3-15
ill worker results in contamination of one or more servings of food. Evidently, the hypothetical panelist believes the odds of food getting contaminated if it is handled by an ill worker is something on the order of 19 to 1, which is the same as a 0.95 probability of occurring.
As with the first round of estimates, we asked the expert panelists to complete 18 separate elicitation forms in the second round of estimates. Panelists also completed 18 separate forms for contributing factors that may permit pathogen growth in food. Together, the examples provided by Figures 3-1 and 3-2 demonstrate the distinction between “occurrence of contributing factors” and “contamination of food that may result from occurrences of contributing factors.” To ensure that the distinction was understood and preserved throughout the expert elicitation, we urged all panelists to take care as they completed the two distinct steps of elicitation tasks.
Challenges and Issues
Identifying panelists with appropriate knowledge and experience for the expert elicitation was challenging. Although RTI and FDA believed that all panelists invited to participate in the expert elicitation were well suited for the task, some of the panelists proved not to have as much practical experience as we had thought. RTI believes that the expert who declined to participate was in fact the most qualified and experienced candidate. We believe that the absence of that candidate substantially weakened the panel.
Several panelists expressed difficulty in estimating probabilities for contributing factors that may not be particularly well defined. For example, the definition of “inappropriate hand washing” was particularly troublesome for some panelists. One panelist asked if inappropriate hand washing is the same thing as failure to wash hands. Another panelist asked if the definition of hand washing in the Food Code should be used. The invited expert who declined to join the panel told RTI there is no universally acceptable definition for “inappropriate hand washing.” Panelists were also uncertain about how to define “inappropriate advance preparation.” One panelist questioned why gloved-hand contact is included as a contributing factor for households, because gloved-handed

Modeling the Effects of Food Handling Practices on the Incidence of Foodborne Illness
3-16
preparation of food in households is extremely rare. Consequently, some variation in probabilities estimated by panelists may be due to differences in how each panelist defined certain contributing factors.
Some panelists struggled with the level of abstraction needed to estimate probabilities across a broad range of food categories and pathogens. As noted previously, one invited panelist decided not to participate in the expert elicitation, largely for this reason. During the teleconference session, one panelist noted that, “the conditional probabilities depend on what the food is.” Another panelist mentioned that the probabilities we asked them to estimate are not well known, and that very little experimental data are available for conditional probabilities.
RTI designed the expert elicitation to elicit a range of estimates, not to produce consensus estimates of probabilities. For calibrating probability parameters in the FHPM, we calculated average estimates across panelists, which tends to mitigate bias that may be present in the estimates of any single panelists and also tends to mitigate the issue of differences in definitions used for various contributing factors. Nonetheless, lessons learned from conducting the initial expert elicitation will be valuable for guiding future research.
Based on experience with the initial expert elicitation, we believe that a more extensive expert elicitation would produce more accurate estimates of probability parameters needed in the FHPM. We offer the following specific recommendations for improving expert elicitation of probability parameters: (1) recruit a larger, more experienced panel of experts; (2) conduct the elicitation session face-to-face with ample advance time and ample joint session time to allow panelists to share information and discuss merits and demerits of specific estimates; (3) demonstrate the FHPM to the panelists before eliciting their estimates; (4) provide specific definitions of each contributing factor; and (5) ask panelists to provide estimates that are differentiated by food category and type of pathogen. Conducting an expert elicitation that incorporates these recommendations would produce superior estimates but would also require substantially more resources and time than were available for the initial expert elicitation.

Section 3 —Calibration of the Food Handling Practices Model
3-17
3.3 NATIONAL BASELINE CALIBRATION ESTIMATES This section describes in detail how RTI calculated each scenario parameter and scenario probability. We organize our discussion by model stage and channel within model stage, listing parameter names, descriptions, and sources under the relevant stage and channel. We provide numerical estimates in Appendix D and in an Excel workbook, which accompanies this report on CD-ROM. Separate worksheets within the Excel workbook provide calculations and data sources used for each category of parameter we estimated.
3.3.1 Source Contamination Stage
The source contamination stage of the FHPM has two categories of parameters that must be estimated: annual servings for each of seven food categories and probability that a serving of the ith food category is contaminated with the jth pathogen when it leaves the final supply source.
Variable Name: Nsi
Description: Annual servings of the ith food category consumed in the United States.
Data Found: RTI found annual consumption of each food category (dairy, eggs, meat, poultry, produce, seafood, and water). RTI also found survey data that reported the amount consumed per eating occasion for each food category. We divided total annual consumption by the typical amount consumed per eating occasion to calculate annual servings consumed in the United States for each food category. To determine annual servings of water, we converted daily per capita consumption to an annual figure and divided by an estimate of average serving size.
Sources:
International Bottled Water Association. “Survey: America’s Poor Drinking Habits Contradict Knowledge of Health Risks.” <http://www.bottledwater.org/public/InfoRepNatFactSheettest.htm>. Accessed March 24, 2003.

Modeling the Effects of Food Handling Practices on the Incidence of Foodborne Illness
3-18
Lucier, Gary, Susan Pollack, and Agnes Perez. November 1997. “Import Penetration in the U.S. Fruit and Vegetable Industry.” Vegetables and Specialties/VGS-273. Washington, DC: USDA, ERS. http://www.ers.usda.gov/briefing/vegetables/vegpdf/Import Pen.pdf.
National Chicken Council. Eat Chicken.com. “Per Capita Consumption of Poultry and Livestock, in Pounds, 1960 to Estimated 2002.” <http://www.eatchicken.com /statistics/consumption_pounds_60_02.cfm>. Accessed December 11, 2002.
U.S. Department of Agriculture, Agricultural Research Service. 2000a. Continuing Survey of Food Intakes by Individuals 1994-96, 1998. CD-ROM.
U.S. Department of Agriculture, Economic Research Service. 1999. Food Consumption, Prices, and Expenditures, 1970-97/SB-965. <http://www.ers.usda.gov/publications/sb965/>.
U.S. Food and Drug Administration, Center for Food Safety and Applied Nutrition, FDA Prime Connection. “Proposed Seafood HACCP Rule.” Docket Numbers 90N-0199 and 93N-0195.
Variable Name: P(Aij)
Description: Probability that a serving of the ith food category is contaminated with the jth pathogen when it leaves the final supply source.
Data Found: RTI located relevant source contamination prevalence studies published in government sources and the scientific literature. We aggregated estimates from multiple studies for each food category using a two-stage weighted average technique, as described in greater detail below.
We found contamination prevalence studies for a variety of pathogen/food item combinations. For some pathogen/food item combinations (e.g., cantaloupe contaminated with E. coli), we located multiple studies that report estimates of prevalence of contamination. To create a single estimate of contamination prevalence estimates from multiple studies of the same pathogen/food item combination, we calculated a weighted average of the multiple prevalence estimates, using study sample size as the basis for the weights. This method allowed contamination prevalence estimates from larger studies to contribute more to the

Section 3 —Calibration of the Food Handling Practices Model
3-19
weighted average estimate. We used a second stage of weighting to combine contamination prevalence estimates for food items that together comprise a single food category (e.g., cantaloupe, strawberries, onions, and other fruits and vegetables comprise the “produce” food category). For second-stage weighting, we used annual consumption of each food item as the basis for calculating the weighted average contamination prevalence estimate for the category.
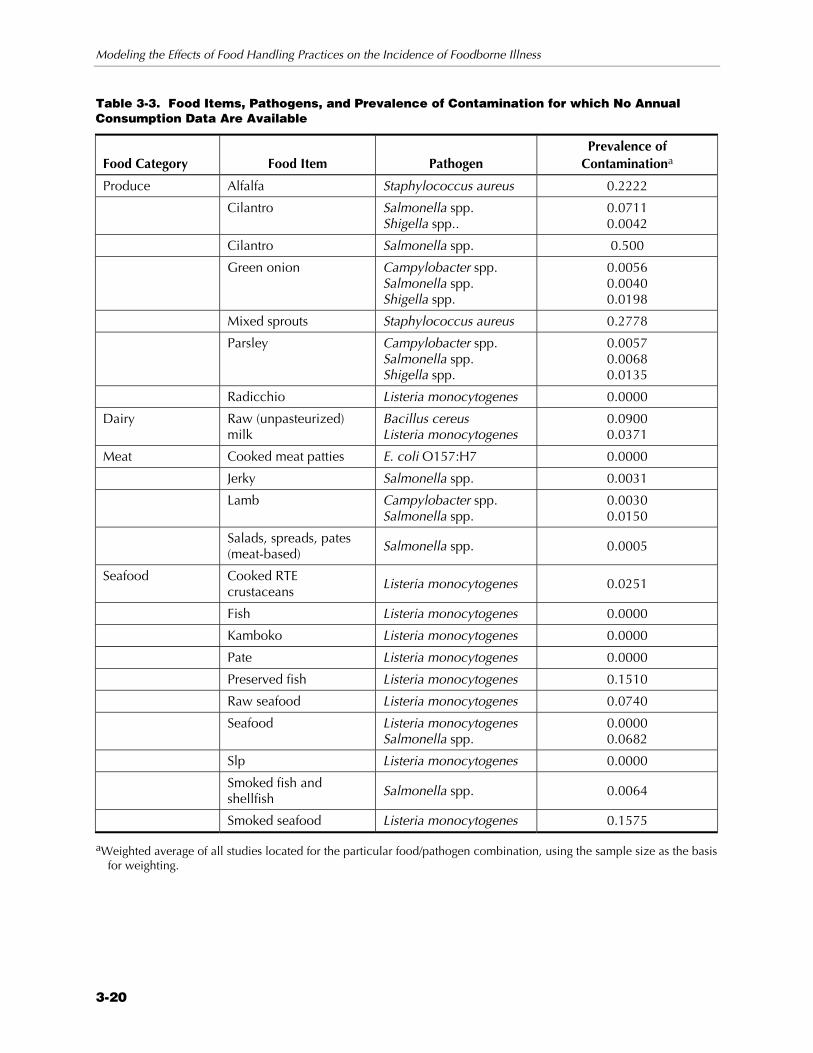
But as we anticipated, consumption data were not available for some food items, even though one or more contamination prevalence studies for the food item were sometimes available. For example, we might have a study that estimates prevalence of E. coli contamination on green onions but have no estimate of annual consumption of green onions. With no estimate of the share of green onions in the food category “produce” available, we had no reasonable way to include the contamination prevalence estimate for green onions in the second-stage weighted average for the food category “produce.” Consequently, we had to omit source contamination prevalence estimates for such food items from our calculations. Table 3-3 lists specific food items for which contamination prevalence estimates are available, but for which annual consumption data are unavailable.
Although researchers have conducted many contamination prevalence studies, studies tend to focus on a limited set of food items and pathogens. Some studies are no longer current (e.g., over 10 years old), so we excluded them from our calculations. We found several studies based on food samples in other countries. Because production practices can vary widely in different areas of the world, we omitted contamination prevalence rates for other countries because they do not accurately reflect contamination prevalence in the U.S. food supply. The only instances in which we included data from other countries are those where the food items are identified as imports into the United States. Many microbiological studies report level of contamination (often in terms of cfu/g) rather than the prevalence of contaminated samples versus uncontaminated samples. However, the data reported in cfu/g did not fit into our model parameters. Thus, those studies were excluded from our analysis.
Modeling the Effects of Food Handling Practices on the Incidence of Foodborne Illness
3-20
Table 3-3. Food Items, Pathogens, and Prevalence of Contamination for which No Annual Consumption Data Are Available
Food Category Food Item Pathogen Prevalence of
Contaminationa
Produce Alfalfa Staphylococcus aureus 0.2222
Cilantro Salmonella spp. Shigella spp..
0.0711 0.0042
Cilantro Salmonella spp. 0.500
Green onion Campylobacter spp. Salmonella spp. Shigella spp.
0.0056 0.0040 0.0198
Mixed sprouts Staphylococcus aureus 0.2778
Parsley Campylobacter spp. Salmonella spp. Shigella spp.
0.0057 0.0068 0.0135
Radicchio Listeria monocytogenes 0.0000
Dairy Raw (unpasteurized) milk
Bacillus cereus Listeria monocytogenes
0.0900 0.0371
Meat Cooked meat patties E. coli O157:H7 0.0000
Jerky Salmonella spp. 0.0031
Lamb Campylobacter spp. Salmonella spp.
0.0030 0.0150
Salads, spreads, pates (meat-based) Salmonella spp. 0.0005
Seafood Cooked RTE crustaceans
Listeria monocytogenes 0.0251
Fish Listeria monocytogenes 0.0000
Kamboko Listeria monocytogenes 0.0000
Pate Listeria monocytogenes 0.0000
Preserved fish Listeria monocytogenes 0.1510
Raw seafood Listeria monocytogenes 0.0740
Seafood Listeria monocytogenes Salmonella spp.
0.0000 0.0682
Slp Listeria monocytogenes 0.0000
Smoked fish and shellfish Salmonella spp. 0.0064
Smoked seafood Listeria monocytogenes 0.1575
aWeighted average of all studies located for the particular food/pathogen combination, using the sample size as the basis for weighting.

Section 3 —Calibration of the Food Handling Practices Model
3-21
Sources:
Berrang, M.E., C.E. Lyon, and D.P. Smith. 2000. “Incidence of Listeria Monocytogenes on Pre-Scald and Post-Chill Chicken.” Journal of Applied Poultry Research 9:546-550.
Beuchat, L.R. “Pathogenic Microorganisms Associated with Fresh Produce.” Journal of Food Protection 59(2):204-216.
Cox, N.A., J.S. Bailey, and M.E. Berrang. 1997. “The Presence of Listeria Monocytogenes in the Integrated Poultry Industry.” Journal of Applied Poultry Research 6:116-119.
Duffy, E.A., K.E. Belk, J.N. Sofos, G.R. Bellinger, A. Pape, and G.C. Smith. 2001. “Extent of Microbial Contamination in United States Pork Retail Products.” Journal of Food Protection 64(2):172-178.
Ebel, Eric, and Wayne Schlosser. 2000. “Estimating the Annual Fraction of Eggs Contaminated with Salmonella Enteritidis in the United States.” International Journal of Food Microbiology 61(1):51-62.
Elliott, E., and J. Kevenberg. 2000. “Risk Assessment Used to Evaluate the U.S. Position on Listeria Monocytogenes in Seafood.” International Journal of Food Microbiology 62(3):253-260.
Farber, J. 2000. “Present Situation in Canada Regarding Listeria Monocytogenes and RTE Seafood Products.” International Journal of Food Microbiology 62(3):247-251.
Jay, J.M. 1996. “Prevalence of Listeria spp. in Meat and Poultry Products.” Food Control 7(4/5):209-214.
Levine, P., B. Rose, S. Green, G. Ransom, and W. Hill. 2001. “Pathogen Testing of Ready-to-Eat Meat and Poultry Products Collected at Federally Inspected Establishments in the United States, 1990 to 1999.” Journal of Food Protection 64(8):1188-1193.
National Marine Fisheries Service, Office of Science and Technology, Fisheries Statistics and Economics Division. “Commercial Fisheries. Data Caveats.” <http://www.st.nmfs.gov/st1/commercial/landings/caveat.html>. Accessed November 13, 2002.
Scanga, J.A., A.D. Grona, K.E. Belk, J.N. Sofos, G.R. Bellinger, and G.C. Smith. 2000. “Microbiological Contamination of Raw Beef Trimmings and Ground Beef.” Meat Science 56:145-152.

Modeling the Effects of Food Handling Practices on the Incidence of Foodborne Illness
3-22
Sofos, J.N., S.L. Kochevar, J.O. Reagan, and G.C. Smith. 1999. “Incidence of Salmonella on Beef Carcasses Relating to the U.S. Meat and Poultry Inspection Regulations.” Journal of Food Protection 62(5):467-473.
Trampel, D.W., R.J. Hasiak, L.J. Hoffman, and M.C. Debey. 2000. “Recovery of Salmonella from Water, Equipment, and Carcasses in Turkey Processing Plants.” Journal of Applied Poultry Research 9:29-34.
U.S. Department of Agriculture, Agricultural Research Service, Beltsville Human Nutrition Research Center, Food Surveys Research Group. 2002. What We Eat in America. Beltsville, MD: USDA.
U.S. Department of Agriculture, Food Safety and Inspection Service, Science and Technology, Microbiology Division. February 1996. “Nationwide Beef Microbiological Baseline Data Collection Program: Cows and Bulls. December 1993–November 1994.”
U.S. Department of Agriculture, Food Safety and Inspection Service, Science and Technology, Microbiology Division. April 1996. “Nationwide Broiler Chicken Microbiological Baseline Data Collection Program July 1994–June 1995.”
U.S. Department of Agriculture, Food Safety and Inspection Service, Science and Technology, Microbiology Division. April 1996. “Nationwide Federal Plant Raw Ground Beef Microbiological Survey, August 1993–March 1994.”
U.S. Department of Agriculture, Food Safety and Inspection Service, Science and Technology, Microbiology Division. June 1996. “Nationwide Pork Microbiological Baseline Data Collection Program: Market Hogs. April 1995–March 1996.”
U.S. Department of Agriculture, Food Safety and Inspection Service, Science and Technology, Microbiology Division. May 1996. “Nationwide Raw Ground Chicken Microbiological Survey.”
U.S. Department of Agriculture, Food Safety and Inspection Service, Science and Technology, Microbiology Division. May 1996. “Nationwide Raw Ground Turkey Microbiological Survey.”
U.S. Department of Agriculture, Food Safety and Inspection Service. “Microbiological Results of Raw Ground Beef Products Analyzed for Escherichia coli 0157:H7.” <http://www.fsis.usda.gov/ OPHS/ecoltest/tables1.htm>. Accessed November 6, 2002.

Section 3 —Calibration of the Food Handling Practices Model
3-23
U.S. Department of Agriculture, Food Safety and Inspection Service. “Salmonella Enteritidis Risk Assessment.” <http://www.fsis.usda.gov/OPHS/risk/index.htm>. Accessed March 12, 2002.
U.S. Food and Drug Administration, Center for Food Safety and Applied Nutrition. 2001. “Processing Parameters Needed to Control Pathogens in Cold Smoked Fish; Potential Hazards in Cold-Smoked Fish: Listeria Monocytogenes.” <http://www.cfsan.fda.gov/~comm/ift2list.html>. Accessed March 7, 2002.
U.S. Food and Drug Administration, Center for Food Safety and Applied Nutrition. December 2000. Draft Risk Assessment on the Public Health Impact of Vibrio Parahaemolyticus in Raw Molluscan Shellfish. Washington, DC: FDA.
3.3.2 Retail and Household Contamination Stage
RTI calculated some of the parameters for the contamination stage of the model using consumption data from the CSFII (USDA, ARS, 2000a) and its companion recipe database (USDA, ARS, 2000a). Because we use the same initial procedures to calculate several parameters in the contamination stage of the model, we describe our methods below before describing calculations for each category of parameter within the retail channel and the household channel.
The CSFII data set contains the grams of a food product consumed by a respondent, while the recipe database contains the ingredients by gram weight of each food product in the CSFII. We initially determined the percentage (by weight) of each ingredient in each recipe for each food product. We divided each ingredient gram weight by the total gram weight of the recipe of ingredients to calculate the percentage (by weight) of each ingredient in each recipe.
RTI merged the recipe database with the CSFII, 1994–1996, 1998 to produce a combined data set. We calculated the grams of each ingredient consumed by multiplying the percentage of ingredient per recipe by the gram weight of food product consumed by the respondent. We then created a subset of the CSFII data that contains only ingredients consumed that correspond with food categories in the FHPM (meat, poultry, dairy, produce, eggs, seafood, and water). We use this subset of ingredients and respondent information to calculate four of the nine parameters in the contamination stage of the model.

Modeling the Effects of Food Handling Practices on the Incidence of Foodborne Illness
3-24
Retail Channel Variable Name: ci
Description: Proportion of annual servings of the ith food category that reaches final consumers through a retail establishment.
Data Found: The parameter ci is the fraction of annual servings of the ith food category that reaches consumers through retail establishments. The parameter (1 – ci), which appears in the FHPM in the household channel, is the complementary fraction of the ith food category that reaches households without passing through a retail food establishment. Thus, estimating ci allows us to calculate the complement, (1 – ci).
The CSFII collects data on food products (and ingredients) and the corresponding source of food products consumed by survey respondents. We organized the food sources according to the two channels of the model (retail and household). We then grouped each ingredient by food category and totaled the weights of the food category by channel. Using this information, we calculated the proportion of each food category going to the retail establishments, ci , and directly to households without first passing through the retail channel, (1 – ci). This methodology was used for all food categories except for water.
The International Bottled Water Association (IBWA) posted survey results on its website, stating that 62 percent of daily per capita water consumption was from tap water sources (including well and municipal water), and the remaining 38 percent was from bottled water sources. RTI disaggregated the tap water into retail and household, using overall food consumption data from the CSFII. We inferred that 100 percent of bottled water was from retail services. The retail portion of tap water was added to the proportion of bottled water to determine the ci for water.
Sources:
International Bottled Water Association. “Survey: America’s Poor Drinking Habits Contradict Knowledge of Health Risks.” <http://www.bottledwater.org/public/InfoRepNatFactSheettest.htm>. Accessed March 24, 2003.
U.S. Department of Agriculture, Agricultural Research Service. 2000a. “Continuing Survey of Food Intakes by Individuals 1994-96, 1998.” CD-ROM.

Section 3 —Calibration of the Food Handling Practices Model
3-25
Variable Name: bij
Description: Proportion of total annual servings of ith food category served or sold to consumers by the jth category of retail food establishment.
Data Found: The CSFII provides 11 categories of retail food sources. Because these categories did not match those listed in the FHPM Retail Categories, we grouped the CSFII data into three retail groups: retail food stores, restaurants, and institutions. For each of the three retail groups, we aggregated the ingredient weights into the seven food categories listed in the model. For each combination of food category and retail group, we converted the gram weights into number of servings using individual serving size estimates.
The Economic Research Service and the Economic Census publish annual sales estimates for various types of retail categories. These reports provide data for all retail categories included in the FHPM with the exception of mixed-service restaurants. RTI used reported annual sales figures to estimate proportions within the three broad retail groups for which we had consumption estimates (retail food stores, restaurants, and institutions). We multiplied the number of servings by the proportion of food represented by the corresponding food category and then multiplied this by the proportion represented by each retail category. We summed the ingredient weights for all retail categories and estimated the proportion of each food category prepared by each retail category.
Sources:
U.S. Census Bureau. 2001. Summary 1997 Economic Census, Retail Trade, Subject Series. EC97R445-SM. Washington, DC: U.S. Department of Commerce.
U.S. Department of Agriculture, Agricultural Research Service. 2000a. “Continuing Survey of Food Intakes by Individuals 1994-96, 1998.” CD-ROM.
U.S. Department of Agriculture, Economic Research Service. “Food Market Structures: Food Retailing and Food Service.” <http://www.ers.usda.gov/Briefing/FoodMarketStructures/foodservice.htm>. Updated December 8, 2000.

Modeling the Effects of Food Handling Practices on the Incidence of Foodborne Illness
3-26
Variable Name: gij
Description: Proportion of annual servings of the ith food category bought by consumers from the jth category of retail food establishment for further preparation by households, which have been further handled or repackaged by the retail establishment
Data Found: RTI added this share parameter to the model too near the end of the project to identify estimates.
Variable: P(B’jk)
Description: Probability of occurrence of the kth contributing factor that may contaminate food in the jth category of retail food establishment.
Data Found: For this parameter, we relied on both secondary literature sources and estimates obtained from the expert elicitation. RTI located two secondary sources applicable to this parameter: an FDA study that analyzed contamination factors at retail food stores,2 full-service and fast-food restaurants, nursing homes, hospitals, and elementary schools and a study that observed food handling practices at a temporary food service establishment (a state fair).
Contamination factors studied in the FDA report include inappropriate hand washing and sanitation of cooking utensils and equipment. The factors examined in the state fair study include bare-hand contact with RTE food and inappropriate hand washing. We did not find secondary data on the prevalence of inappropriate sanitation of cutting boards, inappropriate gloved-hand contact with food, or food handling by ill or colonized, asymptomatic persons. We identified other studies that report the prevalence of contributing factors but excluded them because they were conducted in other countries or they report results that are more than 10 years old.
For our national baseline scenario calibration of the FHPM, we computed a simple average of the estimates gleaned from the secondary literature and estimates provided by the expert panelists.
2Handling practices at retail food stores were observed in three departments of the
store (meat, produce, and deli). We calculated a weighted average, using sample size as the basis for weighting, across the three departments to estimate the prevalence at retail food stores.

Section 3 —Calibration of the Food Handling Practices Model
3-27
Sources: Food and Drug Administration, Retail Food Program Steering
Committee. 2000. “Report of the FDA Retail Food Program Database of Foodborne Illness Risk Factors.”
Kendall, David, Catherine Viator, and Becky Durocher. February 28, 2003. “Modeling the Effects of Food Handling Practices on the Incidence of Foodborne Illness.” Second Draft Report. Prepared for the Food and Drug Administration. Research Triangle Park, NC: RTI International.
Manning, C., and S. Snider. 1993. “Temporary Public Eating Places: Food Safety Knowledge, Attitudes, and Practices.” Journal of Environmental Health 56(1):24-28.
Variable Name: P(C’jk|B’jk)
Description: Probability that occurrence of the kth contributing factor contaminates food in the jth category of retail establishment.
Data Found: RTI found no secondary sources that report conditional probabilities. Thus, to create the national baseline scenario calibration we used estimates generated by the expert elicitation for this category of parameter. RTI calculated a simple average of the estimates submitted by the individual expert panelists.
Source:
Kendall, David, Catherine Viator, and Becky Durocher. February 28, 2003. “Modeling the Effects of Food Handling Practices on the Incidence of Foodborne Illness.” Second Draft Report. Prepared for the Food and Drug Administration. Research Triangle Park, NC: RTI International.
Household Channel
Variable Name: (1 – ci)
Description: Proportion of annual servings of the ith food category that reaches final consumers without passing through retail establishments.
Data Found: See explanation for ci in the retail channel.
Source:
U.S. Department of Agriculture, Agricultural Research Service. 2000a. “Continuing Survey of Food Intakes by Individuals 1994-96, 1998.” CD-ROM.

Modeling the Effects of Food Handling Practices on the Incidence of Foodborne Illness
3-28
Variable Name: 1-gij
Description: Proportion of annual servings of the ith food category bought by consumers from the jth category of retail food establishment, as packaged by the final manufacturing source, without further preparation by the retail establishment
Data Found: RTI added this share parameter to the model too near the end of the project to identify estimates.
Variable Name: uj
Description: Proportion of annual servings of food that are prepared by the jth category of household.
Data Found: Using the CSFII data collected on household characteristics, we classified all households in the sample according to the definitions of household categories in the FHPM. We classified all remaining households in the CSFII sample in a NOL category. Using the CSFII data on food sources, we summed all ingredients going into the household channel of the model and determined the percentage of ingredients for each household type.
Source:
U.S. Department of Agriculture, Agricultural Research Service. 2000. “Continuing Survey of Food Intakes by Individuals 1994-96, 1998.” CD-ROM.
Variable Name: P(B*jk)
Description: Probability of occurrence of the kth contributing factor that may contaminate food in the jth category of household.
Data Found: Data on food handling practices of households are typically self-reported survey data. Only rarely are results based on direct observation by researchers. Many of the studies are longitudinal, which provides data over time for specific contributing factors. The contributing factors most commonly studied include inappropriate hand washing and cross-contamination from cutting boards. Factors not typically studied at the household level include gloved-hand contact with food and food handling by colonized, asymptomatic carriers.
Numerous studies have been published on the prevalence of contributing factors that may contaminate food at the household

Section 3 —Calibration of the Food Handling Practices Model
3-29
level. However, categories of households typically reported do not correspond to those used in the FHPM. Furthermore, the contributing factors analyzed in such studies do not exactly match those defined in the FHPM. For these reasons, RTI augmented secondary data with estimates generated by expert elicitation.
RTI used data from FDA’s Food Safety Survey as the primary dataset for this parameter, grouping responses according to the household categories defined in the FHPM. We created a NOL category for the household types in the Food Safety Survey that did not match those specified in the FHPM. The Food Safety Survey analyzed three contributing factors that corresponded to the household channel of the contamination stage of the FHPM: inappropriate hand washing, cross-contamination from cutting boards, and cross-contamination from other sources. We calculated a weighted average when multiple questions were asked that addressed the same contributing factor with the number of sample points as the basis for weighting.
RTI found one study that analyzed food preparation by ill household members. Because the study did not differentiate its results by type of household, we applied the percentage found in the study to all household categories of the FHPM.
Sources:
Altekruse, S., S. Yang, B. Timbo, and F. Angulo. 1999. “A Multi-State Survey of Consumer Food-Handling and Food-Consumption Practices.” American Journal of Preventative Medicine 16(3):216-221.
Audits International. “Audits International’s Home Food Safety Survey.” <http://audits.com/Report.html>. Accessed September 20, 2002.
Centers for Disease Control and Prevention, FoodNet. Revised July 20, 2000. “Population Survey Atlas of Exposures: 1998–1999.” <http://www.cdc.gov/foodnet/surveys/ Pop_surv.htm>. Accessed March 4, 2002.
Kendall, David, Catherine Viator, and Becky Durocher. February 28, 2003. “Modeling the Effects of Food Handling Practices on the Incidence of Foodborne Illness.” Second Draft Report. Prepared for the Food and Drug Administration. Research Triangle Park, NC: RTI International.

Modeling the Effects of Food Handling Practices on the Incidence of Foodborne Illness
3-30
Shiferaw, B., et al. 2000. “Prevalence of High-Risk Food Consumption and Food Handling Practices Among Adults: A Multistate Survey, 1996-1997.” Journal of Food Protection 63(11):1538-1543.
U.S. Food and Drug Administration/Food Safety and Inspection Service (FDA/FSIS). 2001. “Food Safety Survey.” Washington, DC.
Variable Name: P(C*jk |B*jk)
Description: Probability that occurrence of the kth contributing factor contaminates a serving of food in the jth category of household.
Data Found: RTI found no secondary sources that report conditional probabilities. Thus, to create the national baseline scenario calibration, we used estimates generated by the expert elicitation for this category of parameter. RTI calculated a simple average of the estimates submitted by the individual expert panelists.
Source:
Kendall, David, Catherine Viator, and Becky Durocher. February 28, 2003. “Modeling the Effects of Food Handling Practices on the Incidence of Foodborne Illness.” Second Draft Report. Prepared for the Food and Drug Administration. Research Triangle Park, NC: RTI International.
3.3.3 Retail and Household Pathogen Control Stage
The pathogen control stage of the model also has two channels: retail and household. Many of the studies analyzing contributing factors that contaminate food also look at contributing factors that allow pathogens to survive and grow.
Retail Channel
Variable Name: wj
Description: Proportion of annual servings of food sold by the jth category of retail food establishment that is consumed without further preparation by a household.
Data Found: Because restaurants and institutions prepare and sell RTE foods with only minor exception, RTI set the share consumed without further preparation by households to 100 percent. For retail food stores, the opposite is true; most food sold by retail food stores
Section 3 —Calibration of the Food Handling Practices Model
3-31
is further prepared by a household before consumption. Two trade associations proved helpful information for estimating wj for grocery stores and convenience stores. By coincidence, the estimates for grocery stores and convenience stores were the same. RTI attempted to locate an estimate of wj for seafood stores through web searches and several e-mails and phone calls to trade associations, independent consultants, personal contacts in the food industry, and government sources. However, we did not find a reliable, accurate estimate. Therefore, we used the same estimate for seafood stores that we found for grocery stores and convenience stores.
Sources:
Food Marketing Institute. 2002. “Facts and Figures: Supermarket Sales by Department.” <http://www.fmi.org/facts_figs/ keyfacts/grocerydept.htm>.
National Association of Convenience Stores (NACS). 2002. “Convenience Store Industry: Totals, Trends, and Averages.” <http://www.nacsonline.com/PDFs/soihighlights2002.pdf>.
Variable Name: P(B”jk)
Description: Probability of occurrence of the kth contributing factor that may allow pathogen survival and growth in the jth category of retail food establishment.
Data Found: RTI found only one published study that analyzed food handling factors that may allow growth of pathogens in food. The study we found analyzed only three factors: inappropriate time or temperature for hot holding, inappropriate time or temperature for cold holding, and inappropriate time or temperature for cooling. Thus, we used estimates from the expert elicitation to assist in estimating this parameter.
Holding temperatures are the contributing factors most commonly studied at the retail level. Factors that have not been studied include inappropriate advance preparation, food kept at room temperature for too long, and inappropriate thawing of frozen foods.
Sources:
Modeling the Effects of Food Handling Practices on the Incidence of Foodborne Illness
3-32
Kendall, David, Catherine Viator, and Becky Durocher. February 28, 2003. “Modeling the Effects of Food Handling Practices on the Incidence of Foodborne Illness.” Second Draft Report. Prepared for the Food and Drug Administration. Research Triangle Park, NC: RTI International.
U.S. Food and Drug Administration Retail Food Program Steering Committee. 2000. “Report of the FDA Retail Food Program Database of Foodborne Illness Risk Factors.”
Variable Name: P(C’’jk |B’’jk)
Description: Probability that occurrence of the kth contributing factor in the jth retail establishment allows pathogens to survive or grow on a serving of pathogen-contaminated food.
Data Found: RTI found no secondary sources that report conditional probabilities. Thus, to create the national baseline scenario calibration, we used estimates generated by the expert elicitation for this category of parameter. RTI calculated a simple average of the estimates submitted by the individual expert panelists.
Source:
Kendall, David, Catherine Viator, and Becky Durocher. February 28, 2003. “Modeling the Effects of Food Handling Practices on the Incidence of Foodborne Illness.” Second Draft Report. Prepared for the Food and Drug Administration. Research Triangle Park, NC: RTI International.
Household Channel
Variable Name: (1 – wj)
Description: Proportion of annual servings of food sold by the jth retail food service establishment that is further prepared by households before consumption.
Data Found: See explanation for wj in the retail channel.
Sources:
Food Marketing Institute—Facts and Figures. November 2002. “Key Facts. Supermarket Sales by Department—Percent of Total Supermarket Sales.” <http://www.fmi.org/facts_figs/ keyfacts/grocerydept.htm>. Accessed December 4, 2002.
Section 3 —Calibration of the Food Handling Practices Model
3-33
National Association of Convenience Stores (NACS). 2002. “Convenience Store Industry: Totals, Trends, and Averages.” <http://www.nacsonline.com/PDFs/soihighlights2002.pdf>.
Variable Name: P(B**jk)
Description: Probability of the occurrence of the kth contributing factor that may allow survival and growth of pathogens in food in the jth category of household.
Data Found: Similar to parameter P(B*jk), RTI used data from FDA’s Food Safety Survey as the primary dataset to estimate the parameter P(B**jk). We grouped responses according to the household categories defined in the FHPM. We created a NOL category for the household types in the Food Safety Survey that did not match those specified in the FHPM. The Food Safety Survey analyzed three contributing factors that corresponded to this stage and channel of the FHPM: food served raw or undercooked, improper leftover procedures, and improper thermometer use when cooking. We calculated a weighted average when multiple questions were asked that addressed the same contributing factor, with the number of sample points as the basis for weighting.
We also used other studies when appropriate. However, these studies did not report their findings using the household categories defined in the FHPM. RTI used the reported average among all households and set this equal to all household categories. Factors most commonly studied include inappropriate time or temperature for holding and foods served raw or undercooked. Foods that are typically associated with undercooking include hamburgers, eggs, oysters, and unpasteurized milk. The factors allowing pathogens to grow that have not been studied include food kept at room temperature too long, inappropriate time or temperature for hot holding, and inappropriate time or temperature for reheating.
RTI averaged all secondary findings with the estimates provided by the expert panel.
Sources:
Altekruse, S., S. Yang, B. Timbo, and F. Angulo. 1999. “A Multi-State Survey of Consumer Food-Handling and Food-Consumption Practices.” American Journal of Preventative Medicine 16(3):216-221.

Modeling the Effects of Food Handling Practices on the Incidence of Foodborne Illness
3-34
Audits International. “Audits International’s Home Food Safety Survey.” <http://audits.com/Report.html>. Accessed September 20, 2002.
Centers for Disease Control and Prevention, FoodNet. Revised July 20, 2000. “Population Survey Atlas of Exposures: 1998–1999.” <http://www.cdc.gov/foodnet/surveys/ Pop_surv.htm>. Accessed March 4, 2002.
Kendall, David, Catherine Viator, and Becky Durocher. February 28, 2003. “Modeling the Effects of Food Handling Practices on the Incidence of Foodborne Illness.” Second Draft Report. Prepared for the Food and Drug Administration. Research Triangle Park, NC: RTI International.
Shiferaw, B., et al. 2000. “Prevalence of High-Risk Food Consumption and Food Handling Practices Among Adults: A Multistate Survey, 1996-1997.” Journal of Food Protection 63(11):1538-1543.
Spectrum Consulting. 2000. “A Camera’s View of Consumer Food Handling and Preparation Practices.” Final Report. Logan UT: Spectrum Consulting.
U.S. Food and Drug Administration/Food Safety and Inspection Service (FDA/FSIS). 2001. “Food Safety Survey.” Washington, DC.
Variable Name: P(C**jk|B**jk)
Description: Probability that occurrence of the kth contributing factor allows pathogens to survive or grow on a serving of pathogen-contaminated food prepared in the jth category of household
Data Found: RTI found no secondary sources that report conditional probabilities. Thus, to create the national baseline scenario calibration, we used estimates generated by the expert elicitation for this category of parameter. RTI calculated a simple average of the estimates submitted by the individual expert panelists.
Source:
Kendall, David, Catherine Viator, and Becky Durocher. February 28, 2003. “Modeling the Effects of Food Handling Practices on the Incidence of Foodborne Illness.” Second Draft Report. Prepared for the Food and Drug Administration. Research Triangle Park, NC: RTI International.

Section 3 —Calibration of the Food Handling Practices Model
3-35
3.3.4 Foodborne Illness Stage
In the FHPM, we define the probability
P(FBI) = P(ingesting a serving of pathogen-contaminated food causes a “noticeable” case of foodborne illness).
By “noticeable,” we mean that the illness produces symptoms that are apparent to the patient, even though the symptoms may not be identified by the patient as related to an FBI and may not be severe enough to require medical treatment. The FHPM further partitions FBI as follows:
1. Untreated FBI
2. Medically treated FBI
a. Physician treated FBI
b. Hospitalizations
c. Deaths
Cases of untreated FBI are those for which the patient does not seek professional medical treatment.3 Medically treated FBI comprises three subcategories: physician treated, hospitalizations, and deaths. The three subcategories of medically treated FBI are not mutually exclusive. In the FHPM, we assume that all hospitalizations and deaths are physician treated, and all deaths are first hospitalizations, but not all physician-treated cases result in hospitalization or death.
P(FBI) is a probability parameter used in the FHPM to define binomial distributions for two random variables: FBIR for the retail channel and FBIH for the household channel. In the FHPM, D and E are also binomial random variables, where D is annual servings of pathogen-contaminated food prepared in the retail channel, and E is annual servings of pathogen-contaminated food prepared in the household channel. Thus,
FBIR~B[D, P(FBI)], for the retail channel;
FBIH~B[E, P(FBI)], for the household channel; and
FBI = FBIR + FBIH = annual cases of FBI.
To estimate annual cases of FBI using the FHPM, we must assign a numerical value for the parameter P(FBI). But it is also possible to
3We include self treatment using over-the-counter (OTC) medications in the
untreated category.

Modeling the Effects of Food Handling Practices on the Incidence of Foodborne Illness
3-36
estimate a value for P(FBI) using the FHPM, if the user supplies an estimate of total annual FBI. For example, using the estimate from Mead et al. (1999) that annual FBI = 76,000,000, and combining this estimate with expected values for the binomial random variables D and E simulated by FHPM, we can estimate P(FBI) such that the expected value of FBI is 76,000,000 as follows:
FBI = FBIR + FBIH
Exp[FBI] = Exp(FBIR) + Exp[FBIH]
Exp[FBI] = D[P(FBI)] + E[P(FBI)], since FBIR ~B(D, P(FBI)) and
FBIH ~B(E, P(FBI))
76,000,000 = P(FBI)[Exp(D) +Exp(E)]
P(FBI) = 76,000,000/[Exp(D) + Exp(E)]
The FHPM simulates the distributions of D and E and hence provides Exp(D) and Exp(E), which allows us to calculate a value for P(FBI) that yields the result of Mead et al. (1999) at the mean.
Figures 3-3 and 3-4 provide Venn diagrams that depict the relationships in the FHPM among FBIU, FBIM, FBIH, FBID, FBIM-H-D, and FBIH-D. The notation M~H~D means FBI that is medically treated but does not result in death or hospitalization; the notation H~D means FBI that results in hospitalization but not death.
In terms set notation, the following relationships hold:
FBI = FBIU c FBIM
FBIU 1 FBIM = ∅
FBIH = FBIM 1 FBIH , because all cases of hospitalization are also medically treated
FBID = FBIH 1 FBID, assuming all deaths are first hospitalizations
FBIM-H-D = annual cases of medically treated FBI that are treated by a physician but do not result in hospitalization or death, such that
FBIM = FBIM-H-D c (FBIM 1 ~FBID) c FBID
= FBIM-H-D c FBIH-D c FBID

Section 3 —Calibration of the Food Handling Practices Model
3-37
Figure 3-3. Venn Diagram of Untreated and Medically Treated Foodborne Illness
Figure 3-4. Venn Diagram for Partitioning Medically Treated Foodborne Illness
In Figure 3-4, FBIM-H-D is depicted as the darker gray-shaded area, and FBIH-D is the lighter-gray-shaded area.
FBIU and FBIM are mutually exclusive; FBIH is a subset of FBIM, and FBID is a subset of FBIH. In other words, untreated cases and medically treated cases are distinct with no intersection, all
FBI
FBIU FBID FBIH~D
FBIM~H~D
FBI
FBIU FBIM

Modeling the Effects of Food Handling Practices on the Incidence of Foodborne Illness
3-38
hospitalizations are medically treated cases, and all deaths are hospitalizations.
For example, if FBIM-H-D = 88, FBIH-D = 10, and FBID = 2, then FBIM = 88+10+2 = 100, and FBIH =12.
In terms of probability we may write the following:
P(FBI) = P(FBIU) + P(FBIM)
P(FBIM) = P(FBIM-H-D) + P(FBIH)
P(FBI) = P(FBIU) + P(FBIM-H-D) + P(FBIH)
P(FBIH|FBIM) = P(H 1 M)/P(FBIM) = P(FBIH)/P(FBIM)
P(FBID|FBIH) = P(D 1 H)/P(FBIH) = P(FBID)/P(FBIH)
Variable Name: P(FBI)
Description: Probability that ingesting a serving of pathogen-contaminated food results in a noticeable case of FBI.
Data Found: RTI found no data from secondary sources to estimate P(FBI) but did find data in Mead et al. (1999) that allowed us to calibrate a value for P(FBI) that generates 76,000,000 annual cases of FBI at the mean of the distribution for FBI simulated by the FHPM, as described above.
Source:
Mead, P., et al. 1999. “Food-Related Illness and Death in the United States.” Emerging Infectious Diseases 5(5):607-625.
Variable Name: P(FBIM)
Description: Probability that ingesting a serving of pathogen-contaminated food results in a case of FBI sufficiently severe that treatment by a physician is sought.
Data Found: Using data from a FoodNet population survey, Hedberg et al. (1997) reports that 88 of 1,100 respondents with nonbloody diarrhea sought medical attention. Based on this information, we estimate that P(FBIM) = 88 / 1,100, or 0.08.

Section 3 —Calibration of the Food Handling Practices Model
3-39
Source:
Hedberg, C., F. Angulo, J. Townes, et al. 1997. “Differences in Escherichia coli 0157:H7 Annual Incidence among FoodNet Active Surveillance Sites.” Poster presented at FoodNet Conference, Baltimore, MD, June 22-26, 1997.
Variable Name: P(FBIH|FBIM)
Description: Probability that a case of FBI that requires professional medical treatment becomes sufficiently severe to require hospitalization:
P(FBIH|FBIM) = P(FBIH)/P(FBIM)
P(FBIH) = FBIH/FBI
Data Found: RTI used estimates from Mead et al. (1999) to estimate the probability of FBIs resulting in hospitalization or death. Mead et al. estimated annual cases of FBI using data from active, passive, and outbreak surveillance reporting systems. Although Mead et al. presents estimates of hospitalization and fatality rates for specific pathogens, it does not report the proportion of illnesses that are treated vs. untreated.
Mead et al. (1999) estimate the number of hospitalizations attributable to FBI as 323,000. Using this estimate and the equations above, we estimate the parameter P(FBIH) = 323,000 / 76 million = 0.00425 and
P(FBIH|FBIM) = P(FBIH)/P(FBIM) = 0.00425/0.08 = 0.053125.
Source:
Mead, P., et al. 1999. “Food-Related Illness and Death in the United States.” Emerging Infectious Diseases 5(5):607-625.
Variable Name: P(FBID|FBIH)
Description: Probability that a case of FBI that requires medical treatment by a physician becomes sufficiently severe that death occurs:
P(FBID|FBIH) = P(FBID)/P(FBIH)
P(FBID) = FBID/FBI
P(FBIH) = FBIH/FBI

Modeling the Effects of Food Handling Practices on the Incidence of Foodborne Illness
3-40
Data Found: Mead et al. (1999) estimated the number of deaths attributable to FBI as 5,200. Using this estimate and the equations above, we estimated the parameter P(FBID|FBIH) = P(FBID)/P(FBIH) = 0.00006842/0.00425 = 0.01609907.
Source:
Mead, P., et al. 1999. “Food-Related Illness and Death in the United States.” Emerging Infectious Diseases 5(5):607-625.

4-1
Using the Food Handling Practices 4 Model
The FHPM allows users to estimate change in annual cases of FBI, given one or more changes in the prevalence of food handling practices employed in retail food establishments or in households. In this section, we discuss the nature and interpretation of baseline scenarios and change scenarios. We demonstrate with a hypothetical example how the operational FHPM can be used for benefit analysis of food safety regulation. Section 4 concludes with a discussion of potential applications of the FHPM.
4.1 CALIBRATING BASELINE AND CHANGE SCENARIOS Although the model has several potential uses, the primary purpose of the FHPM is to allow users to analyze the effect of changes in food handling practices on the incidence of FBI. To produce quantitative estimates of change in FBI, given change in one or more food handling practices, users conduct the following steps:
1) Define a Baseline Scenario
2) Calibrate the Baseline Scenario
3) Simulate FBI for the Baseline Scenario
4) Define a Change Scenario
5) Recalibrate the FHPM for the Change Scenario
6) Simulate the Change Scenario
7) Compare Output of the FHPM for the Baseline and Change Scenarios

Modeling the Effects of Food Handling Practices on the Incidence of Foodborne Illness
4-2
4.1.1 Defining a Baseline Scenario
RTI designed the FHPM to be flexible enough to permit a wide variety of applications, but with flexibility comes a potential for misinterpretation of the model’s outputs. Appropriate interpretation of the model’s outputs begins with a concrete definition of the baseline scenario. To define a baseline scenario, users must consider the following elements:
Z geographic region (city, state, region, nation),
Z time period,
Z food categories,
Z pathogens,
Z retail establishment categories, and
Z household categories.
For example, a user might define the following baseline scenario:
Z geographic region: New York City;
Z time period: 2003;
Z food categories: dairy and eggs;
Z retail establishment categories: full-service restaurants;
Z household categories: none; and
Z pathogens: Salmonella Enteritidis and Listeria monocytogenes.
Given this definition of the baseline scenario, output of the FHPM must be interpreted to apply only to the limited conditions defined by the baseline scenario. For example, the user would need to understand that output of the FHPM for this baseline scenario would not include FBI due to any pathogens other than Salmonella Enteritidis and Listeria monocytogenes and would not include FBI for any retail establishment other than full-service restaurants. Although this caveat—that interpretation of outputs depends on the definition of the baseline scenario—may seem obvious, it could be overlooked.
Given the above definition of the baseline scenario, the user would set many probability parameters in the FHPM to zero to calibrate the defined baseline scenario appropriately. For example, all source contamination probabilities other than those for Salmonella Enteritidis and Listeria monocytogenes would be set to zero by the user for the food categories of dairy and eggs. Annual servings of

Section 4 — Using the Food Handling Processes Model
4-3
food for food categories other than dairy and eggs would also be set to zero, and the values set for dairy and eggs must be calibrated to reflect consumption in New York City. If by mistake the user included a nonzero probability for some other pathogen—say Bacillus cereus for dairy—the output of the FHPM could easily be misinterpreted, leading to an overestimate of FBI associated only with Salmonella Enteritidis and Listeria monocytogenes in dairy products or egg products.
To summarize, appropriate interpretation and calibration of the baseline scenario is completely dependent on the definition of the baseline scenario, which by the user determines.
4.1.2 Calibrating a Baseline Scenario
The FHPM comprises up to 1,546 nonzero parameters. A baseline scenario is a complete specification of all 1,546 parameters in the FHPM. Depending on the specified definition of a baseline scenario, many parameters may require zero values. Given the large number of parameters available in the model, users will typically begin any specific analysis by modifying a baseline scenario that has been previously saved in the baseline scenario database. To meet the objectives of Task Order 1, RTI developed a calibration for a national baseline scenario, which we describe in detail in Section 3 of this report. The baseline scenario database also includes a zero baseline scenario, which can serve as the starting point for any baseline scenario users may wish to define and calibrate.
To calibrate a new baseline scenario in the FHPM, users may modify an existing baseline scenario by entering values through the user interface, or they can modify parameter values directly on the worksheets that make up the FHPM. Once users make appropriate modifications to calibrate baseline scenarios they define, they can save them to the baseline scenario database, ready to be reloaded in the future for analysis.
4.1.3 Defining a Change Scenario
In the FHPM, a change scenario is a complete set of calibration values for parameters in the model. The user compares the change scenario to the baseline scenario to determine if changes in parameter values implementation of a regulation, rule, or any other
Modeling the Effects of Food Handling Practices on the Incidence of Foodborne Illness
4-4
change occur because of analysis. To define a change scenario, users must
Z carefully specify the change (e.g., implementation of a new rule, which they expect to have some impact on annual FBI;
Z identify each parameter in the baseline scenario they expect will change under the change scenario; and
Z estimate new values for parameters they expect to change under the change scenario.
For example, given the hypothetical definition for the baseline scenario above, suppose that the FHPM produced a simulated result that total annual FBI would be 35,000 cases in New York City in 2003, because pathogen contamination of dairy or egg products by Salmonella Enteritidis and Listeria monocytogenes in full-service restaurants. Further suppose that New York public health officials want to analyze the potential effects of implementing a new food handling rule that mandates no bare-hand contact with RTE dairy products or eggs. Suppose also that, under the baseline scenario, the probability of occurrence of bare-hand contact with RTE food in full-service restaurants had been calibrated to 0.195.
Under the change scenario, the analyst may decide to recalibrate the probability of occurrence of bare-hand contact with RTE food in full-service restaurants to 0.0, which may be appropriate assuming full compliance with the new rule when it is implemented. Alternatively, the analyst may recalibrate the same probability to 0.0975, which might be appropriate if the analyst thinks that implementing the new rule will not eliminate the contributing factor of bare-hand contact with RTE dairy product and eggs in full-service restaurants but will reduce the prevalence of the contributing factor to half its baseline value.
4.1.4 Calibrating for a Change Scenario
To calibrate a change scenario in the FHPM, users must first run a baseline simulation for the baseline scenario. Users may then recalibrate appropriate parameters for the change scenario by entering values through the user interface, or they can modify parameter values directly on the worksheets that make up the FHPM.

Section 4 — Using the Food Handling Processes Model
4-5
4.2 ADVANCED USE OF THE FHPM The Monte Carlo simulation engine used by the FHPM is @Risk. Consequently, users who are familiar with @Risk can use the full graphical and analytical power of the software to create user-specified graphs, conduct sensitivity analysis, and run multiple scenarios. The user interface provided with Version 1.0 of the FHPM provides for efficient and easy use of the model, which precludes incorporating many of the features of @Risk.
Users familiar with Microsoft Access and Excel will also have additional options for using the FHPM. For example, skilled users of the FHPM may find it convenient to enter values for a baseline calibration directly in the baseline scenarios database. Users skilled with Excel’s graphical capabilities may find it convenient to create customized reports directly from the model’s output, instead of using the limited graphical displays provided through the user interface.
To build flexibility into the FHPM, RTI included user-definable categories for foods, retail establishments, households, and contributing factors. In the model, user-definable categories are denoted [name] A and [name] B (e.g., Food A, Restaurant B). This feature of the FHPM allows users to include any type of food, retail establishment, household, or contributing factor that holds special interest for a specific analysis.
4.3 POTENTIAL APPLICATIONS OF THE FHPM As noted before, the primary purpose of developing the FHPM is to give FDA analysts a user-friendly tool for estimating changes in annual cases of FBI, given one or more changes in the prevalence of food handling practices employed in retail food establishments or in households. Output of the FHPM will often be an intermediate step in a complete analysis of public health benefits attributable to changes in food safety rules. Although RTI designed the FHPM to accomplish this primary purpose, users should find that the FHPM offers value for other types of analysis as well. For example, the list below is suggestive but not exhaustive:
Z estimating annual FBI in the United States, based on independent primary research that estimates P(FBI);

Modeling the Effects of Food Handling Practices on the Incidence of Foodborne Illness
4-6
Z estimating the share of FBI in the United States attributable to pathogen-contaminated food served by retail establishments vs. food prepared by households;
Z comparing shares of FBI attributable to different categories of retail establishments or household categories;
Z analyzing the potential effects of FBI on advances in pharmacology that may reduce risk for specific populations now at greater risk for FBI, due to compromised immune systems;
Z analyzing the potential effects on FBI of reducing source contamination of specific food categories; and
Z estimating annual cases of FBI attributable to specific pathogen-food combinations.
One fact that has become well known to researchers working on Task Order 1 is the potential for evaluating estimates of particular risks or contamination prevalence produced through independent primary research. Using the FHPM, researchers can explore the implications of the estimates they produce, making it possible to judge the validity of new and old estimates.

R-1
References
Altekruse, S.F., S. Yang, B.B. Timbo, and F.J. Angulo. 1999. “A Multi-State Survey of Consumer Food-Handling and Food-Consumption Practices.” American Journal of Preventive Medicine 16(3):216-221.
Audits International. “Audits International’s Home Food Safety Survey.” <http://audits.com/Report.html>. Accessed September 20, 2002.
Berrang, M.E., C.E. Lyon, and D.P. Smith. 2000. “Incidence of Listeria Monocytogenes on Pre-Scald and Post-Chill Chicken.” Journal of Applied Poultry Research 9:546-550.
Beuchat, L.R. “Pathogenic Microorganisms Associated with Fresh Produce.” Journal of Food Protection 59(2):204-216.
Centers for Disease Control and Prevention, FoodNet. Revised July 20, 2000. “Population Survey Atlas of Exposures: 1998–1999.” <http://www.cdc.gov/foodnet/surveys/ Pop_surv.htm>. Accessed March 4, 2002.
Cox, N.A., J.S. Bailey, and M.E. Berrang. 1997. “The Presence of Listeria Monocytogenes in the Integrated Poultry Industry.” Journal of Applied Poultry Research 6:116-119.
Duffy, E.A., K.E. Belk, J.N. Sofos, G.R. Bellinger, A. Pape, and G.C. Smith. 2001. “Extent of Microbial Contamination in United States Pork Retail Products.” Journal of Food Protection 64(2):172-178.
Ebel, Eric, and Wayne Schlosser. 2000. “Estimating the Annual Fraction of Eggs Contaminated with Salmonella Enteritidis in the United States.” International Journal of Food Microbiology 61(1):51-62.

Modeling the Effects of Food Handling Practices on the Incidence of Foodborne Illness
R-2
Elliott, E., and J. Kevenberg. 2000. “Risk Assessment Used to Evaluate the U.S. Position on Listeria Monocytogenes in Seafood.” International Journal of Food Microbiology 62(3):253-260.
Farber, J. 2000. “Present Situation in Canada Regarding Listeria Monocytogenes and RTE Seafood Products.” International Journal of Food Microbiology 62(3):247-251.
Food Marketing Institute—Facts and Figures. November 2002. “Key Facts. Supermarket Sales by Department—Percent of Total Supermarket Sales.” <http://www.fmi.org/facts_figs/ keyfacts/grocerydept.htm>. Accessed December 4, 2002.
Hedberg, C., F. Angulo, J. Townes, et al. 1997. “Differences in Escherichia coli 0157:H7 annual incidence among FoodNet active surveillance sites.” Poster presented at FoodNet Conference, Baltimore, MD, June 22-26, 1997.
International Bottled Water Association. “Survey: America’s Poor Drinking Habits Contradict Knowledge of Health Risks.” <http://www.bottledwater.org/public/InfoRepNatFactSheettest.htm>. Accessed March 24, 2003.
Jay, J.M. 1996. “Prevalence of Listeria spp. in Meat and Poultry Products.” Food Control 7(4/5):209-214.
Levine, P., B. Rose, S. Green, G. Ransom, and W. Hill. 2001. “Pathogen Testing of Ready-to-Eat Meat and Poultry Products Collected at Federally Inspected Establishments in the United States, 1990 to 1999.” Journal of Food Protection 64(8):1188-1193.
Lucier, Gary, Susan Pollack, and Agnes Perez. November 1997. “Import Penetration in the U.S. Fruit and Vegetable Industry.” Vegetables and Specialties/VGS-273. Washington, DC: USDA, ERS. <http://www.ers.usda.gov/ briefing/vegetables/vegpdf/Import Pen.pdf.>
Manning, Carol K., and Sue O. Snider. 1993. “Temporary Public Eating Places: Food Safety Knowledge, Attitudes and Practices.” Journal of Environmental Health 56(1):24-28.
Mead, P., et al. 1999. “Food-Related Illness and Death in the United States.” Emerging Infectious Diseases 5(5):607-625.
National Association of Convenience Stores (NACS). 2002. “Convenience Store Industry: Totals, Trends & Averages.” <http://www.nacsonline.com/PDFs/soihighlights2002.pdf>.

References
R-3
National Chicken Council. Eat Chicken.com. “Per Capita Consumption of Poultry and Livestock, in Pounds, 1960 to Estimated 2002.” <http://www.eatchicken.com/ statistics/consumption_pounds_60_02.cfm>. Accessed December 11, 2002.
National Marine Fisheries Service, Office of Science and Technology, Fisheries Statistics and Economics Division. “Commercial Fisheries. Data Caveats.” <http://www.st.nmfs.gov/st1/commercial/landings/caveat.html>. Accessed November 13, 2002.
National Marine Fisheries Service, Office of Science and Technology, National Marine Fisheries Service. Annual Commercial Landing Statistics. <http://www.st.nmfs.gov/ commercial/landings/annual_landings.html>. Accessed November 13, 2002.
Scanga, J.A., A.D. Grona, K.E. Belk, J.N. Sofos, G.R. Bellinger, and G.C. Smith. 2000. “Microbiological Contamination of Raw Beef Trimmings and Ground Beef.” Meat Science 56:145-152.
Shiferaw, B., et al. 2000. “Prevalence of High-Risk Food Consumption and Food Handling Practices Among Adults: A Multistate Survey, 1996-1997.” Journal of Food Protection.
Sofos, J.N., S.L. Kochevar, J.O. Reagan, and G.C. Smith. 1999. “Incidence of Salmonella on Beef Carcasses Relating to the U.S. Meat and Poultry Inspection Regulations.” Journal of Food Protection 62(5):467-473.
Spectrum Consulting. 2000. “A Camera’s View of Consumer Food Handling and Preparation Practices.” Final Report. Logan UT: Spectrum Consulting.
Trampel, D.W., R.J. Hasiak, L.J. Hoffman, and M.C. Debey. 2000. “Recovery of Salmonella from Water, Equipment, and Carcasses in Turkey Processing Plants.” Journal of Applied Poultry Research 9:29-34.
U.S. Census Bureau. 2001. Summary 1997 Economic Census, Retail Trade, Subject Series. EC97R445-SM. Washington, DC: U.S. Department of Commerce.
U.S. Department of Agriculture, Agricultural Research Service. 2000a. “Continuing Survey of Food Intakes by Individuals 1994-96, 1998.” CD-ROM.
Modeling the Effects of Food Handling Practices on the Incidence of Foodborne Illness
R-4
U.S. Department of Agriculture, Agricultural Research Service. 2000b. “Continuing Survey of Food Intakes by Individuals.” <http://www.barc.usda.gov/bhnrc/foodsurvey/pdf/ Facts1.pdf>.
U.S. Department of Agriculture, Agricultural Research Service, Beltsville Human Nutrition Research Center, Food Surveys Research Group. 2002. What We Eat in America. Beltsville, MD: USDA.
U.S. Department of Agriculture, Economic Research Service. 1999. Food Consumption, Prices, and Expenditures, 1970-97/SB-965. <http://www.ers.usda.gov/publications/sb965/>.
U.S. Department of Agriculture, Economic Research Service. “Food Market Structures: Food Retailing and Food Service.” <http://www.ers.usda.gov/Briefing/FoodMarketStructures/ foodservice.htm>. Updated December 8, 2000.
U.S. Department of Agriculture, Food Safety and Inspection Service. Undated. “Progress Report on Salmonella Testing of Raw Meat and Poultry Products, 1998-2001.”
U.S. Department of Agriculture, Food Safety and Inspection Service. Undated. “Progress Report on Salmonella Testing of Raw Meat and Poultry Products, 1998-2001.”
U.S. Department of Agriculture, Food Safety and Inspection Service. “Microbiological Results of Raw Ground Beef Products Analyzed for Escherichia coli 0157:H7.” <http://www.fsis.usda.gov/ OPHS/ecoltest/tables1.htm>. Accessed November 6, 2002.
U.S. Department of Agriculture, Food Safety and Inspection Service. “Salmonella Enteritidis Risk Assessment.” <http://www.fsis.usda.gov/OPHS/risk/index.htm>. Accessed March 12, 2002.
U.S. Department of Agriculture, Food Safety and Inspection Service, Science and Technology, Microbiology Division. April 1996. “Nationwide Federal Plant Raw Ground Beef Microbiological Survey, August 1993–March 1994.”
U.S. Department of Agriculture, Food Safety and Inspection Service, Science and Technology, Microbiology Division. June 1996. “Nationwide Pork Microbiological Baseline Data Collection Program: Market Hogs. April 1995–March 1996.”

References
R-5
U.S. Department of Agriculture, Food Safety and Inspection Service, Science and Technology, Microbiology Division. February 1996. “Nationwide Beef Microbiological Baseline Data Collection Program: Cows and Bulls. December 1993–November 1994.”
U.S. Department of Agriculture, Food Safety and Inspection Service, Science and Technology, Microbiology Division. May 1996. “Nationwide Raw Ground Turkey Microbiological Survey.”
U.S. Department of Agriculture, Food Safety and Inspection Service, Science and Technology, Microbiology Division. May 1996. “Nationwide Raw Ground Chicken Microbiological Survey.”
U.S. Department of Agriculture, Food Safety and Inspection Service, Science and Technology, Microbiology Division. April 1996. “Nationwide Broiler Chicken Microbiological Baseline Data Collection Program July 1994–June 1995.”
U.S. Department of Commerce, Census Bureau. January 2001. 1997 Economic Census: Retail Trade, Subject Series. EC97R442-SM. Washington, DC: U.S. Department of Commerce.
U.S. Food and Drug Administration, Center for Food Safety and Applied Nutrition, FDA Prime Connection. “Proposed Seafood HACCP Rule.” Docket Numbers 90N-0199 and 93N-0195.
U.S. Food and Drug Administration, Center for Food Safety and Applied Nutrition. December 2000. Draft Risk Assessment on the Public Health Impact of Vibrio Parahaemolyticus in Raw Molluscan Shellfish. Washington, DC: FDA.
U.S. Food and Drug Administration, Center for Food Safety and Applied Nutrition. August 10, 2000. “Report of the FDA Retail Food Program Database of Foodborne Illness Risk Factors.” <http://www.cfsan.fda.gov/~dms/retrsk.html>. Accessed September 18, 2002.
U.S. Food and Drug Administration Retail Food Program Steering Committee. 2000. “Report of the FDA Retail Food Program Database of Foodborne Illness Risk Factors.”

Modeling the Effects of Food Handling Practices on the Incidence of Foodborne Illness
R-6
U.S. Food and Drug Administration, Center for Food Safety and Applied Nutrition. 2001. “Analysis and Evaluation of Preventive Control Measures for the Control and Reduction/Elimination of Microbial Hazards on Fresh and Fresh-Cut Produce.” Chapter IV. <http://www.cfsan.fda.gov/~comm/ift3-4i and /ift3-4a.html>. Accessed March 7, 2002 and October 1, 2002.
U.S. Food and Drug Administration, Center for Food Safety and Applied Nutrition. 2001. “Survey of Domestic Fresh Produce: Interim Results (July 31, 2001).” <http://www.cfsan.fda.gov/~dms/prodsur9.html>. Accessed September 20, 2002.
U.S. Food and Drug Administration, Center for Food Safety and Applied Nutrition, USDA/Food Safety and Inspection Service, Centers for Disease Control and Prevention. 2001. Listeria Risk Assessment. <http://www.foodsafety.gov/ ~dms/lmriska6.html>. Accessed September 27, 2002.
U.S. Food and Drug Administration, Center for Food Safety and Applied Nutrition (USFDA). 2001. “Processing Parameters Needed to Control Pathogens in Cold Smoked Fish; Potential Hazards in Cold-Smoked Fish: Listeria Monocytogenes.” <http://www.cfsan.fda.gov/~comm/ift2list.html>. Accessed March 7, 2002.
U.S. Food and Drug Administration/Food Safety and Inspection Service (FDA/FSIS). 2001. “Food Safety Survey.” Washington, DC.

Appendix A: Letter of Invitation, Background Information, and Instructions Sent to Panelists


A-1
Letter of Invitation May 2, 2003 Mr./Ms./Dr. Name Title Address City, State ZIP Dear Name: I write to ask for your help with an interesting and important research project RTI is conducting for the Food and Drug Administration (FDA). I hope you will accept RTI’s invitation to join a panel of food safety researchers, epidemiologists, and sanitarians for an expert elicitation we will conduct in January 2003.
Under contract with FDA, RTI is developing a quantitative simulation model to estimate the effects of food handling practices and other contributing factors on the incidence of foodborne illness. The Food Handling Practices Model requires data from food intake surveys, food safety surveys, contamination prevalence studies, outbreak studies, and other published scientific literature. Although some data needed for the model is not available from previous research, we believe the needed data can be estimated through expert elicitation.
We are recruiting six to eight expert panelists from academia, government, and industry. Once the panel is set, we will schedule a teleconference call during the week of January 27-31 at a time convenient for everyone. The teleconference call will require an hour to an hour and a half of your valuable time. Panelists who accept our invitation to participate will receive an honorarium of $500, or if you prefer, RTI will donate $500 to a charity of your choice.
Before the teleconference session, we will send you a package of information about topics we will ask panelists to discuss. We will also ask panelists to complete and return a worksheet to RTI before the group session.
If you are willing to join the panel, please send me your favorable reply via e-mail ([email protected]) at your earliest convenience. Please include in your reply a number where I can reach you by telephone. We will be calling soon to schedule the teleconference session and provide additional information.
Thank you for considering our request. I look forward to working with you.
Kind regards,

Modeling the Effects of Food Handling Practices on the Incidence of Foodborne Illness
A-2
Background Information Sent to Panelists
Background Information for Expert Elicitation Panelists RTI Project 8184-01
Modeling the Effects of Food Handling Practices on the Incidence of Foodborne Illness
Overview of the Project Each year millions of cases of foodborne illness occur in the United States. Preceding most cases of foodborne illness is contamination of food by pathogens, coupled with failure to destroy or sufficiently control pathogens in retail food establishments or households. Under contract with the Food and Drug Administration (FDA), RTI International is developing a quantitative simulation model of the effects of contributing factors on the incidence of foodborne illness. Using stochastic simulation methods, the model incorporates inherent uncertainty of key relationships involved. The new model will allow FDA to analyze changes in the incidence of foodborne illness that may be associated with changes in food handling practices. The Food Handling Practices Model (FHPM), requires data from food intake surveys, food safety surveys, contamination prevalence studies, outbreak studies, and other published scientific literature. Although some data needed for the model is not available from previous research, we believe that data gaps can be narrowed through expert elicitation. To develop an initial calibration of the FHPM, RTI has recruited a panel of experienced, highly qualified food safety experts to provide expert judgments for several scenario parameters required in the model.
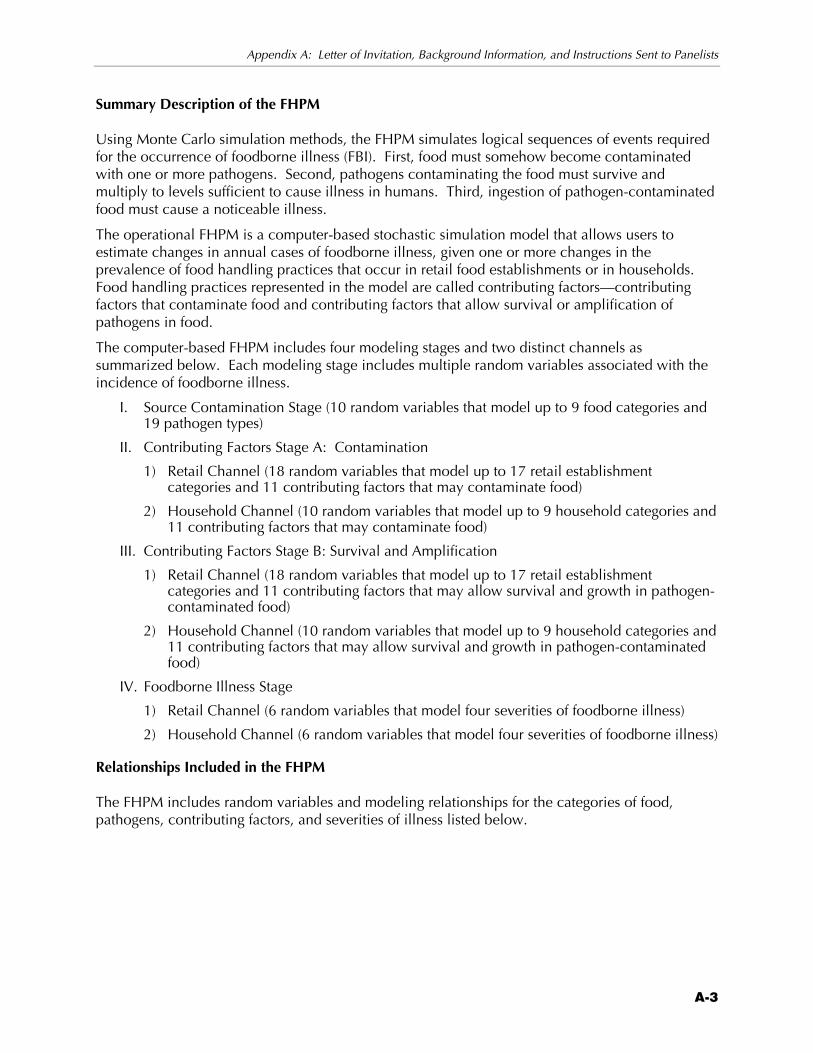
Appendix A: Letter of Invitation, Background Information, and Instructions Sent to Panelists
A-3
Summary Description of the FHPM Using Monte Carlo simulation methods, the FHPM simulates logical sequences of events required for the occurrence of foodborne illness (FBI). First, food must somehow become contaminated with one or more pathogens. Second, pathogens contaminating the food must survive and multiply to levels sufficient to cause illness in humans. Third, ingestion of pathogen-contaminated food must cause a noticeable illness.
The operational FHPM is a computer-based stochastic simulation model that allows users to estimate changes in annual cases of foodborne illness, given one or more changes in the prevalence of food handling practices that occur in retail food establishments or in households. Food handling practices represented in the model are called contributing factors—contributing factors that contaminate food and contributing factors that allow survival or amplification of pathogens in food.
The computer-based FHPM includes four modeling stages and two distinct channels as summarized below. Each modeling stage includes multiple random variables associated with the incidence of foodborne illness.
I. Source Contamination Stage (10 random variables that model up to 9 food categories and 19 pathogen types)
II. Contributing Factors Stage A: Contamination
1) Retail Channel (18 random variables that model up to 17 retail establishment categories and 11 contributing factors that may contaminate food)
2) Household Channel (10 random variables that model up to 9 household categories and 11 contributing factors that may contaminate food)
III. Contributing Factors Stage B: Survival and Amplification
1) Retail Channel (18 random variables that model up to 17 retail establishment categories and 11 contributing factors that may allow survival and growth in pathogen-contaminated food)
2) Household Channel (10 random variables that model up to 9 household categories and 11 contributing factors that may allow survival and growth in pathogen-contaminated food)
IV. Foodborne Illness Stage
1) Retail Channel (6 random variables that model four severities of foodborne illness)
2) Household Channel (6 random variables that model four severities of foodborne illness)
Relationships Included in the FHPM The FHPM includes random variables and modeling relationships for the categories of food, pathogens, contributing factors, and severities of illness listed below.

Modeling the Effects of Food Handling Practices on the Incidence of Foodborne Illness
A-4
Categories of Food 1. Dairy 2. Eggs 3. Meat 4. Poultry 5. Produce 6. Seafood 7. Water
Pathogens 1. Bacillus cereus 2. Campylobacter jejuni 3. Clostridium perfringens 4. Cryptosporidium parvum 5. Cyclospora cayetanensis 6. E. coli O157:H7 7. other E. coli spp. 8. Hepatitis A 9. Listeria monocytogenes 10. Norovirus group 11. Salmonella enteritidis 12. all other non-typhoidal Salmonella spp. 13. Shigella spp. 14. Staphylococcus aureus. 15. Streptococcus spp. 16. Vibrio spp. 17. Yersinia enterocolitica
Categories of Retail Establishments Retail Food Stores 1. Grocery stores 2. Convenience stores 3. Seafood stores Restaurants 4. Full-service restaurants 5. Mixed-service restaurants 6. Fast-food restaurants 7. Temporary establishments Institutions 8. Childcare centers 9. Hospitals 10. Schools 11. Nursing homes

Appendix A: Letter of Invitation, Background Information, and Instructions Sent to Panelists
A-5
Categories of Households 1. Single female 2. Single male 3. Single parent with children 4. Couple without children 5. Couple with children 6. Senior male 7. Senior female
Sanitation & Hygiene: Practices that May Contaminate Food 4 1. Inappropriate hand washing 2. Inappropriate bare-hand contact with ready-to-eat (RTE) foods 3. Inappropriate bare-hand contact with ready-to-cook (RTC) foods 4. Inappropriate gloved-hand contact with RTE foods 5. Inappropriate gloved-hand contact with RTC foods 6. Inappropriate sanitation or cleaning of cutting boards or other cutting surfaces 7. Food handling by ill worker 8. Food handling by asymptomatic carrier 9. Inappropriate sanitation of equipment or utensils
Survival & Amplification: Factors that Permit Survival or Amplify Growth 1 1. Inappropriate time or temperature for cooking 2. Inappropriate time or temperature for reheating 3. Inappropriate time or temperature for cooling 4. Inappropriate time or temperature for cold holding 5. Inappropriate advance preparation 6. Inappropriate time or temperature for hot holding 7. Food kept at room temperature too long 8. Inappropriate thawing of frozen foods 9. Food served raw or lightly cooked
Categories of Severity of Illness 1. Untreated 2. Treated
a. Physician treated b. Hospitalizations c. Deaths
Description of the Expert Elicitation Tasks RTI will ask the panel of food safety experts to provide judgments that focus mainly on the probabilities or odds of occurrence of food handling practices, which are identified above as “sanitation and hygiene factors” or “survival and amplification factors.” Sanitation and hygiene factors are food handling practices that may contaminate food; survival and amplification factors are food handling practices that may permit survival or growth of pathogens in contaminated food. We have designed a two-step procedure to elicit information that is sufficient to estimate
4Source: Adapted from CDC Investigation of a Foodborne Outbreak form (CDC 52.13, OMB No.0920-0004).

Modeling the Effects of Food Handling Practices on the Incidence of Foodborne Illness
A-6
probabilities needed for the FHPM. First, we will ask panelists to estimate the relative likelihood of occurrence of the various contributing factors in particular types of retail food service establishments and households. Second, we will ask panelists to estimate the relative likelihood that a serving of food is contaminated, given that the contributing factor occurred. The example below illustrates the two-step procedure. The sample form illustrated in Exhibit 1 shows an example of contributing factors that may contaminate food in the category of retail establishments called “convenience stores” in the FHPM. In the example, the hypothetical expert judge thinks that “inappropriate gloved-hand contact with ready-to-cook foods” is the contributing factor that is LEAST likely to occur in convenience stores. The same expert said that “inappropriate hand washing” is the contributing factor that is MOST likely to occur, and moreover, it is 1,500 times more likely than the least likely. Note also that this hypothetical judge estimates that “inappropriate bare-hand contact with ready-to-cook foods” and “food handling by ill worker” are equally likely events, and that both are 100 times more likely to occur in convenience stores than “inappropriate gloved-hand contact with ready-to-cook foods.” In the example, the expert judge also estimates that the most likely contributing factor, “inappropriate hand washing,” occurs 50,000 times out of every 100,000 opportunities for it to occur, which is to say the event has 1 to 1 odds of occurring, or a 0.50 probability of occurring. If the expert panelist that completed the elicitation form in Exhibit 1 thought that all 9 contributing factors were equally likely to occur in convenience stores, the expert would have entered “1” for all 9 contributing factors. If the expert thought that the most frequently occurring contributing factor in convenience stores had 1 to 3 odds for occurring, the expert would have written 25,000 for Item 4, instead of 50,000. 5 We anticipate that the likelihood of occurrence of contributing factors may vary by categories of retail establishments and households. Therefore, we will ask members of the expert panel to complete 36 separate elicitation forms like the sample in Exhibit 1 (18 for contributing factors that contaminate food; 18 for contributing factors that permit survival and growth of pathogens), using a separate form for each of the 11 categories of retail establishments and 7 categories of households included in the FHPM. We are hopeful that all members of the expert panel will provide estimates for each category of retail establishment and household. But we understand that some panelists may feel they have insufficient knowledge or experience to make estimates for one or more categories of retail establishments or households. In such cases, we ask that panelists leave the elicitation form blank, except for checking the “Estimates Omitted” box on the form to tell us that no estimates were made. Exhibit 2 provides a sample elicitation form for the second type of elicitation task we will ask panelists to complete. The example shows that the hypothetical expert panelist thinks that “inappropriate sanitation of equipment or utensils” is the contributing factor LEAST likely to result in contamination of a serving of food in convenience stores. Note especially that the same judge
5In general, the statement that the odds are r to s in favor of an event E occurring is equivalent to the statement that P(E) = r/(r+s). Definition: If P(E) = p, the odds in favor of the event E occurring are r to s (often written r : s) where r/s = p/(1-p). If r and s are given, then p can be found by using the equation p = r/(r + s).

Appendix A: Letter of Invitation, Background Information, and Instructions Sent to Panelists
A-7
Exhibit A-1. Elicitation Form A: Retail Contamination Stage
Contributing Factors that Contaminate Food
Retail Establishment Category: Convenience Stores—Small retail food stores that offer a limited selection of high-convenience items; open long hours to provide convenient access. Estimates Omitted • Please Complete the Following Steps in Order:
1. Identify the contributing factor below that you panelist to occur LEAST frequently; type in the number “1” in the table below to designate its relative likelihood of occurrence.
2. Identify the contributing factor below that you panelist to occur MOST frequently; type in a number in the table below to quantify the likelihood of occurrence of the most frequently occurring contributing factor, relative to the least frequently occurring.
3. For each remaining contributing factor, type in a number in the table below to quantify your judgment of the likelihood of occurrence, relative to the least frequent and most frequent; the relative likelihood numbers you type may be the same or different for each contributing factor, depending on your judgment of relative likelihood.
4. Focus on the contributing factor you judge to occur MOST frequently; of 100,000 opportunities for that contributing factor to occur in convenience stores, type in the cell to the right the number of times you think it is likely to occur.
50,000
Contributing Factor Relative Likelihood Inappropriate hand washing 1,500
Inappropriate bare-hand contact with read-to-eat foods 500 Inappropriate bare-hand contact with ready-to-cook foods 100 Inappropriate gloved-hand contact with ready-to-eat foods 267 Inappropriate gloved-hand contact with ready-to-cook foods 1
Inappropriate sanitation of cutting boards or cutting surfaces 820
Food handling by ill worker 100
Food handling by asymptomatic worker 50
Inappropriate sanitation of equipment or utensils 600
did not think that “inappropriate sanitation of equipment or utensils” was the least likely contributing factor to occur (see Exhibit 1), but does think that the likelihood that a serving of food will actually be contaminated, given the occurrence of the contributing factor, is much lower than for the other 8 contributing factors. The same hypothetical expert said that the MOST likely event in convenience stores is “Given that food handling by an ill worker occurs, a serving of food is contaminated with one or more pathogens.” Evidently, the hypothetical expert in the example believes that it is highly likely that a serving of food will be contaminated, if the serving is handled by an ill worker. In fact, the judge believes that when food handling by an ill worker occurs, it is 10,000 more times likely to contaminate a serving of food than when inappropriate sanitation of equipment or utensils occurs. Note also that this hypothetical expert estimates that “inappropriate bare-hand contact with ready-to-cook foods” and “inappropriate gloved-hand contact with ready-to-cook foods” are equally likely to result in contamination of a serving of food when they occur, and that both are 10 times more likely to result in a contaminated serving of food than inappropriate sanitation of equipment or utensils.
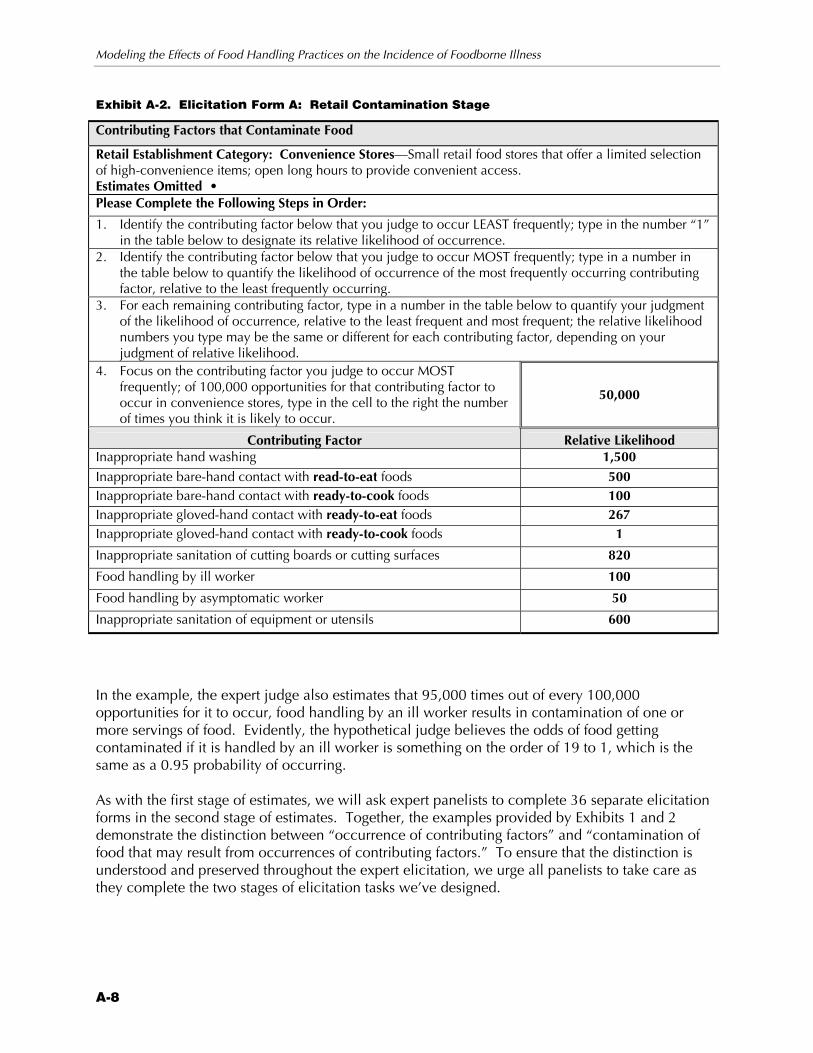
Modeling the Effects of Food Handling Practices on the Incidence of Foodborne Illness
A-8
Exhibit A-2. Elicitation Form A: Retail Contamination Stage
Contributing Factors that Contaminate Food
Retail Establishment Category: Convenience Stores—Small retail food stores that offer a limited selection of high-convenience items; open long hours to provide convenient access. Estimates Omitted • Please Complete the Following Steps in Order:
1. Identify the contributing factor below that you judge to occur LEAST frequently; type in the number “1” in the table below to designate its relative likelihood of occurrence.
2. Identify the contributing factor below that you judge to occur MOST frequently; type in a number in the table below to quantify the likelihood of occurrence of the most frequently occurring contributing factor, relative to the least frequently occurring.
3. For each remaining contributing factor, type in a number in the table below to quantify your judgment of the likelihood of occurrence, relative to the least frequent and most frequent; the relative likelihood numbers you type may be the same or different for each contributing factor, depending on your judgment of relative likelihood.
4. Focus on the contributing factor you judge to occur MOST frequently; of 100,000 opportunities for that contributing factor to occur in convenience stores, type in the cell to the right the number of times you think it is likely to occur.
50,000
Contributing Factor Relative Likelihood Inappropriate hand washing 1,500
Inappropriate bare-hand contact with read-to-eat foods 500 Inappropriate bare-hand contact with ready-to-cook foods 100 Inappropriate gloved-hand contact with ready-to-eat foods 267 Inappropriate gloved-hand contact with ready-to-cook foods 1
Inappropriate sanitation of cutting boards or cutting surfaces 820
Food handling by ill worker 100
Food handling by asymptomatic worker 50
Inappropriate sanitation of equipment or utensils 600
In the example, the expert judge also estimates that 95,000 times out of every 100,000 opportunities for it to occur, food handling by an ill worker results in contamination of one or more servings of food. Evidently, the hypothetical judge believes the odds of food getting contaminated if it is handled by an ill worker is something on the order of 19 to 1, which is the same as a 0.95 probability of occurring. As with the first stage of estimates, we will ask expert panelists to complete 36 separate elicitation forms in the second stage of estimates. Together, the examples provided by Exhibits 1 and 2 demonstrate the distinction between “occurrence of contributing factors” and “contamination of food that may result from occurrences of contributing factors.” To ensure that the distinction is understood and preserved throughout the expert elicitation, we urge all panelists to take care as they complete the two stages of elicitation tasks we’ve designed.

Appendix A: Letter of Invitation, Background Information, and Instructions Sent to Panelists
A-9
Notes on Expert Judgment of Probability or Odds In his Discourse on Method, Descartes wrote that “it is a truth very certain that when it is not in our power to determine what is true we ought to follow what is most probable.” For estimating the effects of food handling practices on the incidence of foodborne illness, it turns out to be challenging to determine even the “true” probabilities of some uncertain events that logically affect the incidence of foodborne illness. As research scientists, RTI researchers are inclined to favor statistically valid estimates of relative frequencies as a means of estimating probabilities. But we recognize that even relative frequency measures result in “judgmental” estimates of probabilities. Statistically measured relative frequencies provide sample evidence of historical behavior; but since past behavior is no guarantee of future behavior—either for systems or humans—even statistically measured relative frequencies cannot be strictly said to be “objective” estimates of probabilities that are independent of human judgment. Nonetheless, when statistically valid relative frequency data are available, we tend to consider them a reliable basis for estimating probabilities, based on a classical definition of probability. For expert elicitation of probability estimates, RTI presumes that most expert judges would find statistically valid relative frequency data compelling, although not necessarily decisive. Definition of Probability for the FHPM. For our purposes with the FHPM, we define probabilities to be numbers between 0 and 1 that obey the addition and multiplication laws governing logical “or & “and” relationships between events, and to be numbers that reflect the degree of belief about uncertain future events held by an analyst or decision maker. Without getting mathematically technical, we offer the following observations: For a discrete event E, the probability of its occurrence P(E) is an index number that stands in direct proportion to human judgment that E will occur, given a set of well defined conditions.
1. P(E) = 1 if E is certain to occur 2. P(E) = 0 if it is impossible for E to occur 3. 0 < P(E) < 1 if E may or may not occur, where values closer to 0 mean E is less likely to
occur and values closer to 1 mean E is more likely to occur. Framing Issues for the Expert Elicitation. The FHPM treats uncertainty associated with foodborne illness in terms of the theory of random variables. The model is somewhat detailed in some ways, but quite abstract in others. Because they are food safety experts, members of the expert panel will have experience and knowledge of a wide variety of environmental conditions that affect the incidence of foodborne illness. By framing estimates of probability and relative likelihood in terms of “usual,” “typical,” or “expected” conditions, members of the expert panel will be able to estimate probabilistic parameter values that will be meaningful and useful for the FHPM. Judgmental probability encoding is a type of expert elicitation that may be used for developing probabilities when adequate experimental data and estimates of associated uncertainty are not available. In forming probability judgments, experts rely on their experience and knowledge of the events of interest. Experimental psychologists and decision analysts have amassed considerable data concerning the way people form and express probabilistic judgments. The evidence suggests that when considering large amounts of complex information, most people use heuristics (i.e., simplifying rules or rules of thumb) and exhibit certain cognitive biases (i.e.,

Modeling the Effects of Food Handling Practices on the Incidence of Foodborne Illness
A-10
systematic departures from logical thought). Below we review five common biases and heuristics, and offer suggestions to help members of the expert panel mitigate their effects. 1. The order in which evidence is considered often influences human judgment, although logically that should not be the case. Of necessity, items of information are considered one by one in a sequential fashion. Information considered first and last tend to dominate judgment. Initial information may have undue influence because it sometimes provides the framework that subsequent information is tailored to fit. For example, people typically search for evidence to confirm their initial hypotheses; they rarely look for evidence that weighs against them.
Suggestion: To avoid effects of the sequence of information considered, keep in mind that the order in which you think of relevant information should not influence your final judgment. You may want to make written notes of important information you consider and then review the information in two or more sequences, checking the consistency of how the information influences your judgments. Try to keep an open mind until you have gone through all relevant evidence, and don’t let early information you consider sway you more than information considered later.
2. Related to these sequential effects is a phenomenon called “anchoring and adjustment.” Based on early partial information, people form initial probability estimates of the events in question. Although they adjust this anchor judgment when considering subsequent information, such adjustments tend to be too small. In other words, people tend to attach too little weight to information they acquire after forming their initial judgment.
Most people have difficulty conceptualizing and making judgments about large, abstract universes or populations. A natural tendency is to recall specific instances and consider them as representative of the population as a whole. However, people often recall certain specific instances more clearly because they stand out in some way, such as being familiar, unusual, especially concrete, or of personal significance. Unfortunately, they then attribute the specific characteristics of these singular examples—often incorrectly—to all the members of the population of interest. Moreover, expert judges often combine these memory effects with the sequential phenomena noted earlier. For example, experts might naturally think first of a recent study or one that was unusual and therefore stands out. Experts’ tendency might be to treat the recalled studies as typical of the population of relevant research and ignore important differences among studies. Then, in subsequent attempts to recall information, expert judges might tend to think primarily of evidence that is consistent with the initial items they considered.
Suggestion: To avoid adverse memory effects, define various classes of information that you deem relevant, and then search your memory for examples of each. Don’t restrict your thinking only to items that stand out for specific reasons. Make a special attempt to consider conflicting evidence and to think of data that may be inconsistent with a particular theory. Also, be careful to concentrate on the given probability judgment, and do not let your own values affect those judgments.
3. People often overestimate the reliability of some types of information, minimizing factors such as sampling error and imprecise measurement. They may summarize evidence in terms of simple and definite conclusions, which causes them to be overconfident in their judgments. This tendency tends to be stronger for experts who have considerable intellectual or personal involvement in a particular field. Expert judges may interpret information in a way that is consistent with their beliefs and expectations, causing them to over generalize results and ignore or underestimate contradictory evidence.
Appendix A: Letter of Invitation, Background Information, and Instructions Sent to Panelists
A-11
Suggestion: To accurately estimate the reliability of relevant information, pay attention to such matters as sample size and the power of statistical tests. Keep in mind that most data are approximate to some degree, subject to elements of random error, imprecise measurement, interpretation, and personal evaluation. In addition, the farther one must extrapolate, or generalize, from a particular study to a situation of interest, the less reliable is the conclusion and the less certainty should be attributed to it. Rely more heavily on information that you consider more reliable, but resist treating it as “absolute truth.”
4. Sometimes the importance of events, or their possible costs or benefits, influences judgments about the certainty of the events when, logically, importance should not affect probability. In other words, one’s attitudes toward risk tend to affect one’s ability to make accurate probability judgments. For example, many physicians tend to overestimate the probability of very severe diseases because they feel it is important to detect and treat them; similarly, many smokers underestimate the probability of adverse consequences of smoking because they feel that the odds do not apply to them.
Suggestion: Keep in mind that the importance of an event or an outcome should not influence your judgment of its probability of occurrence. It is logical to consider the cost or severity of outcome to decide the point at which you think mitigating action should be taken, but not logical to allow importance of the event to influence your judgment of the likelihood of occurrence.
5. People also find it difficult to assess extreme probabilities, frequently doing a poor job when probabilities are close to zero or one. The closer to zero or one a probability is, the greater the impact of small changes. For example, changing a probability by 0.009 from 0.510 to 0.501 leaves the odds almost unchanged, but the same change from 0.999 to 0.99 changes the odds by a factor of about 10, from 999:1 to 99:1.
Suggestion: As you make probability judgments, sometimes translate to the alternative scale (odds compared to probabilities), or consider the probability that the event will not happen (i.e., a probability of 0.95 “for” means a 0.05 probability “against”). When estimating very small or very large probabilities, it is often best to think in terms of odds, which are unbounded, instead of probabilities, which are bounded. For example, one might more easily conceptualize odds of 1 to 199 than a probability of 0.005.
Research shows that awareness of potential biases, and practice making probability estimates, can improve the ability of experts to estimate probabilities. Expert judges who are aware of natural cognitive biases and try consciously to avoid them tend to make more accurate and reliable probability estimates.
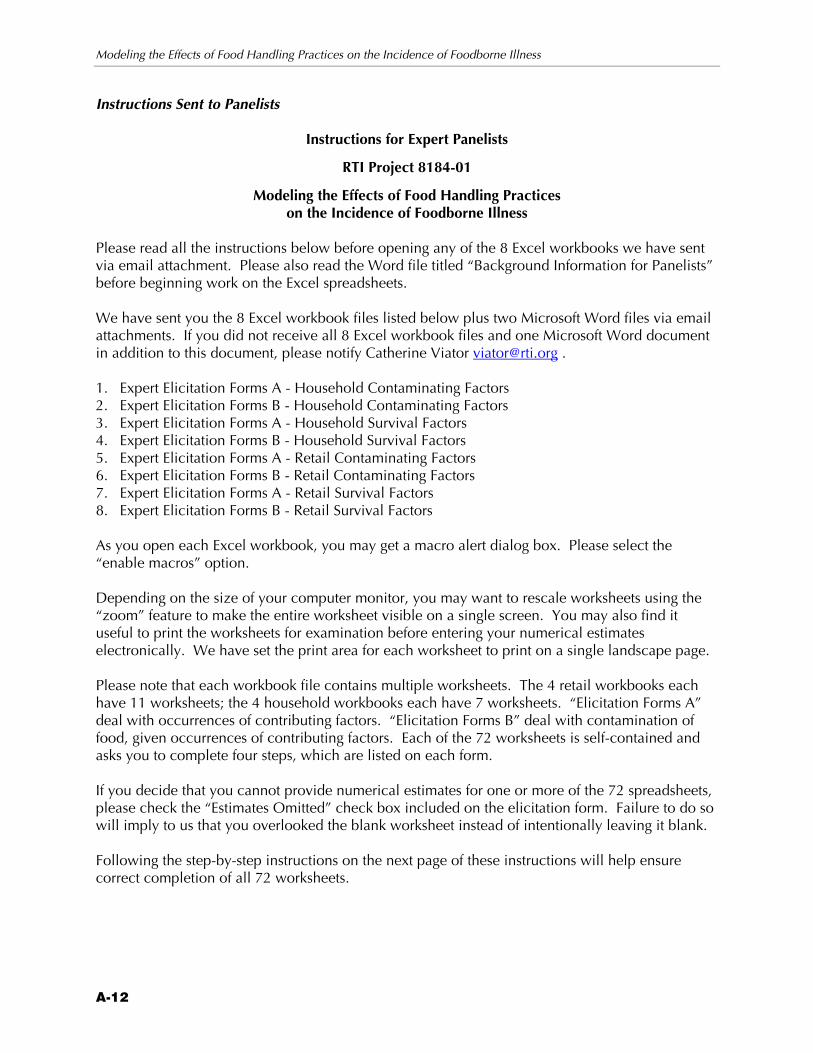
Modeling the Effects of Food Handling Practices on the Incidence of Foodborne Illness
A-12
Instructions Sent to Panelists
Instructions for Expert Panelists
RTI Project 8184-01
Modeling the Effects of Food Handling Practices on the Incidence of Foodborne Illness
Please read all the instructions below before opening any of the 8 Excel workbooks we have sent via email attachment. Please also read the Word file titled “Background Information for Panelists” before beginning work on the Excel spreadsheets. We have sent you the 8 Excel workbook files listed below plus two Microsoft Word files via email attachments. If you did not receive all 8 Excel workbook files and one Microsoft Word document in addition to this document, please notify Catherine Viator [email protected] . 1. Expert Elicitation Forms A - Household Contaminating Factors 2. Expert Elicitation Forms B - Household Contaminating Factors 3. Expert Elicitation Forms A - Household Survival Factors 4. Expert Elicitation Forms B - Household Survival Factors 5. Expert Elicitation Forms A - Retail Contaminating Factors 6. Expert Elicitation Forms B - Retail Contaminating Factors 7. Expert Elicitation Forms A - Retail Survival Factors 8. Expert Elicitation Forms B - Retail Survival Factors As you open each Excel workbook, you may get a macro alert dialog box. Please select the “enable macros” option. Depending on the size of your computer monitor, you may want to rescale worksheets using the “zoom” feature to make the entire worksheet visible on a single screen. You may also find it useful to print the worksheets for examination before entering your numerical estimates electronically. We have set the print area for each worksheet to print on a single landscape page. Please note that each workbook file contains multiple worksheets. The 4 retail workbooks each have 11 worksheets; the 4 household workbooks each have 7 worksheets. “Elicitation Forms A” deal with occurrences of contributing factors. “Elicitation Forms B” deal with contamination of food, given occurrences of contributing factors. Each of the 72 worksheets is self-contained and asks you to complete four steps, which are listed on each form. If you decide that you cannot provide numerical estimates for one or more of the 72 spreadsheets, please check the “Estimates Omitted” check box included on the elicitation form. Failure to do so will imply to us that you overlooked the blank worksheet instead of intentionally leaving it blank. Following the step-by-step instructions on the next page of these instructions will help ensure correct completion of all 72 worksheets.

Appendix A: Letter of Invitation, Background Information, and Instructions Sent to Panelists
A-13
Step-by-Step Instructions 1. Select one of the eight Excel workbooks and open it. Although no particular order is required
for completing the elicitation forms, you may find it useful to complete all four worksheets of the type “Expert Elicitation Forms A” before moving on to complete the four worksheets of the type “Expert Elicitation Forms B.”
2. Select the first worksheet of the workbook you opened. Each workbook contains multiple worksheets, which are accessed by clicking on the tabs at the bottom of the screen. The arrows on the bottom-left of your screen will enable you to scroll through the worksheets.
3. Review the worksheet. We are hopeful that all expert judges will provide numerical estimates for all 72 elicitation forms, but you should not provide estimates if you feel you have insufficient experience or knowledge on which to base your estimates. If you decide not to complete the worksheet, check the “Estimates Omitted” check box and leave all other entry cells blank.
4. Follow the four steps included on the worksheet form you have opened, which ask you to type numerical estimates directly on the Excel worksheet. The worksheets are protected, which enables you to use the “tab” key to move from one entry cell to the next.
5. Once you have finished entering numerical estimates in all entry cells of the worksheet, review your estimates, satisfying yourself that you have entered the numbers you intended. You may change your mind and adjust one or more entries until you are satisfied that you have provided your best estimates.
6. Select the next worksheet in the workbook and repeat instruction steps 4 and 5. Be sure to complete all worksheets in the workbook (11 worksheets for retail workbooks; 7 worksheets for household workbooks)
7. Using the Excel FILE menu, do a SAVE AS on the completed file to your hard drive, saving the file in a location you will remember. Do not change the name of the file, but do type your last name as the first word of the existing title, which will help you identify files that you have completed and will help us keep track of your completed files when you return them to us. For example, when you do the SAVE AS for the file titled “Expert Elicitation Forms A - Household Survival Factors.xls,” you would alter the title of the file in the FILE NAME: text box near the bottom of the dialog box to read “LastName Expert Elicitation Forms A - Household Survival Factors.xls”
8. Repeat instruction steps 1 through 7 until you have opened and completed all eight Excel workbooks.
9. Once you have completed entries for all eight Excel workbooks, attach all eight workbook files to an email and send them via email to Catherine Viator, [email protected]. Ms. Viator will send you a reply to confirm receipt of your completed workbook files.
10. Retain the completed workbook files on your computer or print them for later reference during the teleconference call we’ve scheduled for Wednesday, January 29, 2003, 3:00 p.m. CST.


Appendix B: Summary of Statements from Panelists during the Teleconference Session for the Expert Elicitation


B-1
On January 29, 2003, RTI conducted a teleconference session with members of the expert panel who had earlier provided initial estimates of probability parameters in electronic worksheets. The teleconference session gave panelists an opportunity to consider and discuss together the aggregated results that RTI provided to the panelists several days before the teleconference session.
Because of technical problems with recording equipment, the teleconference service vendor recorded only about one-third of the session. Below are selected summary statements of comments made by members of the expert panel during the teleconference session.
General Comments 1. How shall we define inappropriate hand washing? It’s hard to define. Is this the same as
failure to wash hands? 2. How shall we define “inappropriate bare-hand or glove-hand contact with ready-to-cook food?
Is there such a thing? 3. None of the probabilities we’re estimating are well known; only after a lot of talking together
could we bring our estimates together, if we were seeking consensus. 4. A lot of the variance in our estimates of the conditional probabilities will depend on what
foods we’re thinking about. The conditional probabilities depend on what the food is. One approach would be to think about the food that has the greatest risk.
5. The range of probability estimates for contributing factors that permit survival and growth is much smaller than the range of estimates for contributing factors that may contaminate food.
6. When the range of estimates is large, that should indicate greater uncertainty about the estimates.
7. Very little experimental data are available for the conditional probabilities.
Retail Establishments 1. For contributing factors that contaminate, the aggregated results for hospitals are too high
compared to full-service restaurants; hospitals are relatively safe places in terms of food safety because of the extensive training in hospitals.
2. The aggregated results show that the conditional probability for gloved-hand contact is larger than for inappropriate sanitation of cutting boards; why would that be?
3. Gloved-hand contact with food might have a higher probability of contaminating food because gloves come into more intimate contact with the food than cutting boards.
4. Child care facilities are likely to have a higher incidence of food contamination due to changing of diapers and kids with dirty hands.
5. An asymptomatic worker is much less likely to contaminate food than an ill worker. Ill workers should be a much larger risk.
6. For retail establishments, contributing factors that contaminate food are much more likely than contributing factors that permit survival and growth.
7. People who have poor food safety practices at home probably also have poor food safety practices when they go to work in a retail food service establishment.
8. I’m surprised that nursing homes came out in the aggregated results with the highest probability of contributing factors that permit survival and growth in foods. In my experience, full-service restaurants should have higher probabilities for contributing factors that permit survival and growth.
9. Grocery stores separate meat from produce sections, and their workers in deli are not typically handling raw food at the same time they’re handling cooked food, so cross-contamination from raw to cooked is not as frequent as in other types of retail food service establishments, such as full-service restaurants.

Modeling the Effects of Food Handling Practices on the Incidence of Foodborne Illness
B-2
Households 1. It is extremely unlikely that any households will prepare food wearing gloves. This really
shouldn’t be a contributing factor for households.

Appendix C: Parameters Estimated by Expert Elicitation


C-1
Ta
ble
C-1
. F
ina
l E
stim
ate
s, C
on
trib
uti
ng
Fa
cto
rs:
Re
tail
Con
tam
ina
tio
n
Ret
ail E
stab
lishm
ent
Cat
egor
ies
Food
Sto
res
Res
taur
ants
In
stitu
tions
G
C
S
FS
MS
FF
T C
C
H
S N
H
Con
trib
utin
g Fa
ctor
s:
Con
tam
inat
ion
A
B
A
B
A
B
A
B
A
B
A
B
A
B
A
B
A
B
A
B
A
B
Food
han
dlin
g by
as
ympt
omat
ic fo
od
hand
ler
.070
.0
13
.134
.0
18
.071
.0
18
.053
.0
18
.070
.0
23
.087
.0
18
.080
.0
23
.075
.0
18
.015
.0
05
.065
.0
23
.055
.0
18
Food
han
dlin
g by
ill
food
han
dler
.1
83
.030
.1
73
.085
.1
40
.075
.1
33
.075
.1
33
.065
.1
67
.065
.1
25
.070
.1
10
.065
.0
40
.055
.0
95
.065
.1
00
.110
In
appr
opri
ate
bare
-ha
nd c
onta
ct w
ith
read
y-to
-coo
k fo
ods
.083
.0
45
.034
.0
28
.051
.0
20
.090
.0
20
.097
.0
25
.107
.0
25
.100
.0
35
.075
.0
30
.060
.0
25
.065
.0
20
.070
.0
20
Inap
prop
riat
e ba
re-
hand
con
tact
with
re
ady-
to-e
at fo
ods
.170
.0
60
.130
.0
80
.150
.1
40
.227
.1
15
.197
.1
15
.300
.1
20
.175
.1
30
.235
.1
20
.130
.1
15
.135
.1
15
.140
.1
25
Inap
prop
riat
e gl
oved
-han
d co
ntac
t w
ith r
eady
-to-
cook
fo
ods
.030
.0
13
.017
.0
05
.025
.0
11
.037
.0
16
.045
.0
16
.202
.0
16
.038
.0
21
.073
.0
21
.043
.0
16
.053
.0
21
.053
.0
16
Inap
prop
riat
e gl
oved
-han
d co
ntac
t w
ith r
eady
-to-
eat
food
s .1
33
.010
.1
27
.016
.0
65
.030
.1
10
.020
.0
97
.025
.1
67
.025
.1
25
.040
.1
00
.020
.0
85
.015
.0
90
.025
.0
95
.030
In
appr
opri
ate
hand
w
ashi
ng
.417
.1
50
.343
.1
05
.325
.1
50
.473
.1
35
.473
.1
50
.457
.1
50
.375
.1
60
.345
.1
05
.175
.0
95
.200
.1
35
.250
.1
95
Inap
prop
riat
e sa
nita
tion
of
equi
pmen
t or
uten
sils
.3
03
.030
.2
67
.065
.3
15
.090
.3
50
.075
.3
50
.065
.3
00
.065
.3
00
.070
.1
60
.075
.1
25
.060
.1
75
.065
.2
25
.060
In
appr
opri
ate
sani
tatio
n or
cl
eani
ng o
f cut
ting
boar
ds
.303
.0
50
.227
.0
50
.295
.1
30
.347
.1
60
.350
.1
15
.300
.1
20
.250
.1
25
.165
.1
15
.150
.1
15
.160
.1
15
.220
.1
15
G =
Gro
cery
Sto
res
FS
= F
ull-
Serv
ice
Res
taur
ants
T
= T
empo
rary
Est
ablis
hmen
t S
= S
choo
ls
C =
Con
veni
ence
Sto
res
MS
= M
ixed
-Ser
vice
Res
taur
ants
C
C
= C
hild
Car
e C
ente
r N
H =
Nur
sing
Hom
es
S =
Sea
food
Sto
res
FF
= F
ast F
ood
Res
taur
ants
H
=
Hos
pita
ls
N
ote:
C
ells
labe
led
“A”
cont
ain
P(co
ntri
butin
g fa
ctor
occ
urs)
.
Cel
ls la
bele
d “B
” co
ntai
n P(
food
is c
onta
min
ated
, giv
en th
e co
ntri
butin
g fa
ctor
occ
urre
d).

Modeling the Effects of Food Handling Practices on the Incidence of Foodborne Illness
C-2
Ta
ble
C-2
. F
ina
l E
stim
ate
s, C
on
trib
uti
ng
Fa
cto
rs:
Re
tail
Su
rviv
al
an
d G
row
th
Ret
ail E
stab
lishm
ent
Cat
egor
ies
Food
Sto
res
Res
taur
ants
In
stitu
tions
G
C
S
FS
MS
FF
T C
C
H
S N
H
Con
trib
utin
g Fa
ctor
s: S
urvi
val
and
Gro
wth
A
B
A
B
A
B
A
B
A
B
A
B
A
B
A
B
A
B
A
B
A
B
Fo
od k
ept a
t roo
m
tem
pera
ture
too
long
.2
50
.125
.1
35
.135
.2
85
.125
.2
87
.130
.2
17
.130
.2
03
.140
.2
50
.190
.1
10
.180
.1
50
.185
.1
80
.190
.1
75
.185
Fo
od s
erve
d ra
w o
r lig
htly
coo
ked
.004
.0
53
.011
.0
28
.020
.1
55
.053
.1
05
.024
.1
05
.008
.1
55
.023
.1
65
.008
.0
28
.028
.0
28
.028
.0
28
.028
.0
28
Inap
prop
riat
e ad
vanc
e pr
epar
atio
n .1
37
.065
.0
86
.080
.1
50
.130
.2
53
.075
.1
80
.075
.1
27
.035
.1
50
.150
.1
30
.130
.1
25
.115
.2
00
.180
.2
00
.190
In
appr
opri
ate
thaw
ing
of fr
ozen
fo
ods
.217
.0
13
.086
.0
13
.185
.0
13
.250
.0
13
.183
.0
13
.170
.0
15
.160
.0
45
.160
.0
13
.090
.0
13
.125
.0
13
.125
.0
13
Inap
prop
riat
e tim
e or
tem
pera
ture
for
cold
hol
ding
.2
33
.115
.1
90
.080
.1
80
.130
.2
60
.075
.1
30
.080
.1
50
.140
.1
50
.150
.1
55
.090
.1
25
.075
.1
30
.080
.1
75
.080
In
appr
opri
ate
time
or te
mpe
ratu
re fo
r co
okin
g .1
93
.070
.1
20
.050
.2
00
.075
.2
37
.130
.2
00
.080
.2
73
.130
.2
10
.145
.2
50
.080
.1
10
.070
.1
30
.080
.1
50
.080
In
appr
opri
ate
time
or te
mpe
ratu
re fo
r co
olin
g .2
27
.075
.1
90
.050
.1
30
.070
.2
93
.150
.1
80
.150
.1
33
.100
.2
60
.145
.1
50
.140
.1
10
.130
.1
40
.140
.1
90
.140
In
appr
opri
ate
time
or te
mpe
ratu
re fo
r ho
t hol
ding
.2
80
.120
.2
80
.080
.0
80
.055
.3
20
.075
.1
07
.075
.1
10
.140
.1
20
.140
.1
10
.080
.1
00
.065
.1
80
.080
.1
80
.080
In
appr
opri
ate
time
or te
mpe
ratu
re fo
r re
heat
ing
.167
.0
50
.155
.0
33
.155
.0
50
.223
.0
40
.197
.0
20
.137
.1
20
.275
.1
50
.160
.0
85
.135
.0
70
.130
.0
80
.125
.0
80
G =
Gro
cery
Sto
res
FS
= F
ull-
Serv
ice
Res
taur
ants
T
= T
empo
rary
Est
ablis
hmen
t S
= S
choo
ls
C =
Con
veni
ence
Sto
res
MS
= M
ixed
-Ser
vice
Res
taur
ants
C
C
= C
hild
Car
e C
ente
r N
H
= N
ursi
ng H
omes
S
= S
eafo
od S
tore
s FF
=
Fas
t Foo
d R
esta
uran
ts
H
= H
ospi
tals
Not
e:
Cel
ls la
bele
d “A
” co
ntai
n P(
cont
ribu
ting
fact
or o
ccur
s).
C
ells
labe
led
“B”
cont
ain
P(fo
od is
con
tam
inat
ed, g
iven
the
cont
ribu
ting
fact
or o
ccur
red)
.
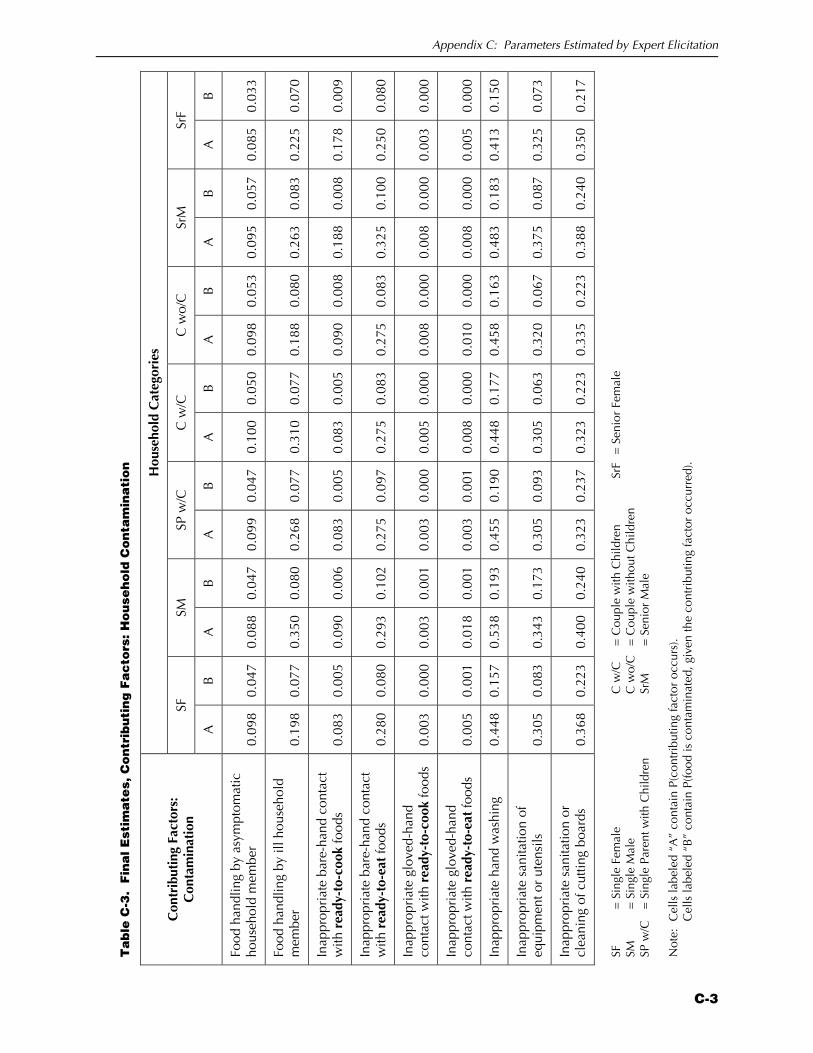
C-3
Appendix C: Parameters Estimated by Expert Elicitation
Ta
ble
C-3
. F
ina
l E
stim
ate
s, C
on
trib
uti
ng
Fa
cto
rs:
Ho
use
ho
ld C
on
tam
ina
tio
n
Hou
seho
ld C
ateg
orie
s
SF
SM
SP w
/C
C w
/C
C w
o/C
Sr
M
SrF
Con
trib
utin
g Fa
ctor
s:
Con
tam
inat
ion
A
B
A
B
A
B
A
B
A
B
A
B
A
B
Food
han
dlin
g by
asy
mpt
omat
ic
hous
ehol
d m
embe
r 0.
098
0.04
7 0.
088
0.04
7 0.
099
0.04
7 0.
100
0.05
0 0.
098
0.05
3 0.
095
0.05
7 0.
085
0.03
3
Food
han
dlin
g by
ill h
ouse
hold
m
embe
r 0.
198
0.07
7 0.
350
0.08
0 0.
268
0.07
7 0.
310
0.07
7 0.
188
0.08
0 0.
263
0.08
3 0.
225
0.07
0
Inap
prop
riat
e ba
re-h
and
cont
act
with
rea
dy-t
o-co
ok fo
ods
0.08
3 0.
005
0.09
0 0.
006
0.08
3 0.
005
0.08
3 0.
005
0.09
0 0.
008
0.18
8 0.
008
0.17
8 0.
009
Inap
prop
riat
e ba
re-h
and
cont
act
with
rea
dy-t
o-ea
t fo
ods
0.28
0 0.
080
0.29
3 0.
102
0.27
5 0.
097
0.27
5 0.
083
0.27
5 0.
083
0.32
5 0.
100
0.25
0 0.
080
Inap
prop
riat
e gl
oved
-han
d co
ntac
t with
rea
dy-t
o-co
ok fo
ods
0.00
3 0.
000
0.00
3 0.
001
0.00
3 0.
000
0.00
5 0.
000
0.00
8 0.
000
0.00
8 0.
000
0.00
3 0.
000
Inap
prop
riat
e gl
oved
-han
d co
ntac
t with
rea
dy-t
o-ea
t fo
ods
0.00
5 0.
001
0.01
8 0.
001
0.00
3 0.
001
0.00
8 0.
000
0.01
0 0.
000
0.00
8 0.
000
0.00
5 0.
000
Inap
prop
riat
e ha
nd w
ashi
ng
0.44
8 0.
157
0.53
8 0.
193
0.45
5 0.
190
0.44
8 0.
177
0.45
8 0.
163
0.48
3 0.
183
0.41
3 0.
150
Inap
prop
riat
e sa
nita
tion
of
equi
pmen
t or
uten
sils
0.
305
0.08
3 0.
343
0.17
3 0.
305
0.09
3 0.
305
0.06
3 0.
320
0.06
7 0.
375
0.08
7 0.
325
0.07
3
Inap
prop
riat
e sa
nita
tion
or
clea
ning
of c
uttin
g bo
ards
0.
368
0.22
3 0.
400
0.24
0 0.
323
0.23
7 0.
323
0.22
3 0.
335
0.22
3 0.
388
0.24
0 0.
350
0.21
7
SF
= S
ingl
e Fe
mal
e C
w/C
=
Cou
ple
with
Chi
ldre
n Sr
F =
Sen
ior
Fem
ale
SM
= S
ingl
e M
ale
C w
o/C
=
Cou
ple
with
out C
hild
ren
SP w
/C
= S
ingl
e Pa
rent
with
Chi
ldre
n Sr
M
= S
enio
r M
ale
Not
e:
Cel
ls la
bele
d “A
” co
ntai
n P(
cont
ribu
ting
fact
or o
ccur
s).
C
ells
labe
led
“B”
cont
ain
P(fo
od is
con
tam
inat
ed, g
iven
the
cont
ribu
ting
fact
or o
ccur
red)
.

Modeling the Effects of Food Handling Practices on the Incidence of Foodborne Illness
C-4
Ta
ble
C-4
. F
ina
l E
stim
ate
s, C
on
trib
uti
ng
Fa
cto
rs:
Ho
use
ho
ld S
urv
iva
l an
d G
row
th
Hou
seho
ld C
ateg
orie
s
SF
SM
SP w
/C
C w
/C
C w
o/C
Sr
M
SrF
Con
trib
utin
g Fa
ctor
s: S
urvi
val
and
Gro
wth
A
B
A
B
A
B
A
B
A
B
A
B
A
B
Food
kep
t at r
oom
tem
pera
ture
to
o lo
ng
0.25
3 0.
072
0.25
5 0.
075
0.25
00.
073
0.27
0 0.
073
0.23
0 0.
073
0.23
0 0.
106
0.22
5 0.
106
Food
ser
ved
raw
or
light
ly
cook
ed
0.16
0 0.
072
0.21
3 0.
107
0.13
50.
078
0.13
5 0.
079
0.16
8 0.
073
0.19
8 0.
082
0.15
5 0.
081
Inap
prop
riat
e ad
vanc
e pr
epar
atio
n 0.
140
0.01
90.
125
0.02
0 0.
190
0.06
9 0.
218
0.07
0 0.
140
0.02
0 0.
118
0.02
0 0.
125
0.01
9
Inap
prop
riat
e th
awin
g of
froz
en
food
s 0.
210
0.03
50.
200
0.03
7 0.
210
0.03
5 0.
210
0.03
6 0.
213
0.03
6 0.
210
0.03
5 0.
193
0.03
5
Inap
prop
riat
e tim
e or
tem
pera
ture
fo
r co
ld h
oldi
ng
0.17
8 0.
068
0.20
0 0.
073
0.17
80.
068
0.16
8 0.
069
0.19
5 0.
070
0.24
3 0.
069
0.18
8 0.
068
Inap
prop
riat
e tim
e or
tem
pera
ture
fo
r co
okin
g 0.
273
0.04
30.
313
0.11
6 0.
255
0.04
0 0.
263
0.04
7 0.
263
0.04
8 0.
300
0.11
0 0.
275
0.10
6
Inap
prop
riat
e tim
e or
tem
pera
ture
fo
r co
olin
g 0.
228
0.07
40.
250
0.08
0 0.
225
0.07
1 0.
263
0.07
8 0.
225
0.07
9 0.
238
0.07
3 0.
250
0.07
1
Inap
prop
riat
e tim
e or
tem
pera
ture
fo
r ho
t hol
ding
0.
140
0.01
80.
118
0.02
0 0.
100
0.01
9 0.
105
0.01
9 0.
093
0.02
0 0.
143
0.01
8 0.
125
0.01
9
Inap
prop
riat
e tim
e or
tem
pera
ture
fo
r re
heat
ing
0.17
5 0.
070
0.15
0 0.
073
0.16
50.
071
0.22
5 0.
072
0.17
8 0.
071
0.15
8 0.
072
0.15
5 0.
071
SF
= S
ingl
e Fe
mal
e C
w/C
=
Cou
ple
with
Chi
ldre
n Sr
F =
Sen
ior
Fem
ale
SM
= S
ingl
e M
ale
C w
o/C
=
Cou
ple
with
out C
hild
ren
SP w
/C
= S
ingl
e Pa
rent
with
Chi
ldre
n Sr
M
= S
enio
r M
ale
Not
e:
Cel
ls la
bele
d “A
” co
ntai
n P(
cont
ribu
ting
fact
or o
ccur
s).
C
ells
labe
led
“B”
cont
ain
P(fo
od is
con
tam
inat
ed, g
iven
the
cont
ribu
ting
fact
or o
ccur
red)
.

Appendix D: All Parameters Estimated for the National Baseline Calibration


D-1
Food Category Number of Annual
Servings
Dairy 345,702,445,683
Eggs 57,203,104,242
Meat 162,753,089,629
Poultry 129,219,082,353
Produce 614,966,486,998
Seafood 26,022,691,467
Water 626,585,873,709
Total 1,962,452,774,081
Table D-2. Parameter P(Aij)
Food Category
Pathogen Dairy Eggs Meat Poultry Produce Seafood Water
Bacillus cereus 0.3358
Campylobacter jejuni 0.0624 0.7612
Clostridium perfringens 0.1700 0.2132 0.4021
Cryptosporidium parvum 0.0535
E. coli O157:H7 0.0022 0.0000
E. coli spp 0.6564 0.9675 0.6238
Hepatitis A
Listeria monocytogenes 0.0061 0.0000 0.1804 0.1332 0.3270
Norwalk virus group
Salmonella Enteritidis 0.0000
Salmonella spp 0.0190 0.1599 0.0082
Shigella spp 0.0056
Staphylococcus aureus 0.1566 0.6304 0.2222
Streptococcus spp
Vibrio spp 0.0474
Yersinia enterocolitica 0.0248
Table D-1. Parameter Nsi

Modeling the Effects of Food Handling Practices on the Incidence of Foodborne Illness
D-2
Food Category Purchased Through
Retail Home-Grown
Produce 0.981 0.019
Meats 0.998 0.002
Poultry 0.996 0.004
Dairy 0.993 0.007
Seafood 0.989 0.011
Eggs 0.988 0.012
Water 0.465 0.535
Table D-3. Parameters ci and 1 – ci

D-3
Appendix D: All Parameters Estimated for the National Baseline Calibration
Ta
ble
D-4
. P
ara
me
ter
bij
Food
Cat
egor
y
Ret
ail C
ateg
ory
Dai
ry
Eggs
M
eat
Poul
try
Prod
uce
Seaf
ood
Ret
ail f
ood
stor
es
Gro
cery
sto
re
0.46
64
0.68
76
0.75
51
0.72
61
0.74
02
0.19
70
Con
veni
ence
sto
re
0.05
76
0.08
50
0.09
33
0.08
97
0.09
14
0.00
90
Seaf
ood
stor
e 0.
0000
0.
0000
0.
0000
0.
0000
0.
0000
0.
0006
Res
taur
ants
Full-
serv
ice
rest
aura
nts
0.15
89
0.07
86
0.05
07
0.04
62
0.04
72
0.30
48
Mix
ed-s
ervi
ce r
esta
uran
ts
0.00
00
0.00
00
0.00
00
0.00
00
0.00
00
0.00
00
Fast
-foo
d re
stau
rant
s 0.
1704
0.
0843
0.
0544
0.
0495
0.
0507
0.
3270
Tem
pora
ry e
stab
lishm
ents
0.
0202
0.
0100
0.
0065
0.
0059
0.
0060
0.
0388
Res
taur
ant A
—N
OL
0.06
21
0.03
07
0.01
98
0.01
81
0.01
85
0.11
92
Inst
itutio
ns
Chi
ld c
are
cent
ers
0.00
22
0.00
08
0.00
07
0.00
22
0.00
16
0.00
01
Hos
pita
ls
0.00
33
0.00
12
0.00
10
0.00
33
0.00
24
0.00
02
Scho
ols
0.02
65
0.00
99
0.00
84
0.02
64
0.01
89
0.00
15
Nur
sing
hom
es
0.00
66
0.00
25
0.00
21
0.00
66
0.00
47
0.00
04
Inst
itutio
n A
—N
OL
0.02
65
0.00
99
0.00
84
0.02
64
0.01
89
0.00
15
Tota
l 1
1 1
1 1
1

Modeling the Effects of Food Handling Practices on the Incidence of Foodborne Illness
D-4
Ta
ble
D-5
. P
ara
me
ter
P(B
′ jk)
Food
Sto
res
Res
taur
ants
In
stit
utio
ns
Con
tam
inat
ion
Fact
ors
Gro
cery
C
onve
nien
ceSe
afoo
d Fu
ll-Se
rvic
e M
ixed
-Se
rvic
e Fa
st-F
ood
Tem
pora
ryC
hild
Car
eH
ospi
tals
Sc
hool
s N
ursi
ng
Hom
es
Food
han
dlin
g by
as
ympt
omat
ic fo
od h
andl
er
0.09
89
0.21
63
0.24
820.
0713
0.
1098
0.
1588
0.
1367
0.
1167
0.
0433
0.
1156
0.
0978
Food
han
dlin
g by
ill f
ood
hand
ler
0.16
61
0.20
14
0.21
710.
1038
0.
1069
0.
1367
0.
0938
0.
1067
0.
0433
0.
0994
0.
0972
Inap
prop
riat
e ba
re-h
and
cont
act w
ith r
eady
-to-
cook
fo
ods
0.06
96
0.04
31
0.06
460.
0925
0.
1183
0.
1503
0.
1292
0.
2500
0.
1400
0.
2600
0.
2300
Inap
prop
riat
e ba
re-h
and
cont
act w
ith r
eady
-to-
eat
food
s 0.
1489
0.
1511
0.
1929
0.19
50
0.19
33
0.31
88
0.32
00
0.19
00
0.10
33
0.12
61
0.12
39
Inap
prop
riat
e gl
oved
-han
d co
ntac
t with
rea
dy-t
o-co
ok
food
s 0.
0225
0.
0125
0.
0167
0.02
75
0.03
38
0.15
13
0.02
50
0.04
84
0.02
84
0.03
50
0.03
50
Inap
prop
riat
e gl
oved
-han
d co
ntac
t with
rea
dy-t
o-ea
t fo
ods
0.10
71
0.11
29
0.07
430.
1075
0.
1183
0.
2188
0.
1667
0.
1433
0.
0950
0.
1431
0.
1336
Inap
prop
riat
e ha
nd w
ashi
ng
0.40
92
0.38
25
0.39
670.
6200
0.
4925
0.
5300
0.
2333
0.
3633
0.
2867
0.
3739
0.
3344
Inap
prop
riat
e sa
nita
tion
of
equi
pmen
t or
uten
sils
0.
4084
0.
3161
0.
3756
0.49
69
0.31
98
0.34
94
0.28
33
0.14
00
0.22
50
0.15
28
0.25
53
Inap
prop
riat
e sa
nita
tion
or
clea
ning
of c
uttin
g bo
ards
0.
2489
0.
2236
0.
2895
0.26
50
0.27
17
0.29
53
0.22
92
0.21
00
0.15
00
0.21
50
0.23
83

D-5
Appendix D: All Parameters Estimated for the National Baseline Calibration
Ta
ble
D-6
. P
ara
me
ter
P(C
′ jkIB
′ jk)
Food
Sto
res
Res
taur
ants
In
stit
utio
ns
Con
tam
inat
ion
Fact
ors
Gro
cery
C
onve
nien
ceSe
afoo
d Fu
ll-Se
rvic
e M
ixed
-Se
rvic
e Fa
st-F
ood
Tem
pora
ryC
hild
C
are
Hos
pita
ls
Scho
ols
Nur
sing
H
omes
Food
han
dlin
g by
asy
mpt
omat
ic
food
han
dler
0.
0500
0.
0217
0.
1783
0.
0783
0.
1350
0.
2117
0.
1483
0.
1850
0.
1144
0.
1150
0.
1417
Food
han
dlin
g by
ill f
ood
hand
ler
0.02
00
0.19
00
0.05
00
0.05
00
0.04
34
0.04
34
0.04
67
0.04
34
0.03
67
0.04
34
0.07
34
Inap
prop
riat
e ba
re-h
and
cont
act
with
rea
dy-t
o-co
ok fo
ods
0.07
17
0.16
83
0.05
50
0.08
00
0.13
67
0.16
67
0.12
33
0.19
33
0.12
78
0.11
33
0.05
67
Inap
prop
riat
e ba
re-h
and
cont
act
with
rea
dy-t
o-ea
t foo
ds
0.08
17
0.18
67
0.21
83
0.13
50
0.18
17
0.25
50
0.20
33
0.23
17
0.17
39
0.16
42
0.30
00
Inap
prop
riat
e gl
oved
-han
d co
ntac
t with
rea
dy-t
o-co
ok fo
ods
0.03
61
0.10
34
0.02
37
0.06
87
0.11
53
0.26
03
0.18
03
0.16
53
0.10
76
0.10
12
0.16
20
Inap
prop
riat
e gl
oved
-han
d co
ntac
t with
rea
dy-t
o-ea
t foo
ds
0.01
36
0.14
37
0.16
58
0.09
67
0.16
67
0.16
67
0.12
67
0.23
00
0.14
89
0.14
17
0.19
33
Inap
prop
riat
e ha
nd w
ashi
ng
0.18
33
0.23
67
0.26
67
0.14
00
0.19
00
0.25
00
0.20
67
0.20
00
0.14
67
0.16
50
0.17
33
Inap
prop
riat
e sa
nita
tion
of
equi
pmen
t or
uten
sils
0.
0339
0.
1233
0.
3100
0.
1500
0.
1333
0.
1933
0.
1467
0.
1800
0.
2067
0.
1933
0.
0833
Inap
prop
riat
e sa
nita
tion
or
clea
ning
of c
uttin
g bo
ards
0.
0333
0.
0334
0.
1075
0.
1133
0.
0887
0.
1175
0.
1083
0.
0940
0.
0878
0.
0867
0.
1092
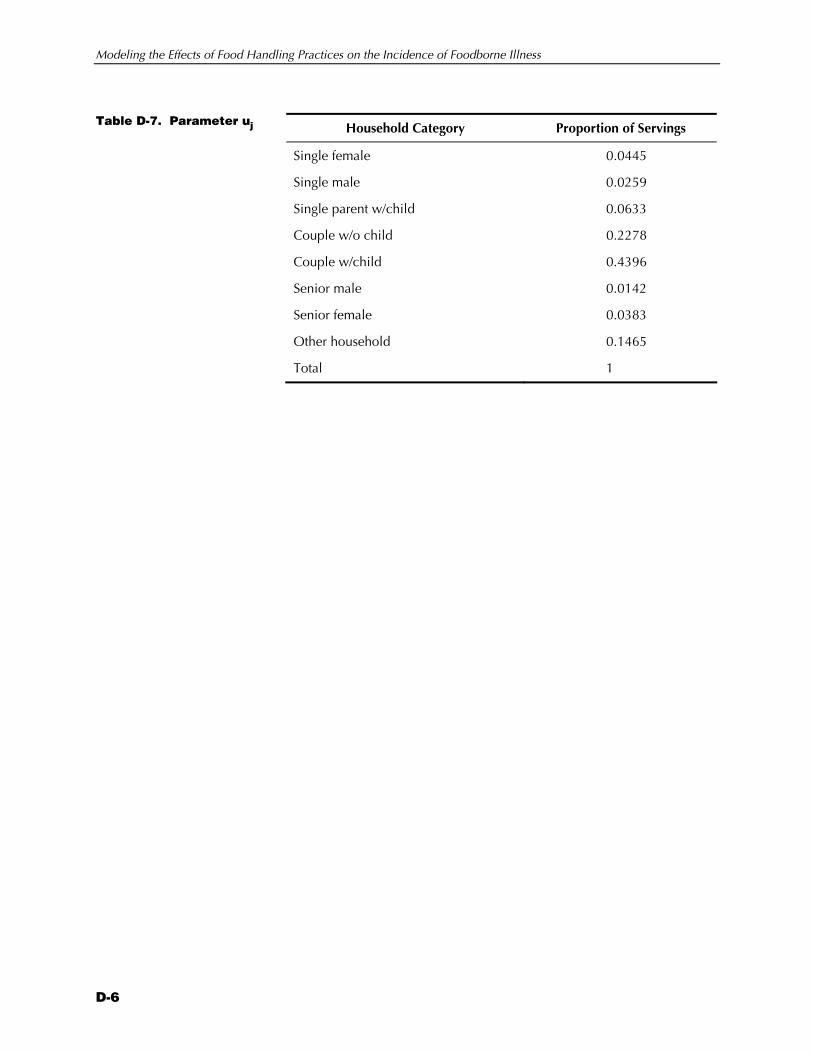
Modeling the Effects of Food Handling Practices on the Incidence of Foodborne Illness
D-6
Household Category Proportion of Servings
Single female 0.0445
Single male 0.0259
Single parent w/child 0.0633
Couple w/o child 0.2278
Couple w/child 0.4396
Senior male 0.0142
Senior female 0.0383
Other household 0.1465
Total 1
Table D-7. Parameter uj

D-7
Appendix D: All Parameters Estimated for the National Baseline Calibration
Ta
ble
D-8
. P
ara
me
ter
P(B
* jk)
Con
tam
inat
ion
Fact
ors
Sing
le
Fem
ale
Sing
le
Mal
e Si
ngle
Pa
rent
Cou
ple
wit
h C
hild
ren
Cou
ple
No
Chi
ldre
n Se
nior
M
ale
Seni
or
Fem
ale
Food
han
dlin
g by
asy
mpt
omat
ic h
ouse
hold
m
embe
r 0.
0880
0.
0787
0.
0861
0.
1060
0.
0960
0.
0833
0.
0770
Food
han
dlin
g by
ill h
ouse
hold
mem
ber
0.11
40
0.17
17
0.13
53
0.18
28
0.11
88
0.13
33
0.12
25
Inap
prop
riat
e ba
re-h
and
cont
act w
ith r
eady
-to-
cook
food
s 0.
0661
0.
0720
0.
0660
0.
0661
0.
0720
0.
1500
0.
1420
Inap
prop
riat
e ba
re-h
and
cont
act w
ith r
eady
-to-
eat f
oods
0.
2440
0.
2535
0.
2365
0.
2623
0.
2493
0.
2765
0.
2180
Inap
prop
riat
e gl
oved
-han
d co
ntac
t with
rea
dy-
to-c
ook
food
s 0.
0085
0.
0075
0.
0065
0.
0280
0.
0210
0.
0085
0.
0078
Inap
prop
riat
e gl
oved
-han
d co
ntac
t with
rea
dy-
to-e
at fo
ods
0.01
96
0.02
23
0.01
39
0.01
61
0.01
31
0.01
59
0.01
79
Inap
prop
riat
e ha
nd w
ashi
ng
0.42
02
0.40
89
0.37
72
0.37
79
0.37
13
0.42
22
0.36
02
Inap
prop
riat
e sa
nita
tion
of e
quip
men
t or
uten
sils
0.
3190
0.
3390
0.
2990
0.
3740
0.
3460
0.
3550
0.
3275
Inap
prop
riat
e sa
nita
tion
or c
lean
ing
of c
uttin
g bo
ards
0.
2707
0.
2393
0.
2020
0.
2433
0.
2291
0.
2941
0.
1970
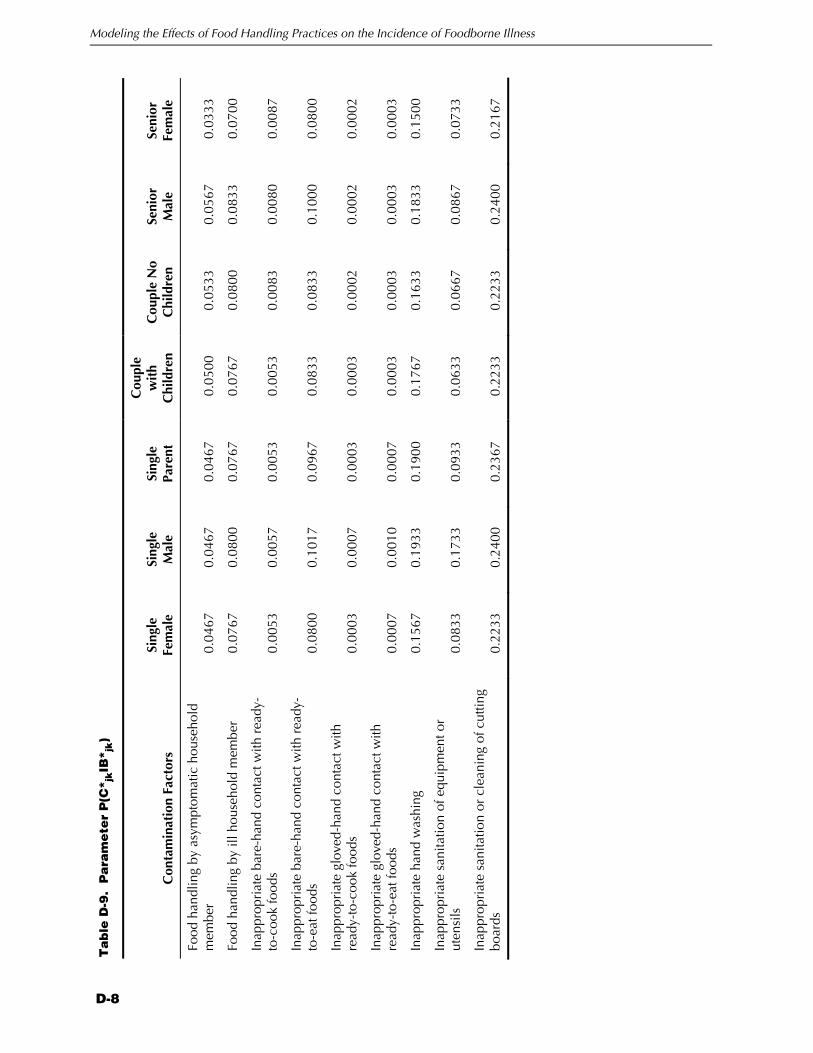
Modeling the Effects of Food Handling Practices on the Incidence of Foodborne Illness
D-8
Ta
ble
D-9
. P
ara
me
ter
P(C
* jkIB
* jk)
Con
tam
inat
ion
Fact
ors
Sing
le
Fem
ale
Sing
le
Mal
e Si
ngle
Pa
rent
Cou
ple
wit
h C
hild
ren
Cou
ple
No
Chi
ldre
n Se
nior
M
ale
Seni
or
Fem
ale
Food
han
dlin
g by
asy
mpt
omat
ic h
ouse
hold
m
embe
r 0.
0467
0.
0467
0.
0467
0.
0500
0.
0533
0.
0567
0.
0333
Food
han
dlin
g by
ill h
ouse
hold
mem
ber
0.07
67
0.08
00
0.07
67
0.07
67
0.08
00
0.08
33
0.07
00
Inap
prop
riat
e ba
re-h
and
cont
act w
ith r
eady
-to
-coo
k fo
ods
0.00
53
0.00
57
0.00
53
0.00
53
0.00
83
0.00
80
0.00
87
Inap
prop
riat
e ba
re-h
and
cont
act w
ith r
eady
-to
-eat
food
s 0.
0800
0.
1017
0.
0967
0.
0833
0.
0833
0.
1000
0.
0800
Inap
prop
riat
e gl
oved
-han
d co
ntac
t with
re
ady-
to-c
ook
food
s 0.
0003
0.
0007
0.
0003
0.
0003
0.
0002
0.
0002
0.
0002
Inap
prop
riat
e gl
oved
-han
d co
ntac
t with
re
ady-
to-e
at fo
ods
0.00
07
0.00
10
0.00
07
0.00
03
0.00
03
0.00
03
0.00
03
Inap
prop
riat
e ha
nd w
ashi
ng
0.15
67
0.19
33
0.19
00
0.17
67
0.16
33
0.18
33
0.15
00
Inap
prop
riat
e sa
nita
tion
of e
quip
men
t or
uten
sils
0.
0833
0.
1733
0.
0933
0.
0633
0.
0667
0.
0867
0.
0733
Inap
prop
riat
e sa
nita
tion
or c
lean
ing
of c
uttin
g bo
ards
0.
2233
0.
2400
0.
2367
0.
2233
0.
2233
0.
2400
0.
2167
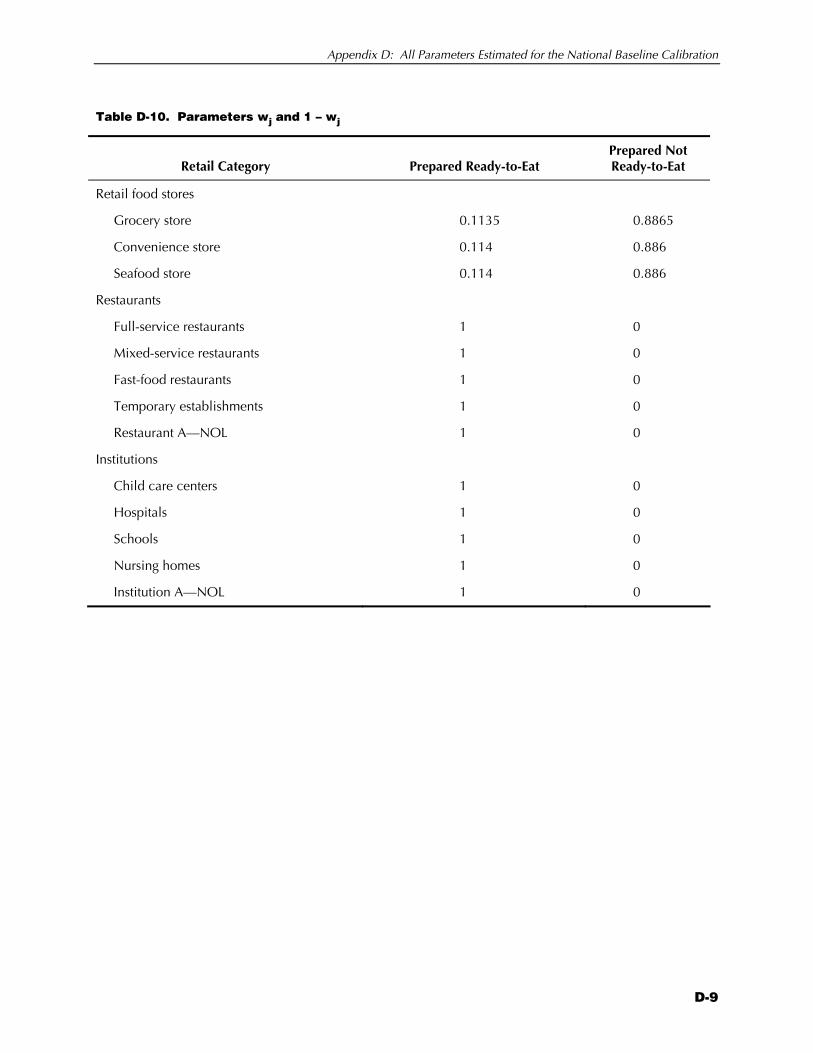
Appendix D: All Parameters Estimated for the National Baseline Calibration
D-9
Table D-10. Parameters wj and 1 – wj
Retail Category Prepared Ready-to-Eat Prepared Not Ready-to-Eat
Retail food stores
Grocery store 0.1135 0.8865
Convenience store 0.114 0.886
Seafood store 0.114 0.886
Restaurants
Full-service restaurants 1 0
Mixed-service restaurants 1 0
Fast-food restaurants 1 0
Temporary establishments 1 0
Restaurant A—NOL 1 0
Institutions
Child care centers 1 0
Hospitals 1 0
Schools 1 0
Nursing homes 1 0
Institution A—NOL 1 0

Modeling the Effects of Food Handling Practices on the Incidence of Foodborne Illness
D-10
Ta
ble
D-1
1.
Pa
ram
ete
r P
(B" j
k)
Food
Sto
res
Res
taur
ants
In
stit
utio
ns
Path
ogen
Gro
wth
Fac
tors
G
roce
ryC
onve
nien
ceSe
afoo
dFu
ll-Se
rvic
e M
ixed
-Se
rvic
eFa
st-
Food
Te
mpo
rary
Chi
ld
Car
e H
ospi
tals
Scho
ols
Nur
sing
H
omes
Food
kep
t at r
oom
te
mpe
ratu
re to
o lo
ng
0.30
00
0.30
67
0.40
67
0.32
75
0.27
500.
3425
0.
3167
0.
2300
0.
2333
0.
3200
0.11
84
Food
ser
ved
raw
or
light
ly
cook
ed
0.00
28
0.00
70
0.01
34
0.04
00
0.01
780.
0063
0.
0150
0.
0050
0.
0184
0.
0184
0.01
83
Inap
prop
riat
e ad
vanc
e pr
epar
atio
n 0.
2025
0.
2496
0.
2926
0.
2900
0.
2350
0.26
39
0.23
33
0.22
59
0.20
19
0.31
110.
2833
Inap
prop
riat
e th
awin
g of
fr
ozen
food
s 0.
2375
0.
2014
0.
2678
0.
2625
0.
2125
0.25
42
0.20
67
0.21
11
0.14
89
0.21
670.
0983
Inap
prop
riat
e tim
e or
te
mpe
ratu
re fo
r co
ld h
oldi
ng
0.42
69
0.14
11
0.13
44
0.50
63
0.10
500.
3726
0.
1100
0.
1138
0.
3511
0.
2750
0.22
94
Inap
prop
riat
e tim
e or
te
mpe
ratu
re fo
r co
okin
g 0.
2450
0.
2726
0.
3259
0.
2775
0.
2500
0.37
39
0.27
33
0.30
59
0.19
19
0.26
440.
1013
Inap
prop
riat
e tim
e or
te
mpe
ratu
re fo
r co
olin
g 0.
1800
0.
1459
0.
1059
0.
5400
0.
1450
0.11
69
0.18
67
0.11
39
0.08
52
0.11
110.
1333
Inap
prop
riat
e tim
e or
te
mpe
ratu
re fo
r ho
t hol
ding
0.
3688
0.
2011
0.
0678
0.
3288
0.
0875
0.09
52
0.09
00
0.08
38
0.21
78
0.13
330.
1213
Inap
prop
riat
e tim
e or
te
mpe
ratu
re fo
r re
heat
ing
0.20
00
0.24
78
0.24
78
0.24
25
0.22
250.
2292
0.
2833
0.
2111
0.
1789
0.
2200
0.09
83

D-11
Appendix D: All Parameters Estimated for the National Baseline Calibration
Ta
ble
D-1
2.
Pa
ram
ete
r P
(C" j
kIB
" jk)
Food
Sto
res
Res
taur
ants
In
stit
utio
ns
Path
ogen
Gro
wth
Fac
tors
G
roce
ry
Con
veni
ence
Seaf
ood
Full-
Serv
ice
Mix
ed-
Serv
ice
Fast
-Fo
od
Tem
pora
ryC
hild
C
are
Hos
pita
lsSc
hool
s N
ursi
ng
Hom
es
Food
kep
t at r
oom
te
mpe
ratu
re to
o lo
ng
0.16
67
0.20
11
0.19
17
0.16
170.
1700
0.
2183
0.
1683
0.
1617
0.
1608
0.
1642
0.
1858
Food
ser
ved
raw
or
light
ly
cook
ed
0.04
89
0.04
61
0.21
17
0.14
500.
1533
0.
2283
0.
1725
0.
0808
0.
0746
0.
0746
0.
1121
Inap
prop
riat
e ad
vanc
e pr
epar
atio
n 0.
0778
0.
2200
0.
2492
0.
1625
0.15
42
0.08
58
0.12
08
0.10
75
0.09
54
0.13
88
0.15
79
Inap
prop
riat
e th
awin
g of
fr
ozen
food
s 0.
0084
0.
0084
0.
0084
0.
0084
0.00
84
0.01
01
0.03
00
0.00
84
0.00
84
0.00
84
0.00
84
Inap
prop
riat
e tim
e or
te
mpe
ratu
re fo
r co
ld
hold
ing
0.14
61
0.19
22
0.30
33
0.20
000.
2200
0.
3433
0.
2250
0.
1850
0.
1625
0.
1658
0.
2408
Inap
prop
riat
e tim
e or
te
mpe
ratu
re fo
r co
okin
g 0.
0744
0.
1444
0.
1583
0.
1617
0.13
67
0.14
92
0.20
08
0.15
75
0.14
04
0.14
71
0.20
96
Inap
prop
riat
e tim
e or
te
mpe
ratu
re fo
r co
olin
g 0.
0583
0.
0500
0.
0683
0.
1150
0.22
50
0.25
42
0.26
33
0.26
00
0.23
67
0.24
33
0.34
33
Inap
prop
riat
e tim
e or
te
mpe
ratu
re fo
r ho
t hol
ding
0.
1078
0.
1089
0.
0908
0.
0875
0.09
17
0.28
08
0.17
67
0.13
67
0.11
83
0.12
83
0.17
83
Inap
prop
riat
e tim
e or
te
mpe
ratu
re fo
r re
heat
ing
0.04
17
0.04
39
0.04
96
0.03
790.
0342
0.
2675
0.
2458
0.
2025
0.
1779
0.
1846
0.
2721

Modeling the Effects of Food Handling Practices on the Incidence of Foodborne Illness
D-12
Ta
ble
D-1
3.
Pa
ram
ete
r P
(B**
jk)
Path
ogen
Gro
wth
Fac
tors
Si
ngle
Fe
mal
e Si
ngle
M
ale
Sing
le
Pare
nt
Cou
ple
wit
h C
hild
ren
Cou
ple
No
Chi
ldre
n Se
nior
M
ale
Seni
or
Fem
ale
Food
kep
t at r
oom
tem
p to
o lo
ng
0.23
80
0.26
40
0.27
80
0.32
23
0.21
40
0.24
69
0.23
25
Food
ser
ved
raw
or
light
ly c
ooke
d 0.
1589
0.
1664
0.
1405
0.
1638
0.
1543
0.
1576
0.
1249
Inap
prop
riat
e ad
vanc
e pr
epar
atio
n 0.
0860
0.
1000
0.
1410
0.
1720
0.
0710
0.
1020
0.
0800
Inap
prop
riat
e th
awin
g of
froz
en fo
ods
0.18
90
0.19
50
0.20
65
0.21
65
0.25
00
0.19
76
0.18
58
Inap
prop
riat
e tim
e or
tem
p fo
r co
ld h
oldi
ng
0.15
10
0.16
00
0.15
10
0.14
70
0.15
80
0.17
70
0.15
50
Inap
prop
riat
e tim
e or
tem
p fo
r co
okin
g 0.
3086
0.
3248
0.
3020
0.
3051
0.
3044
0.
3202
0.
3100
Inap
prop
riat
e tim
e or
tem
p fo
r co
olin
g 0.
2420
0.
2550
0.
2480
0.
2925
0.
2500
0.
2557
0.
2581
Inap
prop
riat
e tim
e or
tem
p fo
r ho
t hol
ding
0.
1132
0.
0960
0.
0826
0.
1010
0.
0770
0.
1187
0.
1041
Inap
prop
riat
e tim
e or
tem
p fo
r re
heat
ing
0.16
40
0.16
00
0.18
40
0.35
00
0.17
20
0.17
31
0.16
53
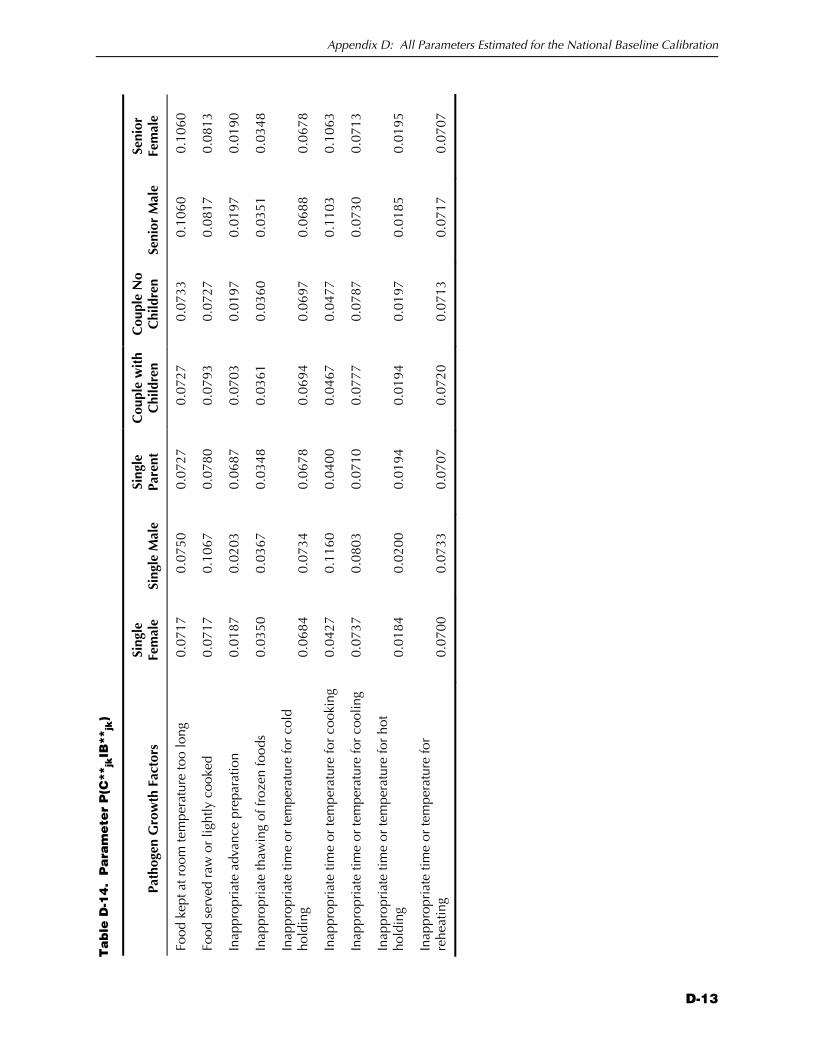
D-13
Appendix D: All Parameters Estimated for the National Baseline Calibration
Ta
ble
D-1
4.
Pa
ram
ete
r P
(C**
jkIB
**jk
)
Path
ogen
Gro
wth
Fac
tors
Si
ngle
Fe
mal
e Si
ngle
Mal
e Si
ngle
Pa
rent
C
oupl
e w
ith
Chi
ldre
n C
oupl
e N
o C
hild
ren
Seni
or M
ale
Seni
or
Fem
ale
Food
kep
t at r
oom
tem
pera
ture
too
long
0.
0717
0.
0750
0.
0727
0.
0727
0.
0733
0.
1060
0.
1060
Food
ser
ved
raw
or
light
ly c
ooke
d 0.
0717
0.
1067
0.
0780
0.
0793
0.
0727
0.
0817
0.
0813
Inap
prop
riat
e ad
vanc
e pr
epar
atio
n 0.
0187
0.
0203
0.
0687
0.
0703
0.
0197
0.
0197
0.
0190
Inap
prop
riat
e th
awin
g of
froz
en fo
ods
0.03
50
0.03
67
0.03
48
0.03
61
0.03
60
0.03
51
0.03
48
Inap
prop
riat
e tim
e or
tem
pera
ture
for
cold
ho
ldin
g 0.
0684
0.
0734
0.
0678
0.
0694
0.
0697
0.
0688
0.
0678
Inap
prop
riat
e tim
e or
tem
pera
ture
for
cook
ing
0.04
27
0.11
60
0.04
00
0.04
67
0.04
77
0.11
03
0.10
63
Inap
prop
riat
e tim
e or
tem
pera
ture
for
cool
ing
0.07
37
0.08
03
0.07
10
0.07
77
0.07
87
0.07
30
0.07
13
Inap
prop
riat
e tim
e or
tem
pera
ture
for
hot
hold
ing
0.01
84
0.02
00
0.01
94
0.01
94
0.01
97
0.01
85
0.01
95
Inap
prop
riat
e tim
e or
tem
pera
ture
for
rehe
atin
g 0.
0700
0.
0733
0.
0707
0.
0720
0.
0713
0.
0717
0.
0707

Modeling the Effects of Food Handling Practices on the Incidence of Foodborne Illness
D-14
P(FBI treated) 0.08
P(FBIU) 0.92
P(FBIH) 0.00425
P(FBID) 6.84211 X 10⁻⁵
Table D-15. Parameter P(FBI)