Embed Size (px)
Citation preview
ACTA
UNIVERSITATIS
UPSALIENSIS
UPPSALA
2008
Digital Comprehensive Summaries of Uppsala Dissertationsfrom the Faculty of Science and Technology 444
Modeling the Interaction Space ofBiological Macromolecules: AProteochemometric Approach
Applications for Drug Discovery and Development
ALEKSEJS KONTIJEVSKIS
ISSN 1651-6214ISBN 978-91-554-7229-0urn:nbn:se:uu:diva-8916
���������� �������� �� ������ �������� � �� �������� ������� � �������� ��������� ��� �� ������� !�������� "�� #� $��% �� �&��� '� �(� �� ��� ' ���� ')(����(�* +(� �������� ,��� �� ������� � - ���(*
��������
.��/���0��� 1* $��%* ����� �(� 2������� 3���� ' ��� ���� ������������� 1)����(�������� 1�����(* 1��������� '� ��� �������� �� ���������* 1��� ����������� ���������* ������� ��� � ���� ����� � � ������� ���� ������� ���� ������� � ��� �� ��� � ������ ###* 44 ��* ������* 23�5 &4%6&�6��#64$$&6�*
�������� ��������� ��� �� �(� (���� ' ������ ��� ���� ��������* .,��� � '�������� ��� ��� �������� �� �(� ������� � ���� �� ������� ��������� ' ����� ���� ������� � �� �(������ ����� ��� �(� 0�� '� ������ ��������� ' ����'����� �� �������� ' ��� �''������� ��������*+(�� �(���� ������� ��������� � �(� ��������� ' � ��� �(��6���'�������
������( ������ �����(���������7 � ����� ���(� '� �������� ����� ������� '��� ���� ������������ �� �(��� �� ���* 2 �(�� ,�0 ,� �����������(���������6����� �������� ����� ��� ���� ���� ' ����� '�������� ���������(��� �������� �� ����� �� ������ �����(��������� � ��������� ����� ������(��*+(�� ( �(� �����(�������� ������� ' ��� � �������� ���� ���� ' �������� ���������
�������� '�� ������ ����� ������� ,� ������ ��� ������ ���(����� ' ��� ��������� ��286� �� ������� ����� �(�����(������ ���������� ' ��������� ������ � �''�������� ���� � ��������� ��������* !� '���(�� ��������� (, ���� �����(������������� �� �� ���� '� ���� ' ������� �(������ ,��( ���� �������� ��� 6�������� ������������ '� ����� ��� ��������� ���(����� � �(� �(�����(������ ���� ���������� ' ������� �286� ������ ���/�������* !� ������ ��� ��� (�� �� �(���������� ' �286� ������� �����'����� �� �������� � ������9�� 2:6+�-5 ���� ��������� ���'������� ������� ' �(� ��� ��� ��� ' �286� ������� ���������� ��6����������*!� ������� (, �����(��������� �� �� ���� � ��� ��� ��� ����� ' ����� �����
'������� � ���� ������ �� ��������� (, �� �� �������� ��� �� ����������� �� ��� �������� ������* :������ ,� ������ �(� ������� ' �(� �����(�������� ������( ��������� ' 1��-+ ��������� ' ��� ��������� ,��( � ������� '��� �(����� '����(��� )#�� �9���� �� ������ ��� ��������� ' �(� ������( � �(��(����� ����� '����*
� ������ �����(���������� ���'�������� �(���'�������� �(������ ������ ;31<���������� ��������� �286�� ��� ���������� �(����� ������ ����(��� )#��� =)�<���������� ��������� ���������� ���(��6����� � �� ( ����
�� �� � ���� �����! �� "���� �� � ��� �� #����������! #$ %&'! ������� ���� �����!�()*%+,- �������! �� � �. � ���� �� � /����� ������ #���� �� �! #$ %&+! ����������� �����! �()*%+,- �������! �� � �
> 1��0��/� .��/���0�� $��%
2335 �?��6?$�#23�5 &4%6&�6��#64$$&6����������������6%&�? @(����AA��*0�*��A������B��C���������������6%&�?D

To my family

Cover image: A three-dimensional representation of the interaction universe of biological macromolecules and low molecular weight compounds. Each red sphere represents a chemical sub-space of macromolecules and each gray sphere corre-sponds to a chemical sub-space of ligands. Lines indicate multiple macromolecule-ligand interactions. Proteochemometric models describe interaction universe mathematically and may be used for predictions of any interactions in this universe.
List of Papers This thesis is based on the following original papers, which are referred to in the text by their Roman numerals.
I. Kontijevskis A, Petrovska R, Mutule I, Uhlen S, Komorowski J, Prusis P, Wikberg JE (2007) Proteochemometric analysis of small cyclic peptides' interaction with wild-type and chimeric melano-cortin receptors. Proteins, 69, 83-96.
II. Kontijevskis A, Wikberg JE, Komorowski J (2007) Computational
proteomics analysis of HIV-1 protease interactome. Proteins, 68, 305-312.
III. Kontijevskis A, Prusis P, Petrovska R, Yahorava S, Mutulis F, Mu-
tule I, Komorowski J, Wikberg JE (2007) A look inside HIV resis-tance through retroviral protease interaction maps. PLoS Computa-tional Biology, 3(3), e48.
IV. Kontijevskis A, Petrovska R, Yahorava S, Komorowski J, Wikberg
JE (2008) Exploring interaction space of retroviral proteases reveals general patterns for resistance-improved HIV retardants. Submitted.
V. Kontijevskis A, Komorowski J, Wikberg JE (2008) Generalized
proteochemometric model of multiple cytochrome P450 enzymes and their inhibitors. Submitted.
Reprints were made with permission from the publisher

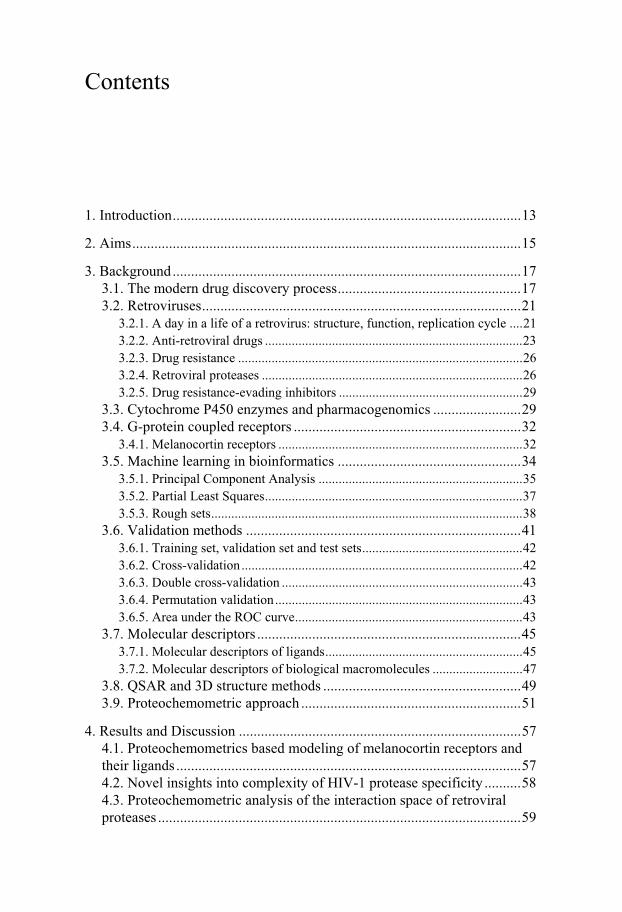
Contents
1. Introduction...............................................................................................13
2. Aims..........................................................................................................15
3. Background...............................................................................................17 3.1. The modern drug discovery process..................................................17 3.2. Retroviruses.......................................................................................21
3.2.1. A day in a life of a retrovirus: structure, function, replication cycle ....21 3.2.2. Anti-retroviral drugs .............................................................................23 3.2.3. Drug resistance .....................................................................................26 3.2.4. Retroviral proteases ..............................................................................26 3.2.5. Drug resistance-evading inhibitors .......................................................29
3.3. Cytochrome P450 enzymes and pharmacogenomics ........................29 3.4. G-protein coupled receptors ..............................................................32
3.4.1. Melanocortin receptors .........................................................................32 3.5. Machine learning in bioinformatics ..................................................34
3.5.1. Principal Component Analysis .............................................................35 3.5.2. Partial Least Squares.............................................................................37 3.5.3. Rough sets.............................................................................................38
3.6. Validation methods ...........................................................................41 3.6.1. Training set, validation set and test sets................................................42 3.6.2. Cross-validation....................................................................................42 3.6.3. Double cross-validation ........................................................................43 3.6.4. Permutation validation..........................................................................43 3.6.5. Area under the ROC curve....................................................................43
3.7. Molecular descriptors ........................................................................45 3.7.1. Molecular descriptors of ligands...........................................................45 3.7.2. Molecular descriptors of biological macromolecules ...........................47
3.8. QSAR and 3D structure methods ......................................................49 3.9. Proteochemometric approach ............................................................51
4. Results and Discussion .............................................................................57 4.1. Proteochemometrics based modeling of melanocortin receptors and their ligands ..............................................................................................57 4.2. Novel insights into complexity of HIV-1 protease specificity ..........58 4.3. Proteochemometric analysis of the interaction space of retroviral proteases ...................................................................................................59

4.4. Generalized proteochemometric model of multiple cytochrome P450 enzymes and their inhibitors.....................................................................61
5. Concluding remarks and future perspectives ............................................63
6. Acknowledgments.....................................................................................65
7. References.................................................................................................69
Abbreviations
ACC Auto- and cross-covariances ACTH Adrenocorticotropic hormone ADMET Adsorption, distribution, metabolism, elimination, toxicity AIDS Acquired immune deficiency syndrome AUC Area under the ROC curve BLAST Basic local alignment search tool CYP Cytochrome P450 enzyme DNA Deoxyribonucleic acid FDA Food and drug administration FN False negative FP False positive GPCR G-protein coupled receptor GRIND Grid-independent descriptors HAART Highly active anti-retroviral therapy HCV Hepatitis C virus HIV-1 Human immunodeficiency virus type 1 HMM Hidden Markov models HTS High-throughput screening MC Melanocortin receptor MIF Molecular interaction field MSH Melanocyte-stimulating hormone NMR Nuclear magnetic resonance NNRTI Non-nucleoside reverse transcriptase inhibitor NRTI Nucleoside reverse transcriptase inhibitor PCA Principal component analysis PCM Proteochemometrics
PDB Protein data bank PLS Partial least squares QSAR Quantitative structure-activity relationship QSPR Quantitative structure-property relationship RMSEE Root mean square error of estimate RMSEP Root mean square error of prediction RNA Ribonucleic acid ROC Receiver operating characteristic curve RT Reverse transcriptase TN True negative TP True positive

13
1. Introduction
The “OMICS” world
Over the past ten years, technical revolutions in molecular biology, informatics and automation brought major changes in biology and chemistry and had significant impact on many aspects of human activities, especially in medicine and the pharmaceutical sciences. These three revolutions not only shifted paradigms of biology and opened new prospects and promises for gene and stem cell-based therapies, but also offered opportunities for the application of new diagnostic procedures, development of more selective and efficacious medicines, and the eventual elimination of many diseases. The appearance of the so called “omics” world in life sciences, exemplified by genomics, proteomics, metabonomics, transcriptoms, glycomics, and interactomics gave a global view on large-scale investigations and biological processes in general (1-4). Although what we can envisage is still far from what we can actually do today, the “omics” concepts have irrevocably al-tered the intellectual landscape of the biosciences.
However, biology and chemistry is at risk of becoming overflown by data on a previously unknown scale and complexity. New postgenomic strategies need to be developed urgently, to take full advantage of the data “explosion” of the “omics” world and to understand the complexity of the organization of life. But will we really be able to understand biological com-plexity to the full extent possible? Are we ready to make full models of biol-ogy? A similar question was put forward in 1903: “The flying machine which will really fly might be evolved by the combined and continuous efforts of mathematicians and mechanicians in from one million to ten million years” (The New York Times, October 9, 1903). However, already on December 17, 1903, the Wright Flyer became the first powered, heavier-than-air ma-chine to achieve controlled, sustained flight with a pilot aboard.
During the past 20 years a multidisciplinary field, called bioinfor-matics, has emerged and become an important part of research and develop-ment in the biomedical sciences (4). Bioinformatics operates at the level of protein and nucleic acid sequences, their structures, functions and phylogen-ies and it provides a multitude of powerful methods for efficient analysis of vast amounts of data; from microarray experiments and high-throughput
14
screening data, to biochemical and mass spectrometry data. The field of bio-informatics is a very dynamic one and its scope and focus are constantly changing, growing, developing and expanding to encompass new areas of applications (5).
In this thesis we developed further a novel chemo-bioinformatics approach called proteochemometrics and demonstrated its practical utility in analyzing the molecular interaction space of protein-ligand interactions, among other things its applicability for design of retroviral protease inhibi-tors, its potential contribution to the pharmacogenomics field and drug dis-covery and development. This thesis, therefore, is addressed to scientists from various disciplines from biologists and computer scientists to computa-tional chemists and chemo-bioinformaticians.
The next chapters of this thesis will introduce a reader to the back-ground of the study and explain the main methods this work is based on. To highlight the complexity of new drug development the background starts with a short overview of the modern drug discovery process (section 3.1), following a summary on retroviruses (section 3.2) and a review of several important classes of biological targets (sections 3.2-3.4). Next, a brief intro-duction to machine learning in bioinformatics (section 3.5), validation meth-ods (section 3.6), and molecular descriptors (section 3.7) is given. This is followed by a description of the QSAR and 3D structure methods (section 3.8) and the proteochemometric approach (section 3.9). Finally, section 4 gives an overview about the results achieved in papers I-V and section 5 concludes this work.

15
2. Aims
- The main aim of the study was to develop the proteochemometric approach
further as a generalized method for the analysis of the interaction space of biological macromolecules and their ligands for multiple organisms, new types of biological targets using large data sets.
- To evaluate and compare validity, interpretability and scope of proteo-
chemometric and QSAR models, as well as to assess the use of various molecular descriptors in proteochemometric modeling.
- To perform in-depth proteochemometric analysis of the interaction space of
retroviral proteases, analyze biological mechanisms underlying drug resis-tance, and develop strategies for design of multiple-target selective com-pounds, including adaptive inhibitors of HIV-1 proteases based on proteo-chemometrics.
- To investigate the complexity of HIV-1 protease specificity from a bioin-
formatics point of view. - To assess the applicability of the proteochemometric approach in the phar-
macogenomics field; in particular to use it for exploration of the interac-tion space of cytochrome P450 enzymes and their inhibitors.

16
17
3. Background
3.1. The modern drug discovery process
“They are ill discoverers that think there is no land, when they can see noth-ing but sea.”
(Francis Bacon, 1561-1626) The discovery and development of new medicines is considered to be one of the most complex research areas in academia and the pharmaceutical indus-try. To be successful, tight integration of multiple disciplines and technolo-gies is needed to resolve all the challenges contained in the costly and time-consuming drug discovery process. Up until about 40 years ago, the tradi-tional process of drug discovery was directed to testing of small molecules against cells, tissues or on whole animals (6). Only a relatively small number of compounds could be tested in this way and the optimization of a lead compound was often performed without any deep knowledge about the tar-get. In the late 1960s and 1970s, due to significant advances in understand-ing of human biology and biochemistry, “drug hunters” began to discover novel targets using the methods of classical pharmacology (6). Various chemical probes were used to identify novel receptor subtypes and new classes of drugs (which are still in clinical use today) emerged, such as �- and �- blockers, histamine and serotonin antagonists and many others. Dur-ing the 1980s, with the advancements in biochemical separations and cloning technology, individual enzymes, ion channels and receptors (in expressed cells or membrane preparations) then became available for drug screening and rational drug design. This stimulated discovery of many new important classes of drugs, such as angiotensin converting enzyme inhibitors, leukot-riene antagonists, and many more. Further development of biochemical as-says techniques led to introduction of high-throughput screening (HTS) into the drug discovery process during the 1990s. HTS aims to identify lead compounds by the screening of large libraries of chemicals against biologi-cal targets (7-8).
18
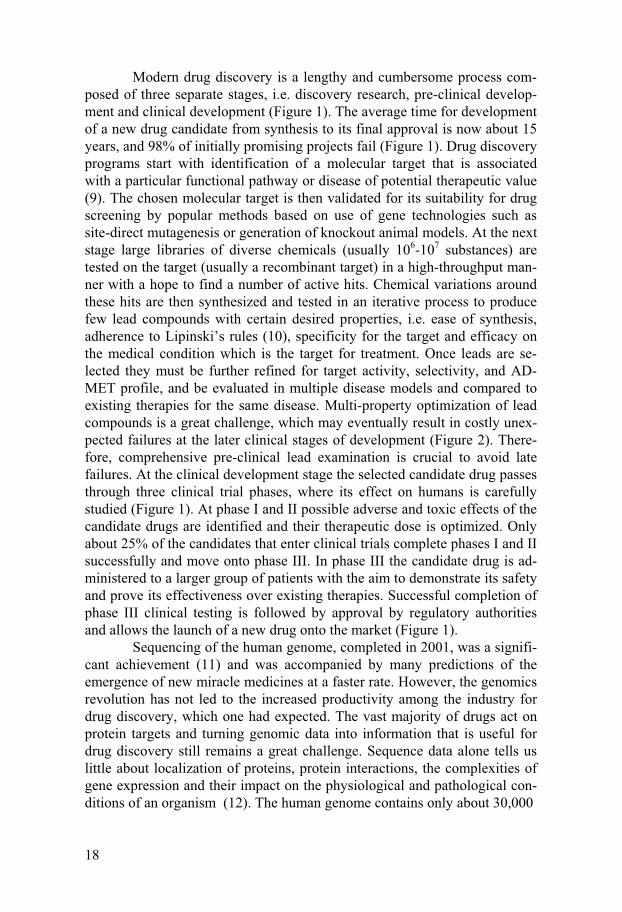
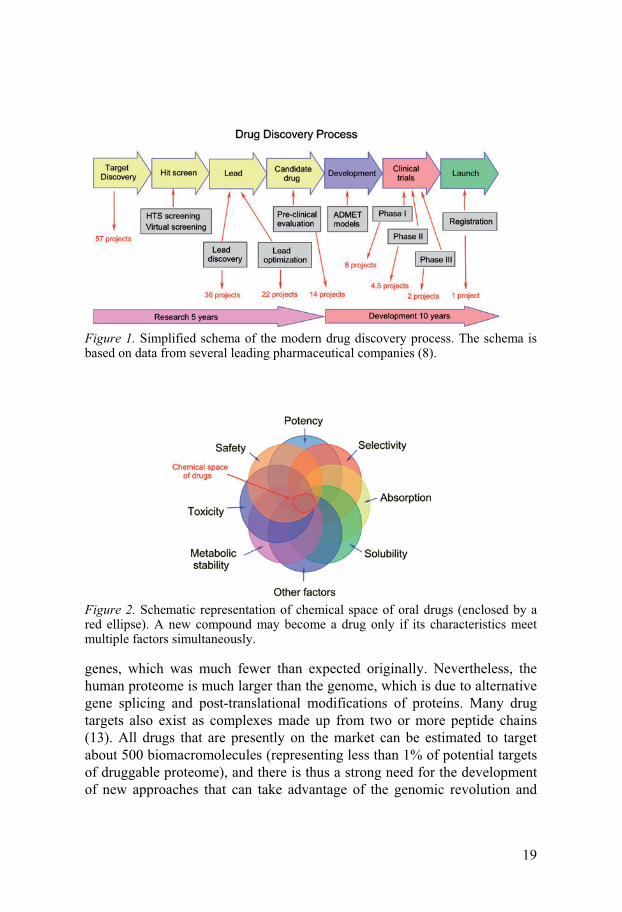
Modern drug discovery is a lengthy and cumbersome process com-posed of three separate stages, i.e. discovery research, pre-clinical develop-ment and clinical development (Figure 1). The average time for development of a new drug candidate from synthesis to its final approval is now about 15 years, and 98% of initially promising projects fail (Figure 1). Drug discovery programs start with identification of a molecular target that is associated with a particular functional pathway or disease of potential therapeutic value (9). The chosen molecular target is then validated for its suitability for drug screening by popular methods based on use of gene technologies such as site-direct mutagenesis or generation of knockout animal models. At the next stage large libraries of diverse chemicals (usually 106-107 substances) are tested on the target (usually a recombinant target) in a high-throughput man-ner with a hope to find a number of active hits. Chemical variations around these hits are then synthesized and tested in an iterative process to produce few lead compounds with certain desired properties, i.e. ease of synthesis, adherence to Lipinski’s rules (10), specificity for the target and efficacy on the medical condition which is the target for treatment. Once leads are se-lected they must be further refined for target activity, selectivity, and AD-MET profile, and be evaluated in multiple disease models and compared to existing therapies for the same disease. Multi-property optimization of lead compounds is a great challenge, which may eventually result in costly unex-pected failures at the later clinical stages of development (Figure 2). There-fore, comprehensive pre-clinical lead examination is crucial to avoid late failures. At the clinical development stage the selected candidate drug passes through three clinical trial phases, where its effect on humans is carefully studied (Figure 1). At phase I and II possible adverse and toxic effects of the candidate drugs are identified and their therapeutic dose is optimized. Only about 25% of the candidates that enter clinical trials complete phases I and II successfully and move onto phase III. In phase III the candidate drug is ad-ministered to a larger group of patients with the aim to demonstrate its safety and prove its effectiveness over existing therapies. Successful completion of phase III clinical testing is followed by approval by regulatory authorities and allows the launch of a new drug onto the market (Figure 1).
Sequencing of the human genome, completed in 2001, was a signifi-cant achievement (11) and was accompanied by many predictions of the emergence of new miracle medicines at a faster rate. However, the genomics revolution has not led to the increased productivity among the industry for drug discovery, which one had expected. The vast majority of drugs act on protein targets and turning genomic data into information that is useful for drug discovery still remains a great challenge. Sequence data alone tells us little about localization of proteins, protein interactions, the complexities of gene expression and their impact on the physiological and pathological con-ditions of an organism (12). The human genome contains only about 30,000
19
Figure 1. Simplified schema of the modern drug discovery process. The schema is based on data from several leading pharmaceutical companies (8).
Figure 2. Schematic representation of chemical space of oral drugs (enclosed by a red ellipse). A new compound may become a drug only if its characteristics meet multiple factors simultaneously.
genes, which was much fewer than expected originally. Nevertheless, the human proteome is much larger than the genome, which is due to alternative gene splicing and post-translational modifications of proteins. Many drug targets also exist as complexes made up from two or more peptide chains (13). All drugs that are presently on the market can be estimated to target about 500 biomacromolecules (representing less than 1% of potential targets of druggable proteome), and there is thus a strong need for the development of new approaches that can take advantage of the genomic revolution and
20
develop drugs for the remaining large number of yet unexploited targets (14, 15).
So far, only slightly over a thousand molecules have been developed as therapeutics, thus representing only a tiny portion of the chemical space of potential drug-like molecules. It has been estimated that the number of syn-thetically feasible small molecules ranges between 1018 and 10200 (depending on the descriptors used for estimate calculation), suggesting that a tremen-dous number of potential small molecules with appropriate biological prop-erties and therapeutical activity remain to be discovered. Although HTS takes a central place in the initial stages of drug finding programs among the industry, it does not allow screening of larger libraries than 106-107 com-pounds in a reasonable time, it is restricted to in-house or commercially available compounds, and its costs are very high for large-scale projects. Many hits from HTS fail in subsequent studies in cells or animals. This is mainly because HTS compounds are screened in vitro against a single target while many hits are later shown to exhibit high activity to proteins of com-pletely different cell pathways, and thereby alter the function of the target organism in an undesired way (16). The use of computers and computational methods cover all aspects of modern drug discovery today. Alternative ap-proaches to HTS, known as virtual screening methods, have been developed, where one screens large libraries of diverse compounds that complement proteins of known structure in the computer and then experimentally tests only those that are predicted to bind well (7). One approach to virtual screen-ing is to use statistical models (based on various machine-learning tech-niques) trained on large volumes of data to predict the activity of the ligands of interest. Virtual screening can assess a large number of diverse com-pounds, which may then be obtained physically and tested in vitro once pre-dicted to be highly active (7). Virtual screening reduces costly syntheses of a large number of compounds and provides the best way to access a large chemical space without the commitment in time, materials and infrastructure that HTS demands. A variety of computational filters may be applied in ad-dition to the virtual screenings to ensure that selected hits meet standards of “drug-likeness” (7).
Today the average development cost of a single drug is estimated to amount to more than US$800 million, and late-stage developments and their failures account for a large fraction of expenditures (17). Failures thus need to be kept to a minimum, and this can be achieved by the accurate and objec-tive quality assessment of drug candidates at key points during the discovery process. Integration of novel computational approaches at every stage of drug development, such as protein function prediction, structure-activity relationships, bio-physicochemical and ADMET properties prediction, and evaluation of pharmacogenomic profiles of drug candidates might aid selec-tion and prioritization of the projects with the best potential and lead to sig-nificant reduction of development costs.

21
3.2. Retroviruses
3.2.1. A day in a life of a retrovirus: structure, function, replication cycle Viruses are the simplest organisms found in nature. Outside the living cell they represent nothing more than miniature capsules of genetic information and are no more alive than a piece of rock. Things change when the viruses penetrate the right kind of cell type and hijack its internal machinery. Vi-ruses attack the cell with one goal, namely to produce more viruses by a process known as viral replication.
Retroviruses are RNA-based viruses that contain reverse transcrip-tase enzymes to transcribe their RNA into the host cell genome. Retroviruses cause a wide spectrum of diseases, which include tumors, myelopathies, immunodeficiencies, chronic infections such as arthritis, infective dermatitis, and uveitis. Indeed these viruses have global socioeconomic negative im-pact.
In 1973 Hardy et al. identified and described the first retrovirus, the feline leukemia virus (18). Later other retroviruses were also found, which included the Rous sarcoma virus (RSV), equine infectious anemia virus (EIAV), and bovine leukemia virus (BLV), the later causing leukemia in cattle. In 1980 Poiesz and co-workers found and isolated the first human retrovirus from patients with adult T-cell leukemia, HTLV-I (19), which was followed by the discovery of HIV-1 in 1983 (20). A few years later a second retrovirus, HIV-2, being similar to HIV-1, was isolated from patients in West Africa (21). Both HIV-1 and HIV-2 are transmitted by sexual contact, through blood, and from mother to child during birth or through breast-feeding after birth, and they both appear to cause clinically indistinguishable AIDS.
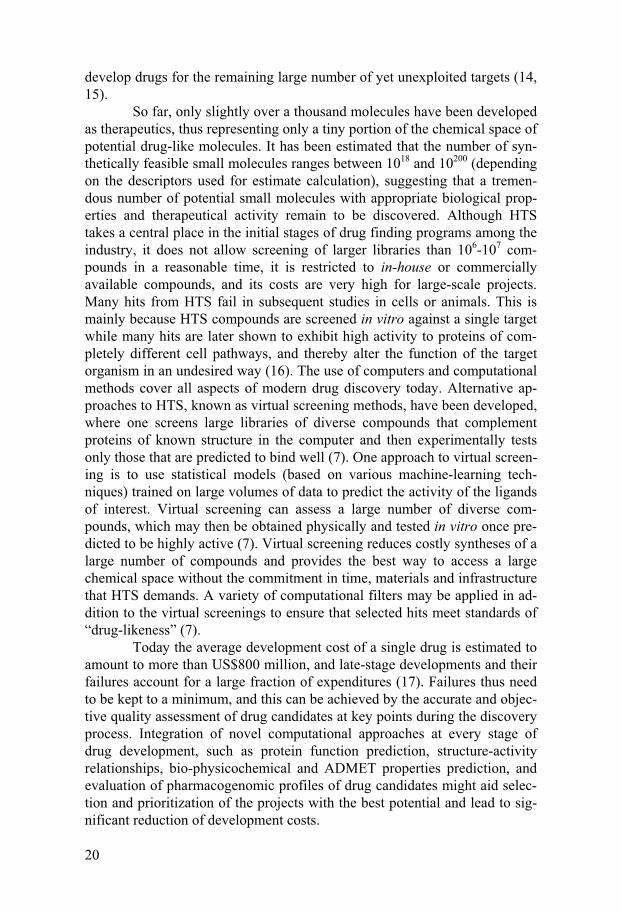
All retroviruses have similar genomic organization and express three main polypeptides. The first polypeptide, gag (glycosaminoglycan), contains matrix, capsid and nucleocapsid proteins that create the virion’s internal structure. The second polypeptide, called gag-pol (glycosaminoglycan-polymerase) contains the above gag proteins as well as functional proteins, i.e. retroviral protease, reverse transcriptase and integrase. Finally the third polyprotein, env (envelope), contains two virus envelope proteins. The later proteins are located on the exterior of the mature retrovirus and are involved in the process for the recognition of receptors on the target cells that are a part of the infection process (Figure 3) (22).
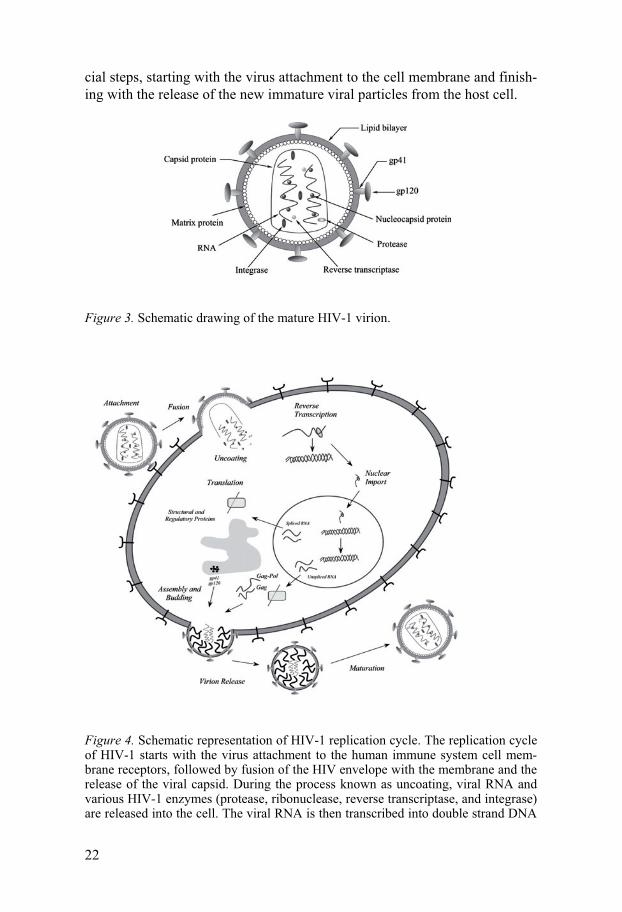
The replication cycle for all retroviruses shares large similarities and it is here exemplified by the replication cycle schema for human immunode-ficiency virus (HIV-1) (Figure 4). The retroviral cycle includes several cru-
22
cial steps, starting with the virus attachment to the cell membrane and finish-ing with the release of the new immature viral particles from the host cell.
Figure 3. Schematic drawing of the mature HIV-1 virion.
Figure 4. Schematic representation of HIV-1 replication cycle. The replication cycle of HIV-1 starts with the virus attachment to the human immune system cell mem-brane receptors, followed by fusion of the HIV envelope with the membrane and the release of the viral capsid. During the process known as uncoating, viral RNA and various HIV-1 enzymes (protease, ribonuclease, reverse transcriptase, and integrase) are released into the cell. The viral RNA is then transcribed into double strand DNA
23
with the help of the reverse transcriptase enzyme. The reverse transcription step is extremely error-prone and during this stage multiple HIV-1 genome mutations may be introduced. The transcribed DNA is integrated then into the host cell genome by the HIV-1 integrase enzyme. At the next stage viral DNA information is copied to mRNA to produce several regulatory proteins. At a later step structural gag, gag-pol, and env polyproteins are produced from the viral mRNA. During the final stage of the HIV-1 replication cycle new virions are created by assembly of viral genome and viral proteins and subsequent budding through the membrane of the host cell. Next, newly released HIV-1 virions mature to become infectious through the proteolytic action of the HIV-1 protease, which cleaves gag and gag-pol polyproteins.
3.2.2. Anti-retroviral drugs Research aimed at understanding and combating HIV and AIDS has shown remarkable progress since this disease was first reported. As a result, cur-rently available therapies have begun to transform this deadly disease into a chronic non-lethal condition (23). More than 20 anti-HIV drugs are available on the market today and all of them, except two, target HIV-encoded en-zymes, namely reverse transcriptase (RT) and protease (http://www.fda.gov/oashi/aids/virals.html) (24). Various strategies are un-der investigation to improve the situation with anti-viral drugs and address the most acute problems associated with HIV treatment. This includes: i) the optimization of multiple drug combinations, ii) the chemical optimization of known anti-HIV drugs to enhance their deliverability, iii) the validation of new viral life-cycle points for possible new therapeutic intervention (25), and iv) the discovery of novel agents against proven targets with improved medicinal profiles (26).
Protease inhibitors Most approved HIV-1 protease inhibitors are analogues to the natural pep-tide substrates of the protease, but they are not cleavable and, therefore com-pete with the natural substrates at the active site of the protease (23, 24). A majority of the clinically approved protease inhibitors, namely saquinavir, ritonavir, indinavir, nelfinavir, amprenavir, darunavir, atazanavir and lopi-navir, share the same structural determinant - a hydroxyethylene core (in-stead of the normal peptidic linkage); this makes them non-scissile pepti-domimetic substrate analogues for the HIV-1 protease (Figure 5) (23, 27). A second generation protease inhibitor, tipranavir, was approved recently for the treatment of HIV. Tipranavir is a selective and potent non-peptidic in-hibitor of the HIV-1 protease with excellent affinity to the proteases of some drug-resistant strains of HIV-1, as well as for the HIV-2 virus protease (Fig-ure 5). The majority of HIV-1 isolates, which are broadly cross-resistant to protease inhibitors, were found to be sensitive to tipranavir; however, new tipranavir-resistant HIV isolates have also been identified (26, 28). Protease

24
inhibitors of HIV-1 protease have played a particularly important role in control of HIV, as their introduction into the therapeutic regimes has resulted in a substantial improvement in disease management.
Figure 5. Chemical structures of approved HIV-1 protease inhibitors.
25
Reverse transcriptase inhibitors The substrate binding site of HIV RT has been shown to be an attractive target for nucleosidic RT inhibitors (NRTIs). Eight nucleoside analogues, i.e. zidovudine, didanosine, zalcitabine, stavudine, lamivudine, abacavir, teno-fovir, and emtricitabine have been allowed as anti-HIV drugs, and several others are in advanced development. To become active, these drugs must be phosphorylated consecutively inside the host cell by three cellular kinases to form the corresponding 5�-triphosphate derivatives, which then interact with the RT as chain terminators during the reverse transcription reaction. How-ever, various mutations outside and in the active site of the RT cause high-level resistance to NRTIs (27, 29, 30).
Another group of non-nucleoside RT inhibitors (NNRTIs) interact with an allosteric, non-substrate binding site on HIV-1 RT impairing the RT’s domain mobility and thereby disrupting the DNA polymerization reac-tion. Today, three NNRTIs (nevirapine, delavirdine and efavirenz) have been approved, but several others are under development. Nevertheless, mutations in amino acid residues that surround the NNRTI-binding site can induce resistance to NNRTIs (27, 29, 30).
Other anti-HIV drugs The only inhibitor approved to date that targets viral entry into the host cell by binding to the viral transmembrane protein gp41 is enfuviritide. It pre-vents fusion of HIV-1 with the target cell’s membranes (24). The recently approved anti-HIV drug maraviroc is another entry inhibitor, which inhibits CCR5 chemokine receptors (31). Integrase inhibitors, which inhibit the en-zyme called integrase responsible for integration of viral DNA into the cell DNA, are also in advanced development. Maturation inhibitors represent another class of potential anti-HIV agents, which inhibit the last step in gag polyprotein processing, resulting in non-infectious virions with defective cores (32, 33).
Highly active antiretroviral therapy When given singly, none of the available antiretroviral drugs can suppress HIV replication effectively for an extended period of time due to rapid emergence of resistant strains of HIV-1. This limitation of “mono-therapy” has led to the introduction of highly active antiretroviral therapy (HAART), in which three or more anti-HIV drugs from at least two different classes are combined. Although HAART represents a major breakthrough in anti-HIV therapy and has helped dramatically reduce AIDS disease progression and mortality, the treatment does not remove HIV-1 from the patient. Therefore to maintain the viral load as low as possible, administration of combinations of drugs need to be continued throughout the patient’s life (24). However, mutations leading to partial or complete resistance have been found for all
26
clinically used anti-HIV compounds and their combinations, as well as for all candidate drugs seriously considered for HIV therapy (28).
3.2.3. Drug resistance Despite the availability of effective therapies, emergence and spread of mi-crobial and viral resistance to drugs is now threatening to undermine our ability to treat infections and save lives. Drug resistance can be considered as a natural response to the selective pressure of the drug on the population of viruses or microorganisms. Several common mechanisms are responsible for drug resistance and include, for example, increased efflux or decreased in-flux of the drug, alternative pathway to bypass inhibited reaction, increased production of drug sensitive enzymes, increased amount of an enzyme sub-strate (i.e. to compete with the drug), decreased requirement for a product of inhibited reaction or failure to activate the drug. However, resistance medi-ated by mutations in the genes of infectious organisms that alter drug’s inter-action with its respective target protein remains the most common mecha-nism of resistance (34-38) (papers III and IV).
Drug discovery techniques for remedies of pathogens usually seek an inhibitor that maximally inhibits a given biomolecular target of the patho-gen. In many cases this is an effective approach as many drug targets of pathogens are specific for their ligands and their active sites have little lati-tude to mutations. Such inhibitors will also be relatively robust to the ap-pearance of resistance mutations in the enzyme/target, because highly spe-cific enzymes have little range for remodeling their active sites without compromising binding and catalysis. However, the presence of amino acid polymorphisms in the targeted proteins remains a significant obstacle to the efficacy of the majority of drugs directed against viruses, bacteria, or para-sites (39). Amino acid polymorphisms may arise naturally by spontaneous mutations in a viral or bacterial genome or be selected under evolutionary pressure of anti-viral/anti-bacterial therapies. As a result, different strains of the infectious agent, different versions of the same target within a single microorganism are observed (40). An ideal drug will then be one that is ex-tremely effective against a primary target and also maintains its efficacy against the most important variants of the target molecule. The absence of conformational constraints at critical locations in the drug chemical structure must provide an adaptation mechanism to target variations (paper IV) (39).
3.2.4. Retroviral proteases Viral proteases are essential in the life cycle of many viruses, including herpesviruses, rhinoviruses, flaviviruses and retroviruses. Viral proteases, therefore, have been favored targets for antiviral agents (41). Retroviral pro-teases function as dimmers with a single active site built by the amino acid

27
residues originating from two identical monomers (Figure 6). The flexible �-loops (also known as “flaps”) are functionally very important, and a flap of each monomer changes orientation during the ligand binding and creates multiple interactions with it (42). The N- and C-termini of the protease monomers form four-stranded �-sheets (42). The conserved active site resi-dues of HIV-1 protease, i.e. D25, T26 and G27, are located in a loop, the structure of which is stabilized by a rigid network of hydrogen bonds and two catalytic aspartates (D25 and D25�) that promote substrate amide bond hydrolysis (42).
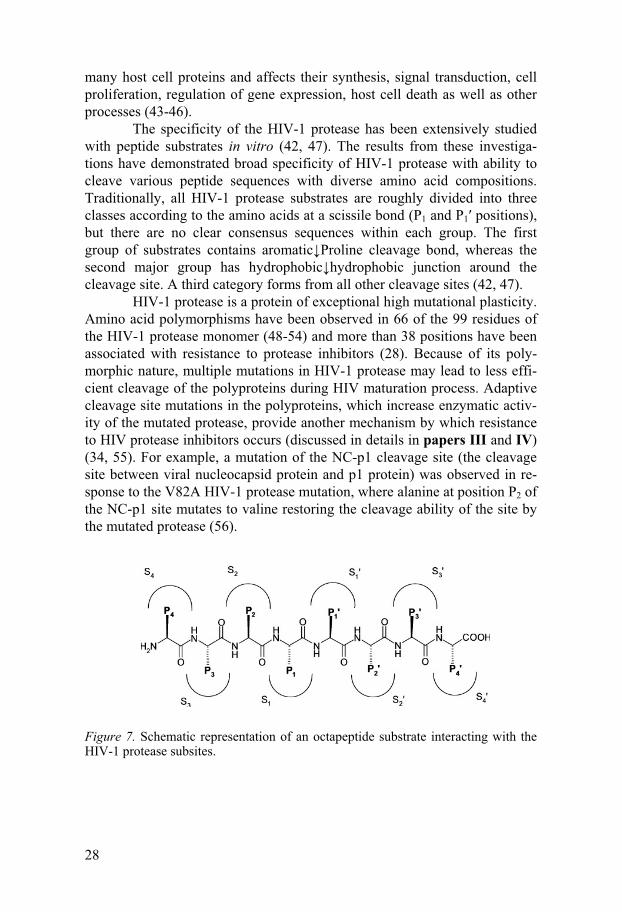
A number of distinct “pockets” that accommodate the side chains of the substrate amino acids can be identified in retroviral proteases. Subsites on the N-terminal side of the cleavage bond are unprimed and those on the C-terminal side are primed. Therefore, two amino acid residues that are ad-jacent to the scissile bond are labeled P1 and P1�; the next two P2 and P2�; etc. The corresponding binding sites in the protease are labeled S1 and S1�, S2 and S2� and so on. Due to the symmetry of retroviral proteases being formed from its identical monomers, the primed and unprimed pockets are formed by identical amino acid residues. Some protease amino acids participate in the formation of more than one binding pocket. Binding sites S4, S2, S1�, S3� are
Figure 6. Crystal structure of HIV-1 protease. Helices are indicated in green, strands in blue and turns and coils in orange. The active site residues D25 and D25� are shown in red. The figure is drawn from the 3D coordinates of HIV-1 protease de-rived from PDB using VMD v. 1.8.3 software. PDB accession number 1AAQ.
located on one side of the protease active site, whereas pockets S3, S1, S2�, and S4� are located in a similar manner on the opposite side of the active site (Figure 7) (23, 42).
The main function of retroviral proteases is to ensure efficient and correct cleavage of newly expressed precursor viral polyproteins into smaller mature viral proteins (27). However, HIV-1 protease also interacts with
28
many host cell proteins and affects their synthesis, signal transduction, cell proliferation, regulation of gene expression, host cell death as well as other processes (43-46).
The specificity of the HIV-1 protease has been extensively studied with peptide substrates in vitro (42, 47). The results from these investiga-tions have demonstrated broad specificity of HIV-1 protease with ability to cleave various peptide sequences with diverse amino acid compositions. Traditionally, all HIV-1 protease substrates are roughly divided into three classes according to the amino acids at a scissile bond (P1 and P1� positions), but there are no clear consensus sequences within each group. The first group of substrates contains aromatic�Proline cleavage bond, whereas the second major group has hydrophobic�hydrophobic junction around the cleavage site. A third category forms from all other cleavage sites (42, 47).
HIV-1 protease is a protein of exceptional high mutational plasticity. Amino acid polymorphisms have been observed in 66 of the 99 residues of the HIV-1 protease monomer (48-54) and more than 38 positions have been associated with resistance to protease inhibitors (28). Because of its poly-morphic nature, multiple mutations in HIV-1 protease may lead to less effi-cient cleavage of the polyproteins during HIV maturation process. Adaptive cleavage site mutations in the polyproteins, which increase enzymatic activ-ity of the mutated protease, provide another mechanism by which resistance to HIV protease inhibitors occurs (discussed in details in papers III and IV) (34, 55). For example, a mutation of the NC-p1 cleavage site (the cleavage site between viral nucleocapsid protein and p1 protein) was observed in re-sponse to the V82A HIV-1 protease mutation, where alanine at position P2 of the NC-p1 site mutates to valine restoring the cleavage ability of the site by the mutated protease (56).
Figure 7. Schematic representation of an octapeptide substrate interacting with the HIV-1 protease subsites.
29
3.2.5. Drug resistance-evading inhibitors Traditionally, drug molecules are designed according to the lock-and-key concept to fit accurately into the binding cavity of the target protein (40, 57). This approach results often in conformationally constrained pre-shaped molecules, which do well against a unique target, but lack the adaptability to small target variations due to naturally occurring polymorphisms or drug resistance mutations (40, 57). All protease inhibitors in current clinical use may suffer dramatic decrease in binding affinity and become ineffective when confronted with mutations associated with drug-resistance (58-63). Therefore, a major challenge in the design of resistance-evading drugs is the integration of target genetic diversity into the drug design process. In fact, this is a strategy that alters the traditional lock-and-key concept (57).
Many non-active site resistance-causing mutations modify the ge-ometry of the binding pockets in HIV-1 protease but do not change the chemical character of the active site (57, 64). The role of these mutations was originally assumed to be only of a compensatory nature, but new find-ings demonstrate that some of the non-active site mutations might play a very important role in lowering the affinity of inhibitors (64). For example, mutations such as I84V, V82F, I47V and I50V in HIV-1 protease change spatial arrangement, shape, or volume of the binding pocket but not its polar-ity or hydrophobicity. Rigid inhibitors cannot adapt to these geometric dis-tortions and thus lose their binding affinity (57).
Peptide substrates, on the other hand, have a higher flexibility than most synthetic inhibitors and are more amenable to adapt to backbone rear-rangements or subtle conformational changes induced by mutations in the protease (65). Therefore, peptide substrates with high activity on multiple protease variants would represent a “promiscuous” group of lead candidates for further development into adaptive inhibitors, which could be effective over an array of highly-resistant viral mutants (papers III and IV).
3.3. Cytochrome P450 enzymes and pharmacogenomics Metabolism determines the fate of drugs entering the body, and depends not only on physicochemical properties of the compounds, but also on the char-acteristics of the involved metabolizing system, the constitution of which is influenced by a number of genetic and environmental factors (66, 67). In an ideal situation drugs are converted to harmless, water-soluble metabolites, which are easily excreted through the urine. However, some drugs may cause drug-drug interactions by inhibiting or inducing the activities of meta-bolic enzymes, and thereby altering the normal detoxification and elimina-tion processes of other co-administered drugs (66). Drug metabolism occurs in two main phases – Phase I and II. Phase I enzymes are responsible for
30
modification of functional groups of drugs, i.e. oxidation, hydrolysis or re-duction. Phase II enzymes are responsible for the conjugation of phase I metabolites with water-solubilizing endogenous substituents (68, 69).
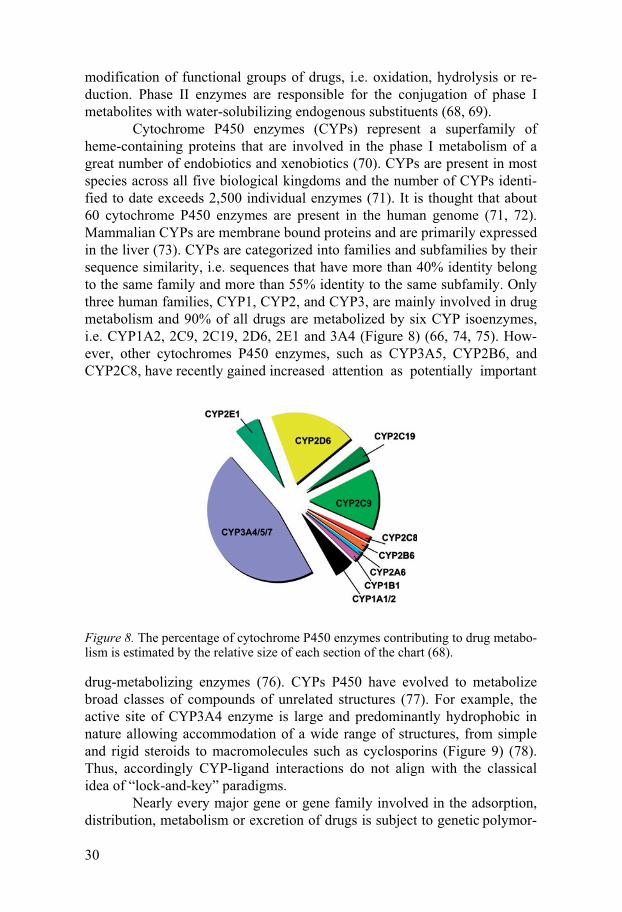
Cytochrome P450 enzymes (CYPs) represent a superfamily of heme-containing proteins that are involved in the phase I metabolism of a great number of endobiotics and xenobiotics (70). CYPs are present in most species across all five biological kingdoms and the number of CYPs identi-fied to date exceeds 2,500 individual enzymes (71). It is thought that about 60 cytochrome P450 enzymes are present in the human genome (71, 72). Mammalian CYPs are membrane bound proteins and are primarily expressed in the liver (73). CYPs are categorized into families and subfamilies by their sequence similarity, i.e. sequences that have more than 40% identity belong to the same family and more than 55% identity to the same subfamily. Only three human families, CYP1, CYP2, and CYP3, are mainly involved in drug metabolism and 90% of all drugs are metabolized by six CYP isoenzymes, i.e. CYP1A2, 2C9, 2C19, 2D6, 2E1 and 3A4 (Figure 8) (66, 74, 75). How-ever, other cytochromes P450 enzymes, such as CYP3A5, CYP2B6, and CYP2C8, have recently gained increased attention as potentially important
Figure 8. The percentage of cytochrome P450 enzymes contributing to drug metabo-lism is estimated by the relative size of each section of the chart (68).
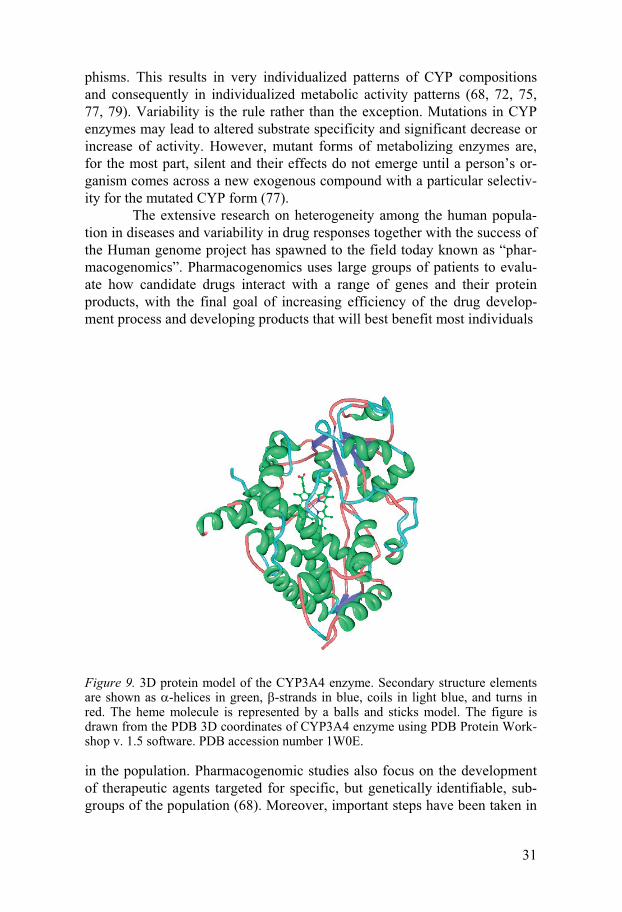
drug-metabolizing enzymes (76). CYPs P450 have evolved to metabolize broad classes of compounds of unrelated structures (77). For example, the active site of CYP3A4 enzyme is large and predominantly hydrophobic in nature allowing accommodation of a wide range of structures, from simple and rigid steroids to macromolecules such as cyclosporins (Figure 9) (78). Thus, accordingly CYP-ligand interactions do not align with the classical idea of “lock-and-key” paradigms.
Nearly every major gene or gene family involved in the adsorption, distribution, metabolism or excretion of drugs is subject to genetic polymor-
31
phisms. This results in very individualized patterns of CYP compositions and consequently in individualized metabolic activity patterns (68, 72, 75, 77, 79). Variability is the rule rather than the exception. Mutations in CYP enzymes may lead to altered substrate specificity and significant decrease or increase of activity. However, mutant forms of metabolizing enzymes are, for the most part, silent and their effects do not emerge until a person’s or-ganism comes across a new exogenous compound with a particular selectiv-ity for the mutated CYP form (77).
The extensive research on heterogeneity among the human popula-tion in diseases and variability in drug responses together with the success of the Human genome project has spawned to the field today known as “phar-macogenomics”. Pharmacogenomics uses large groups of patients to evalu-ate how candidate drugs interact with a range of genes and their protein products, with the final goal of increasing efficiency of the drug develop-ment process and developing products that will best benefit most individuals
Figure 9. 3D protein model of the CYP3A4 enzyme. Secondary structure elements are shown as �-helices in green, �-strands in blue, coils in light blue, and turns in red. The heme molecule is represented by a balls and sticks model. The figure is drawn from the PDB 3D coordinates of CYP3A4 enzyme using PDB Protein Work-shop v. 1.5 software. PDB accession number 1W0E.
in the population. Pharmacogenomic studies also focus on the development of therapeutic agents targeted for specific, but genetically identifiable, sub-groups of the population (68). Moreover, important steps have been taken in
32
the use of molecular diagnostics to more precisely select optimal drugs and dosage regimes for individual patients (80).
Pharmaceutical companies are employing various strategies in order to minimize the high cost of drug development, reducing time which com-pounds spend in discovery programs, and trying to predict potential failures of the candidate drugs in the pre-clinical and clinical trials as early as possi-ble (81). More than 70% of candidate drugs failures are attributed to inade-quate drug absorption and metabolism, high toxicity and a lack of therapeu-tic efficacy (66). Therefore, considerable attention has been placed by the pharma industry on computational methods that could predict accurately ADMET properties of the candidate drugs well in advance (66, 75, 82) (pa-per V).
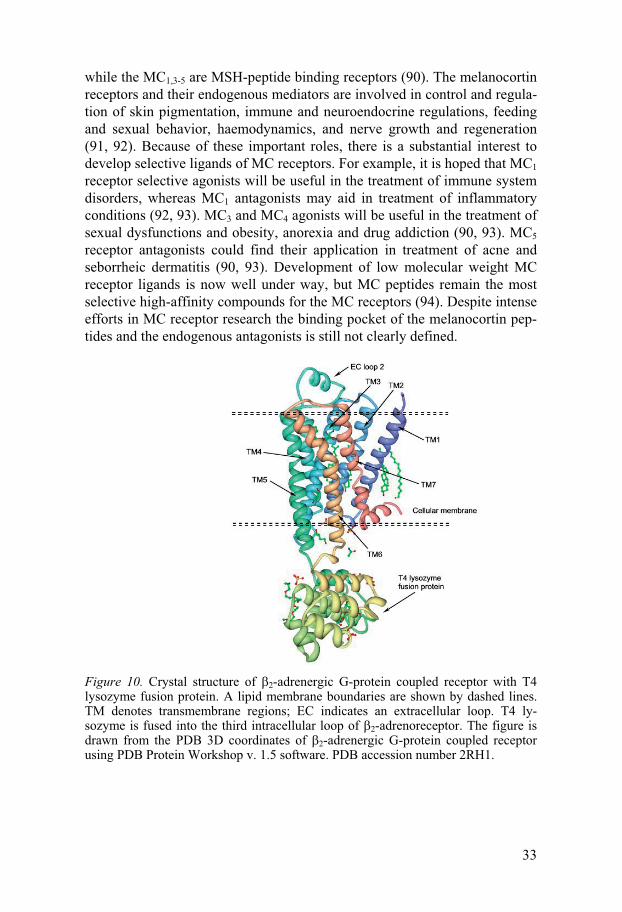
3.4. G-protein coupled receptors The G-protein-coupled receptor (GPCR) family is one of the largest and most diverse groups of proteins and is encoded by 3% of the genes present in the human genome (11, 83-86). There are around 700 GPCRs in humans and all of them share a conserved transmembrane structure comprising seven transmembrane helices as shown in Figure 10 (87). GPCRs are involved in many physiological processes and are attractive targets for pharmacological intervention (83). Binding of specific ligands to the extracellular loops or transmembrane helices causes conformational changes in the GPCRs that then act as a switch to relay a signal to G-proteins, that in turn signal to cause further intracellular responses (87).
GPCRs are one of the most important drug targets for the pharma-ceutical industry, and more than 50% of all marketed drugs act on them (14). However, the currently used drugs target only 30 members of the family, which include mainly biogenic amine receptors. Thus, there is enormous potential to exploit the remaining family members, including the more than 100 so-called orphan receptors for which no ligands so far have been identi-fied (88). Structure-based in silico approaches have been extremely chal-lenging for this family of receptors because of the lack of exact 3D structural information. Only two tertiary structures for the GPCRs have been identified to date, namely bovine rhodopsin (83) and human �2-adrenergic receptor (89) (Figure 10).
3.4.1. Melanocortin receptors Melanocortin receptors (MC) belong to the GPCR protein family and exist in five different subtypes, MC1-5, showing about 40 - 60 % amino acid se-quence identity (90). The MC2 receptor is the ACTH receptor that binds adrenocorticotropin hormone but not the melanocortins (MSH-peptides),
33
while the MC1,3-5 are MSH-peptide binding receptors (90). The melanocortin receptors and their endogenous mediators are involved in control and regula-tion of skin pigmentation, immune and neuroendocrine regulations, feeding and sexual behavior, haemodynamics, and nerve growth and regeneration (91, 92). Because of these important roles, there is a substantial interest to develop selective ligands of MC receptors. For example, it is hoped that MC1 receptor selective agonists will be useful in the treatment of immune system disorders, whereas MC1 antagonists may aid in treatment of inflammatory conditions (92, 93). MC3 and MC4 agonists will be useful in the treatment of sexual dysfunctions and obesity, anorexia and drug addiction (90, 93). MC5 receptor antagonists could find their application in treatment of acne and seborrheic dermatitis (90, 93). Development of low molecular weight MC receptor ligands is now well under way, but MC peptides remain the most selective high-affinity compounds for the MC receptors (94). Despite intense efforts in MC receptor research the binding pocket of the melanocortin pep-tides and the endogenous antagonists is still not clearly defined.
Figure 10. Crystal structure of �2-adrenergic G-protein coupled receptor with T4 lysozyme fusion protein. A lipid membrane boundaries are shown by dashed lines. TM denotes transmembrane regions; EC indicates an extracellular loop. T4 ly-sozyme is fused into the third intracellular loop of �2-adrenoreceptor. The figure is drawn from the PDB 3D coordinates of �2-adrenergic G-protein coupled receptor using PDB Protein Workshop v. 1.5 software. PDB accession number 2RH1.

34
3.5. Machine learning in bioinformatics Rapid developments in DNA sequencing, high-throughput screening and advances in combinatorial chemistry and crystallography produce huge amount of biological data, and the accumulation of such data continues growing at a phenomenal rate (4). As a result, many databases have emerged over the last 20 years, which contain massive amount of new data for aca-demic research and business purposes. This includes sequence databases [GenBank, EMBL (European Molecular Biology Laboratory nucleotide se-quence database), DDBJ (DNA Data Bank of Japan), PIR (Protein Informa-tion Resource), SWISS-PROT], structural databases [CSD (Cambridge Structural Database for organic and organometallic crystal structures), PDB (the Protein Data Bank for protein structures), NDB (the Nucleic Acid Data-base for nucleic acids structures)], interaction databases [BIND (Biomolecu-lar Interaction Network Database), MIPS (Mammalian Protein-Protein Inter-action Database), the Binding Database, KiBank, Protein-DNA recognition database] and databases for many other types of biological data. However, human inspection, interpretation and understanding of the large-scale data are not realistic and there exists a quickly expanding gap between data gen-eration and the biological knowledge it potentially contains (4).
This knowledge is hidden in the ocean of data and in order to extract useful information and identify interesting patterns, features, and relation-ships sophisticated computational algorithms need to be applied (95-97). The process of extraction of knowledge from data is known as data mining or knowledge discovery. It aims to extract previously unknown, nontrivial and practically useful information from data and make it accessible for human interpretation.
A large number of data mining tools have been developed based on recent advances in machine learning. Machine learning represents an area of artificial intelligence that aims to design algorithms that can “learn”. All machine learning techniques can be roughly divided into two major groups; supervised and unsupervised learning methods. Supervised methods, such as artificial neural networks, decision trees, rule-based and regression methods, k-nearest neighbor, support vector machines and other methods learn by examples, whereas unsupervised learning methods, such as principal com-ponent analysis, self-organizing feature maps and data clustering learn with-out prior knowledge of correct outcomes (96, 98). There is no universal ma-chine learning technique and one method may be preferable over another to solve a particular problem. Typically, there is an interest in the development of models that could generalize, i.e. make accurate predictions for unseen cases, as well as gain new insight into the nature of the problem at hand. It is often also important to understand how different model variables relate to each other, and how they can be interpreted. For example, a significant ad-vantage of rules-based and decision trees models is that they can be easily
35
understood by a human. In contrast, artificial neural network models usually do not provide any indication on importance of attributes, although they can demonstrate excellent prediction results. A person with some statistical knowledge, on the other hand, can easily interpret regression equation coef-ficients of logistic regression or partial least squares. A brief overview of some important machine learning techniques used in papers I-V is given hereinafter.
3.5.1. Principal Component Analysis Intelligent interpretation of a plethora of data is a challenge. The human mind cannot easily interpret more than three dimensions and, therefore, some form of data reduction is needed. The compressed information can then be visualized in various graphical forms in 2D or 3D spaces with com-binations with color if necessary. Currently, many data mining techniques are available for processing and overviewing multivariate data (1). However, principal component analysis (PCA) remains one of the most powerful data reduction techniques (99-101).
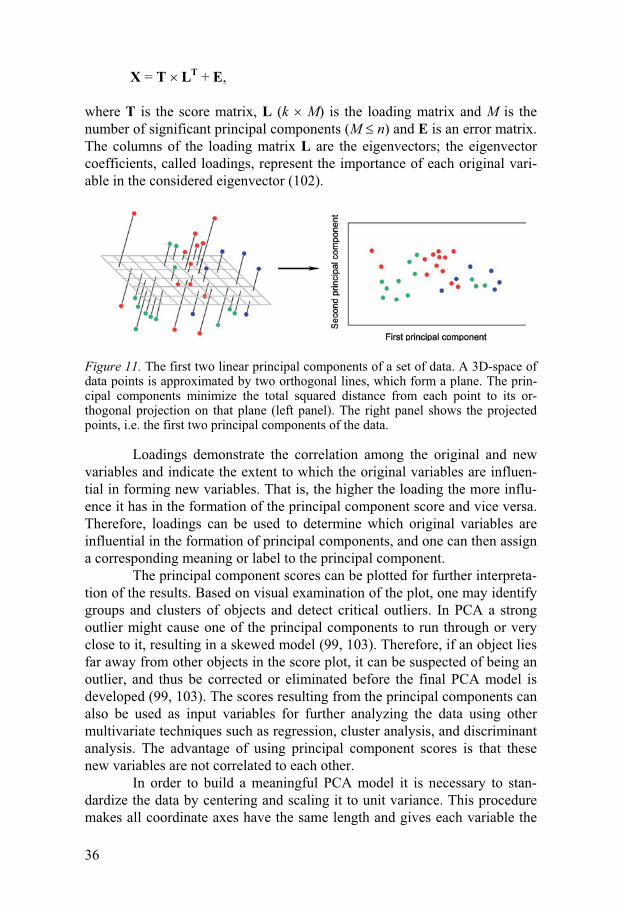
A data matrix X with N objects and K variables can be represented as an ensemble of N points in a K-dimensional space. Although such a K-dimensional space is difficult to visualize when the number of dimensions is more than three, mathematically, such a space represents the same concept as a space with only two or three dimensions. Geometrical concepts such as points, lines, planes, hyper-planes, distances and angles all have the same properties in multidimensional space as in 3D-space. PCA is a mathematical transformation of a data matrix to a new coordinate system, where the first new axis, X1 (the first principal component), results in a new variable x1, such that this new variable accounts for the maximum of the total variance. The second axis X2, (the second principal component) being orthogonal to the first X1 axis, is identified such that the corresponding new variable, x2, accounts for the maximum of the variance that has not been accounted for by the first variable; thus accordingly x1 and x2 are uncorrelated (Figure 11). The procedure is repeated until all N new axes have been identified such that the new variables x1, x2, …, xN account for successive maximum variances and the variables are uncorrelated (100, 101). Thus, PCA projects a swarm of points down on to a low-dimensional hyper-plane or subspace and forms new variables, which are linear composites of the original variables.
Mathematically, PCA approximates a data matrix X in terms of the product of two smaller matrices T and L�, which capture the essential data patterns of X (99). Modeling the k variables in the data matrix X (n � k), where n is the number of objects, as linear combinations of the common factors T (n � M) or principal components can be expressed as follows:
36
X = T � LT + E, where T is the score matrix, L (k � M) is the loading matrix and M is the number of significant principal components (M � n) and E is an error matrix. The columns of the loading matrix L are the eigenvectors; the eigenvector coefficients, called loadings, represent the importance of each original vari-able in the considered eigenvector (102).
Figure 11. The first two linear principal components of a set of data. A 3D-space of data points is approximated by two orthogonal lines, which form a plane. The prin-cipal components minimize the total squared distance from each point to its or-thogonal projection on that plane (left panel). The right panel shows the projected points, i.e. the first two principal components of the data.
Loadings demonstrate the correlation among the original and new variables and indicate the extent to which the original variables are influen-tial in forming new variables. That is, the higher the loading the more influ-ence it has in the formation of the principal component score and vice versa. Therefore, loadings can be used to determine which original variables are influential in the formation of principal components, and one can then assign a corresponding meaning or label to the principal component.
The principal component scores can be plotted for further interpreta-tion of the results. Based on visual examination of the plot, one may identify groups and clusters of objects and detect critical outliers. In PCA a strong outlier might cause one of the principal components to run through or very close to it, resulting in a skewed model (99, 103). Therefore, if an object lies far away from other objects in the score plot, it can be suspected of being an outlier, and thus be corrected or eliminated before the final PCA model is developed (99, 103). The scores resulting from the principal components can also be used as input variables for further analyzing the data using other multivariate techniques such as regression, cluster analysis, and discriminant analysis. The advantage of using principal component scores is that these new variables are not correlated to each other.
In order to build a meaningful PCA model it is necessary to stan-dardize the data by centering and scaling it to unit variance. This procedure makes all coordinate axes have the same length and gives each variable the
37
same influence on the PCA model. The application of PCA to large data sets provides powerful ways for simple data overviewing, detection of data trends, object groupings and outliers.
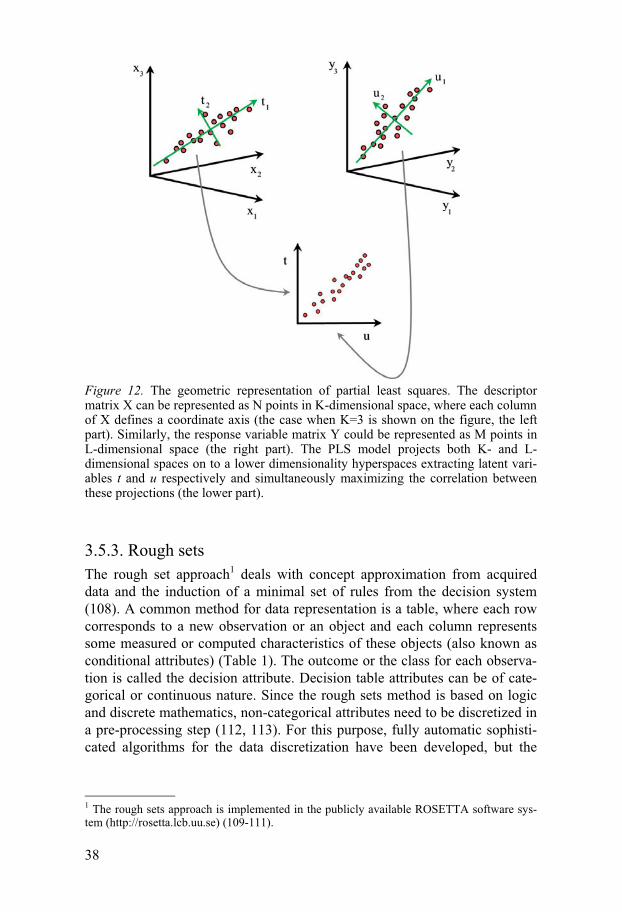
3.5.2. Partial Least Squares Partial least squares projection to latent structures (PLS) takes PCA one step further, as it deals not only with one X variable data matrix but simultane-ously also with another data matrix Y of response variables (104-106). PLS addresses a multivariate regression problem, i.e. the problem of predicting one or many y-variables from a multivariate set of x-variables. The central idea of PLS is to compute the principal component scores of the X and the Y data matrices and then fit a regression model between these scores (Figure 12). Therefore, the initial steps in PLS are the same as in PCA. First, each object is represented as a point in both X- and Y-spaces and then the first PLS component is projected as a line in each of these spaces that passes through the swarms of points. Mathematically, the matrix X is decomposed into a score matrix T and a loading matrix L� plus an error matrix E (eq. 1). Similarly, the Y matrix is decomposed into a score matrix U and loading matrix Q� and the error matrix F (eq. 3). The goal of the PLS algorithm is to well approximate the groups of points in X- and Y-spaces and to provide the best possible correlation between the projections (Figure 12). The projec-tions of X and Y are connected and correlated through the following rela-tions:
X = T � LT + E (eq. 1) U = T + UE, where UE is an error matrix of the regression (eq. 2) Y = U � QT + F (eq. 3)
The optimal number of PLS model components with respect to model’s pre-dictability is determined by cross-validation (107).
A great advantage of PLS is that it can be applied to almost any type of data matrices, for example, matrices with multiple variables, many obser-vations or both (papers I, III-V) (1). PLS is highly suitable for problems with partly correlated variables (papers I, III-V) (1). Moreover, PLS can also be used as a class discriminant method. In this case, the response vari-ables can be coded with 0 for one class and 1 for the other class (paper III) (107). Another attractive feature of the PLS method is that it provides pow-erful views on the data structure compressed in 2D or 3D dimensions in a form of score and loading plots and may thereby be used to reveal groups or patterns in the data (1).
38
Figure 12. The geometric representation of partial least squares. The descriptor matrix X can be represented as N points in K-dimensional space, where each column of X defines a coordinate axis (the case when K=3 is shown on the figure, the left part). Similarly, the response variable matrix Y could be represented as M points in L-dimensional space (the right part). The PLS model projects both K- and L-dimensional spaces on to a lower dimensionality hyperspaces extracting latent vari-ables t and u respectively and simultaneously maximizing the correlation between these projections (the lower part).
3.5.3. Rough sets The rough set approach1 deals with concept approximation from acquired data and the induction of a minimal set of rules from the decision system (108). A common method for data representation is a table, where each row corresponds to a new observation or an object and each column represents some measured or computed characteristics of these objects (also known as conditional attributes) (Table 1). The outcome or the class for each observa-tion is called the decision attribute. Decision table attributes can be of cate-gorical or continuous nature. Since the rough sets method is based on logic and discrete mathematics, non-categorical attributes need to be discretized in a pre-processing step (112, 113). For this purpose, fully automatic sophisti-cated algorithms for the data discretization have been developed, but the
1 The rough sets approach is implemented in the publicly available ROSETTA software sys-tem (http://rosetta.lcb.uu.se) (109-111).
39
number and size of intervals of continuous attributes depend highly on how deep we want to explore a problem.
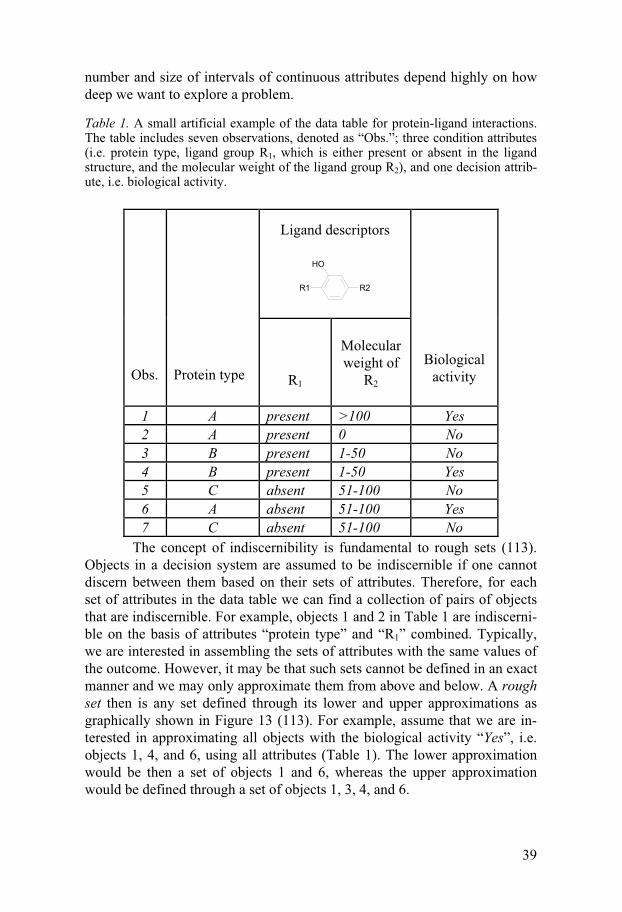
Table 1. A small artificial example of the data table for protein-ligand interactions. The table includes seven observations, denoted as “Obs.”; three condition attributes (i.e. protein type, ligand group R1, which is either present or absent in the ligand structure, and the molecular weight of the ligand group R2), and one decision attrib-ute, i.e. biological activity.
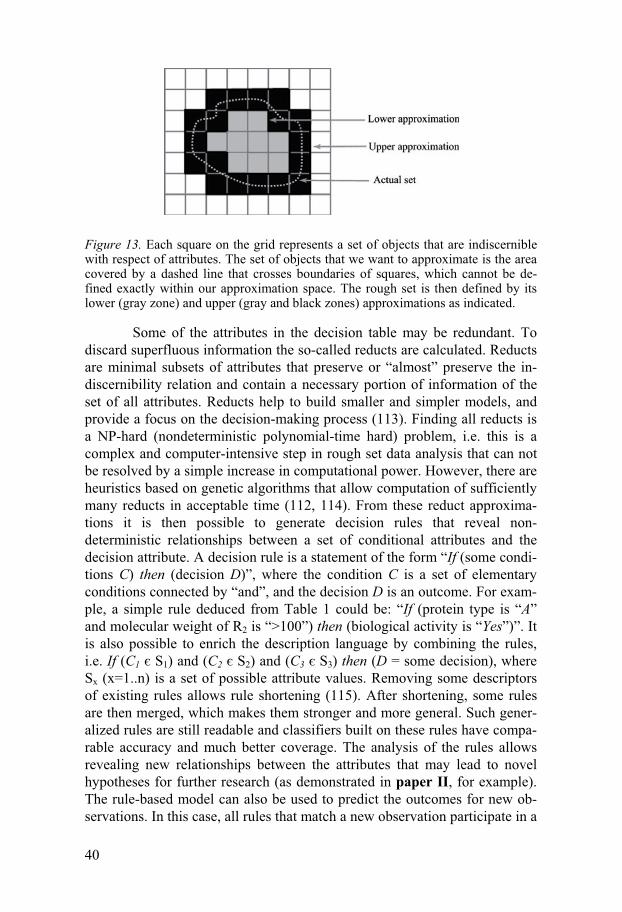
The concept of indiscernibility is fundamental to rough sets (113). Objects in a decision system are assumed to be indiscernible if one cannot discern between them based on their sets of attributes. Therefore, for each set of attributes in the data table we can find a collection of pairs of objects that are indiscernible. For example, objects 1 and 2 in Table 1 are indiscerni-ble on the basis of attributes “protein type” and “R1” combined. Typically, we are interested in assembling the sets of attributes with the same values of the outcome. However, it may be that such sets cannot be defined in an exact manner and we may only approximate them from above and below. A rough set then is any set defined through its lower and upper approximations as graphically shown in Figure 13 (113). For example, assume that we are in-terested in approximating all objects with the biological activity “Yes”, i.e. objects 1, 4, and 6, using all attributes (Table 1). The lower approximation would be then a set of objects 1 and 6, whereas the upper approximation would be defined through a set of objects 1, 3, 4, and 6.
Ligand descriptors R1 R2
OH
Obs.
Protein type
R1
Molecular weight of
R2
Biological activity
1 A present >100 Yes 2 A present 0 No 3 B present 1-50 No 4 B present 1-50 Yes 5 C absent 51-100 No 6 A absent 51-100 Yes 7 C absent 51-100 No
40
Figure 13. Each square on the grid represents a set of objects that are indiscernible with respect of attributes. The set of objects that we want to approximate is the area covered by a dashed line that crosses boundaries of squares, which cannot be de-fined exactly within our approximation space. The rough set is then defined by its lower (gray zone) and upper (gray and black zones) approximations as indicated.
Some of the attributes in the decision table may be redundant. To discard superfluous information the so-called reducts are calculated. Reducts are minimal subsets of attributes that preserve or “almost” preserve the in-discernibility relation and contain a necessary portion of information of the set of all attributes. Reducts help to build smaller and simpler models, and provide a focus on the decision-making process (113). Finding all reducts is a NP-hard (nondeterministic polynomial-time hard) problem, i.e. this is a complex and computer-intensive step in rough set data analysis that can not be resolved by a simple increase in computational power. However, there are heuristics based on genetic algorithms that allow computation of sufficiently many reducts in acceptable time (112, 114). From these reduct approxima-tions it is then possible to generate decision rules that reveal non-deterministic relationships between a set of conditional attributes and the decision attribute. A decision rule is a statement of the form “If (some condi-tions C) then (decision D)”, where the condition C is a set of elementary conditions connected by “and”, and the decision D is an outcome. For exam-ple, a simple rule deduced from Table 1 could be: “If (protein type is “A” and molecular weight of R2 is “>100”) then (biological activity is “Yes”)”. It is also possible to enrich the description language by combining the rules, i.e. If (C1 � S1) and (C2 � S2) and (C3 � S3) then (D = some decision), where Sx (x=1..n) is a set of possible attribute values. Removing some descriptors of existing rules allows rule shortening (115). After shortening, some rules are then merged, which makes them stronger and more general. Such gener-alized rules are still readable and classifiers built on these rules have compa-rable accuracy and much better coverage. The analysis of the rules allows revealing new relationships between the attributes that may lead to novel hypotheses for further research (as demonstrated in paper II, for example). The rule-based model can also be used to predict the outcomes for new ob-servations. In this case, all rules that match a new observation participate in a
41
voting process (votes are proportional to rule support). Possible outcomes are then ranked according to the percentage of votes received and the one with the highest rank is chosen as a final result (113, 116). The rough sets approach finds a wide range of applications in data mining and knowledge discovery, such as for analysis of attribute associations, classification, and clustering (paper II) (112-114, 116, 117). However, the major advantage of the rule-based models generated using rough sets is that they can be easily interpreted and understood by non-experts.
3.6. Validation methods Validation techniques represent a powerful toolbox for the assessment of the quality of models in terms of their significance (i.e. whether a model de-scribes a real biological process or it is an artifact obtained by pure chance) and ability to generalize (i.e. to perform well in predicting new independent data). Assessment of model performance is extremely important from a prac-tical point of view, since it allows us to evaluate and compare how different learning methods work, and eventually choose the best learning method and the best model. Therefore, various validation methods have been developed to address these issues, such as cross-validation, external validation, permu-tation techniques, variable selection, bootstrapping and bagging, akaike and Baeysian information criteria and many others (96, 98, 102). Some of the most popular and widely used techniques are described hereinafter.
The R2 validation parameter demonstrates the goodness of the model fit. It measures how well a regression or a classification model fits the data of the training set (papers I, III-V). R2 is the squared multiple correlation coefficient; that is the percent of total variance of the response explained by a regression or classification model, and is calculated as follows:
2_
1
2_
12
)(
)(1
yy
yyR n
ii
estimatedi
n
ii
�
�
�
�
�
� ,
where iy is observed and estimatediy _
�
is the model’s estimated response. _y is
a mean value of the observed response variables. The closer R2 is to one, the better the fit for a model and the smaller the model’s estimation error. How-ever, when the number of descriptors is relatively large compared to the number of observations in the data set, simple models can be found with good fitting properties due to chance correlation (118, 119). Moreover, the R2 parameter is not related to the capacity of the model to perform well on future data sets and the model’s training error is a poor estimate of the error
42
of the test set (102). To avoid models with chance correlations and overfit2, further validation is needed.
3.6.1. Training set, validation set and test sets One common validation approach for both regression and classification problems is to randomly divide the data into three parts, i.e. a training set, a validation set, and a test set. The training set is used by machine learning methods to fit models. The validation set is used to optimize parameters of those models, select one particular model and estimate its prediction error. Finally, the test set is used to calculate the generalization error for the cho-sen, optimized model. Because the results of this validation strongly depend on the split of the data, it is advisable to repeat the procedure several hun-dred of times and average prediction errors. The main disadvantage of this validation technique is that it is suitable in a data-rich situation, whereas in case data is scarce other methods are more efficient, some of which are de-scribed below (96, 98, 102).
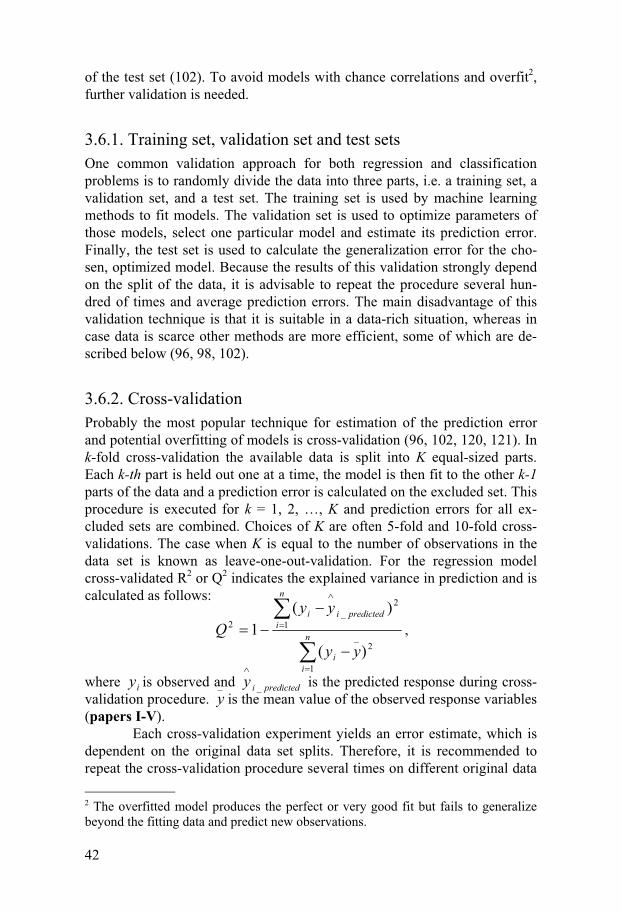
3.6.2. Cross-validation Probably the most popular technique for estimation of the prediction error and potential overfitting of models is cross-validation (96, 102, 120, 121). In k-fold cross-validation the available data is split into K equal-sized parts. Each k-th part is held out one at a time, the model is then fit to the other k-1 parts of the data and a prediction error is calculated on the excluded set. This procedure is executed for k = 1, 2, …, K and prediction errors for all ex-cluded sets are combined. Choices of K are often 5-fold and 10-fold cross-validations. The case when K is equal to the number of observations in the data set is known as leave-one-out-validation. For the regression model cross-validated R2 or Q2 indicates the explained variance in prediction and is calculated as follows:
2_
1
2_
12
)(
)(1
yy
yyQ n
ii
predictedi
n
ii
�
�
�
�
�
� ,
where iy is observed and predictediy _
�
is the predicted response during cross-validation procedure.
_y is the mean value of the observed response variables
(papers I-V). Each cross-validation experiment yields an error estimate, which is
dependent on the original data set splits. Therefore, it is recommended to repeat the cross-validation procedure several times on different original data 2 The overfitted model produces the perfect or very good fit but fails to generalize beyond the fitting data and predict new observations.
43
set sub-divisions in order to estimate average cross-validation error of pre-diction (papers IV and V).
3.6.3. Double cross-validation Another advanced validation technique is a double cross-validation (122). First, the original data set is randomly divided into N equal parts, e.g. A1, A2, …, AN. Then new N data sets are generated by excluding the N-th part in turn, so the first data set B1 contains parts A2, A3, …, AN, the second new B2 data set contains parts A1, A3, A4,…, AN and the N-th data set BN is con-structed from the parts A1, A2, …, A(N-1). K-fold cross-validation is then ap-plied for each of the models fitted to the Bx data set (x = 1, 2, …, N) (the inner loop of the double cross-validation). Each model fitted to Bx data set is also validated by a corresponding Ax test set (the outer loop of the double cross-validation) (paper II).
3.6.4. Permutation validation Permutation validation is yet another popular validation technique that is used to test for chance correlations between variables in the model and the response variable. The validation procedure starts with generation of multi-ple (several hundred or more) new data sets where response variables are randomly permuted. A model is fitted then to each new permutated data set and further validated (for example by cross-validation) following the same scheme as applied for the model fitted to the original data (123). The quality of the models generated on permuted data (for example, R2 and Q2 parame-ters) is then compared to the quality of the original model. If the original model is robust and has no or very little chance correlation, this will be seen as a significant difference in the quality of the original model and the models obtained with randomly permuted responses (102) (papers I-V). The differ-ence in quality between models built on permuted and original data could be also emphasized by a p-value, which would show a probability for the origi-nal model to be observed by chance.
3.6.5. Area under the ROC curve A prediction for a binary decision attribute by a model can have four possi-ble outcomes, i.e. true positive (TP) and true negative (TN) outcomes are correct classifications, whereas false positive (FP) and false negative (FN) outcomes are incorrect classifications. The FP occurs when the outcome is incorrectly classified as “yes” when it is actually “no” and vice versa for the FN. The number of correct classifications divided by the total number of classifications is known as classification accuracy, i.e. (TP + TN) / (TP + TN + FP + FN), whereas the error rate is one minus this expression. In multiple
44
decision problems the classification results are often displayed as a two-dimensional confusion matrix with rows and columns for each class. Each element in this matrix corresponds to the number of examples for which the actual class is the row and the predicted class is the column. The larger the numbers of correct predictions down the main diagonal are, the better the prediction accuracy is for a given classifier (96).
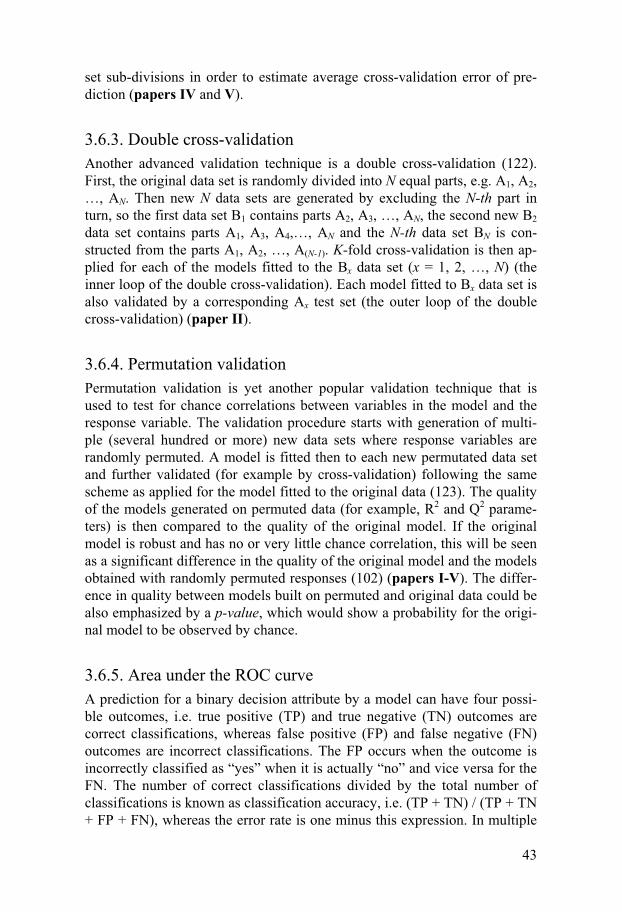
One of the standard evaluation techniques of performance for a clas-sification model is the receiver operating characteristic (ROC) curve (124). It demonstrates the performance of a classifier independently on decision class distribution or error costs. A ROC curve is the plot of the number of the true positive rate (sensitivity, i.e. TP / (TP + FN)) against the false positive rate (1 – specificity, i.e. 1 - (TN / (TN + FP))) (Figure 14). The shape of the ROC curve depends on the test data. However, application of cross-validation can reduce this dependence (96, 113).
Figure 14. Graphical representation of the ROC curve. Receiver operating character-istics curve results from plotting sensitivity against 1-specificity for all possible thresholds. AUC indicates the area under the ROC curve.
To summarize ROC curves into one value, the area under the ROC curve, or AUC, is usually computed. AUC is a valuable indicator of a model’s performance, since it is independent of both prevalence of classes and error costs. In general, the larger AUC is, the better the model. The AUC of 0.5 for a binary classifier indicates that it does not perform better than random classification, while AUC=1.0 signifies a perfect discrimination (Figure 14) (96, 113, 114).
45
3.7. Molecular descriptors A huge number of various molecular descriptors have been developed re-cently for the mathematical description of properties of low molecular weight compounds and biological macromolecules (102). Representation of molecules by use of numbers opens many possibilities to apply various sta-tistical modeling methods to answer practically and theoretically important questions. Molecular descriptors range from binary descriptors and physico-chemical descriptors to 3D structural and higher dimension descriptors, and beyond. In principle, any measured or calculated property of a compound could become a descriptor for that compound. With the advancement of chemoinformatics and bioinformatics many open-source and commercial software programs have become available for calculating hundreds to thou-sands various 0D-3D descriptors of organic compounds (http://www.moleculardescriptors.eu). For example, the current version 5.5 of the popular Dragon program can generate more than 3,200 molecular descriptors (http://www.talete.mi.it). Usually as many descriptors as possible are computed to represent the data set molecules. The number of descriptors is subsequently reduced during the modeling process, leaving the most rele-vant for the problem studied. Some important groups of descriptors for ligands and biopolymers used in this thesis are discussed below.
3.7.1. Molecular descriptors of ligands Binary descriptors of ligands represent the simplest group of molecular de-scriptors; these indicate the presence or absence of particular functional groups, properties, or features in the ligand in a boolean manner. In this way various structural keys (also known as ligand “fingerprints”) can be gener-ated, showing the chemical composition and structural motifs of molecules in a boolean array format (125). Other simple structural descriptors include molecule atom and bond counts or molecular weight. One-dimensional rep-resentations of the molecule may be obtained by fragment counts, e.g. the number of various functional groups, number of H-bond donor or H-bond acceptor atoms etc. Various topological or 2D descriptors of ligands are fre-quently applied in the modeling of their physical, chemical and biological properties (125). Topological descriptors characterize the constitution of the compounds and are usually calculated from molecular graphs of ligands. Zagreb index, Wiener index, shape indices, molecular walk counts, BCUT descriptors, and many others are among the commonly used topological descriptors (125).
However, the real biological processes occur in 3D space and the 3D structure of ligands usually determines their biological activity. Several ex-perimental techniques, such as X-ray crystallography, electron diffraction and NMR spectroscopy are used to derive 3D structures of molecules. For

46
ligands without any such experimental data, 3D structures can be simulated using computational methods, for example by the popular 3D structure gen-eration program Corina (Molecular Networks, http://www.molecular-networks.com) or Concord (Tripos Inc., http://www.tripos.com). 3D struc-tural descriptors characterize molecular eccentricity, electrostatic, hydropho-bicity, and hydrogen-bonding potentials, comparative molecular field analy-sis of the ligands and many other properties. 4D and higher dimensional descriptors include 3D coordinates of the ligands and sampling of their con-formations. However, in order to derive 3D or geometrical descriptors of the series of small molecules, one needs to align or superimpose them first. This is usually a time-consuming step, which is difficult to perform using auto-matic procedures. Moreover, any alignment procedure introduces a certain amount of subjectivity, and the less information available about the mole-cules, the worse the alignment can be. Because many 3D descriptors of small molecules are highly dependent on the quality of alignment, any mistake introduced at this step will affect the rest of the study leading to unpredict-able results.
Alignment-independent Volsurf and GRIND descriptors of small molecules based on molecular interactions fields (MIFs) have been devel-oped recently to overcome the above mentioned ligand superimposition problem (126-128). MIFs represent the ability of small molecules to estab-lish energetically favorable interactions with other molecules. For this reason MIFs have been widely used in drug discovery and development, since most biological effects caused by active compounds are due to their ability to bind different types of macromolecules, such as receptors, enzymes, and trans-porters. Volsurf and GRIND descriptors represent MIFs of small molecules in a compact way suitable for human interpretation and understanding. The Volsurf molecular descriptors are very suitable for modeling of the physico-chemical and pharmacokinetic properties of the compounds, whereas the GRIND descriptors mainly represent ability of the compounds to bind mac-romolecules and their pharmacodynamic properties.
Hydrophobic, hydrogen bond acceptor and hydrogen bond donor groups at the receptor-binding site are responsible for the most important types of ligand-receptor interactions and, therefore, three main types of MIFs are mostly used for computing GRIND descriptors, namely DRY, character-izing hydrophobic interactions; O, representing hydrogen acceptor groups; N, representing hydrogen bond donor groups (126-128). In addition to the most commonly used DRY, N and O probes, the Almond program (http://www.moldiscovery.com) may compute also other probes, for exam-ple a TIP probe or a “shape” probe, a pseudo-MIF representing the local curvature of the molecular surface (129). The descriptors of this probe in-clude information of any sharp changes in the local molecule curvature.
GRIND descriptors have several important advantages. Large librar-ies of chemically diverse compounds can be described without the need to
47
align or otherwise superimpose their structures and usually they can be mod-eled without any significant outlier behavior (paper V). Furthermore, each GRIND probe can be viewed as a different block of descriptors characteriz-ing different binding abilities of the compounds. However, the bioactive conformation of the molecule is often not the lowest energy conformation. The later is usually computed before the GRIND descriptor generation pro-cedure and the problem of description of numerous ligand conformations still remains an active field of research.
3.7.2. Molecular descriptors of biological macromolecules Biological macromolecules, such as DNA, RNA and proteins, are structures of extreme complexity. They consist of several thousands of atoms, each of which is more or less flexible to move and the overall macromolecule 3D structure frequently changes upon binding of a ligand. Nevertheless, many molecular descriptors applicable to low molecular weight compounds, could in principle be used also for characterization of macromolecules. For exam-ple, four binary descriptors could be used to characterize each base of DNA or RNA genetic code, where all descriptors will be assigned value “0” except one, which will be given “+1” indicating the base being described. Similarly, a 20-bit binary vector could be used for description of natural amino acids in a protein sequence, where one bit will be assigned value “+1” depending on amino acid type and the other 19 bits will be set to “0”. However, such bi-nary approach over-expands descriptor space unnecessarily. When using such descriptors the distance between any two bases or any two amino acids is the same, which may be not biologically and chemically relevant. For this reason, numerous mutation matrices have been developed for natural amino acids, which further expand description abilities for biopolymers (130-133). Secondary structure elements (such as �-helices, �-sheets, turns, coils), structural motifs and subunits may also serve as descriptors of the 3D struc-ture of the proteins.
Various physical and chemical characteristics of amino acids, such as, for example, molecular weight, hydrophobicity, and surface area may be used to establish quantitative description of peptide or protein sequences. However, these physicochemical descriptors together with other experimen-tal and calculated properties of amino acids could be used to compute a few general amino acids descriptors, such as z-scales (134). The z-scales repre-sent the “principal properties” of amino acids derived by PCA applied on a data matrix consisting of 26 physicochemical properties of 20 coding and 67 non-coding amino acids (134). The z-scales are independent of each other; they are simple to use and may be roughly interpreted as reflecting hydro-phobicity (z1-scale), steric properties/polarizability (z2-scale), polarity (z3-scale) and electronic properties (z4- and z5-scales) of amino acids. The z-scales are optimized to distinguish between different amino acids for the
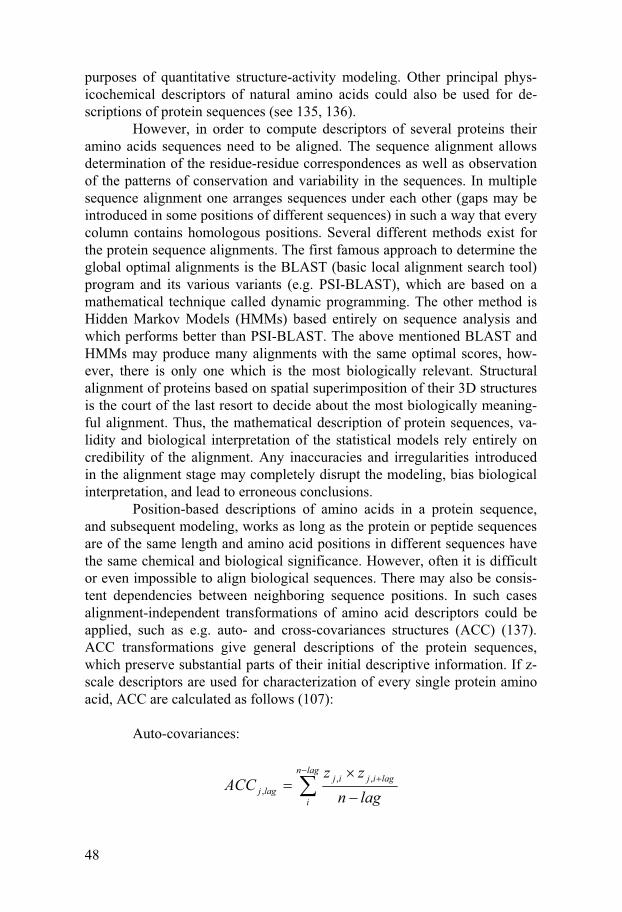
48
purposes of quantitative structure-activity modeling. Other principal phys-icochemical descriptors of natural amino acids could also be used for de-scriptions of protein sequences (see 135, 136).
However, in order to compute descriptors of several proteins their amino acids sequences need to be aligned. The sequence alignment allows determination of the residue-residue correspondences as well as observation of the patterns of conservation and variability in the sequences. In multiple sequence alignment one arranges sequences under each other (gaps may be introduced in some positions of different sequences) in such a way that every column contains homologous positions. Several different methods exist for the protein sequence alignments. The first famous approach to determine the global optimal alignments is the BLAST (basic local alignment search tool) program and its various variants (e.g. PSI-BLAST), which are based on a mathematical technique called dynamic programming. The other method is Hidden Markov Models (HMMs) based entirely on sequence analysis and which performs better than PSI-BLAST. The above mentioned BLAST and HMMs may produce many alignments with the same optimal scores, how-ever, there is only one which is the most biologically relevant. Structural alignment of proteins based on spatial superimposition of their 3D structures is the court of the last resort to decide about the most biologically meaning-ful alignment. Thus, the mathematical description of protein sequences, va-lidity and biological interpretation of the statistical models rely entirely on credibility of the alignment. Any inaccuracies and irregularities introduced in the alignment stage may completely disrupt the modeling, bias biological interpretation, and lead to erroneous conclusions.
Position-based descriptions of amino acids in a protein sequence, and subsequent modeling, works as long as the protein or peptide sequences are of the same length and amino acid positions in different sequences have the same chemical and biological significance. However, often it is difficult or even impossible to align biological sequences. There may also be consis-tent dependencies between neighboring sequence positions. In such cases alignment-independent transformations of amino acid descriptors could be applied, such as e.g. auto- and cross-covariances structures (ACC) (137). ACC transformations give general descriptions of the protein sequences, which preserve substantial parts of their initial descriptive information. If z-scale descriptors are used for characterization of every single protein amino acid, ACC are calculated as follows (107):
Auto-covariances:
�
��
lagn
i
lagijijlagj lagn
zzACC ,,
,

49
Cross-covariances between two different z-scales j and k:
�
�
��
lagn
i
lagikijlagkj lagn
zzACC ,,
, , where indices j and k are used for the each of the five z-scales, index i is the amino acid position (i = 1, 2, … , n), and n is the number of amino acids in the sequence. Lag parameter shows “distance” of interaction between amino acid positions. For example, lag=1 accounts only for the nearest neighbor positions cross-dependencies, whereas lag=2 describes interactions between amino acid residuals separated by one further amino acid and so on (lag = 1, 2, … , L, where L<n).
Although a clear advantage of ACC description of biological poly-mers is their alignment independence, the interpretation and understanding of models built on these descriptors becomes difficult. Therefore, such ACC-based models could be used for virtual screening of libraries of peptide se-quences with various amino acid substitutions in order to find sequences with the desired biological properties (137). ACC transforms may also help to evaluate the effect of simultaneous presence of certain structural features at some fixed distances in the sequences (135).
3.8. QSAR and 3D structure methods Understanding molecular recognition remains a central topic in the devel-opment of bioactive substances, which eventually may become new drugs. Many different computational methods have been developed in recent years for modeling protein-ligand interactions to help in the design of molecules with high affinity and specificity and this includes methods for use both in lead compound discovery and in lead optimization stages (138-141).
An enormous amount of work has appeared over the last 40 years correlating descriptors derived from molecular compounds to a variety of biological and chemical data using machine learning techniques (142). These studies have established traditional computational fields for studying mo-lecular recognition known as quantitative structure-activity relationship (QSAR) and quantitative structure-property relationship (QSPR) modeling (143, 144, 145). Although QSAR models provide information on which mo-lecular properties afford high activity of a compound on a target, the main disadvantage is a limited scope of the models regarding understanding of target-ligand interactions. Moreover, QSAR models are often limited to structurally related compounds, which restrict their applicability on a large-scale.

50
When a 3D structure of the protein of interest is known, various computer-based approaches can be applied to design active compounds. One widely used approach is docking, where the 3D structure of the macromole-cule is used to model the protein-ligand complex (97, 141). In many cases methods based on analysis of the protein 3D structure are highly useful and may afford statistical enrichment of chemical libraries in virtual screening (146). However, there are many intrinsic problems with the use of such 3D techniques.
The first bottleneck is the necessity for accurate 3D structures, which are often not available, or too costly to determine experimentally. For example, currently the most important drug targets are integral membrane proteins (i.e. GPCRs, which constitute 60% of all drug targets) and only two structures have been determined to atomic resolution so far (83, 89). Even for water-soluble proteins the manufacturing of crystals for diffraction measurements is a very difficult task. Computational methods for prediction of the 3D structures of macromolecules from amino acid sequences are often too inaccurate to be highly useful for drug design and often fail, despite the large efforts made to improve structure prediction algorithms.
The second bottleneck is that docking methods are error prone and fail to account for the dynamics of proteins. In reality macromolecules are complicated dynamic structures, which adopt many different conformations and frequently change shape and structure upon ligand binding. To predict which ligands the target receptor might recognize, energetically accessible conformations of the receptor and the ligand should be calculated. Unfortu-nately, the number of possible conformations rises exponentially with the number of rotatable bonds, posing computational problems for full sampling of conformations for the protein-ligand complexes (7). Furthermore, 3D docking methods take into account only one protein at a time and simultane-ously designing compounds to fit multiple targets, such as mutated receptors, is a very difficult task indeed. 3D docking methods are also quite poor in predicting binding affinities of the ligands and thus constructed models do not allow generalizations to dissimilar proteins (147). Therefore, new ap-proaches for analysis of protein-ligand interactions are needed to resolve these issues.
51
3.9. Proteochemometric approach Proteochemometrics (PCM), a novel powerful chemo-bioinformatics ap-proach, has been developed recently for the analysis of protein-ligand inter-actions, protein function, protein engineering and drug design (92, 117, 148-158) (papers I, III-V). The central goal of the proteochemometric approach is to describe the “interaction space” between series of multiple macromole-cules and series of multiple ligands. This leads to PCM models, which can be applied for various purposes. The principle behind proteochemometrics is simple, however, sophisticated modeling techniques are required to construct reliable models. A simplified schema for PCM modeling process is shown in Figure 15.
At the first stage descriptors of biological macromolecules and ligands are derived in different ways as described in the section 3.7 and are termed ordinary descriptors for macromolecules and ligands respectively (Figure 15). For example, in paper I binary descriptors of proteins were used, whereas in papers I and III-V macromolecules were described by z-scale descriptors. Binary description of the ligands were used in papers I and II and physicochemical descriptors in papers II-IV. Alignment-independent GRIND descriptors have been shown to be highly effective in the construction of the proteochemometric model in paper V. Ordinary de-scriptors of experimental assays were also introduced in papers III and IV and proved to increase validity of the PCM models.
A matrix of N ordinary descriptors for macromolecules can be viewed as a set of points in the N-dimensional descriptor space, forming the chemical space of macromolecules (Figure 16B). Similarly a matrix of ligand ordinary descriptors forms the chemical space of ligands (Figure 16). The matrices of ordinary descriptors of macromolecules and ligands are usu-ally pre-processed before modeling. For example, data centering and scaling to unit variance is commonly used (papers I, III-V). Block-scaling of the groups of related descriptors is another method for improving the quality of PCM models (papers I, III, IV). At the second stage, cross-terms or interac-tion-term descriptors are generated by multiplying any two ordinary descrip-tors. In this way three types of interaction-term descriptors usually are de-rived, i.e. ligand-ligand, receptor-receptor, and ligand-receptor interaction-terms. In principle, also higher order interaction-terms could be generated by multiplying three or more ordinary descriptors. However, the number of possible interaction-terms increases rapidly as the square of a number of the ordinary descriptors, which potentially may lead to overfit in further model-ing. Therefore, variable selection or descriptor space compression methods, such as PCA, could be highly useful to reduce the number of descriptors while preserving information they contain in relation to the biological activ-ity under study (papers I and V). Interaction-term descriptors form the “in-teraction space”, which represents non-covalent interactions of the ligands
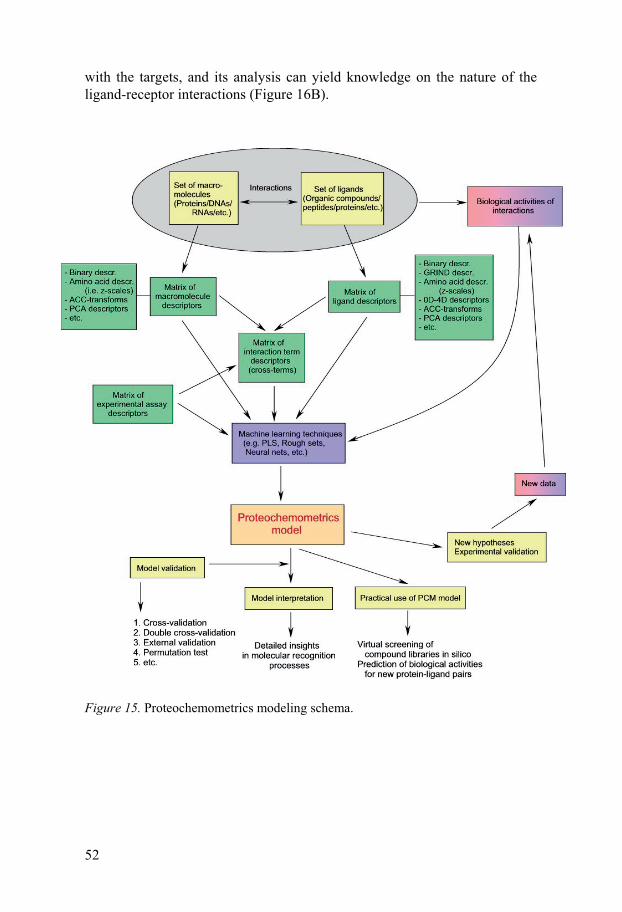
52
with the targets, and its analysis can yield knowledge on the nature of the ligand-receptor interactions (Figure 16B).
Figure 15. Proteochemometrics modeling schema.
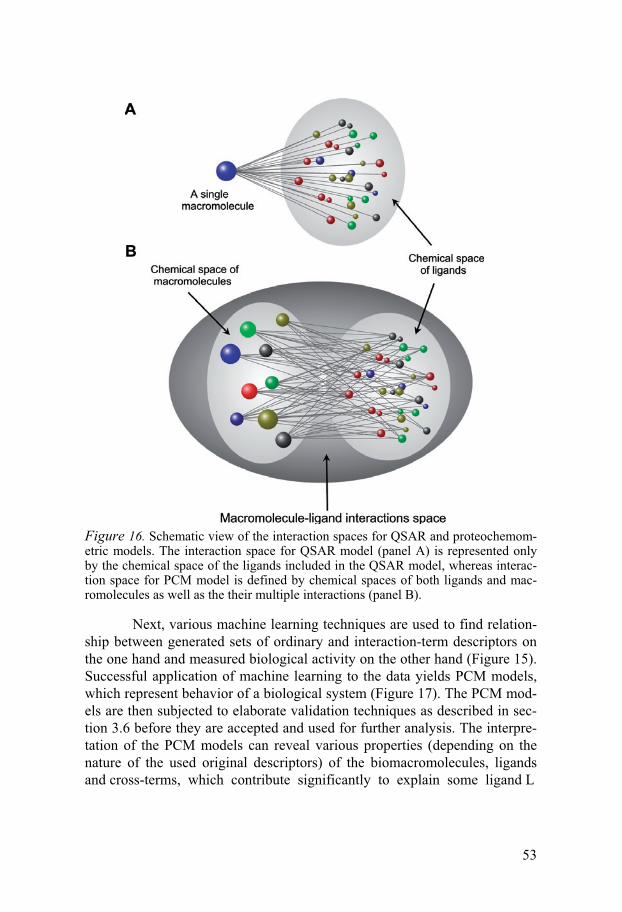
53
Figure 16. Schematic view of the interaction spaces for QSAR and proteochemom-etric models. The interaction space for QSAR model (panel A) is represented only by the chemical space of the ligands included in the QSAR model, whereas interac-tion space for PCM model is defined by chemical spaces of both ligands and mac-romolecules as well as the their multiple interactions (panel B).
Next, various machine learning techniques are used to find relation-ship between generated sets of ordinary and interaction-term descriptors on the one hand and measured biological activity on the other hand (Figure 15). Successful application of machine learning to the data yields PCM models, which represent behavior of a biological system (Figure 17). The PCM mod-els are then subjected to elaborate validation techniques as described in sec-tion 3.6 before they are accepted and used for further analysis. The interpre-tation of the PCM models can reveal various properties (depending on the nature of the used original descriptors) of the biomacromolecules, ligands and cross-terms, which contribute significantly to explain some ligand L
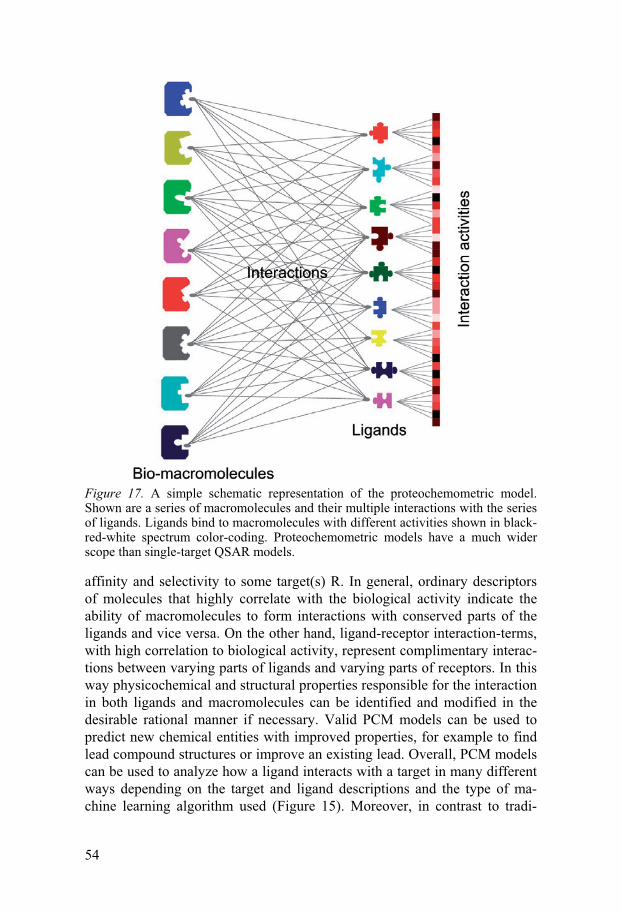
54
Figure 17. A simple schematic representation of the proteochemometric model. Shown are a series of macromolecules and their multiple interactions with the series of ligands. Ligands bind to macromolecules with different activities shown in black-red-white spectrum color-coding. Proteochemometric models have a much wider scope than single-target QSAR models.
affinity and selectivity to some target(s) R. In general, ordinary descriptors of molecules that highly correlate with the biological activity indicate the ability of macromolecules to form interactions with conserved parts of the ligands and vice versa. On the other hand, ligand-receptor interaction-terms, with high correlation to biological activity, represent complimentary interac-tions between varying parts of ligands and varying parts of receptors. In this way physicochemical and structural properties responsible for the interaction in both ligands and macromolecules can be identified and modified in the desirable rational manner if necessary. Valid PCM models can be used to predict new chemical entities with improved properties, for example to find lead compound structures or improve an existing lead. Overall, PCM models can be used to analyze how a ligand interacts with a target in many different ways depending on the target and ligand descriptions and the type of ma-chine learning algorithm used (Figure 15). Moreover, in contrast to tradi-
55
tional QSAR models built on data from a single target, the information con-tent incorporated in PCM models increases tremendously and PCM models, therefore, have a much wider scope (compare Figure 16A and 16B; Figure 17).
A great advantage of PCM is that it does not require knowledge of 3D structure of the macromolecules to study ligand recognition. However, if such 3D data is available it can also be included in the modeling process. Apart from identification of active sites of targets and determination of direct interactions between parts of a ligand with active site residues, PCM ap-proach can be used for prediction of indirect interactions in proteins, i.e. revealing regions (amino acids, sequence stretches, domains etc.) and their various structural and physicochemical properties that influence ligand bind-ing indirectly (papers I, III-V) (156).
Another advanced feature of the PCM approach is that it can be si-multaneously applied over large sets of different target proteins collected from various types of species and strains. Structural and physicochemical properties for a ligand to interact optimally with a particular target or a group of targets can also be derived using PCM (papers III and IV). This makes it possible to engineer multiple target selective drugs not seldom desired due to redundant signaling pathways and adaptive drugs, which would bind effec-tively to the target and its mutated variants. In the case where no single drug can be found which fits a desired profile, two or more drug combinations can be used instead. Each drug would then cover a part of the chemical space of the targets and in combination they would have the capacity to interact with and inhibit all possible target variations.
Large-scale PCM aims to build generalized interaction models over broad groups of targets. Construction of such generalized models occurs in an iterative manner. From the initial PCM models, covering multiple types of targets and ligands, interaction space regions of interest are identified. New experiments are then performed and PCM models are further enriched. Therefore, any new drug development project could be started using existing data for more or less related targets and from completed projects or projects in progress. This existing data can be combined into one unified model to afford predictions for a new target of interest (papers III-V).
Proteochemometrics is a very robust and completely general method and could potentially be extended to the analysis of interactions of other macromolecules such as RNA and DNA and low molecular weight com-pounds, such as peptides and chemical libraries. The PCM technology will have a pivotal role in influencing future strategies for discovering novel ligands with desired properties in relation to multiple targets. Applied sys-tematically on a large scale, proteochemometrics may yield maps for the interaction space of entire protein families with natural and synthetic ligands, and even beyond, potentially covering interactions in entire genomes and proteomes.

56
57
4. Results and Discussion
4.1. Proteochemometrics based modeling of melanocortin receptors and their ligands Paper I presents a proteochemometric analysis of the interaction space of small cyclic melanocortin receptor active HS peptides and melanocortin receptors. One of the aims of this study was to understand why the HS-129 pentapeptide expresses high selectivity towards MC4 receptor, as well as to identify the amino acids in the recognition site in MC receptors responsible for the observed HS-129 peptide high activity. In order to achieve these goals, chemical space of four wild-type MC receptors were expanded by a library of 14 chimeric MC receptors. Descriptors of MC receptors, HS pep-tides and their cross-terms were correlated to the observed activities by means of PLS regression and two valid proteochemometric models (i.e. M1 and M2) were obtained. The M1 model was based on binary description of MC receptor segments, whereas physicochemical properties of the MC re-ceptors amino acids were used for construction of the M2 model. The inter-pretation of the M1 model revealed the most important MC receptor seg-ments and amino acids for HS peptide binding. The M2 model was used to estimate the contribution of individual amino acids for selectivity of the HS-129 peptide to the MC4 receptor. This was afforded by exchanging MC4 receptor amino acids to the corresponding amino acids from other MC recep-tors and predicting the activity change for the HS-129 peptide on a mutated receptor in silico. The results from this model interpretation indicated spe-cific amino acids responsible for the HS-129 peptide selectivity for MC4 receptor (Figure 5 in paper I). The robustness of the recognition maps of MC receptors derived from the M2 model was confirmed by the Monte-Carlo simulations. Moreover, the results from this study were supported by several published previously site-direct mutagenesis studies.
Thus, paper I clearly demonstrated the utility of proteochemomet-rics for the analysis of the recognition sites of biological macromolecules in great detail, even though the modeling was applied on a relatively small interaction data set. Furthermore, the constructed accurate PCM models
58
could be used for a priori prediction of inhibition activities of HS peptides and their derivatives towards wild-type and mutated MC receptors. The knowledge of selectivity recognition maps of MC receptors revealed by the M2 model is a necessary prerequisite for the rational drug design for these receptors.
4.2. Novel insights into complexity of HIV-1 protease specificity Since the very first published reports it became apparent that the specificity of HIV-1 protease is complex and there are no simple rules defining it. Pa-per II addresses this issue and describes a comprehensive bioinformatics analysis of the HIV-1 protease specificity based on rough sets approach. In this work we analyzed the largest data set of substrates and non-substrates of HIV-1 protease compared to previously published reports, which led to a number of novel findings.
The analysis of the amino acids in P1-P1� positions among all pep-tides of the collected data set demonstrated that more than 50% of substrates should be classified into the “other cleavage sites” group according to tradi-tional classification described in section 3.2.4. This surprising finding ques-tioned the reliability of the traditional classification of HIV-1 protease sub-strates and prompted us to investigate HIV-1 protease specificity further in detail. We applied rough sets on the HIV-1 protease data set presented in the physicochemical coding and constructed a highly valid predictive rule-based model. The results from the rule model analysis showed that HIV-1 protease specificity is much more complex indeed than previously anticipated and that it cannot be defined based only on substrate amino acids at a scissile bond (P1-P1� positions) or any other single substrate amino acid. The model suggested that a combination of amino acids in at least three substrate posi-tions define patterns for HIV-1 protease specificity. Moreover, our analysis indicated that the most important physicochemical properties of amino acids for defining protease specificity span through all substrate positions P4-P4� and are not limited by the substrate core P2-P2�. In addition the most impor-tant amino acid properties for the HIV-1 protease substrates and non-substrates were identified.
The results of paper II provided novel insights into complexity of HIV-1 protease specificity, which may facilitate considerably the design of novel HIV-1 protease inhibitors and understanding of HIV-1 protease inter-actions with the host cell proteins. Paper II provides the most detailed char-acterization of HIV-1 protease specificity to date, allowing accurate predic-tions of the substrate cleavage and interpretation of complex data in a simple visual format. These results showed that only by combining and analyzing
59
massive HIV proteome data was it possible to discover novel general pat-terns of physicochemical determinants of HIV-1 protease-peptide interac-tions.
4.3. Proteochemometric analysis of the interaction space of retroviral proteases HIV-1 protease inhibitors that act at the active site of the aspartic proteases can lose effectiveness due to random polymorphic variation in the enzyme and thus HIV-1 can become resistant to pharmacological treatment. Many studies have determined that the constellations of protease mutations pro-mote resistance to selected inhibitors and the subsequent changes in protease substrate recognition and cleavage rate. HIV-1 protease inhibitors are usu-ally rigid chemical structures, which lack adaptability to target variations, whereas retroviral substrates are flexible molecules that can adapt and bind to many protease mutants. Therefore, efficiently cleaved substrates or sub-strates with low Michaelis constants, Km, over multiple retroviral proteases might serve as good templates for the design of adaptive peptidomimetic inhibitors that could show inhibitory activity across multiple resistance mu-tations. However, it is difficult to predict which substrates could have de-sired properties over many proteases.
Papers III and IV describe proteochemometric analysis of the inter-action space of multiple retroviral proteases and their substrates. The aim of this work was to explore and understand the complexity of interactions and resistance mechanisms of retroviral proteases as well as to construct general predictive models for retroviral proteases and their substrates. Another goal of the study was to define the physicochemical determinants of substrate cleavability, catalytic efficiency and binding for existing and forthcoming retroviral protease mutants and design inhibitors with the activity towards drug-resistant variants of HIV-1 protease.
This study was based on the analysis of a large comprehensive data set for 63 retroviral proteases from 9 different retroviral species. Retroviral proteases were structurally aligned and physicochemical properties of their amino acids, as well as properties of the substrate amino acids and their mul-tiple interaction-terms, were correlated to the known biochemical activities. This resulted in statistically valid cleavability and cleavage rate PCM models (described in paper III) and a generalized Km PCM model (described in paper IV). All models were assessed by in vitro laboratory testing on an independent set of peptides of diverse structures. The cleavability model (paper III) could correctly classify all cleavable substrates as cleavable, and all non-cleavable substrates as non-cleavable in this experimental validation.
60
Catalytic efficiencies of the cleavable substrates predicted by the cleavage rate model (paper III) agreed well with the experimentally determined val-ues. The generalized Km model (paper IV) also accurately predicted Km constants for the experimental data set. Moreover, all above models could accurately predict the activities of the completely excluded retroviral prote-ases, most notably for multiple HIV-1 protease mutants and for HIV-2 pro-tease. This ability is completely lacking in the QSAR models constructed for an individual protein target.
All models were further analyzed in detail. The results of this analy-sis revealed multiple positions in proteases and substrates where compensa-tional mutations could occur, that restore effective substrate binding and cleavage following the appearance of protease inhibitor resistance mutations. The most important physicochemical effects of amino acids that rule sub-strate cleavage and binding across multiple proteases were also localized. The new general physicochemical patterns for retroviral substrates were experimentally validated. This was achieved by selection of suitable natural and artificial amino acids for the P3-P3� positions of the substrates according to recognition maps, and virtual screening of the constructed library of hexapeptides by the generalized Km model (paper IV) to estimate Km values towards several HIV-1 proteases bearing drug-resistant mutations. From the screened library 10 hexapeptides with diverse structures and predicted low Km-s values were selected, synthesized, and tested for their inhibitory activ-ity in vitro on the “wild-type” and drug-resistant HIV-1 protease mutants. All these hexpapeptides were shown to effectively inhibit HIV-1 protease and some of them demonstrated uniform inhibitory activity against all prote-ases tested. The designed structures represent examples of prospective new lead series with micromolar inhibitory activities.
The PCM models described in paper III may be used to monitor HIV-1 protease and cleavage sites evolution in a physicochemical sense, i.e. to predict possible future trajectories that HIV-1 evolution may take. Know-ing potential HIV-1 mutants to come in the future would theoretically allow the design of advanced inhibitors that could account for expected resistance mutations, which even yet have not occurred. The PCM approach under-taken in paper IV was highly successful and resulted in peptides with in-hibitory activity on the tested HIV-1 proteases. Hexapeptide inhibitors de-signed in this study, as well as many other potential hexapeptide inhibitors predicted by the Km model, could be used as templates for the development of drug-resistance improved retardants. The proteochemometric approach described in papers III and IV has wide-ranging implications in studies of interaction space and resistance mechanisms of HIV; it may also be applied to study interaction space of other pathogens exhibiting resistance to drugs due to target protein heterogeneity.
61
4.4. Generalized proteochemometric model of multiple cytochrome P450 enzymes and their inhibitors Inhibition of cytochrome P450s (CYP) enzymes is probably the most com-mon mechanism underlying drug toxicity, loss of therapeutic efficacy, and is a common cause of drug-drug interactions in the clinics. The development of methods that can detect CYP inhibition as early as possible in order to minimize the risk of late failures of the candidate drugs has thus become a subject of the utmost importance for drug development in the pharmaceutical industry. Therefore, the main aim of the study presented in paper V was to test how proteochemometric approach could be integrated in evaluation of metabolic properties of compounds.
Data related to 14 CYP isoforms and 375 ligands of diverse struc-tures and their corresponding inhibition constants IC50 were obtained from the public domain. Physicochemical properties of CYP enzymes, GRIND descriptors of ligands and their cross-terms were correlated to inhibition constants resulting in a highly valid general PCM model for CYP inhibition (paper V). Validation of this general model demonstrated that it is indeed robust and capable to predict, with high accuracy, inhibition activities of the excluded CYP isoforms and inhibitors.
A considerable number of ligand-based, QSAR, pharmacophore and homology models have been published previously for individual CYP iso-forms. However, all of them considered one particular CYP enzyme isoform at a time. The findings of this study demonstrate that the performance of the global CYP model is better than of previously published models, as the global model can predict accurately inhibition activities for diverse sets of compounds and different CYP isoforms. Such a general model has great practical utility in virtual screening of new libraries of investigational com-pounds towards multiple CYPs simultaneously, even for those CYPs, for which individual single-target models are still not available. Therefore, the global model and its modeling approach might be used for a priori predic-tions of potential drug-drug interactions in developing drug candidates.
Many common human CYP enzyme polymorphisms have accumu-lated along racial lines and it seems to be very costly to establish pharmaco-genetic profiles of prospective drug candidates regarding these polymor-phisms before they are launched into the clinical trials. The method pre-sented in this study could be in principle extended to predict the activity of investigational drugs to the most common polymorphic forms of CYPs, similarly as the generalized CYP model predicted activities of the excluded CYP isoforms or as other PCM models could predict activities of mutated proteases (papers III and IV) or MC receptors (paper I). Moreover, analy-sis of the general CYP model revealed common CYP amino acids and ligand properties (as well as their inter-dependencies), which may aid the selection of drug candidates showing weak inhibition over multiple CYPs.

62
General PCM models for multiple CYPs reproduced upon large-scale proprietary chemical collections could be suitable for high-throughput virtual screening of massive libraries of compounds for an array of multiple CYP isoforms and polymorphic variants in early and late phases of the drug discovery process. Overall, the proteochemometric approach provides a gen-eral strategy for the analysis of a variety of CYP isoforms with multiple ligands and should be similarly applicable to model interactions of other proteins involved in absorption, distribution, metabolism and elimination of xenobiotics. The author envisages that models similar to the one presented in this study will be of great interest and practical utility for the pharmaceutical industry and would strongly encourage further research in pharmacogenom-ics.

63
5. Concluding remarks and future perspectives
The majority of drugs interact with specific proteins, such as enzymes, membrane receptors, and proteins involved in various cellular events like signal transduction or cell cycle control. The genes encoding these proteins exhibit genetic polymorphisms, which are often associated with a profound effect on drug activities (68). For example, polymorphisms in angiotensin converting enzyme (ACE) change its response to ACE inhibitors (159) and variations in �-adrenergic receptors alter sensitivity to �-agonists in asthmat-ics (160). More than 40 different variants of the �-chain of human hemoglo-bin exist among Middle and South American populations with the mutations being distributed all over the protein sequence (161). There are of course numerous other examples of this type (68). Polymorphic forms of proteins may be well recognized by natural ligands, whereas activities of exogenous compounds, such as drugs and candidate drugs, could differ by several or-ders of magnitude. This may happen if, for instance, a recognition site of a new exogenous compound differs from the binding site of the endogenous ligand or if an exogenous compound interacts directly or indirectly with polymorphic amino acid residues.
Nevertheless, the drug discovery process is still largely based upon a “one molecule - one target - one disease” philosophy (162). There is a grow-ing recognition that target variability should be taken into account during the development of novel compounds, however. The powerful chemo-bioinformatics approach, proteochemometrics, presented in this thesis pro-vides a simple and effective strategy of modeling the interaction space of multiple biological macromolecules from various biological species with their ligands and has potential to take full advantage of the available interac-tomics data. An important feature of proteochemometrics making it distinct from other methods is that it allows simultaneous optimization of ligands over several targets. This makes it possible to design multiple targets selec-tive drugs as well as adaptive drugs, which would adapt and bind equally well to a number of specific protein variants. Moreover, concomitant optimi-zation for increased selectivity for one particular target while reducing it for multiple anti-targets is also possible with the use of proteochemometrics.
In the work underlying this thesis we have successfully applied pro-teochemometrics on various large interaction data sets for novel targets and multiple species and demonstrated how general PCM models could be inter-
64
preted in the chemical and biological sense. In principle, there are no con-straints that would limit the application of the proteochemometric approach on an even larger scale for modeling, for example, huge protein-protein in-teraction networks or for construction of a quantitative interaction model for the multitude of chemical compounds and proteins in an organism's pro-teome. This should ultimately become possible due to rapid growth of inter-action data available in the public domain (http://www.bind.ca; http://www.bindingdb.org; http://dip.doe-mbi.ucla.edu) and commercial databases (http://www.aureus-pharma.com). The process of PCM modeling is iterative and more and more general interaction models should be possible to construct by including new data. Similarly, there are no limitations for the application of various machine learning techniques in PCM modeling, and rapid developments in this field are highly beneficial for proteochemomet-rics. Moreover, in proteochemometrics any type of mathematical description of macromolecules and ligands is allowed depending on what kind of knowledge one is interested in obtaining from the final PCM model. Proteo-chemometrics is highly useful to study molecular recognition processes, generate “hit” compounds with desired properties, and explore molecular interaction space around “lead” compounds. PCM may contribute signifi-cantly to the pharmacogenomics field and help to stay one step ahead in the evolutionary race with drug-resistant pathogens. The range of potential ap-plications of proteochemometrics is quickly growing.
Finally, in the introduction to this thesis I left the reader with the un-answered question: “Are we ready to make full models of biology?” How close are we to start “flying” in biology, i.e. to model complex biological systems? In my opinion, we have already “taken off” and now are rising quickly to more and more advanced levels of modeling and understanding of biology; and I envisage that proteochemometric approach will play one of the pivotal roles in this process in the future.

65
6. Acknowledgments
Over the years many people have contributed to this work significantly, traveling with me on this long, enjoyable and rewarding journey, and I will not spare words here thanking them: First of all I would like to thank my supervisor Prof. Jarl Wikberg for pro-viding pleasant, creative and friendly working environment, for giving me the opportunity to be part of your group, for all support and encouragement. Thank you for your genuine, everlasting enthusiasm, active support of my projects throughout this study and showing me what it feels like to be “on the cutting edge” of science. I would like to express my sincere gratitude to my supervisor Prof. Jan Ko-morowski for creating scientific environment of the highest standard, for sparking my interest in bioinformatics, for all your encouragement, support I could wish, and valuable discussions. Especially, I am thankful for giving me the freedom to develop my own work, supporting and constantly con-tributing to my professional development and providing wonderful opportu-nities to participate in the international meetings and conferences. I would like to acknowledge my co-supervisor Dr. Peteris Prusis for intro-duction to the exciting field of chemoinformatics and valuable help in start-ing my research projects. Thank you also for your kind support, input, friendship, many fruitful, vivid discussions and interesting conversations, as well as critical comments and useful suggestions for the research projects. Special thanks to Anders Sjöberg, the Chairman of LCB, for understanding and support. I would like to thank also all my wonderful co-authors at the Department of Pharmaceutical Biosciences for their significant contributions throughout this study, especially Ramona Petrovska, Prof. Staffan Uhlen, Sviatlana Ya-horava, Aleh Yahorau, Felikss Mutulis, and Ilze Mutule, who worked hard to synthesize and screen many compounds investigated in this study. Thank you for your excellent collaboration, hospitality and friendship.

66
I am thankful to all my present and former colleagues and collaborators at the Linnaeus Centre for Bioinformatics for creating such a friendly environ-ment to work, especially to Adam Ameur, Gunnar Andersson, Claes Anders-son, Robin Andersson, Ann-Charlotte Berglund Sonnhammer, Erik Bong-cam-Rudloff, Örjan Carlborg, David Ardell, Stefan Enroth, Torgeir Hvid-sten, Alvaro Martinez Barrio, Jakub Orzechowski Westholm, Helena Ström-bergsson, Michael Baldamus, Weronica Ek, Eva Freyhult, Marcin Kierczak, Katharina Huber, Alice Lesser, Vincent Moulton, Hung Son Nguyen, Witold Rudnicki and Herman Midelfart. In particular I would like to express my appreciation again to Torgeir Hvid-sten and Marcin Kierczak, as well as Ewa Makosa, and �ukasz Ligowski for help and support working with Rosetta program. Special thanks to Alice Lesser for proofreading this thesis. Special acknowledgments to Arnaud Le Rouzic, Lars Rönnegård, Gabriela Aguileta, Jose Alvarez Castro, Francois Besnier, Byeong-Woo Kim, Vladi-mir Yankovski, again to Marcin Kierczak, María Quintela Sánchez and Mikhail Velikanov for the endless interesting discussions, everlasting enthu-siasm, and friendship. I also would like to acknowledge Nils-Einar Eriksson, again Vladimir Yank-ovski, Magnus Jansson, Gustavo Gonzáles-Wall, and Emil Lundberg for their proficient technical support, as well as Gunilla Nyberg Olsson, Christin Grønnslett, Lena Wadelius, and Erika Johansson for your kind help and competent administrative assistance. I would like to thank all my colleagues at the Department of Pharmaceutical Biosciences for your help, encouragement and support, especially Ilona Mandrika, Maris Lapinsh, Martin Eklund, Ola Sputh, Stephy Prakash and Muhammad Junaid. I acknowledge also my colleagues at the Latvian Institute of Organic Syn-thesis for support and encouragement, in particular Prof. Ivars Kalvins, Maija Dambrova, Edgars Suna, Martins Katkevics, and Aleksandrs Gutcaits. Thanks to all my friends in Sweden, Latvia and around Europe for believing in me, supporting me and making me think of other things than research. This research has been supported by grants from the Swedish VR (04X-05957), Swedish Animal Welfare Agency, Knut and Alice Wallenberg Foundation, and Swedish International Development Cooperation Agency (HIV-2006-019). Their financial support in greatly appreciated.

67
I am immensely grateful to my family for all the love and encouragement and for always being a constant source of support and optimism. Finally, I would like to thank my treasure and inspiration, Aleksandra, for all your support, advice, encouragement and love and for giving me pleasure in life.
Aleksejs Kontijevskis

68
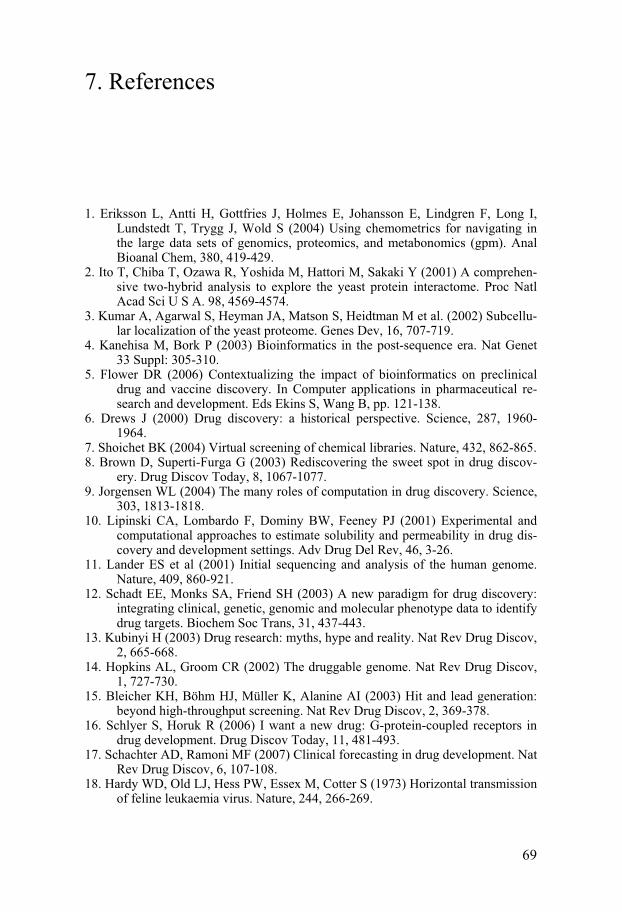
69
7. References
1. Eriksson L, Antti H, Gottfries J, Holmes E, Johansson E, Lindgren F, Long I, Lundstedt T, Trygg J, Wold S (2004) Using chemometrics for navigating in the large data sets of genomics, proteomics, and metabonomics (gpm). Anal Bioanal Chem, 380, 419-429.
2. Ito T, Chiba T, Ozawa R, Yoshida M, Hattori M, Sakaki Y (2001) A comprehen-sive two-hybrid analysis to explore the yeast protein interactome. Proc Natl Acad Sci U S A. 98, 4569-4574.
3. Kumar A, Agarwal S, Heyman JA, Matson S, Heidtman M et al. (2002) Subcellu-lar localization of the yeast proteome. Genes Dev, 16, 707-719.
4. Kanehisa M, Bork P (2003) Bioinformatics in the post-sequence era. Nat Genet 33 Suppl: 305-310.
5. Flower DR (2006) Contextualizing the impact of bioinformatics on preclinical drug and vaccine discovery. In Computer applications in pharmaceutical re-search and development. Eds Ekins S, Wang B, pp. 121-138.
6. Drews J (2000) Drug discovery: a historical perspective. Science, 287, 1960-1964.
7. Shoichet BK (2004) Virtual screening of chemical libraries. Nature, 432, 862-865. 8. Brown D, Superti-Furga G (2003) Rediscovering the sweet spot in drug discov-
ery. Drug Discov Today, 8, 1067-1077. 9. Jorgensen WL (2004) The many roles of computation in drug discovery. Science,
303, 1813-1818. 10. Lipinski CA, Lombardo F, Dominy BW, Feeney PJ (2001) Experimental and
computational approaches to estimate solubility and permeability in drug dis-covery and development settings. Adv Drug Del Rev, 46, 3-26.
11. Lander ES et al (2001) Initial sequencing and analysis of the human genome. Nature, 409, 860-921.
12. Schadt EE, Monks SA, Friend SH (2003) A new paradigm for drug discovery: integrating clinical, genetic, genomic and molecular phenotype data to identify drug targets. Biochem Soc Trans, 31, 437-443.
13. Kubinyi H (2003) Drug research: myths, hype and reality. Nat Rev Drug Discov, 2, 665-668.
14. Hopkins AL, Groom CR (2002) The druggable genome. Nat Rev Drug Discov, 1, 727-730.
15. Bleicher KH, Böhm HJ, Müller K, Alanine AI (2003) Hit and lead generation: beyond high-throughput screening. Nat Rev Drug Discov, 2, 369-378.
16. Schlyer S, Horuk R (2006) I want a new drug: G-protein-coupled receptors in drug development. Drug Discov Today, 11, 481-493.
17. Schachter AD, Ramoni MF (2007) Clinical forecasting in drug development. Nat Rev Drug Discov, 6, 107-108.
18. Hardy WD, Old LJ, Hess PW, Essex M, Cotter S (1973) Horizontal transmission of feline leukaemia virus. Nature, 244, 266-269.

70
19. Poiesz BJ, Ruscetti FW, Gazdar AF, Bunn PA, Minna JD, Gallo RC (1980) Detection and isolation of type C retrovirus particles from fresh and cultured lymphocytes of a patient with cutaneous T-cell lymphoma. Proc Natl Acad Sci USA, 77, 7415-7419.
20. Gallo RC, Thomson MM (1996) Human T-cell Lymphotropic Virus Type I (Hollsberg P, Hafler DA, eds.), Wiley and Sons, Chichester. pp. 325.
21. Clavel F, Guétard D, Brun-Vézinet F, Chamaret S, Rey M, Santos-Ferreira MO, Laurent AG, Dauguet C, Katlama C, Rouzioux C, Klatzmann D, Champali-maud JL, Montagnier L (1986) Isolation of a new human retrovirus from West African patients with AIDS. Science, 233, 343-346.
22. Coffin JM, Hughes SH, Varmus HE (1997) Retroviruses. Cold Spring Harbor Laboratory Press, Woodbury, NY.
23. Randolph JT, DeGoey DA (2004) Peptidomimetic inhibitors of HIV protease. Curr Top Med Chem, 4, 1079-1095.
24. Lengauer T, Sing T (2006). Bioinformatics-assisted anti-HIV therapy. Nat Rev Microbiology, 4, 790-797.
25. Brass AL, Dykxhoorn DM, Benita Y, Yan N, Engelman A, Xavier RJ, Lieber-man J, Elledge SJ (2008) Identification of host proteins required for HIV in-fection through a functional genomic screen. Science, 319, 921-926.
26. Chrusciel RA, Strohbach JW (2004) Non-peptidic HIV protease inhibitors. Curr Top Med Chem, 4, 1097-1114.
27. De Clercq E (2002) Strategies in the design of antiviral drugs. Nat Rev Drug Discov, 1, 13-25.
28. Johnson VA, Brun-Vezinet F, Clotet B, Gunthard HF, Kuritzkes DR, Pillay D, Schapiro JM, Richman DD (2007) Update of the drug resistance mutations in HIV-1: 2007. Top HIV Med, 15,119-125.
29. De Clercq E (2004) Non-nucleoside reverse transcriptase inhibitors (NNRTIs): Past, present, and future. Chem Biodivers, 1, 44-64.
30. Castro HC, Loureiro NI, Pujol-Luz M, Souza AM, Albuquerque MG, Santos DO, Cabral LM, Frugulhetti IC, Rodrigues CR (2006) HIV-1 reverse tran-scriptase: a therapeutical target in the spotlight. Curr Med Chem, 13, 313-324.
31. Meanwell NA, Kadow JF (2007) Maraviroc, a chemokine CCR5 receptor an-tagonist for the treatment of HIV infection and AIDS. Curr Opin Investig Drugs, 8, 669-681.
32. Zeinalipour-Loizidou E, Nicolaou C, Nicolaides A, Kostrikis LG (2007) HIV-1 integrase: from biology to chemotherapeutics. Curr HIV Res, 5, 365-388.
33. Temesgen Z, Feinberg JE (2006) Drug evaluation: bevirimat-HIV Gag protein and viral maturation inhibitor. Curr Opin Investig Drugs, 7, 759-765.
34. Erickson JW, Burt SK (1996). Structural mechanisms of HIV drug resistance. Annu Rev Pharmacol Toxicol, 36, 545-571.
35. Blanchard JS (1996) Molecular mechanisms of drug resistance in Mycobacte-rium tuberculosis. Annu Rev Biochem, 65, 215-239.
36. Borst P (1991) Genetic mechanisms of drug resistance, A review. Acta Oncol, 30, 87-105.
37. Remy S et al. (2003) A novel mechanism underlying drug resistance in chronic epilepsy. Ann Neurol, 53, 469-479.
38. Schafer JM, Bentrem DJ, Takei H, Gajdos C, Badve S, Jordan VC.(2002) A mechanism of drug resistance to tamoxifen in breast cancer. J Steroid Bio-chem Mol Biol, 83, 75-83.
39. Nezami A, Kimura Y, Hidaka K, Kiso A, Liu J, Kiso Y, Goldberg DE, Freire E (2003) High-affinity inhibition of a family of Plasmodium falciparum prote-ases by a designed adaptive inhibitor. Biochemistry, 42, 8459-8464.
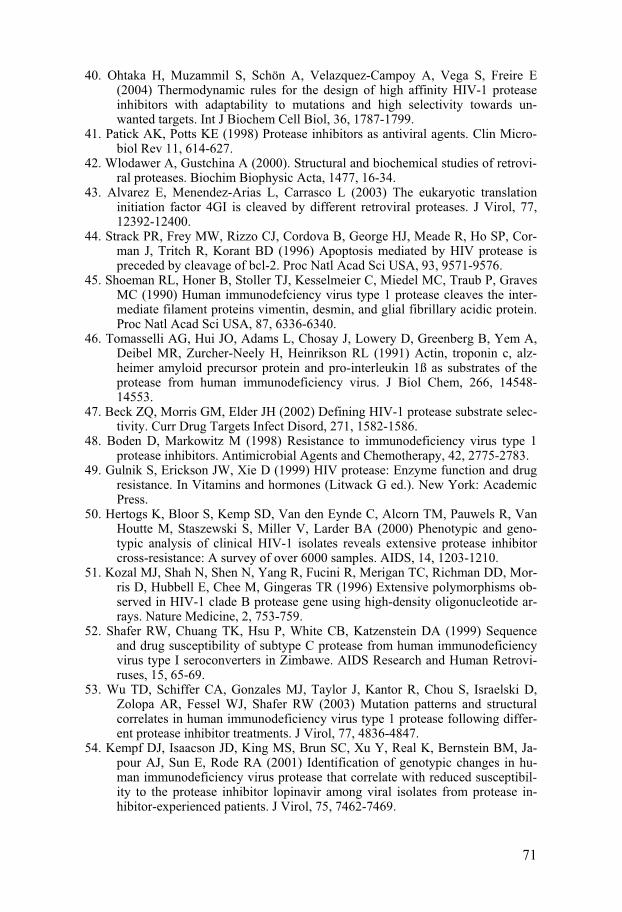
71
40. Ohtaka H, Muzammil S, Schön A, Velazquez-Campoy A, Vega S, Freire E (2004) Thermodynamic rules for the design of high affinity HIV-1 protease inhibitors with adaptability to mutations and high selectivity towards un-wanted targets. Int J Biochem Cell Biol, 36, 1787-1799.
41. Patick AK, Potts KE (1998) Protease inhibitors as antiviral agents. Clin Micro-biol Rev 11, 614-627.
42. Wlodawer A, Gustchina A (2000). Structural and biochemical studies of retrovi-ral proteases. Biochim Biophysic Acta, 1477, 16-34.
43. Alvarez E, Menendez-Arias L, Carrasco L (2003) The eukaryotic translation initiation factor 4GI is cleaved by different retroviral proteases. J Virol, 77, 12392-12400.
44. Strack PR, Frey MW, Rizzo CJ, Cordova B, George HJ, Meade R, Ho SP, Cor-man J, Tritch R, Korant BD (1996) Apoptosis mediated by HIV protease is preceded by cleavage of bcl-2. Proc Natl Acad Sci USA, 93, 9571-9576.
45. Shoeman RL, Honer B, Stoller TJ, Kesselmeier C, Miedel MC, Traub P, Graves MC (1990) Human immunodefciency virus type 1 protease cleaves the inter-mediate filament proteins vimentin, desmin, and glial fibrillary acidic protein. Proc Natl Acad Sci USA, 87, 6336-6340.
46. Tomasselli AG, Hui JO, Adams L, Chosay J, Lowery D, Greenberg B, Yem A, Deibel MR, Zurcher-Neely H, Heinrikson RL (1991) Actin, troponin c, alz-heimer amyloid precursor protein and pro-interleukin 1ß as substrates of the protease from human immunodeficiency virus. J Biol Chem, 266, 14548-14553.
47. Beck ZQ, Morris GM, Elder JH (2002) Defining HIV-1 protease substrate selec-tivity. Curr Drug Targets Infect Disord, 271, 1582-1586.
48. Boden D, Markowitz M (1998) Resistance to immunodeficiency virus type 1 protease inhibitors. Antimicrobial Agents and Chemotherapy, 42, 2775-2783.
49. Gulnik S, Erickson JW, Xie D (1999) HIV protease: Enzyme function and drug resistance. In Vitamins and hormones (Litwack G ed.). New York: Academic Press.
50. Hertogs K, Bloor S, Kemp SD, Van den Eynde C, Alcorn TM, Pauwels R, Van Houtte M, Staszewski S, Miller V, Larder BA (2000) Phenotypic and geno-typic analysis of clinical HIV-1 isolates reveals extensive protease inhibitor cross-resistance: A survey of over 6000 samples. AIDS, 14, 1203-1210.
51. Kozal MJ, Shah N, Shen N, Yang R, Fucini R, Merigan TC, Richman DD, Mor-ris D, Hubbell E, Chee M, Gingeras TR (1996) Extensive polymorphisms ob-served in HIV-1 clade B protease gene using high-density oligonucleotide ar-rays. Nature Medicine, 2, 753-759.
52. Shafer RW, Chuang TK, Hsu P, White CB, Katzenstein DA (1999) Sequence and drug susceptibility of subtype C protease from human immunodeficiency virus type I seroconverters in Zimbawe. AIDS Research and Human Retrovi-ruses, 15, 65-69.
53. Wu TD, Schiffer CA, Gonzales MJ, Taylor J, Kantor R, Chou S, Israelski D, Zolopa AR, Fessel WJ, Shafer RW (2003) Mutation patterns and structural correlates in human immunodeficiency virus type 1 protease following differ-ent protease inhibitor treatments. J Virol, 77, 4836-4847.
54. Kempf DJ, Isaacson JD, King MS, Brun SC, Xu Y, Real K, Bernstein BM, Ja-pour AJ, Sun E, Rode RA (2001) Identification of genotypic changes in hu-man immunodeficiency virus protease that correlate with reduced susceptibil-ity to the protease inhibitor lopinavir among viral isolates from protease in-hibitor-experienced patients. J Virol, 75, 7462-7469.
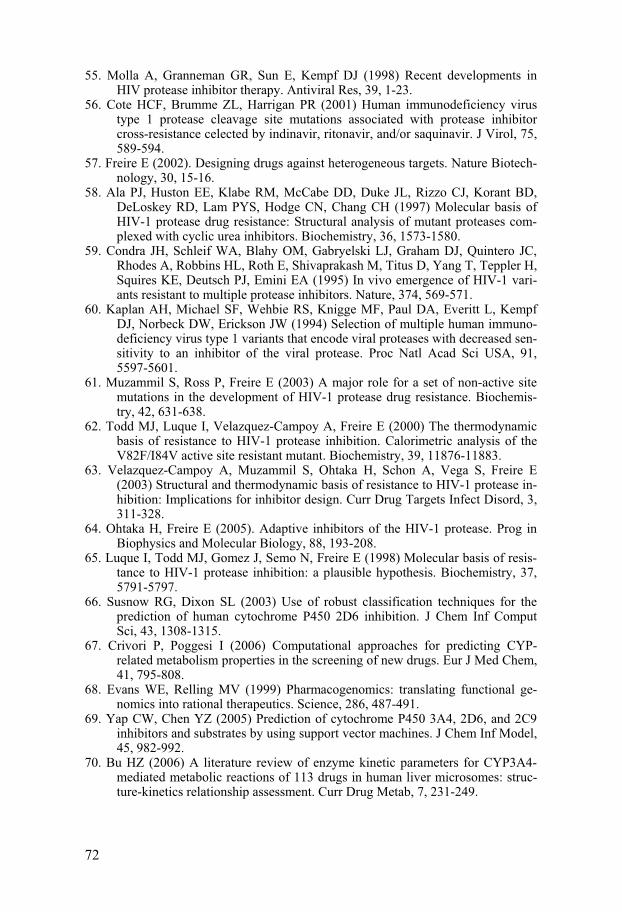
72
55. Molla A, Granneman GR, Sun E, Kempf DJ (1998) Recent developments in HIV protease inhibitor therapy. Antiviral Res, 39, 1-23.
56. Cote HCF, Brumme ZL, Harrigan PR (2001) Human immunodeficiency virus type 1 protease cleavage site mutations associated with protease inhibitor cross-resistance celected by indinavir, ritonavir, and/or saquinavir. J Virol, 75, 589-594.
57. Freire E (2002). Designing drugs against heterogeneous targets. Nature Biotech-nology, 30, 15-16.
58. Ala PJ, Huston EE, Klabe RM, McCabe DD, Duke JL, Rizzo CJ, Korant BD, DeLoskey RD, Lam PYS, Hodge CN, Chang CH (1997) Molecular basis of HIV-1 protease drug resistance: Structural analysis of mutant proteases com-plexed with cyclic urea inhibitors. Biochemistry, 36, 1573-1580.
59. Condra JH, Schleif WA, Blahy OM, Gabryelski LJ, Graham DJ, Quintero JC, Rhodes A, Robbins HL, Roth E, Shivaprakash M, Titus D, Yang T, Teppler H, Squires KE, Deutsch PJ, Emini EA (1995) In vivo emergence of HIV-1 vari-ants resistant to multiple protease inhibitors. Nature, 374, 569-571.
60. Kaplan AH, Michael SF, Wehbie RS, Knigge MF, Paul DA, Everitt L, Kempf DJ, Norbeck DW, Erickson JW (1994) Selection of multiple human immuno-deficiency virus type 1 variants that encode viral proteases with decreased sen-sitivity to an inhibitor of the viral protease. Proc Natl Acad Sci USA, 91, 5597-5601.
61. Muzammil S, Ross P, Freire E (2003) A major role for a set of non-active site mutations in the development of HIV-1 protease drug resistance. Biochemis-try, 42, 631-638.
62. Todd MJ, Luque I, Velazquez-Campoy A, Freire E (2000) The thermodynamic basis of resistance to HIV-1 protease inhibition. Calorimetric analysis of the V82F/I84V active site resistant mutant. Biochemistry, 39, 11876-11883.
63. Velazquez-Campoy A, Muzammil S, Ohtaka H, Schon A, Vega S, Freire E (2003) Structural and thermodynamic basis of resistance to HIV-1 protease in-hibition: Implications for inhibitor design. Curr Drug Targets Infect Disord, 3, 311-328.
64. Ohtaka H, Freire E (2005). Adaptive inhibitors of the HIV-1 protease. Prog in Biophysics and Molecular Biology, 88, 193-208.
65. Luque I, Todd MJ, Gomez J, Semo N, Freire E (1998) Molecular basis of resis-tance to HIV-1 protease inhibition: a plausible hypothesis. Biochemistry, 37, 5791-5797.
66. Susnow RG, Dixon SL (2003) Use of robust classification techniques for the prediction of human cytochrome P450 2D6 inhibition. J Chem Inf Comput Sci, 43, 1308-1315.
67. Crivori P, Poggesi I (2006) Computational approaches for predicting CYP-related metabolism properties in the screening of new drugs. Eur J Med Chem, 41, 795-808.
68. Evans WE, Relling MV (1999) Pharmacogenomics: translating functional ge-nomics into rational therapeutics. Science, 286, 487-491.
69. Yap CW, Chen YZ (2005) Prediction of cytochrome P450 3A4, 2D6, and 2C9 inhibitors and substrates by using support vector machines. J Chem Inf Model, 45, 982-992.
70. Bu HZ (2006) A literature review of enzyme kinetic parameters for CYP3A4-mediated metabolic reactions of 113 drugs in human liver microsomes: struc-ture-kinetics relationship assessment. Curr Drug Metab, 7, 231-249.

73
71. Lewis DF, Lake BG, Dickins M (2004) Substrates of human cytochromes P450 from families CYP1 and CYP2: analysis of enzyme selectivity and metabo-lism. Drug Metabol Drug Interact, 20, 111-142.
72. Rodriguez-Antona C, Ingelman-Sundberg M (2006) Cytochrome P450 pharma-cogenetics and cancer. Oncogene, 25, 1679-1691.
73. Haji-Momenian S, Rieger JM, Macdonald TL, Brown ML (2003) Comparative molecular field analysis and QSAR on substrates binding to cytochrome p450 2D6. Bioorg Med Chem, 11, 5545-5554.
74. Bachmann KA, Ring BJ, Wrighton SA (2003) Drug-drug interactions and the cytochrome P450. In Drug metabolizing enzymes: Cytochrome P450 and other enzymes in drug discovery and development (Fisher M, Lee J, and Obach S eds) pp. 311-336, FontisMedia, Lausanne, Switzerland.
75. Arimoto R (2006) Computational models for predicting interactions with cyto-chrome p450 enzyme. Curr Top Med Chem, 6, 1609-1618.
76. Obach RS, Walsky RL, Venkatakrishnan K, Gaman EA, Houston JB, Tremaine LM (2006) The utility of in vitro cytochrome P450 inhibition data in the pre-diction of drug-drug interactions. J Pharmacol Exp Ther, 316, 336-348.
77. Haining RL, Yu A (2003) Cytochrome P450 pharmacogenetics. In Drug me-tabolizing enzymes: Cytochrome P450 and other enzymes in drug discovery and development (Fisher M, Lee J, and Obach S eds) pp. 375-415, FontisMe-dia, Lausanne, Switzerland.
78. Lill MA, Dobler M, Vedani A (2006) Prediction of small-molecule binding to cytochrome P450 3A4: flexible docking combined with multidimensional QSAR. ChemMedChem, 1, 73-81.
79. Pelkonen O, Mäenpää J, Taavitsainen P, Rautio A, Raunio H (1998) Inhibition and induction of human cytochrome P450 (CYP) enzymes. Xenobiotica, 28, 1203-1253.
80. Kleyn PW, Vesell ES (1998) Genetic variation as a guide to drug development. Science, 281, 1820-1821.
81. Jalaie M, Arimoto R, Gifford E, Schefzick S, Waller CL (2004) Prediction of drug-like molecular properties. Modeling cytochrome P450 interactions. Methods Mol Biol, 275, 449-520.
82. Ekins S, Stresser DM, Williams JA (2003) In vitro and pharmacophore insights into CYP3A enzymes. Trends Pharmacol Sci, 24, 161-166.
83. Palczewski K, Kumasaka T, Hori T, Behnke CA, Motoshima H, Fox BA, Le Trong I, Teller DC, Okada T, Stenkamp RE, Yamamoto M, Miyano M (2000) Crystal structure of rhodopsin: A G protein-coupled receptor. Science, 289, 739-745.
84. Horn F, Bettler E, Oliveira L, Campagne F, Cohen FE, Vriend G (2003) GPCRDB information system for G protein-coupled receptors. Nucleic Acids Res, 31, 294-297.
85. Foord SM, Bonner TI, Neubig RR, Rosser EM, Pin JP, Davenport AP, Spedding M, Harmar AJ (2005) International Union of Pharmacology. XLVI. G protein-coupled receptor list. Pharmacol Rev, 57, 279-288.
86. Venter JC et al (2001) The sequence of the human genome. Science, 291, 1304-1351.
87. Iiri T, Farfel Z, Bourne HR (1998) G-protein diseases furnish a model for the turn-on switch. Nature, 394, 35-38.
88. Civelli O (2005) GPCR deorphanizations: the novel, the known and the unex-pected transmitters. Trends Pharmacol Sci, 26, 15-19.
89. Cherezov V, Rosenbaum DM, Hanson MA, Rasmussen SG, Thian FS, Kobilka TS, Choi HJ, Kuhn P, Weis WI, Kobilka BK, Stevens RC (2007) High-
74
resolution crystal structure of an engineered human beta2-adrenergic G protein coupled receptor. Science, 318, 1258-1265.
90. Wikberg JES (2001) Melanocortin receptors: new opportunities in drug discov-ery. Exp Opin Ther Patents, 11, 61-76.
91. Wikberg JES, Mutulis F, Mutule I, Veiksina S, Lapinsh M, Petrovska R, Prusis P (2003) Melanocortin receptors: ligands and proteochemometrics modeling. Ann N Y Acad Sci, 994, 21-26.
92. Wikberg JE, Mutulis F (2008) Targeting melanocortin receptors: an approach to treat weight disorders and sexual dysfunction. Nat Rev Drug Discov, 7, 307-323.
93. Wikberg JE. (1999) Melanocortin receptors: perspectives for novel drugs. Eur J Pharmacol, 375, (1-3) 295-310.
94. Nickolls SA, Cismowski MI, Wang X, Wolff M, Conlon PJ, Maki RA (2003) Molecular determinants of melanocortin 4 receptor ligand binding and MC4/MC3 receptor selectivity. J Pharmacol Exp Ther, 304, 1217-1227.
95. Buydens LMC, Reijmers TH, Beckers MLM, Wehrens R (1999) Molecular data-mining: a challenge for chemometrics. Chem Intel Lab Syst, 49, 121-133.
96. Witten IH, Frank E (2005) Data mining. Practical machine learning tools and techniques. 2nd ed. (Gray J ed). Elsevier.
97. Terfloth L (2003) Drug design. In Chemoinformatics (Gasteiger J, Engel T eds.) pp. 487–618. Weinheim: Wiley-VCH.
98. Hastie T, Tibshirani RJ, Friedman J (2001) The elements of statistical learning. Springer, New York.
99. Wold S, Esbensen K, Geladi P (1987) Principal Component Analysis. Chem Int Lab Syst, 2, 37-52.
100. Sharma S (1995) Principal component analysis. In Applied Multivariate Tech-niques. pp. 58-89, Wiley Har/Dsk ed.
101. Howe TJ, Mahieu G, Marichal P, Tabruyn T, Vugts P (2007) Data reduction and representation in drug discovery. Drug Discov Today, 12, 45-53.
102. Todeschini R and Consonni V (2000) Handbook of Molecular Descriptors (In the series of Methods and Principles in Medicinal Chemistry - Volume 11 (Mannhold R, Kubinyi H, Timmerman H eds.) Wiley - VCH.
103. Gabrielsson J, Lindberg N-O, Lundstedt T (2002) Multivariate methods in pharmaceutical applications. J Chemom, 16, 141-160.
104. Geladi P, Kowalski BR (1986) Partial least-squares regression: A tutorial. Anal Chim Acta, 185, 1-17.
105. Wold S, Johansson E, Cocchi M (1993) 3D QSAR in drug design, theory, methods, and applications. pp. 523-550, (Kubinyi H ed.) ESCOM Science Publishers, Leiden.
106. Eriksson L, Johansson E, Kettaneh-Wold N, Wold S (2001) Multi- and mega-variate data analysis - principles and applications. Umetrics AB. ISBN 91-973730-1-X.
107. Edman M, Jarhede T, Sjöström M, Wieslander Å (1999) Different sequence patterns in signal peptides from mycoplasmas, other gram-positive bacteria, and Echerichia coli: A multivariate data analysis. Proteins, 35, 195-205.
108. Pawlak Z (1982) Rough sets. Int J Inform Comp Science, 11, 341-356. 109. Øhrn A, Komorowski J, Skowron A, Synak P (1998) The design and imple-
mentation of a knowledge discovery toolkit based on rough sets: The ROSETTA system. In Rough Sets in Knowledge Discovery Methodology and Applications. Physica-Verlag, Heidelberg, Germany, (Polkowski and Skowron eds.), pp. 376-399.

75
110. Øhrn A, Komorowski J, Skowron A, Synak P (1998). The ROSETTA software system. In Rough Sets in Knowledge Discovery 2: Applications, Case Studies and Software Systems. Physica-Verlag, Heidelberg, Germany. (Polkowski and Skowron eds.), pp. 572-576.
111. Komorowski J, Øhrn A, Skowron A (2002) The ROSETTA Rough set software system. In Handbook of Data Mining and Knowledge Discovery. (Klösgen W, Zytkow J eds.), Oxford University Press. pp. 554-559.
112. Komorowski J, Øhrn A (1999) Modelling prognostic power of cardiac tests using rough sets. Artificial Intelligence in Medicine, 15, 167-191.
113. Øhrn A, Rowland T (2000) Rough sets: A knowledge discovery technique for multi-factorial medical outcomes. Am J Phys Med Rehabil, 79, 100-108.
114. Hvidsten TR, Komorowski J, Sandvik AK, Laegreid A (2001) Predicting gene function from gene expressions and ontologies. Pac Symp Biocomput, 299-310.
115. Makosa E (2005) Rule tuning. (Master’s thesis). The Linnaeus Centre for Bio-informatics, Uppsala University, Uppsala, Sweden.
116. Komorowski J, Pawlak Z, Polkowski L, Skowron A (1999) Rough sets: A tutorial. In Rough Fuzzy Hybridization: A New Trend in Decicion-Making. (Pal SK, Skowron A eds.), Springer. pp. 3-98.
117. Strombergsson H, Prusis P, Midelfart H, Lapinsh M, Wikberg JE, Komorowski J (2006) Rough set-based proteochemometrics modeling of G-protein-coupled receptor-ligand interactions. Proteins, 63, 24-34.
118. Topliss JG, Edwards RP (1979) Chance factors in studies of quantitative struc-ture-activity relationships. J Med Chem, 22, 1238-1244.
119. Clark M, Cramer RD (1993) The probability of chance correlation using partial least squares (PLS). Quant Struct-Act Relat, 12, 137-145.
120. Efron B (1983) Estimating the error rate of a prediction rule: Improvement on cross-validation. J Am Stat Assoc, 78, 316-331.
121. Osten DW (1988) Selection of optimal regression models via cross-validation. J Chemom, 2, 39.
122. Freyhult E, Prusis P, Lapinsh M, Wikberg JE, Moulton V, Gustafsson MG (2005) Unbiased descriptor and parameter selection confirms the potential of proteochemometric modelling. BMC Bioinformatics, 6:50.
123. Lindgren F, Hansen B, Karcher W, Sjöström M, Eriksson L (1996) Model validation by permutation tests: applications to variable selection. J Chemom, 10, 521-532.
124. Hanley JA, McNeil BJ (1982) The meaning and use of the area under a receiver operating characteristic (ROC) curve. Radiology, 143, 29-36.
125. Gasteiger J, Engel T (2003) Chemoinformatics. A textbook. Wiley-VCH, ISBN: 978-3-527-30681-7.
126. Cruciani G, Mannhold R, Kubinyi H, Folkers G (2005) Molecular Interaction Fields: Applications in Drug Discovery and ADME Prediction. Wiley-VCH, ISBN: 978-3-527-31087-6.
127. Cruciani G, Pastor M, Guba W (2000) VolSurf: a new tool for the pharmacoki-netic optimization of lead compounds. Eur J Pharm Sci, Suppl 2, S29-S39.
128. Pastor M, Cruciani G, McLay I, Pickett S, Clementi S (2000) Grid-Independent Descriptors (GRIND): a novel class of alignment-independent three dimen-sional molecular descriptors. J Med Chem, 43, 323-3243.
129. Fontaine F, Pastor M, Sanz F (2004) Incorporating molecular shape into the alignment-free GRid-INdependent Descriptors. J Med Chem, 47, 2805-2825.
130. Dayhoff MO, Schwartz RM, Orcutt BC (1978) A model of evolutionary change in proteins. Atlas of protein sequence and structure 1978, 345-352.
76
131. Johnson MS, Overington JP (1993) A structural basis for sequence compari-sons. An evaluation of scoring methodologies. J Mol Biol, 233, 716-738.
132. Müller T, Spang R, Vingron M (2002) Estimating amino acid substitution models: a comparison of Dayhoff's estimator, the resolvent approach and a maximum likelihood method. Mol Biol Evol, 19, 8-13.
133. Crooks GE, Brenner SE (2005) An alternative model of amino acid replace-ment. Bioinformatics, 21, 975-980.
134. Sandberg M, Eriksson L, Jonsson J, Sjöström M, Wold S (1998) New chemical descriptors relevant for the design of biologically active peptides. A multivari-ate characterization of 87 amino acids. J Med Chem, 41, 2481-2491.
135. Cruciani G, Baroni M, Carosati E, Clementi M, Valigi R, Clementi S (2004) Peptide studies by means of principal properties of amino acids derived from MIF descriptors. J Chemom, 18, 146-155.
136. Rudnicki WR, Komorowski J (2004) Feature synthesis and extraction for the construction of generalized properties of amino acids. In Proc. 4th international conference on rough sets and current trends in computing, RSCTC 2004. pp. 786-791. (Tsumoto S et al. eds.), Springer, ISBN 3-540-22117-4.
137. Wold S, Jonsson J, Sjöström M, Sandberg M, Rännar S (1993) DNA and pep-tide sequences and chemical processes multivariately modelled by principal component analysis and partial least squares projections to latent structures. Anal Chim Acta, 277, 239-253.
138. Böhm H-J, Schneider G, Mannhold R, Kubinyi H, Folkers G (2003) Protein-Ligand Interactions: From Molecular Recognition to Drug Design. Wiley-VCH. ISBN-10: 3527305211.
139. Kitchen DB, Decornez H, Furr JR, Bajorath J (2004) Docking and scoring in virtual screening for drug discovery: methods and applications. Nat Rev Drug Discov, 3, 935-949.
140. Ortiz AR, Gomez-Puertas P, Leo-Macias A, Lopez-Romero P, Lopez-Viñas E, Morreale A, Murcia M, Wang K (2006) Computational approaches to model ligand selectivity in drug design. Curr Top Med Chem, 6, 41-55.
141. Leach AR, Shoichet BK, Peishoff CE (2006) Prediction of protein-ligand inter-actions. Docking and scoring: successes and gaps. J Med Chem, 49, 5851-5855.
142. Gasteiger J (2005) Chemoinformatics: a new field with a long tradition. Anal Bioanal Chem. DOI 10.1007/s00216-005-0065-y.
143. Hansch C, Fujita T (1964) A method for the correlation of biological activity and chemical structure. J Am Chem Soc. 86, 1616-1626.
144. Akamatsu M (2002) Current state and perspectives of 3D-QSAR. Curr Top Med Chem, 2, 1381-1394.
145. Kolossov E, Stanforth R (2007) The quality of QSAR models: problems and solutions. SAR and QSAR in Env Res, 18, 89-100.
146. Schneider G, Böhm H-J. (2002) Virtual screening and fast automated docking methods. Drug Discov Technol, 7, 64-70.
147. Evers A, Hessler G, Matter H, Klabunde T (2005) Virtual screening of biogenic amine-binding G-protein coupled receptors: comparative evaluation of pro-tein- and ligand-based virtual screening protocols. J Med Chem, 48, 5448-5465.
148. Lapinsh M, Prusis P, Gutcaits A, Lundstedt T, Wikberg JE (2001) Develop-ment of proteo-chemometrics: a novel technology for the analysis of drug-receptor interactions. Biochim Biophys Acta, 1525, 180-190.
77
149. Lapinsh M, Prusis P, Lundstedt T, Wikberg JE (2002) Proteochemometrics modeling of the interaction of amine G-protein coupled receptors with a di-verse set of ligands. Mol Pharmacol, 61, 1465-1475.
150. Lapinsh M, Prusis P, Mutule I, Mutulis F, Wikberg JE (2003) QSAR and pro-teochemometric analysis of the interaction of a series of organic compounds with melanocortin receptor subtypes. J Med Chem, 46, 2572-2579.
151. Lapinsh M, Prusis P, Petrovska R, Uhlen S, Mutule I, Veiksina S, Wikberg JE (2007) Proteochemometric modeling reveals the interaction site for Trp9 modified alpha-MSH peptides in melanocortin receptors. Proteins, 67, 653-660.
152. Lapinsh M, Prusis P, Uhlen S, Wikberg JE (2005) Improved approach for pro-teochemometrics modeling: Application to organic compound-amine G pro-tein-coupled receptor interactions. Bioinformatics, 21, 4289-4296
153. Lapinsh M, Veiksina S, Uhlen S, Petrovska R, Mutule I, Mutulis F, Yahorava S, Prusis P, Wikberg JE (2005) Proteochemometric mapping of the interaction of organic compounds with melanocortin receptor subtypes. Mol Pharmacol, 67, 50-59.
154. Mandrika I, Prusis P, Yahorava S, Shikhagie M, Wikberg JES (2007) Proteo-chemometric modeling of antibody-antigen interactions using SPOT synthe-sised peptide arrays. Protein Eng Des Sel, 6, 301-307.
155. Prusis P, Lundstedt T, Wikberg JE (2002) Proteochemometrics analysis of MSH peptide binding to melanocortin receptors. Protein Eng, 15, 305-311.
156. Prusis P, Uhlen S, Petrovska R, Lapinsh M, Wikberg JE (2006) Prediction of indirect interactions in proteins. BMC Bioinformatics, 22, 167.
157. Strombergsson H, Kryshtafovych A, Prusis P, Fidelis K, Wikberg JE, Ko-morowski J, Hvidsten TR (2006) Generalized modeling of enzyme-ligand in-teractions using proteochemometrics and local protein substructures. Proteins, 65, 568-579.
158. Wikberg JES, Lapinsh M, Prusis P (2004). Proteochemometrics: A tool for modeling the molecular interaction space. In Chemogenomics in Drug Dis-covery – A Medicinal Chemistry Perspective, (Kubinyi H, Muller G eds.), pp. 289-309, Weinheim, Wiley-VCH.
159. Nakano Y, Oshima T, Watanabe M, Matsuura H, Kajiyama G, Kambe M (1997) Angiotensin I-converting enzyme gene polymorphism and acute re-sponse to captopril in essential hypertension. Am J Hypertens. 10, 1064-1068.
160. Martinez FD, Graves PE, Baldini M, Solomon S, Erickson R (1997) Associa-tion between genetic polymorphisms of the beta2-adrenoceptor and response to albuterol in children with and without a history of wheezing. J Clin Invest, 100, 3184-3188.
161. Salzano FM (2000) Permanence or change? The meaning of genetic variation. Proc Natl Acad Sci USA, 97, 5317-5321.
162. Morphy R, Rankovic Z (2007) Fragments, network biology and designing mul-tiple ligands. Drug Discov Today, 12, 156-160.
Acta Universitatis UpsaliensisDigital Comprehensive Summaries of Uppsala Dissertationsfrom the Faculty of Science and Technology 444
Editor: The Dean of the Faculty of Science and Technology
A doctoral dissertation from the Faculty of Science andTechnology, Uppsala University, is usually a summary of anumber of papers. A few copies of the complete dissertationare kept at major Swedish research libraries, while thesummary alone is distributed internationally through theseries Digital Comprehensive Summaries of UppsalaDissertations from the Faculty of Science and Technology.(Prior to January, 2005, the series was published under thetitle “Comprehensive Summaries of Uppsala Dissertationsfrom the Faculty of Science and Technology”.)
Distribution: publications.uu.seurn:nbn:se:uu:diva-8916
ACTA
UNIVERSITATIS
UPSALIENSIS
UPPSALA
2008


![Macromolecules in Biological - [email protected] - African](https://img.pdfslide.net/doc/110x75/620621ba8c2f7b173004c6a2/macromolecules-in-biological-emailprotected-african.jpg)