Embed Size (px)
Citation preview
This content has been downloaded from IOPscience. Please scroll down to see the full text.
Download details:
IP Address: 152.118.24.10
This content was downloaded on 16/02/2017 at 09:53
Please note that terms and conditions apply.
Modelling land use/cover changes with markov-cellular automata in Komering Watershed,
South Sumatera
View the table of contents for this issue, or go to the journal homepage for more
2017 IOP Conf. Ser.: Earth Environ. Sci. 54 012103
(http://iopscience.iop.org/1755-1315/54/1/012103)
Home Search Collections Journals About Contact us My IOPscience
You may also be interested in:
The critical land in Komering watershed as a result of land use changes from 2000-2016 period
E Kusratmoko, S T Dayanti and Supriatna
Surface runoff estimation from various land use in Mapili Watershed using SCS Curve Number and
Geographic Information System
Sri Malahayati Yusuf, David Guluda and Trisumitra Jayanegara
Analysis of Land Cover Change in a Coastal Area using Remotely Sensed Data
I Jaunzeme, M Kainka, M Reiniks et al.
Modelling LULC for the period 2010-2030 using GIS and Remote sensing: a case study of Tikrit, Iraq
Sinan Jasim Hadi, Helmi Z M Shafri and Mustafa D Mahir
Spatial modelling of land use/cover change (LUCC) in South Tangerang City, Banten
K Saifullah, B Barus and E Rustiadi
Land use cover changes and water quality of Cipunten Agung Watershed Banten
Afifa Karima and Regan Leonardus Kaswanto
Temporal and spatial changes of land use and landscape in a coal mining area in Xilingol grassland
Chunzhu Guan, Baolin Zhang, Jiannan Li et al.
Phase transitions in two-dimensional stochastic cellular automata
K Kaneko and Y Akutsu
Forest fires detection in Indonesia using satellite Himawari-8 (case study: Sumatera and Kalimantan
on august-october 2015)
Fatkhuroyan, Trinah Wati and Andersen Panjaitan
Modelling land use/cover changes with markov-cellular
automata in Komering Watershed, South Sumatera
E Kusratmoko*, S D Y Albertus and Supriatna
Magister Program Department of Geography FMIPA Universitas Indonesia Gedung H
Kampus UI Depok, Indonesia
E-mail: [email protected]
Abstract. This research has a purpose to study and develop a model that can representing and
simulating spatial distribution pattern of land use change in Komering watershed. The Komering
watershed is one of nine sub Musi river basin and is located in the southern part of Sumatra
island that has an area of 8060,62 km2. Land use change simulations, achieved through Markov-
cellular automata (CA) methodologies. Slope, elevation, distance from road, distance from river,
distance from capital sub-district, distance from settlement area area were driving factors that
used in this research. Land use prediction result in 2030 also shows decrease of forest acreage
up to -3.37%, agricultural land decreased up to -2.13%, and open land decreased up to -0.13%.
On the other hand settlement area increased up to 0.07% , and plantation land increased up to
5.56%. Based on the predictive result, land use unconformity percentage to RTRW in Komering
watershed is 18.62 % and land use conformity is 58.27%. Based on the results of the scenario,
where forest in protected areas and agriculture land are maintained, shows increase the land use
conformity amounted to 60.41 % and reduce unconformity that occur in Komering watershed to
17.23 %.
1. Introduction
Komering watershed is one sub-basin of nine sub basin in the Musi basin catchment, and in line with
the developments in Komering watershed, the various orders of life is changing rapidly following the
various needs of the community. One impact of these changes is that the pattern of use of natural
resources which are located around the community. In addition to the growth in population and
settlement area will urge the land use/cover pattern in Komering watershed change that is usually
converted from the use of agricultural land to non-agricultural so that erosion and sedimentation is high
enough. The condition of the river and the land area is seen that the upstream Komering watershed has
been impaired or decline of ecosystems and Environment [1]. The setback is particularly indicated
environmental quality include the existence of illegal logging for the area of aquaculture, plantations
and settlement areas do not pay attention to the principles of environmental sustainability and the
turbidity of the water in a river estuary Komering watershed. To prevent such degradation, monitoring
of land use/cover change in Komering watershed is very important. Therefore this study was intended
to employ Geographycal Information System and remote sensing techniques to detect land use/cover
change in Komering watershed between 1990 and 2016, and Markov-cellular automata (CA)
methodologies to simulating land use/cover change in year 2030 using Land Change Modeler tools on
Idrisi Selva software.
1
LISAT IOP PublishingIOP Conf. Series: Earth and Environmental Science 54 (2017) 012103 doi:10.1088/1755-1315/54/1/012103
International Conference on Recent Trends in Physics 2016 (ICRTP2016) IOP PublishingJournal of Physics: Conference Series 755 (2016) 011001 doi:10.1088/1742-6596/755/1/011001
Content from this work may be used under the terms of the Creative Commons Attribution 3.0 licence. Any further distributionof this work must maintain attribution to the author(s) and the title of the work, journal citation and DOI.
Published under licence by IOP Publishing Ltd
2. Method
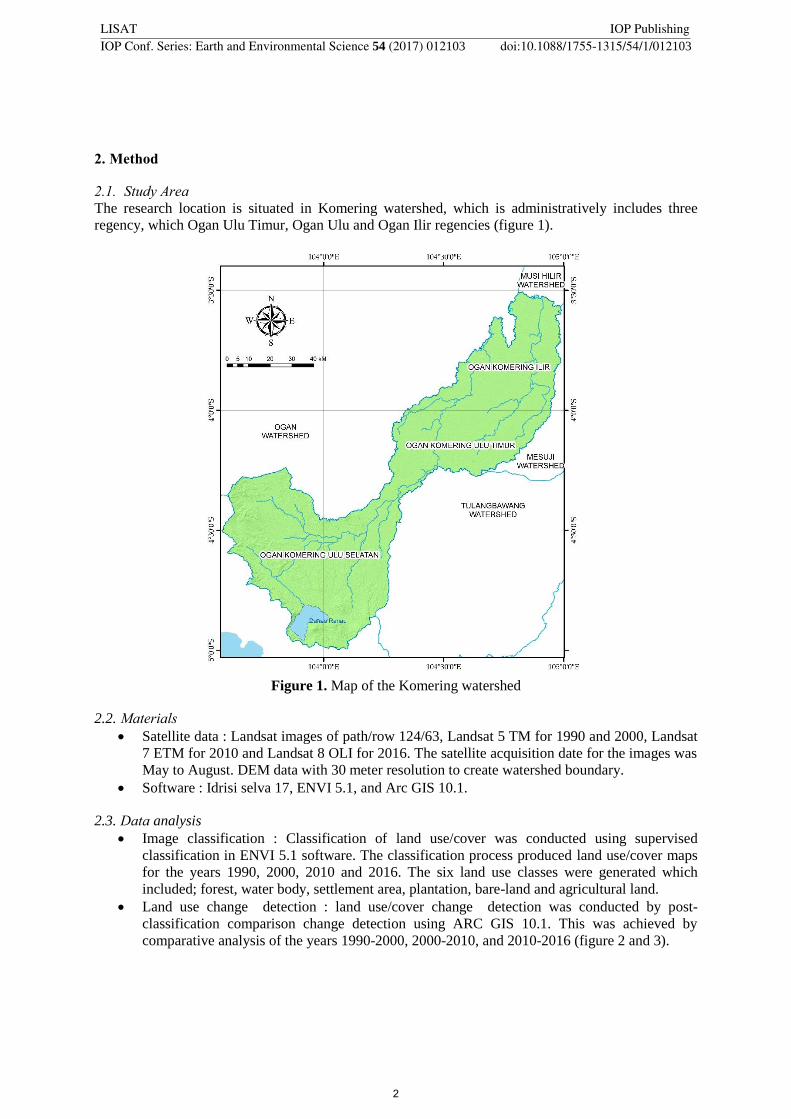
2.1. Study Area
The research location is situated in Komering watershed, which is administratively includes three
regency, which Ogan Ulu Timur, Ogan Ulu and Ogan Ilir regencies (figure 1).
Figure 1. Map of the Komering watershed
2.2. Materials
Satellite data : Landsat images of path/row 124/63, Landsat 5 TM for 1990 and 2000, Landsat
7 ETM for 2010 and Landsat 8 OLI for 2016. The satellite acquisition date for the images was
May to August. DEM data with 30 meter resolution to create watershed boundary.
Software : Idrisi selva 17, ENVI 5.1, and Arc GIS 10.1.
2.3. Data analysis
Image classification : Classification of land use/cover was conducted using supervised
classification in ENVI 5.1 software. The classification process produced land use/cover maps
for the years 1990, 2000, 2010 and 2016. The six land use classes were generated which
included; forest, water body, settlement area, plantation, bare-land and agricultural land.
Land use change detection : land use/cover change detection was conducted by post-
classification comparison change detection using ARC GIS 10.1. This was achieved by
comparative analysis of the years 1990-2000, 2000-2010, and 2010-2016 (figure 2 and 3).
2
LISAT IOP PublishingIOP Conf. Series: Earth and Environmental Science 54 (2017) 012103 doi:10.1088/1755-1315/54/1/012103
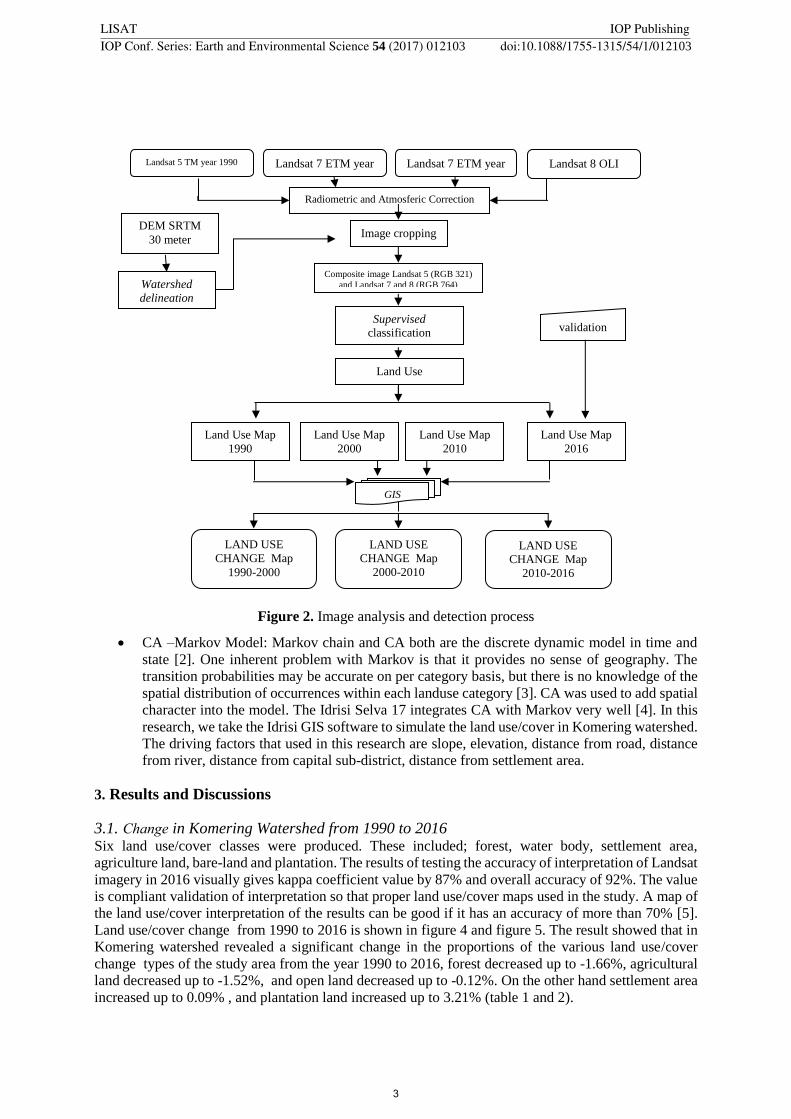
Figure 2. Image analysis and detection process
CA –Markov Model: Markov chain and CA both are the discrete dynamic model in time and
state [2]. One inherent problem with Markov is that it provides no sense of geography. The
transition probabilities may be accurate on per category basis, but there is no knowledge of the
spatial distribution of occurrences within each landuse category [3]. CA was used to add spatial
character into the model. The Idrisi Selva 17 integrates CA with Markov very well [4]. In this
research, we take the Idrisi GIS software to simulate the land use/cover in Komering watershed.
The driving factors that used in this research are slope, elevation, distance from road, distance
from river, distance from capital sub-district, distance from settlement area.
3. Results and Discussions
3.1. Change in Komering Watershed from 1990 to 2016 Six land use/cover classes were produced. These included; forest, water body, settlement area,
agriculture land, bare-land and plantation. The results of testing the accuracy of interpretation of Landsat
imagery in 2016 visually gives kappa coefficient value by 87% and overall accuracy of 92%. The value
is compliant validation of interpretation so that proper land use/cover maps used in the study. A map of
the land use/cover interpretation of the results can be good if it has an accuracy of more than 70% [5].
Land use/cover change from 1990 to 2016 is shown in figure 4 and figure 5. The result showed that in
Komering watershed revealed a significant change in the proportions of the various land use/cover
change types of the study area from the year 1990 to 2016, forest decreased up to -1.66%, agricultural
land decreased up to -1.52%, and open land decreased up to -0.12%. On the other hand settlement area
increased up to 0.09% , and plantation land increased up to 3.21% (table 1 and 2).
LAND USE
CHANGE Map
1990-2000
LAND USE
CHANGE Map
2000-2010
LAND USE
CHANGE Map
2010-2016
Land Use Map
2000
Land Use Map
2010
Land Use Map
2016
GIS
Overlay
Land Use
Classification
Landsat 7 ETM year
2000
Landsat 7 ETM year
2010 Landsat 8 OLI
year 2016
Radiometric and Atmosferic Correction
Image cropping
validation
Composite image Landsat 5 (RGB 321)
and Landsat 7 and 8 (RGB 764)
Supervised
classification
Landsat 5 TM year 1990
Land Use Map
1990
DEM SRTM
30 meter
Watershed
delineation
3
LISAT IOP PublishingIOP Conf. Series: Earth and Environmental Science 54 (2017) 012103 doi:10.1088/1755-1315/54/1/012103
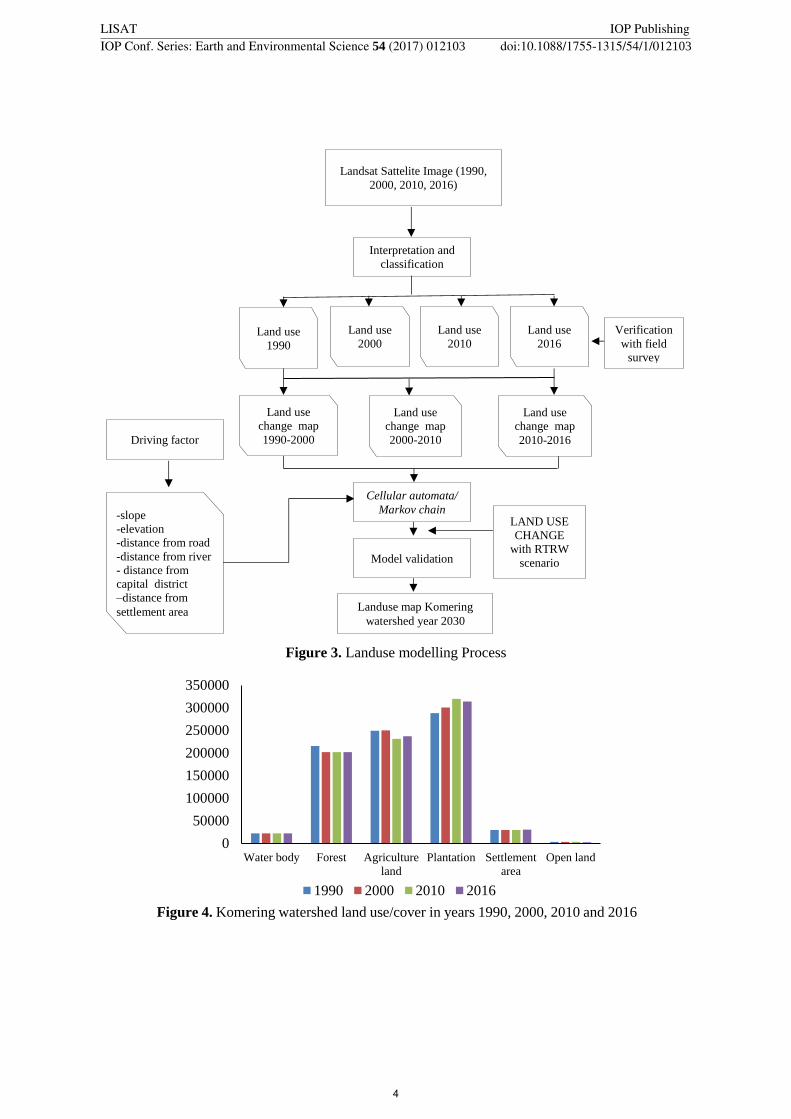
Figure 3. Landuse modelling Process
Figure 4. Komering watershed land use/cover in years 1990, 2000, 2010 and 2016
0
50000
100000
150000
200000
250000
300000
350000
Water body Forest Agriculture
land
Plantation Settlement
area
Open land
1990 2000 2010 2016
Driving factor
-slope
-elevation
-distance from road
-distance from river
- distance from
capital district
–distance from
settlement area
Verification
with field
survey
Landsat Sattelite Image (1990,
2000, 2010, 2016)
Interpretation and
classification
Land use
1990
Land use
2000
Land use
2010
Land use
2016
Land use
change map
1990-2000
Land use
change map
2000-2010
Land use
change map
2010-2016
Cellular automata/
Markov chain
Model validation
Landuse map Komering
watershed year 2030
LAND USE
CHANGE
with RTRW
scenario
4
LISAT IOP PublishingIOP Conf. Series: Earth and Environmental Science 54 (2017) 012103 doi:10.1088/1755-1315/54/1/012103
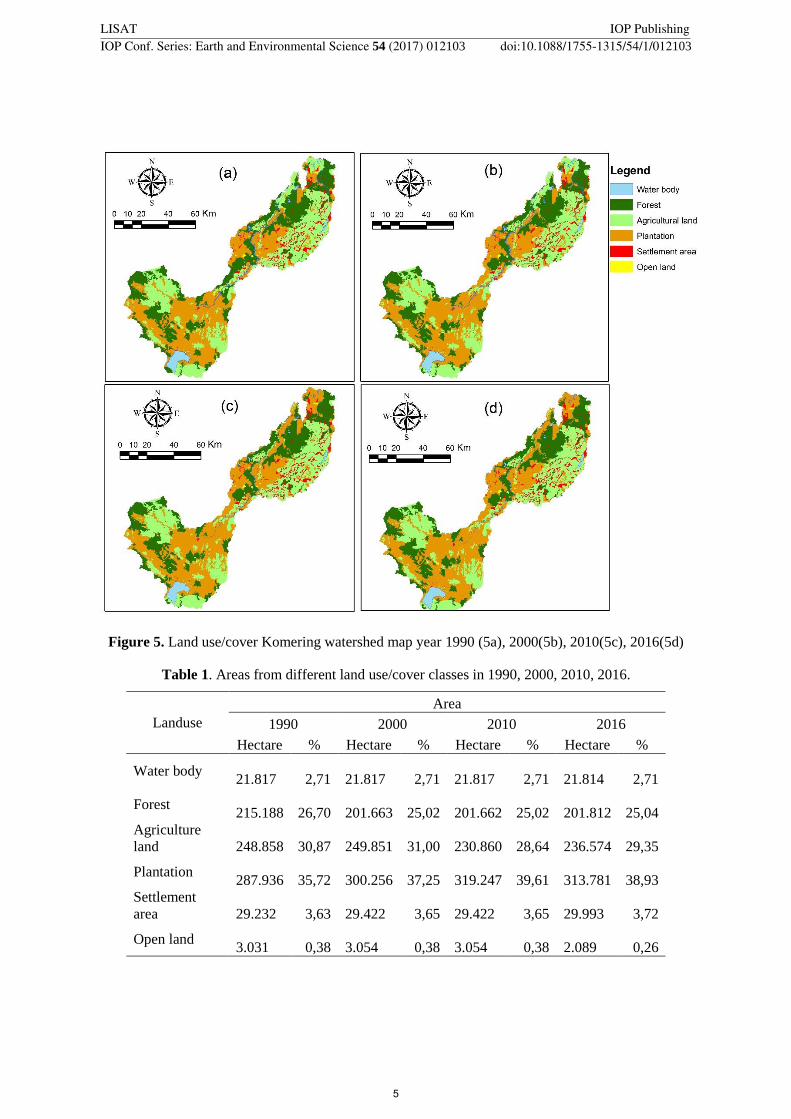
Figure 5. Land use/cover Komering watershed map year 1990 (5a), 2000(5b), 2010(5c), 2016(5d)
Table 1. Areas from different land use/cover classes in 1990, 2000, 2010, 2016.
Landuse
Area
1990 2000 2010 2016
Hectare % Hectare % Hectare % Hectare %
Water body
21.817 2,71
21.817 2,71
21.817 2,71
21.814 2,71
Forest
215.188 26,70
201.663 25,02
201.662 25,02
201.812 25,04
Agriculture
land
248.858 30,87
249.851 31,00
230.860 28,64
236.574 29,35
Plantation
287.936 35,72
300.256 37,25
319.247 39,61
313.781 38,93
Settlement
area
29.232 3,63
29.422 3,65
29.422 3,65
29.993 3,72
Open land
3.031 0,38
3.054 0,38
3.054 0,38
2.089 0,26
5
LISAT IOP PublishingIOP Conf. Series: Earth and Environmental Science 54 (2017) 012103 doi:10.1088/1755-1315/54/1/012103
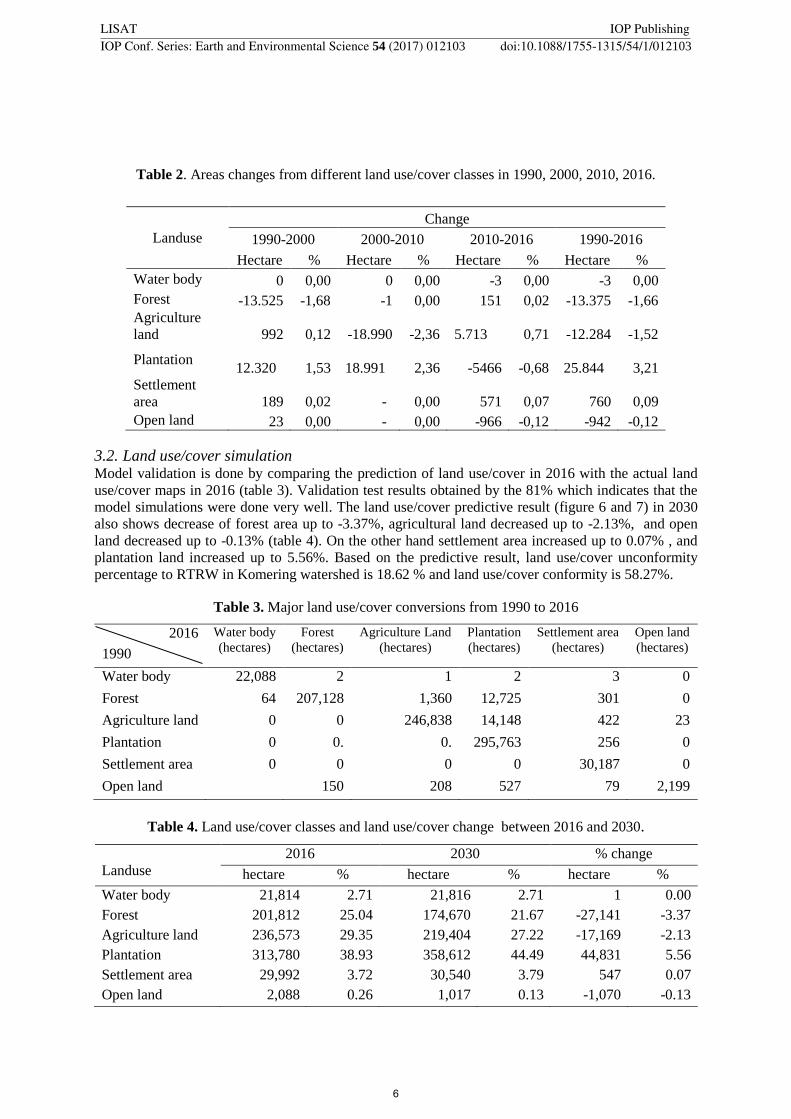
Table 2. Areas changes from different land use/cover classes in 1990, 2000, 2010, 2016.
Landuse
Change
1990-2000 2000-2010 2010-2016 1990-2016
Hectare % Hectare % Hectare % Hectare %
Water body 0 0,00 0 0,00 -3 0,00 -3 0,00
Forest -13.525 -1,68 -1 0,00 151 0,02 -13.375 -1,66
Agriculture
land 992 0,12 -18.990 -2,36
5.713 0,71 -12.284 -1,52
Plantation
12.320 1,53
18.991 2,36 -5466 -0,68
25.844 3,21
Settlement
area 189 0,02 - 0,00 571 0,07 760 0,09
Open land 23 0,00 - 0,00 -966 -0,12 -942 -0,12
3.2. Land use/cover simulation Model validation is done by comparing the prediction of land use/cover in 2016 with the actual land
use/cover maps in 2016 (table 3). Validation test results obtained by the 81% which indicates that the
model simulations were done very well. The land use/cover predictive result (figure 6 and 7) in 2030
also shows decrease of forest area up to -3.37%, agricultural land decreased up to -2.13%, and open
land decreased up to -0.13% (table 4). On the other hand settlement area increased up to 0.07% , and
plantation land increased up to 5.56%. Based on the predictive result, land use/cover unconformity
percentage to RTRW in Komering watershed is 18.62 % and land use/cover conformity is 58.27%.
Table 3. Major land use/cover conversions from 1990 to 2016
2016 Water body
(hectares)
Forest
(hectares)
Agriculture Land
(hectares)
Plantation
(hectares)
Settlement area
(hectares)
Open land
(hectares) 1990
Water body 22,088 2 1 2 3 0
Forest 64 207,128 1,360 12,725 301 0
Agriculture land 0 0 246,838 14,148 422 23
Plantation 0 0. 0. 295,763 256 0
Settlement area 0 0 0 0 30,187 0
Open land 150 208 527 79 2,199
Table 4. Land use/cover classes and land use/cover change between 2016 and 2030.
Landuse
2016 2030 % change
hectare % hectare % hectare %
Water body 21,814 2.71 21,816 2.71 1 0.00
Forest 201,812 25.04 174,670 21.67 -27,141 -3.37
Agriculture land 236,573 29.35 219,404 27.22 -17,169 -2.13
Plantation 313,780 38.93 358,612 44.49 44,831 5.56
Settlement area 29,992 3.72 30,540 3.79 547 0.07
Open land 2,088 0.26 1,017 0.13 -1,070 -0.13
6
LISAT IOP PublishingIOP Conf. Series: Earth and Environmental Science 54 (2017) 012103 doi:10.1088/1755-1315/54/1/012103
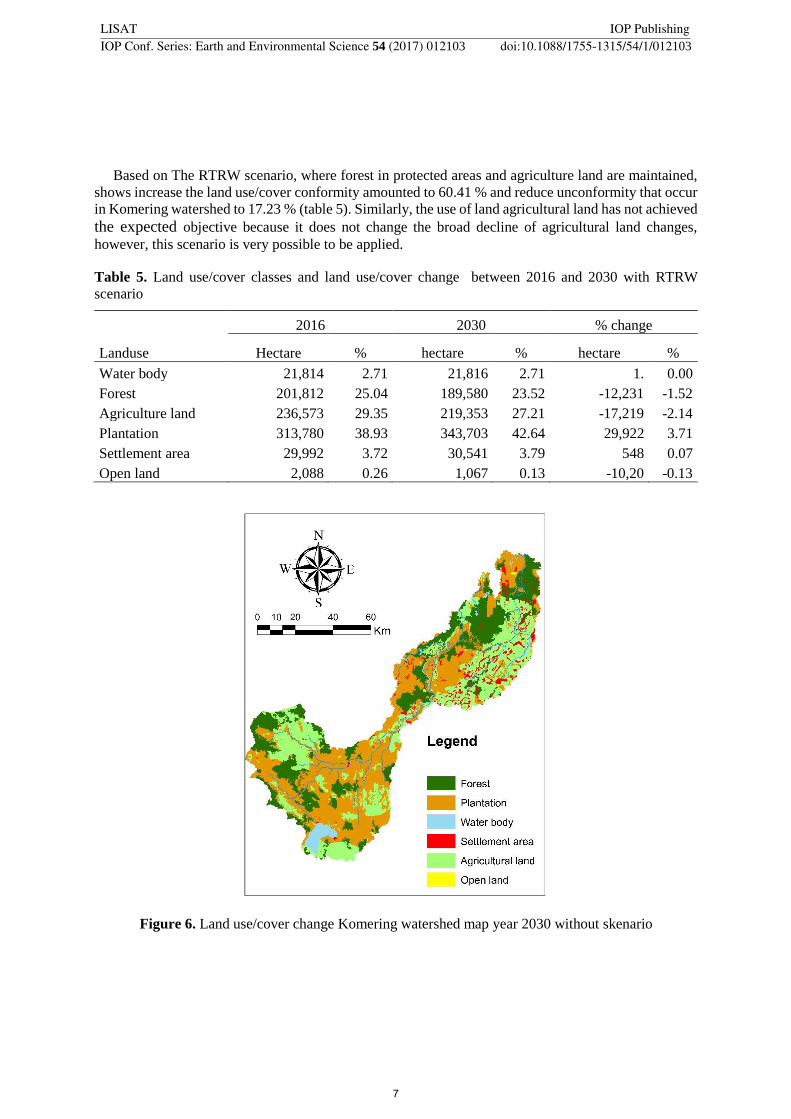
Based on The RTRW scenario, where forest in protected areas and agriculture land are maintained,
shows increase the land use/cover conformity amounted to 60.41 % and reduce unconformity that occur
in Komering watershed to 17.23 % (table 5). Similarly, the use of land agricultural land has not achieved the expected objective because it does not change the broad decline of agricultural land changes,
however, this scenario is very possible to be applied.
Table 5. Land use/cover classes and land use/cover change between 2016 and 2030 with RTRW
scenario
Landuse
2016 2030 % change
Hectare % hectare % hectare %
Water body 21,814 2.71 21,816 2.71 1. 0.00
Forest 201,812 25.04 189,580 23.52 -12,231 -1.52
Agriculture land 236,573 29.35 219,353 27.21 -17,219 -2.14
Plantation 313,780 38.93 343,703 42.64 29,922 3.71
Settlement area 29,992 3.72 30,541 3.79 548 0.07
Open land 2,088 0.26 1,067 0.13 -10,20 -0.13
Figure 6. Land use/cover change Komering watershed map year 2030 without skenario
7
LISAT IOP PublishingIOP Conf. Series: Earth and Environmental Science 54 (2017) 012103 doi:10.1088/1755-1315/54/1/012103
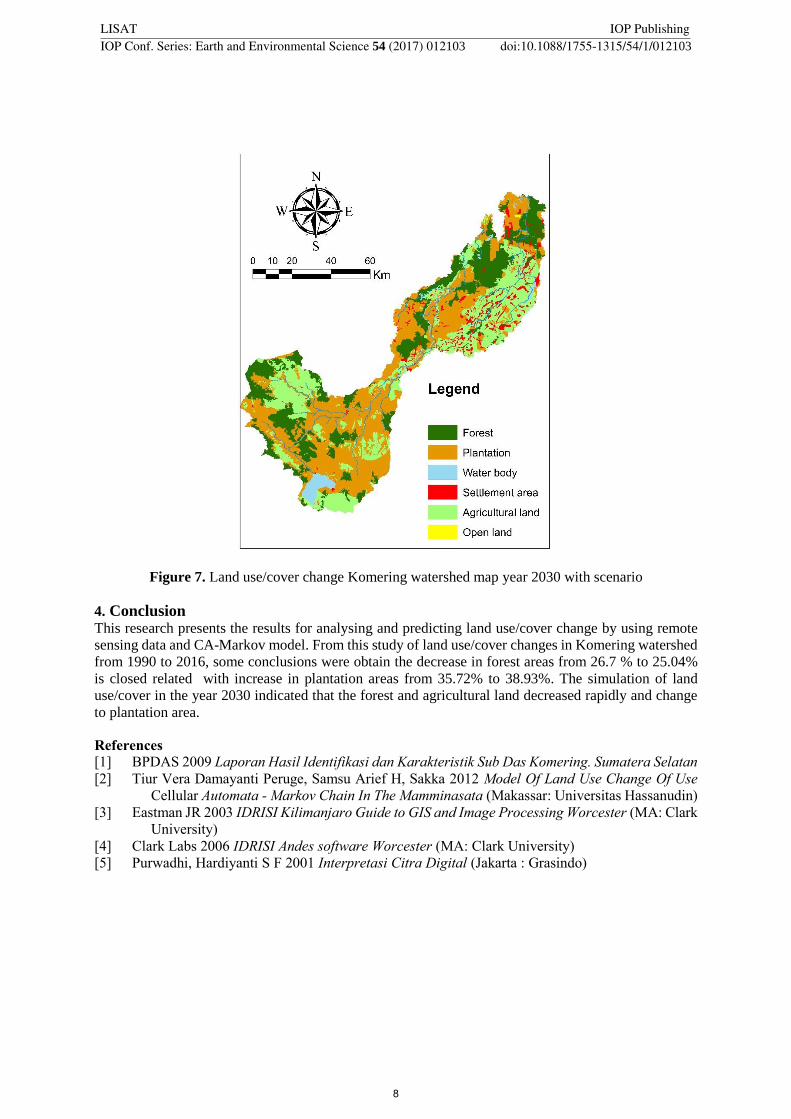
Figure 7. Land use/cover change Komering watershed map year 2030 with scenario
4. Conclusion This research presents the results for analysing and predicting land use/cover change by using remote
sensing data and CA-Markov model. From this study of land use/cover changes in Komering watershed
from 1990 to 2016, some conclusions were obtain the decrease in forest areas from 26.7 % to 25.04%
is closed related with increase in plantation areas from 35.72% to 38.93%. The simulation of land
use/cover in the year 2030 indicated that the forest and agricultural land decreased rapidly and change
to plantation area.
References
[1] BPDAS 2009 Laporan Hasil Identifikasi dan Karakteristik Sub Das Komering. Sumatera Selatan
[2] Tiur Vera Damayanti Peruge, Samsu Arief H, Sakka 2012 Model Of Land Use Change Of Use
Cellular Automata - Markov Chain In The Mamminasata (Makassar: Universitas Hassanudin)
[3] Eastman JR 2003 IDRISI Kilimanjaro Guide to GIS and Image Processing Worcester (MA: Clark
University)
[4] Clark Labs 2006 IDRISI Andes software Worcester (MA: Clark University)
[5] Purwadhi, Hardiyanti S F 2001 Interpretasi Citra Digital (Jakarta : Grasindo)
8
LISAT IOP PublishingIOP Conf. Series: Earth and Environmental Science 54 (2017) 012103 doi:10.1088/1755-1315/54/1/012103