Embed Size (px)
Citation preview
1
Modelling
Molecular Flexibility for
Crystal Structure Prediction
Ogaga Glory Uzoh
14-01-2015
Submitted in partial fulfilment of the requirements for the degree of
Doctor of Engineering
to
University College London
Department of Chemistry
University College London
20 Gordon Street
London
WC1H 0AJ
United Kingdom
Declaration
2
Declaration
I Ogaga Glory Uzoh confirm that the work presented in this thesis is my own Where
information has been derived from other sources I confirm that this has been indicated
in the thesis
_______________
Ogaga Glory Uzoh
January 2015
Abstract
3
Abstract
In the crystal packing of molecules wherein a single bond links aromatic groups a
change in the torsion angle can optimise close packing of the molecule The improved
intermolecular interactions Uinter outweigh the conformational energy penalty Eintra to
give a more stable lattice energy Elatt = Uinter +Eintra This thesis uses this lattice energy
model hierarchically in a new Crystal Structure Prediction (CSP) algorithm
CrystalPredictor version 16 which varies the low-barrier torsion angles at the start of
generating hypothetical crystal structures
The crystal structure of 1-benzyl-1H-tetrazole was successfully predicted in an
informal lsquoblind testrsquo when given the chemical diagram and the number of molecules in
the asymmetric unit cell Then the concept of whether specific molecular fragments
favour polymorphism (ie polymorphophore) was investigated by analysing the crystal
energy landscapes of the monomorphic fenamic acid and the polymorphic derivative
tolfenamic acid The CSP results show that the polymorphophore promotes but does not
guarantee polymorphism and that the substituents on the polymorphophore fragment
decide the relative energies of the crystal structures
Molecular Dynamics (MD) cannot use this lattice energy model because many ab initio
calculations of Eintra on a single molecule are expensive However the examination of
the physical origin of the torsional barrier in fenamates aided the derivation of an
analytical model forEintra This thesis develops codes for fitting analytical
intramolecular force fields to ab initio conformational profiles of fenamates An
intramolecular exp-6 atom-atom term (for the non-bonded repulsion-dispersion
contributions) plus a cosine term (that represents the changes to the Molecular Orbitals)
accurately model the ab initio conformational energy surfaces of fenamic and tolfenamic
acids This thesis provides a first step in extendingEintra data generated from CSP
studies to help MD on condensed phases of pharmaceutical-like organic molecules
Dedication
4
Dedication
I dedicate this thesis to my wife Jodi Uzoh my mother Felicia Uzoh and my father
Emmanuel Uzoh For their endless love support and encouragement
Acknowledgments
5
Acknowledgments
Foremost I would like to thank my supervisor Professor Sally Price for her support
and direction throughout my time at UCL Her encouragement and wise words at the start
of my doctorate program were vital
My sincere gratitude to Louise Price for helping me to understand the practical aspects
of the computational methods of Crystal Structure Prediction (CSP) and for the interesting
and insightful discussions about research and life My colleagues in Room G18 and
friends at UCL made my time there fun inspiring and exciting I would like to thank Rex
Palmer for setting the informal blind test of Chapter 3 and for the subsequent collaborative
paper
Many thanks to the Centre for Doctoral Training in Molecular Modelling and Materials
Science (CDTM3S) at UCL for the rigorous training they gave me during the first year
and the yearly industrial day invitation to present my research The opportunity to work
with sixth form students in the third year sponsored by CDTM3S was one of the most
rewarding experiences I had at UCL
My industrial sponsor Cambridge Crystallographic Data Centre (CCDC) has been
instrumental at every research stage The encouragement received after presenting my
work at the annual CCDC student day was invaluable My industrial supervisors at
CCDCndashndashAurora J Cruz-Cabeza (a year and a half) and Peter Galek (two and a half years)
ndashndashhave been instrumental in collaborative research and publications I appreciate their
insight energy time and encouragement during our many meetings
Finally this work would not be possible without the financial support from the CCDC
and the Engineering and Physical Science Research Council (EPSRC) under the
CDTM3S grant EPG0366751
List of Publications
6
List of Publications
1 Uzoh O G Cruz-Cabeza A J Price S L Is the Fenamate Group a
Polymorphophore Contrasting the Crystal Energy Landscapes of Fenamic and
Tolfenamic Acids Cryst Growth Des 2012 12 (8) 4230-4239
2 Spencer J Patel H Deadman J J Palmer R A Male L Coles S J Uzoh
O G Price S L The Unexpected but Predictable Tetrazole Packing in Flexible
1-Benzyl-1H-Tetrazole CrystEngComm 2012 14 (20) 6441-6446
I carried out all the computational work and prepared the manuscript
3 Uzoh O G Galek P T A Price S L Towards more Accurate Force Fields for
pharmaceutical molecules ndash Analysing the Conformational Energy Profiles of
Fenamates 2014 (Submitted)
Table of Contents
7
Table of Contents
Modelling Molecular Flexibility for Crystal Structure Prediction 1
Declaration 2
Abstract 3
Dedication 4
Acknowledgments 5
List of Publications 6
Table of Contents 7
List of Figures 11
List of Tables 18
List of Abbreviations 20
List of Symbols 21
Chapter 1 Introduction 22
11 Background 22
12 Scope and Outline of Thesis 26
Chapter 2 Theoretical Background 27
21 Overview 27
22 Intermolecular Forces 27
221 Pairwise Additivity 28
222 Physical Origin of Intermolecular Force 29
223 Long-range Interactions 30
224 Short-range Interactions 31
225 Penetration Energy and Charge Transfer 32
23 Modelling the Intermolecular Forces for Organic Molecules 32
231 Repulsion-Dispersion Potentials 33
232 Electrostatics Potential 34
24 Intramolecular Energy 36
25 Force Fields (Atomistic Modelling) 38
251 AMBER 41
252 CHARMM 42
253 Other Force Fields 42
254 The Limits of Current Force Fields 43
Table of Contents
8
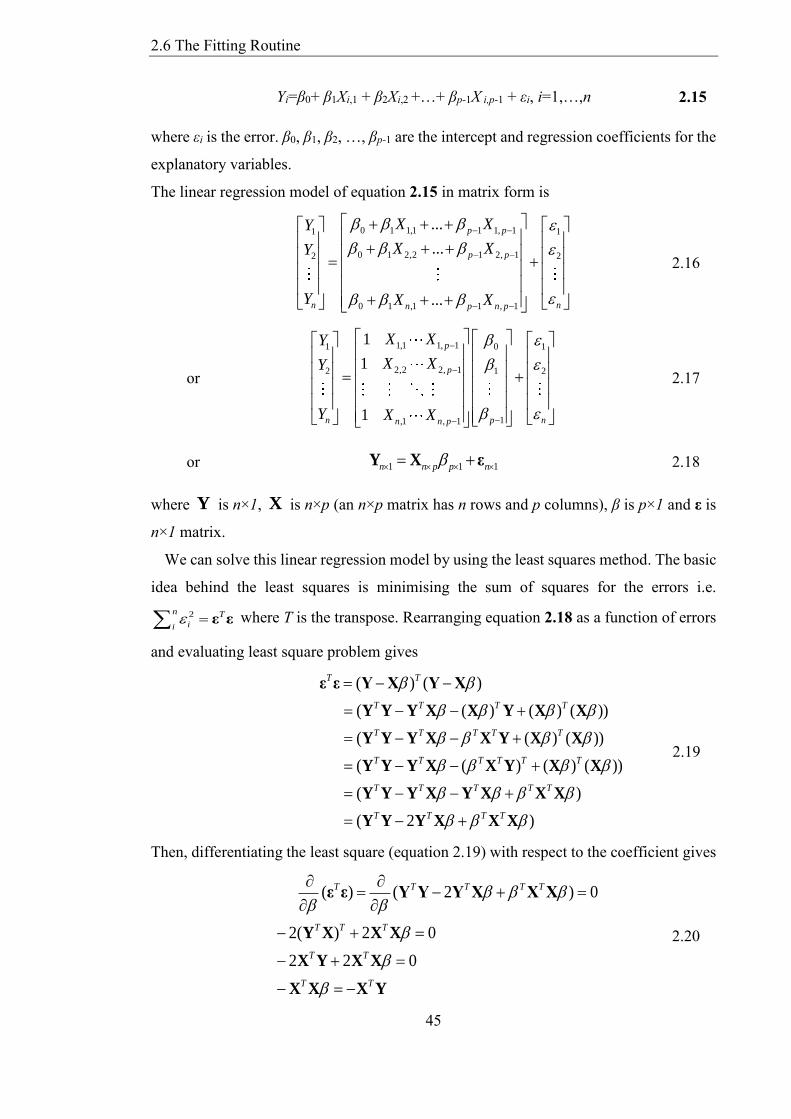
26 The Fitting Routine 44
261 Linear Least Square Method 44
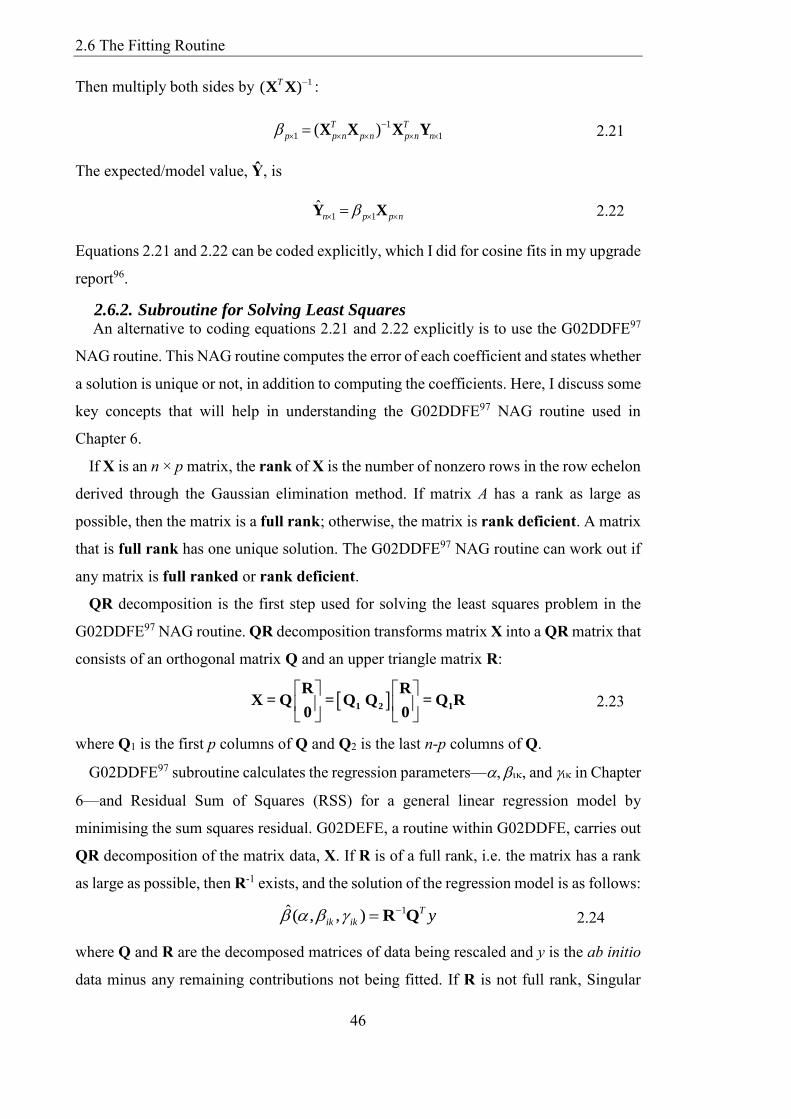
262 Subroutine for Solving Least Squares 46
27 Electronic Structure Methods 47
271 Hartree Fock Theory 48
271 Molecular Orbital Theory 48
272 Correlation Effects 49
273 Moslashller-Plesset Perturbation Theory 49
274 Density Functional Theory 50
275 The DFT-D Approach 51
28 Crystal Structure Prediction (CSP) 52
281 CrystalPredictor 54
282 CrystalOptimizer 55
283 Polarizable Continuum Model (PCM) 56
284 Other Approaches to Lattice Energy Minimisation 56
285 The Crystal Energy Landscapes 58
286 The Blind Tests 58
29 Crystal Structure Comparison 59
Chapter 3 An Informal Blind Test A Crystal Structure Prediction of 1-
Benzyl-1H-tetrazole 62
31 Introduction 62
311 Background 62
312 Experimental Determination of 1-Benzyl-1H-Tetrazole 63
313 Molecular Geometry of the Experimental Structure 63
314 Crystal Packing Weak Hydrogen Bonding 64
315 Overview of the Challenge 65
32 Computational Methodology 66
321 Conformational Analysis 66
322 Crystal Structure Prediction 66
33 Results and Discussion 67
331 Conformational Energy Grid 67
332 The CrystalPredictor Energy Landscape 68
333 The CrystalOptimizer and PCM Energy Landscapes 68
334 Did the Predicted Structure Really Match the Experimental 70
335 The Global Minimum Structure on the PCM Energy Landscape 71
336 Post Analysis Comparison of Structure with CSD 73
Table of Contents
9
34 Summary 76
Chapter 4 Is the fenamate group a polymorphophore Contrasting the crystal
energy landscapes of fenamic and tolfenamic acids 77
41 Introduction 77
411 Polymorphism and Polymorphophores 79
412 Conformations in known Crystal Structures 79
413 Experimental Data of FA and TA 80
414 Similarities between the known forms of FA and TA 83
415 Solving the Connectivity Problem of a Disordered Form 84
416 Overview 87
42 Computational Methods 87
421 Ab initio Conformational Profile of TA 87
422 CSD Survey for Fenamates 87
423 Crystal Structure Prediction 88
424 Experimental Crystal Structures with Z´ gt1 90
425 Comparison of Crystal Structures 90
43 Results 91
431 Dependence of Conformational Energy on Method 91
432 Consideration of H-bonded Torsion 92
433 CSD Survey of Fenamates 93
434 Validation of the CrystalOptimizer plus PCM Models 95
435 Energy Landscapes of Intermediate Steps 96
436 Finding and Explaining the Known Structures with CSP 97
437 Other Known Fenamates and their Hypothetical Structures 103
438 Update on a Recently Discovered Polymorph of TA 105
439 The Cost of Lattice Energy Minimisation 106
44 Summary 107
Chapter 5 The Origin of conformational energy barriers in Fenamates 109
51 Introduction 109
511 Background 109
512 Torsional Barrier for Ethane 110
513 Overview 113
52 Method 114
521 Determining Conformation Energy Scan for Isolated Molecule 114
522 Ab initio Conformational Energy Profiles for Fenamates 114
523 Investigation of Electronic Effects 115
Table of Contents
10
524 Investigation of the Steric (Non-Bonded) Effects 116
53 Results 117
531 Effect of Different Definitions of the Same Flexible Bond 117
532 Effect of Step Size on the Conformation Profile of Fenamate Molecule 119
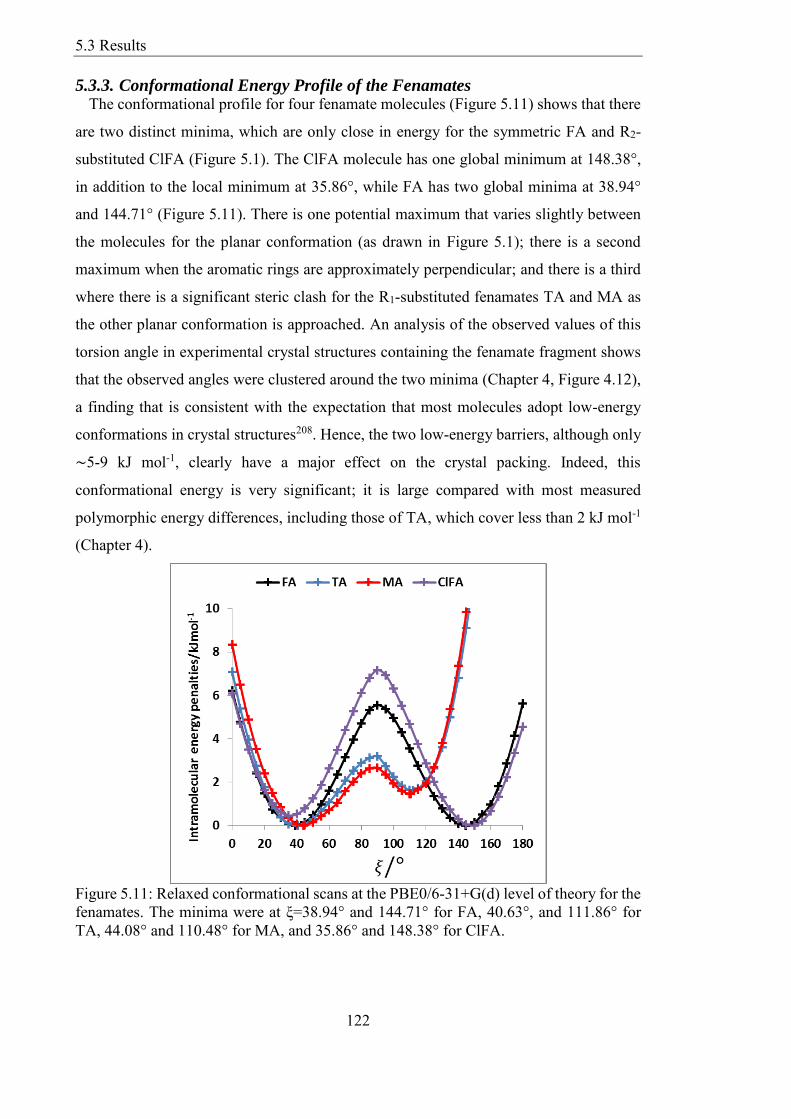
533 Conformational Energy Profile of the Fenamates 122
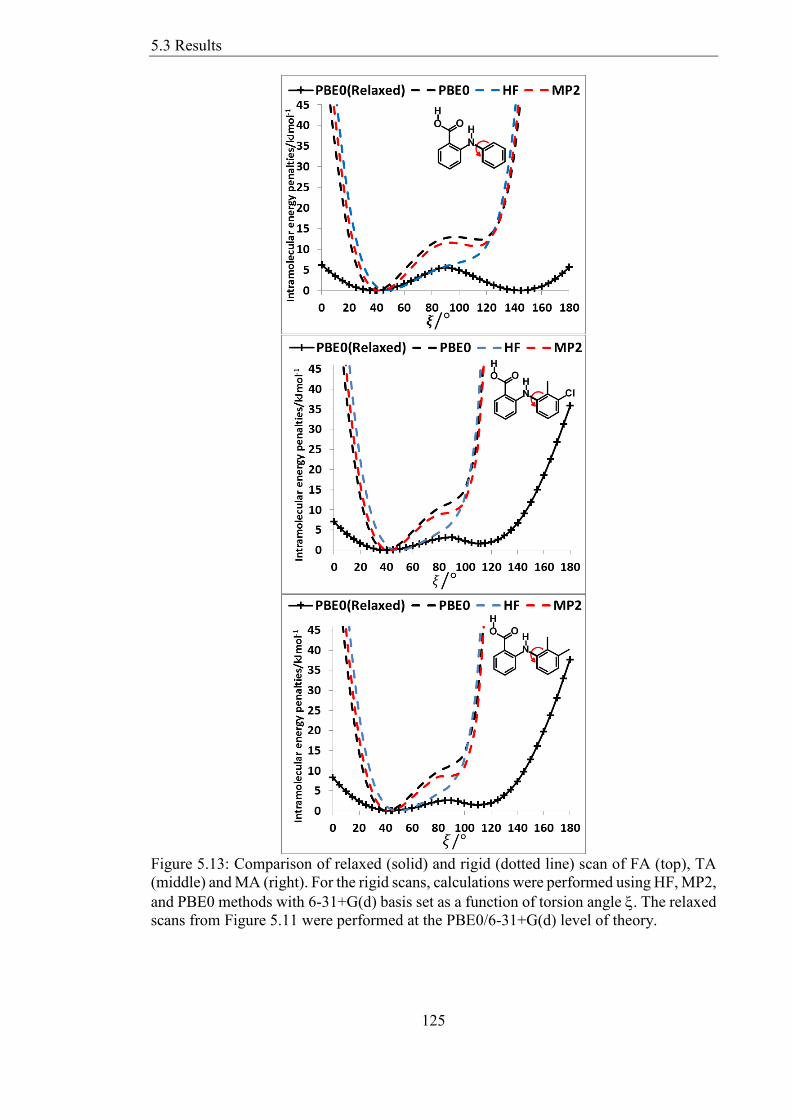
534 Rigid Versus Relaxed Scans of Fenamates 124
535 Splitting electronic from steric contributions to the barrier to rotation 127
536 Estimating the Steric Contributions with an Atom-Atom Potential 130
537 Investigating the Important Interactions with Atom-Atom Potential 131
54 Discussion The Physical Origins of Torsional Potentials 133
55 Summary 134
Chapter 6 Toward New Force fields for Fenamate Molecules 136
61 Introduction 136
611 Background 136
612 A Case for Modelling Decoupled Intramolecular Energy 137
613 Analytical Models of Intramolecular Energies 138
614 Overview 138
62 Methodology Fitting Analytical Models to Conformational Profiles 139
621 Torsional Potential Model 139
622 AtomndashAtom Model 141
63 Results 144
631 Cosine Series Model 144
632 Rescaled Repulsion Model 146
633 Combined Physical Model 149
634 Transferability 154
64 Summary 157
Chapter 7 Conclusions and Future Work 158
71 Position of CSP in the Context of this Thesis 158
72 Towards more accurate force-fields for pharmaceutical molecules 159
73 Future Work 160
Appendix A 162
Contents of enclosed CD-ROM 162
Bibliography 163
List of Figures
11
List of Figures
Figure 11 Diagrammatic illustration of crystal structure prediction (CSP) methodology
23
Figure 12 A chemical diagram of a target molecule XX from the fifth blind test17 24
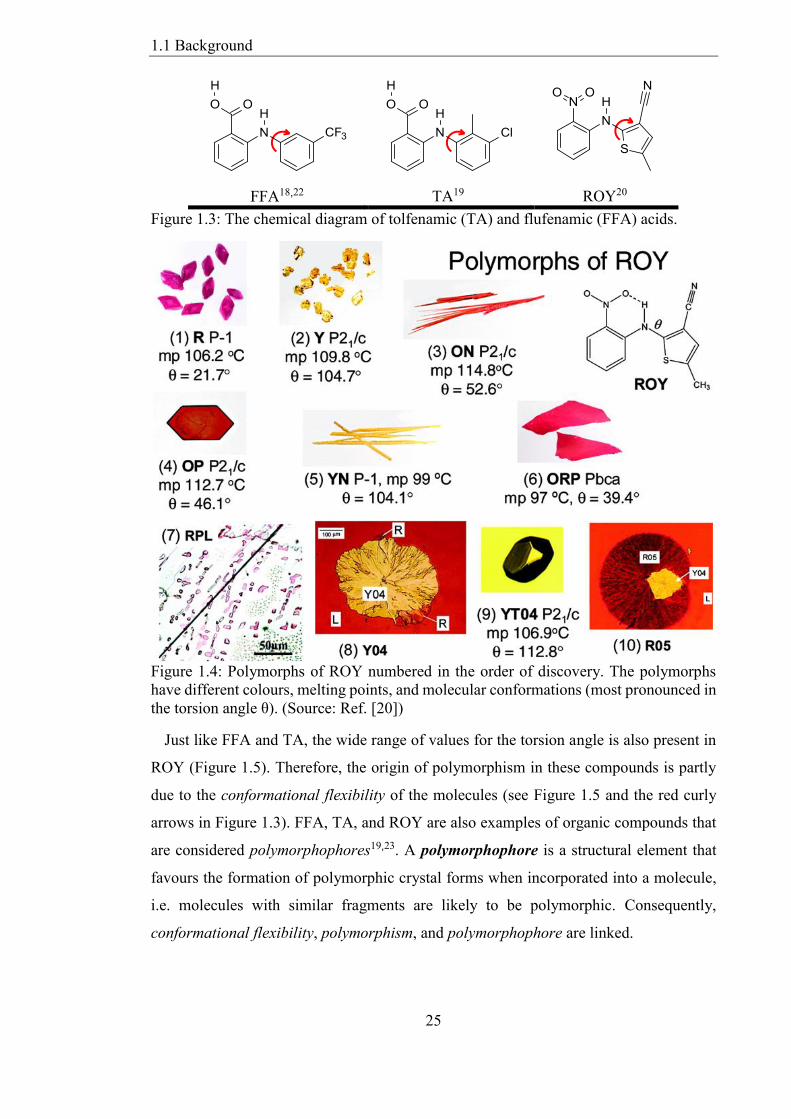
Figure 13 The chemical diagram of tolfenamic (TA) and flufenamic (FFA) acids 25
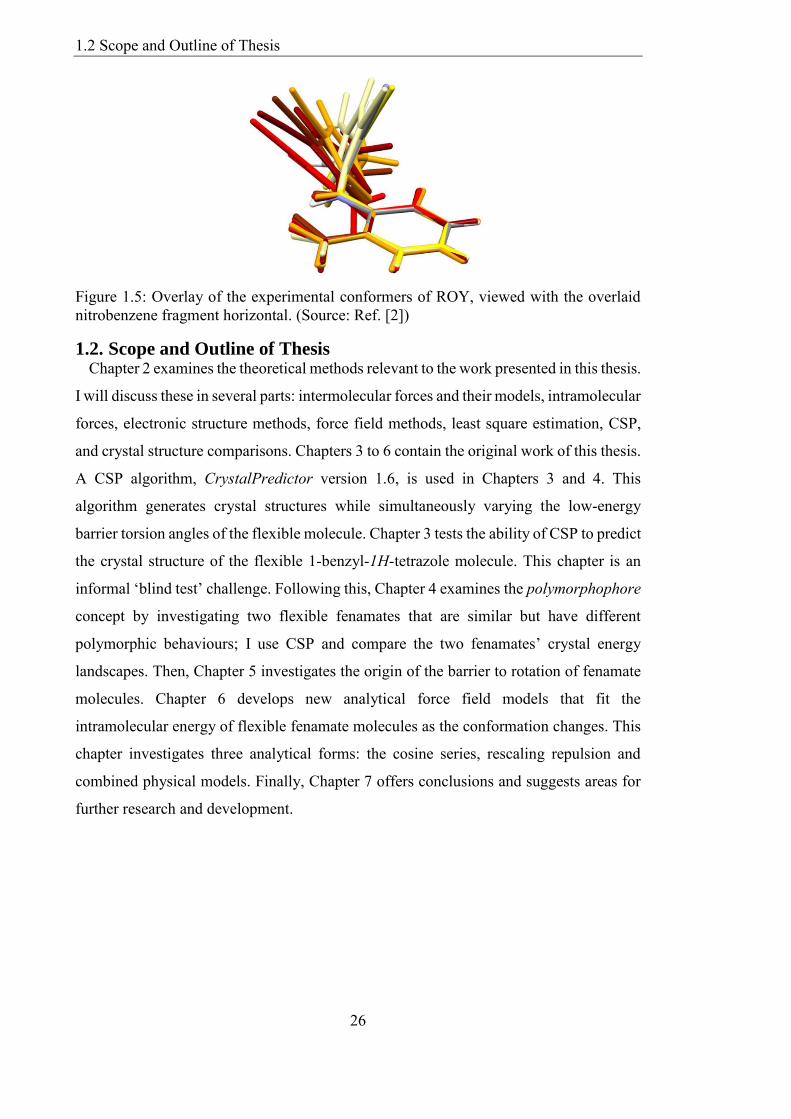
Figure 14 Polymorphs of ROY numbered in the order of discovery The polymorphs
have different colours melting points and molecular conformations (most pronounced in
the torsion angle θ) (Source Ref [20]) 25
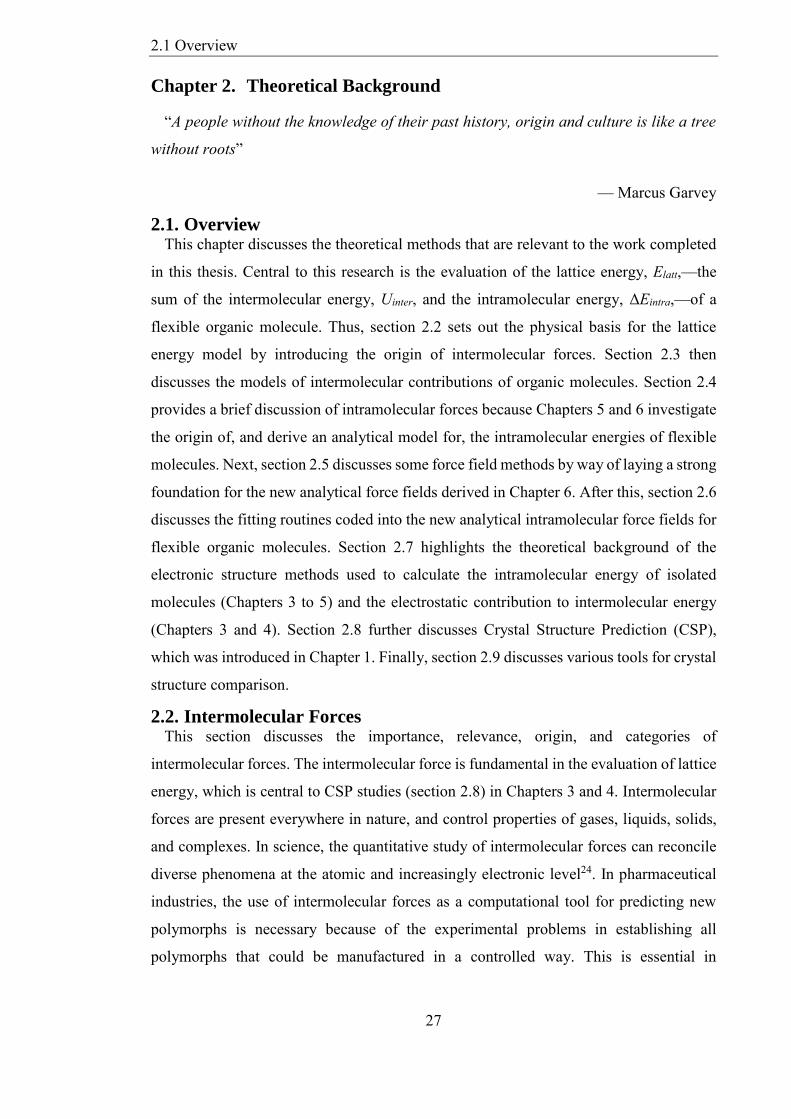
Figure 15 Overlay of the experimental conformers of ROY viewed with the overlaid
nitrobenzene fragment horizontal (Source Ref [2]) 26
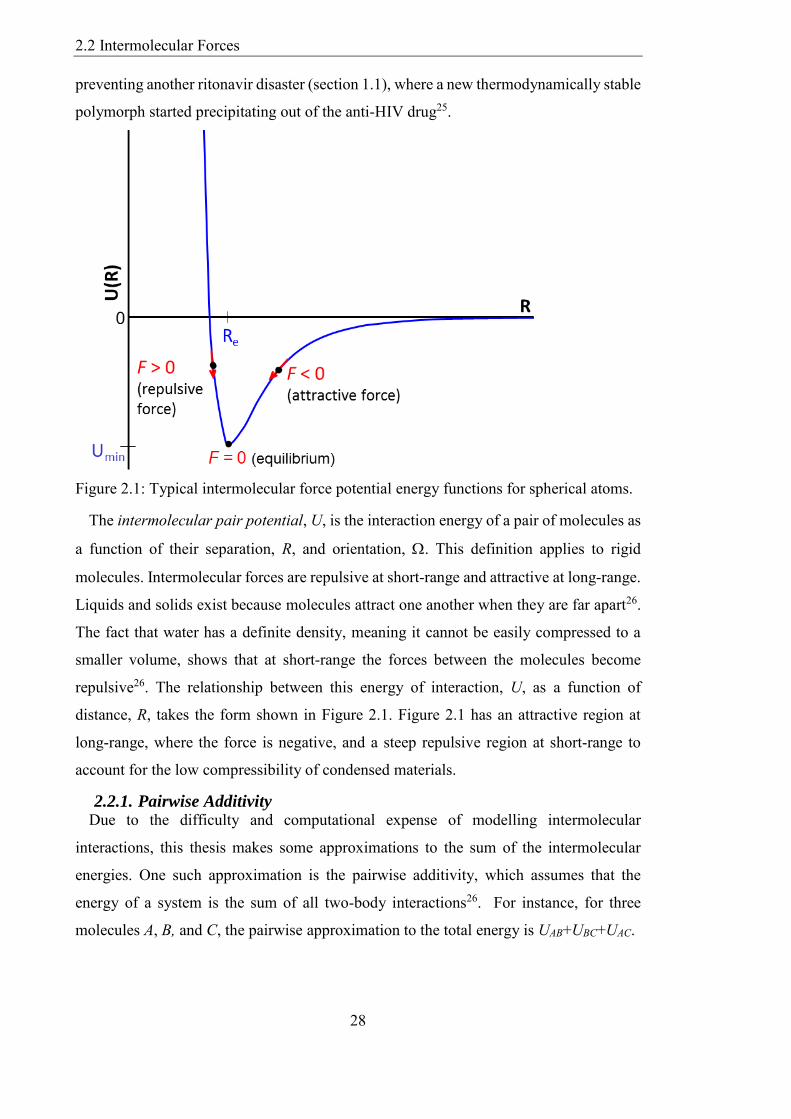
Figure 21 Typical intermolecular force potential energy functions for spherical atoms
28
Figure 22 Charge distributions corresponding to pure multipoles Blue portions
represent regions where the function is positive and yellow portions represents where it
is negative Qlk is the spherical harmonic multipole where l is angular momentum
quantum number and k = l l-1hellip -l specifies the component of the angular momentum
around the z-axis (Source httpenwikipediaorgwikiSpherical_harmonics [Accessed
11012015]) 35
Figure 23 Schematic representation of conformational change and conformational
adjustment (Source Ref [58]) 37
Figure 24 The schematic view of force field interactions Covalent bonds are solid lines
while the dotted line indicates non-bonded interaction (Source Ref [68]) 39
Figure 25 Schematic view of four key contributions to a molecular mechanics force
field These forces are bond stretching bond stretching angle bending torsional terms
and non-bonded interactions (Source Ref [63]) 39
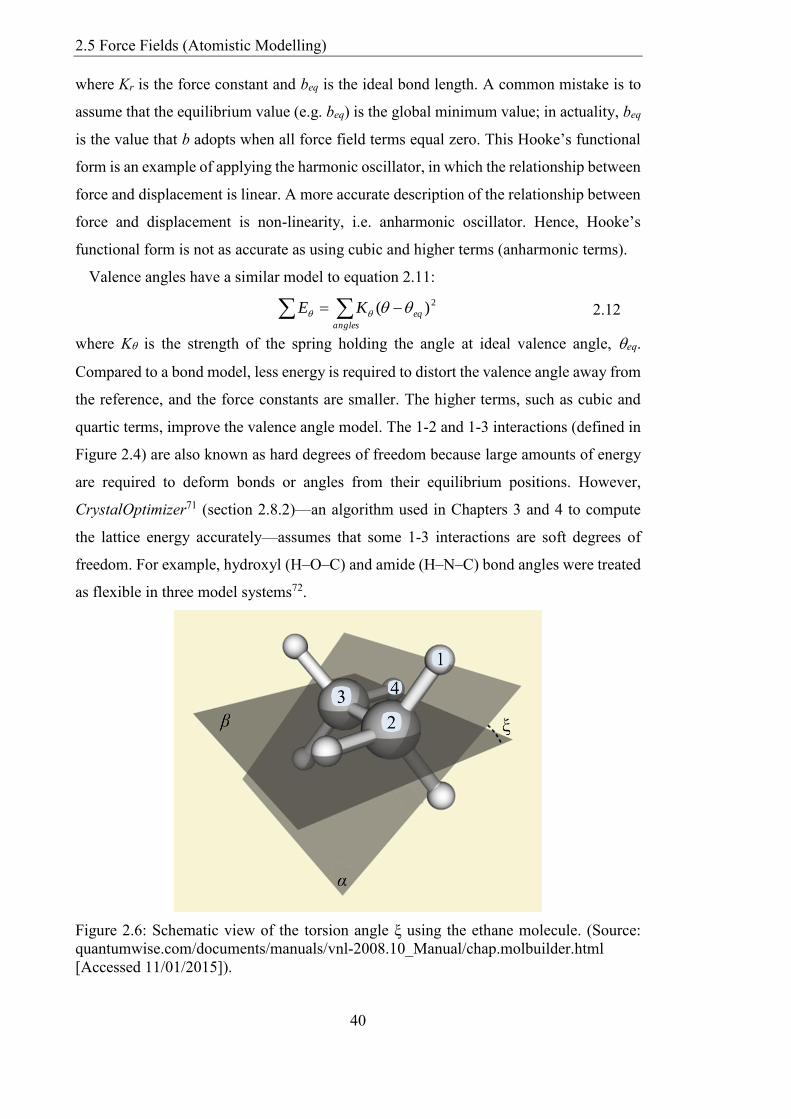
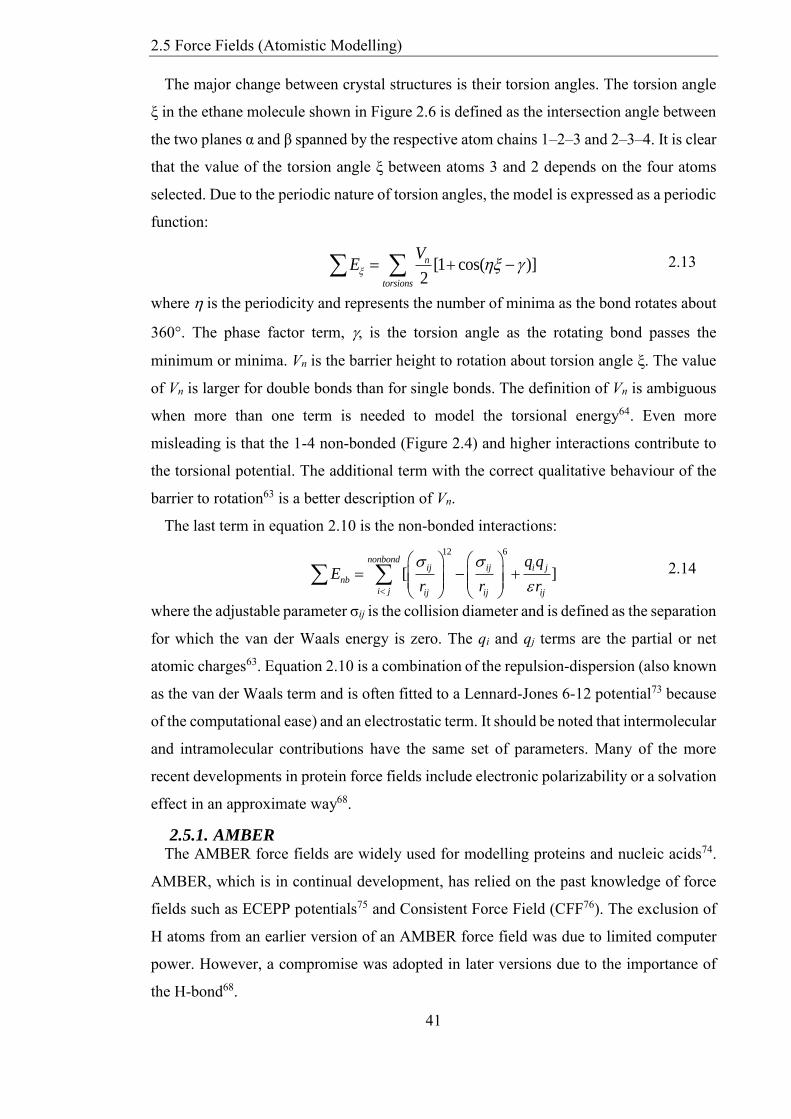
Figure 26 Schematic view of the torsion angle ξ using the ethane molecule (Source
quantumwisecomdocumentsmanualsvnl-200810_Manualchapmolbuilderhtml
[Accessed 11012015]) 40
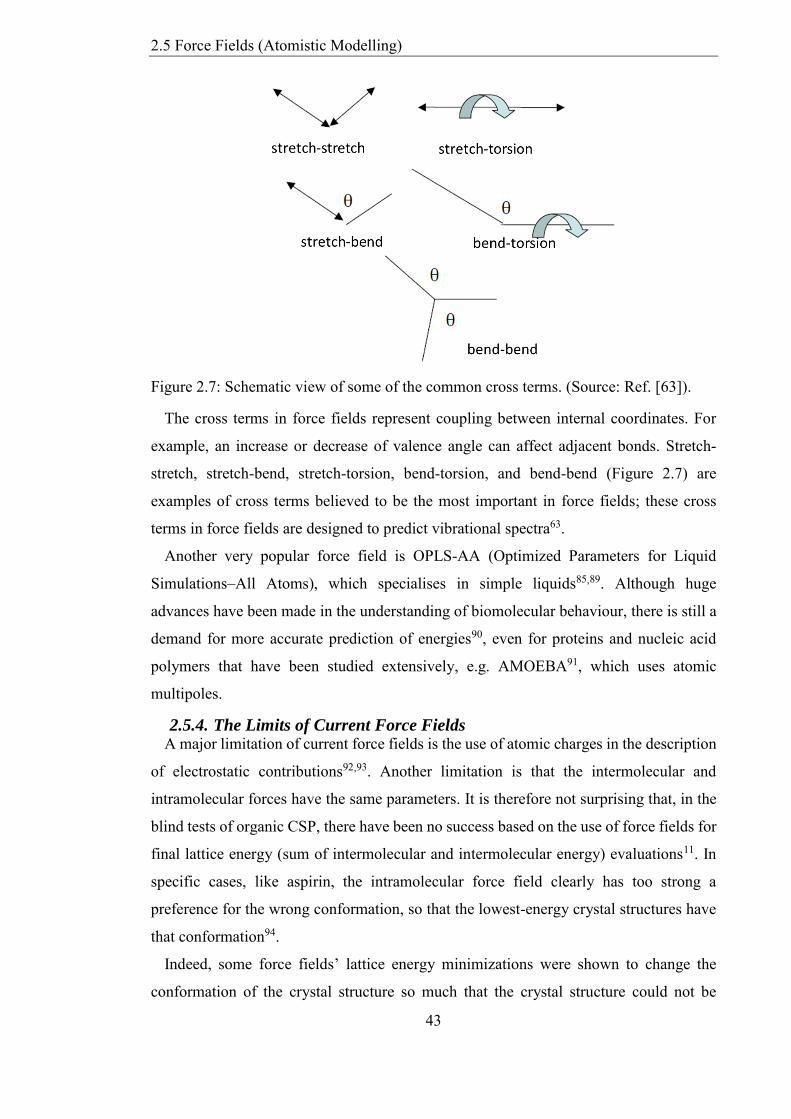
Figure 27 Schematic view of some of the common cross terms (Source Ref [63]) 43
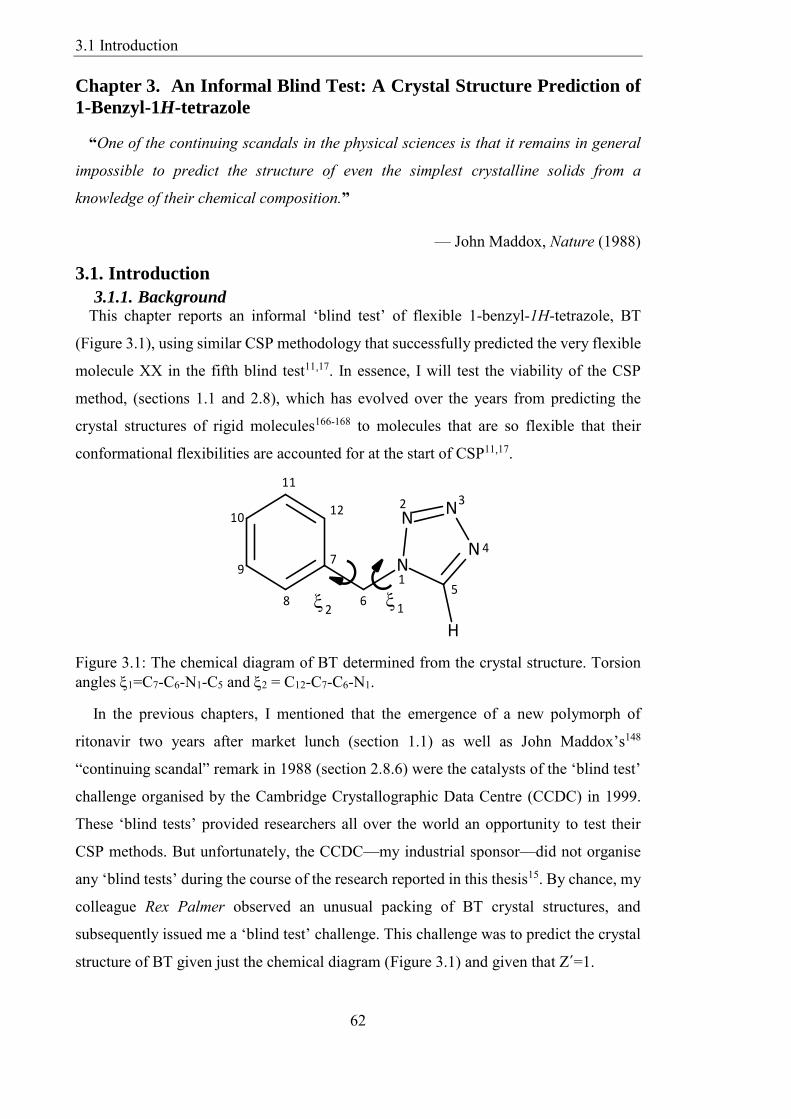
Figure 31 The chemical diagram of BT determined from the crystal structure Torsion
angles 1=C7-C6-N1-C5 and 2 = C12-C7-C6-N1 62
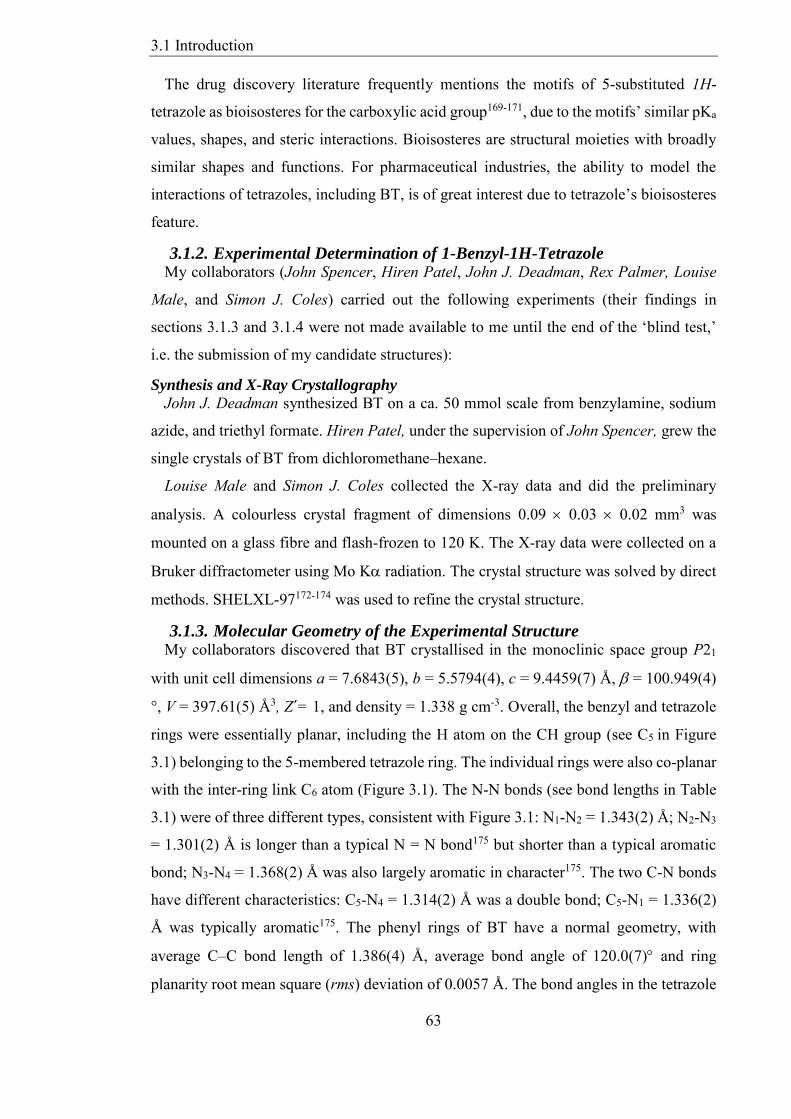
Figure 32 The crystal structure of BT (a) Partial view of the crystal packing showing
close CH∙∙∙N contacts between a central tetrazole and six surrounding tetrazoles (b)
Partial view showing CH∙∙∙N CH∙∙∙C and CH∙∙∙ contacts 64
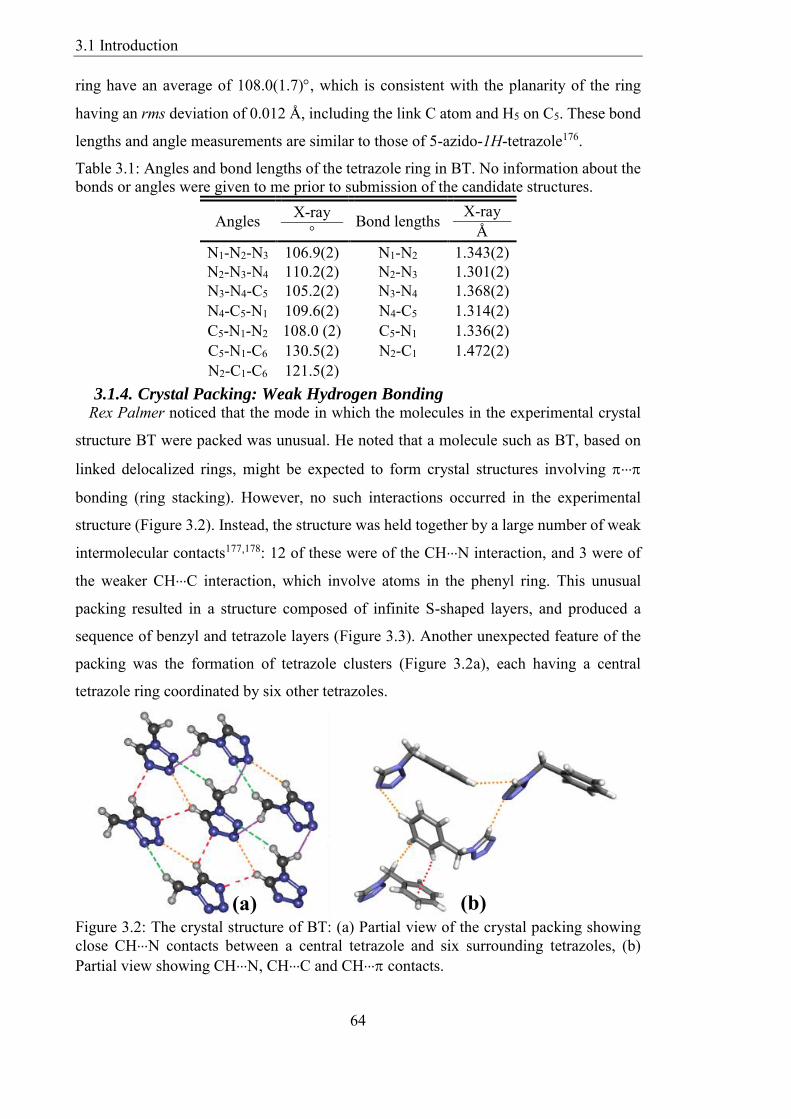
Figure 33 BT crystal structure (a) View of the infinite S-shaped layers held together by
weak CH∙∙∙N and CH∙∙∙C H-bonds (b) Partial view of the layer structure showing
List of Figures
12
alternative B(benzyl) and T(tetrazole) layers and the repeating layer sequence [BTBT |
TBTB] 65
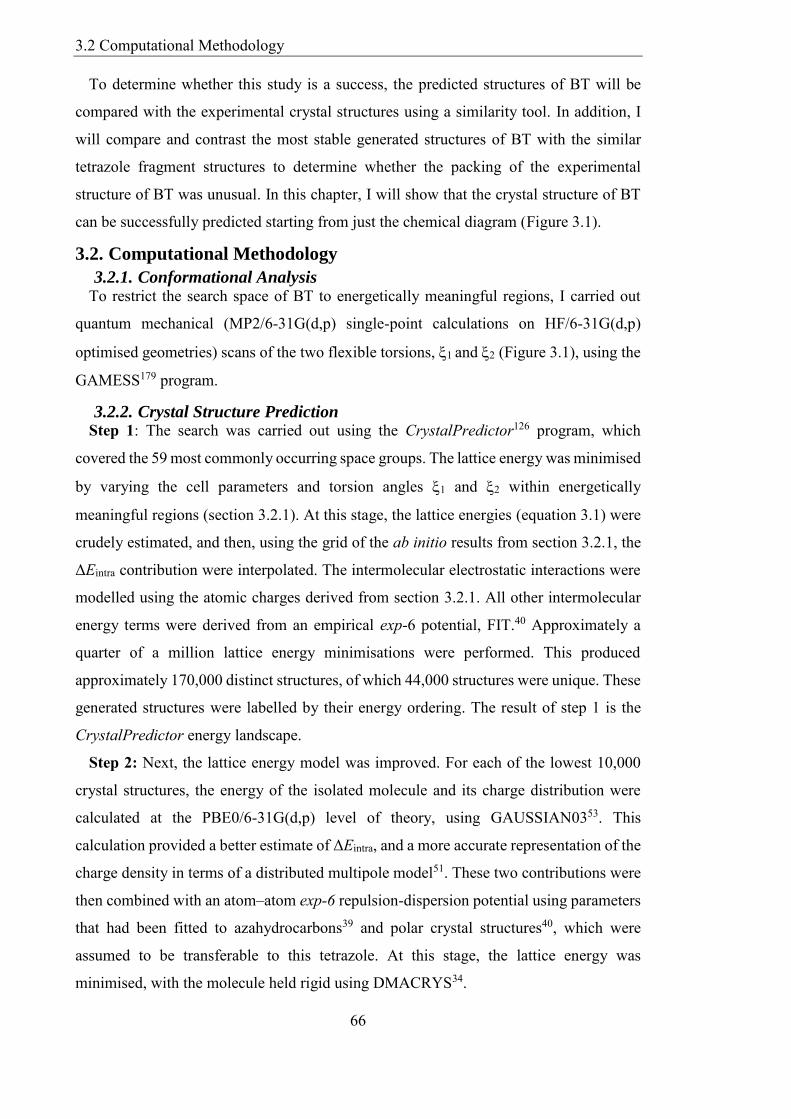
Figure 34 The conformational energy grid used in the search Relative intramolecular
energies ΔEintra (kJ mol-1) for isolated molecule calculations at the MP26-31G(d p)
level of theory 67
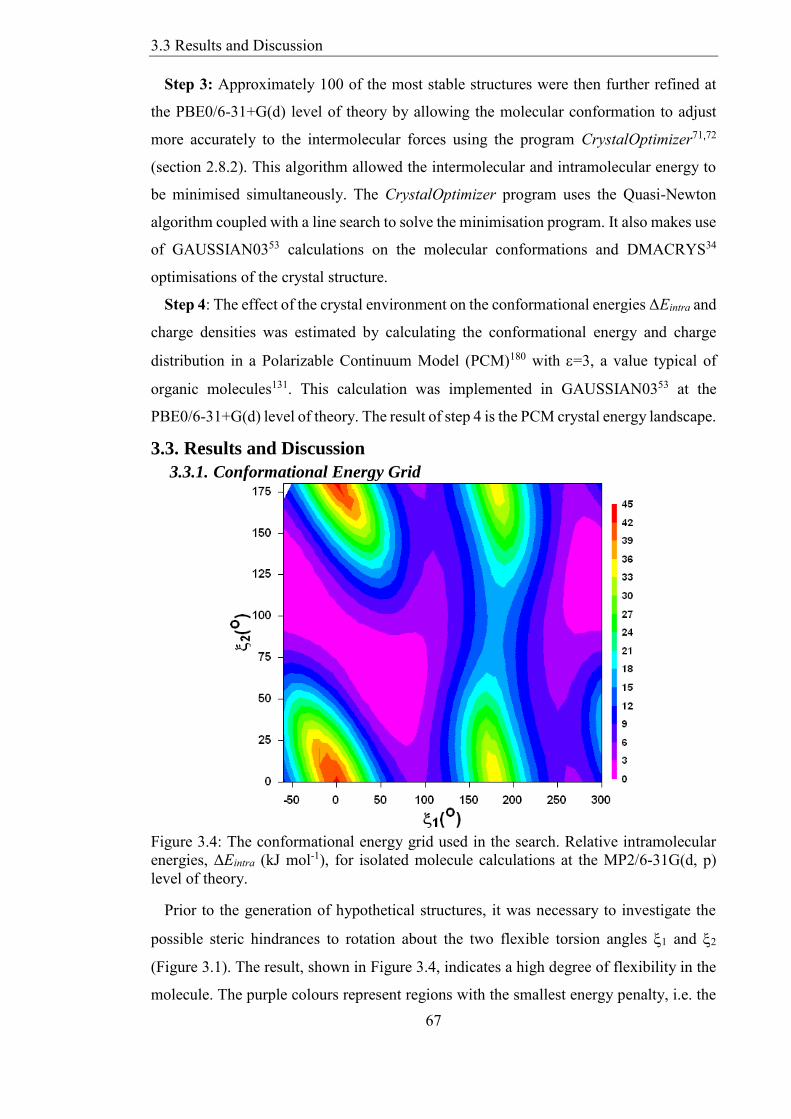
Figure 35 The CrystalPredictor energy landscape of BT generated with a crude lattice
energy model The generated structure that matched the experimental structure is
highlighted in the open red symbol 68
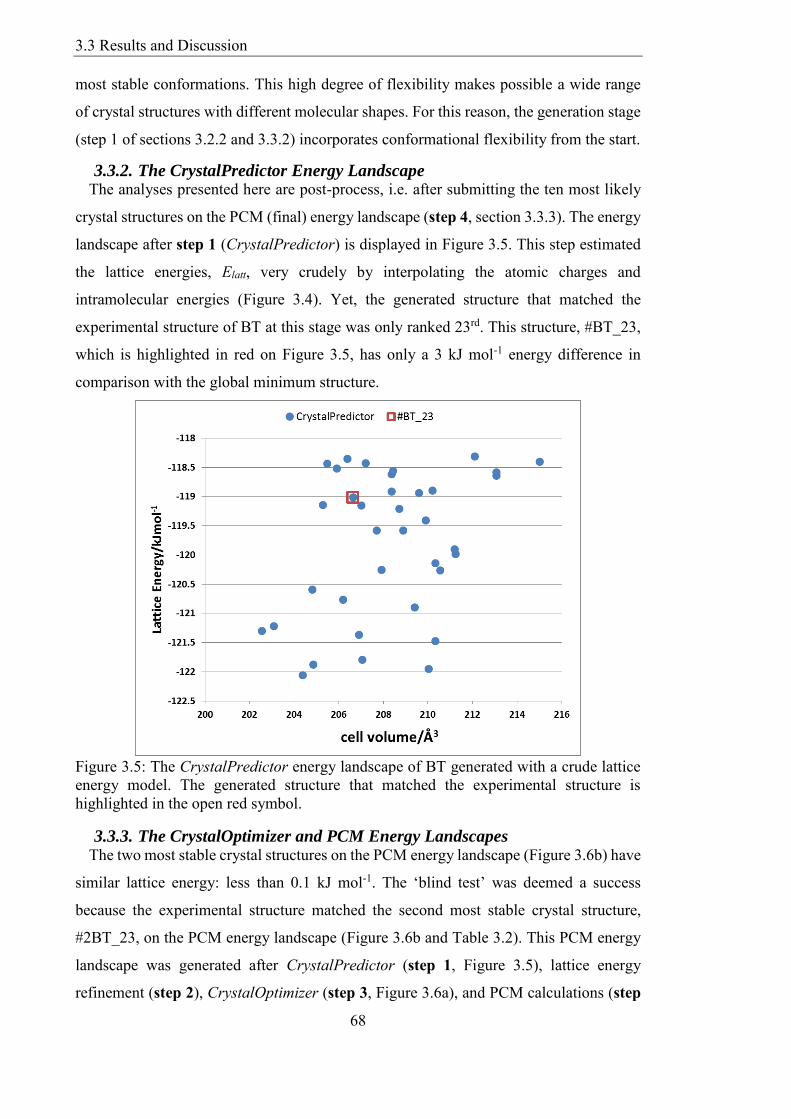
Figure 36 (a) The CrystalOptimizer (step 3) and (b) PCM (step 4) energy landscape
of BT GM is the global energy minimum The open red symbol represents a match
between the experimental crystal structure and the generated structure The energy
ranking of the crystal structure that matches the experimental has improved from fourth
most stable 4 to second most stable 2 69
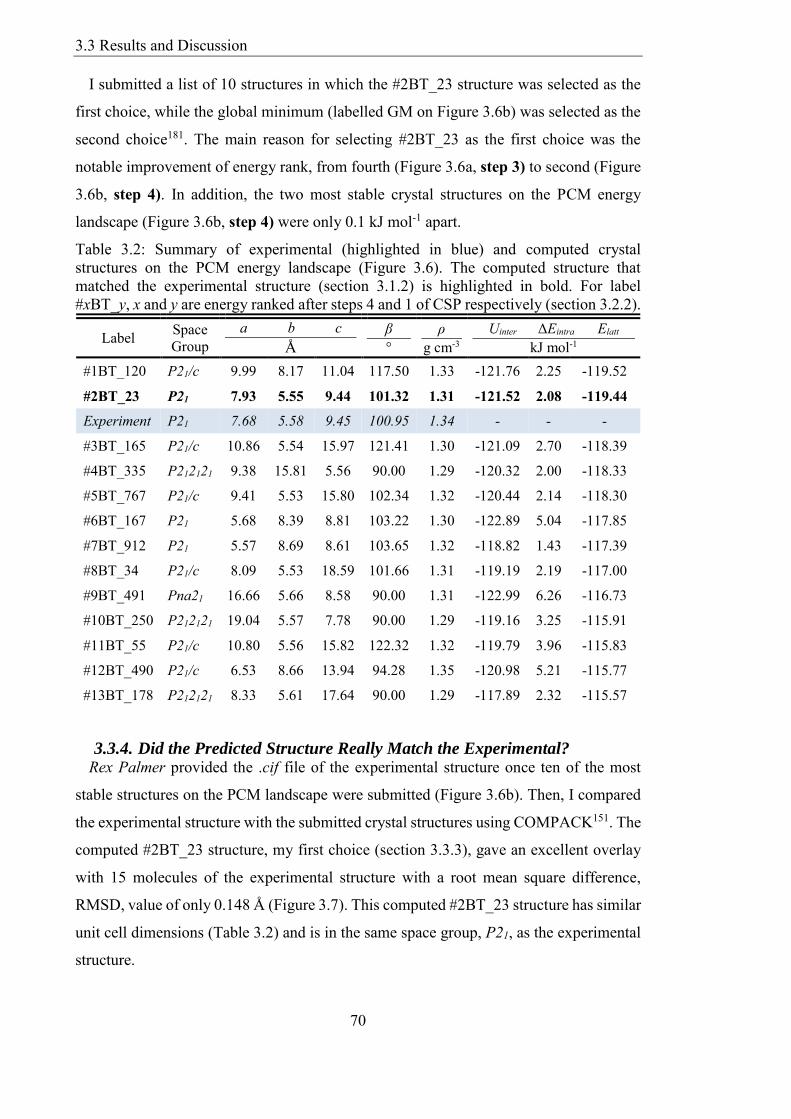
Figure 37 The 15-molecule overlay between the experimental (atomic colours) and the
second most stable computed structure 2BT_23 (green) The direction of the view
obscures some of the molecules 71
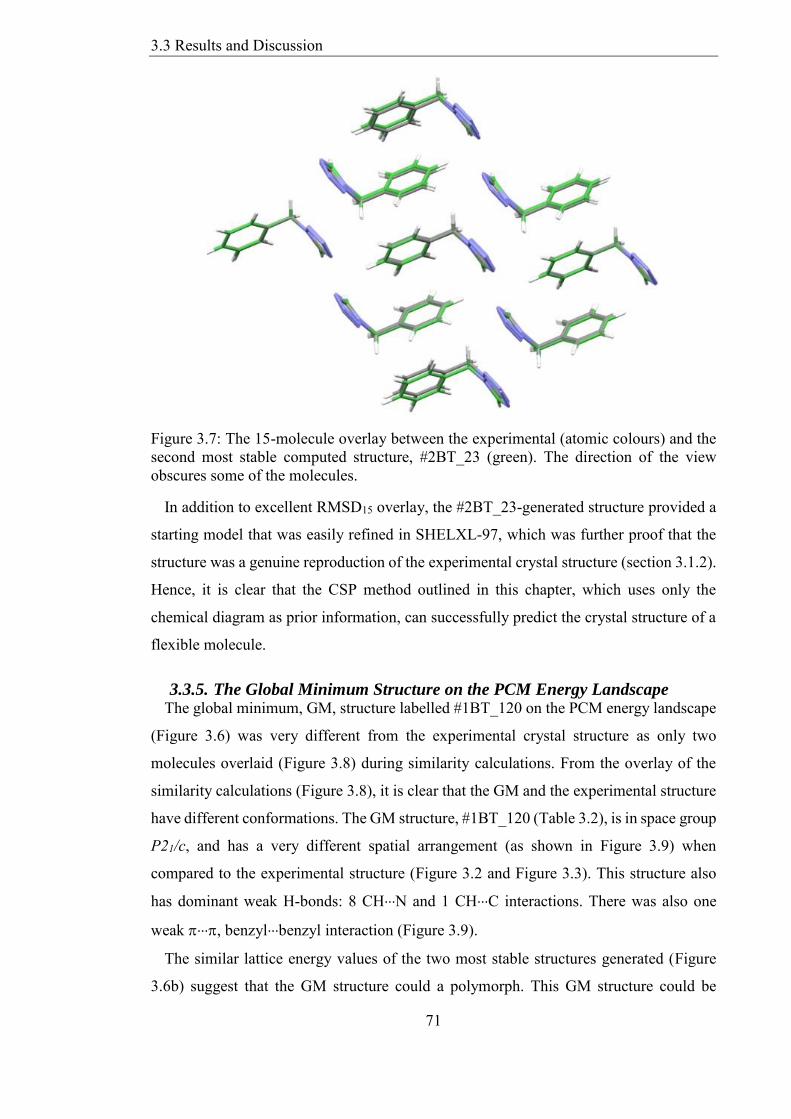
Figure 38 Crystal Packing Similarity between experimental (grey) and the most stable
predicted structure (1BT_120 green) with only 2 molecules matching (RMSD2 = 1072
Aring) 72
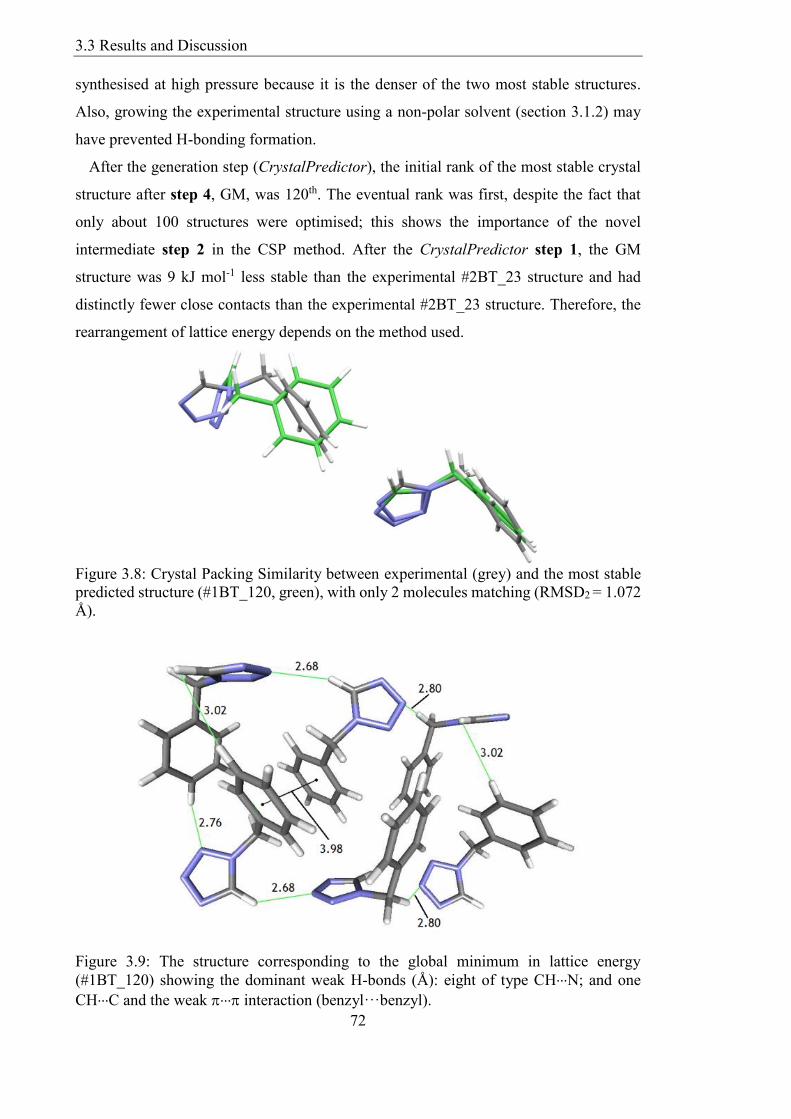
Figure 39 The structure corresponding to the global minimum in lattice energy
(1BT_120) showing the dominant weak H-bonds (Aring) eight of type CH∙∙∙N and one
CH∙∙∙C and the weak ∙∙∙ interaction (benzylmiddotmiddotmiddotbenzyl) 72
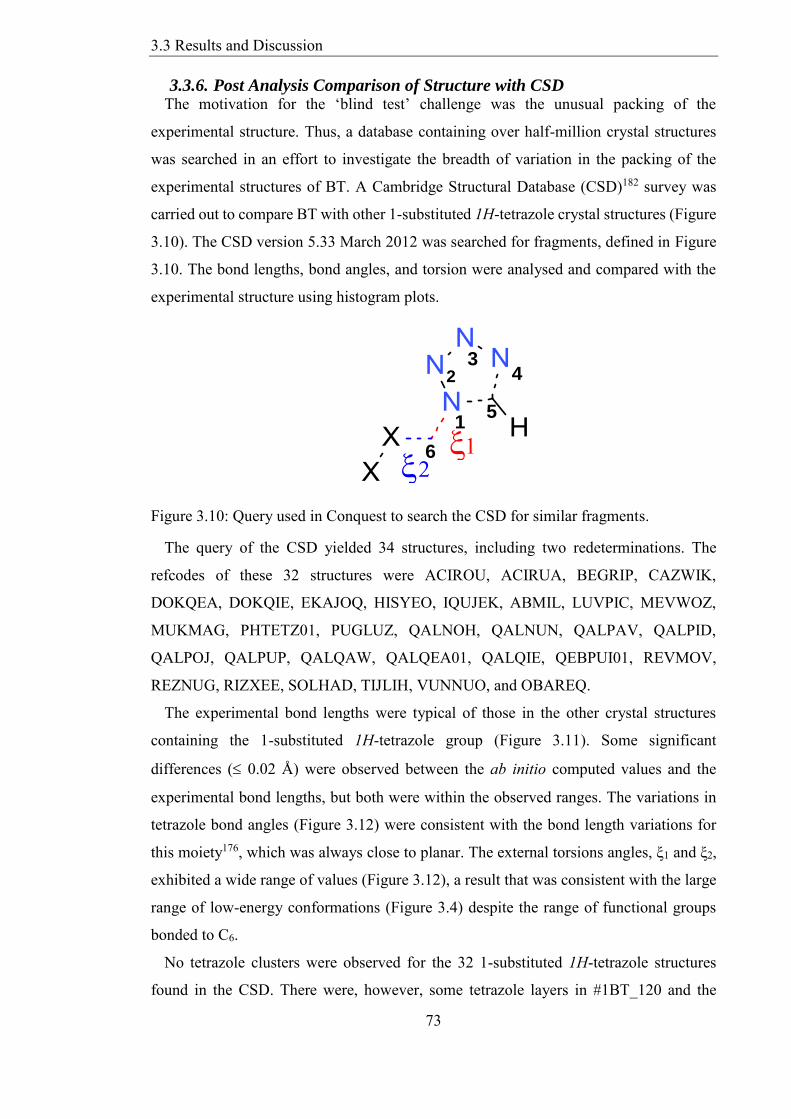
Figure 310 Query used in Conquest to search the CSD for similar fragments 73
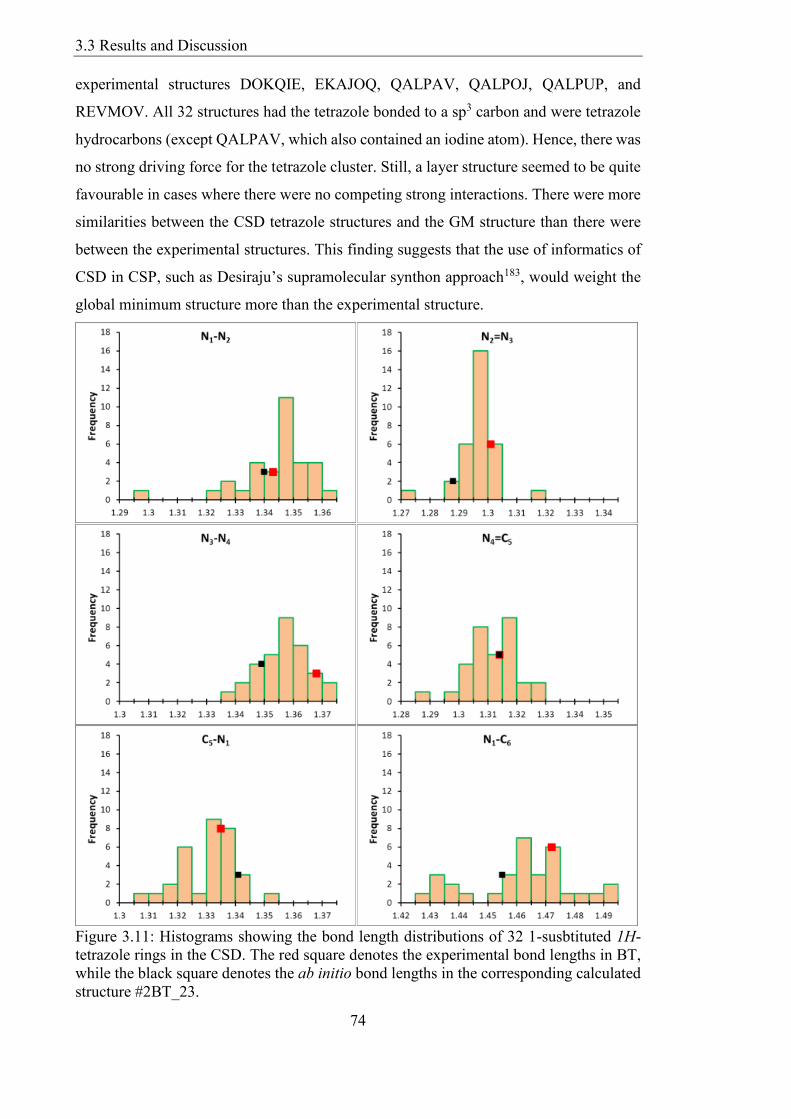
Figure 311 Histograms showing the bond length distributions of 32 1-susbtituted 1H-
tetrazole rings in the CSD The red square denotes the experimental bond lengths in BT
while the black square denotes the ab initio bond lengths in the corresponding calculated
structure 2BT_23 74
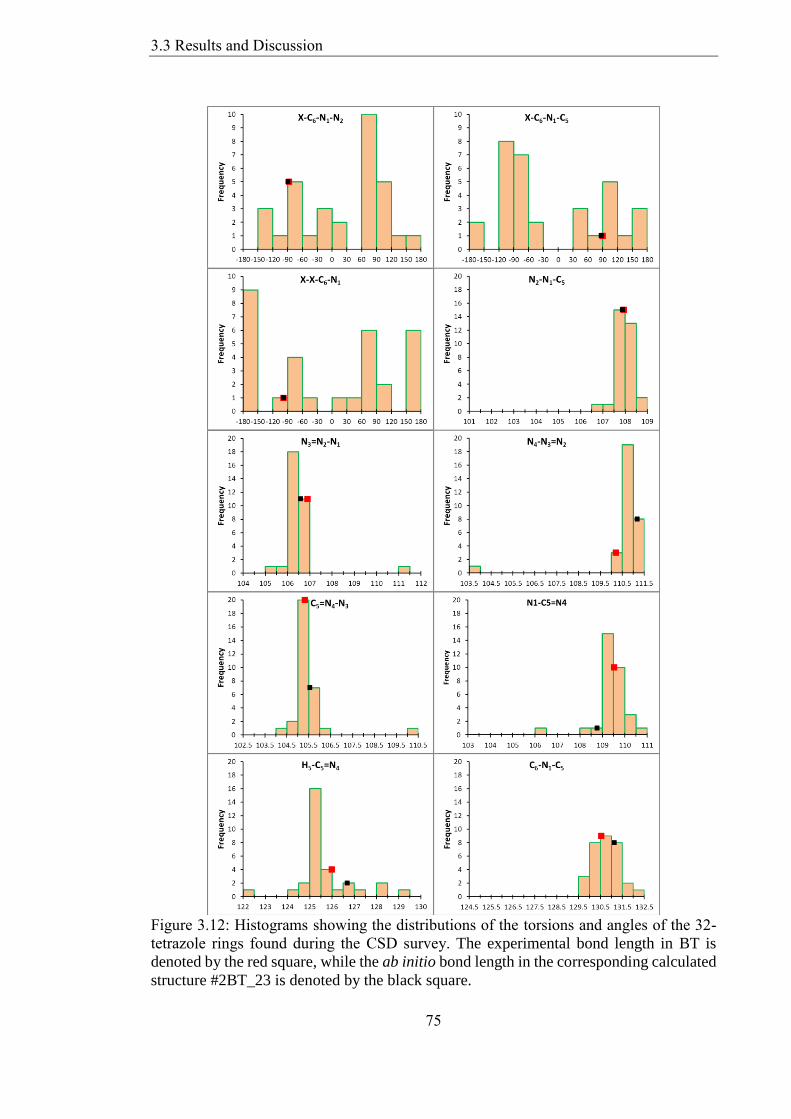
Figure 312 Histograms showing the distributions of the torsions and angles of the 32-
tetrazole rings found during the CSD survey The experimental bond length in BT is
denoted by the red square while the ab initio bond length in the corresponding calculated
structure 2BT_23 is denoted by the black square 75
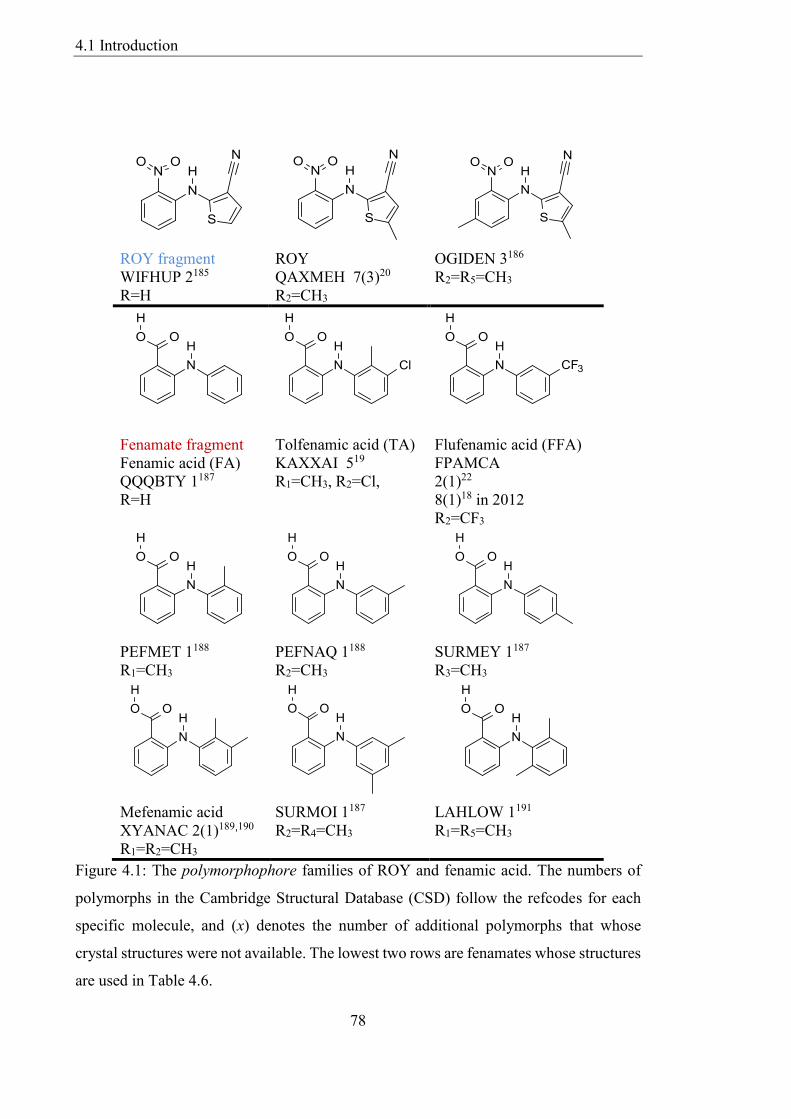
Figure 41 The polymorphophore families of ROY and fenamic acid The numbers of
polymorphs in the Cambridge Structural Database (CSD) follow the refcodes for each
specific molecule and (x) denotes the number of additional polymorphs that whose
crystal structures were not available The lowest two rows are fenamates whose structures
are used in Table 46 78
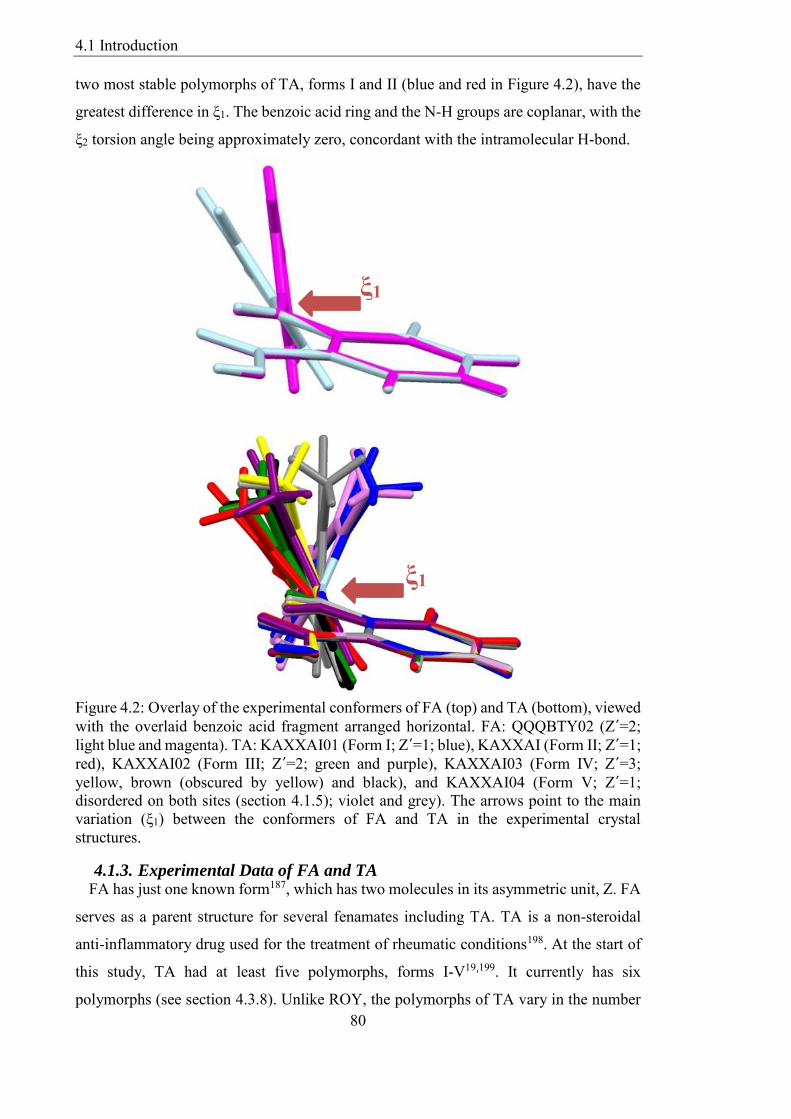
Figure 42 Overlay of the experimental conformers of FA (top) and TA (bottom) viewed
with the overlaid benzoic acid fragment arranged horizontal FA QQQBTY02 (Z´=2
light blue and magenta) TA KAXXAI01 (Form I Z´=1 blue) KAXXAI (Form II Z´=1
red) KAXXAI02 (Form III Z´=2 green and purple) KAXXAI03 (Form IV Z´=3
yellow brown (obscured by yellow) and black) and KAXXAI04 (Form V Z´=1
disordered on both sites (section 415) violet and grey) The arrows point to the main
List of Figures
13
variation (ξ1) between the conformers of FA and TA in the experimental crystal
structures 80
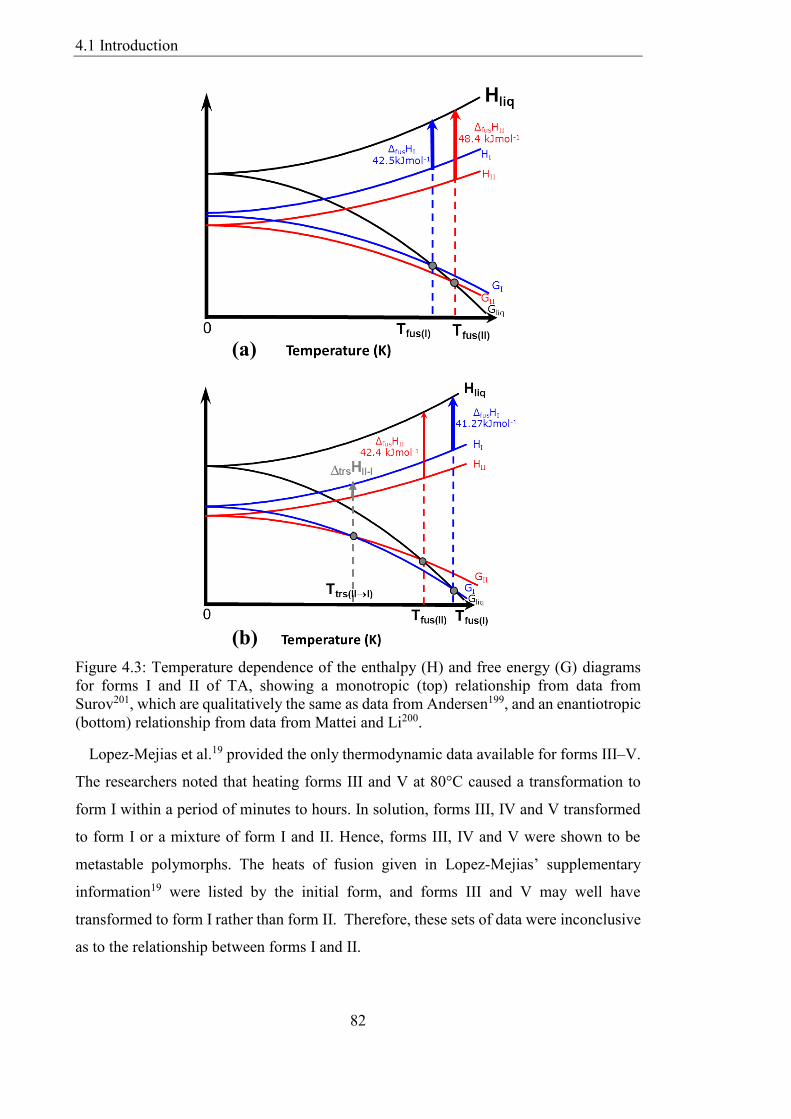
Figure 43 Temperature dependence of the enthalpy (H) and free energy (G) diagrams
for forms I and II of TA showing a monotropic (top) relationship from data from
Surov201 which are qualitatively the same as data from Andersen199 and an enantiotropic
(bottom) relationship from data from Mattei and Li200 82
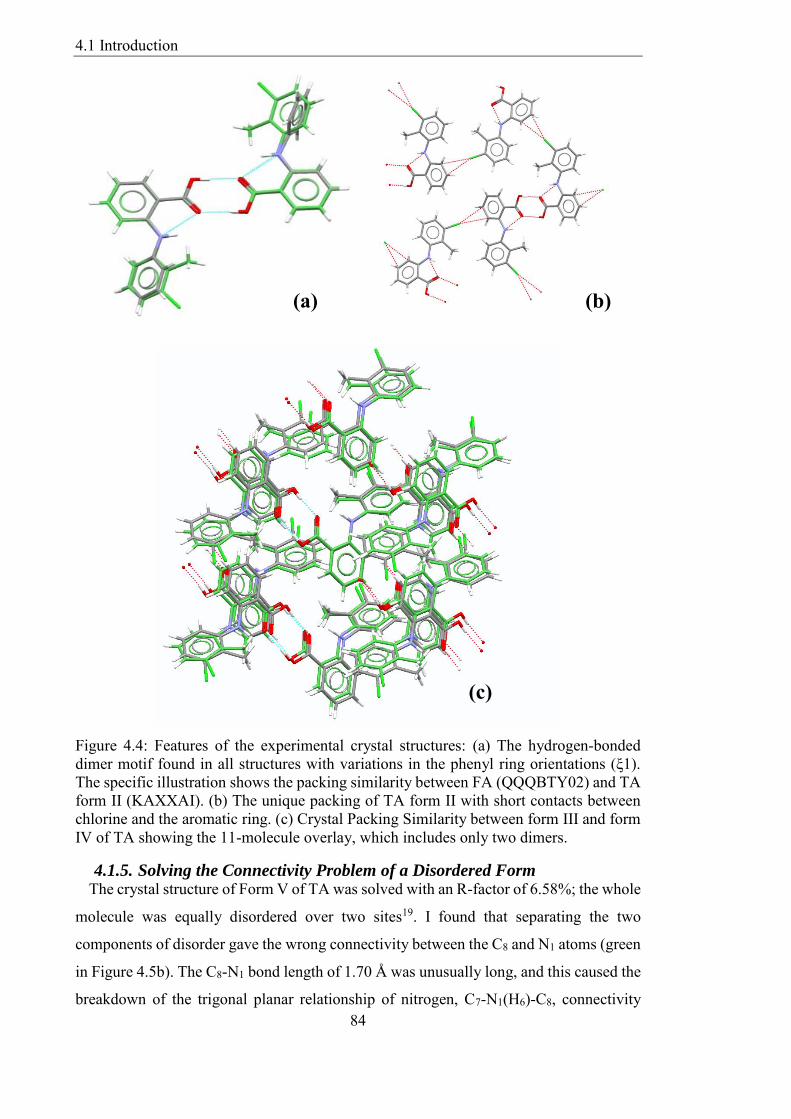
Figure 44 Features of the experimental crystal structures (a) The hydrogen-bonded
dimer motif found in all structures with variations in the phenyl ring orientations (ξ1)
The specific illustration shows the packing similarity between FA (QQQBTY02) and TA
form II (KAXXAI) (b) The unique packing of TA form II with short contacts between
chlorine and the aromatic ring (c) Crystal Packing Similarity between form III and form
IV of TA showing the 11-molecule overlay which includes only two dimers 84
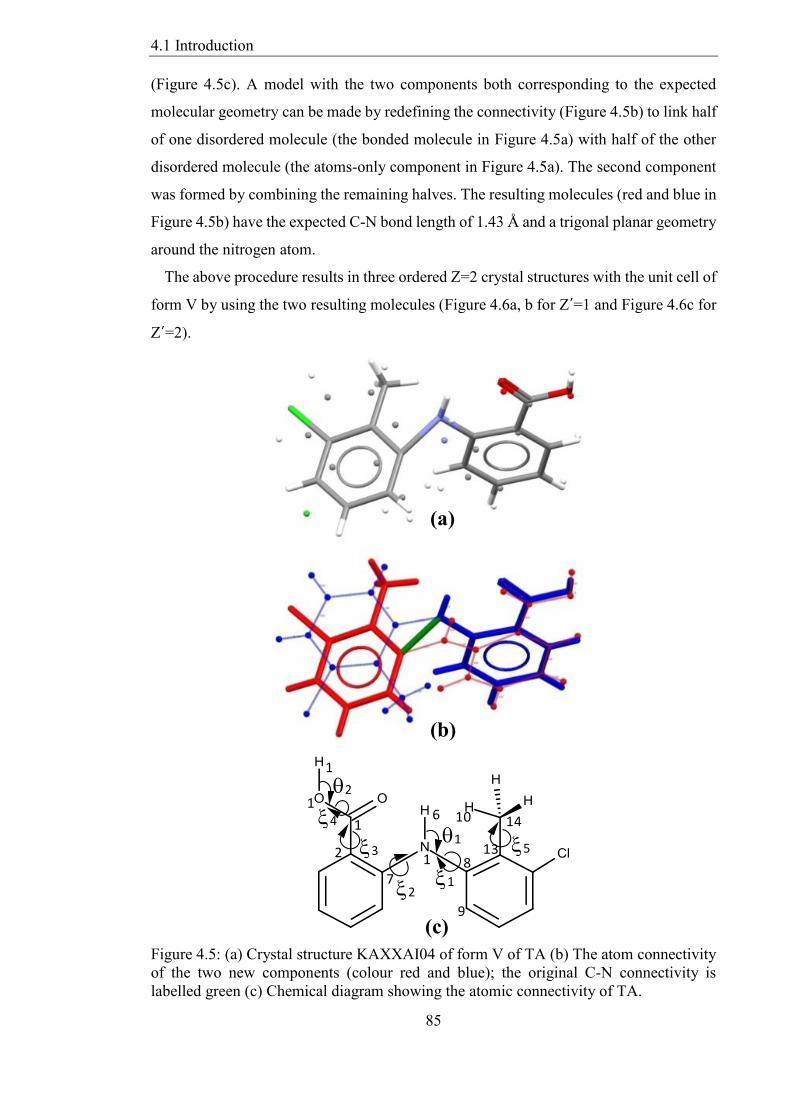
Figure 45 (a) Crystal structure KAXXAI04 of form V of TA (b) The atom connectivity
of the two new components (colour red and blue) the original C-N connectivity is
labelled green (c) Chemical diagram showing the atomic connectivity of TA 85
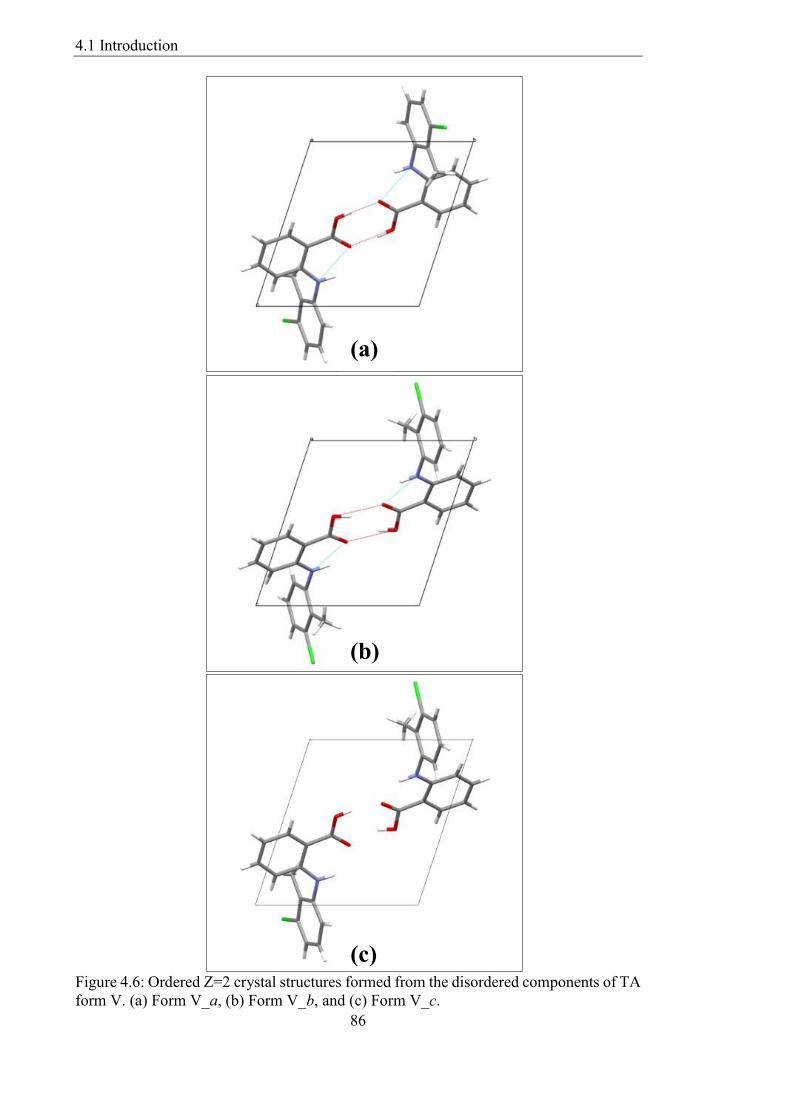
Figure 46 Ordered Z=2 crystal structures formed from the disordered components of TA
form V (a) Form V_a (b) Form V_b and (c) Form V_c 86
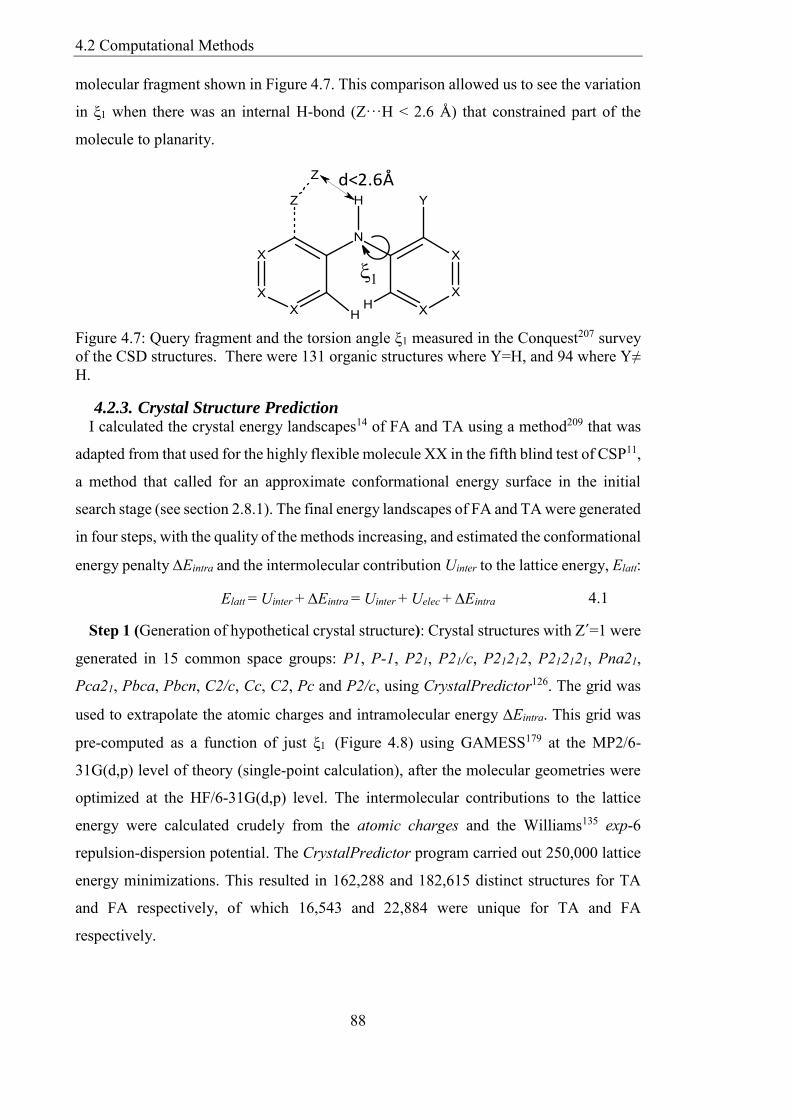
Figure 47 Query fragment and the torsion angle ξ1 measured in the Conquest207 survey
of the CSD structures There were 131 organic structures where Y=H and 94 where Yne
H 88
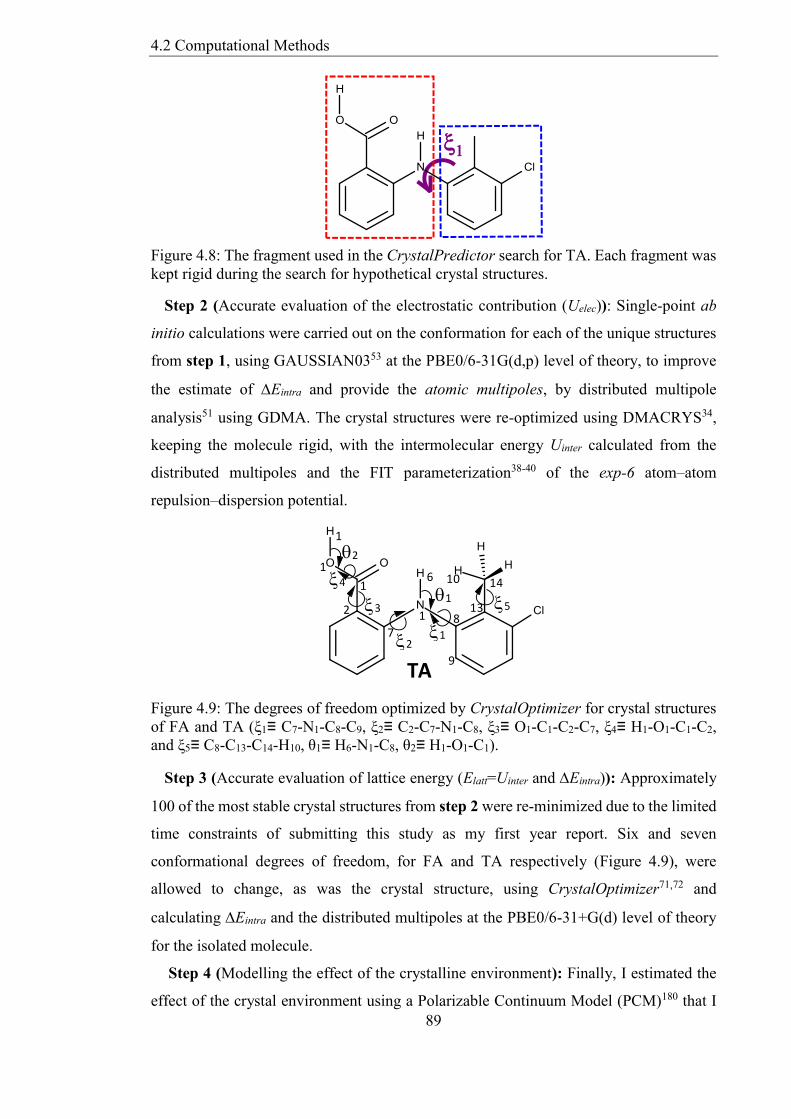
Figure 48 The fragment used in the CrystalPredictor search for TA Each fragment was
kept rigid during the search for hypothetical crystal structures 89
Figure 49 The degrees of freedom optimized by CrystalOptimizer for crystal structures
of FA and TA (ξ1equiv C7-N1-C8-C9 ξ2equiv C2-C7-N1-C8 ξ3equiv O1-C1-C2-C7 ξ4equiv H1-O1-C1-C2
and ξ5equiv C8-C13-C14-H10 θ1equiv H6-N1-C8 θ2equiv H1-O1-C1) 89
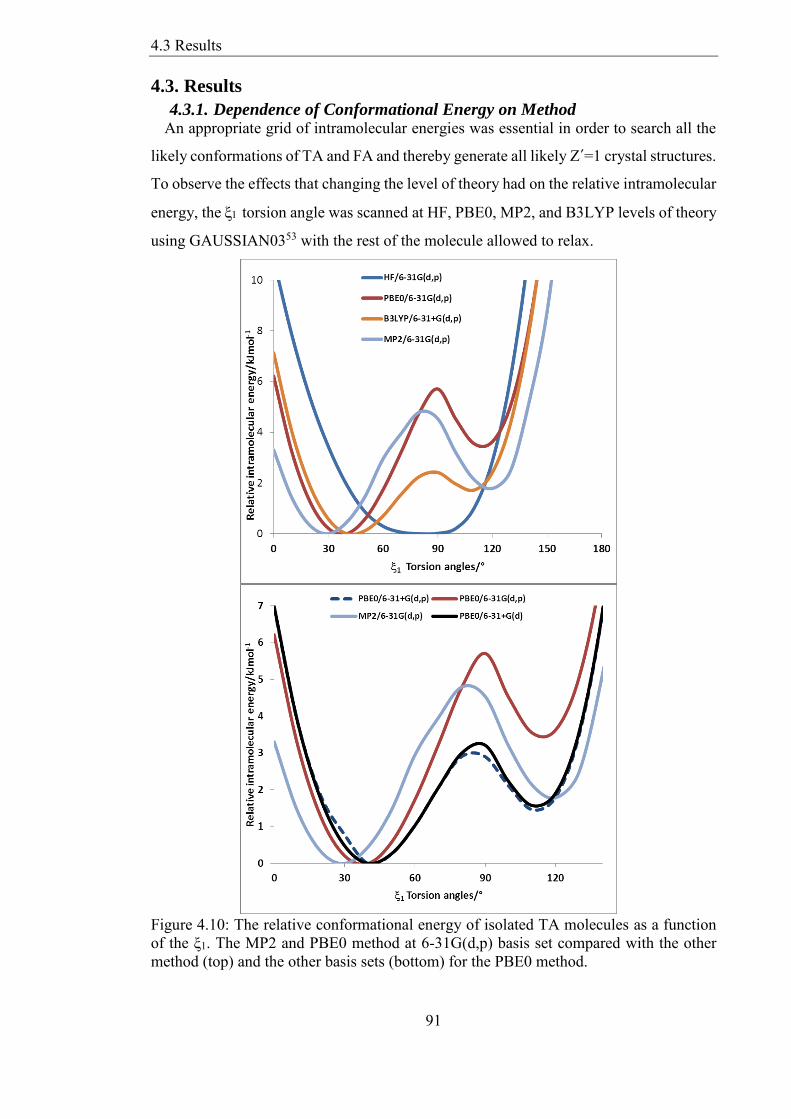
Figure 410 The relative conformational energy of isolated TA molecules as a function
of the ξ1 The MP2 and PBE0 method at 6-31G(dp) basis set compared with the other
method (top) and the other basis sets (bottom) for the PBE0 method 91
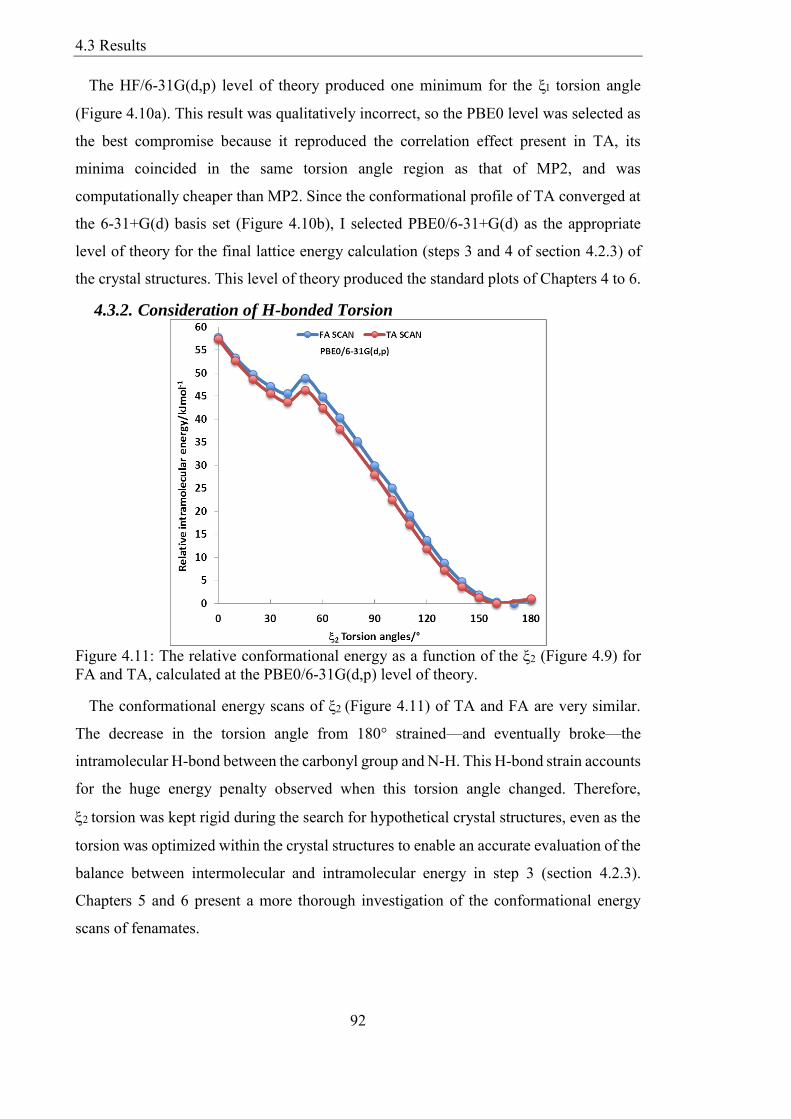
Figure 411 The relative conformational energy as a function of the ξ2 (Figure 49) for
FA and TA calculated at the PBE06-31G(dp) level of theory 92
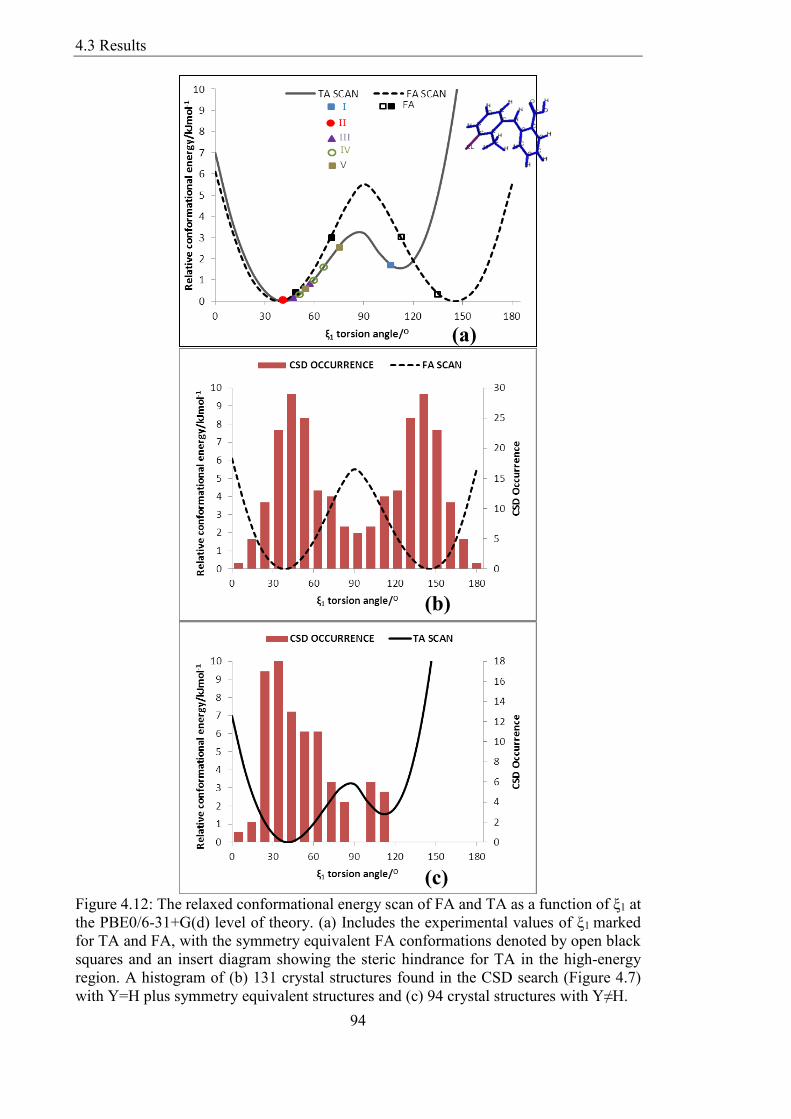
Figure 412 The relaxed conformational energy scan of FA and TA as a function of ξ1 at
the PBE06-31+G(d) level of theory (a) Includes the experimental values of ξ1 marked
for TA and FA with the symmetry equivalent FA conformations denoted by open black
squares and an insert diagram showing the steric hindrance for TA in the high-energy
region A histogram of (b) 131 crystal structures found in the CSD search (Figure 47)
with Y=H plus symmetry equivalent structures and (c) 94 crystal structures with YneH
94
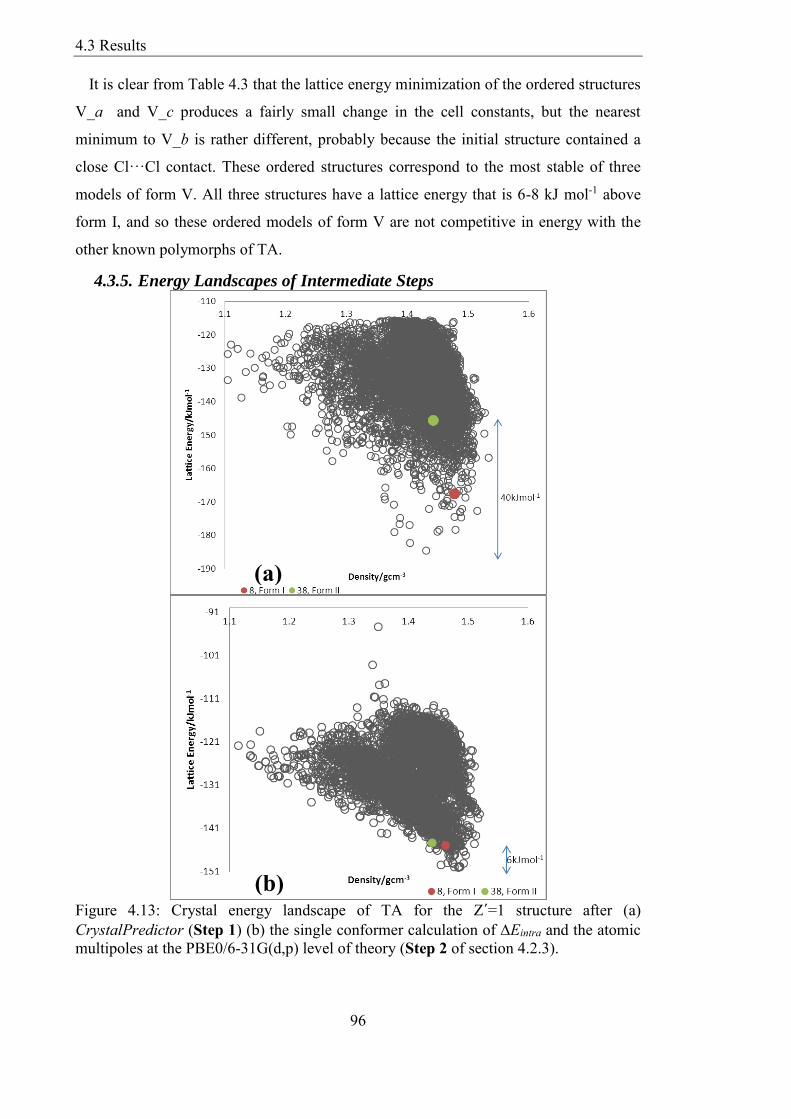
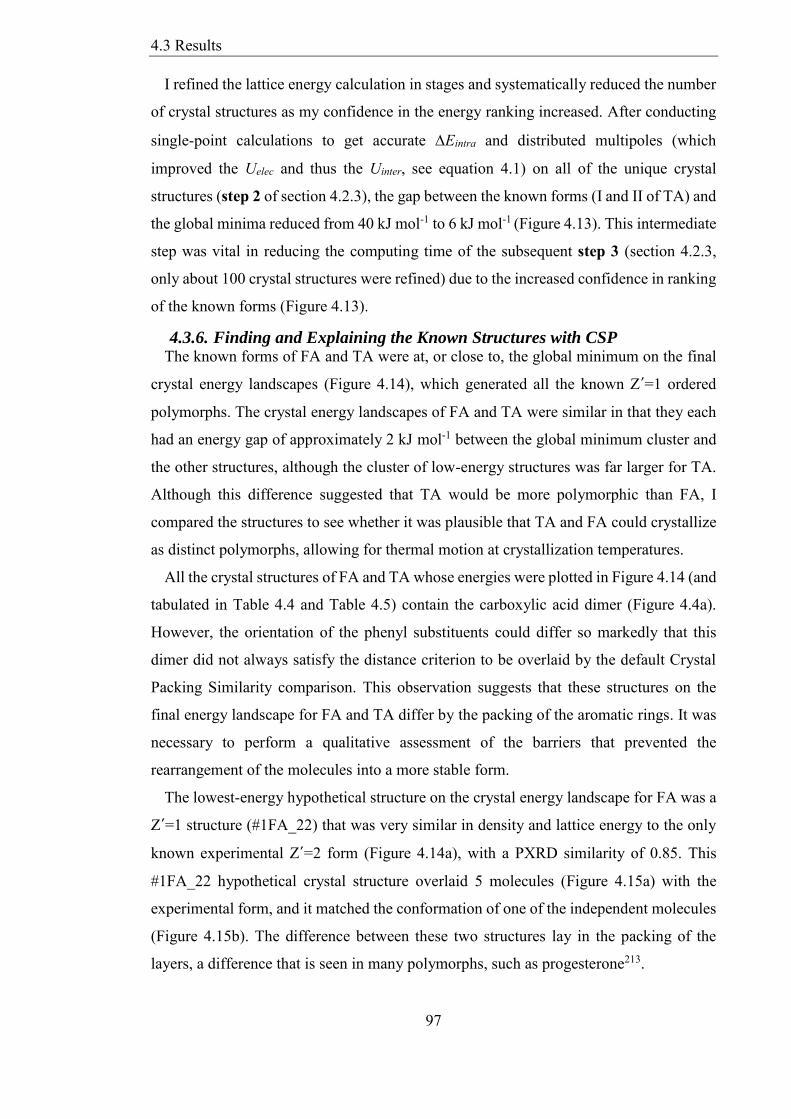
Figure 413 Crystal energy landscape of TA for the Z´=1 structure after (a)
CrystalPredictor (Step 1) (b) the single conformer calculation of Eintra and the atomic
multipoles at the PBE06-31G(dp) level of theory (Step 2 of section 423) 96
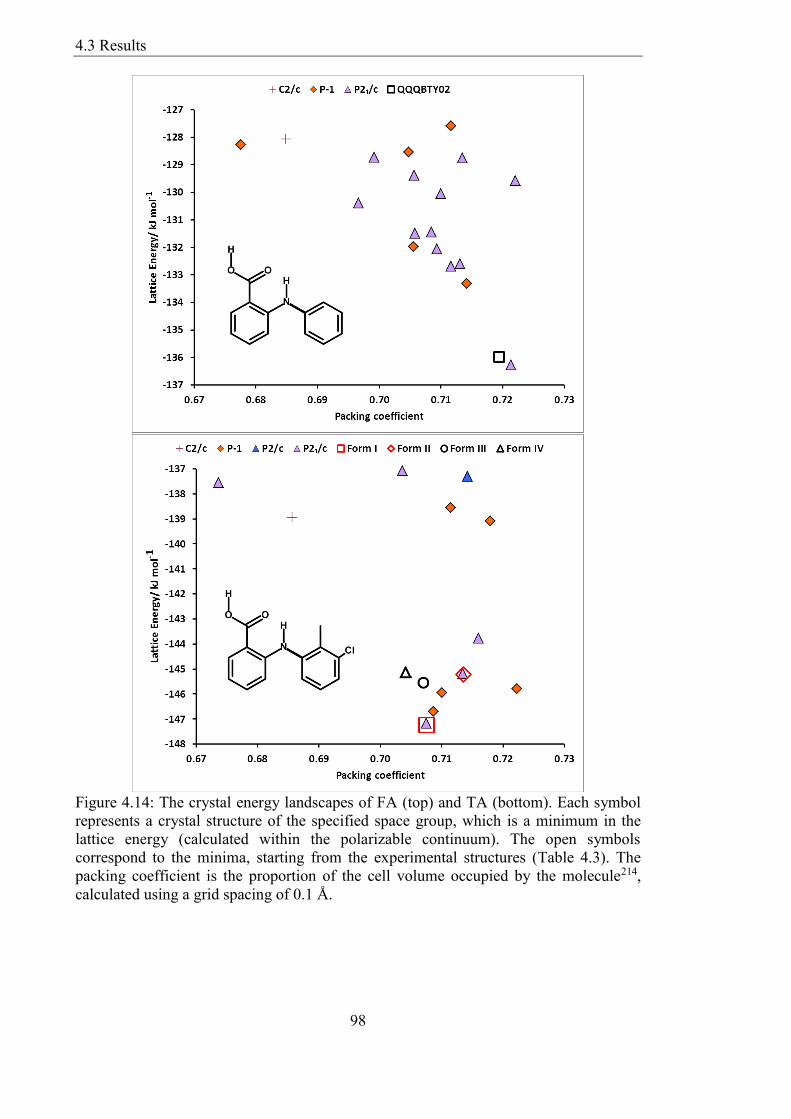
Figure 414 The crystal energy landscapes of FA (top) and TA (bottom) Each symbol
represents a crystal structure of the specified space group which is a minimum in the
List of Figures
14
lattice energy (calculated within the polarizable continuum) The open symbols
correspond to the minima starting from the experimental structures (Table 43) The
packing coefficient is the proportion of the cell volume occupied by the molecule214
calculated using a grid spacing of 01 Aring 98
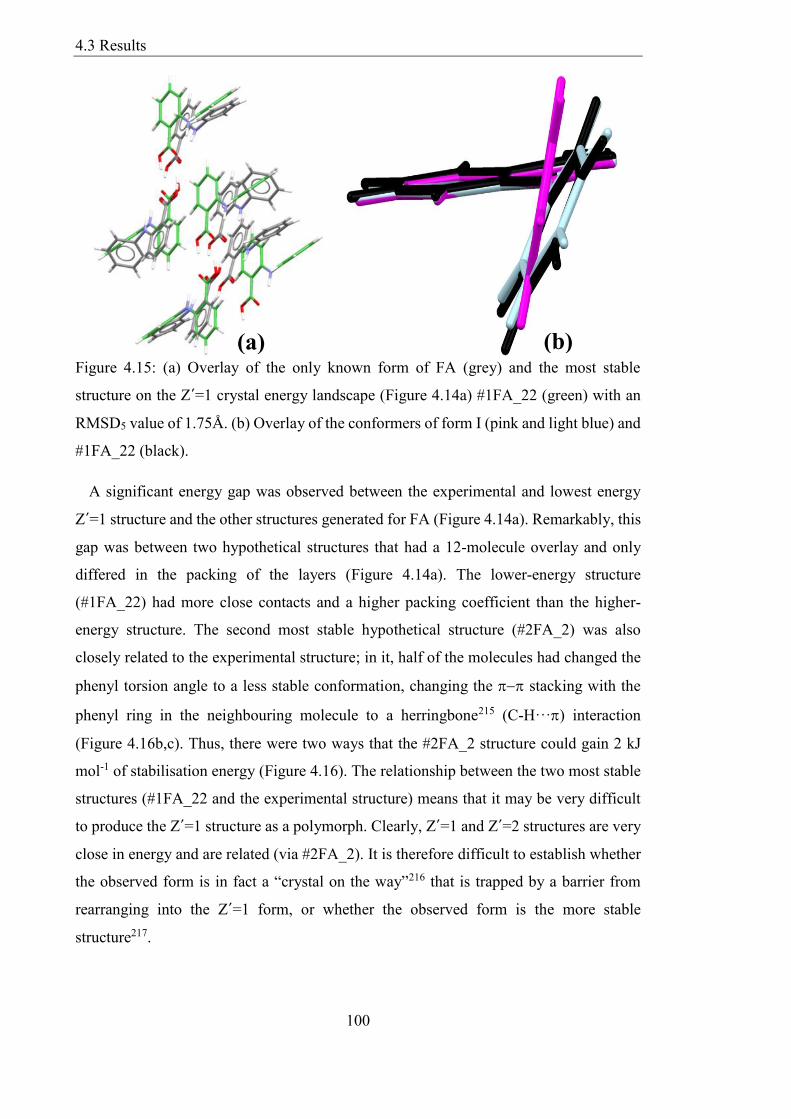
Figure 415 (a) Overlay of the only known form of FA (grey) and the most stable
structure on the Z´=1 crystal energy landscape (Figure 414a) 1FA_22 (green) with an
RMSD5 value of 175Aring (b) Overlay of the conformers of form I (pink and light blue) and
1FA_22 (black) 100
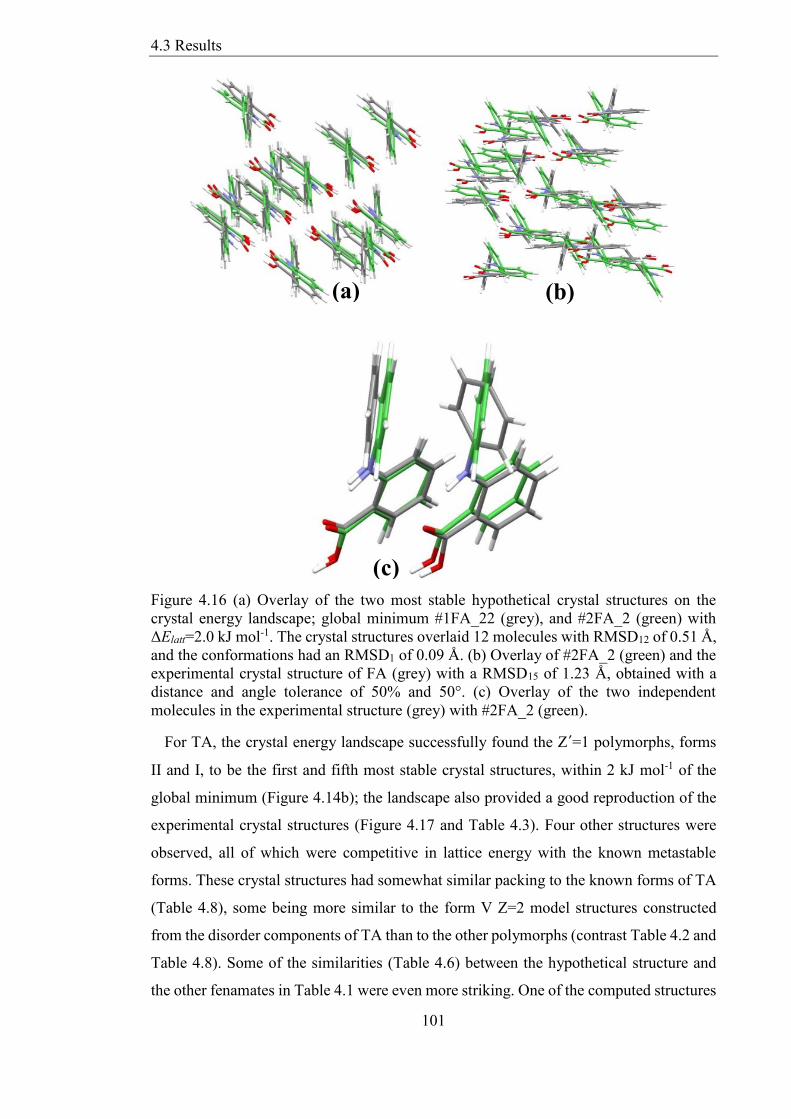
Figure 416 (a) Overlay of the two most stable hypothetical crystal structures on the
crystal energy landscape global minimum 1FA_22 (grey) and 2FA_2 (green) with
ΔElatt=20 kJ mol-1 The crystal structures overlaid 12 molecules with RMSD12 of 051 Aring
and the conformations had an RMSD1 of 009 Aring (b) Overlay of 2FA_2 (green) and the
experimental crystal structure of FA (grey) with a RMSD15 of 123 Aring obtained with a
distance and angle tolerance of 50 and 50deg (c) Overlay of the two independent
molecules in the experimental structure (grey) with 2FA_2 (green) 101
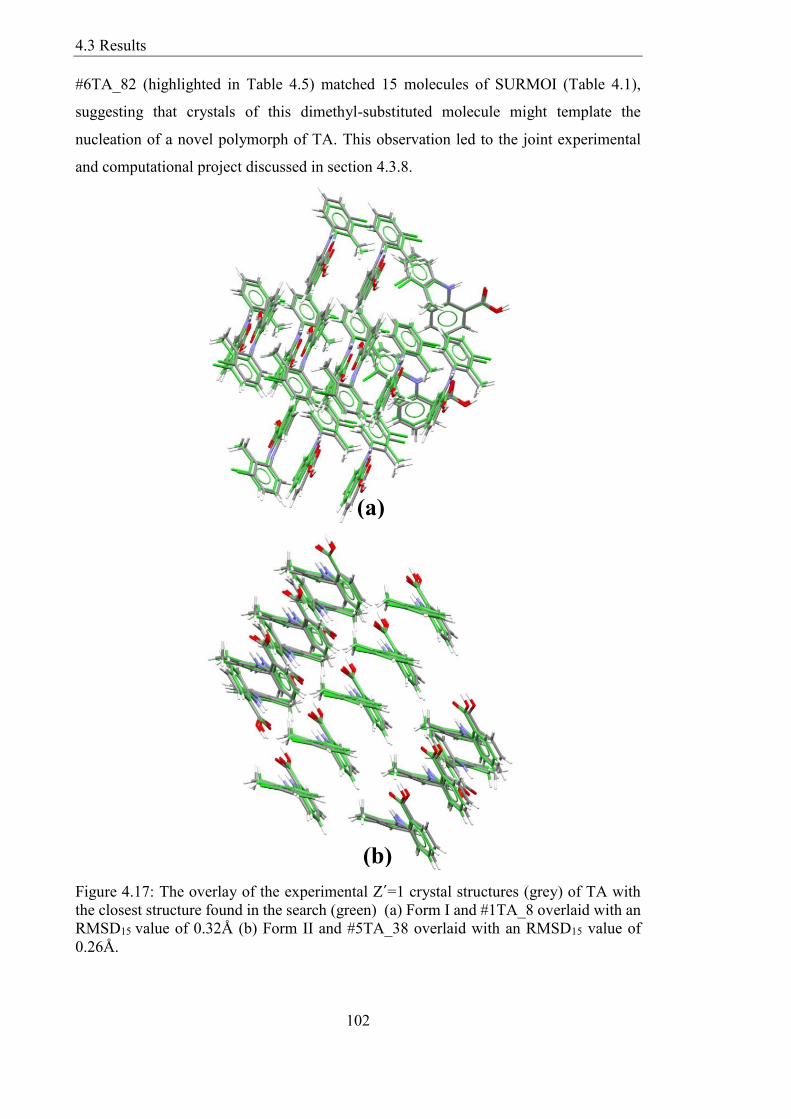
Figure 417 The overlay of the experimental Z´=1 crystal structures (grey) of TA with
the closest structure found in the search (green) (a) Form I and 1TA_8 overlaid with an
RMSD15 value of 032Aring (b) Form II and 5TA_38 overlaid with an RMSD15 value of
026Aring 102
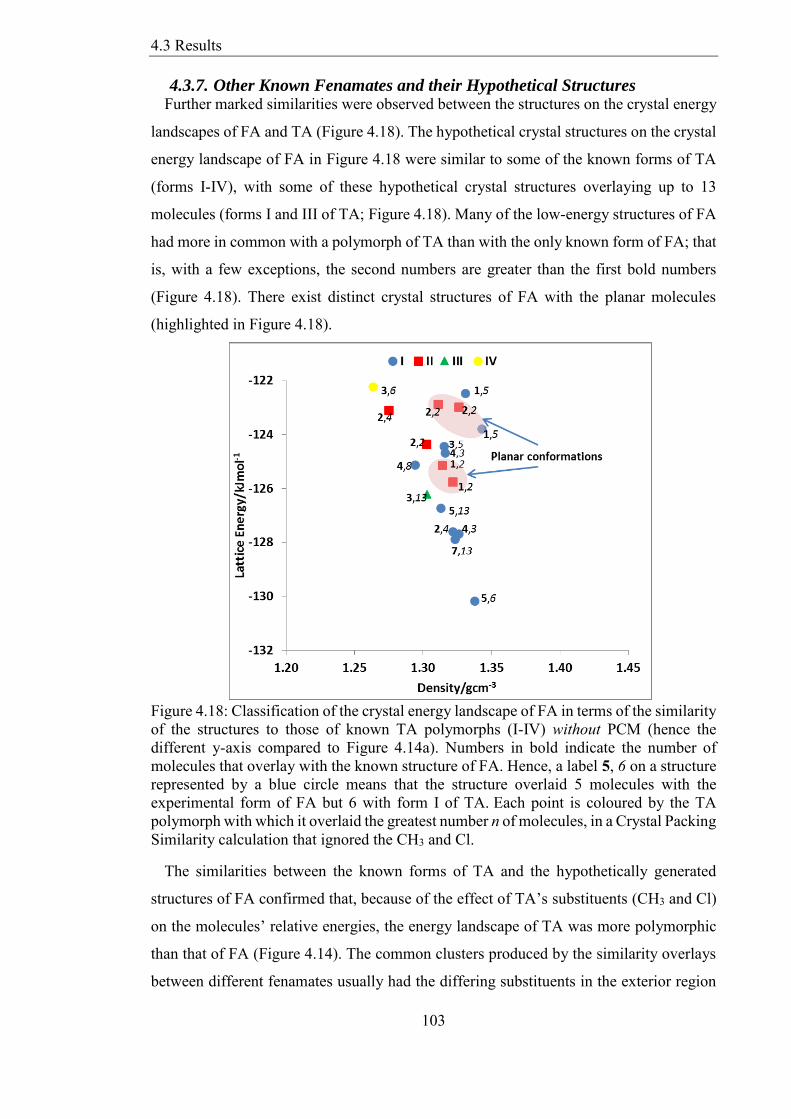
Figure 418 Classification of the crystal energy landscape of FA in terms of the similarity
of the structures to those of known TA polymorphs (I-IV) without PCM (hence the
different y-axis compared to Figure 414a) Numbers in bold indicate the number of
molecules that overlay with the known structure of FA Hence a label 5 6 on a structure
represented by a blue circle means that the structure overlaid 5 molecules with the
experimental form of FA but 6 with form I of TAEach point is coloured by the TA
polymorph with which it overlaid the greatest number n of molecules in a Crystal Packing
Similarity calculation that ignored the CH3 and Cl 103
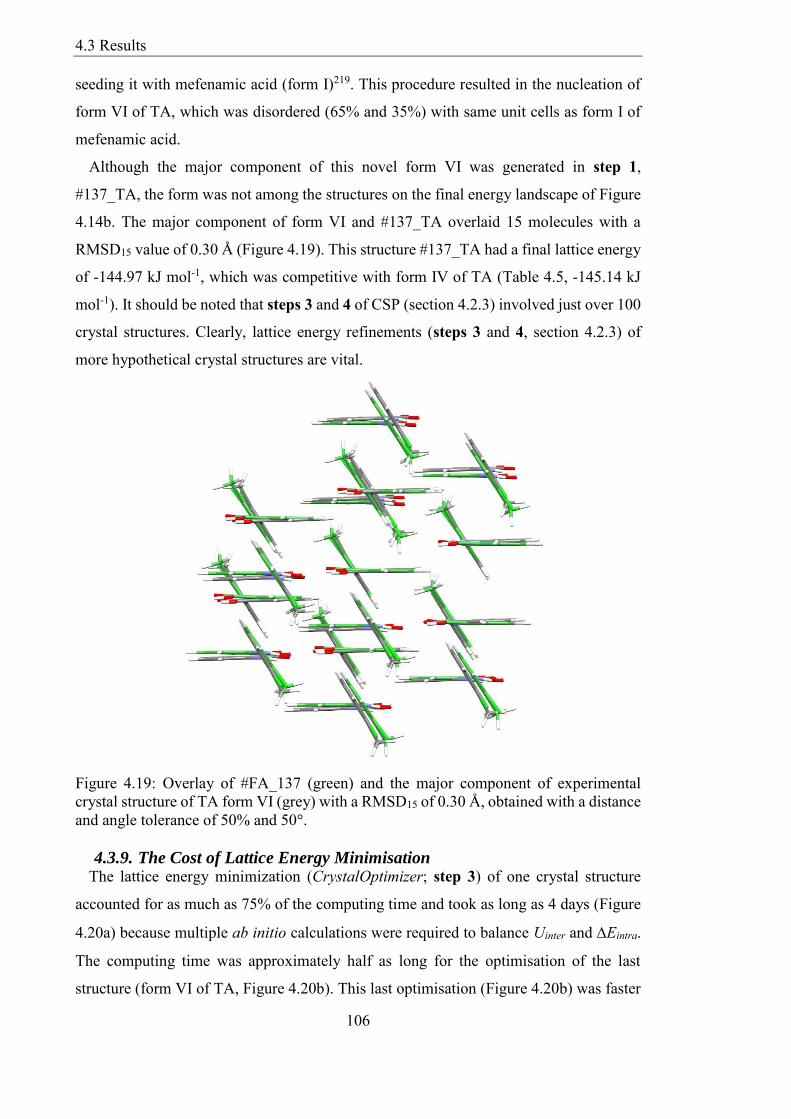
Figure 419 Overlay of FA_137 (green) and the major component of experimental
crystal structure of TA form VI (grey) with a RMSD15 of 030 Aring obtained with a distance
and angle tolerance of 50 and 50deg 106
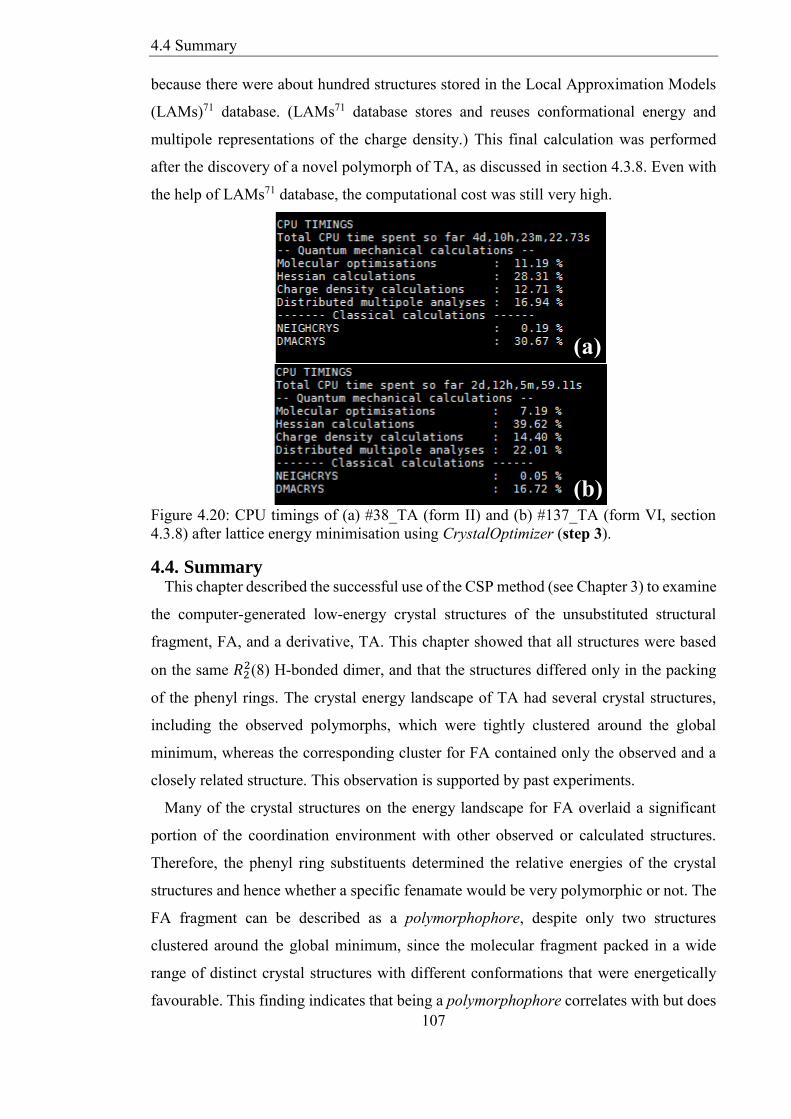
Figure 420 CPU timings of (a) 38_TA (form II) and (b) 137_TA (form VI section
438) after lattice energy minimisation using CrystalOptimizer (step 3) 107
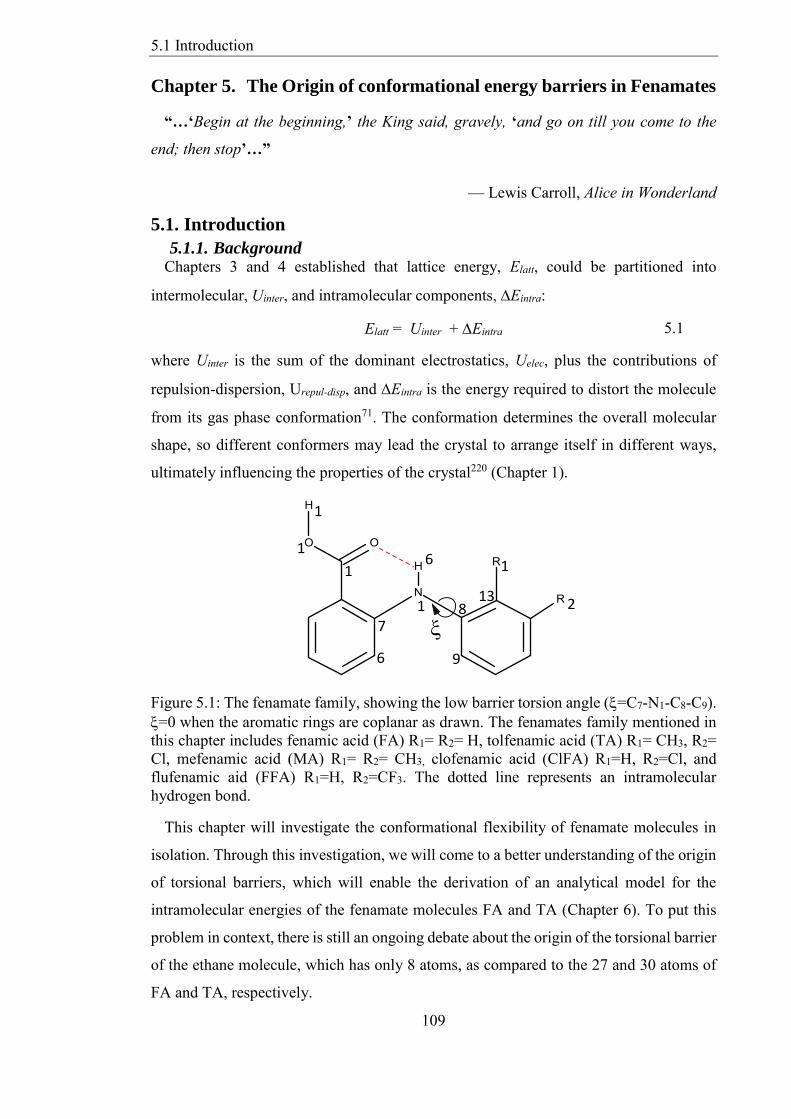
Figure 51 The fenamate family showing the low barrier torsion angle (=C7-N1-C8-C9)
=0 when the aromatic rings are coplanar as drawn The fenamates family mentioned in
this chapter includes fenamic acid (FA) R1= R2= H tolfenamic acid (TA) R1= CH3 R2=
Cl mefenamic acid (MA) R1= R2= CH3 clofenamic acid (ClFA) R1=H R2=Cl and
flufenamic aid (FFA) R1=H R2=CF3 The dotted line represents an intramolecular
hydrogen bond 109
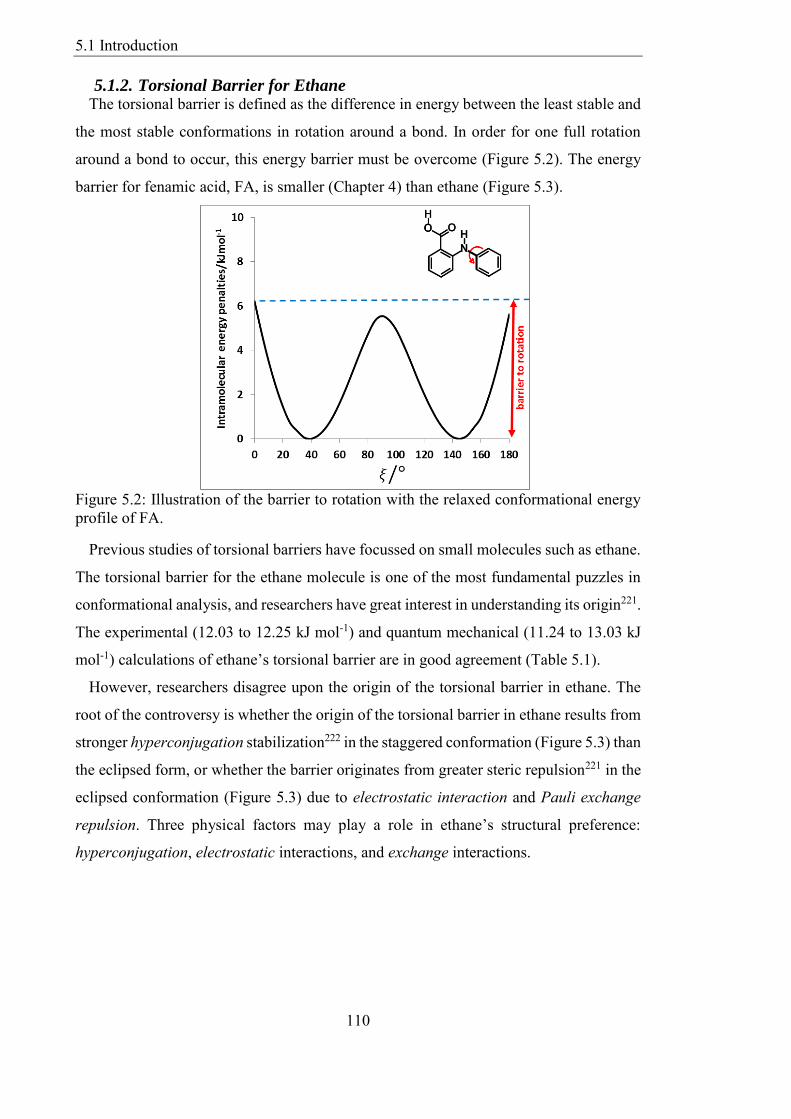
Figure 52 Illustration of the barrier to rotation with the relaxed conformational energy
profile of FA 110
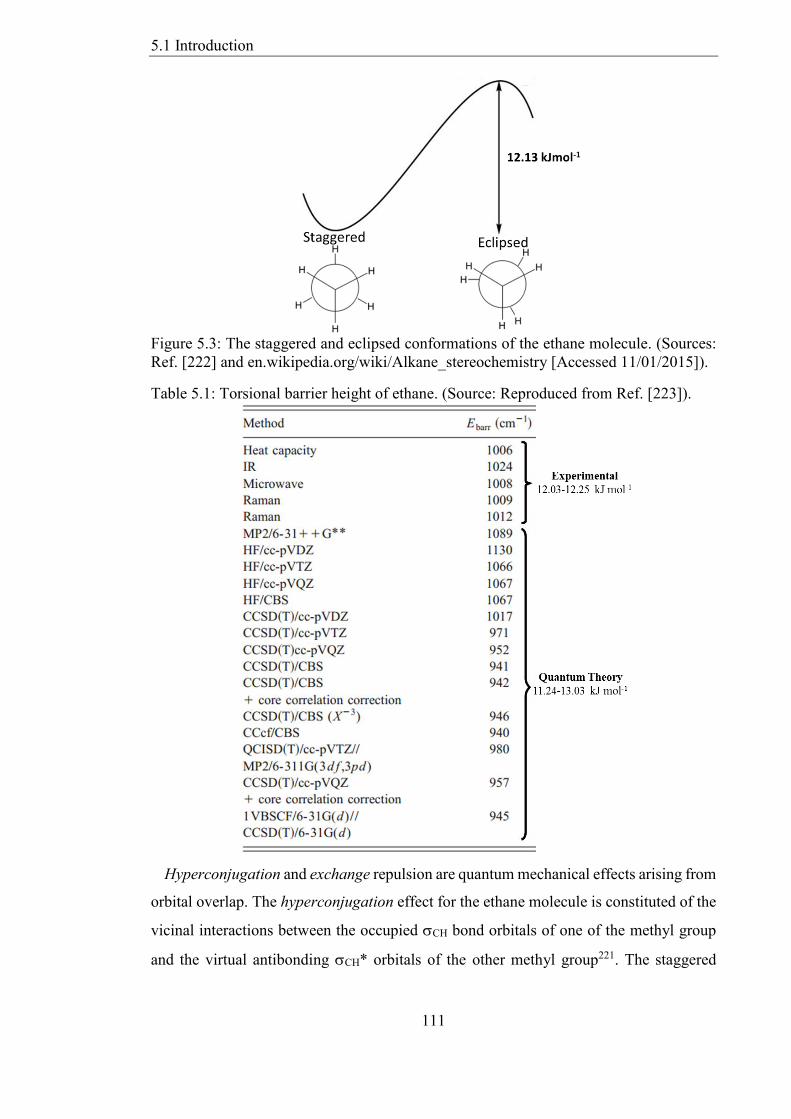
Figure 53 The staggered and eclipsed conformations of the ethane molecule (Sources
Ref [222] and enwikipediaorgwikiAlkane_stereochemistry [Accessed 11012015])
111
List of Figures
15
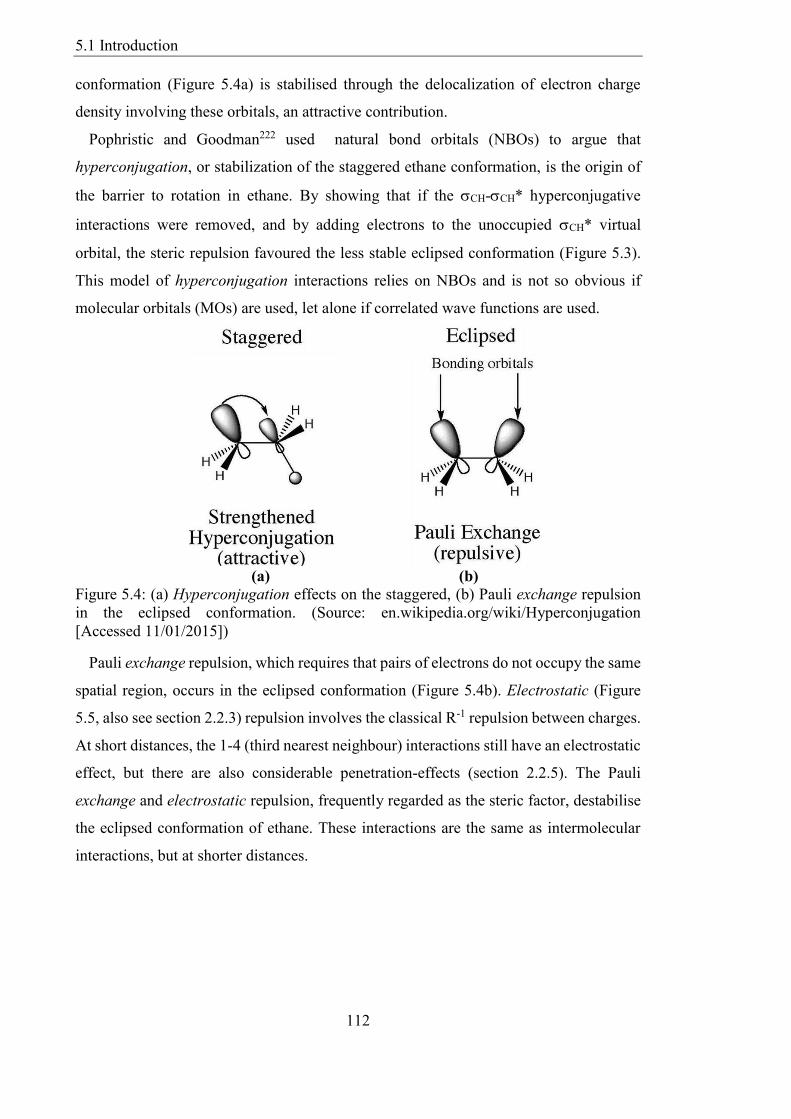
Figure 54 (a) Hyperconjugation effects on the staggered (b) Pauli exchange repulsion
in the eclipsed conformation (Source enwikipediaorgwikiHyperconjugation
[Accessed 11012015]) 112
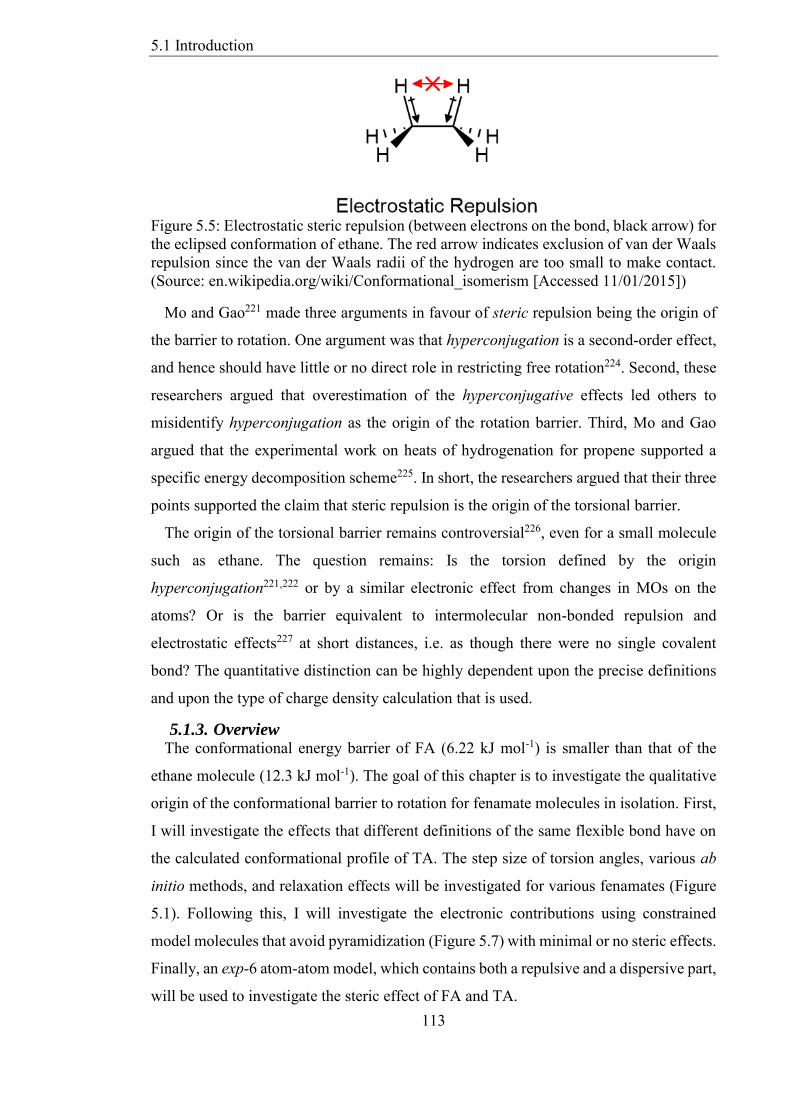
Figure 55 Electrostatic steric repulsion (between electrons on the bond black arrow) for
the eclipsed conformation of ethane The red arrow indicates exclusion of van der Waals
repulsion since the van der Waals radii of the hydrogen are too small to make contact
(Source enwikipediaorgwikiConformational_isomerism [Accessed 11012015]) 113
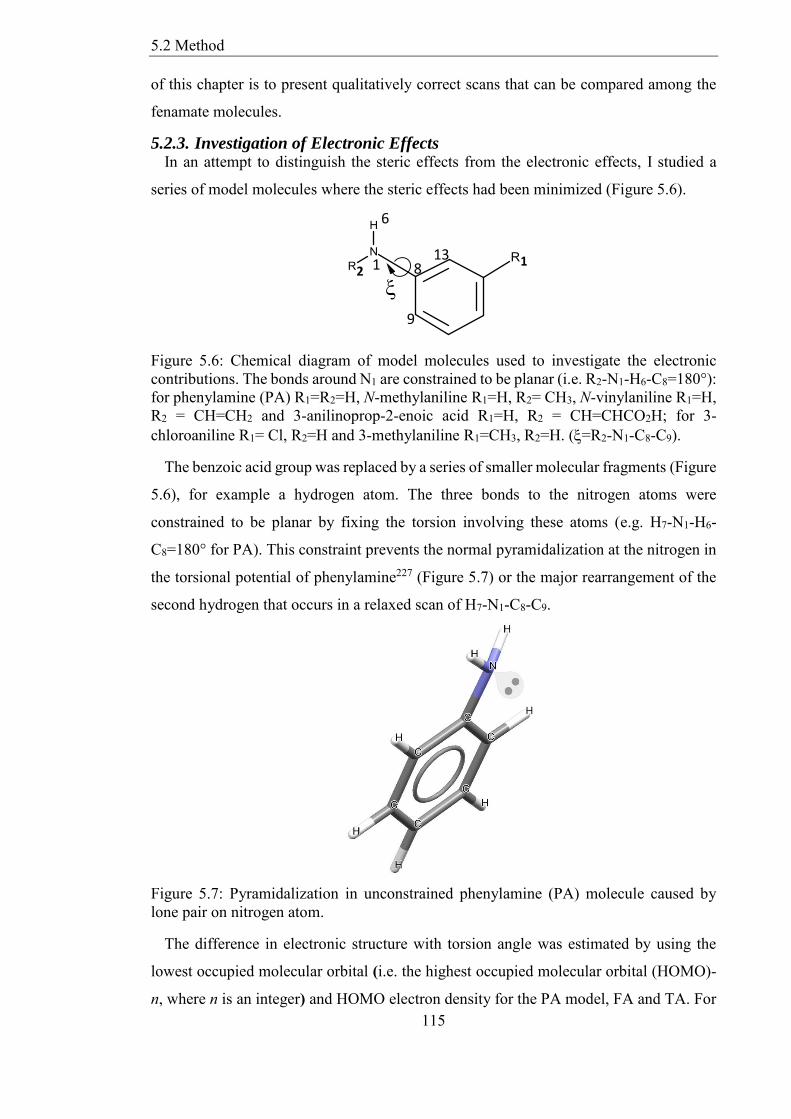
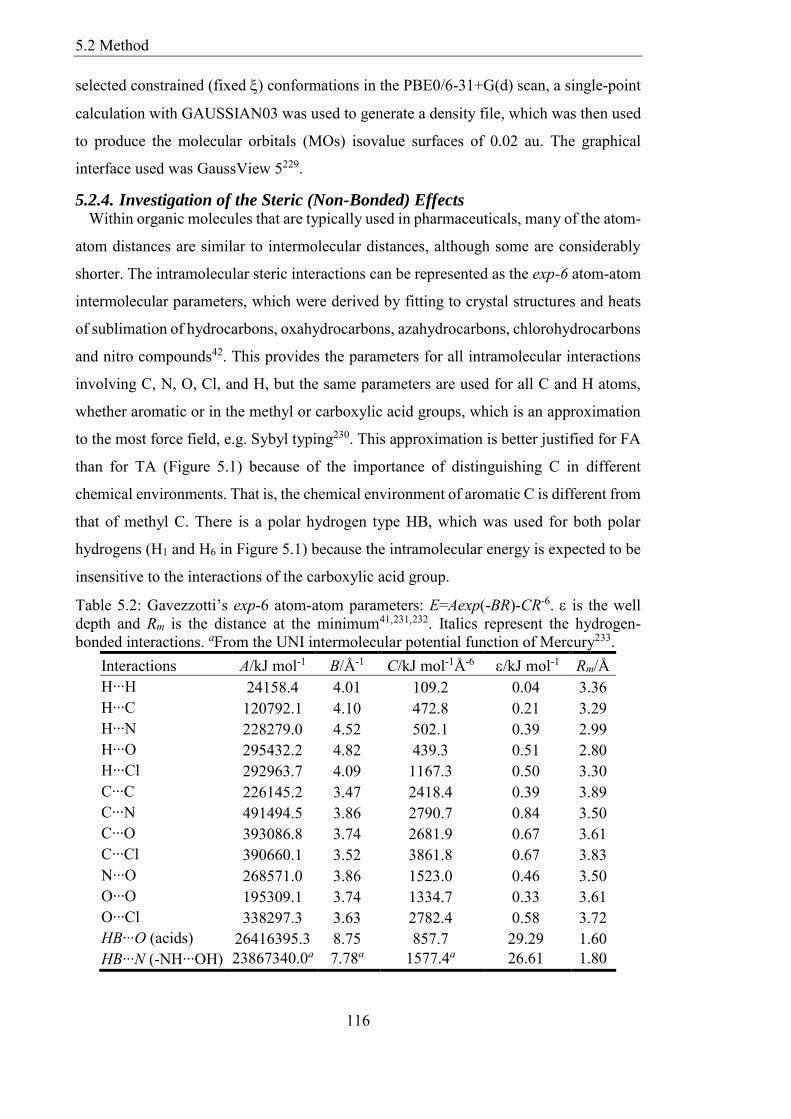
Figure 56 Chemical diagram of model molecules used to investigate the electronic
contributions The bonds around N1 are constrained to be planar (ie R2-N1-H6-C8=180deg)
for phenylamine (PA) R1=R2=H N-methylaniline R1=H R2= CH3 N-vinylaniline R1=H
R2 = CH=CH2 and 3-anilinoprop-2-enoic acid R1=H R2 = CH=CHCO2H for 3-
chloroaniline R1= Cl R2=H and 3-methylaniline R1=CH3 R2=H (=R2-N1-C8-C9) 115
Figure 57 Pyramidalization in unconstrained phenylamine (PA) molecule caused by
lone pair on nitrogen atom 115
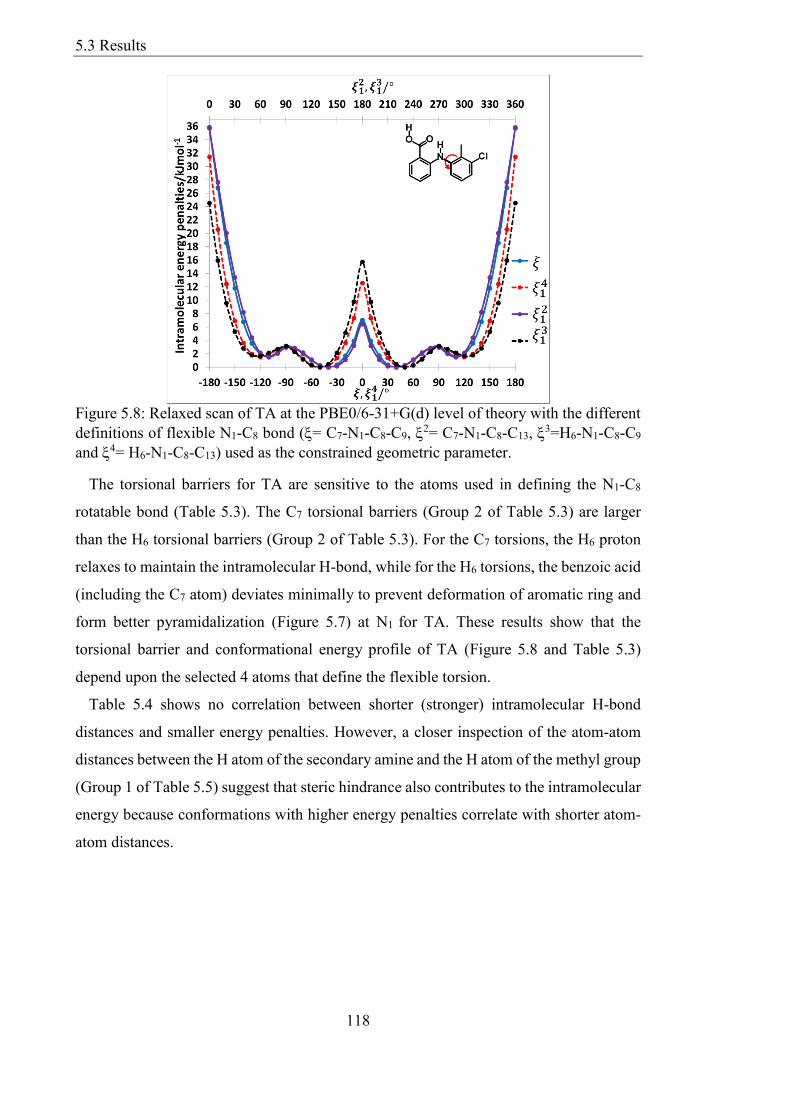
Figure 58 Relaxed scan of TA at the PBE06-31+G(d) level of theory with the different
definitions of flexible N1-C8 bond (= C7-N1-C8-C9 2= C7-N1-C8-C13
3=H6-N1-C8-C9
and 4= H6-N1-C8-C13) used as the constrained geometric parameter 118
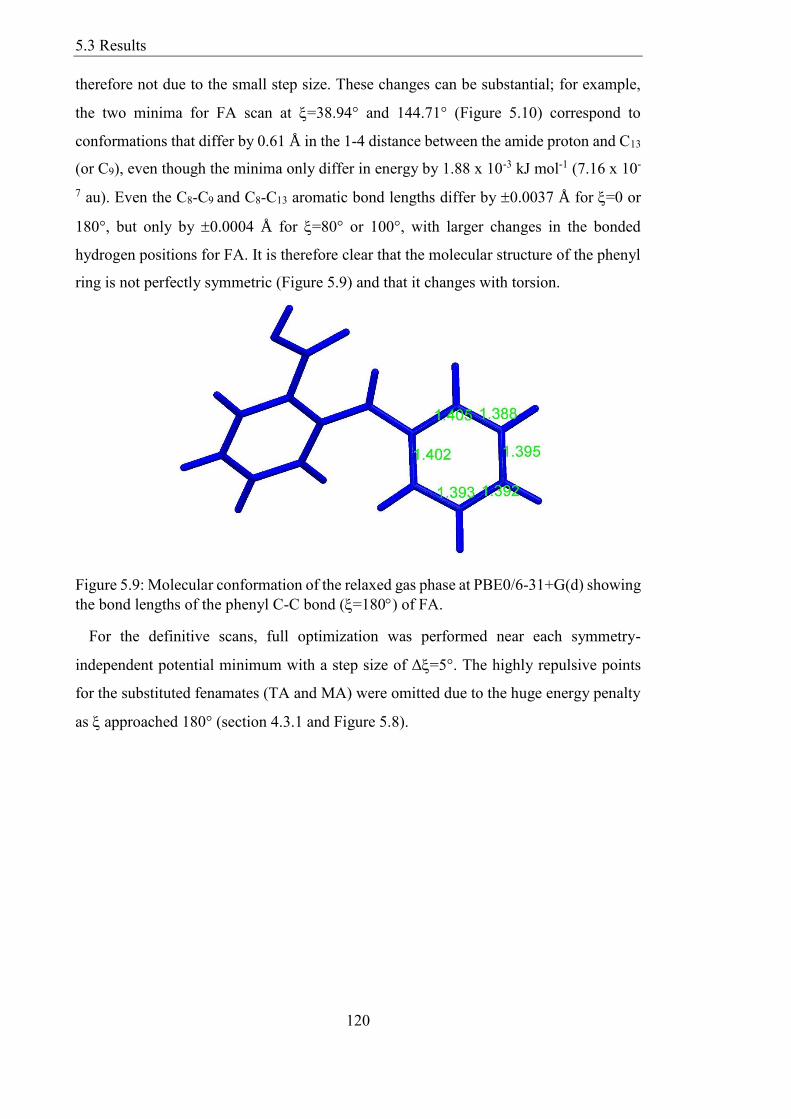
Figure 59 Molecular conformation of the relaxed gas phase at PBE06-31+G(d) showing
the bond lengths of the phenyl C-C bond (=180) of FA 120
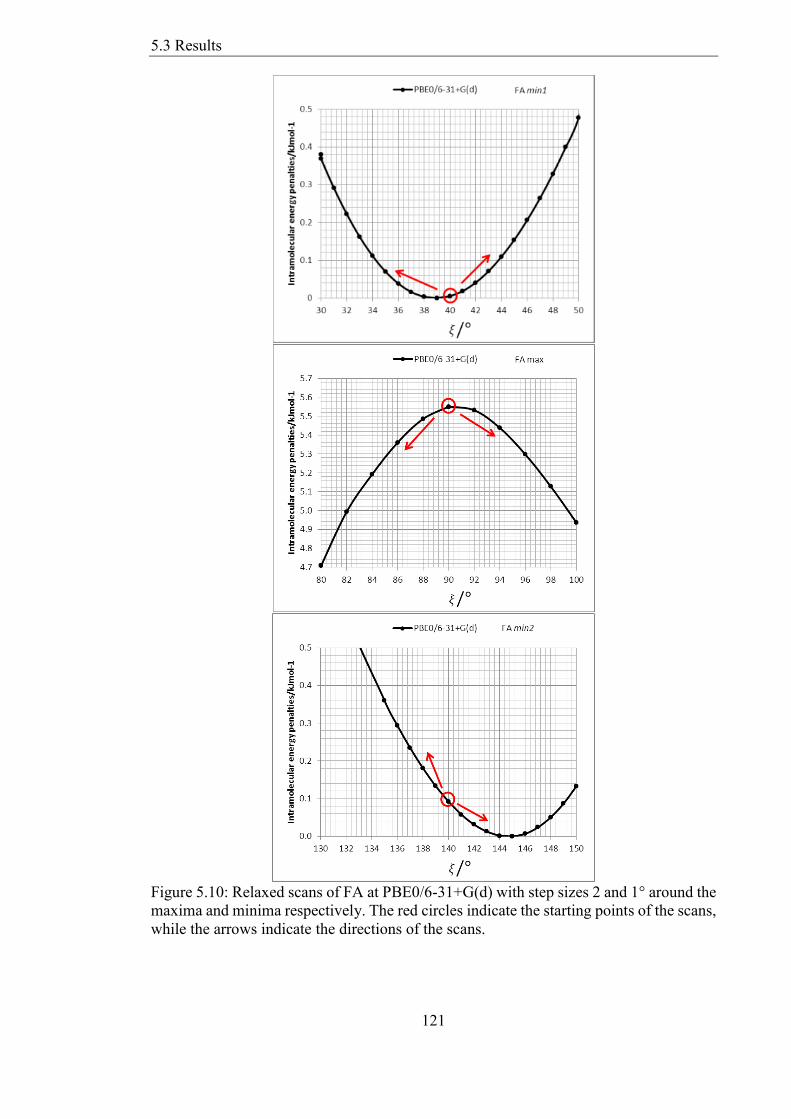
Figure 510 Relaxed scans of FA at PBE06-31+G(d) with step sizes 2 and 1deg around the
maxima and minima respectively The red circles indicate the starting points of the scans
while the arrows indicate the directions of the scans 121
Figure 511 Relaxed conformational scans at the PBE06-31+G(d) level of theory for the
fenamates The minima were at ξ=3894deg and 14471deg for FA 4063deg and 11186deg for
TA 4408deg and 11048deg for MA and 3586deg and 14838deg for ClFA 122
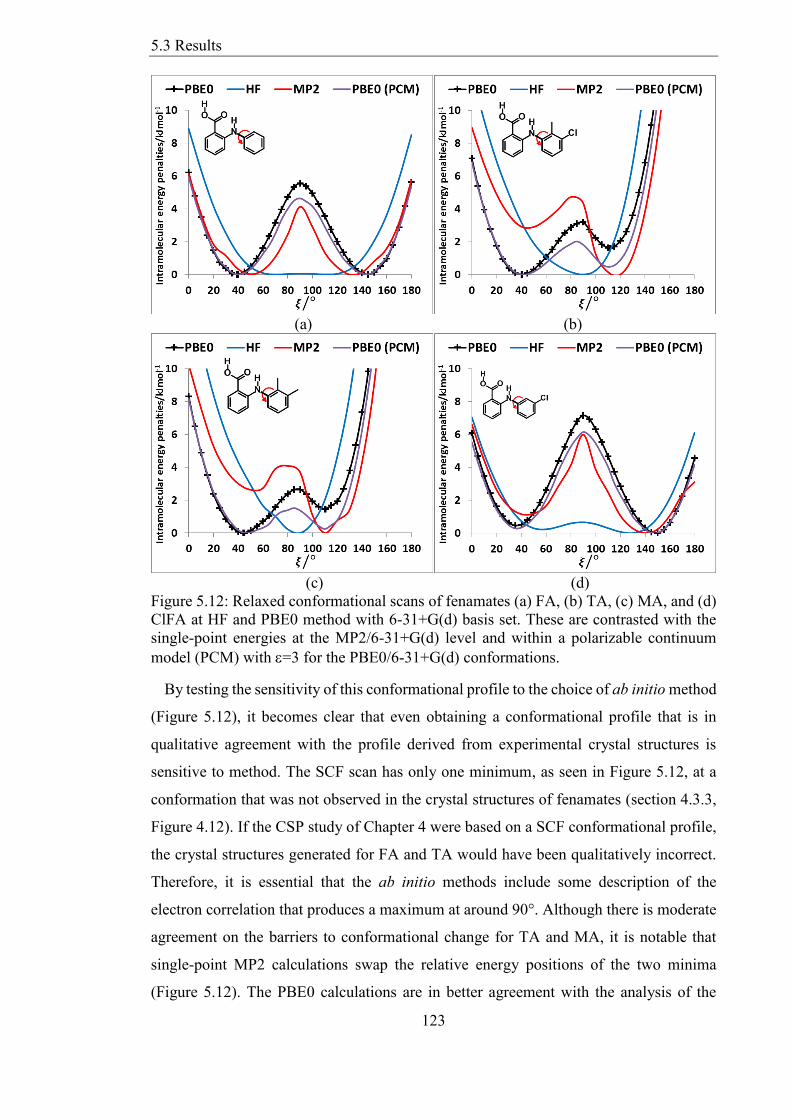
Figure 512 Relaxed conformational scans of fenamates (a) FA (b) TA (c) MA and (d)
ClFA at HF and PBE0 method with 6-31+G(d) basis set These are contrasted with the
single-point energies at the MP26-31+G(d) level and within a polarizable continuum
model (PCM) with =3 for the PBE06-31+G(d) conformations 123
Figure 513 Comparison of relaxed (solid) and rigid (dotted line) scan of FA (top) TA
(middle) and MA (right) For the rigid scans calculations were performed using HF MP2
and PBE0 methods with 6-31+G(d) basis set as a function of torsion angle The relaxed
scans from Figure 511 were performed at the PBE06-31+G(d) level of theory 125
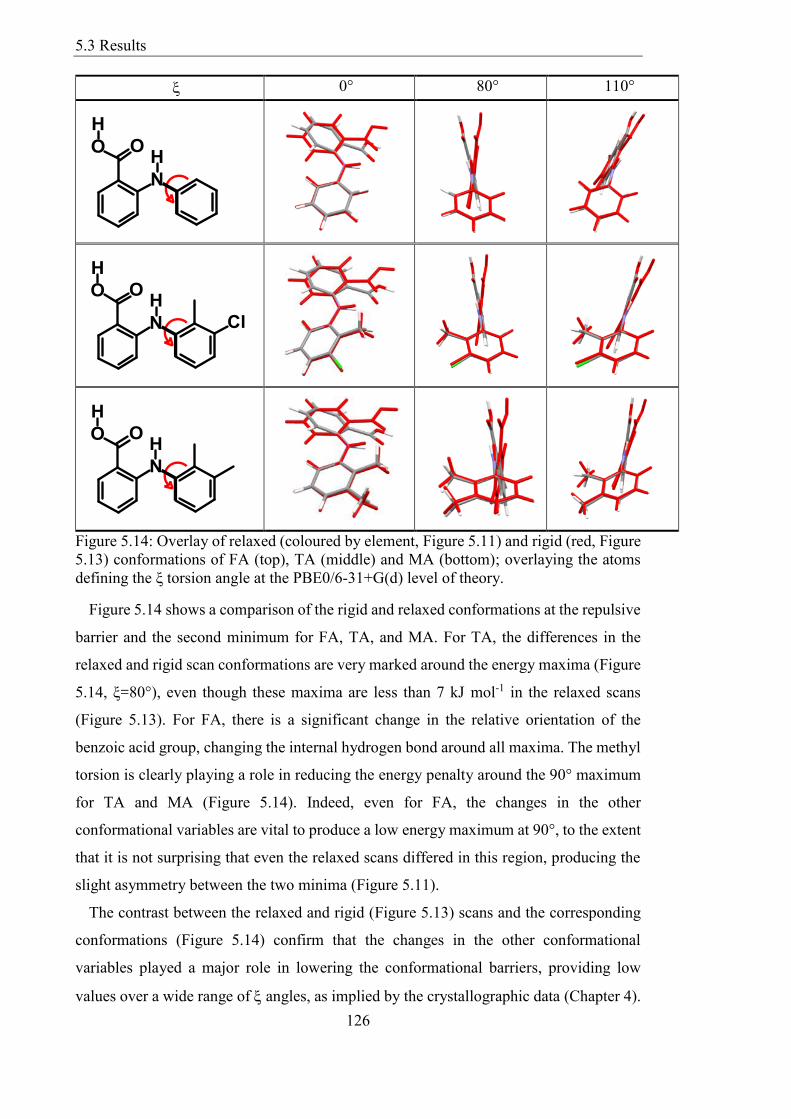
Figure 514 Overlay of relaxed (coloured by element Figure 511) and rigid (red Figure
513) conformations of FA (top) TA (middle) and MA (bottom) overlaying the atoms
defining the ξ torsion angle at the PBE06-31+G(d) level of theory 126
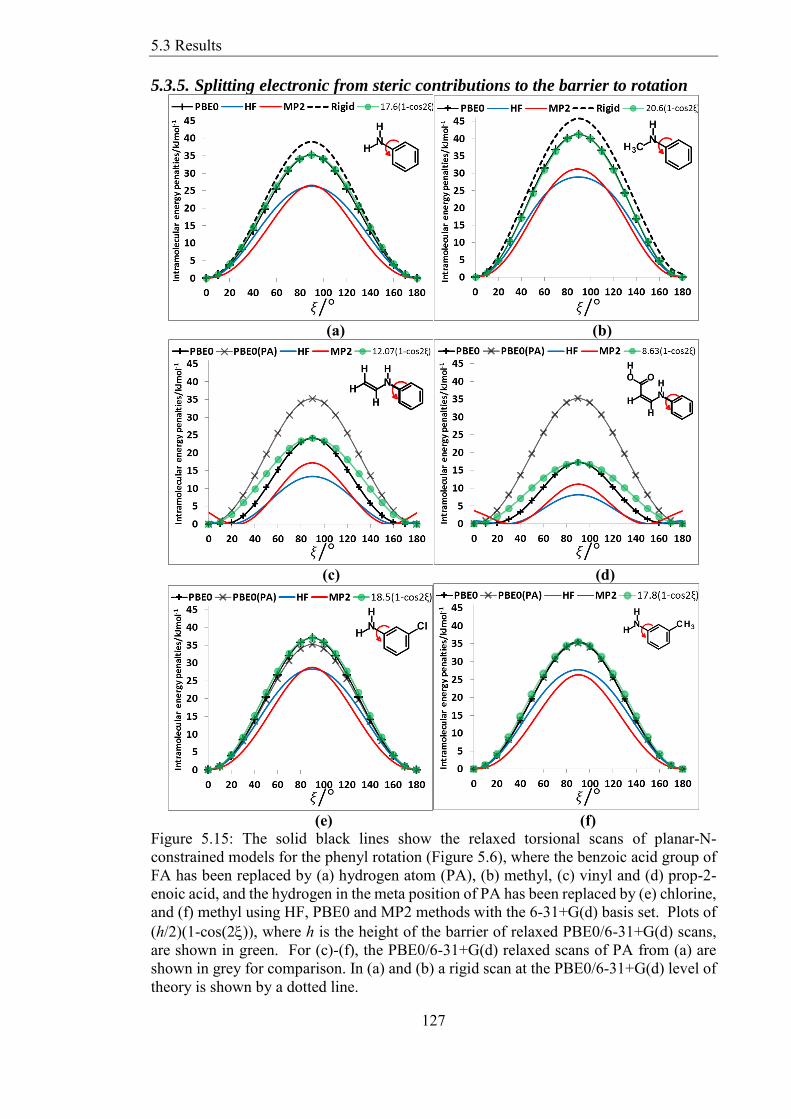
Figure 515 The solid black lines show the relaxed torsional scans of planar-N-
constrained models for the phenyl rotation (Figure 56) where the benzoic acid group of
FA has been replaced by (a) hydrogen atom (PA) (b) methyl (c) vinyl and (d) prop-2-
enoic acid and the hydrogen in the meta position of PA has been replaced by (e) chlorine
and (f) methyl using HF PBE0 and MP2 methods with the 6-31+G(d) basis set Plots of
(h2)(1-cos(2)) where h is the height of the barrier of relaxed PBE06-31+G(d) scans
List of Figures
16
are shown in green For (c)-(f) the PBE06-31+G(d) relaxed scans of PA from (a) are
shown in grey for comparison In (a) and (b) a rigid scan at the PBE06-31+G(d) level of
theory is shown by a dotted line 127
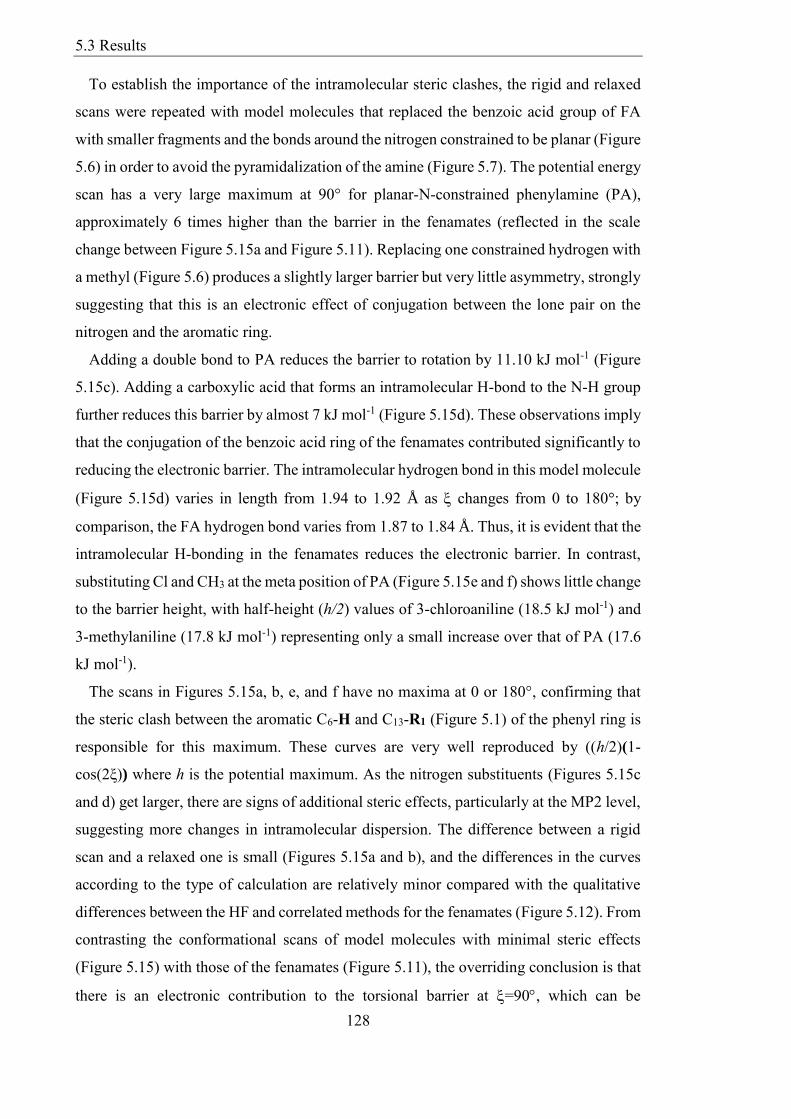
Figure 516 The electron density surface of HOMO frontier orbitals for different
conformations of PA (top) FA (middle) and TA (bottom) obtained from the PBE06-
31+G(d) level of theory Contour map isovalues were drawn at a 002 au level 129
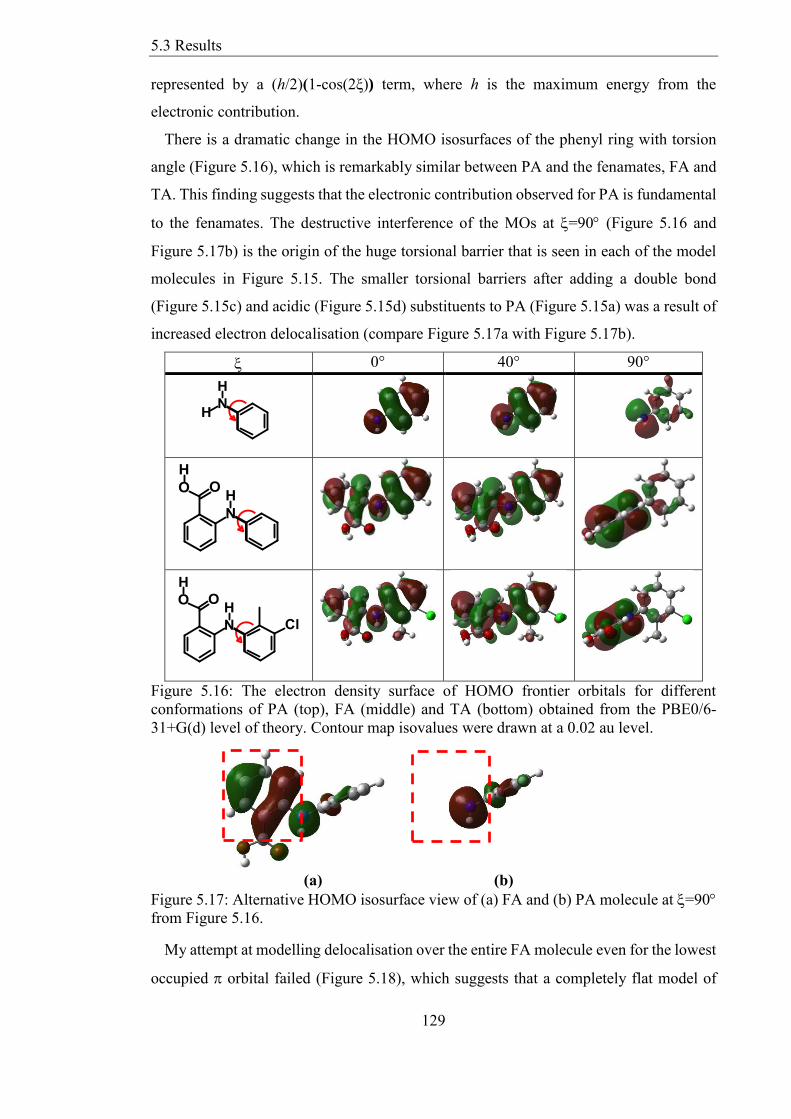
Figure 517 Alternative HOMO isosurface view of (a) FA and (b) PA molecule at =90
from Figure 516 129
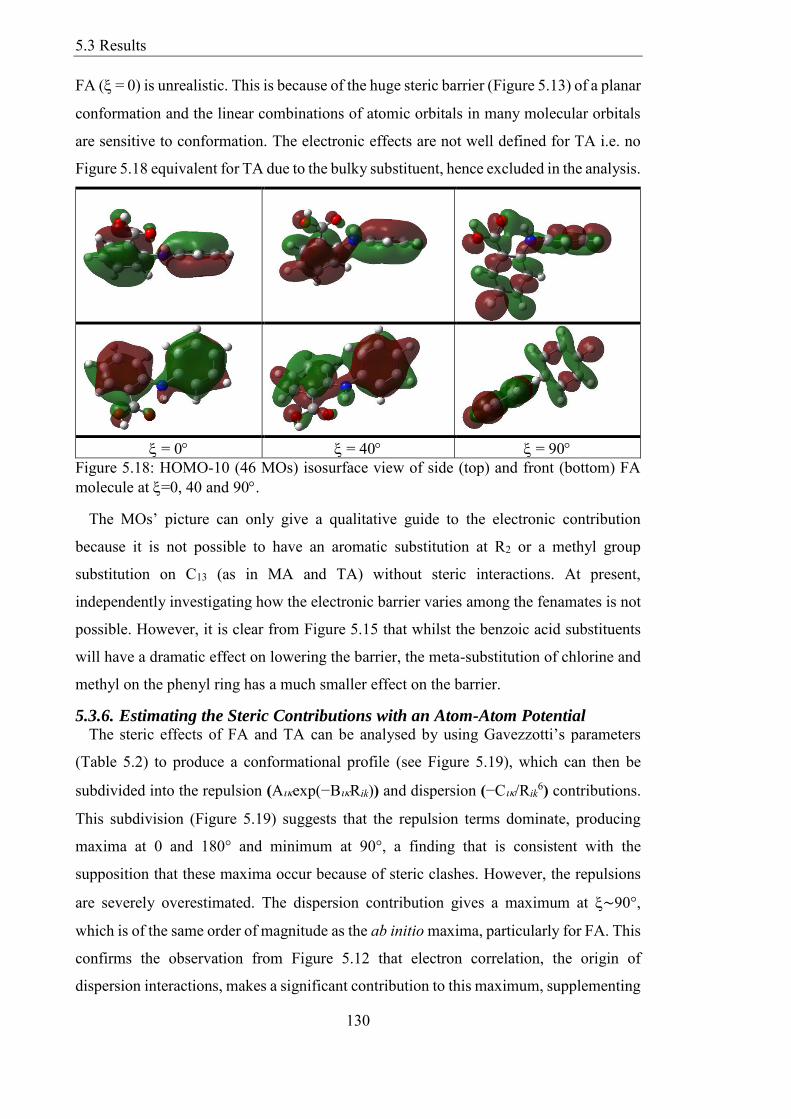
Figure 518 HOMO-10 (46 MOs) isosurface view of side (top) and front (bottom) FA
molecule at =0 40 and 90 130
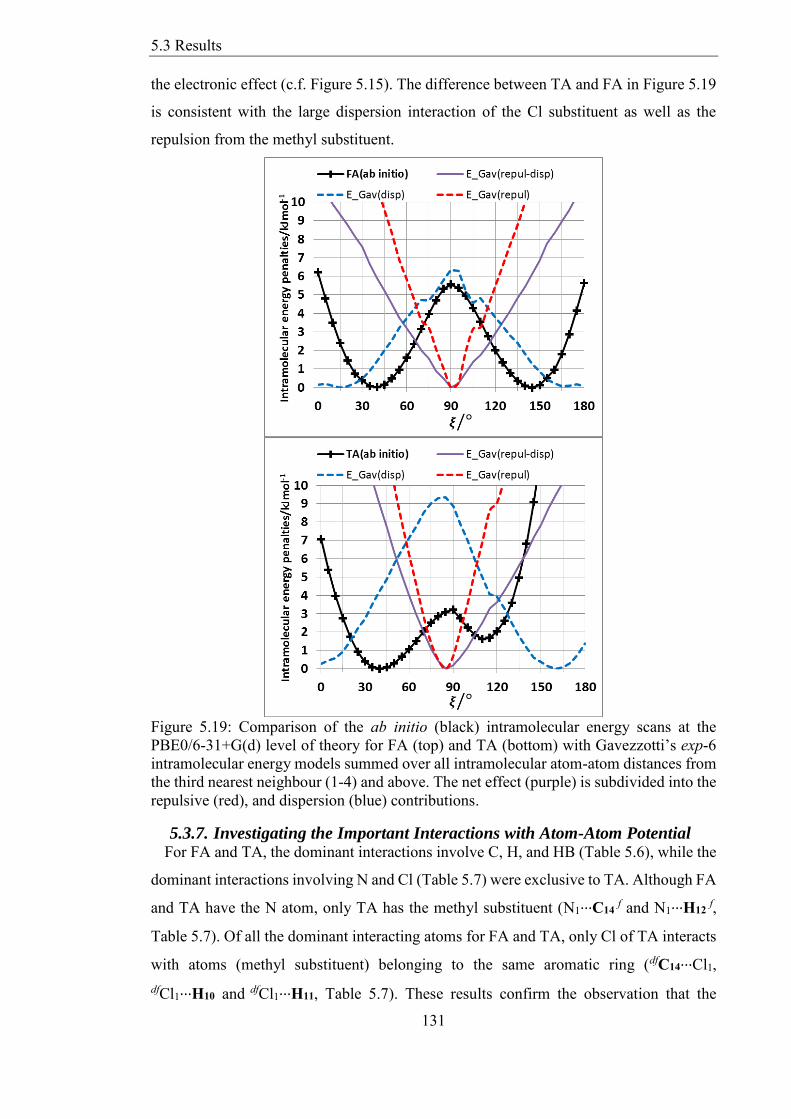
Figure 519 Comparison of the ab initio (black) intramolecular energy scans at the
PBE06-31+G(d) level of theory for FA (top) and TA (bottom) with Gavezzottirsquos exp-6
intramolecular energy models summed over all intramolecular atom-atom distances from
the third nearest neighbour (1-4) and above The net effect (purple) is subdivided into the
repulsive (red) and dispersion (blue) contributions 131
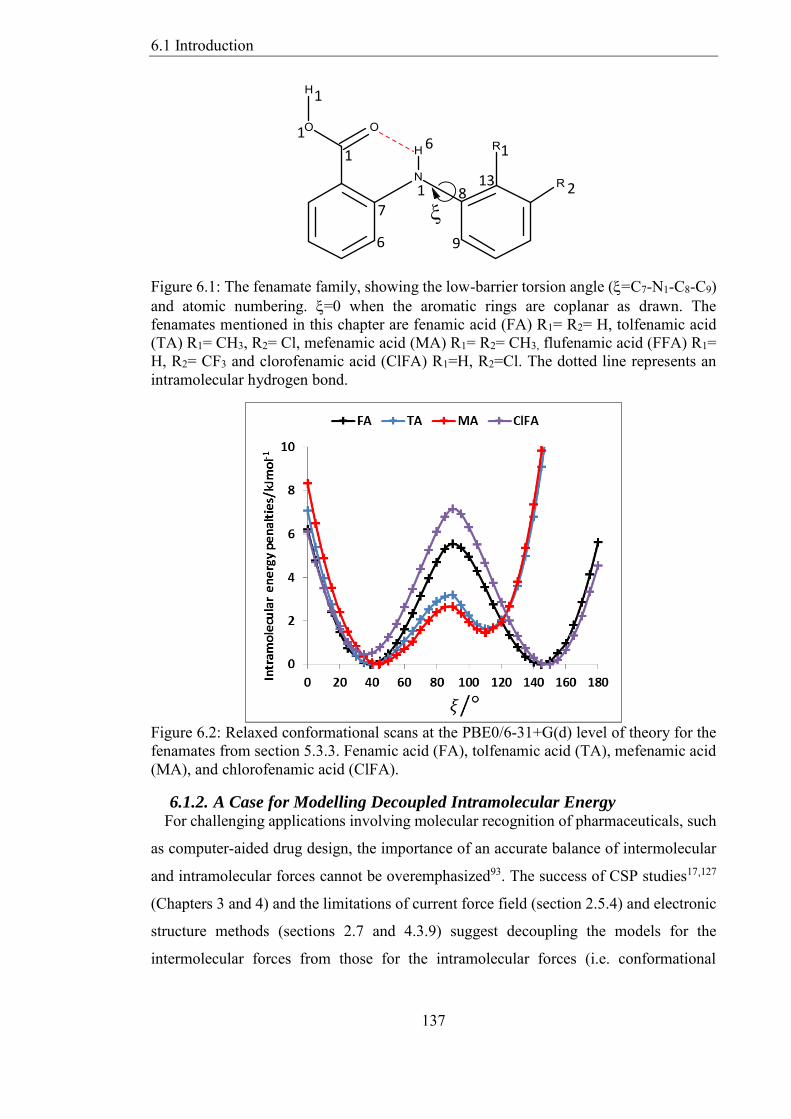
Figure 61 The fenamate family showing the low-barrier torsion angle (=C7-N1-C8-C9)
and atomic numbering =0 when the aromatic rings are coplanar as drawn The
fenamates mentioned in this chapter are fenamic acid (FA) R1= R2= H tolfenamic acid
(TA) R1= CH3 R2= Cl mefenamic acid (MA) R1= R2= CH3 flufenamic acid (FFA) R1=
H R2= CF3 and clorofenamic acid (ClFA) R1=H R2=Cl The dotted line represents an
intramolecular hydrogen bond 137
Figure 62 Relaxed conformational scans at the PBE06-31+G(d) level of theory for the
fenamates from section 533 Fenamic acid (FA) tolfenamic acid (TA) mefenamic acid
(MA) and chlorofenamic acid (ClFA) 137
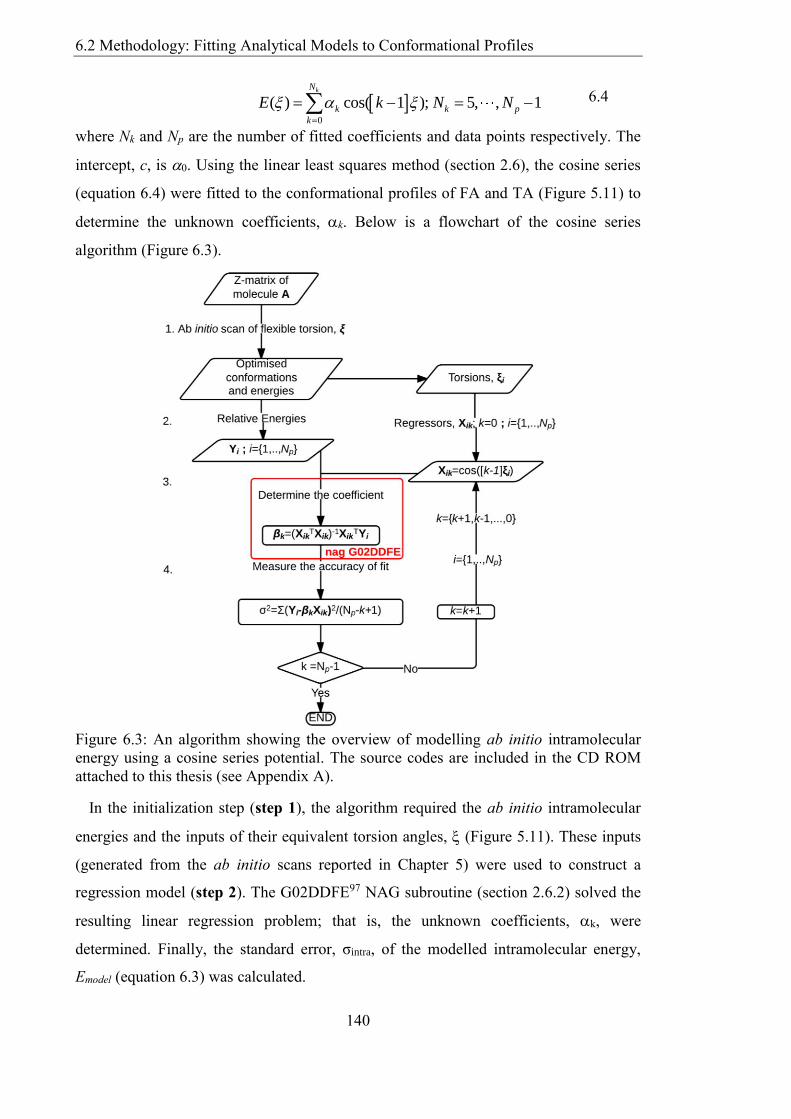
Figure 63 An algorithm showing the overview of modelling ab initio intramolecular
energy using a cosine series potential The source codes are included in the CD ROM
attached to this thesis (see Appendix A) 140
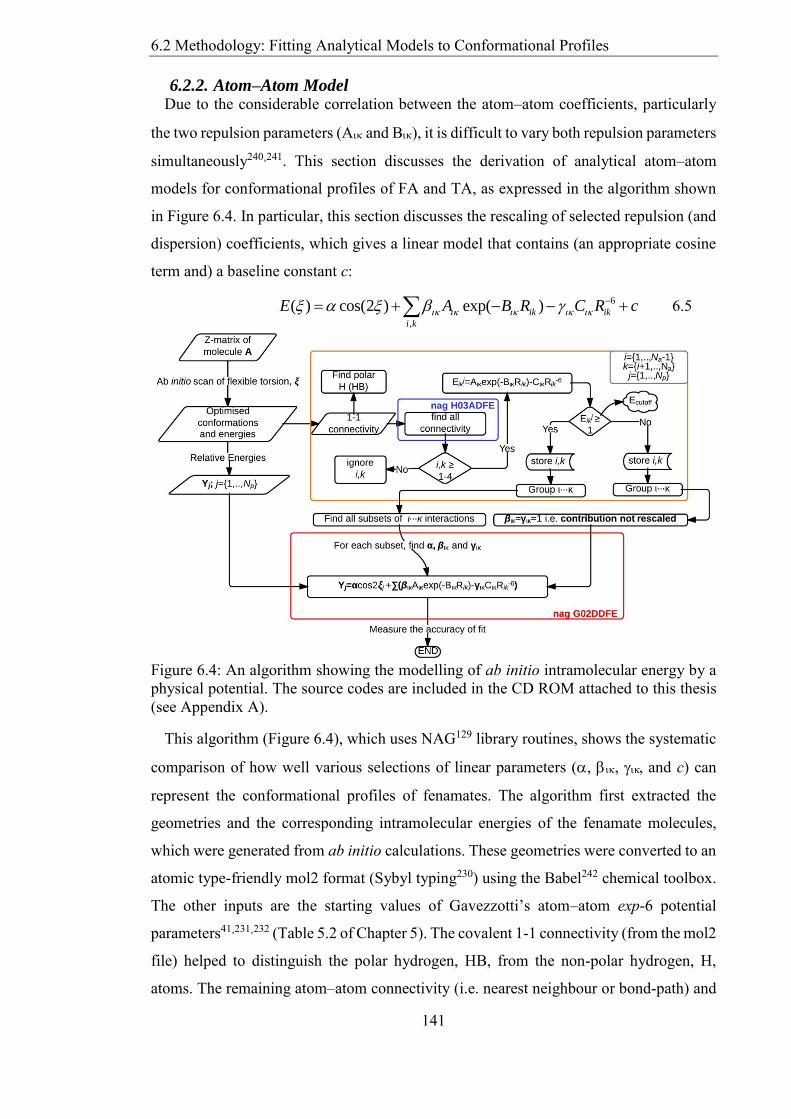
Figure 64 An algorithm showing the modelling of ab initio intramolecular energy by a
physical potential The source codes are included in the CD ROM attached to this thesis
(see Appendix A) 141
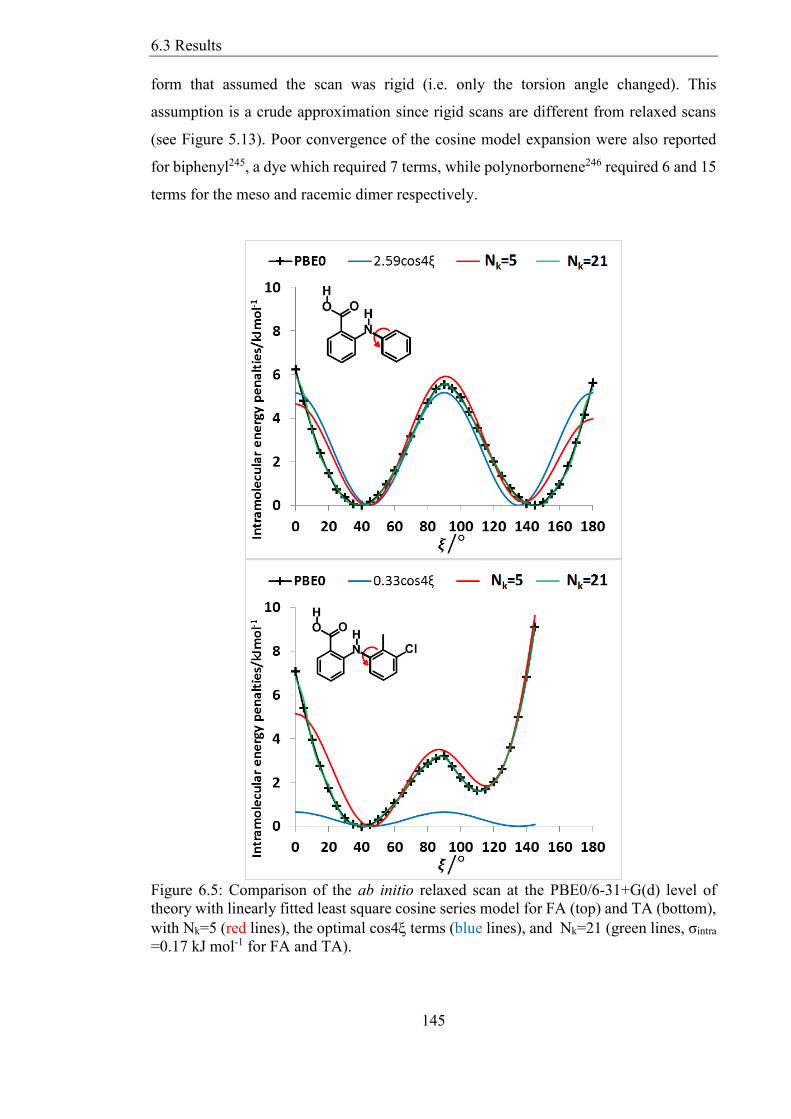
Figure 65 Comparison of the ab initio relaxed scan at the PBE06-31+G(d) level of
theory with linearly fitted least square cosine series model for FA (top) and TA (bottom)
with Nk=5 (red lines) the optimal cos4 terms (blue lines) and Nk=21 (green lines σintra
=017 kJ mol-1 for FA and TA) 145
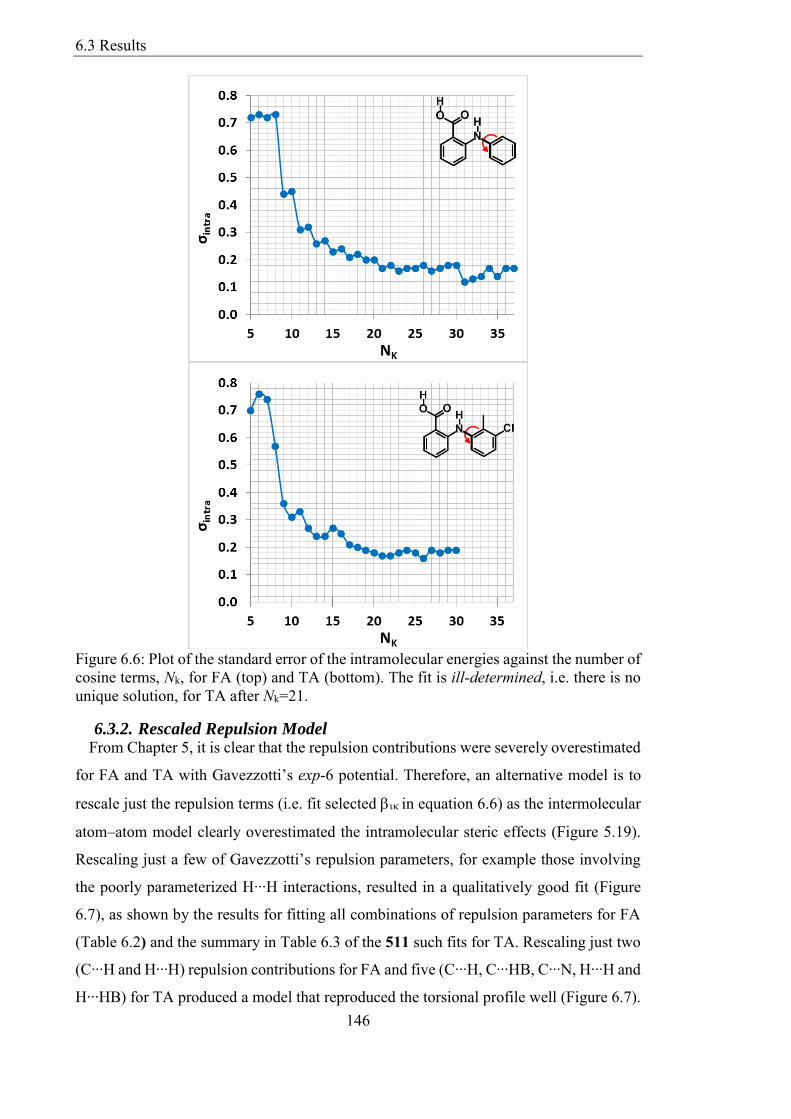
Figure 66 Plot of the standard error of the intramolecular energies against the number of
cosine terms Nk for FA (top) and TA (bottom) The fit is ill-determined ie there is no
unique solution for TA after Nk=21 146
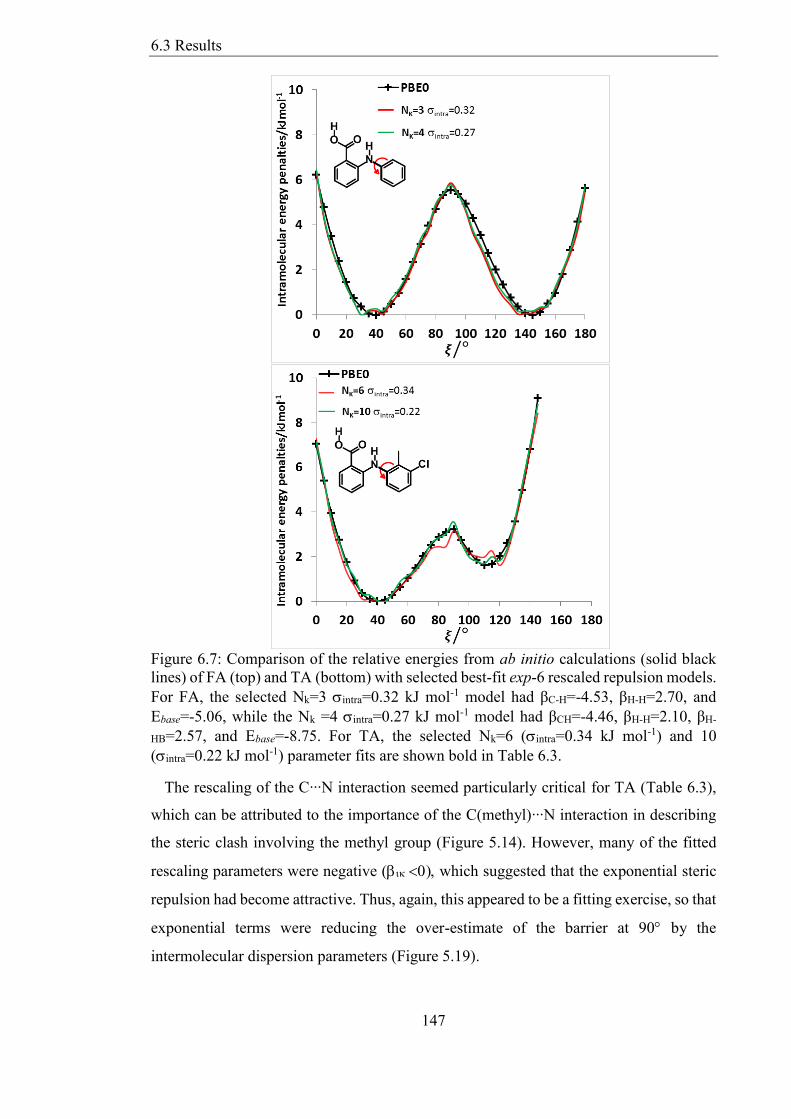
Figure 67 Comparison of the relative energies from ab initio calculations (solid black
lines) of FA (top) and TA (bottom) with selected best-fit exp-6 rescaled repulsion models
For FA the selected Nk=3 intra=032 kJ mol-1 model had βC-H=-453 βH-H=270 and
Ebase=-506 while the Nk =4 intra=027 kJ mol-1 model had βCH=-446 βH-H=210 βH-
List of Figures
17
HB=257 and Ebase=-875 For TA the selected Nk=6 (intra=034 kJ mol-1) and 10
(intra=022 kJ mol-1) parameter fits are shown bold in Table 63 147
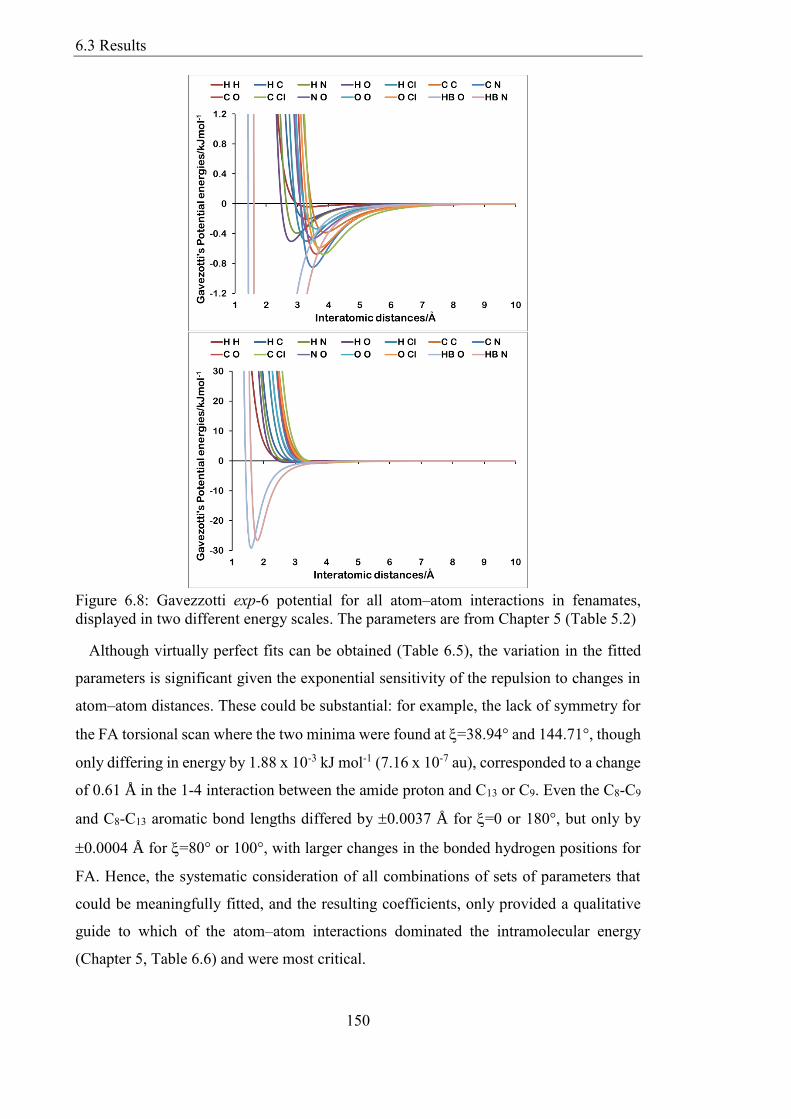
Figure 68 Gavezzotti exp-6 potential for all atomndashatom interactions in fenamates
displayed in two different energy scales The parameters are from Chapter 5 (Table 52)
150
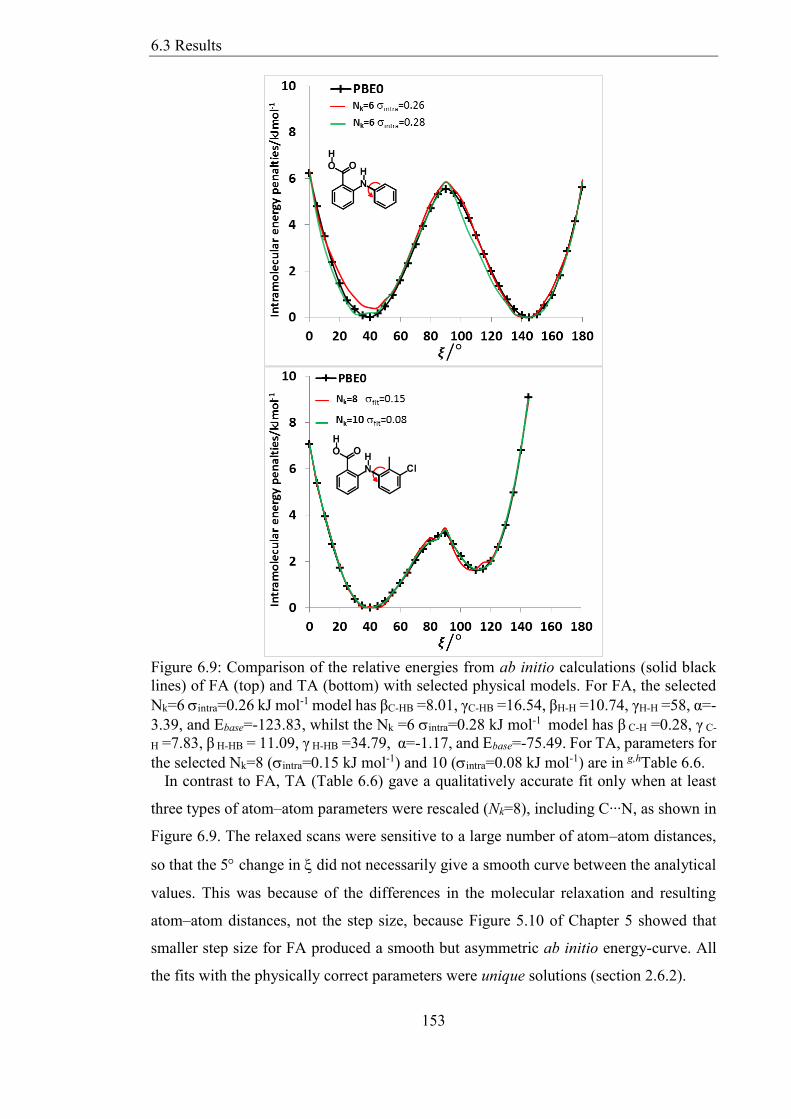
Figure 69 Comparison of the relative energies from ab initio calculations (solid black
lines) of FA (top) and TA (bottom) with selected physical models For FA the selected
Nk=6 intra=026 kJ mol-1 model has βC-HB =801 γC-HB =1654 βH-H =1074 γH-H =58 α=-
339 and Ebase=-12383 whilst the Nk =6 intra=028 kJ mol-1 model has β C-H =028 γ C-
H =783 β H-HB = 1109 γ H-HB =3479 α=-117 and Ebase=-7549 For TA parameters for
the selected Nk=8 (intra=015 kJ mol-1) and 10 (intra=008 kJ mol-1) are in ghTable 66
153
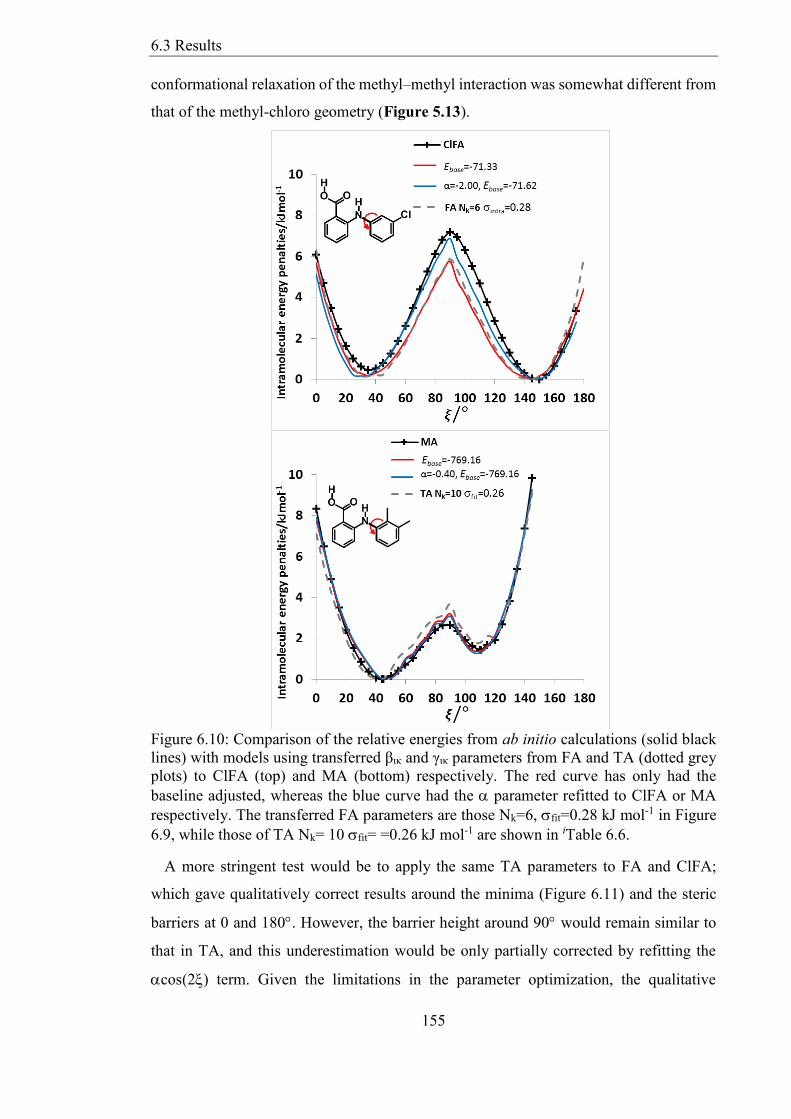
Figure 610 Comparison of the relative energies from ab initio calculations (solid black
lines) with models using transferred βικ and γικ parameters from FA and TA (dotted grey
plots) to ClFA (top) and MA (bottom) respectively The red curve has only had the
baseline adjusted whereas the blue curve had the parameter refitted to ClFA or MA
respectively The transferred FA parameters are those Nk=6 fit=028 kJ mol-1 in Figure
69 while those of TA Nk= 10 fit= =026 kJ mol-1 are shown in iTable 66 155
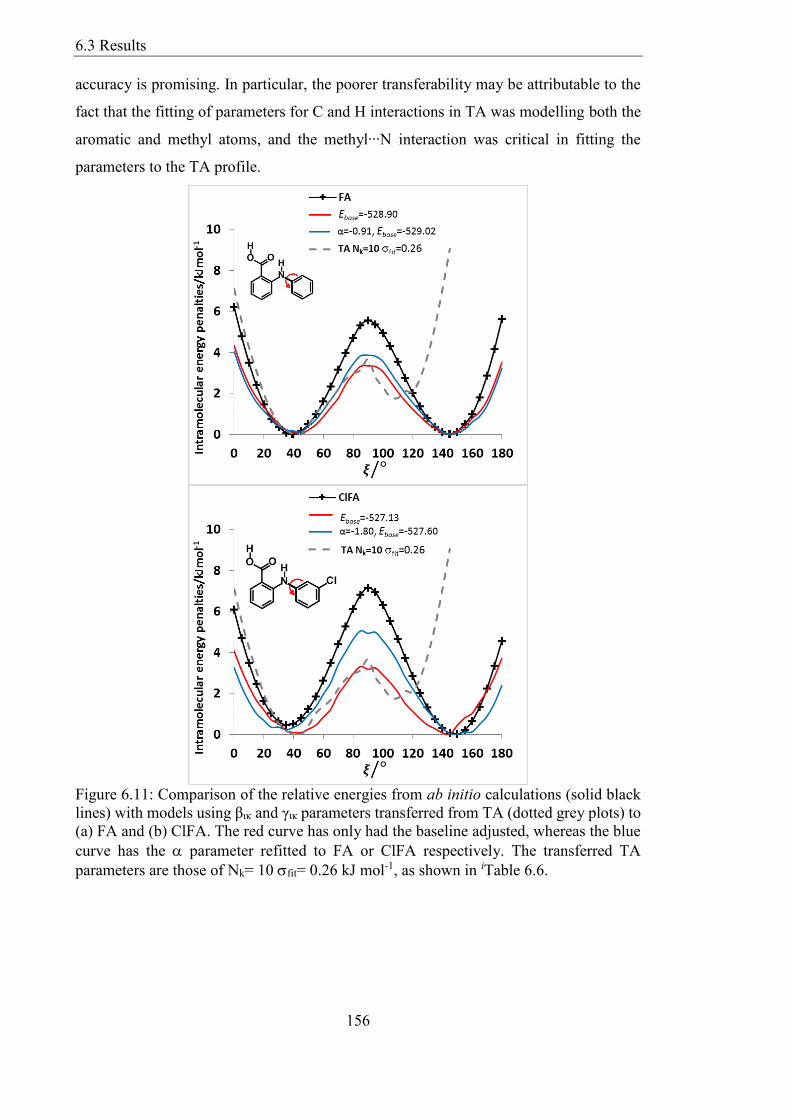
Figure 611 Comparison of the relative energies from ab initio calculations (solid black
lines) with models using βικ and γικ parameters transferred from TA (dotted grey plots) to
(a) FA and (b) ClFA The red curve has only had the baseline adjusted whereas the blue
curve has the parameter refitted to FA or ClFA respectively The transferred TA
parameters are those of Nk= 10 fit= 026 kJ mol-1 as shown in iTable 66 156
List of Tables
18
List of Tables
Table 31 Angles and bond lengths of the tetrazole ring in BT No information about the
bonds or angles were given to me prior to submission of the candidate structures 64
Table 32 Summary of experimental (highlighted in blue) and computed crystal
structures on the PCM energy landscape (Figure 36) The computed structure that
matched the experimental structure (section 312) is highlighted in bold For label
xBT_y x and y are energy ranked after steps 4 and 1 of CSP respectively (section 322)
70
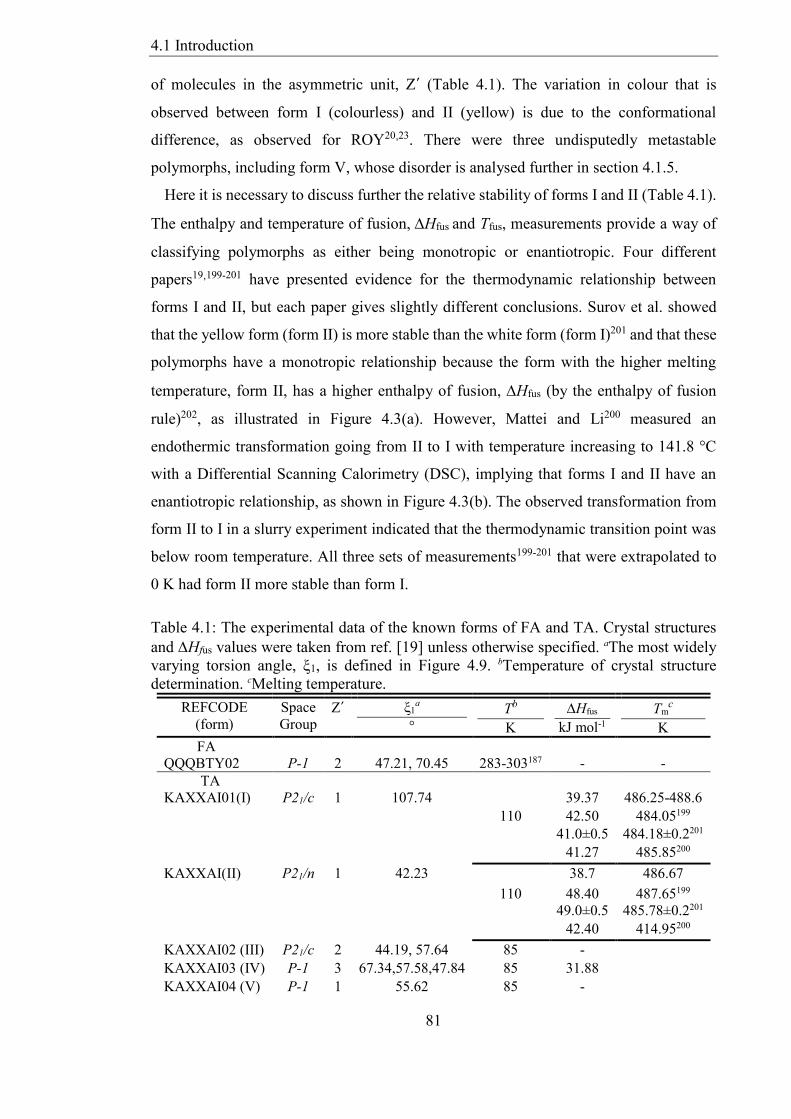
Table 41 The experimental data of the known forms of FA and TA Crystal structures
and Hfus values were taken from ref [19] unless otherwise specified aThe most widely
varying torsion angle ξ1 is defined in Figure 49 bTemperature of crystal structure
determination cMelting temperature 81
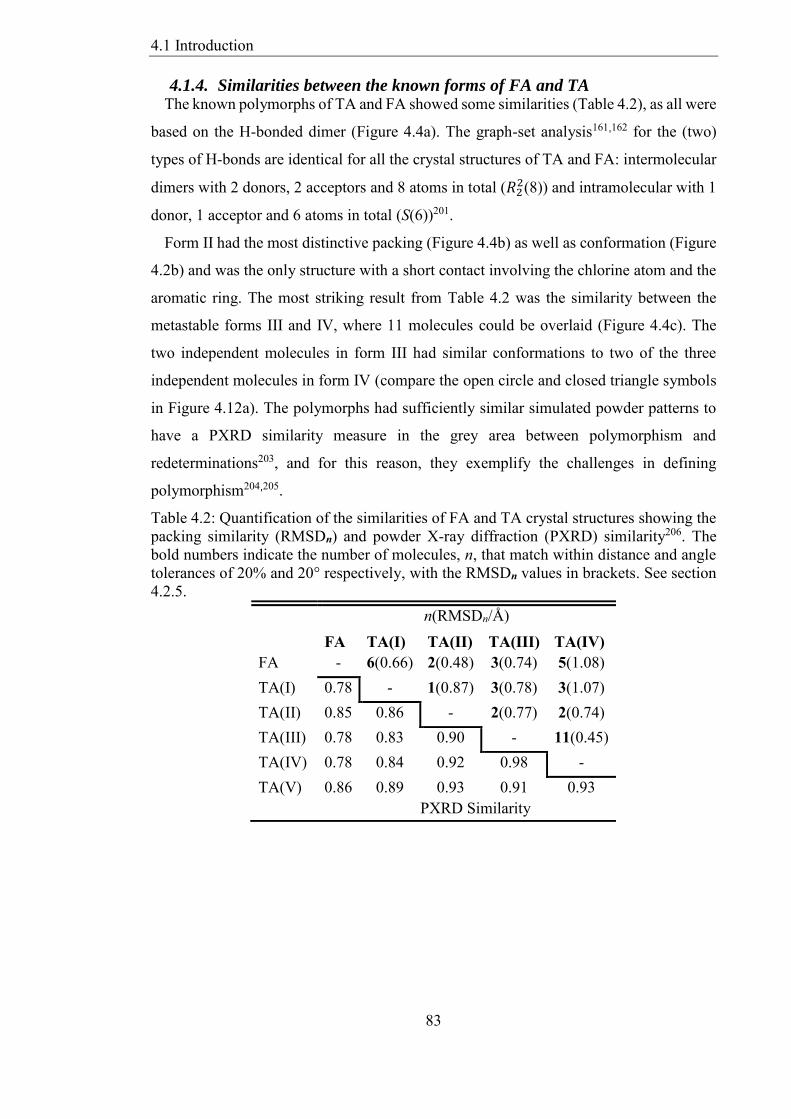
Table 42 Quantification of the similarities of FA and TA crystal structures showing the
packing similarity (RMSDn) and powder X-ray diffraction (PXRD) similarity206 The
bold numbers indicate the number of molecules n that match within distance and angle
tolerances of 20 and 20deg respectively with the RMSDn values in brackets See section
425 83
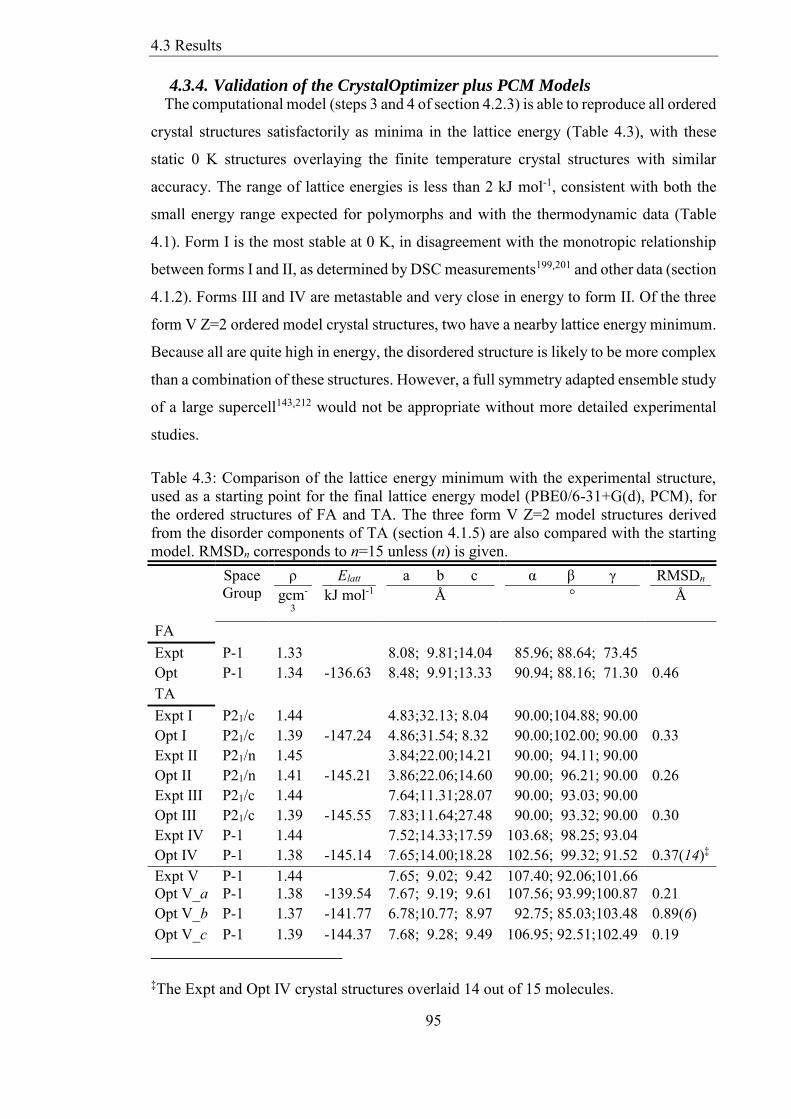
Table 43 Comparison of the lattice energy minimum with the experimental structure
used as a starting point for the final lattice energy model (PBE06-31+G(d) PCM) for
the ordered structures of FA and TA The three form V Z=2 model structures derived
from the disorder components of TA (section 415) are also compared with the starting
model RMSDn corresponds to n=15 unless (n) is given 95
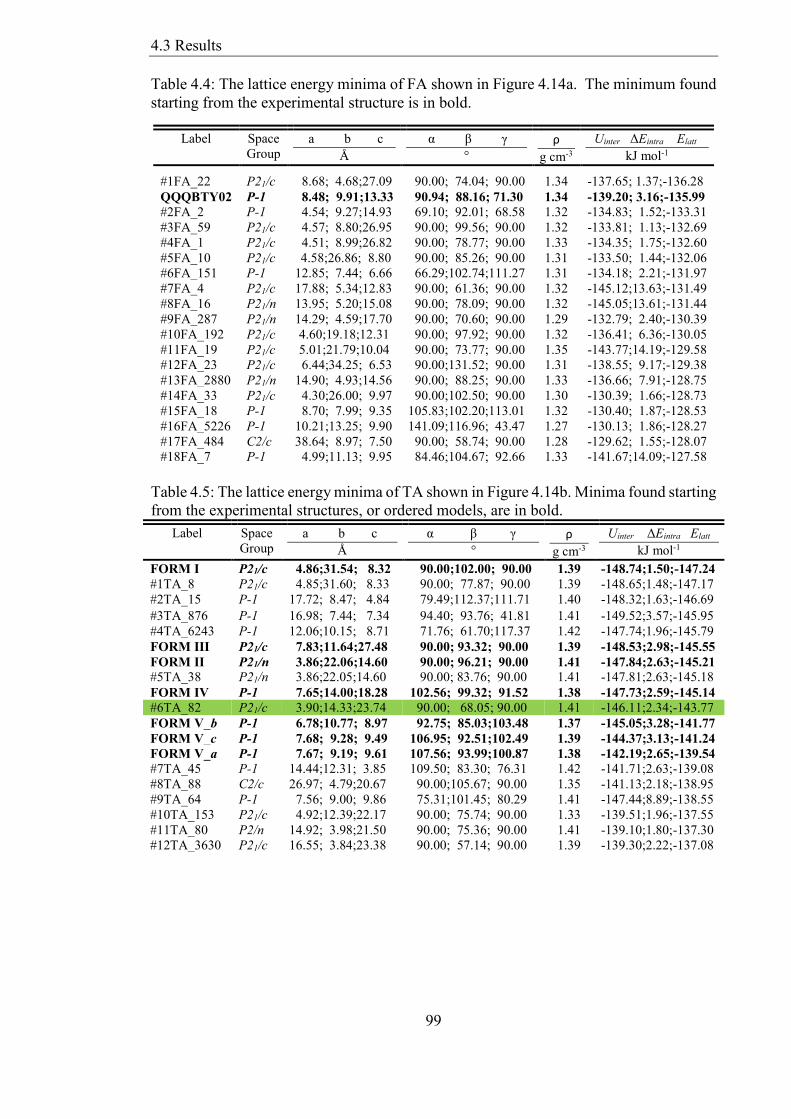
Table 44 The lattice energy minima of FA shown in Figure 414a The minimum found
starting from the experimental structure is in bold 99
Table 45 The lattice energy minima of TA shown in Figure 414b Minima found starting
from the experimental structures or ordered models are in bold 99
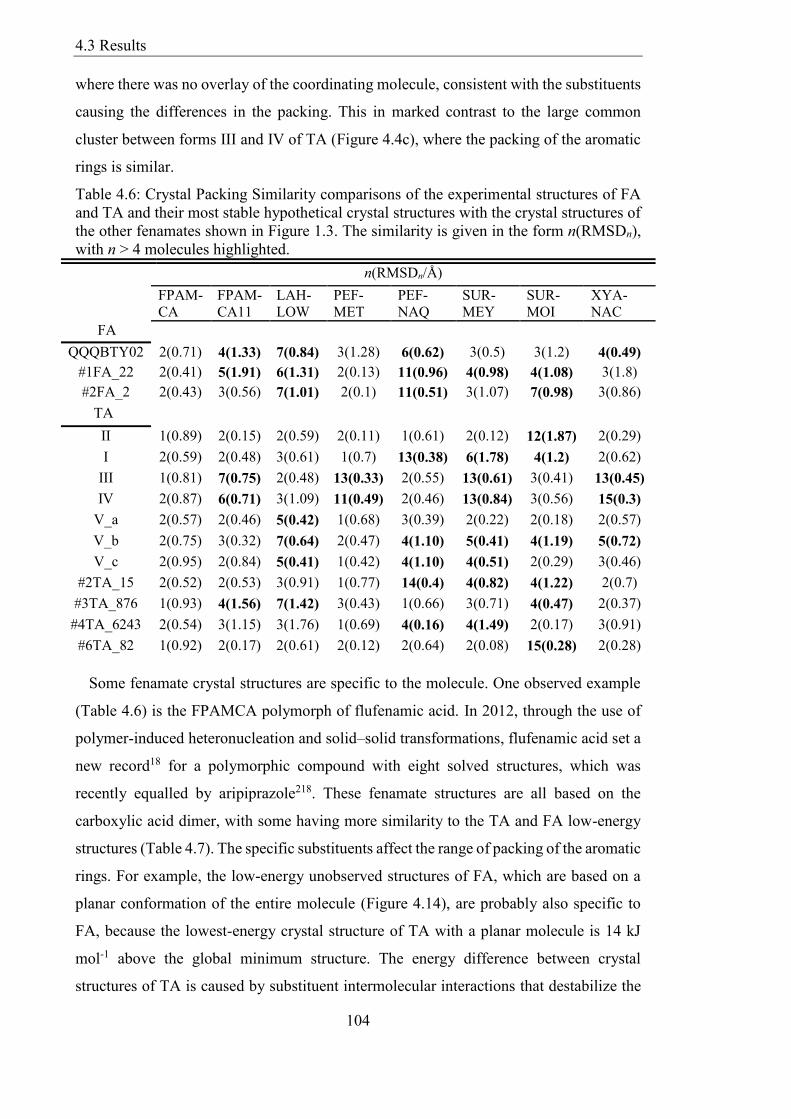
Table 46 Crystal Packing Similarity comparisons of the experimental structures of FA
and TA and their most stable hypothetical crystal structures with the crystal structures of
the other fenamates shown in Figure 13 The similarity is given in the form n(RMSDn)
with n gt 4 molecules highlighted 104
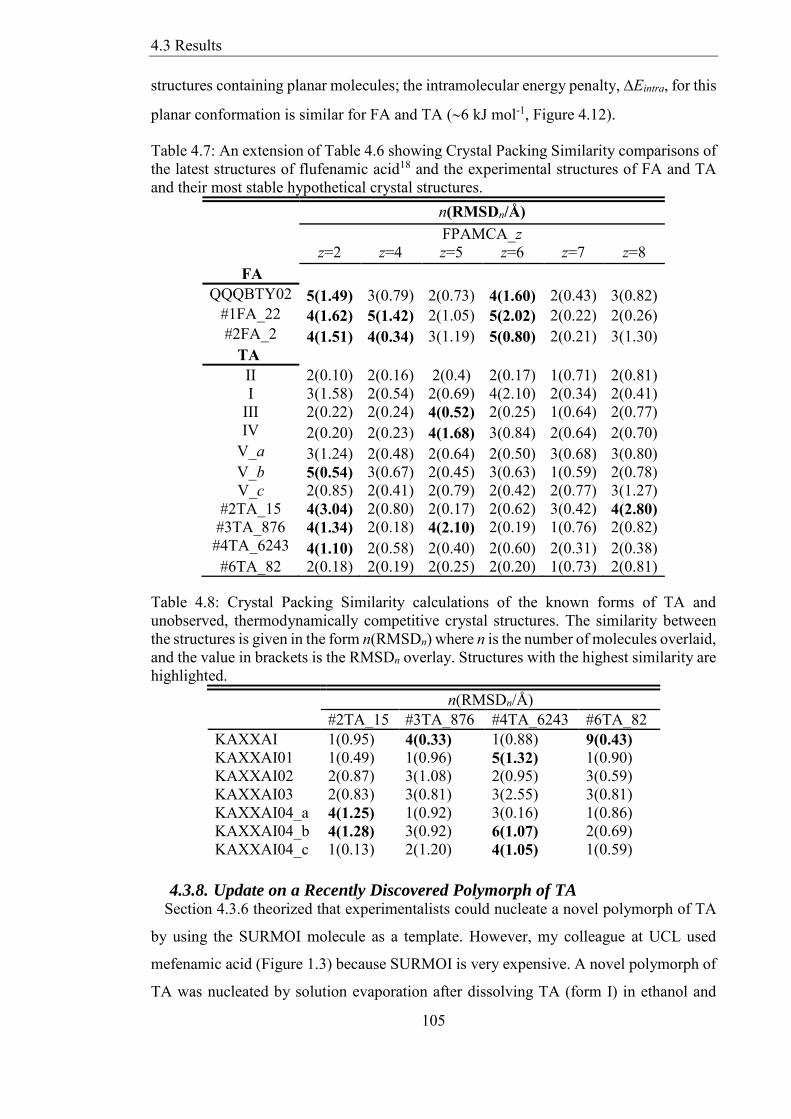
Table 47 An extension of Table 46 showing Crystal Packing Similarity comparisons of
the latest structures of flufenamic acid18 and the experimental structures of FA and TA
and their most stable hypothetical crystal structures 105
Table 48 Crystal Packing Similarity calculations of the known forms of TA and
unobserved thermodynamically competitive crystal structures The similarity between
the structures is given in the form n(RMSDn) where n is the number of molecules overlaid
and the value in brackets is the RMSDn overlay Structures with the highest similarity are
highlighted 105
Table 51 Torsional barrier height of ethane (Source Reproduced from Ref [223]) 111
List of Tables
19
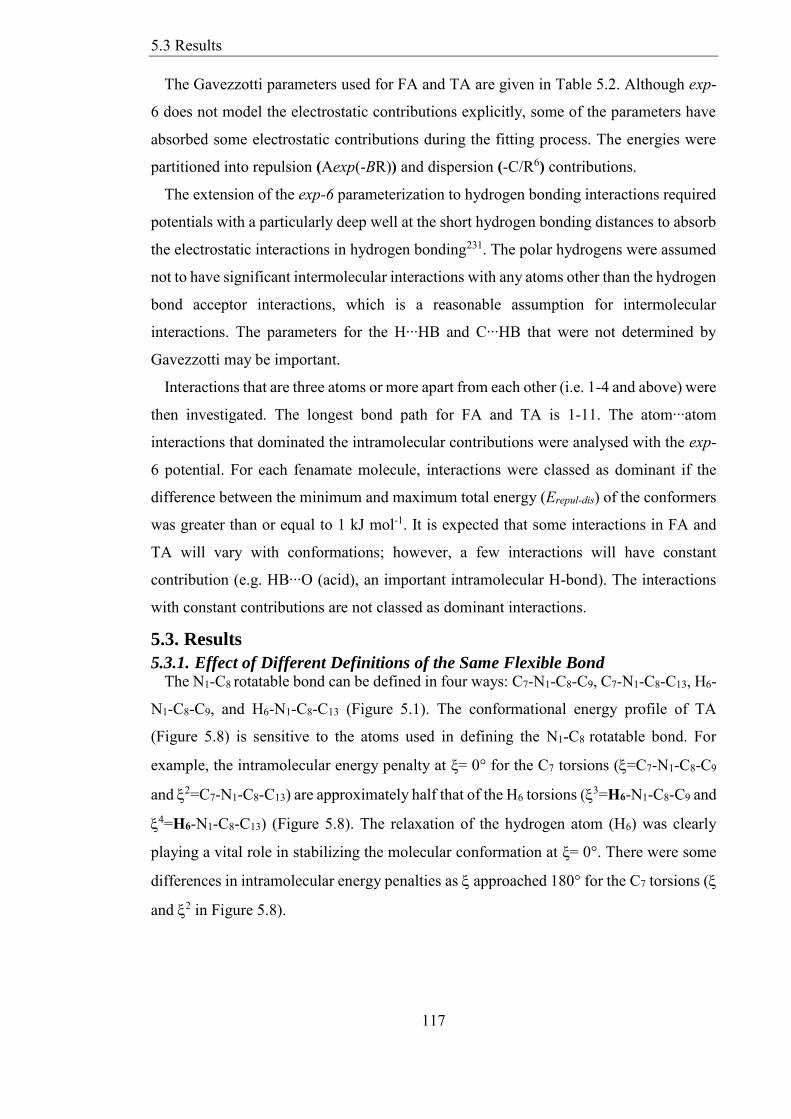
Table 52 Gavezzottirsquos exp-6 atom-atom parameters E=Aexp(-BR)-CR-6 is the well
depth and Rm is the distance at the minimum41231232 Italics represent the hydrogen-
bonded interactions aFrom the UNI intermolecular potential function of Mercury233 116
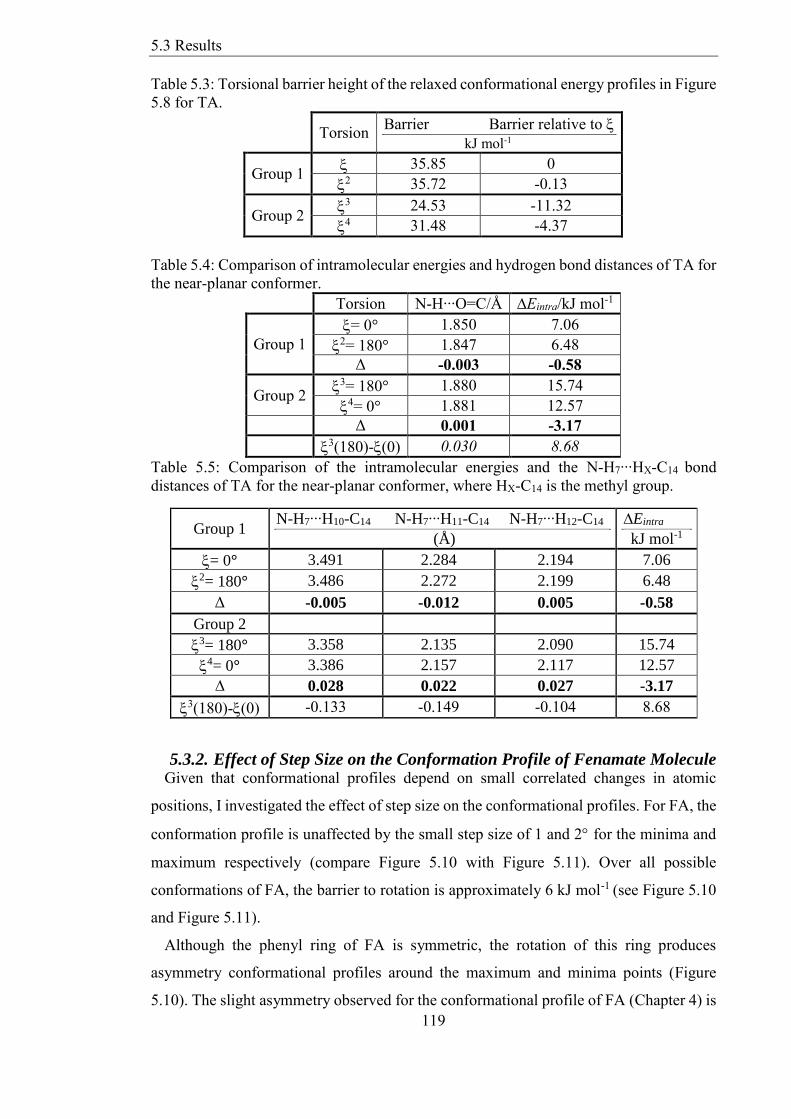
Table 53 Torsional barrier height of the relaxed conformational energy profiles in Figure
58 for TA 119
Table 54 Comparison of intramolecular energies and hydrogen bond distances of TA for
the near-planar conformer 119
Table 55 Comparison of the intramolecular energies and the N-H7∙∙∙HX-C14 bond
distances of TA for the near-planar conformer where HX-C14 is the methyl group 119
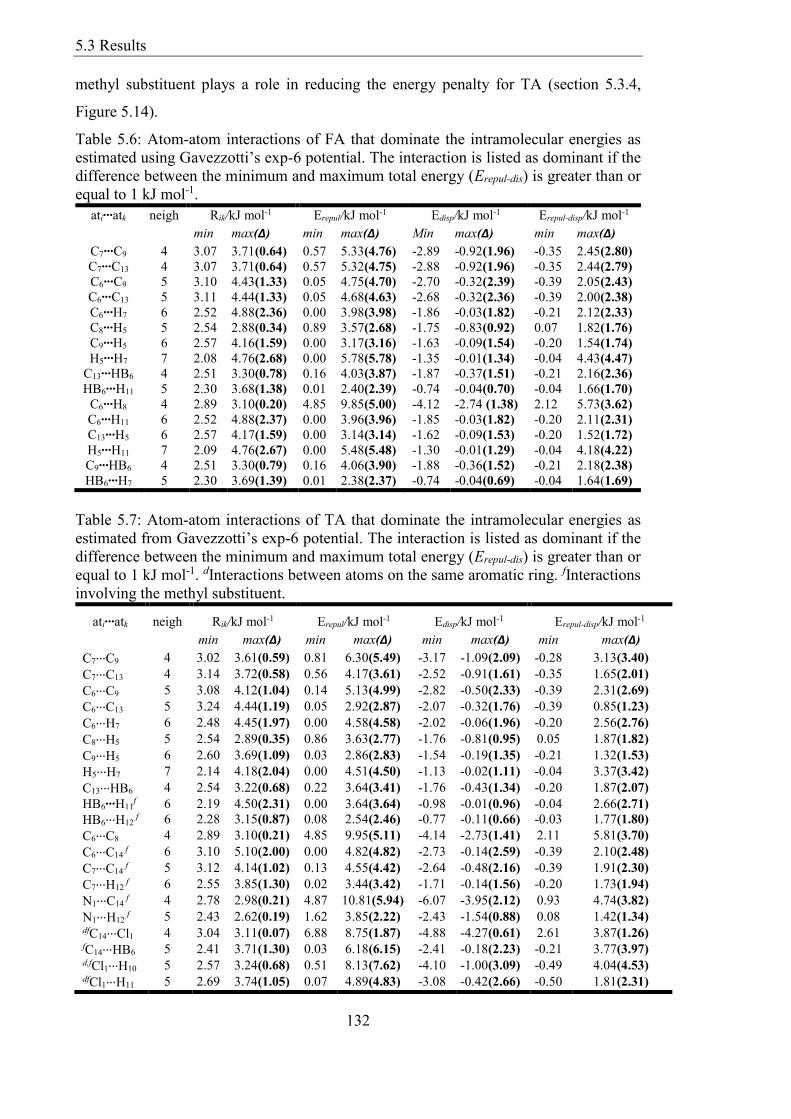
Table 56 Atom-atom interactions of FA that dominate the intramolecular energies as
estimated using Gavezzottirsquos exp-6 potential The interaction is listed as dominant if the
difference between the minimum and maximum total energy (Erepul-dis) is greater than or
equal to 1 kJ mol-1 132
Table 57 Atom-atom interactions of TA that dominate the intramolecular energies as
estimated from Gavezzottirsquos exp-6 potential The interaction is listed as dominant if the
difference between the minimum and maximum total energy (Erepul-dis) is greater than or
equal to 1 kJ mol-1 dInteractions between atoms on the same aromatic ring fInteractions
involving the methyl substituent 132
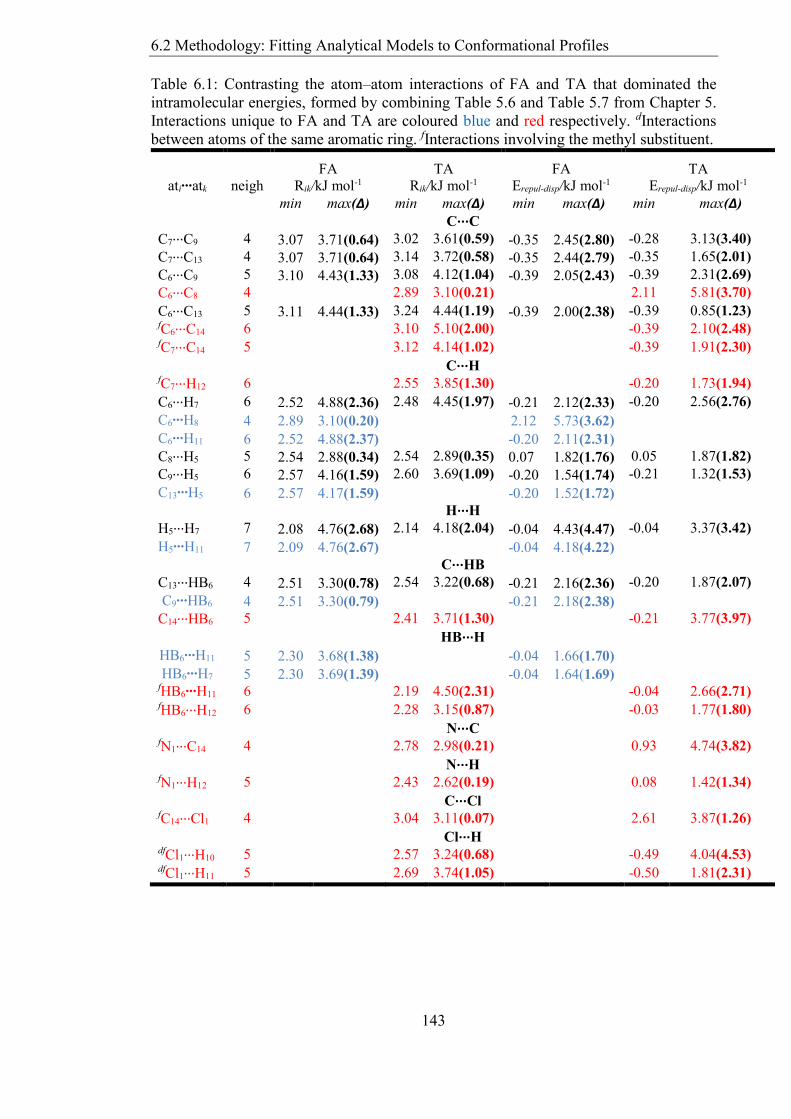
Table 61 Contrasting the atomndashatom interactions of FA and TA that dominated the
intramolecular energies formed by combining Table 56 and Table 57 from Chapter 5
Interactions unique to FA and TA are coloured blue and red respectively dInteractions
between atoms of the same aromatic ring fInteractions involving the methyl substituent
143
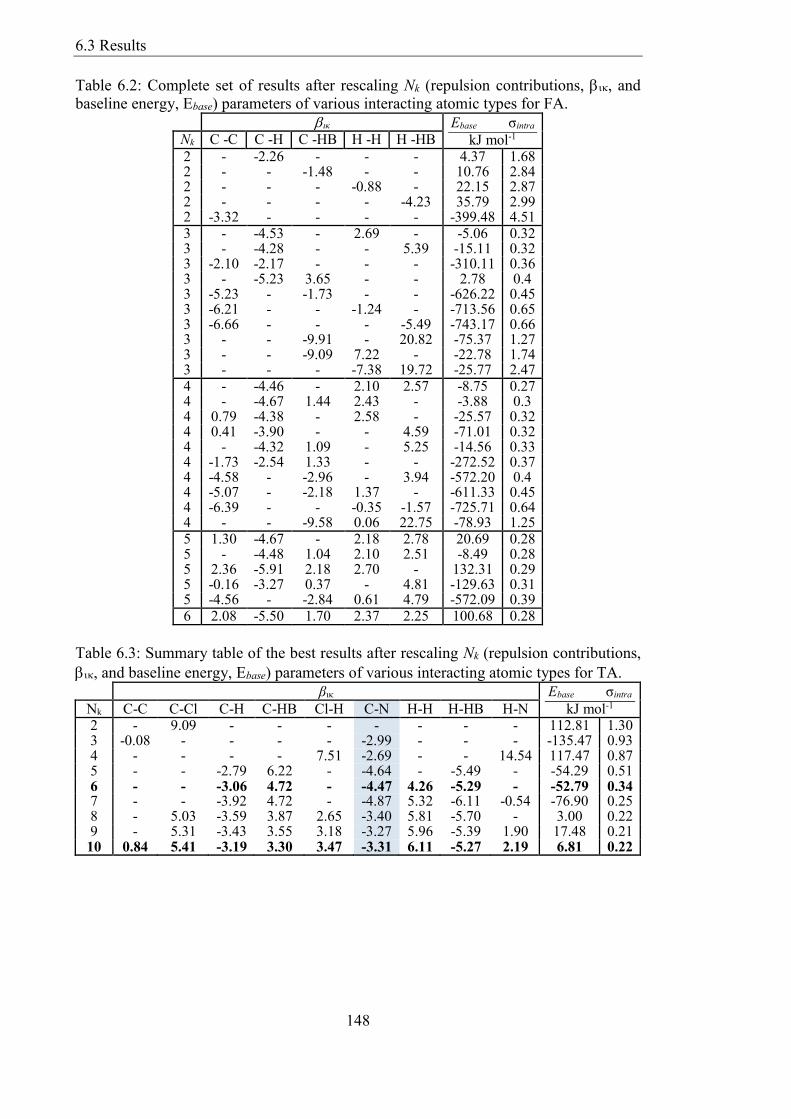
Table 62 Complete set of results after rescaling Nk (repulsion contributions and
baseline energy Ebase) parameters of various interacting atomic types for FA 148
Table 63 Summary table of the best results after rescaling Nk (repulsion contributions
and baseline energy Ebase) parameters of various interacting atomic types for TA
148
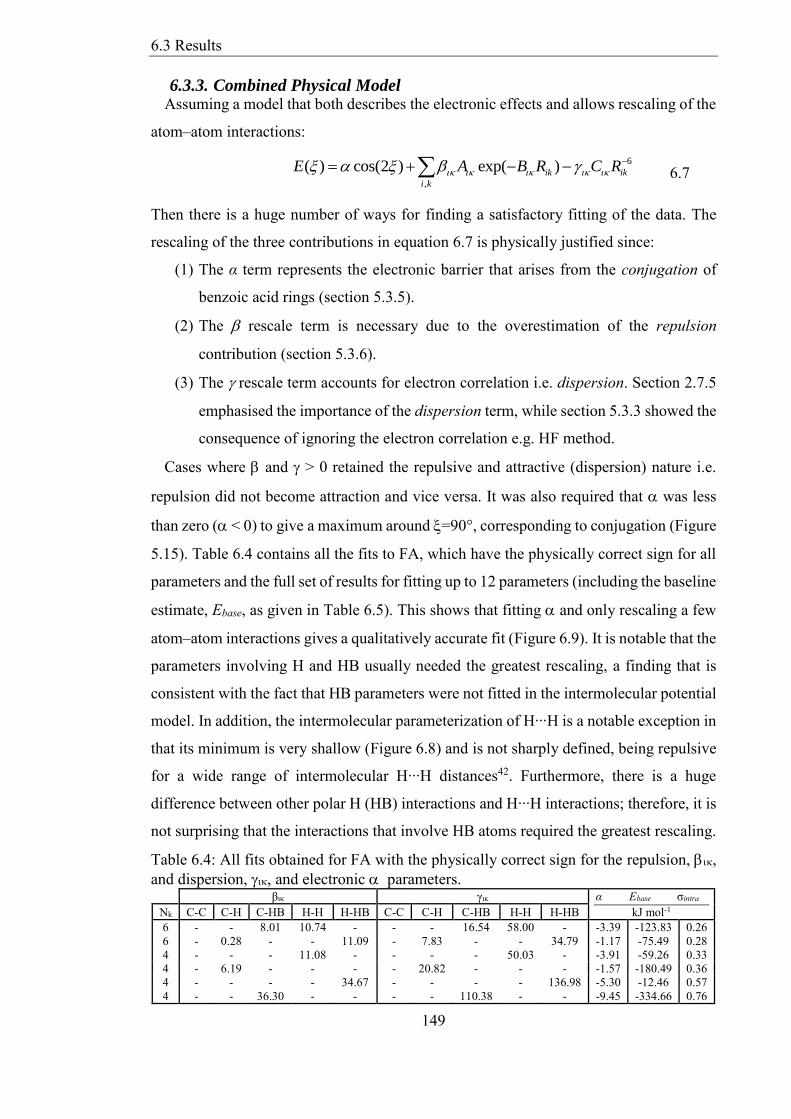
Table 64 All fits obtained for FA with the physically correct sign for the repulsion
and dispersion and electronic parameters 149
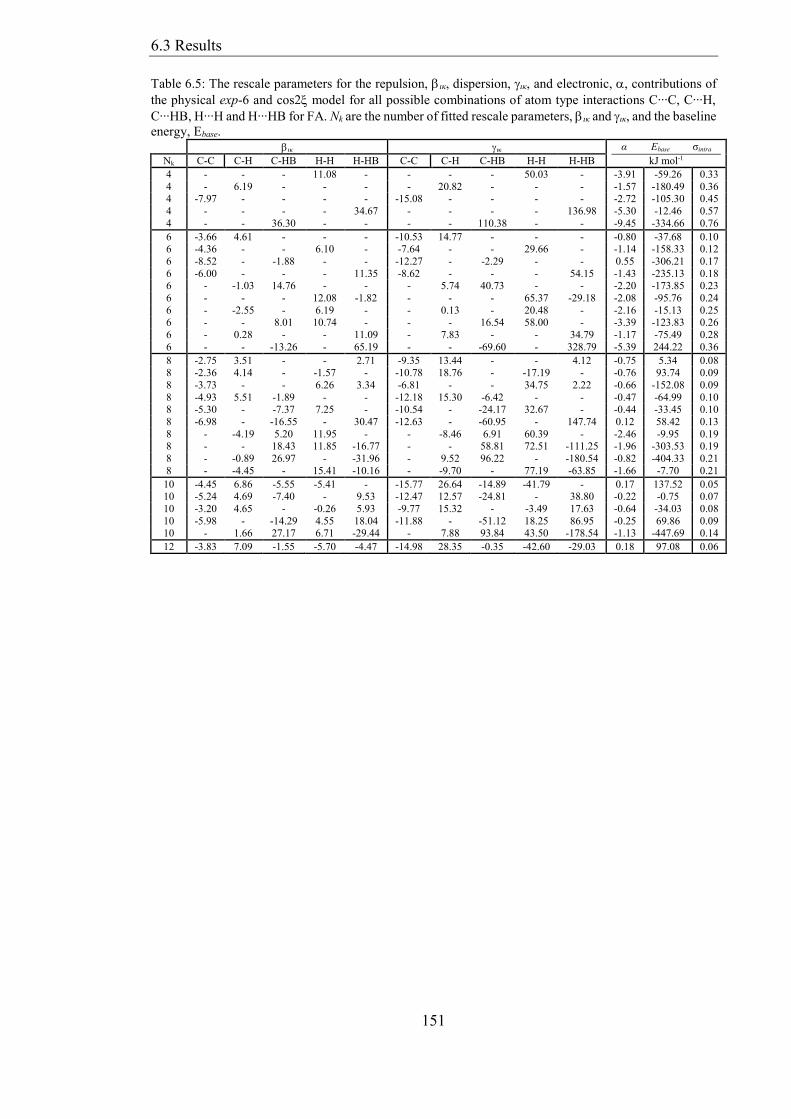
Table 65 The rescale parameters for the repulsion ικ dispersion ικ and electronic
contributions of the physical exp-6 and cos2 model for all possible combinations of atom
type interactions C∙∙∙C C∙∙∙H C∙∙∙HB H∙∙∙H and H∙∙∙HB for FA Nk are the number of
fitted rescale parameters ικ and ικ and the baseline energy Ebase 151
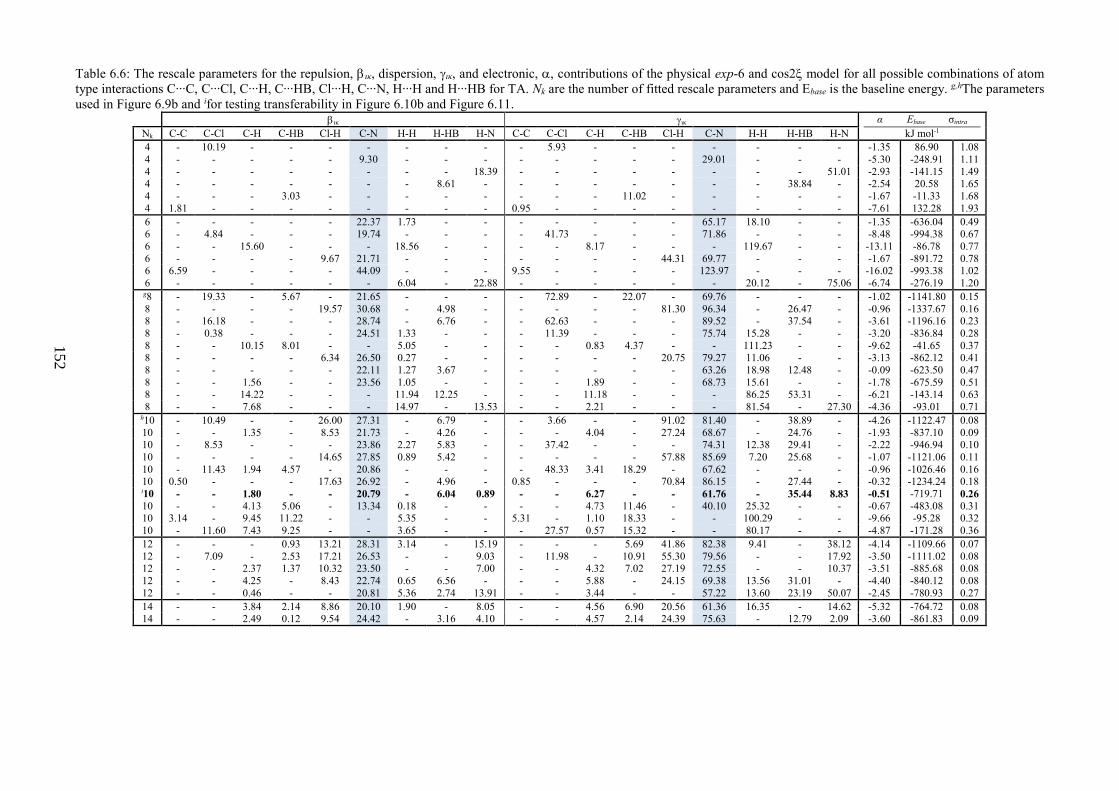
Table 66 The rescale parameters for the repulsion ικ dispersion ικ and electronic
contributions of the physical exp-6 and cos2 model for all possible combinations of atom
type interactions C∙∙∙C C∙∙∙Cl C∙∙∙H C∙∙∙HB Cl∙∙∙H C∙∙∙N H∙∙∙H and H∙∙∙HB for TA Nk
are the number of fitted rescale parameters and Ebase is the baseline energy ghThe
parameters used in Figure 69b and ifor testing transferability in Figure 610b and Figure
611 152
List of Abbreviations
20
List of Abbreviations
CCDC Cambridge Crystallographic Data Centre
CSP Crystal Structure Prediction
API Active Pharmaceutical Ingredient
DFT Density Functional Theory
HFSCF Hatree ForkSelf Consistent Field
PBE Perdew Burke and Ernzerhof exchange-correlation functional
B3LYP Becke three-parameter Lee-Yang-Parr
MP-n Moslashller-Plessett nth order of pertubabtion
PCM Polarizable Continuum Model
DMA Distributed Multipole Analysis
GDMA Gaussian Distributed Multipole Analysis
BT 1-Benzyl-1H-Tetrazole
FA Fenamic Acid
TA Tolfenamic Acid
PA Phenylamine (Aniline)
n-MA N-Methylaniline
MA Mefenamic Acid
List of Symbols
21
List of Symbols
Flexible torsion angle
Np Number of data points
Nk Number of fitted coefficients
Na Number of atoms
Xij Regressors i = 1hellip Np j = 1hellip Nk
Yi Regressand i = 1hellip Np
Elatt Lattice energy
Eintra Intramolecular energy relative to the most stable conformation
Uinter Intermolecular energy
11 Background
22
Chapter 1 Introduction
ldquoMay the Force be with yourdquo
mdash General Dodonna Star Wars A New Hope
11 Background Polymorphism the ability of a molecule to crystallise or pack in more than one
structural form1 is a phenomenon that though common is not completely understood
The phenomenon which has been the subject of long and extensive research is of crucial
importance in many branches of the chemical industry Most of all in the pharmaceutical
industry because polymorphs can show significant differences in properties such as
solubility and dissolution rate2 which in turn affect the bioavailability of drug
formulations as well as their melting point physicochemical stability and mechanical
properties3
Researchers recognise that the polymorphic differences among molecules can be
exploited to take advantage of better compactibility or powder flow rate In addition a
thermodynamically metastable form may be chosen to improve drug administration as
such a form may have a higher dissolution rate than a more stable polymorph3 A third
reason for the increasing industrial interest in polymorphism is the need to protect
intellectual property as different patents can protect the different polymorphs of an active
pharmaceutical ingredient (API)
Polymorphism is common with about one-third of all APIs confirmed to be
polymorphic4 yet not so long ago the concept of polymorphism was either treated as an
annoyance or completely ignored by academics The dismissive attitude changed after the
sudden emergence of a new polymorph of the drug ritonavir a protease inhibitor for the
HIV virus Production had to stop as Abbott Laboratories (the manufacturer) was forced
to embark upon an expensive reformulation of the drug The more stable polymorph of
the API was discovered after capsules suddenly started failing dissolution tests two years
after the drug had been launched on the market5 The ritonavir incident taught the
pharmaceutical industry that the best insurance against such surprises is to conduct an
exhaustive experimental search before going to market6 a view that has since led to
regulations requiring extensive screening and process control for polymorphs in APIs and
inactive pharmaceutical ingredients 7
11 Background
23
The unexpected emergence of the new ritonavir polymorph despite proactive attempts
to discover polymorphs before the drug was marketed forcibly reminded us that
metastable polymorphs can appear to be kinetically stable1 If Abbot Laboratories had
computed the energies of possible polymorphs for ritonavir before marketing the drug
the company may have been able to prevent a multi-million dollar problem As Graeme
Day6 noted lsquocomputational methods of predicting crystal structures could play a large
part in this research both in identifying all possible polymorphic forms and judging their
relative stabilities ndash an examination and evaluation of all possible crystal structures of a
given compound is a step towards the understanding and perhaps control of
polymorphismrsquo Given the ubiquity and importance of polymorphs it is clear that
researchers need a computer tool that is capable of postulating possible crystal structures
of organic molecules before synthesis especially since a ldquostandardrdquo experiment that
guarantees the finding of all crystalline forms is impossible89
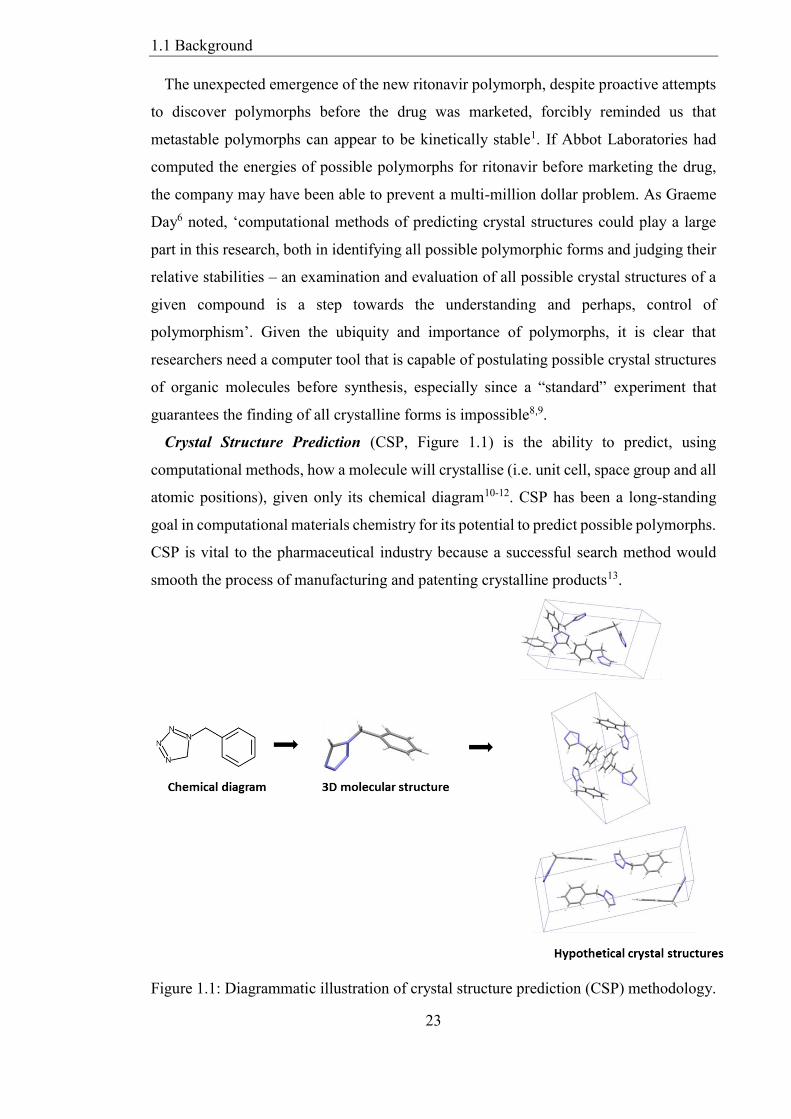
Crystal Structure Prediction (CSP Figure 11) is the ability to predict using
computational methods how a molecule will crystallise (ie unit cell space group and all
atomic positions) given only its chemical diagram10-12 CSP has been a long-standing
goal in computational materials chemistry for its potential to predict possible polymorphs
CSP is vital to the pharmaceutical industry because a successful search method would
smooth the process of manufacturing and patenting crystalline products13
Figure 11 Diagrammatic illustration of crystal structure prediction (CSP) methodology
11 Background
24
The international blind tests14 organised by the Cambridge Crystallographic Data
Centre (CCDC) is a collaborative effort that charts the progress and state of the art in
predicting the crystal structures of small organic molecules Since the first blind test in
1999 there have been five more challenges issued by the CCDC and Figure 12 shows
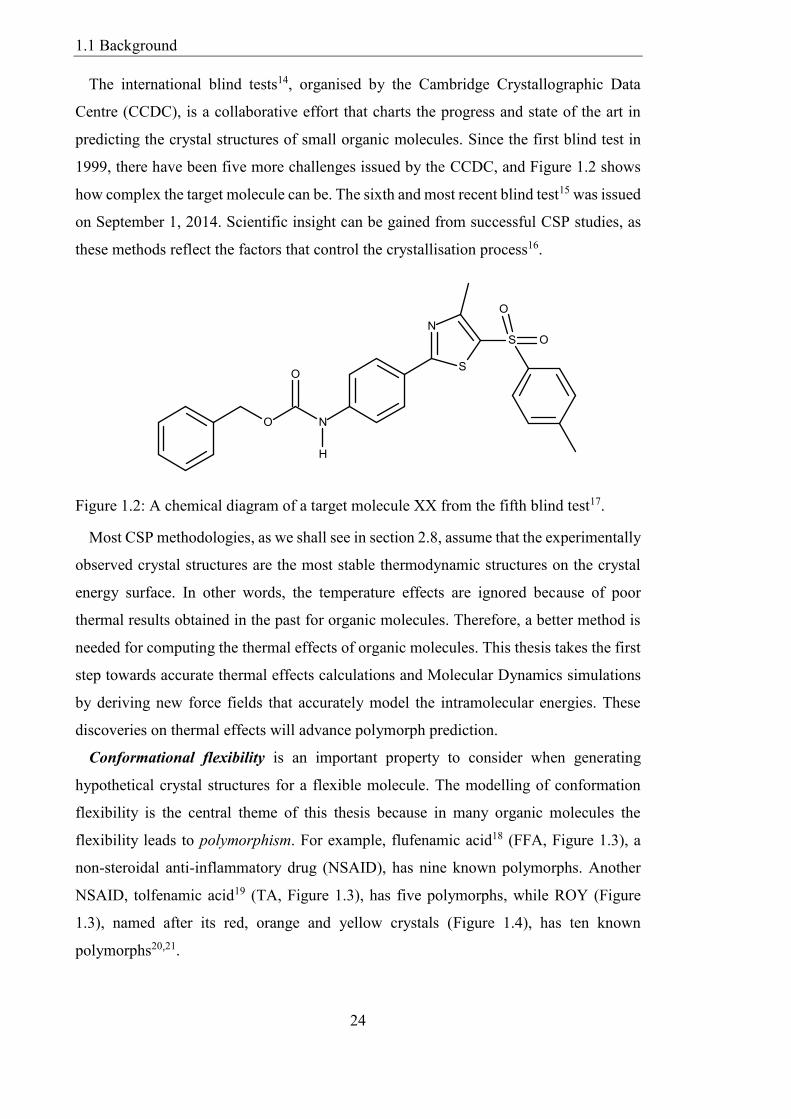
how complex the target molecule can be The sixth and most recent blind test15 was issued
on September 1 2014 Scientific insight can be gained from successful CSP studies as
these methods reflect the factors that control the crystallisation process16
Figure 12 A chemical diagram of a target molecule XX from the fifth blind test17
Most CSP methodologies as we shall see in section 28 assume that the experimentally
observed crystal structures are the most stable thermodynamic structures on the crystal
energy surface In other words the temperature effects are ignored because of poor
thermal results obtained in the past for organic molecules Therefore a better method is
needed for computing the thermal effects of organic molecules This thesis takes the first
step towards accurate thermal effects calculations and Molecular Dynamics simulations
by deriving new force fields that accurately model the intramolecular energies These
discoveries on thermal effects will advance polymorph prediction
Conformational flexibility is an important property to consider when generating
hypothetical crystal structures for a flexible molecule The modelling of conformation
flexibility is the central theme of this thesis because in many organic molecules the
flexibility leads to polymorphism For example flufenamic acid18 (FFA Figure 13) a
non-steroidal anti-inflammatory drug (NSAID) has nine known polymorphs Another
NSAID tolfenamic acid19 (TA Figure 13) has five polymorphs while ROY (Figure
13) named after its red orange and yellow crystals (Figure 14) has ten known
polymorphs2021
11 Background
25
FFA1822 TA19 ROY20
Figure 13 The chemical diagram of tolfenamic (TA) and flufenamic (FFA) acids
Figure 14 Polymorphs of ROY numbered in the order of discovery The polymorphs
have different colours melting points and molecular conformations (most pronounced in
the torsion angle θ) (Source Ref [20])
Just like FFA and TA the wide range of values for the torsion angle is also present in
ROY (Figure 15) Therefore the origin of polymorphism in these compounds is partly
due to the conformational flexibility of the molecules (see Figure 15 and the red curly
arrows in Figure 13) FFA TA and ROY are also examples of organic compounds that
are considered polymorphophores1923 A polymorphophore is a structural element that
favours the formation of polymorphic crystal forms when incorporated into a molecule
ie molecules with similar fragments are likely to be polymorphic Consequently
conformational flexibility polymorphism and polymorphophore are linked
12 Scope and Outline of Thesis
26
Figure 15 Overlay of the experimental conformers of ROY viewed with the overlaid
nitrobenzene fragment horizontal (Source Ref [2])
12 Scope and Outline of Thesis Chapter 2 examines the theoretical methods relevant to the work presented in this thesis
I will discuss these in several parts intermolecular forces and their models intramolecular
forces electronic structure methods force field methods least square estimation CSP
and crystal structure comparisons Chapters 3 to 6 contain the original work of this thesis
A CSP algorithm CrystalPredictor version 16 is used in Chapters 3 and 4 This
algorithm generates crystal structures while simultaneously varying the low-energy
barrier torsion angles of the flexible molecule Chapter 3 tests the ability of CSP to predict
the crystal structure of the flexible 1-benzyl-1H-tetrazole molecule This chapter is an
informal lsquoblind testrsquo challenge Following this Chapter 4 examines the polymorphophore
concept by investigating two flexible fenamates that are similar but have different
polymorphic behaviours I use CSP and compare the two fenamatesrsquo crystal energy
landscapes Then Chapter 5 investigates the origin of the barrier to rotation of fenamate
molecules Chapter 6 develops new analytical force field models that fit the
intramolecular energy of flexible fenamate molecules as the conformation changes This
chapter investigates three analytical forms the cosine series rescaling repulsion and
combined physical models Finally Chapter 7 offers conclusions and suggests areas for
further research and development
21 Overview
27
Chapter 2 Theoretical Background
ldquoA people without the knowledge of their past history origin and culture is like a tree
without rootsrdquo
mdash Marcus Garvey
21 Overview This chapter discusses the theoretical methods that are relevant to the work completed
in this thesis Central to this research is the evaluation of the lattice energy Elattndashndashthe
sum of the intermolecular energy Uinter and the intramolecular energy ΔEintrandashndashof a
flexible organic molecule Thus section 22 sets out the physical basis for the lattice
energy model by introducing the origin of intermolecular forces Section 23 then
discusses the models of intermolecular contributions of organic molecules Section 24
provides a brief discussion of intramolecular forces because Chapters 5 and 6 investigate
the origin of and derive an analytical model for the intramolecular energies of flexible
molecules Next section 25 discusses some force field methods by way of laying a strong
foundation for the new analytical force fields derived in Chapter 6 After this section 26
discusses the fitting routines coded into the new analytical intramolecular force fields for
flexible organic molecules Section 27 highlights the theoretical background of the
electronic structure methods used to calculate the intramolecular energy of isolated
molecules (Chapters 3 to 5) and the electrostatic contribution to intermolecular energy
(Chapters 3 and 4) Section 28 further discusses Crystal Structure Prediction (CSP)
which was introduced in Chapter 1 Finally section 29 discusses various tools for crystal
structure comparison
22 Intermolecular Forces This section discusses the importance relevance origin and categories of
intermolecular forces The intermolecular force is fundamental in the evaluation of lattice
energy which is central to CSP studies (section 28) in Chapters 3 and 4 Intermolecular
forces are present everywhere in nature and control properties of gases liquids solids
and complexes In science the quantitative study of intermolecular forces can reconcile
diverse phenomena at the atomic and increasingly electronic level24 In pharmaceutical
industries the use of intermolecular forces as a computational tool for predicting new
polymorphs is necessary because of the experimental problems in establishing all
polymorphs that could be manufactured in a controlled way This is essential in
22 Intermolecular Forces
28
preventing another ritonavir disaster (section 11) where a new thermodynamically stable
polymorph started precipitating out of the anti-HIV drug25
Figure 21 Typical intermolecular force potential energy functions for spherical atoms
The intermolecular pair potential U is the interaction energy of a pair of molecules as
a function of their separation R and orientation This definition applies to rigid
molecules Intermolecular forces are repulsive at short-range and attractive at long-range
Liquids and solids exist because molecules attract one another when they are far apart26
The fact that water has a definite density meaning it cannot be easily compressed to a
smaller volume shows that at short-range the forces between the molecules become
repulsive26 The relationship between this energy of interaction U as a function of
distance R takes the form shown in Figure 21 Figure 21 has an attractive region at
long-range where the force is negative and a steep repulsive region at short-range to
account for the low compressibility of condensed materials
221 Pairwise Additivity Due to the difficulty and computational expense of modelling intermolecular
interactions this thesis makes some approximations to the sum of the intermolecular
energies One such approximation is the pairwise additivity which assumes that the
energy of a system is the sum of all two-body interactions26 For instance for three
molecules A B and C the pairwise approximation to the total energy is UAB+UBC+UAC
22 Intermolecular Forces
29
222 Physical Origin of Intermolecular Force The significant forces between molecules have an electromagnetic origin27 Strong and
weak nuclear forces do not contribute to the intermolecular force because they are
significant over a range of the order of 10-4 nm this is extremely small compared to
molecular dimensions which are typically 05 nm The gravitational force which is long-
range does not contribute to the intermolecular force because the gravitational potential
energy of two atoms 04 nm apart is only 7 x 10-52 J some thirty orders of magnitude
smaller than the typical intermolecular force28 Consequently the intermolecular forces
have an electromagnetic origin
The work reported in this thesis will focus on closed-shell ground state molecules
Resonance interactions do not occur between ordinary closed-shell molecules in their
ground state Magnetic interactions are several orders of magnitude smaller and are not
significant to the intermolecular forces Therefore these two contributions will not be
considered any further
Intermolecular forces are of quantum mechanical origin and can in principle be
determined by solving Schroumldingerrsquos equation and using the Born-Oppenheimer
approximation (ie nuclei are in fixed positions) The physical origin of the
intermolecular force from perturbation theory is as follows
4
a b
a A b B o ab
e eH
r
21
where ea is the charge on particle a one of the particles of molecule A and rab is the
distance between it and the particle b in molecule B The Hʹ is the perturbation on HA +
HB and consists of electrostatic interactions between the particles of a (electron and
nuclei) and those of b
The intermolecular force F and intermolecular energy U are related
U
FR
22
where R is the distance between the spherical molecules
When considering the intermolecular potentials it is helpful to separate various
contributions These contributions of intermolecular energy can be separated into two
Perturbation theory finds approximate solution to problem by starting from the exact
solution of a related problem It is can be used for describing intermolecular forces
because they are relatively weak
22 Intermolecular Forces
30
main types short-range and long-range interactions Israelachvili29 argued against
making this distinction due to the danger of counting twice which can happen in
theoretical analysis when forces with the same physical origin are both short-ranged and
long-ranged
223 Long-range Interactions If the interacting molecules are far enough apart ie long-range then the perturbation
theory becomes simpler because the overlap between the wavefunctions of the two
molecules can be neglected This is called the polarization approximation which was
first formulated by London30 in 193631 Three main types of long-range interactions exist
electrostatic induction and dispersion These long-range contributions vary by R-n
Electrostatic
The electrostatic force is a classical Coulombic interaction which arises from the
interaction between the static charge distributions of two molecules This force can be
attractive or repulsive but is strictly pairwise additive and dependent on orientation
Therefore the electrostatic force plays an important role in determining the structure
adopted by the solid state If ρA(r) is the charge density for molecule A then equation 21
becomes
3 3
00
( ) ( )d d 0 0 0 0
4
A BA B A B
o
H W
r r
r rr r
23
The first-order energy described the electrostatic interaction The electrostatic
expression in equation 23 is the exact classical Coulombic interaction energy of two
molecular charge distributions at long-range
Induction
The induction effects a second-order energy arise from the distortion of a particular
molecule in the electric field of all its neighbours and are always attractive These effects
are non-additive because the fields of several neighbouring molecules may reinforce or
nullify each other26 The induction energy of molecules A and B are considered separately
The induction contribution of molecule A in state m and non-degenerate ground state 0
is
The induction energies are always attractive because distortion only occurs when there
is a lowering of energy Because the energies are non-additive they are difficult to
implement computationally32 The inclusion of the explicit induction to the
0 0
0 0 0 0 0 0A B A B A B A B
A
ind A Am m
H m m HU
W W
24
22 Intermolecular Forces
31
intermolecular energy can significantly reorder the relative energies of a molecule33
especially for large molecules like carbamazepine32 The distributed polarizability can be
used to model the induction energy as Gareth Welch34 did However this approach is
computationally demanding because a large basis set and high-quality wavefunctions are
often required32 for convergence criteria to be met In this thesis the induction energy is
not modelled explicitly Instead it uses PCM (Polarizable Continuum Model section
283) to model the polarization effect that arises from the electrostatic interactions in a
solvent medium29
Dispersion
Dispersion is a universal force of quantum mechanical origin We know that because
electrons are in continuous motion their electron density oscillates continuously
producing instantaneous electric dipoles that change as the electron density changes The
instantaneous dipole in one molecule induces another electric dipole in the other
molecule There is an instantaneous correlation of fluctuation of charge density This is
why this contribution is universal and requires a description of electron correlation
Dispersion is an attractive force and is approximately pairwise additive The perturbation
theory expression for dispersion contribution is as follows
0 0 0 0
00 00disp A B A B
m n m m
H mn mn HU
W W W W
25
London30 provided the most widely understood treatment of dispersion forces where
atoms can be visualised as a set of harmonic oscillators In this treatment the coupling of
the oscillators leads to the lowering of the energy The dispersion energy depends on the
square of the coupling constant The leading term in the dispersion energy is proportional
to R-6 because the coupling for a pair of interacting dipoles is proportional to R-3
224 Short-range Interactions
Exchange-Repulsion
When electron clouds of two molecules approach each other and become sufficiently
close they overlap At short-range the most important contributions are exchange and
repulsion these two are often taken together despite having opposite signs and are called
exchange-repulsion31 The exchange contribution is the attractive energy resulting from
electrons of one molecule becoming free to move over both molecules This increases the
uncertainty of the electronrsquos position allowing the momentum and energy to decrease
Repulsion contribution arises from the slight overlap of electrons that are trying to occupy
the same region of space This overlap which is prohibited by the Pauli Exclusion
23 Modelling the Intermolecular Forces for Organic Molecules
32
Principle leads to redistribution of electrons and increase of the repulsion between the
nuclei The exponential repulsion domination leads to an overall repulsive effect and is
approximately pairwise
225 Penetration Energy and Charge Transfer The overlap at short-range leads to modification of the long-range terms When charge
densities overlap at short-range the electron density will no longer shield the nuclei of
one molecule and therefore the molecules will experience a greater attraction of electron
density associated with other species The energy difference from this increased attraction
is the charge penetration it is the modification of the electrostatic energy at short-range
and so is a first-order effect Charge transfer also occurs during redistribution of electrons
at short-range It is a part of the short-range induction energy and so is a second-order
effect The energy contributions from charge transfer and penetration are small and are
often negligible35 Some of these effects may be absorbed in the empirically fitted models
of the dispersion and repulsion terms (section 27)
In summary for the organic molecules studied in this thesis repulsion dominates at
short-range while electrostatic and dispersion contributions dominate the intermolecular
energy at long-range Therefore the total intermolecular energy can be expressed as the
summation of the electrostatic Uelec repulsion Urepul and dispersion Udisp contributions
inter elec repul disp elec repul dispU U U U U U 26
23 Modelling the Intermolecular Forces for Organic Molecules The potential model used in this thesis for evaluating the intermolecular energy Uinter
is an intermediary between conventional force fields and periodic electronic structure
calculations The functional form of conventional force fields have limitations because
the same charges are used for intermolecular and intramolecular interactions2 (section
254) Periodic electronic structure calculations are very expensive and were not
available at the start of my research in 2010 For example the plane-wave DFT-D study
of selected pharmaceutical crystal structures using Quantum Espresso was published in
201336 The Generation Ranking and Characterisation Engine (GRACE37 program
section 284) which when coupled to another periodic DFT-D code (section 275) was
successful in the fourth blind test10 is still not available to researchers as of this writing
The work presented in this thesis models the dispersion repulsion and electrostatic
interactions (equation 26) explicitly The dispersion and repulsion contributions were
modelled using a transferrable empirically fitted model In contrast the electrostatic
23 Modelling the Intermolecular Forces for Organic Molecules
33
contribution was modelled using ab initio wavefunction calculation on an isolated
molecule for each molecular conformation due to limited transferability
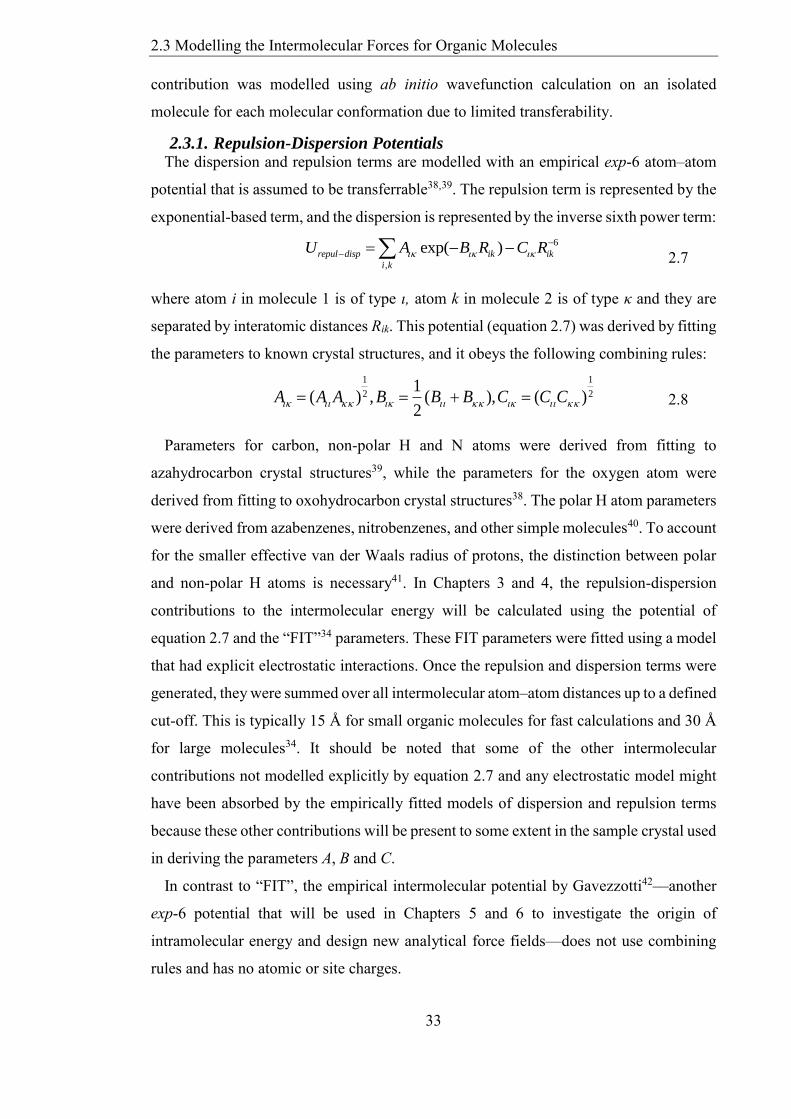
231 Repulsion-Dispersion Potentials The dispersion and repulsion terms are modelled with an empirical exp-6 atomndashatom
potential that is assumed to be transferrable3839 The repulsion term is represented by the
exponential-based term and the dispersion is represented by the inverse sixth power term
6
exp( )
repul disp ik ik
i k
U A B R C R 27
where atom i in molecule 1 is of type ι atom k in molecule 2 is of type κ and they are
separated by interatomic distances Rik This potential (equation 27) was derived by fitting
the parameters to known crystal structures and it obeys the following combining rules
1 1
2 21
( ) ( ) ( )2
A A A B B B C C C 28
Parameters for carbon non-polar H and N atoms were derived from fitting to
azahydrocarbon crystal structures39 while the parameters for the oxygen atom were
derived from fitting to oxohydrocarbon crystal structures38 The polar H atom parameters
were derived from azabenzenes nitrobenzenes and other simple molecules40 To account
for the smaller effective van der Waals radius of protons the distinction between polar
and non-polar H atoms is necessary41 In Chapters 3 and 4 the repulsion-dispersion
contributions to the intermolecular energy will be calculated using the potential of
equation 27 and the ldquoFITrdquo34 parameters These FIT parameters were fitted using a model
that had explicit electrostatic interactions Once the repulsion and dispersion terms were
generated they were summed over all intermolecular atomndashatom distances up to a defined
cut-off This is typically 15 Aring for small organic molecules for fast calculations and 30 Aring
for large molecules34 It should be noted that some of the other intermolecular
contributions not modelled explicitly by equation 27 and any electrostatic model might
have been absorbed by the empirically fitted models of dispersion and repulsion terms
because these other contributions will be present to some extent in the sample crystal used
in deriving the parameters A B and C
In contrast to ldquoFITrdquo the empirical intermolecular potential by Gavezzotti42ndashndashanother
exp-6 potential that will be used in Chapters 5 and 6 to investigate the origin of
intramolecular energy and design new analytical force fieldsndashndashdoes not use combining
rules and has no atomic or site charges
23 Modelling the Intermolecular Forces for Organic Molecules
34
232 Electrostatics Potential This section discusses the two methods used in this thesis for modelling the electrostatic
contribution to the intermolecular energy (equation 26) in Chapters 3 and 4
(1) The Atomic Charge Model is a crude but inexpensive approach It uses Coulombrsquos
law through pairwise interaction of isotropic (spherical) point charge q placed on each
atom separated by distance R
0
1(R )
4 R i k
elec ik
ik
q qU 29
where ε0 is the dielectric vacuum constant It assumes that the charge density of the
molecule can be described by superimposing spherical atomic electron densities The
atomic charge model cannot represent non-spherical features such as lone pairs and
electrons or short-distance directional intermolecular interactions like the geometry of
the H-bond41 As a result extensions to the isotropic model have been proposed to define
lone pair sites as dummy atoms having isotropic electrostatic interactions43 or at satellite
positions that are optimised to provide best fit to the electrostatic field44
Although atomic charges can be derived from the experimental X-ray diffraction data
these results are unreliable due to the many approximations and assumptions that must be
made during their calculation45 On the other hand atomic charges can be generated from
an ab initio wavefunction calculation of the isolated molecule to estimate the electrostatic
contribution41 This involves using the CHELPG scheme (an acronym for CHarges from
ELectrostatic Potentials Grid based method) which performs the least-squares fit of the
atomic charges to reproduce the molecular electrostatic potential as evaluated from ab
initio density on a regularly spaced grid46 Unfortunately higher moments such as
octupoles hexadecapoles and so on make a small contribution to the potential when the
CHELPG scheme is used Indeed Francl et al47 showed that the CHELPG procedure is
ill conditioned for higher atomic multipoles so that the charges are not well determined
however they did show that Singular Value Decomposition (section 262) could improve
the condition numberdagger
(2) The Distributed Multipole Moments The electrostatic potential around a molecule
can be represented by an expansion of multipole moments At long range this
daggerThe condition number is the ratio of the largest to smallest singular value in the singular
value decomposition of a matrix A matrix is ill conditioned if the condition number is
too large
23 Modelling the Intermolecular Forces for Organic Molecules
35
electrostatic potential is exact since the charge distribution is approximately spherical as
the distance approaches infinity At shorter range the more apparent anisotropic nature
of charge density is not easily represented by the central multipole expansion48 A better
approach is to use a multiple expansion about several sites in the molecule which can be
achieved with the distributed multipole expansion
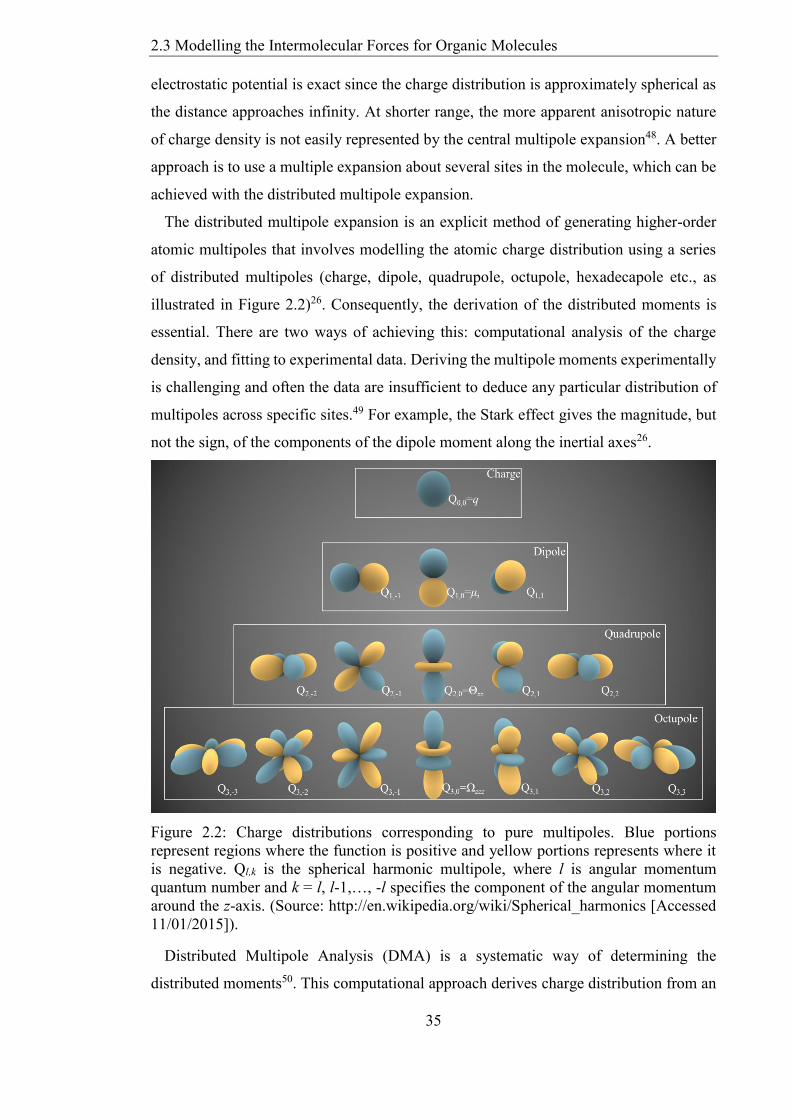
The distributed multipole expansion is an explicit method of generating higher-order
atomic multipoles that involves modelling the atomic charge distribution using a series
of distributed multipoles (charge dipole quadrupole octupole hexadecapole etc as
illustrated in Figure 22)26 Consequently the derivation of the distributed moments is
essential There are two ways of achieving this computational analysis of the charge
density and fitting to experimental data Deriving the multipole moments experimentally
is challenging and often the data are insufficient to deduce any particular distribution of
multipoles across specific sites49 For example the Stark effect gives the magnitude but
not the sign of the components of the dipole moment along the inertial axes26
Figure 22 Charge distributions corresponding to pure multipoles Blue portions
represent regions where the function is positive and yellow portions represents where it
is negative Qlk is the spherical harmonic multipole where l is angular momentum
quantum number and k = l l-1hellip -l specifies the component of the angular momentum
around the z-axis (Source httpenwikipediaorgwikiSpherical_harmonics [Accessed
11012015])
Distributed Multipole Analysis (DMA) is a systematic way of determining the
distributed moments50 This computational approach derives charge distribution from an
24 Intramolecular Energy
36
ab initio wavefunction51 and describes it in terms of distributed multipoles (Figure 22)
located at a number of site in the molecule using the Gaussian Distributed Multipole
Analysis (GDMA)52 program The GDMA program carries out a DMA of the density
matrix (Fchk) file produced by GAUSSIAN53 for the isolated molecule in the molecular
axis system34 This thesis uses version 252 of GDMA because it handles diffuse functions
more satisfactorily51 than version 154
In contrast to the atomic charge model the distributed multipole moments have
successfully predicted the directional (anisotropic) lone pair interactions π-π stacking
arrangements in aromatic rings and electrons and H-bond geometries in molecular
organic crystal5556 The long-range interactions which include the chargendashcharge (R-1)
chargendashdipole (R-2) and dipolendashdipole (R-3) terms are evaluated using the Ewald
summation method57 while the remaining long-range interactions are summed by direct
method
In summary the electrostatic contribution is modelled by using either an atomic charge
model or distributed multipole moments obtained from ab initio methods while the
repulsion and dispersion contribution are modelled using an empirical exp-6 potential
24 Intramolecular Energy The lattice energy of a crystal structure is the sum of the intermolecular and
intramolecular energies The focus of this section is the intramolecular part of the lattice
energy In Chapters 5 and 6 I investigate the origin and derive analytical models for the
intramolecular energies of flexible molecules (Chapter 6) Therefore this section
concisely examines the intramolecular energy of flexible molecules
The intramolecular energy of rigid molecules is negligible so the early work of crystal
structure prediction (section 11) focussed on the easier problem of rigid molecules In
this thesis a flexible molecule has one or more internal degrees of freedom that change
between phases for example torsion angles around single bonds The intramolecular
energy for a flexible molecule is the energy difference between the molecule in a specific
conformation (eg in a crystal) and in the lowest energy of the isolated gas phase
conformation As evident from ROY in Chapter 1 polymorphic forms can exhibit very
different torsion angles (Figure 15) ie can display conformational polymorphism
Cruz-Cabeza and Bernstein58 argued that when referring to conformations in crystal
structures a distinction should be made between conformational adjustment and
conformational change Conformational adjustment arises when a flexible molecule
adjusts to the crystal environment by slightly varying the conformation to minimise the
24 Intramolecular Energy
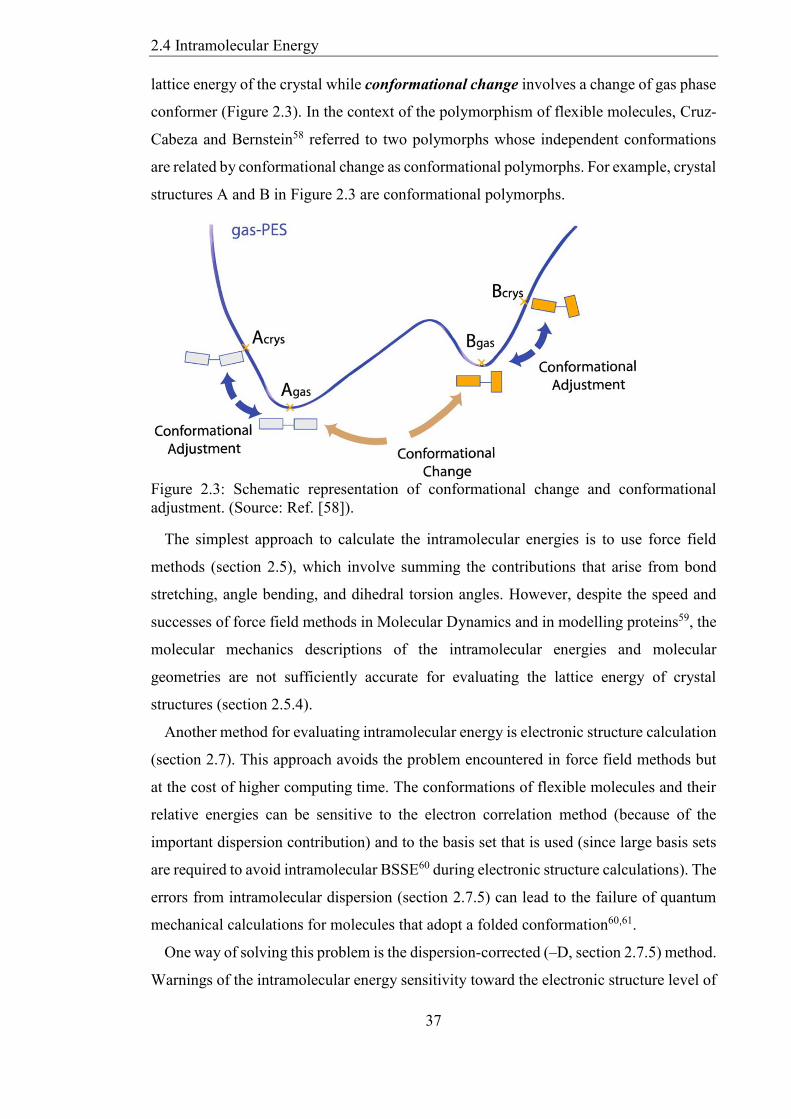
37
lattice energy of the crystal while conformational change involves a change of gas phase
conformer (Figure 23) In the context of the polymorphism of flexible molecules Cruz-
Cabeza and Bernstein58 referred to two polymorphs whose independent conformations
are related by conformational change as conformational polymorphs For example crystal
structures A and B in Figure 23 are conformational polymorphs
Figure 23 Schematic representation of conformational change and conformational
adjustment (Source Ref [58])
The simplest approach to calculate the intramolecular energies is to use force field
methods (section 25) which involve summing the contributions that arise from bond
stretching angle bending and dihedral torsion angles However despite the speed and
successes of force field methods in Molecular Dynamics and in modelling proteins59 the
molecular mechanics descriptions of the intramolecular energies and molecular
geometries are not sufficiently accurate for evaluating the lattice energy of crystal
structures (section 254)
Another method for evaluating intramolecular energy is electronic structure calculation
(section 27) This approach avoids the problem encountered in force field methods but
at the cost of higher computing time The conformations of flexible molecules and their
relative energies can be sensitive to the electron correlation method (because of the
important dispersion contribution) and to the basis set that is used (since large basis sets
are required to avoid intramolecular BSSE60 during electronic structure calculations) The
errors from intramolecular dispersion (section 275) can lead to the failure of quantum
mechanical calculations for molecules that adopt a folded conformation6061
One way of solving this problem is the dispersion-corrected (ndashD section 275) method
Warnings of the intramolecular energy sensitivity toward the electronic structure level of
25 Force Fields (Atomistic Modelling)
38
theory are relevant to the CSP studies of Chapter 3 and 4 where the focus is on other
aspects of the computational model and not on the rigorous test of these errors However
it is a common practise to use one electronic structure method for evaluating the
intramolecular contributions toward the final lattice energies A necessary compromise
then is to conduct prior analysis of the effect that different levels of theory have on the
intramolecular energy for a specific molecule
The frequently used DFT level of theory such as B3LYP6-31G(d) may not give
reliable results for molecular systems where the intramolecular dispersion energy is likely
to be a major factor in determining the conformation60 Due to this limitation I did not
use the 6-31G(d) basis set in Chapters 3 and 4 when computing the final intramolecular
and intermolecular energies of the crystal structures
25 Force Fields (Atomistic Modelling) Force field methods (also known molecular mechanics methods) ignore the moleculersquos
electronic motions and calculate the energy of a system as a function of the nuclear
positions These methods are a cheap alternative to electronic structure methods (section
27) The basis of understanding the force field is the Born-Oppenheimer approximation
which assumes that the motions of the nuclei are independent of the motions of the
electrons In force field calculations the arrangement of the electrons is assumed to be
fixed62 Thus traditional force field methods cannot predict properties based on electronic
motions such as the breaking and formation of chemical bonds polarization effects and
proton transfer
The parameters determined for small molecules can be transferred to larger systems
such as polymers63 and can also be used for billions of atoms on supercomputers Indeed
the ability to transfer force fields from one system to anotherndashndashfor systems that are too
large for quantum mechanical calculationsndashndashis arguably the most valuable property of
many force fields6364
The downside to these classical force fields is that conformation and energy results are
often prone to inaccuracies These inaccuracies were observed when force fields methods
were used in CSP to calculate the final lattice energies65-67 (section 254)
25 Force Fields (Atomistic Modelling)
39
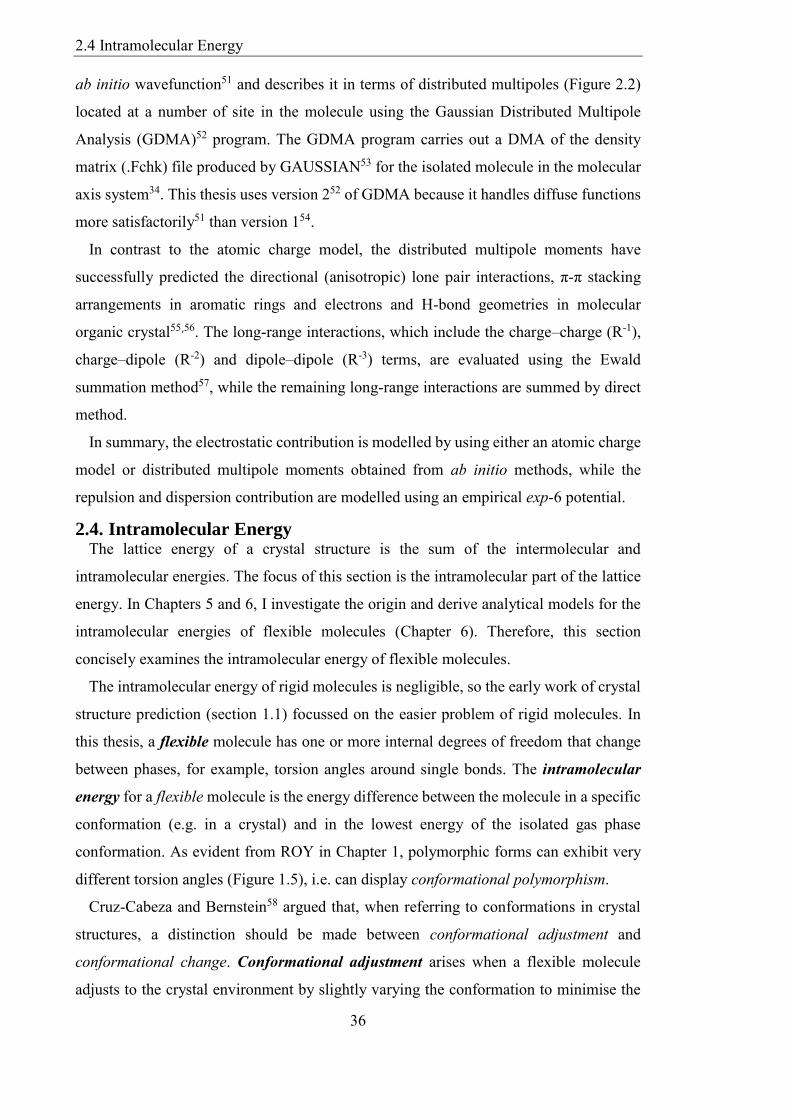
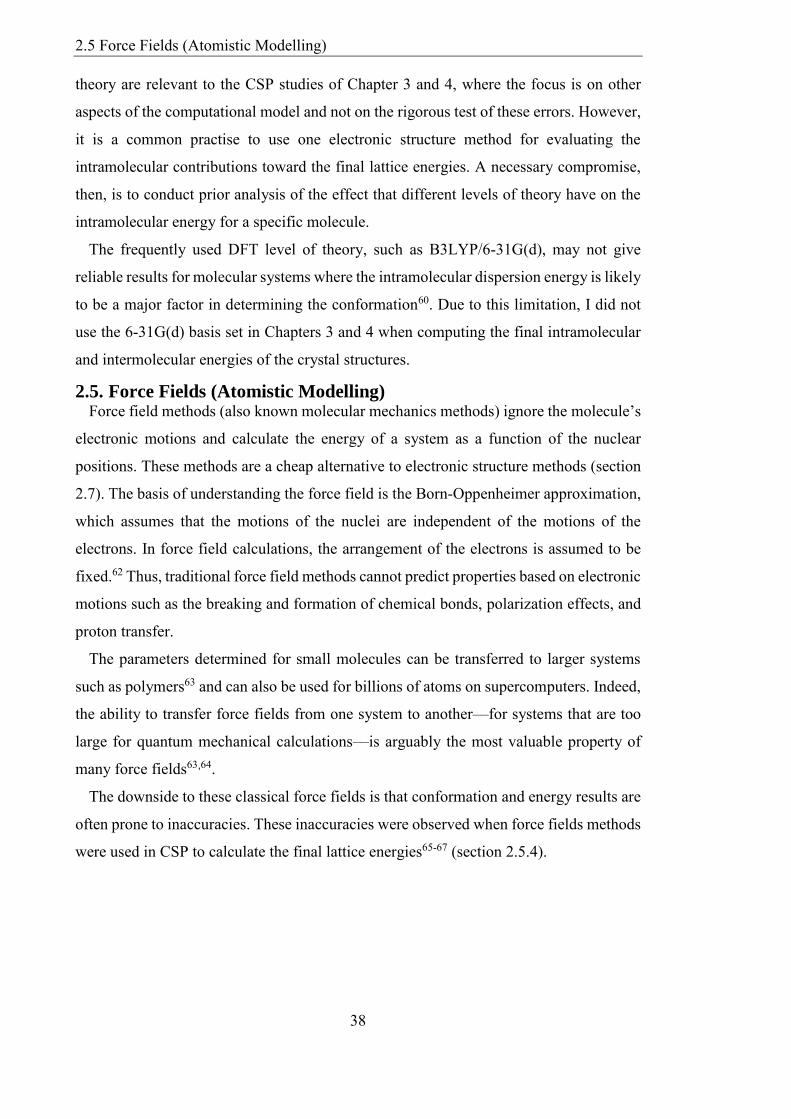
Figure 24 The schematic view of force field interactions Covalent bonds are solid lines
while the dotted line indicates non-bonded interaction (Source Ref [68])
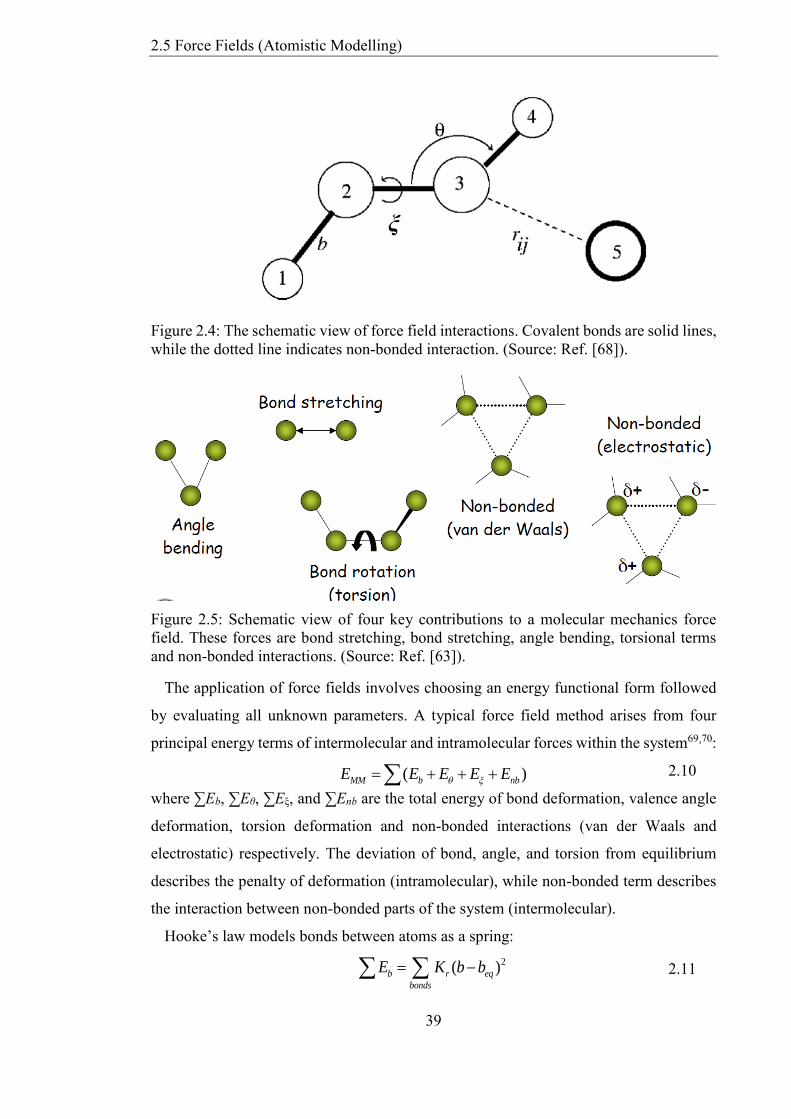
Figure 25 Schematic view of four key contributions to a molecular mechanics force
field These forces are bond stretching bond stretching angle bending torsional terms
and non-bonded interactions (Source Ref [63])
The application of force fields involves choosing an energy functional form followed
by evaluating all unknown parameters A typical force field method arises from four
principal energy terms of intermolecular and intramolecular forces within the system6970
( )MM b nbE E E E E 210
where sumEb sumEθ sumEξ and sumEnb are the total energy of bond deformation valence angle
deformation torsion deformation and non-bonded interactions (van der Waals and
electrostatic) respectively The deviation of bond angle and torsion from equilibrium
describes the penalty of deformation (intramolecular) while non-bonded term describes
the interaction between non-bonded parts of the system (intermolecular)
Hookersquos law models bonds between atoms as a spring
2( )b r eq
bonds
E K b b
211
25 Force Fields (Atomistic Modelling)
40
where Kr is the force constant and beq is the ideal bond length A common mistake is to
assume that the equilibrium value (eg beq) is the global minimum value in actuality beq
is the value that b adopts when all force field terms equal zero This Hookersquos functional
form is an example of applying the harmonic oscillator in which the relationship between
force and displacement is linear A more accurate description of the relationship between
force and displacement is non-linearity ie anharmonic oscillator Hence Hookersquos
functional form is not as accurate as using cubic and higher terms (anharmonic terms)
Valence angles have a similar model to equation 211
angles
eqKE 2)(
212
where K is the strength of the spring holding the angle at ideal valence angle eq
Compared to a bond model less energy is required to distort the valence angle away from
the reference and the force constants are smaller The higher terms such as cubic and
quartic terms improve the valence angle model The 1-2 and 1-3 interactions (defined in
Figure 24) are also known as hard degrees of freedom because large amounts of energy
are required to deform bonds or angles from their equilibrium positions However
CrystalOptimizer71 (section 282)ndashndashan algorithm used in Chapters 3 and 4 to compute
the lattice energy accuratelyndashndashassumes that some 1-3 interactions are soft degrees of
freedom For example hydroxyl (HndashOndashC) and amide (HndashNndashC) bond angles were treated
as flexible in three model systems72
Figure 26 Schematic view of the torsion angle ξ using the ethane molecule (Source
quantumwisecomdocumentsmanualsvnl-200810_Manualchapmolbuilderhtml
[Accessed 11012015])
25 Force Fields (Atomistic Modelling)
41
The major change between crystal structures is their torsion angles The torsion angle
ξ in the ethane molecule shown in Figure 26 is defined as the intersection angle between
the two planes α and β spanned by the respective atom chains 1ndash2ndash3 and 2ndash3ndash4 It is clear
that the value of the torsion angle ξ between atoms 3 and 2 depends on the four atoms
selected Due to the periodic nature of torsion angles the model is expressed as a periodic
function
[1 cos( )]2
n
torsions
VE 213
where is the periodicity and represents the number of minima as the bond rotates about
360deg The phase factor term is the torsion angle as the rotating bond passes the
minimum or minima Vn is the barrier height to rotation about torsion angle ξ The value
of Vn is larger for double bonds than for single bonds The definition of Vn is ambiguous
when more than one term is needed to model the torsional energy64 Even more
misleading is that the 1-4 non-bonded (Figure 24) and higher interactions contribute to
the torsional potential The additional term with the correct qualitative behaviour of the
barrier to rotation63 is a better description of Vn
The last term in equation 210 is the non-bonded interactions
12 6
[ ]nonbond
ij ij i j
nb
i j ij ij ij
q qE
r r r
214
where the adjustable parameter σij is the collision diameter and is defined as the separation
for which the van der Waals energy is zero The qi and qj terms are the partial or net
atomic charges63 Equation 210 is a combination of the repulsion-dispersion (also known
as the van der Waals term and is often fitted to a Lennard-Jones 6-12 potential73 because
of the computational ease) and an electrostatic term It should be noted that intermolecular
and intramolecular contributions have the same set of parameters Many of the more
recent developments in protein force fields include electronic polarizability or a solvation
effect in an approximate way68
251 AMBER The AMBER force fields are widely used for modelling proteins and nucleic acids74
AMBER which is in continual development has relied on the past knowledge of force
fields such as ECEPP potentials75 and Consistent Force Field (CFF76) The exclusion of
H atoms from an earlier version of an AMBER force field was due to limited computer
power However a compromise was adopted in later versions due to the importance of
the H-bond68
25 Force Fields (Atomistic Modelling)
42
The charges were derived by fitting partial charges to ESP (electrostatics potential)
charges obtained via ab initio calculations (HFSTO-3G) An adapted version of van der
Waalsrsquo term from amide data fitting by Lifsonrsquos group7778 and liquid state simulations79
by Jorgensen was used The first two terms (bonds and angles) of equation 230 were
fitted from crystal structure data while the torsional terms were extracted from either
experimental data or ab initio calculations
The fact that AMBER has limited parameters for organic molecules prevented this force
field from being widely used in drug design and other studies of ligandndashprotein or ligandndash
DNA interactions80 Hence a Generalised Amber Force Field (GAFF) was introduced by
Wang et al80 to describe a wider variety of organic molecules including most
pharmaceutical molecules
252 CHARMM CHARMM81 (Chemistry at HARvard using Molecular Mechanics) has some overlaps
with AMBER in part because the first versions of both force fields were developed
around the same time Like AMBER H atoms were excluded in the earlier version but
were later replaced with a compromise solution Although ab initio calculations were
used in fitting this model a different level of theory (HF6-31G) was employed The
interaction energies were scaled to match water dimerization energy predicted via a
TIP3P model to achieve a balanced solutendashwater and waterndashwater interaction A rough
continuum solvation model can be implemented by using the force field with distance-
dependent dielectric constant The second version of CHARMM from 1985 is used
today because of the respectable results obtained from solvated simulation68
Subsequent developments were made in later versions of CHARMM8283 to improve
the balance of interaction energies in solvent simulations More recently a force field for
all atoms often called the CHARMM general force field (CGenFF) was published84
This force field covers a wide range of chemical groups present in biomolecules and drug-
like molecules and focusses on quality of result rather than on transferability
253 Other Force Fields There are more complex force fields than those discussed above For example cubic
and quartic terms can be added to equations 210 and 211 to reflect anharmonicity and
stretch-bend cross terms or the Lennard-Jones function can be replaced with a more
flexible Buckingham (exp-6) or Morse potential85 Examples of such force fields are
MM486 and Merck Molecular Force Field (MMFF)87 The cubic and quartic terms are
also used in MM288
25 Force Fields (Atomistic Modelling)
43
Figure 27 Schematic view of some of the common cross terms (Source Ref [63])
The cross terms in force fields represent coupling between internal coordinates For
example an increase or decrease of valence angle can affect adjacent bonds Stretch-
stretch stretch-bend stretch-torsion bend-torsion and bend-bend (Figure 27) are
examples of cross terms believed to be the most important in force fields these cross
terms in force fields are designed to predict vibrational spectra63
Another very popular force field is OPLS-AA (Optimized Parameters for Liquid
SimulationsndashAll Atoms) which specialises in simple liquids8589 Although huge
advances have been made in the understanding of biomolecular behaviour there is still a
demand for more accurate prediction of energies90 even for proteins and nucleic acid
polymers that have been studied extensively eg AMOEBA91 which uses atomic
multipoles
254 The Limits of Current Force Fields A major limitation of current force fields is the use of atomic charges in the description
of electrostatic contributions9293 Another limitation is that the intermolecular and
intramolecular forces have the same parameters It is therefore not surprising that in the
blind tests of organic CSP there have been no success based on the use of force fields for
final lattice energy (sum of intermolecular and intermolecular energy) evaluations11 In
specific cases like aspirin the intramolecular force field clearly has too strong a
preference for the wrong conformation so that the lowest-energy crystal structures have
that conformation94
Indeed some force fieldsrsquo lattice energy minimizations were shown to change the
conformation of the crystal structure so much that the crystal structure could not be
26 The Fitting Routine
44
reproduced65 In other cases the force fields were able to reproduce the crystal structures
but failed to rank the energy of these crystal structures accurately These failures have
been traced to using the same charges and van der Waals interactions for the
intermolecular and intramolecular forces95
Generally force field potentials that are more accurate tend to have more terms because
they usually yield better fit with experimental or ab initio data However additional
parameters make the fitting procedure more complicated and time consuming with no
scientific basis Therefore an ideal analytical model for the intramolecular energies
should have terms that are few in number (Chapter 6) based on a consistent scientific
origin (Chapter 5) and transferrable
In summary the traditional force field includes explicit periodic torsional potentials
and non-bonded terms including the electrostatic term that are applied to all atom pairs
separated by three or more covalent bonds (1-4 interactions and above) Researchers built
these traditional force fields on the reasonable assumption that in biomolecules the
intramolecular non-bonded interactions are the same as intermolecular non-bonded
interactions This is clearly a limitation2 because intramolecular atom-atom distances are
often much shorter than intermolecular (van der Waals) distances I exploited this
limitation in Chapter 6 by decoupling the intermolecular and intramolecular contributions
and derived new analytical intramolecular force fields
26 The Fitting Routine The Gavezzotti exp-6 and ldquoFITrdquo potentials (section 231) and many force field methods
were fitted to experimental or ab initio data These potentials all depended on an assumed
functional form the ability to extrapolate the quality of data the range of sampling a
method of fitting (the focus of this section) and so on
In Chapter 6 I developed codes (Appendix A) for fitting a new analytical
intramolecular force field to ab initio conformational profiles of fenamates which use
one method of fitting I assumed that the new analytical intramolecular force field was
approximately linear This section explains what a linear problem is solves the problem
and outlines an alternative solution that uses a Numerical Algorithm Group (NAG) library
that was implemented in the design of new analytical force fields (Appendix A)
261 Linear Least Square Method A model is linear if given a random data of (Yi Xi1hellip Xip-1 i =1hellip n) the relationship
between the response variable or observation Yi and the explanatory or independent
variable Xij can be formulated as follows
26 The Fitting Routine
45
Yi=β0+ β1Xi1 + β2Xi2 +hellip+ βp-1X ip-1 + εi i=1hellipn 215
where εi is the error β0 β1 β2 hellip βp-1 are the intercept and regression coefficients for the
explanatory variables
The linear regression model of equation 215 in matrix form is
0 1 11 1 1 11 1
0 1 22 1 2 12 2
0 1 1 1 1
p p
p p
n nn p n p
X XY
X XY
Y X X
216
or
11 1 11 0 1
22 2 12 1 2
11 1
1
1
1
p
p
n p nn n p
X XY
X XY
Y X X
217
or 1 1 1n n p p n Y X ε 218
where Y is ntimes1 X is ntimesp (an ntimesp matrix has n rows and p columns) β is ptimes1 and ε is
ntimes1 matrix
We can solve this linear regression model by using the least squares method The basic
idea behind the least squares is minimising the sum of squares for the errors ie
2n T
ii ε ε where T is the transpose Rearranging equation 218 as a function of errors
and evaluating least square problem gives
( ) ( )
( ( ) ( ) ( ))
( ( ) ( ))
( ( ) ( ) ( ))
( )
( 2 )
T T
T T T T
T T T T T
T T T T T T
T T T T T
T T T T
ε ε Y X Y X
Y Y Y X X Y X X
Y Y Y X X Y X X
Y Y Y X X Y X X
Y Y Y X Y X X X
Y Y Y X X X
219
Then differentiating the least square (equation 219) with respect to the coefficient gives
( ) ( 2 ) 0
2( ) 2 0
2 2 0
T T T T T
T T T
T T
T T
ε ε Y Y Y X X X
Y X X X
X Y X X
X X X Y
220
26 The Fitting Routine
46
Then multiply both sides by 1( )T X X
1
1 1( )T T
p p n p n p n n
X X X Y 221
The expectedmodel value Ŷ is
1 1ˆ
n p p n Y X 222
Equations 221 and 222 can be coded explicitly which I did for cosine fits in my upgrade
report96
262 Subroutine for Solving Least Squares An alternative to coding equations 221 and 222 explicitly is to use the G02DDFE97
NAG routine This NAG routine computes the error of each coefficient and states whether
a solution is unique or not in addition to computing the coefficients Here I discuss some
key concepts that will help in understanding the G02DDFE97 NAG routine used in
Chapter 6
If X is an n times p matrix the rank of X is the number of nonzero rows in the row echelon
derived through the Gaussian elimination method If matrix A has a rank as large as
possible then the matrix is a full rank otherwise the matrix is rank deficient A matrix
that is full rank has one unique solution The G02DDFE97 NAG routine can work out if
any matrix is full ranked or rank deficient
QR decomposition is the first step used for solving the least squares problem in the
G02DDFE97 NAG routine QR decomposition transforms matrix X into a QR matrix that
consists of an orthogonal matrix Q and an upper triangle matrix R
1 2 1
R RX = Q = Q Q = Q R
0 0 223
where Q1 is the first p columns of Q and Q2 is the last n-p columns of Q
G02DDFE97 subroutine calculates the regression parametersndashndash and in Chapter
6ndashndashand Residual Sum of Squares (RSS) for a general linear regression model by
minimising the sum squares residual G02DEFE a routine within G02DDFE carries out
QR decomposition of the matrix data X If R is of a full rank ie the matrix has a rank
as large as possible then R-1 exists and the solution of the regression model is as follows
1ˆ( ) ik
T
ik y R Q 224
where Q and R are the decomposed matrices of data being rescaled and y is the ab initio
data minus any remaining contributions not being fitted If R is not full rank Singular
27 Electronic Structure Methods
47
Value Decomposition (SVD) of X (ie X=U1DVT) helps to extract just one solution of
the linear regression model
1ˆ ( ) ik
T
ik y VD U 225
where V D and U are respectively the orthogonal the non-negative diagonal element
and the orthogonal decomposed matrices RSS and the standard error fit are related
fit
p k
RSS
N N
226
where Np and Nk are the number of observations and regression coefficients for each of
the independent variables plus the intercept
Solving the least squares problem is a key feature of the algorithm in Chapter 6 The
algorithm undertakes the challenge of deriving a new analytical model for intramolecular
energies of flexible fenamate molecules The remaining features of the algorithm are
discussed in Chapter 6
27 Electronic Structure Methods The development of electronic structure methods and rapid advances in computing
technology have transformed the role of quantitative numerical calculations in both
theoretical and experimental studies of chemistry98 The first era from the 1960s to 1980s
established the basic mathematical foundations and computational machinery of todays
standard electronic structure methods They included HartreendashFock (HF) theory Moslashller-
Plesset (MP) perturbation theory Density Functional Theory (DFT) and many others98
This thesis classifies HF MP and DFT as ab initio methods
This thesis uses electronic structure methods to calculate the molecular properties of a
single molecule (and in principle of dimers and crystals) The electronic structure
methods seek to calculate the molecular properties from the first principles ie solving
Schroumldingerrsquos equation without using empirical data26 However approximations are
always necessary DFT is a modern arsenal of quantum chemical methods99 and to get a
better appreciation of this method it will be useful to look at more traditional
wavefunction-based approaches One of the simplest of these approaches is the Hartree
Fock (HF) theory
27 Electronic Structure Methods
48
271 Hartree Fock Theory The HF theory was developed to solve the electronic Schroumldinger equation that results
from the time-independent Schroumldinger equation after invoking the Born-Oppenheimer
approximation100 There are two good reasons for solving the Schroumldinger equation First
the solution gives the potential energy experienced by the nuclei ie the potential energy
surface Second the electronic wavefunction has lots of useful information about
molecular properties such as dipole and multipole moments polarizability etc
The HF method assumes that the exact N-body wavefunction of the system can be
approximated by a single Slater determinant of N spin-orbitals By employing the
variational theorem which states that the energy is always an upper bound to the true
energy one can derive a set of N-coupled equations for the N spin-orbitals The solution
to this equation yields the energy of the system and the wavefunction
The HF method is called the ldquoSelf-Consistent Field (SCF) methodrdquo because the HF
equations are solved using an iterative process The SCF process starts with an initial
guess for the orbitals and successive iterations are performed with new orbitals until the
self-consistent condition is achieved ie until the solution no longer changes
271 Molecular Orbital Theory With the new Quantum Mechanics (QM) of Heisenberg and Schroumldinger came two
general theories the Valence Bond (VB) and the Molecular Orbital (MO) theories These
two theories developed at around the same time quickly became rivals101 See ref102 for
a review of the classical valence bond approach The focus of this section is the MO
theory
The MO theory based on the HF theory theorises that each electronrsquos motion can be
described as a single-particle function (orbital) that does not depend on the instantaneous
motions of the other electrons MOs are calculated using the Linear Combination of
Atomic Orbitals (LCAO) which is a quantum superposition of Atomic Orbitals (AOs)
MO is a theory of bonding that can give insight into the forces involved in making and
breaking chemical bonds which are often the focus of organic chemistry
The early complexities of Quantum Mechanics led to the visualisation of MOs that are
easier to understand than numerical orbital coefficients103 Using SCF calculations we
can represent MOs using isosurfaces that correspond to the electron density The two
isosurfaces of particular importance are usually the Highest Occupied Molecular Orbital
(HOMO) and the Lowest Unoccupied Molecular Orbital (LUMO) These are known as
the frontier-orbitals104 It is not clear why the frontier-orbital theory is so successful26 but
27 Electronic Structure Methods
49
this theory is used extensively in computational chemistry to understand many
phenomena Frontier orbitals will be used in Chapter 5 of this thesis to understand the
origin of barriers to rotation for flexible molecules
HOMO is the isosurface from which it is energetically easiest to remove electrons from
(eg electron density donation to form a bond) as well as the most relevant MO in this
thesis The only requirement of the empty MOs is that they form an orthogonal set with
the filled MOs These unoccupied MOs are not optimised during the SCF process because
the energy of the molecule does not depend on them As a result these unoccupied MOs
including LUMOs are less reliable than occupied MOs such as the HOMOs Thus
Chapter 5 will focus on the HOMO isosurfaces of flexible molecules
272 Correlation Effects The major limitation of the HF method is that it treats each electron as moving under
the influence of the average effect of all other electrons the method does not take into
account the electronsrsquo instantaneous repulsion26 (correlation effect) One of the most
important effects of electron correlation is the dispersion interaction In fact the
dispersion interaction (section 22) is a correlation effect26100 The correlation energy is
the difference between HF energy in a complete basis (HF limit) and the exact energy
excluding the relativistic effects ie the electrons are propagating at speeds much slower
than light
The HF method is now used merely as a starting point for more elaborate lsquopost-HFrsquo ab
initio quantum chemical approaches99 because the poor performance of the HF method
offsets its efficiency and simplicity Correlation effects modify the electrostatic
interaction between the molecules due to changes in electron distribution and they tend
to reduce charge separations Electron correlation can be handled in quantum chemical
theory calculations using Moslashller-Plesset Perturbation Theory (MPPT) Density
Functional Theory (DFT)105 etc
273 Moslashller-Plesset Perturbation Theory In perturbation theory we start from a known solution and add a perturbation
Hamiltonian (equation 21) Moslashller and Plesset106 used perturbation theory to determine
the correlation energy (small perturbation) after solving the HF problem (the known
solution) Correlation corrections appear at the second order and beyond The zeroth-
order energy is the sum of the occupied orbital (eg HOMO) The first-order energy is
the HF energy26 MPn is the nth-order energy (n 2) In this thesis I did not perform
27 Electronic Structure Methods
50
geometry optimisations using MP2 methods for molecule(s) with 20 or more atoms due
to the computational expense
Although MP2 methods are used as the standard they have limitations For example
van Mourik61 noted that the MP2 description of intramolecular interactions with a -
electron system for flexible molecules is affected by a large intramolecular basis set
superposition error (BSSE) This large BSSE of MP2 was responsible for the wrong order
of stability for Phe-Gly-Phe tripetide107
BSSE is relevant in this thesis because many of the MP2 calculations were carried out
on flexible molecules that contained at least one aromatic ring (Chapters 3 to 5) The
origin of this error lies in the possibility that the unused basis functions of the second unit
B in the associated complex A∙∙∙B may augment the basis set of the first unit A thereby
lowering unit Arsquos energy compared to a calculation of this unit alone26108 This lowering
can be attributed to the variation principle that arises from the mutual enlargement of the
basis set of each monomer by the presence of the orbitals of its partner molecule109 Rather
than using an infinite basis set an impossible task the method for correcting this error is
to use a counterpoise (CP)
274 Density Functional Theory Density Functional Theory (DFT) is a cheaper alternative to MPPT Indeed P J
Stephens et al110 suggested in 1994 that in the future DFT might be preferred over the
MP2 method due to the lower computational demands of DFT That future is now for
DFT is currently the method of choice for first-principles electronic structure calculations
in condensed phase and complex molecular environments111112 Over the last 30 years
physicists working on the electronic structure of solids surfaces defects etc have used
DFT More recently DFT has become popular with theoretical and computational
chemists113
DFT is a theory of electronic structure exact in principle that is based on the electron
density distribution instead of the many-electron wave function111 DFT is based on a
theorem proposed by Hohenberg and Kohn114 which states that knowledge of the
electron density of a system in the ground state is enough to determine the energy lsquothe
energy is a functional of the densityrsquo2699105 A generalized DFT expression is
EDFT[ρ] = ENe[ρ] + T[ρ] + Eee[ρ] 227
where T[ρ] is the kinetic energy associated with the given electron density Eee[ρ] is the
electron-electron interaction energy and ENe[ρ] is the energy of interaction between the
electrons and lsquoexternalrsquo fields The ENe normally includes the interaction between the
27 Electronic Structure Methods
51
electrons and the nuclei but it can also include other fields imposed on the molecule
Each term depends on the electron density ρ
The exact form of T[ρ] and Eee[ρ] are not known and no fundamental theory for
determining them exists at present The usual route for solving this problem is to use the
method proposed by Kohn and Sham115 in 1965 that involves non-interacting electrons
For this system the electron density ρ(r) and the kinetic energy TS[ρ] (S denotes that
the kinetic energy is obtained from a Slater determinant) are exact while the Coulomb
(classical) part J[ρ] of the electron repulsion energy can be calculated The energy of the
system now takes the form
EDFT[ρ] = ENe[ρ] + TS[ρ] + J[ρ] + EXC[ρ] 228
where EXC the exchange-correlation functional is
EXC[ρ]=( T[ρ] - TS[ρ])+( Eee[ρ]- J[ρ]) 229
The exchange and correlation energy EXC is the functional that contains everything that
is not known Local-Density Approximation (LDA) and Generalized Gradient
Approximation (GGA) are used to approximate the EXC LDA the simpler
approximation assumes that the density corresponds to that of a homogeneous electron
cloud It proved to be an improvement over HF but is too inaccurate to be useful for
chemistry26 GGA an improvement on LDA incorporates dependency on electron
density and its gradient In practise hybrid (HF-DFT) functionals are used which
incorporate a portion of the lsquoexact exchangersquo from HF theory105 with exchange and
correlation from other sources (ab initio or empirical)
One of the most widely used hybrid functionals used is B3LYP which incorporates
Beckersquos three exchange-functionals116 (B3) with Lee Yang and Parr correlation
functional LYP117 PBE0118 another widely used functional was used in this thesis
(Chapters 3 to 6) These DFT methods are attractive because their results are comparable
to those obtained using MP perturbation methods but come at a much smaller
computational cost105
275 The DFT-D Approach DFT methods have drawbacks For one they are non-convergent in that no one knows
how to improve the results in a systematic way99119 The success of a particular functional
in one setting does not guarantee the performance in a different setting These drawbacks
led Orio99 to stress the importance of enhancing the credibility of DFT either by including
some form of validation or by estimating the error range through careful comparison
between the calculated and measured observable
28 Crystal Structure Prediction (CSP)
52
Another drawback is that the density functional cannot describe long-range electron
correlations responsible for dispersion forces112120 To overcome this defect researchers
have introduced corrections See refs120121 for a review of the impressive ongoing
attempts to improve the description of dispersion forces of DFT methods From a practical
viewpoint empirically damped ndashC6∙R-6 corrections to the standard density functional
approach provide robustness122 and speed We can solve the difficult dispersion
interactions classically This well-tested approach is DFT-D where -D stands for
dispersion correction The total energy is
EDFT-D = EDFT + Edisp 230
where EDFT is the self-consistent Kohn-Sham energy (equation 227) as obtained from the
chosen density functional and Edisp is an empirical dispersion correction Although DFT-
D was not used in this thesis it is nevertheless relevant because this discussion highlights
the importance of the dispersion contribution (ie correlation effect) to the overall energy
of the system
28 Crystal Structure Prediction (CSP) CSP assumes that the experimentally determined polymorphs correspond to local
minima in the crystal energy surface Elatt To put this approximation in context it is
important to note that the prediction of the relative thermodynamic stability of
polymorphs at a given temperature T and pressure p requires the minimisation of the
Gibbs free energy (G) with respect to the unit cell dimensions and the positions of all
atoms in the unit cell
where E is the internal energy V is volume and S is the entropy123 The variation in the
free energy arises from the differences in packing energy crystal density and entropy
Therefore all three terms associated with the Gibbs free energy (equation 233) should
be evaluated when determining the relative stability of polymorphs It is often the case
that only the lattice energy component of the first term (min E) is evaluated for two
reasons
The TΔS term is often neglected because the difference in lattice vibrational
energies between polymorphs is usually very small25124 At present the thermal
entropic and zero-point contributions to the Gibbs free energy cannot be readily
and accurate evaluated56
min G = min[E + pV ndash TS] 231
28 Crystal Structure Prediction (CSP)
53
The pΔV term could be calculated but is often neglected because of its small ΔV
value The compressibility of solids being low they contribute very little to Gibbs
free energy at normal pressure The pΔV term dominates at high pressure ie
10kbar125
Most of the computational approaches to CSP focus on minimising the lattice energy
The lattice energy Elatt is the internal energy at 0 K and 0 Pa ignoring the zero-point
energy The thermodynamic stability is not always the decisive factor in the packing
patterns of the molecules kinetics also plays an important role because it strongly
influences crystallisation conditions and solvent environment Nonetheless the
experimental structure is expected to appear within a narrow energy range of the global
lattice energy minimum56
Elatt can be calculated in several different ways depending upon the relative importance
of accuracy ease of implementation and computational cost in a given situation56
Ideally the lattice energy of a crystal should be calculated quantum mechanically but
such calculations are expensive Thus most approaches use force field methods andor a
cheap method to generate and evaluating the lattice energy in a hierarchal manner The
most successful CSP approaches rely on some form of the computationally demanding
but accurate electronic structure calculations either on an isolated molecule (to evaluate
the intramolecular contribution combined with the intermolecular contribution that has
been empirical fitted) or on a crystal (using periodic calculations)
Thus the key to successful CSP methods is not just the generation of all possible crystal
structures but also the accurate ranking of these generated crystal structures This ranking
requires balancing the intermolecular Uinter and intramolecular ΔEintra energy
contributions
where Uinter is the sum of the dominant electrostatics Uelec and repulsion-dispersion
Urepul-disp contributions and Eintra is the energy required to distort the molecule from its
gas phase conformation71 X denotes degrees of freedom that define the intermolecular
contacts while vector θ denotes the intramolecular degrees of freedom ie bond lengths
bond angles and torsion angles For rigid molecules there is no θ hence the ΔEintra (θ)
term vanishes For flexible molecules θ and hence ΔEintra (θ) must be accounted for from
the beginning
Elatt = Uinter (X θ) + ΔEintra (θ) 232
28 Crystal Structure Prediction (CSP)
54
281 CrystalPredictor
Chapters 3 and 4 use version 16 of CrystalPredictor126 which is different from rigid
or multiple rigid searches in that it incorporates conformation flexibility during the initial
search stage of crystal structures CrystalPredictor is not a black box it requires careful
analysis clear thinking and learning from earlier CSP studies CrystalPredictor performs
global lattice energy minimisation in order to predict the crystal structures of organic
molecules whose conformation is likely to be significantly affected by the packing forces
CrystalPredictor can find many plausible crystal structures in a multi-dimensional
space defined by the conformational degrees of freedom and lattice variables ie the
positions of the centre(s) of mass of the molecule(s) in the unit cell the orientation of the
molecules and the unit-cell dimensions and angles127 Within CrystalPredictor are two
important algorithms the Sobolrsquo128 sequence and the E04UFF NAG routine129 The
Sobolrsquo sequence generates the initial structures a characteristic of this approach is that
each Sobolrsquo corresponds to a distinct combination of every decision variable and thus
ensures a uniform and efficient sampling This prevents the problematic gaps and clusters
that random sampling can exhibit11 For more detail on how Sobolrsquo works see ref [128]
The E04UFF NAG routine129 carries out an extensive search for local minima of the
lattice energy surface using deterministic low-discrepancy sequences to ensure an optimal
coverage of the search space
CrystalPredictor models the lattice energy as the sum of the intramolecular and
intermolecular energy (equation 232) This lattice energy evaluation is crude but its
computational efficiency is necessary because CSP studies often require hundreds of
thousands of minimisations to sample the entire crystal energy surface The algorithm
computes the intramolecular energy as a function of flexible torsion angles using an
interpolation method on a set of quantum mechanically pre-computed intramolecular
energies by modelling the molecule as a set of rigid fragments connected by flexible
torsion angles The electrostatic contribution Uelec is evaluated by interpolating on pre-
computed atomic charges while an empirically fitted potential FIT34 computes the
repulsive-dispersive interactions Urepul-disp The sum of these two contributions is the
intermolecular energy Uinter=Uelec + Urepul-disp
In short CrystalPredictor is a minimisation algorithm
min Elatt = min[Uinter(X θ) + ΔEintra(θ)] 233
28 Crystal Structure Prediction (CSP)
55
that can generate crystal structures in the 59 most common space groups and with more
than 1 molecule in the asymmetric unit126 Z´gt1 However Chapters 3 and 4 limit the
search of hypothetical crystal structures to Z´=1 due to the huge computing time required
to generate Z´gt1 crystal structures
282 CrystalOptimizer CrystalOptimizer71130 refines crystal structures generated by CrystalPredictor126 To
account for the molecular flexibility accurately the CrystalOptimizer71130 algorithm is
required This algorithm solves the lattice energy problem (equation 233) as a two-level
optimization problem
The outer problem varies and ultimately optimizes the flexible conformational degrees
of freedom the remaining degrees of freedom are adjusted to minimize the intramolecular
energy127 A quasi-Newton scheme which ensures rapid convergence with many
optimization variable (X θ) solves the outer minimisation problem71 The inner
minimization problem optimizes the lattice energy for the fixed molecular conformation
determined by the outer problem The DMACRYS34 (section 26) program performs this
rigid body minimization CrystalOptimizer achieved a significant increase in the accuracy
of lattice energy calculations by127
1 allowing additional flexibility during lattice energy minimization (for example
considering more torsion angles andor bond angles as flexible degrees of
freedom)
2 accurately computing the intramolecular energy throughout optimization and
3 modelling the electrostatic interactions using distributed multipoles (up to
hexadecapole) obtained using the GDMA package52
Multiple ab initio calculations a very time-consuming process were often required
For this reason only the most promising structures from CrystalPredictor were used as
initial points for optimization Sometimes an intermediate step such as single-point ab
initio calculations (see Chapters 3 and 4) can improve the ranking of the lattice energy so
that only a handful of crystal structures (energy cut-off or a set number of unique crystal
structures minima) are optimized with CrystalOptimizer
CrystalOptimizer has one of the major featuresndashndashLocal Approximate Models (LAMs)ndash
ndashthat models the conformational energy and the multipole representation of the charge
density these are updated with explicit quantum mechanical calculations only when
necessary and not at every minimisation step The conformational energies their first and
min Elatt = min [ΔEintra(θ) + min Uinter(X θ)] 234
28 Crystal Structure Prediction (CSP)
56
second gradients and the distributed multipoles are also stored in the LAMs database
Re-using expensive electronic structure calculations (if the same conformational ranges
are encountered while minimising different hypothetical or experimentally determined
crystal structures) reduces the computing time without sacrificing accuracy7172130
283 Polarizable Continuum Model (PCM) Accurately modelling the balance between intramolecular and intermolecular energy is
important (eg using CrystalOptimizer) but just as important is modelling the effect of
the environment in distorting the conformer especially in cases where there is a
considerable difference in molecular conformations Cooper et al131 noticed that the total
calculated crystal energies which combine atom-atom model potential calculations of
intermolecular interactions with DFT intramolecular energies do not effectively
distinguish the real (known) crystal structures from the rest of the low-energy computer-
generated alternatives when the molecular electrostatic models are derived from isolated
molecule calculations They found that introducing a simple model for the bulk crystalline
environment when calculating the molecular energy and electron density distribution led
to important changes in relative total crystal energies and made possible the correct
distinction between the observed crystal structures and the set of computer-generated
possibilities This finding highlights the importance in CSP calculations of the
polarization of the molecular charge distribution especially for polar flexible
molecules131
In Chapters 3 and 4 PCM132 is used to account for the effect of organic environment
after generating and accurately computing the lattice energies using CrystalPredictor
that is an intermediate step that improves the electrostatic contribution to the
intermolecular energy and CrystalOptimizer I will model the polarizable continuum
environment with dielectric constants that is typical of molecular organic crystals ie ε =
3133 The PCM calculations only affect the final energy The geometry is not affected
because there is no molecular geometry minimisation of the crystal structure during the
PCM calculation
284 Other Approaches to Lattice Energy Minimisation There are other well-known approaches to lattice energy minimisations for flexible
molecules One computationally efficient approach is the Rigid CrystalPredictor-
Molecular Mechanics Method (RCM)17 by Graeme Day a variant on the method used in
Chapters 3 and 4 The first step performs constrained geometry optimization on a set
number of distinct conformations obtained from conformational analysis (the flexible
28 Crystal Structure Prediction (CSP)
57
torsion angles are fixed at the expected values from conformational analysis and all other
degrees of freedom are optimized) From this first step we can obtain the geometry
intramolecular energy and atomic charges The second step generates crystal structures
in 21 of the most common space groups by using a rigid CrystalPredictor134 search for
each distinct conformation17 Essentially the molecular geometries are treated as rigid
during the process of generating crystal structures The Uinter is calculated from the atomic
charges and an empirical exp-6 repulsionndashdispersion potential W99135 The third step
refines the most stable crystal structures obtained from the rigid-molecule searches For
this a two-stage procedure proposed by Day136 and co-workers is used The first stage
minimises the crystal structures by allowing the molecular geometry to relax using a
molecular mechanics description of energies associated with changes to the flexible
torsion angles This method trusts the molecular mechanics force field to provide the
correct molecular geometries but discards the energy which is not of sufficient accuracy
for the final ranking of crystal structures Then the resulting crystal structures are re-
optimized without further changes to the molecular conformations DMACRYS34 is used
to model the electrostatic interactions Uelec using the atomic multipole model The
remaining intermolecular terms Urepul and Udisp are obtained using the empirical W99
potential135 The intramolecular energy ΔEintra and the atomic multipole moments for
each conformation are derived from a single-point DFT calculation that incorporates the
PCM with a constant dielectric value of three to reflect the polarization effects in the
crystalline environment
Another approach is GRACE one of the most accurate minimisation methods This
approach presented by Neumann and Perrin was the first case wherein DFT-D methods
(sections 275) were applied to the CSP of molecular organic crystals First during the
crystal structure generation procedure a Tailor-Made Force Field (TMFF)13 developed
for fitting an atom-atom force field (non-bonded and bonding terms) specifically for each
molecule is used Then GRACE uses a hybrid method that combines the sum of the DFT
component and an empirical van der Waals correction ndashD (sections 274 and 275) to
re-optimise the lowest-energy crystal structures During this re-optimisation stage all
nuclear positions and electron density are optimised simultaneously which naturally
accounts for the molecular flexibility and other charge density reorganisation effects such
as polarization This approach reproduces experimental structures very accurately and
ranks the structures favourably amongst other hypothetically generated structures in many
(but not all) cases However these periodic DFT-D calculations are very expensive137
28 Crystal Structure Prediction (CSP)
58
285 The Crystal Energy Landscapes The CSP methods611 discussed above and many others sample a wide range of
possible crystal structures and determine the lattice energy in a hierarchal manner thus
generating a crystal energy landscape14 A crystal energy landscape is a plot of the lattice
energy against the density or the packing coefficient and it tells us how well the crystal
packs These landscapes often include the experimental structures as well as other low-
lying energy crystal structures that are worth comparing with the known polymorphs in
order to determine the types of intermolecular interactions and conformations that could
be feasible for a given molecule
In a crystal energy landscape in which only one crystal structure is calculated to be
more stable than any other by over a few kJ mol-1 typical of polymorphic energy
differences the molecule should only be found in that global minimum structure
Experiments or more demanding searches are needed to determine the stability relative
to multicomponent forms such as hydrates138 solvates139 or cocrystals140141 etc
However in most generated crystal energy landscapes there is typically a cluster of
structures within the energy range of plausible polymorphs These structures have to be
qualitatively assessed to see whether the barriers between the different structures are so
low that thermal motion in the crystal or molecular rearrangement during nucleation and
growth will ensure that only the most thermodynamically stable structure is seen Closely
related structures may also give rise to disorder142143 or plastic phases144 at higher
temperatures
The crystal energy landscape may suggest that alternatives to the known structures
could be found either as more stable or as kinetically trapped metastable polymorphs In
this case the calculations can complement experimental screening145 by suggesting
alternative methods146 such as a templating to produce new polymorphs147 The
knowledge of the crystal energy landscape can help avert problems in pharmaceutical
industries during the manufacturing process and guide the experimentalist search for
undiscovered structure In fact the study of the crystal energy landscape in Chapter 4
helped my colleague to discover a new polymorph (section 438) A way of testing
methodologies developed for predicting crystal structures is through lsquoblind testsrsquo
286 The Blind Tests The early lack of progress in CSP was termed a lsquocontinuing scandalrsquo in Nature in 1988
by John Maddox148 In response the Cambridge Crystallographic Data Centre (CCDC)
organised five lsquoblind testsrsquo10116667149 of organic CSP with the first lsquoblind testrsquo held in
29 Crystal Structure Comparison
59
1999 The blind test provided many researchers the opportunity to test their CSP methods
The fourth blind test results showed a dramatic improvement in the rates of success over
previous blind tests with one group (GRACE) correctly predicting four crystal structures
as their first ranked choice albeit at a considerable computational expense10
In the fifth blind test our research group successfully predicted the crystal structure of
molecule XX1117 which has eight flexible degrees of freedom (internal degrees of
freedom) using CrystalPredictor and CrystalOptimizer algorithms I use a similar
approach in Chapters 3 and 4 The fifth blind test showed that methodologies such as
DFT-D could reliably predict the structures of small organic molecules but GRACE was
unsuccessful for molecule XX11 CCDC released the sixth lsquoblind testrsquo molecules in mid-
September 201415 too late for me to take part By chance an informal lsquoblind testrsquo
challenge did arise during the second year of my research which is the focus of Chapter
3
29 Crystal Structure Comparison Collins et al150 argued that one of the problems modern scientists face is the issue of
structural similarity and difference They noted ldquocriteria for deciding when two crystal
structures are the same is an issue that divides many structural analystsrdquo Indeed this
problem of determining how similar or different two or more crystal structures are was
what inspired researchers to create methods for comparing crystal structures that exist
today The visual inspection of similarities and differences between crystal structures
does have its benefits but the method is slow and susceptible to human bias Thus
researchers need a practical computational method that enables them to identify identical
or similar structures
Identifying the similarities among crystal structures is important when deciding
whether a newly discovered structure is the same as an existing structure151 Sometimes
there is also a need to determine similarities when comparing many structures that are
related as in the case of 50 structures of carbamazepine (CBZ)150 Another reason for
identifying similarities lies in the field of CSP67152 where thousands of hypothetical
structures are generated and many structures converge to the same or approximately the
same structure during lattice optimization Therefore the removal of duplicates and the
production of unique lists of crystal structures are essential
The Mercury153 material module which has COMPACK151 embedded in it allows
graphical representation of the similarity among the polymorphs while standalone
COMPACK scripts can compare hundreds of thousands of crystal structures There are
29 Crystal Structure Comparison
60
three main tools in the material module153 motif search crystal packing feature and
crystal packing similarity tools The crystal packing similarity tool calculates the level of
packing similarities between crystal structures that have the same or similar compound
COMPACK computes these calculations by analysing the geometry of the cluster of
molecules There are two basic steps in comparing two crystal structures using
COMPACK The first step renders the chemical search query subject to several geometric
constraints using the reference molecular structure The second step is the structure
similarity search which involves searching the 3-D coordinates of a target for an
arrangement that matches the query to within specified tolerances The search is
performed by 3DSEARCH154 which is an efficient general search algorithm designed to
find chemical queries within 3D crystal structures information Once 3DSEARCH finds
a match the two structures can be superimposed to obtain a visual impression of their
similarity
The default values for a cluster size of 15 molecules a distance tolerance of 20 and
angle tolerance of 20 are usually used The default cluster size is 15 because the same
clustering results of 30 molecules instead of the default 15 molecules for 1000 predicted
structures of 2-amino-3-nitropyridine led Chisholm and Motherwell151 to the conclusion
that a cluster of 15 molecules is a sufficient size for identifying the same crystal structure
Other methods of comparing crystal structures do exist For example XPac155156
identifies similar sub-components of complete crystal structures of 0- 1- or 2-D in
polymorphs or crystal structures of similar molecules as well as of 3-D in isostructural
assemblies Hirshfeld surface (a way of exploring packing modes157) and fingerprint plots
(a visual representation of all intermolecular interactions simultaneously158) are examples
of Hirshfeld-based methods150159160 of analysing similarities The graphndashset analysis for
H-bonds compares and contrasts sets of molecules161-163 and is based on graph theory for
categorising H-bond motifs Moments of inertia tensors is a technique for comparing
crystal packing based on moments of inertia tensors irrespective of chemical connectivity
and hence the comparison of compounds of diverse chemical composition is possible164
Simulated powder X-ray diffraction165 is another example of comparing crystal
structures In short the comparison of compounds of diverse chemical composition is
possible
COMPACKrsquos ability to give just one number (the distance between matched atoms in
a cluster-root-mean-square-deviation) that shows the relationship between two structures
makes this similarity tool one of the simplest and most effective ways of quantitatively
29 Crystal Structure Comparison
61
rationalising similarity This is why COMPACK will be the primary choice for comparing
crystal structures in this thesis
31 Introduction
62
Chapter 3 An Informal Blind Test A Crystal Structure Prediction of
1-Benzyl-1H-tetrazole
ldquoOne of the continuing scandals in the physical sciences is that it remains in general
impossible to predict the structure of even the simplest crystalline solids from a
knowledge of their chemical compositionrdquo
mdash John Maddox Nature (1988)
31 Introduction
311 Background This chapter reports an informal lsquoblind testrsquo of flexible 1-benzyl-1H-tetrazole BT
(Figure 31) using similar CSP methodology that successfully predicted the very flexible
molecule XX in the fifth blind test1117 In essence I will test the viability of the CSP
method (sections 11 and 28) which has evolved over the years from predicting the
crystal structures of rigid molecules166-168 to molecules that are so flexible that their
conformational flexibilities are accounted for at the start of CSP1117
9
10
1
8
7
2
11
123
65
4
2
1
Figure 31 The chemical diagram of BT determined from the crystal structure Torsion
angles 1=C7-C6-N1-C5 and 2 = C12-C7-C6-N1
In the previous chapters I mentioned that the emergence of a new polymorph of
ritonavir two years after market lunch (section 11) as well as John Maddoxrsquos148
ldquocontinuing scandalrdquo remark in 1988 (section 286) were the catalysts of the lsquoblind testrsquo
challenge organised by the Cambridge Crystallographic Data Centre (CCDC) in 1999
These lsquoblind testsrsquo provided researchers all over the world an opportunity to test their
CSP methods But unfortunately the CCDCndashndashmy industrial sponsorndashndashdid not organise
any lsquoblind testsrsquo during the course of the research reported in this thesis15 By chance my
colleague Rex Palmer observed an unusual packing of BT crystal structures and
subsequently issued me a lsquoblind testrsquo challenge This challenge was to predict the crystal
structure of BT given just the chemical diagram (Figure 31) and given that Z´=1
31 Introduction
63
The drug discovery literature frequently mentions the motifs of 5-substituted 1H-
tetrazole as bioisosteres for the carboxylic acid group169-171 due to the motifsrsquo similar pKa
values shapes and steric interactions Bioisosteres are structural moieties with broadly
similar shapes and functions For pharmaceutical industries the ability to model the
interactions of tetrazoles including BT is of great interest due to tetrazolersquos bioisosteres
feature
312 Experimental Determination of 1-Benzyl-1H-Tetrazole My collaborators (John Spencer Hiren Patel John J Deadman Rex Palmer Louise
Male and Simon J Coles) carried out the following experiments (their findings in
sections 313 and 314 were not made available to me until the end of the lsquoblind testrsquo
ie the submission of my candidate structures)
Synthesis and X-Ray Crystallography
John J Deadman synthesized BT on a ca 50 mmol scale from benzylamine sodium
azide and triethyl formate Hiren Patel under the supervision of John Spencer grew the
single crystals of BT from dichloromethanendashhexane
Louise Male and Simon J Coles collected the X-ray data and did the preliminary
analysis A colourless crystal fragment of dimensions 009 003 002 mm3 was
mounted on a glass fibre and flash-frozen to 120 K The X-ray data were collected on a
Bruker diffractometer using Mo K radiation The crystal structure was solved by direct
methods SHELXL-97172-174 was used to refine the crystal structure
313 Molecular Geometry of the Experimental Structure My collaborators discovered that BT crystallised in the monoclinic space group P21
with unit cell dimensions a = 76843(5) b = 55794(4) c = 94459(7) Aring = 100949(4)
deg V = 39761(5) Aring3 Z´= 1 and density = 1338 g cm-3 Overall the benzyl and tetrazole
rings were essentially planar including the H atom on the CH group (see C5 in Figure
31) belonging to the 5-membered tetrazole ring The individual rings were also co-planar
with the inter-ring link C6 atom (Figure 31) The N-N bonds (see bond lengths in Table
31) were of three different types consistent with Figure 31 N1-N2 = 1343(2) Aring N2-N3
= 1301(2) Aring is longer than a typical N = N bond175 but shorter than a typical aromatic
bond N3-N4 = 1368(2) Aring was also largely aromatic in character175 The two C-N bonds
have different characteristics C5-N4 = 1314(2) Aring was a double bond C5-N1 = 1336(2)
Aring was typically aromatic175 The phenyl rings of BT have a normal geometry with
average CndashC bond length of 1386(4) Aring average bond angle of 1200(7) and ring
planarity root mean square (rms) deviation of 00057 Aring The bond angles in the tetrazole
31 Introduction
64
ring have an average of 1080(17) which is consistent with the planarity of the ring
having an rms deviation of 0012 Aring including the link C atom and H5 on C5 These bond
lengths and angle measurements are similar to those of 5-azido-1H-tetrazole176
Table 31 Angles and bond lengths of the tetrazole ring in BT No information about the
bonds or angles were given to me prior to submission of the candidate structures
Angles X-ray
deg Bond lengths X-ray
Aring
N1-N2-N3 1069(2) N1-N2 1343(2)
N2-N3-N4 1102(2) N2-N3 1301(2)
N3-N4-C5 1052(2) N3-N4 1368(2)
N4-C5-N1 1096(2) N4-C5 1314(2)
C5-N1-N2 1080 (2) C5-N1 1336(2)
C5-N1-C6 1305(2) N2-C1 1472(2)
N2-C1-C6 1215(2)
314 Crystal Packing Weak Hydrogen Bonding Rex Palmer noticed that the mode in which the molecules in the experimental crystal
structure BT were packed was unusual He noted that a molecule such as BT based on
linked delocalized rings might be expected to form crystal structures involving ∙∙∙
bonding (ring stacking) However no such interactions occurred in the experimental
structure (Figure 32) Instead the structure was held together by a large number of weak
intermolecular contacts177178 12 of these were of the CH∙∙∙N interaction and 3 were of
the weaker CH∙∙∙C interaction which involve atoms in the phenyl ring This unusual
packing resulted in a structure composed of infinite S-shaped layers and produced a
sequence of benzyl and tetrazole layers (Figure 33) Another unexpected feature of the
packing was the formation of tetrazole clusters (Figure 32a) each having a central
tetrazole ring coordinated by six other tetrazoles
Figure 32 The crystal structure of BT (a) Partial view of the crystal packing showing
close CH∙∙∙N contacts between a central tetrazole and six surrounding tetrazoles (b)
Partial view showing CH∙∙∙N CH∙∙∙C and CH∙∙∙ contacts
(a) (b)
31 Introduction
65
Figure 33 BT crystal structure (a) View of the infinite S-shaped layers held together by
weak CH∙∙∙N and CH∙∙∙C H-bonds (b) Partial view of the layer structure showing
alternative B(benzyl) and T(tetrazole) layers and the repeating layer sequence [BTBT |
TBTB]
315 Overview of the Challenge After my experimental collaborators grew single crystals of BT from a non-polar
solvent mixture and determined the crystal structure at 120 K I was issued a lsquoblind testrsquo
challenge by Rex Palmer to predict the crystal structure of BT because of the unusual
mode of crystal packing (section 314) No experimental information was given prior to
the submission of the candidate structures The subsequent part of this chapter presents
the computational work I carried out independently upon receiving the chemical diagram
of BT (Figure 31)
This chapter uses CSP methodology (section 322) to predict the crystal structure of a
molecule that can adopt a wide range of molecular shapes due to the conformational
flexibility of the molecule Consequently the conformational flexibility must be
accounted for at the start of CSP (CrystalPredictor 16 section 281) In addition this
method relies on the systematic improvement of the evaluation of the lattice energy Elatt
where Uinter and Eintra are the intermolecular and intramolecular contributions X and
vector θ denote intermolecular and intramolecular degrees These systematic
improvements increase the computing time As a result it is essential to reduce the
number of crystal structures that will be examined as the confidence in the lattice energy
ranking improves in each step
This chapter will also test the transferability of the intermolecular energy potential to
BT since this molecule contains a functional group that differs from those used in
determining the parameters of the intermolecular potentials (section 23)3839
Elatt = Uinter(X θ) + ΔEintra(θ)
31
(b) (a)
32 Computational Methodology
66
To determine whether this study is a success the predicted structures of BT will be
compared with the experimental crystal structures using a similarity tool In addition I
will compare and contrast the most stable generated structures of BT with the similar
tetrazole fragment structures to determine whether the packing of the experimental
structure of BT was unusual In this chapter I will show that the crystal structure of BT
can be successfully predicted starting from just the chemical diagram (Figure 31)
32 Computational Methodology
321 Conformational Analysis To restrict the search space of BT to energetically meaningful regions I carried out
quantum mechanical (MP26-31G(dp) single-point calculations on HF6-31G(dp)
optimised geometries) scans of the two flexible torsions 1 and 2 (Figure 31) using the
GAMESS179 program
322 Crystal Structure Prediction Step 1 The search was carried out using the CrystalPredictor126 program which
covered the 59 most commonly occurring space groups The lattice energy was minimised
by varying the cell parameters and torsion angles 1 and 2 within energetically
meaningful regions (section 321) At this stage the lattice energies (equation 31) were
crudely estimated and then using the grid of the ab initio results from section 321 the
ΔEintra contribution were interpolated The intermolecular electrostatic interactions were
modelled using the atomic charges derived from section 321 All other intermolecular
energy terms were derived from an empirical exp-6 potential FIT40 Approximately a
quarter of a million lattice energy minimisations were performed This produced
approximately 170000 distinct structures of which 44000 structures were unique These
generated structures were labelled by their energy ordering The result of step 1 is the
CrystalPredictor energy landscape
Step 2 Next the lattice energy model was improved For each of the lowest 10000
crystal structures the energy of the isolated molecule and its charge distribution were
calculated at the PBE06-31G(dp) level of theory using GAUSSIAN0353 This
calculation provided a better estimate of ΔEintra and a more accurate representation of the
charge density in terms of a distributed multipole model51 These two contributions were
then combined with an atomndashatom exp-6 repulsion-dispersion potential using parameters
that had been fitted to azahydrocarbons39 and polar crystal structures40 which were
assumed to be transferable to this tetrazole At this stage the lattice energy was
minimised with the molecule held rigid using DMACRYS34
33 Results and Discussion
67
Step 3 Approximately 100 of the most stable structures were then further refined at
the PBE06-31+G(d) level of theory by allowing the molecular conformation to adjust
more accurately to the intermolecular forces using the program CrystalOptimizer7172
(section 282) This algorithm allowed the intermolecular and intramolecular energy to
be minimised simultaneously The CrystalOptimizer program uses the Quasi-Newton
algorithm coupled with a line search to solve the minimisation program It also makes use
of GAUSSIAN0353 calculations on the molecular conformations and DMACRYS34
optimisations of the crystal structure
Step 4 The effect of the crystal environment on the conformational energies ΔEintra and
charge densities was estimated by calculating the conformational energy and charge
distribution in a Polarizable Continuum Model (PCM)180 with =3 a value typical of
organic molecules131 This calculation was implemented in GAUSSIAN0353 at the
PBE06-31+G(d) level of theory The result of step 4 is the PCM crystal energy landscape
33 Results and Discussion
331 Conformational Energy Grid
Figure 34 The conformational energy grid used in the search Relative intramolecular
energies ΔEintra (kJ mol-1) for isolated molecule calculations at the MP26-31G(d p)
level of theory
Prior to the generation of hypothetical structures it was necessary to investigate the
possible steric hindrances to rotation about the two flexible torsion angles 1 and 2
(Figure 31) The result shown in Figure 34 indicates a high degree of flexibility in the
molecule The purple colours represent regions with the smallest energy penalty ie the
33 Results and Discussion
68
most stable conformations This high degree of flexibility makes possible a wide range
of crystal structures with different molecular shapes For this reason the generation stage
(step 1 of sections 322 and 332) incorporates conformational flexibility from the start
332 The CrystalPredictor Energy Landscape The analyses presented here are post-process ie after submitting the ten most likely
crystal structures on the PCM (final) energy landscape (step 4 section 333) The energy
landscape after step 1 (CrystalPredictor) is displayed in Figure 35 This step estimated
the lattice energies Elatt very crudely by interpolating the atomic charges and
intramolecular energies (Figure 34) Yet the generated structure that matched the
experimental structure of BT at this stage was only ranked 23rd This structure BT_23
which is highlighted in red on Figure 35 has only a 3 kJ mol-1 energy difference in
comparison with the global minimum structure
Figure 35 The CrystalPredictor energy landscape of BT generated with a crude lattice
energy model The generated structure that matched the experimental structure is
highlighted in the open red symbol
333 The CrystalOptimizer and PCM Energy Landscapes The two most stable crystal structures on the PCM energy landscape (Figure 36b) have
similar lattice energy less than 01 kJ mol-1 The lsquoblind testrsquo was deemed a success
because the experimental structure matched the second most stable crystal structure
2BT_23 on the PCM energy landscape (Figure 36b and Table 32) This PCM energy
landscape was generated after CrystalPredictor (step 1 Figure 35) lattice energy
refinement (step 2) CrystalOptimizer (step 3 Figure 36a) and PCM calculations (step
33 Results and Discussion
69
4 Figure 36b) Compared to the first step (step 1 Figure 35) the lattice energy rank of
the experimental structure improved significantly from 23rd to 2nd
Figure 36 (a) The CrystalOptimizer (step 3) and (b) PCM (step 4) energy landscape of
BT GM is the global energy minimum The open red symbol represents a match between
the experimental crystal structure and the generated structure The energy ranking of the
crystal structure that matches the experimental has improved from fourth most stable 4
to second most stable 2
(a)
(b)
33 Results and Discussion
70
I submitted a list of 10 structures in which the 2BT_23 structure was selected as the
first choice while the global minimum (labelled GM on Figure 36b) was selected as the
second choice181 The main reason for selecting 2BT_23 as the first choice was the
notable improvement of energy rank from fourth (Figure 36a step 3) to second (Figure
36b step 4) In addition the two most stable crystal structures on the PCM energy
landscape (Figure 36b step 4) were only 01 kJ mol-1 apart
Table 32 Summary of experimental (highlighted in blue) and computed crystal
structures on the PCM energy landscape (Figure 36) The computed structure that
matched the experimental structure (section 312) is highlighted in bold For label
xBT_y x and y are energy ranked after steps 4 and 1 of CSP respectively (section 322)
Label Space Group
a b c
Aring
β
deg
ρ
g cm-3
Uinter ΔEintra Elatt
kJ mol-1
1BT_120 P21c 999 817 1104 11750 133 -12176 225 -11952
2BT_23 P21 793 555 944 10132 131 -12152 208 -11944
Experiment P21 768 558 945 10095 134 - - -
3BT_165 P21c 1086 554 1597 12141 130 -12109 270 -11839
4BT_335 P212121 938 1581 556 9000 129 -12032 200 -11833
5BT_767 P21c 941 553 1580 10234 132 -12044 214 -11830
6BT_167 P21 568 839 881 10322 130 -12289 504 -11785
7BT_912 P21 557 869 861 10365 132 -11882 143 -11739
8BT_34 P21c 809 553 1859 10166 131 -11919 219 -11700
9BT_491 Pna21 1666 566 858 9000 131 -12299 626 -11673
10BT_250 P212121 1904 557 778 9000 129 -11916 325 -11591
11BT_55 P21c 1080 556 1582 12232 132 -11979 396 -11583
12BT_490 P21c 653 866 1394 9428 135 -12098 521 -11577
13BT_178 P212121 833 561 1764 9000 129 -11789 232 -11557
334 Did the Predicted Structure Really Match the Experimental Rex Palmer provided the cif file of the experimental structure once ten of the most
stable structures on the PCM landscape were submitted (Figure 36b) Then I compared
the experimental structure with the submitted crystal structures using COMPACK151 The
computed 2BT_23 structure my first choice (section 333) gave an excellent overlay
with 15 molecules of the experimental structure with a root mean square difference
RMSD value of only 0148 Aring (Figure 37) This computed 2BT_23 structure has similar
unit cell dimensions (Table 32) and is in the same space group P21 as the experimental
structure
33 Results and Discussion
71
Figure 37 The 15-molecule overlay between the experimental (atomic colours) and the
second most stable computed structure 2BT_23 (green) The direction of the view
obscures some of the molecules
In addition to excellent RMSD15 overlay the 2BT_23-generated structure provided a
starting model that was easily refined in SHELXL-97 which was further proof that the
structure was a genuine reproduction of the experimental crystal structure (section 312)
Hence it is clear that the CSP method outlined in this chapter which uses only the
chemical diagram as prior information can successfully predict the crystal structure of a
flexible molecule
335 The Global Minimum Structure on the PCM Energy Landscape The global minimum GM structure labelled 1BT_120 on the PCM energy landscape
(Figure 36) was very different from the experimental crystal structure as only two
molecules overlaid (Figure 38) during similarity calculations From the overlay of the
similarity calculations (Figure 38) it is clear that the GM and the experimental structure
have different conformations The GM structure 1BT_120 (Table 32) is in space group
P21c and has a very different spatial arrangement (as shown in Figure 39) when
compared to the experimental structure (Figure 32 and Figure 33) This structure also
has dominant weak H-bonds 8 CH∙∙∙N and 1 CH∙∙∙C interactions There was also one
weak ∙∙∙ benzyl∙∙∙benzyl interaction (Figure 39)
The similar lattice energy values of the two most stable structures generated (Figure
36b) suggest that the GM structure could a polymorph This GM structure could be
33 Results and Discussion
72
synthesised at high pressure because it is the denser of the two most stable structures
Also growing the experimental structure using a non-polar solvent (section 312) may
have prevented H-bonding formation
After the generation step (CrystalPredictor) the initial rank of the most stable crystal
structure after step 4 GM was 120th The eventual rank was first despite the fact that
only about 100 structures were optimised this shows the importance of the novel
intermediate step 2 in the CSP method After the CrystalPredictor step 1 the GM
structure was 9 kJ mol-1 less stable than the experimental 2BT_23 structure and had
distinctly fewer close contacts than the experimental 2BT_23 structure Therefore the
rearrangement of lattice energy depends on the method used
Figure 38 Crystal Packing Similarity between experimental (grey) and the most stable
predicted structure (1BT_120 green) with only 2 molecules matching (RMSD2 = 1072
Aring)
Figure 39 The structure corresponding to the global minimum in lattice energy
(1BT_120) showing the dominant weak H-bonds (Aring) eight of type CH∙∙∙N and one
CH∙∙∙C and the weak ∙∙∙ interaction (benzylmiddotmiddotmiddotbenzyl)
33 Results and Discussion
73
336 Post Analysis Comparison of Structure with CSD The motivation for the lsquoblind testrsquo challenge was the unusual packing of the
experimental structure Thus a database containing over half-million crystal structures
was searched in an effort to investigate the breadth of variation in the packing of the
experimental structures of BT A Cambridge Structural Database (CSD)182 survey was
carried out to compare BT with other 1-substituted 1H-tetrazole crystal structures (Figure
310) The CSD version 533 March 2012 was searched for fragments defined in Figure
310 The bond lengths bond angles and torsion were analysed and compared with the
experimental structure using histogram plots
1
6
23
5
4
Figure 310 Query used in Conquest to search the CSD for similar fragments
The query of the CSD yielded 34 structures including two redeterminations The
refcodes of these 32 structures were ACIROU ACIRUA BEGRIP CAZWIK
DOKQEA DOKQIE EKAJOQ HISYEO IQUJEK ABMIL LUVPIC MEVWOZ
MUKMAG PHTETZ01 PUGLUZ QALNOH QALNUN QALPAV QALPID
QALPOJ QALPUP QALQAW QALQEA01 QALQIE QEBPUI01 REVMOV
REZNUG RIZXEE SOLHAD TIJLIH VUNNUO and OBAREQ
The experimental bond lengths were typical of those in the other crystal structures
containing the 1-substituted 1H-tetrazole group (Figure 311) Some significant
differences ( 002 Aring) were observed between the ab initio computed values and the
experimental bond lengths but both were within the observed ranges The variations in
tetrazole bond angles (Figure 312) were consistent with the bond length variations for
this moiety176 which was always close to planar The external torsions angles ξ1 and ξ2
exhibited a wide range of values (Figure 312) a result that was consistent with the large
range of low-energy conformations (Figure 34) despite the range of functional groups
bonded to C6
No tetrazole clusters were observed for the 32 1-substituted 1H-tetrazole structures
found in the CSD There were however some tetrazole layers in 1BT_120 and the
33 Results and Discussion
74
experimental structures DOKQIE EKAJOQ QALPAV QALPOJ QALPUP and
REVMOV All 32 structures had the tetrazole bonded to a sp3 carbon and were tetrazole
hydrocarbons (except QALPAV which also contained an iodine atom) Hence there was
no strong driving force for the tetrazole cluster Still a layer structure seemed to be quite
favourable in cases where there were no competing strong interactions There were more
similarities between the CSD tetrazole structures and the GM structure than there were
between the experimental structures This finding suggests that the use of informatics of
CSD in CSP such as Desirajursquos supramolecular synthon approach183 would weight the
global minimum structure more than the experimental structure
Figure 311 Histograms showing the bond length distributions of 32 1-susbtituted 1H-
tetrazole rings in the CSD The red square denotes the experimental bond lengths in BT
while the black square denotes the ab initio bond lengths in the corresponding calculated
structure 2BT_23
33 Results and Discussion
75
Figure 312 Histograms showing the distributions of the torsions and angles of the 32-
tetrazole rings found during the CSD survey The experimental bond length in BT is
denoted by the red square while the ab initio bond length in the corresponding calculated
structure 2BT_23 is denoted by the black square
34 Summary
76
34 Summary I successful predicted the unusual crystal packing of BT given just the chemical
diagram and the Z´ number The packing was predicted by using a model that accurately
determines the electrostatic forces arising from molecular charge density including the
anisotropic forces from the lone pair and electrons but otherwise was not tailored to
the tetrazole∙∙∙tetrazole interactions Thus the intermolecular energy potential is
transferable to BT crystal structure even though the functional group used in determining
the parameters of the intermolecular potentials did not include a single tetrazole molecule
The successful prediction of the experimental structure as one of the two distinct most
stable structures shows that the unusual layers do present an optimal compromise between
the many different weak hydrogen bonds and other intermolecular interactions The most
stable crystal structure GM could well have been an undiscovered polymorph In fact
informatics weighting may have selected this structure Thus this study shows the
potential value of CSP for generating unexpected structures
This study also showed that the level of computational chemistry modelling that was
used is suitable for modelling the molecular recognition of this functional group This
level of modelling could become increasingly useful in pharmaceutical design due to
tetrazolesrsquo bioisosteres properties In the next chapter more will demanded of CSP Will
this method deliver
41 Introduction
77
Chapter 4 Is the fenamate group a polymorphophore Contrasting the
crystal energy landscapes of fenamic and tolfenamic acids
ldquoIts the little details that are vital Little things make big things happenrdquo
mdash John Wooden
41 Introduction This chapter builds on Chapter 3rsquos description of a procedure that successfully
predicted the experimental crystal structure of a flexible molecule in order to address two
specific questions First in a given molecular structure is the presence of a
polymorphophore (section 11) substructure sufficient to ensure polymorphism Second
what role do substituents play in determining the range of polymorphs that are present in
a molecule
In this investigation of the concept of polymorphophore I will use CSP to contrast the
crystal energy landscapes of two fenamates (Figure 13) monomorphic fenamic acid (2-
(phenylamino)-benzoic acid FA) and one of its highly polymorphic derivatives
tolfenamic acid (2-[(3-chloro-2-methylphenyl)amino]-benzoic acid TA) TA is a good
test case for this investigation into whether the fenamate group is a polymorphophore
because at the start of this study TA had five known polymorphs19
The term ldquofenamaterdquo can refer to a range of molecules that vary widely in molecular
structure including niflumic acid which contains an aromatic nitrogen Although some
researchers who have conducted thermodynamic and structural investigations of
fenamate molecular crystals have included an extraordinarily wide range of molecules
even dichlofenac184 the present study is restricted to the fenamates shown in Figure 13
Essentially I will focus on cases where the dominant interactions that determine the
crystal or drug binding are inherent in the proposed polymorphophore families of fenamic
acid (Figure 13)
41 Introduction
78
ROY fragment
WIFHUP 2185
R=H
ROY
QAXMEH 7(3)20
R2=CH3
OGIDEN 3186
R2=R5=CH3
Fenamate fragment
Fenamic acid (FA)
QQQBTY 1187
R=H
Tolfenamic acid (TA)
KAXXAI 519
R1=CH3 R2=Cl
Flufenamic acid (FFA)
FPAMCA
2(1)22
8(1)18 in 2012
R2=CF3
PEFMET 1188
R1=CH3
PEFNAQ 1188
R2=CH3
SURMEY 1187
R3=CH3
Mefenamic acid
XYANAC 2(1)189190
R1=R2=CH3
SURMOI 1187
R2=R4=CH3
LAHLOW 1191
R1=R5=CH3
Figure 41 The polymorphophore families of ROY and fenamic acid The numbers of
polymorphs in the Cambridge Structural Database (CSD) follow the refcodes for each
specific molecule and (x) denotes the number of additional polymorphs that whose
crystal structures were not available The lowest two rows are fenamates whose structures
are used in Table 46
41 Introduction
79
411 Polymorphism and Polymorphophores Polymorphism (section 11) the occurrence of multiple crystal structures with the same
chemical content is now known to be a widespread phenomenon among organic
molecules192 and is of great importance in the industrial manufacture of specialty
chemicals and pharmaceutical products Relatively few systems have several polymorphs
whose crystal structures and relative stabilities have been determined the most
thoroughly investigated20 being the polymorphs of 2-[(2-nitrophenyl)amino]-3-
thiophenecarbonitrile commonly known as ROY (Figure 13) after the red orange and
yellow colour spectrum of the first six polymorphs to be reported193 Some families of
related molecules23194 such as the sulphonamides194 ROY derivatives23 barbiturates195
carbamazepine derivatives147196 and fenamates19 appear to have a strong tendency
toward polymorphism This fact has given rise to the study of a polymorphophore1923196
a term coined by Matzger23 that refers to a structural element that when incorporated into
a molecule favours the formation of polymorphic crystal forms Hence
polymorphophore is a descriptive term and not a quantifiable hypothesis
The focus of this chapter is the polymorphophore concept Some families of molecules
contain a common substructure (the polymorphophore) wherein many members but not
necessarily all exhibit polymorphism For example removing or adding a methyl group
to ROY creates molecules (Figure 13) that are also polymorphic indicating that ROY is
a polymorphophore (Figure 13) However the number of related molecules is limited
probably because ROY is only a precursor in the synthesis of the blockbuster drug
olanzapine Studying polymorphophores is like studying pharmacophores a particularly
promising way of finding new leads in drug discovery especially in cases when a
receptorrsquos 3D structure is unknown197
This chapter considers the fenamates that conserve the H-bonding groups and dominant
molecular shapes by having small non-polar substituent groups for the aromatic protons
as exemplified in Figure 13 These types of substituent(s) might be expected to have
minimal effects on the strongest intermolecular interactions and hence on either crystal
packing or drug receptor binding The fenamates contain a proposed
polymorphophore1819 that is related to that of ROY (Figure 13) in having a phenyl group
attached via an N-H group to a further aromatic ring
412 Conformations in known Crystal Structures The overlay of the conformers of FA and TA in the experimental crystal structures
(Figure 42) confirms that the main variation in conformation is the ξ1 torsion angle The
41 Introduction
80
two most stable polymorphs of TA forms I and II (blue and red in Figure 42) have the
greatest difference in ξ1 The benzoic acid ring and the N-H groups are coplanar with the
ξ2 torsion angle being approximately zero concordant with the intramolecular H-bond
Figure 42 Overlay of the experimental conformers of FA (top) and TA (bottom) viewed
with the overlaid benzoic acid fragment arranged horizontal FA QQQBTY02 (Z´=2
light blue and magenta) TA KAXXAI01 (Form I Z´=1 blue) KAXXAI (Form II Z´=1
red) KAXXAI02 (Form III Z´=2 green and purple) KAXXAI03 (Form IV Z´=3
yellow brown (obscured by yellow) and black) and KAXXAI04 (Form V Z´=1
disordered on both sites (section 415) violet and grey) The arrows point to the main
variation (ξ1) between the conformers of FA and TA in the experimental crystal
structures
413 Experimental Data of FA and TA FA has just one known form187 which has two molecules in its asymmetric unit Z FA
serves as a parent structure for several fenamates including TA TA is a non-steroidal
anti-inflammatory drug used for the treatment of rheumatic conditions198 At the start of
this study TA had at least five polymorphs forms I-V19199 It currently has six
polymorphs (see section 438) Unlike ROY the polymorphs of TA vary in the number
ξ1
ξ1
41 Introduction
81
of molecules in the asymmetric unit Z´ (Table 41) The variation in colour that is
observed between form I (colourless) and II (yellow) is due to the conformational
difference as observed for ROY2023 There were three undisputedly metastable
polymorphs including form V whose disorder is analysed further in section 415
Here it is necessary to discuss further the relative stability of forms I and II (Table 41)
The enthalpy and temperature of fusionHfus and Tfus measurements provide a way of
classifying polymorphs as either being monotropic or enantiotropic Four different
papers19199-201 have presented evidence for the thermodynamic relationship between
forms I and II but each paper gives slightly different conclusions Surov et al showed
that the yellow form (form II) is more stable than the white form (form I)201 and that these
polymorphs have a monotropic relationship because the form with the higher melting
temperature form II has a higher enthalpy of fusion Hfus (by the enthalpy of fusion
rule)202 as illustrated in Figure 43(a) However Mattei and Li200 measured an
endothermic transformation going from II to I with temperature increasing to 1418 degC
with a Differential Scanning Calorimetry (DSC) implying that forms I and II have an
enantiotropic relationship as shown in Figure 43(b) The observed transformation from
form II to I in a slurry experiment indicated that the thermodynamic transition point was
below room temperature All three sets of measurements199-201 that were extrapolated to
0 K had form II more stable than form I
Table 41 The experimental data of the known forms of FA and TA Crystal structures
and Hfus values were taken from ref [19] unless otherwise specified aThe most widely
varying torsion angle ξ1 is defined in Figure 49 bTemperature of crystal structure
determination cMelting temperature
REFCODE (form)
Space Group
Z´ ξ1a
deg Tb
K
Hfus
kJ mol-1
Tmc
K
FA QQQBTY02 P-1 2 4721 7045 283-303187 - - TA KAXXAI01(I) P21c 1 10774 3937 48625-4886
110 4250 48405199
410plusmn05 48418plusmn02201
4127 48585200
KAXXAI(II) P21n 1 4223 387 48667
110 4840 48765199 490plusmn05 48578plusmn02201
4240 41495200
KAXXAI02 (III) P21c 2 4419 5764 85 - KAXXAI03 (IV) P-1 3 673457584784 85 3188 KAXXAI04 (V) P-1 1 5562 85 -
41 Introduction
82
Figure 43 Temperature dependence of the enthalpy (H) and free energy (G) diagrams
for forms I and II of TA showing a monotropic (top) relationship from data from
Surov201 which are qualitatively the same as data from Andersen199 and an enantiotropic
(bottom) relationship from data from Mattei and Li200
Lopez-Mejias et al19 provided the only thermodynamic data available for forms IIIndashV
The researchers noted that heating forms III and V at 80degC caused a transformation to
form I within a period of minutes to hours In solution forms III IV and V transformed
to form I or a mixture of form I and II Hence forms III IV and V were shown to be
metastable polymorphs The heats of fusion given in Lopez-Mejiasrsquo supplementary
information19 were listed by the initial form and forms III and V may well have
transformed to form I rather than form II Therefore these sets of data were inconclusive
as to the relationship between forms I and II
(a)
(b)
41 Introduction
83
414 Similarities between the known forms of FA and TA The known polymorphs of TA and FA showed some similarities (Table 42) as all were
based on the H-bonded dimer (Figure 44a) The graph-set analysis161162 for the (two)
types of H-bonds are identical for all the crystal structures of TA and FA intermolecular
dimers with 2 donors 2 acceptors and 8 atoms in total (11987722(8)) and intramolecular with 1
donor 1 acceptor and 6 atoms in total (S(6))201
Form II had the most distinctive packing (Figure 44b) as well as conformation (Figure
42b) and was the only structure with a short contact involving the chlorine atom and the
aromatic ring The most striking result from Table 42 was the similarity between the
metastable forms III and IV where 11 molecules could be overlaid (Figure 44c) The
two independent molecules in form III had similar conformations to two of the three
independent molecules in form IV (compare the open circle and closed triangle symbols
in Figure 412a) The polymorphs had sufficiently similar simulated powder patterns to
have a PXRD similarity measure in the grey area between polymorphism and
redeterminations203 and for this reason they exemplify the challenges in defining
polymorphism204205
Table 42 Quantification of the similarities of FA and TA crystal structures showing the
packing similarity (RMSDn) and powder X-ray diffraction (PXRD) similarity206 The
bold numbers indicate the number of molecules n that match within distance and angle
tolerances of 20 and 20deg respectively with the RMSDn values in brackets See section
425
n(RMSDnAring)
FA TA(I) TA(II) TA(III) TA(IV)
FA - 6(066) 2(048) 3(074) 5(108)
TA(I) 078 - 1(087) 3(078) 3(107)
TA(II) 085 086 - 2(077) 2(074)
TA(III) 078 083 090 - 11(045)
TA(IV) 078 084 092 098 -
TA(V) 086 089 093 091 093
PXRD Similarity
41 Introduction
84
Figure 44 Features of the experimental crystal structures (a) The hydrogen-bonded
dimer motif found in all structures with variations in the phenyl ring orientations (ξ1)
The specific illustration shows the packing similarity between FA (QQQBTY02) and TA
form II (KAXXAI) (b) The unique packing of TA form II with short contacts between
chlorine and the aromatic ring (c) Crystal Packing Similarity between form III and form
IV of TA showing the 11-molecule overlay which includes only two dimers
415 Solving the Connectivity Problem of a Disordered Form The crystal structure of Form V of TA was solved with an R-factor of 658 the whole
molecule was equally disordered over two sites19 I found that separating the two
components of disorder gave the wrong connectivity between the C8 and N1 atoms (green
in Figure 45b) The C8-N1 bond length of 170 Aring was unusually long and this caused the
breakdown of the trigonal planar relationship of nitrogen C7-N1(H6)-C8 connectivity
(c)
(b) (a)
41 Introduction
85
(Figure 45c) A model with the two components both corresponding to the expected
molecular geometry can be made by redefining the connectivity (Figure 45b) to link half
of one disordered molecule (the bonded molecule in Figure 45a) with half of the other
disordered molecule (the atoms-only component in Figure 45a) The second component
was formed by combining the remaining halves The resulting molecules (red and blue in
Figure 45b) have the expected C-N bond length of 143 Aring and a trigonal planar geometry
around the nitrogen atom
The above procedure results in three ordered Z=2 crystal structures with the unit cell of
form V by using the two resulting molecules (Figure 46a b for Z´=1 and Figure 46c for
Z´=2)
Figure 45 (a) Crystal structure KAXXAI04 of form V of TA (b) The atom connectivity
of the two new components (colour red and blue) the original C-N connectivity is
labelled green (c) Chemical diagram showing the atomic connectivity of TA
9
1
1
2
10
1
813
14
7
164
21
1 53
2
(a)
(b)
(c)
41 Introduction
86
Figure 46 Ordered Z=2 crystal structures formed from the disordered components of TA
form V (a) Form V_a (b) Form V_b and (c) Form V_c
(a)
(b)
(c)
42 Computational Methods
87
416 Overview The focus of this chapter is the polymorphophore concept which I will investigate by
generating crystal energy landscapes (section 285) of FA and TA These crystal energy
landscapes are a valuable tool for examining the known forms of different molecules
because the same level of polymorph screening is rarely applied to entire families of
molecules This is likely the case for FA and TA since TA is a drug molecule while FA
is not In addition there were far more publications for TA than FA (see section 413)
For these reasons FA and TA provide a good test for the concept of polymorphophore
In this chapter the energy landscapes of FA and TA will be generated by first selecting
a suitable ab initio level of theory for the conformational energy of the isolated molecule
I will achieve this by performing ab initio scans at various levels of theory Then these
ab initio scans will be compared with histogram plots of crystal structures whose
fragments are similar to FA and TA The analysis of these scans and plots will guide the
methodology I will use to generate the hypothetical structures The final energy
landscapes of FA and TA will be generated by systematically increasing the accuracy of
evaluating the lattice energies while reducing the number of generated structures Finally
I will compare the crystal structures on the energy landscapes for FA and TA using a
similarity tool
I will show the conformational flexibility of fenamate fragments allows the potential
for a large number of structures and that it is the substituents that determine if a molecule
is polymorphic or not In other words polymorphophore promotes but does not guarantee
polymorphism Concisely CSP goes beyond the lsquoblind testrsquo described in Chapter 3
42 Computational Methods
421 Ab initio Conformational Profile of TA To test the effects of ab initio methods on the conformation profile of TA I compared
relaxed scans at various levels of theory of the main torsion ξ1 (Figure 49) with single-
point energy calculations at the MP26-31G(dp) level of theory The effect of rotating
the H-bonded torsion ξ2 (see Figure 49) was investigated by performing a relaxed scan
at the PBE06-31+G(dp) level of theory The results from these scans helped in selecting
the appropriate level of theory as well as the torsion that would be allowed to rotate during
the generation of hypothetical structures (step 1 section 423)
422 CSD Survey for Fenamates The relaxed conformational scans of the main torsion angle ξ1 (section 421) at the
PBE06-31+G(d) level of theory were complemented by a Conquest207 search of the
Cambridge Structural Database (CSD 208) for the crystal structures containing the
42 Computational Methods
88
molecular fragment shown in Figure 47 This comparison allowed us to see the variation
in ξ1 when there was an internal H-bond (ZmiddotmiddotmiddotH lt 26 Aring) that constrained part of the
molecule to planarity
dlt26Aring
Figure 47 Query fragment and the torsion angle ξ1 measured in the Conquest207 survey
of the CSD structures There were 131 organic structures where Y=H and 94 where Yne
H
423 Crystal Structure Prediction I calculated the crystal energy landscapes14 of FA and TA using a method209 that was
adapted from that used for the highly flexible molecule XX in the fifth blind test of CSP11
a method that called for an approximate conformational energy surface in the initial
search stage (see section 281) The final energy landscapes of FA and TA were generated
in four steps with the quality of the methods increasing and estimated the conformational
energy penalty Eintra and the intermolecular contribution Uinter to the lattice energy Elatt
Step 1 (Generation of hypothetical crystal structure) Crystal structures with Z´=1 were
generated in 15 common space groups P1 P-1 P21 P21c P21212 P212121 Pna21
Pca21 Pbca Pbcn C2c Cc C2 Pc and P2c using CrystalPredictor126 The grid was
used to extrapolate the atomic charges and intramolecular energy Eintra This grid was
pre-computed as a function of just ξ1 (Figure 48) using GAMESS179 at the MP26-
31G(dp) level of theory (single-point calculation) after the molecular geometries were
optimized at the HF6-31G(dp) level The intermolecular contributions to the lattice
energy were calculated crudely from the atomic charges and the Williams135 exp-6
repulsion-dispersion potential The CrystalPredictor program carried out 250000 lattice
energy minimizations This resulted in 162288 and 182615 distinct structures for TA
and FA respectively of which 16543 and 22884 were unique for TA and FA
respectively
Elatt = Uinter + Eintra = Uinter + Uelec + Eintra 41
42 Computational Methods
89
Figure 48 The fragment used in the CrystalPredictor search for TA Each fragment was
kept rigid during the search for hypothetical crystal structures
Step 2 (Accurate evaluation of the electrostatic contribution (Uelec)) Single-point ab
initio calculations were carried out on the conformation for each of the unique structures
from step 1 using GAUSSIAN0353 at the PBE06-31G(dp) level of theory to improve
the estimate of Eintra and provide the atomic multipoles by distributed multipole
analysis51 using GDMA The crystal structures were re-optimized using DMACRYS34
keeping the molecule rigid with the intermolecular energy Uinter calculated from the
distributed multipoles and the FIT parameterization38-40 of the exp-6 atomndashatom
repulsionndashdispersion potential
9
1
1
2
10
1
813
14
7
164
21
1 53
2
TA
Figure 49 The degrees of freedom optimized by CrystalOptimizer for crystal structures
of FA and TA (ξ1equiv C7-N1-C8-C9 ξ2equiv C2-C7-N1-C8 ξ3equiv O1-C1-C2-C7 ξ4equiv H1-O1-C1-C2
and ξ5equiv C8-C13-C14-H10 θ1equiv H6-N1-C8 θ2equiv H1-O1-C1)
Step 3 (Accurate evaluation of lattice energy (Elatt=Uinter and Eintra)) Approximately
100 of the most stable crystal structures from step 2 were re-minimized due to the limited
time constraints of submitting this study as my first year report Six and seven
conformational degrees of freedom for FA and TA respectively (Figure 49) were
allowed to change as was the crystal structure using CrystalOptimizer7172 and
calculating Eintra and the distributed multipoles at the PBE06-31+G(d) level of theory
for the isolated molecule
Step 4 (Modelling the effect of the crystalline environment) Finally I estimated the
effect of the crystal environment using a Polarizable Continuum Model (PCM)180 that I
42 Computational Methods
90
obtained by calculating the wavefunction of the molecular structure in a dielectric of ε=3
(typical of molecular organic crystals)131 as implemented in GAUSSIAN03 The crystal
structures were then re-minimized using the distributed multipoles calculated in the PCM
environment while keeping the molecule rigid the resulting Uinter was combined with the
Eintra to evaluate the lattice energies The CSP-generated crystal structures for FA were
labelled xFA_y where x was the final energy ordering and y the ordering after the
CrystalPredictor stage A comparison of x and y shows the extent of re-ranking by
increasing the accuracy of the lattice energy model
424 Experimental Crystal Structures with Z´ gt1 The complexity of the task of generating Z´gt1 crystal energy landscapes (steps 1-4) for
flexible molecules limited the search (section 423) to Z´=1 Analogous CrystalOptimizer
(step 3) and PCM calculations (step 4) were performed starting from all the experimental
crystal structures of TA and FA which included Z´gt1 structures FA form I and TA
forms III IV and V (section 415) This allowed comparison between Z´=1 generated
crystal structures and the experimental crystal structures of FA and TA
425 Comparison of Crystal Structures The experimental crystal structures the corresponding lattice energy minima and the
structures on the crystal energy landscapes were compared using the Crystal Packing
Similarity151 module (section 29) implemented in Mercury210 This crystal structure
similarity tool returns the highest number of molecules n (where n 15) that can be
overlaid between two different structures when all non-hydrogen atomndashatom distances
are within a 20 distance tolerance and angles are within 20 The calculated RMSDn is
the root mean square deviation of all non-hydrogen atom positions in the clusters of n
molecules The program allows for comparisons of crystal structures of different
molecules with the RMSDn being calculated from only the common non-hydrogen
atoms This Crystal Packing Similarity calculation determines the similarity in the
coordination environment of the two crystal structures rather than of the crystallographic
cell
43 Results
91
43 Results
431 Dependence of Conformational Energy on Method An appropriate grid of intramolecular energies was essential in order to search all the
likely conformations of TA and FA and thereby generate all likely Z´=1 crystal structures
To observe the effects that changing the level of theory had on the relative intramolecular
energy the torsion angle was scanned at HF PBE0 MP2 and B3LYP levels of theory
using GAUSSIAN0353 with the rest of the molecule allowed to relax
Figure 410 The relative conformational energy of isolated TA molecules as a function
of the ξ1 The MP2 and PBE0 method at 6-31G(dp) basis set compared with the other
method (top) and the other basis sets (bottom) for the PBE0 method
43 Results
92
The HF6-31G(dp) level of theory produced one minimum for the torsion angle
(Figure 410a) This result was qualitatively incorrect so the PBE0 level was selected as
the best compromise because it reproduced the correlation effect present in TA its
minima coincided in the same torsion angle region as that of MP2 and was
computationally cheaper than MP2 Since the conformational profile of TA converged at
the 6-31+G(d) basis set (Figure 410b) I selected PBE06-31+G(d) as the appropriate
level of theory for the final lattice energy calculation (steps 3 and 4 of section 423) of
the crystal structures This level of theory produced the standard plots of Chapters 4 to 6
432 Consideration of H-bonded Torsion
Figure 411 The relative conformational energy as a function of the ξ2 (Figure 49) for
FA and TA calculated at the PBE06-31G(dp) level of theory
The conformational energy scans of ξ2 (Figure 411) of TA and FA are very similar
The decrease in the torsion angle from 180deg strainedmdashand eventually brokemdashthe
intramolecular H-bond between the carbonyl group and N-H This H-bond strain accounts
for the huge energy penalty observed when this torsion angle changed Therefore
torsion was kept rigid during the search for hypothetical crystal structures even as the
torsion was optimized within the crystal structures to enable an accurate evaluation of the
balance between intermolecular and intramolecular energy in step 3 (section 423)
Chapters 5 and 6 present a more thorough investigation of the conformational energy
scans of fenamates
43 Results
93
433 CSD Survey of Fenamates The conformational potential energy surfaces of isolated TA and FA molecules (Figure
412a) were similar for a wide range of conformations around those found in experimental
structures (Figure 42) but were different as the bulky methyl substituent of TA
approached the benzoic acid ring (Figure 412a) For FA the energy penalty for
conformational changeEintra was less than 6 kJ mol-1 for a complete rotation of the
phenyl ring whereas for TA there was a conformational region that was far too high in
energy to occur in crystal structures The observed conformations of FA and TA in their
crystal structures corresponded to low-energy isolated molecule conformations (Figure
412a) with a relative intramolecular energyEintra of less than 3 kJ mol-1 The
conformational profile for TA was in qualitative agreement with that calculated by other
high-quality ab initio methods (see MP2 and B3LYP in Figure 410) but the profile was
quantitatively affected by the subtle balance between intramolecular dispersion and
intramolecular basis set superposition error60 Other studies have also suggested that the
barriers to conformational change would be lower in solvents from calculations in a
dielectric continuum simulating CCl4 and methanol211
The crystal structures in the CSD that contain the search criterion of Figure 47 also
show the same preference for the lower energy conformations That is the distribution
maxima coincide with the conformational minima (Figure 412b c) with very few
structures having the two rings near coplanar or perpendicular (ξ1=0 90) around the local
maxima in the conformational energy scans For the Y=H search because both ortho
substituents were hydrogen atoms two torsion angle values arose per conformation in a
crystal structure (one value between 0 and 90 and the second value between 90 and
180) giving a symmetric plot (Figure 412b) For YH on the other hand each structure
had only one torsion angle value and an asymmetric distribution (Figure 412c) reflecting
the steric hindrance of the ortho substituent
43 Results
94
Figure 412 The relaxed conformational energy scan of FA and TA as a function of ξ1 at
the PBE06-31+G(d) level of theory (a) Includes the experimental values of ξ1 marked
for TA and FA with the symmetry equivalent FA conformations denoted by open black
squares and an insert diagram showing the steric hindrance for TA in the high-energy
region A histogram of (b) 131 crystal structures found in the CSD search (Figure 47)
with Y=H plus symmetry equivalent structures and (c) 94 crystal structures with YneH
(b)
(c)
(a)
43 Results
95
434 Validation of the CrystalOptimizer plus PCM Models The computational model (steps 3 and 4 of section 423) is able to reproduce all ordered
crystal structures satisfactorily as minima in the lattice energy (Table 43) with these
static 0 K structures overlaying the finite temperature crystal structures with similar
accuracy The range of lattice energies is less than 2 kJ mol-1 consistent with both the
small energy range expected for polymorphs and with the thermodynamic data (Table
41) Form I is the most stable at 0 K in disagreement with the monotropic relationship
between forms I and II as determined by DSC measurements199201 and other data (section
412) Forms III and IV are metastable and very close in energy to form II Of the three
form V Z=2 ordered model crystal structures two have a nearby lattice energy minimum
Because all are quite high in energy the disordered structure is likely to be more complex
than a combination of these structures However a full symmetry adapted ensemble study
of a large supercell143212 would not be appropriate without more detailed experimental
studies
Table 43 Comparison of the lattice energy minimum with the experimental structure
used as a starting point for the final lattice energy model (PBE06-31+G(d) PCM) for
the ordered structures of FA and TA The three form V Z=2 model structures derived
from the disorder components of TA (section 415) are also compared with the starting
model RMSDn corresponds to n=15 unless (n) is given
Space
Group
ρ
gcm-
3
Elatt
kJ mol-1
a b c
Aring
α β γ
deg
RMSDn
Aring
FA
Expt P-1 133 808 9811404 8596 8864 7345
Opt P-1 134 -13663 848 9911333 9094 8816 7130 046
TA
Expt I P21c 144 4833213 804 900010488 9000
Opt I P21c 139 -14724 4863154 832 900010200 9000 033
Expt II P21n 145 38422001421 9000 9411 9000
Opt II P21n 141 -14521 38622061460 9000 9621 9000 026
Expt III P21c 144 76411312807 9000 9303 9000
Opt III P21c 139 -14555 78311642748 9000 9332 9000 030
Expt IV P-1 144 75214331759 10368 9825 9304
Opt IV P-1 138 -14514 76514001828 10256 9932 9152 037(14)Dagger
Expt V P-1 144 765 902 942 10740 920610166
Opt V_a P-1 138 -13954 767 919 961 10756 939910087 021
Opt V_b P-1 137 -14177 6781077 897 9275 850310348 089(6)
Opt V_c P-1 139 -14437 768 928 949 10695 925110249 019
DaggerThe Expt and Opt IV crystal structures overlaid 14 out of 15 molecules
43 Results
96
It is clear from Table 43 that the lattice energy minimization of the ordered structures
V_a and V_c produces a fairly small change in the cell constants but the nearest
minimum to V_b is rather different probably because the initial structure contained a
close ClmiddotmiddotmiddotCl contact These ordered structures correspond to the most stable of three
models of form V All three structures have a lattice energy that is 6-8 kJ mol-1 above
form I and so these ordered models of form V are not competitive in energy with the
other known polymorphs of TA
435 Energy Landscapes of Intermediate Steps
Figure 413 Crystal energy landscape of TA for the Z´=1 structure after (a)
CrystalPredictor (Step 1) (b) the single conformer calculation of Eintra and the atomic
multipoles at the PBE06-31G(dp) level of theory (Step 2 of section 423)
(a)
(b)
43 Results
97
I refined the lattice energy calculation in stages and systematically reduced the number
of crystal structures as my confidence in the energy ranking increased After conducting
single-point calculations to get accurate Eintra and distributed multipoles (which
improved the Uelec and thus the Uinter see equation 41) on all of the unique crystal
structures (step 2 of section 423) the gap between the known forms (I and II of TA) and
the global minima reduced from 40 kJ mol-1 to 6 kJ mol-1 (Figure 413) This intermediate
step was vital in reducing the computing time of the subsequent step 3 (section 423
only about 100 crystal structures were refined) due to the increased confidence in ranking
of the known forms (Figure 413)
436 Finding and Explaining the Known Structures with CSP The known forms of FA and TA were at or close to the global minimum on the final
crystal energy landscapes (Figure 414) which generated all the known Z´=1 ordered
polymorphs The crystal energy landscapes of FA and TA were similar in that they each
had an energy gap of approximately 2 kJ mol-1 between the global minimum cluster and
the other structures although the cluster of low-energy structures was far larger for TA
Although this difference suggested that TA would be more polymorphic than FA I
compared the structures to see whether it was plausible that TA and FA could crystallize
as distinct polymorphs allowing for thermal motion at crystallization temperatures
All the crystal structures of FA and TA whose energies were plotted in Figure 414 (and
tabulated in Table 44 and Table 45) contain the carboxylic acid dimer (Figure 44a)
However the orientation of the phenyl substituents could differ so markedly that this
dimer did not always satisfy the distance criterion to be overlaid by the default Crystal
Packing Similarity comparison This observation suggests that these structures on the
final energy landscape for FA and TA differ by the packing of the aromatic rings It was
necessary to perform a qualitative assessment of the barriers that prevented the
rearrangement of the molecules into a more stable form
The lowest-energy hypothetical structure on the crystal energy landscape for FA was a
Z´=1 structure (1FA_22) that was very similar in density and lattice energy to the only
known experimental Z´=2 form (Figure 414a) with a PXRD similarity of 085 This
1FA_22 hypothetical crystal structure overlaid 5 molecules (Figure 415a) with the
experimental form and it matched the conformation of one of the independent molecules
(Figure 415b) The difference between these two structures lay in the packing of the
layers a difference that is seen in many polymorphs such as progesterone213
43 Results
98
Figure 414 The crystal energy landscapes of FA (top) and TA (bottom) Each symbol
represents a crystal structure of the specified space group which is a minimum in the
lattice energy (calculated within the polarizable continuum) The open symbols
correspond to the minima starting from the experimental structures (Table 43) The
packing coefficient is the proportion of the cell volume occupied by the molecule214
calculated using a grid spacing of 01 Aring
43 Results
99
Table 44 The lattice energy minima of FA shown in Figure 414a The minimum found
starting from the experimental structure is in bold
Label Space
Group a b c
Aring
α β γ
deg
ρ
g cm-3
Uinter ΔEintra Elatt
kJ mol-1
1FA_22 P21c 868 4682709 9000 7404 9000 134 -13765 137-13628
QQQBTY02 P-1 848 9911333 9094 8816 7130 134 -13920 316-13599
2FA_2 P-1 454 9271493 6910 9201 6858 132 -13483 152-13331
3FA_59 P21c 457 8802695 9000 9956 9000 132 -13381 113-13269
4FA_1 P21c 451 8992682 9000 7877 9000 133 -13435 175-13260
5FA_10 P21c 4582686 880 9000 8526 9000 131 -13350 144-13206
6FA_151 P-1 1285 744 666 66291027411127 131 -13418 221-13197
7FA_4 P21c 1788 5341283 9000 6136 9000 132 -145121363-13149
8FA_16 P21n 1395 5201508 9000 7809 9000 132 -145051361-13144
9FA_287 P21n 1429 4591770 9000 7060 9000 129 -13279 240-13039
10FA_192 P21c 46019181231 9000 9792 9000 132 -13641 636-13005
11FA_19 P21c 50121791004 9000 7377 9000 135 -143771419-12958
12FA_23 P21c 6443425 653 900013152 9000 131 -13855 917-12938
13FA_2880 P21n 1490 4931456 9000 8825 9000 133 -13666 791-12875
14FA_33 P21c 4302600 997 900010250 9000 130 -13039 166-12873
15FA_18 P-1 870 799 935 105831022011301 132 -13040 187-12853
16FA_5226 P-1 10211325 990 1410911696 4347 127 -13013 186-12827
17FA_484 C2c 3864 897 750 9000 5874 9000 128 -12962 155-12807
18FA_7 P-1 4991113 995 844610467 9266 133 -141671409-12758
Table 45 The lattice energy minima of TA shown in Figure 414b Minima found starting
from the experimental structures or ordered models are in bold
Label Space
Group a b c
Aring
α β γ
deg
ρ
g cm-3
Uinter ΔEintra Elatt
kJ mol-1
FORM I P21c 4863154 832 900010200 9000 139 -14874150-14724
1TA_8 P21c 4853160 833 9000 7787 9000 139 -14865148-14717
2TA_15 P-1 1772 847 484 79491123711171 140 -14832163-14669
3TA_876 P-1 1698 744 734 9440 9376 4181 141 -14952357-14595
4TA_6243 P-1 12061015 871 7176 617011737 142 -14774196-14579
FORM III P21c 78311642748 9000 9332 9000 139 -14853298-14555
FORM II P21n 38622061460 9000 9621 9000 141 -14784263-14521
5TA_38 P21n 38622051460 9000 8376 9000 141 -14781263-14518
FORM IV P-1 76514001828 10256 9932 9152 138 -14773259-14514
6TA_82 P21c 39014332374 9000 6805 9000 141 -14611234-14377
FORM V_b P-1 6781077 897 9275 850310348 137 -14505328-14177
FORM V_c P-1 768 928 949 10695 925110249 139 -14437313-14124
FORM V_a P-1 767 919 961 10756 939910087 138 -14219265-13954
7TA_45 P-1 14441231 385 10950 8330 7631 142 -14171263-13908
8TA_88 C2c 2697 4792067 900010567 9000 135 -14113218-13895
9TA_64 P-1 756 900 986 753110145 8029 141 -14744889-13855
10TA_153 P21c 49212392217 9000 7574 9000 133 -13951196-13755
11TA_80 P2n 1492 3982150 9000 7536 9000 141 -13910180-13730
12TA_3630 P21c 1655 3842338 9000 5714 9000 139 -13930222-13708
43 Results
100
Figure 415 (a) Overlay of the only known form of FA (grey) and the most stable
structure on the Z´=1 crystal energy landscape (Figure 414a) 1FA_22 (green) with an
RMSD5 value of 175Aring (b) Overlay of the conformers of form I (pink and light blue) and
1FA_22 (black)
A significant energy gap was observed between the experimental and lowest energy
Z´=1 structure and the other structures generated for FA (Figure 414a) Remarkably this
gap was between two hypothetical structures that had a 12-molecule overlay and only
differed in the packing of the layers (Figure 414a) The lower-energy structure
(1FA_22) had more close contacts and a higher packing coefficient than the higher-
energy structure The second most stable hypothetical structure (2FA_2) was also
closely related to the experimental structure in it half of the molecules had changed the
phenyl torsion angle to a less stable conformation changing the stacking with the
phenyl ring in the neighbouring molecule to a herringbone215 (C-Hmiddotmiddotmiddot) interaction
(Figure 416bc) Thus there were two ways that the 2FA_2 structure could gain 2 kJ
mol-1 of stabilisation energy (Figure 416) The relationship between the two most stable
structures (1FA_22 and the experimental structure) means that it may be very difficult
to produce the Z´=1 structure as a polymorph Clearly Z´=1 and Z´=2 structures are very
close in energy and are related (via 2FA_2) It is therefore difficult to establish whether
the observed form is in fact a ldquocrystal on the wayrdquo216 that is trapped by a barrier from
rearranging into the Z´=1 form or whether the observed form is the more stable
structure217
(a) (b)
43 Results
101
Figure 416 (a) Overlay of the two most stable hypothetical crystal structures on the
crystal energy landscape global minimum 1FA_22 (grey) and 2FA_2 (green) with
ΔElatt=20 kJ mol-1 The crystal structures overlaid 12 molecules with RMSD12 of 051 Aring
and the conformations had an RMSD1 of 009 Aring (b) Overlay of 2FA_2 (green) and the
experimental crystal structure of FA (grey) with a RMSD15 of 123 Aring obtained with a
distance and angle tolerance of 50 and 50deg (c) Overlay of the two independent
molecules in the experimental structure (grey) with 2FA_2 (green)
For TA the crystal energy landscape successfully found the Z´=1 polymorphs forms
II and I to be the first and fifth most stable crystal structures within 2 kJ mol-1 of the
global minimum (Figure 414b) the landscape also provided a good reproduction of the
experimental crystal structures (Figure 417 and Table 43) Four other structures were
observed all of which were competitive in lattice energy with the known metastable
forms These crystal structures had somewhat similar packing to the known forms of TA
(Table 48) some being more similar to the form V Z=2 model structures constructed
from the disorder components of TA than to the other polymorphs (contrast Table 42 and
Table 48) Some of the similarities (Table 46) between the hypothetical structure and
the other fenamates in Table 41 were even more striking One of the computed structures
(a) (b)
(c)
43 Results
102
6TA_82 (highlighted in Table 45) matched 15 molecules of SURMOI (Table 41)
suggesting that crystals of this dimethyl-substituted molecule might template the
nucleation of a novel polymorph of TA This observation led to the joint experimental
and computational project discussed in section 438
Figure 417 The overlay of the experimental Z´=1 crystal structures (grey) of TA with
the closest structure found in the search (green) (a) Form I and 1TA_8 overlaid with an
RMSD15 value of 032Aring (b) Form II and 5TA_38 overlaid with an RMSD15 value of
026Aring
(b)
(a)
43 Results
103
437 Other Known Fenamates and their Hypothetical Structures Further marked similarities were observed between the structures on the crystal energy
landscapes of FA and TA (Figure 418) The hypothetical crystal structures on the crystal
energy landscape of FA in Figure 418 were similar to some of the known forms of TA
(forms I-IV) with some of these hypothetical crystal structures overlaying up to 13
molecules (forms I and III of TA Figure 418) Many of the low-energy structures of FA
had more in common with a polymorph of TA than with the only known form of FA that
is with a few exceptions the second numbers are greater than the first bold numbers
(Figure 418) There exist distinct crystal structures of FA with the planar molecules
(highlighted in Figure 418)
Figure 418 Classification of the crystal energy landscape of FA in terms of the similarity
of the structures to those of known TA polymorphs (I-IV) without PCM (hence the
different y-axis compared to Figure 414a) Numbers in bold indicate the number of
molecules that overlay with the known structure of FA Hence a label 5 6 on a structure
represented by a blue circle means that the structure overlaid 5 molecules with the
experimental form of FA but 6 with form I of TA Each point is coloured by the TA
polymorph with which it overlaid the greatest number n of molecules in a Crystal Packing
Similarity calculation that ignored the CH3 and Cl
The similarities between the known forms of TA and the hypothetically generated
structures of FA confirmed that because of the effect of TArsquos substituents (CH3 and Cl)
on the moleculesrsquo relative energies the energy landscape of TA was more polymorphic
than that of FA (Figure 414) The common clusters produced by the similarity overlays
between different fenamates usually had the differing substituents in the exterior region
43 Results
104
where there was no overlay of the coordinating molecule consistent with the substituents
causing the differences in the packing This in marked contrast to the large common
cluster between forms III and IV of TA (Figure 44c) where the packing of the aromatic
rings is similar
Table 46 Crystal Packing Similarity comparisons of the experimental structures of FA
and TA and their most stable hypothetical crystal structures with the crystal structures of
the other fenamates shown in Figure 13 The similarity is given in the form n(RMSDn)
with n gt 4 molecules highlighted
n(RMSDnAring)
FPAM- CA
FPAM- CA11
LAH- LOW
PEF- MET
PEF- NAQ
SUR- MEY
SUR- MOI
XYA- NAC
FA
QQQBTY02 2(071) 4(133) 7(084) 3(128) 6(062) 3(05) 3(12) 4(049)
1FA_22 2(041) 5(191) 6(131) 2(013) 11(096) 4(098) 4(108) 3(18)
2FA_2 2(043) 3(056) 7(101) 2(01) 11(051) 3(107) 7(098) 3(086)
TA
II 1(089) 2(015) 2(059) 2(011) 1(061) 2(012) 12(187) 2(029)
I 2(059) 2(048) 3(061) 1(07) 13(038) 6(178) 4(12) 2(062)
III 1(081) 7(075) 2(048) 13(033) 2(055) 13(061) 3(041) 13(045)
IV 2(087) 6(071) 3(109) 11(049) 2(046) 13(084) 3(056) 15(03)
V_a 2(057) 2(046) 5(042) 1(068) 3(039) 2(022) 2(018) 2(057)
V_b 2(075) 3(032) 7(064) 2(047) 4(110) 5(041) 4(119) 5(072)
V_c 2(095) 2(084) 5(041) 1(042) 4(110) 4(051) 2(029) 3(046)
2TA_15 2(052) 2(053) 3(091) 1(077) 14(04) 4(082) 4(122) 2(07)
3TA_876 1(093) 4(156) 7(142) 3(043) 1(066) 3(071) 4(047) 2(037)
4TA_6243 2(054) 3(115) 3(176) 1(069) 4(016) 4(149) 2(017) 3(091)
6TA_82 1(092) 2(017) 2(061) 2(012) 2(064) 2(008) 15(028) 2(028)
Some fenamate crystal structures are specific to the molecule One observed example
(Table 46) is the FPAMCA polymorph of flufenamic acid In 2012 through the use of
polymer-induced heteronucleation and solidndashsolid transformations flufenamic acid set a
new record18 for a polymorphic compound with eight solved structures which was
recently equalled by aripiprazole218 These fenamate structures are all based on the
carboxylic acid dimer with some having more similarity to the TA and FA low-energy
structures (Table 47) The specific substituents affect the range of packing of the aromatic
rings For example the low-energy unobserved structures of FA which are based on a
planar conformation of the entire molecule (Figure 414) are probably also specific to
FA because the lowest-energy crystal structure of TA with a planar molecule is 14 kJ
mol-1 above the global minimum structure The energy difference between crystal
structures of TA is caused by substituent intermolecular interactions that destabilize the
43 Results
105
structures containing planar molecules the intramolecular energy penalty Eintra for this
planar conformation is similar for FA and TA (6 kJ mol-1 Figure 412)
Table 47 An extension of Table 46 showing Crystal Packing Similarity comparisons of
the latest structures of flufenamic acid18 and the experimental structures of FA and TA
and their most stable hypothetical crystal structures
n(RMSDnAring)
FPAMCA_z
z=2 z=4 z=5 z=6 z=7 z=8
FA
QQQBTY02 5(149) 3(079) 2(073) 4(160) 2(043) 3(082)
1FA_22 4(162) 5(142) 2(105) 5(202) 2(022) 2(026)
2FA_2 4(151) 4(034) 3(119) 5(080) 2(021) 3(130)
TA
II 2(010) 2(016) 2(04) 2(017) 1(071) 2(081)
I 3(158) 2(054) 2(069) 4(210) 2(034) 2(041)
III 2(022) 2(024) 4(052) 2(025) 1(064) 2(077)
IV 2(020) 2(023) 4(168) 3(084) 2(064) 2(070)
V_a 3(124) 2(048) 2(064) 2(050) 3(068) 3(080)
V_b 5(054) 3(067) 2(045) 3(063) 1(059) 2(078)
V_c 2(085) 2(041) 2(079) 2(042) 2(077) 3(127)
2TA_15 4(304) 2(080) 2(017) 2(062) 3(042) 4(280)
3TA_876 4(134) 2(018) 4(210) 2(019) 1(076) 2(082)
4TA_6243 4(110) 2(058) 2(040) 2(060) 2(031) 2(038)
6TA_82 2(018) 2(019) 2(025) 2(020) 1(073) 2(081)
Table 48 Crystal Packing Similarity calculations of the known forms of TA and
unobserved thermodynamically competitive crystal structures The similarity between
the structures is given in the form n(RMSDn) where n is the number of molecules overlaid
and the value in brackets is the RMSDn overlay Structures with the highest similarity are
highlighted
n(RMSDnAring)
2TA_15 3TA_876 4TA_6243 6TA_82
KAXXAI 1(095) 4(033) 1(088) 9(043)
KAXXAI01 1(049) 1(096) 5(132) 1(090)
KAXXAI02 2(087) 3(108) 2(095) 3(059)
KAXXAI03 2(083) 3(081) 3(255) 3(081)
KAXXAI04_a 4(125) 1(092) 3(016) 1(086)
KAXXAI04_b 4(128) 3(092) 6(107) 2(069)
KAXXAI04_c 1(013) 2(120) 4(105) 1(059)
438 Update on a Recently Discovered Polymorph of TA Section 436 theorized that experimentalists could nucleate a novel polymorph of TA
by using the SURMOI molecule as a template However my colleague at UCL used
mefenamic acid (Figure 13) because SURMOI is very expensive A novel polymorph of
TA was nucleated by solution evaporation after dissolving TA (form I) in ethanol and
43 Results
106
seeding it with mefenamic acid (form I)219 This procedure resulted in the nucleation of
form VI of TA which was disordered (65 and 35) with same unit cells as form I of
mefenamic acid
Although the major component of this novel form VI was generated in step 1
137_TA the form was not among the structures on the final energy landscape of Figure
414b The major component of form VI and 137_TA overlaid 15 molecules with a
RMSD15 value of 030 Aring (Figure 419) This structure 137_TA had a final lattice energy
of -14497 kJ mol-1 which was competitive with form IV of TA (Table 45 -14514 kJ
mol-1) It should be noted that steps 3 and 4 of CSP (section 423) involved just over 100
crystal structures Clearly lattice energy refinements (steps 3 and 4 section 423) of
more hypothetical crystal structures are vital
Figure 419 Overlay of FA_137 (green) and the major component of experimental
crystal structure of TA form VI (grey) with a RMSD15 of 030 Aring obtained with a distance
and angle tolerance of 50 and 50deg
439 The Cost of Lattice Energy Minimisation The lattice energy minimization (CrystalOptimizer step 3) of one crystal structure
accounted for as much as 75 of the computing time and took as long as 4 days (Figure
420a) because multiple ab initio calculations were required to balance Uinter and Eintra
The computing time was approximately half as long for the optimisation of the last
structure (form VI of TA Figure 420b) This last optimisation (Figure 420b) was faster
44 Summary
107
because there were about hundred structures stored in the Local Approximation Models
(LAMs)71 database (LAMs71 database stores and reuses conformational energy and
multipole representations of the charge density) This final calculation was performed
after the discovery of a novel polymorph of TA as discussed in section 438 Even with
the help of LAMs71 database the computational cost was still very high
Figure 420 CPU timings of (a) 38_TA (form II) and (b) 137_TA (form VI section
438) after lattice energy minimisation using CrystalOptimizer (step 3)
44 Summary This chapter described the successful use of the CSP method (see Chapter 3) to examine
the computer-generated low-energy crystal structures of the unsubstituted structural
fragment FA and a derivative TA This chapter showed that all structures were based
on the same 11987722(8) H-bonded dimer and that the structures differed only in the packing
of the phenyl rings The crystal energy landscape of TA had several crystal structures
including the observed polymorphs which were tightly clustered around the global
minimum whereas the corresponding cluster for FA contained only the observed and a
closely related structure This observation is supported by past experiments
Many of the crystal structures on the energy landscape for FA overlaid a significant
portion of the coordination environment with other observed or calculated structures
Therefore the phenyl ring substituents determined the relative energies of the crystal
structures and hence whether a specific fenamate would be very polymorphic or not The
FA fragment can be described as a polymorphophore despite only two structures
clustered around the global minimum since the molecular fragment packed in a wide
range of distinct crystal structures with different conformations that were energetically
favourable This finding indicates that being a polymorphophore correlates with but does
(a)
(b)
44 Summary
108
not guarantee polymorphism It is perhaps not surprising that this term has not been more
widely accepted
The similarities between the structures on the final energy landscapes of TA and other
fenamates led my colleague to conduct a templating experiment on TA (section 438)
The subsequent discovery of a new polymorph of TA (form VI section 438) exemplified
one problem with the CSP discussed earlier Restricting the number of crystal structures
that were accurately optimised (step 3 CrystalOptimizer) to just over 100 structures
meant excluding the recently discovered crystal structure of TA (section 438) from the
final crystal energy landscape (Figure 414b) As a result current intermediate steps like
the single-point calculations used in this chapter (step 2) although successful (section
435) had their limitations
The findings of Chapters 3 and 4 indicate the need for a cheaper and more accurate
approach to modelling lattice energy If the evaluation of Eintra (the bulk of computer
time section 439) can be realized through a less expensive method (Chapter 6) then
molecular dynamics calculations and the temperature effects (eg free energies) can be
better accounted for However we must first understand the origin of intramolecular
forces and energies (Chapter 5)
51 Introduction
109
Chapter 5 The Origin of conformational energy barriers in Fenamates
ldquohelliplsquoBegin at the beginningrsquo the King said gravely lsquoand go on till you come to the
end then stoprsquohelliprdquo
mdash Lewis Carroll Alice in Wonderland
51 Introduction
511 Background Chapters 3 and 4 established that lattice energy Elatt could be partitioned into
intermolecular Uinter and intramolecular components Eintra
where Uinter is the sum of the dominant electrostatics Uelec plus the contributions of
repulsion-dispersion Urepul-disp and Eintra is the energy required to distort the molecule
from its gas phase conformation71 The conformation determines the overall molecular
shape so different conformers may lead the crystal to arrange itself in different ways
ultimately influencing the properties of the crystal220 (Chapter 1)
1
6
2
1
9
1
1
813
7
16
Figure 51 The fenamate family showing the low barrier torsion angle (=C7-N1-C8-C9)
=0 when the aromatic rings are coplanar as drawn The fenamates family mentioned in
this chapter includes fenamic acid (FA) R1= R2= H tolfenamic acid (TA) R1= CH3 R2=
Cl mefenamic acid (MA) R1= R2= CH3 clofenamic acid (ClFA) R1=H R2=Cl and
flufenamic aid (FFA) R1=H R2=CF3 The dotted line represents an intramolecular
hydrogen bond
This chapter will investigate the conformational flexibility of fenamate molecules in
isolation Through this investigation we will come to a better understanding of the origin
of torsional barriers which will enable the derivation of an analytical model for the
intramolecular energies of the fenamate molecules FA and TA (Chapter 6) To put this
problem in context there is still an ongoing debate about the origin of the torsional barrier
of the ethane molecule which has only 8 atoms as compared to the 27 and 30 atoms of
FA and TA respectively
Elatt = Uinter + Eintra 51
51 Introduction
110
512 Torsional Barrier for Ethane The torsional barrier is defined as the difference in energy between the least stable and
the most stable conformations in rotation around a bond In order for one full rotation
around a bond to occur this energy barrier must be overcome (Figure 52) The energy
barrier for fenamic acid FA is smaller (Chapter 4) than ethane (Figure 53)
Figure 52 Illustration of the barrier to rotation with the relaxed conformational energy
profile of FA
Previous studies of torsional barriers have focussed on small molecules such as ethane
The torsional barrier for the ethane molecule is one of the most fundamental puzzles in
conformational analysis and researchers have great interest in understanding its origin221
The experimental (1203 to 1225 kJ mol-1) and quantum mechanical (1124 to 1303 kJ
mol-1) calculations of ethanersquos torsional barrier are in good agreement (Table 51)
However researchers disagree upon the origin of the torsional barrier in ethane The
root of the controversy is whether the origin of the torsional barrier in ethane results from
stronger hyperconjugation stabilization222 in the staggered conformation (Figure 53) than
the eclipsed form or whether the barrier originates from greater steric repulsion221 in the
eclipsed conformation (Figure 53) due to electrostatic interaction and Pauli exchange
repulsion Three physical factors may play a role in ethanersquos structural preference
hyperconjugation electrostatic interactions and exchange interactions
51 Introduction
111
Figure 53 The staggered and eclipsed conformations of the ethane molecule (Sources
Ref [222] and enwikipediaorgwikiAlkane_stereochemistry [Accessed 11012015])
Table 51 Torsional barrier height of ethane (Source Reproduced from Ref [223])
Hyperconjugation and exchange repulsion are quantum mechanical effects arising from
orbital overlap The hyperconjugation effect for the ethane molecule is constituted of the
vicinal interactions between the occupied CH bond orbitals of one of the methyl group
and the virtual antibonding CH orbitals of the other methyl group221 The staggered
51 Introduction
112
conformation (Figure 54a) is stabilised through the delocalization of electron charge
density involving these orbitals an attractive contribution
Pophristic and Goodman222 used natural bond orbitals (NBOs) to argue that
hyperconjugation or stabilization of the staggered ethane conformation is the origin of
the barrier to rotation in ethane By showing that if the CH-CH hyperconjugative
interactions were removed and by adding electrons to the unoccupied CH virtual
orbital the steric repulsion favoured the less stable eclipsed conformation (Figure 53)
This model of hyperconjugation interactions relies on NBOs and is not so obvious if
molecular orbitals (MOs) are used let alone if correlated wave functions are used
(a) (b)
Figure 54 (a) Hyperconjugation effects on the staggered (b) Pauli exchange repulsion
in the eclipsed conformation (Source enwikipediaorgwikiHyperconjugation
[Accessed 11012015])
Pauli exchange repulsion which requires that pairs of electrons do not occupy the same
spatial region occurs in the eclipsed conformation (Figure 54b) Electrostatic (Figure
55 also see section 223) repulsion involves the classical R-1 repulsion between charges
At short distances the 1-4 (third nearest neighbour) interactions still have an electrostatic
effect but there are also considerable penetration-effects (section 225) The Pauli
exchange and electrostatic repulsion frequently regarded as the steric factor destabilise
the eclipsed conformation of ethane These interactions are the same as intermolecular
interactions but at shorter distances
51 Introduction
113
Figure 55 Electrostatic steric repulsion (between electrons on the bond black arrow) for
the eclipsed conformation of ethane The red arrow indicates exclusion of van der Waals
repulsion since the van der Waals radii of the hydrogen are too small to make contact
(Source enwikipediaorgwikiConformational_isomerism [Accessed 11012015])
Mo and Gao221 made three arguments in favour of steric repulsion being the origin of
the barrier to rotation One argument was that hyperconjugation is a second-order effect
and hence should have little or no direct role in restricting free rotation224 Second these
researchers argued that overestimation of the hyperconjugative effects led others to
misidentify hyperconjugation as the origin of the rotation barrier Third Mo and Gao
argued that the experimental work on heats of hydrogenation for propene supported a
specific energy decomposition scheme225 In short the researchers argued that their three
points supported the claim that steric repulsion is the origin of the torsional barrier
The origin of the torsional barrier remains controversial226 even for a small molecule
such as ethane The question remains Is the torsion defined by the origin
hyperconjugation221222 or by a similar electronic effect from changes in MOs on the
atoms Or is the barrier equivalent to intermolecular non-bonded repulsion and
electrostatic effects227 at short distances ie as though there were no single covalent
bond The quantitative distinction can be highly dependent upon the precise definitions
and upon the type of charge density calculation that is used
513 Overview The conformational energy barrier of FA (622 kJ mol-1) is smaller than that of the
ethane molecule (123 kJ mol-1) The goal of this chapter is to investigate the qualitative
origin of the conformational barrier to rotation for fenamate molecules in isolation First
I will investigate the effects that different definitions of the same flexible bond have on
the calculated conformational profile of TA The step size of torsion angles various ab
initio methods and relaxation effects will be investigated for various fenamates (Figure
51) Following this I will investigate the electronic contributions using constrained
model molecules that avoid pyramidization (Figure 57) with minimal or no steric effects
Finally an exp-6 atom-atom model which contains both a repulsive and a dispersive part
will be used to investigate the steric effect of FA and TA
52 Method
114
This chapter will show that the barrier to rotation for FA and TA (Figure 51) depends
significantly upon small correlated changes in the entire molecule rather than on the
atomic position of the atoms that define the rotating torsion It will also show that there
is an intrinsic dispersion and electronic energy barrier when the aromatic rings are
perpendicular to one another the barrier to rotation for small model molecules can be
represented by a simple cos2 term
52 Method In section 431 it was established that the PBE06-31+G(d) level of theory is the best
compromise between the cheap but inaccurate HF method and the expensive but accurate
MP2 method for calculating the packing (intermolecular) and conformational
(intermolecular) energies (equation 51) of FA and TA This chapter examines the ab
initio conformational profiles of fenamate molecules in more detail All the ab initio
calculations reported in this chapter were performed using GAUSSIAN0353
521 Determining Conformation Energy Scan for Isolated Molecule
For TA there are 4 definitions of the N1-C8 rotatable bond (Figure 51) (1) = C7-N1-
C8-C9 (2) 2= C7-N1-C8-C13 (3) 3= H6-N1-C8-C9 and (4) 4= H6-N1-C8-C13 The effects
of these different definitions upon the conformational profile of TA were investigated
using the PBE06-31+G(d) level of theory Preliminary relaxed conformation energy
scans were also performed on FA using 2 and 1 step sizes around the maxima and
minima (section 431) respectively at the same level of theory in order to investigate the
origin of the slight asymmetry in FA
522 Ab initio Conformational Energy Profiles for Fenamates To test the sensitivity to method of the different fenamate moleculesrsquo conformational
profiles (Figure 51) I carried out a relaxed scan at the HF6-31+G(d) level of theory as
well as single-point energy calculations at the MP26-31+G(d) level of theory on the
optimized PBE06-31+G(d) conformations The PBE06-31+G(d) energies were then
revaluated within a polarizable continuum model (PCM)180 with dielectric continuum
value of 3 a typical dielectric environment of organic crystals PCM has been shown to
help the relative energy ranking of some conformational polymorphs (Chapter 4)131
The primary aim of this research was not to seek a definitive ab initio conformational
profile for all molecules as this would have been beyond the capability of the available
computational resources Indeed many studies have emphasized the difficulty in
evaluating the relative energies of fenamate polymorphs184211228 Instead the objective
52 Method
115
of this chapter is to present qualitatively correct scans that can be compared among the
fenamate molecules
523 Investigation of Electronic Effects In an attempt to distinguish the steric effects from the electronic effects I studied a
series of model molecules where the steric effects had been minimized (Figure 56)
12
9
1 813
6
Figure 56 Chemical diagram of model molecules used to investigate the electronic
contributions The bonds around N1 are constrained to be planar (ie R2-N1-H6-C8=180deg)
for phenylamine (PA) R1=R2=H N-methylaniline R1=H R2= CH3 N-vinylaniline R1=H
R2 = CH=CH2 and 3-anilinoprop-2-enoic acid R1=H R2 = CH=CHCO2H for 3-
chloroaniline R1= Cl R2=H and 3-methylaniline R1=CH3 R2=H (=R2-N1-C8-C9)
The benzoic acid group was replaced by a series of smaller molecular fragments (Figure
56) for example a hydrogen atom The three bonds to the nitrogen atoms were
constrained to be planar by fixing the torsion involving these atoms (eg H7-N1-H6-
C8=180deg for PA) This constraint prevents the normal pyramidalization at the nitrogen in
the torsional potential of phenylamine227 (Figure 57) or the major rearrangement of the
second hydrogen that occurs in a relaxed scan of H7-N1-C8-C9
Figure 57 Pyramidalization in unconstrained phenylamine (PA) molecule caused by
lone pair on nitrogen atom
The difference in electronic structure with torsion angle was estimated by using the
lowest occupied molecular orbital (ie the highest occupied molecular orbital (HOMO)-
n where n is an integer) and HOMO electron density for the PA model FA and TA For
52 Method
116
selected constrained (fixed ) conformations in the PBE06-31+G(d) scan a single-point
calculation with GAUSSIAN03 was used to generate a density file which was then used
to produce the molecular orbitals (MOs) isovalue surfaces of 002 au The graphical
interface used was GaussView 5229
524 Investigation of the Steric (Non-Bonded) Effects Within organic molecules that are typically used in pharmaceuticals many of the atom-
atom distances are similar to intermolecular distances although some are considerably
shorter The intramolecular steric interactions can be represented as the exp-6 atom-atom
intermolecular parameters which were derived by fitting to crystal structures and heats
of sublimation of hydrocarbons oxahydrocarbons azahydrocarbons chlorohydrocarbons
and nitro compounds42 This provides the parameters for all intramolecular interactions
involving C N O Cl and H but the same parameters are used for all C and H atoms
whether aromatic or in the methyl or carboxylic acid groups which is an approximation
to the most force field eg Sybyl typing230 This approximation is better justified for FA
than for TA (Figure 51) because of the importance of distinguishing C in different
chemical environments That is the chemical environment of aromatic C is different from
that of methyl C There is a polar hydrogen type HB which was used for both polar
hydrogens (H1 and H6 in Figure 51) because the intramolecular energy is expected to be
insensitive to the interactions of the carboxylic acid group
Table 52 Gavezzottirsquos exp-6 atom-atom parameters E=Aexp(-BR)-CR-6 is the well
depth and Rm is the distance at the minimum41231232 Italics represent the hydrogen-
bonded interactions aFrom the UNI intermolecular potential function of Mercury233
Interactions AkJ mol-1 BAring-1 CkJ mol-1Aring-6 kJ mol-1 RmAring
H∙∙∙H 241584 401 1092 004 336
H∙∙∙C 1207921 410 4728 021 329
H∙∙∙N 2282790 452 5021 039 299
H∙∙∙O 2954322 482 4393 051 280
H∙∙∙Cl 2929637 409 11673 050 330
C∙∙∙C 2261452 347 24184 039 389
C∙∙∙N 4914945 386 27907 084 350
C∙∙∙O 3930868 374 26819 067 361
C∙∙∙Cl 3906601 352 38618 067 383
N∙∙∙O 2685710 386 15230 046 350
O∙∙∙O 1953091 374 13347 033 361
O∙∙∙Cl 3382973 363 27824 058 372
HB∙∙∙O (acids) 264163953 875 8577 2929 160
HB∙∙∙N (-NH∙∙∙OH) 238673400a 778a 15774a 2661 180
53 Results
117
The Gavezzotti parameters used for FA and TA are given in Table 52 Although exp-
6 does not model the electrostatic contributions explicitly some of the parameters have
absorbed some electrostatic contributions during the fitting process The energies were
partitioned into repulsion (Aexp(-BR)) and dispersion (-CR6) contributions
The extension of the exp-6 parameterization to hydrogen bonding interactions required
potentials with a particularly deep well at the short hydrogen bonding distances to absorb
the electrostatic interactions in hydrogen bonding231 The polar hydrogens were assumed
not to have significant intermolecular interactions with any atoms other than the hydrogen
bond acceptor interactions which is a reasonable assumption for intermolecular
interactions The parameters for the H∙∙∙HB and C∙∙∙HB that were not determined by
Gavezzotti may be important
Interactions that are three atoms or more apart from each other (ie 1-4 and above) were
then investigated The longest bond path for FA and TA is 1-11 The atom∙∙∙atom
interactions that dominated the intramolecular contributions were analysed with the exp-
6 potential For each fenamate molecule interactions were classed as dominant if the
difference between the minimum and maximum total energy (Erepul-dis) of the conformers
was greater than or equal to 1 kJ mol-1 It is expected that some interactions in FA and
TA will vary with conformations however a few interactions will have constant
contribution (eg HB∙∙∙O (acid) an important intramolecular H-bond) The interactions
with constant contributions are not classed as dominant interactions
53 Results
531 Effect of Different Definitions of the Same Flexible Bond The N1-C8 rotatable bond can be defined in four ways C7-N1-C8-C9 C7-N1-C8-C13 H6-
N1-C8-C9 and H6-N1-C8-C13 (Figure 51) The conformational energy profile of TA
(Figure 58) is sensitive to the atoms used in defining the N1-C8 rotatable bond For
example the intramolecular energy penalty at ξ= 0deg for the C7 torsions (=C7-N1-C8-C9
and 2=C7-N1-C8-C13) are approximately half that of the H6 torsions (3=H6-N1-C8-C9 and
4=H6-N1-C8-C13) (Figure 58) The relaxation of the hydrogen atom (H6) was clearly
playing a vital role in stabilizing the molecular conformation at ξ= 0deg There were some
differences in intramolecular energy penalties as approached 180deg for the C7 torsions (
and 2 in Figure 58)
53 Results
118
Figure 58 Relaxed scan of TA at the PBE06-31+G(d) level of theory with the different
definitions of flexible N1-C8 bond (= C7-N1-C8-C9 2= C7-N1-C8-C13
3=H6-N1-C8-C9
and 4= H6-N1-C8-C13) used as the constrained geometric parameter
The torsional barriers for TA are sensitive to the atoms used in defining the N1-C8
rotatable bond (Table 53) The C7 torsional barriers (Group 2 of Table 53) are larger
than the H6 torsional barriers (Group 2 of Table 53) For the C7 torsions the H6 proton
relaxes to maintain the intramolecular H-bond while for the H6 torsions the benzoic acid
(including the C7 atom) deviates minimally to prevent deformation of aromatic ring and
form better pyramidalization (Figure 57) at N1 for TA These results show that the
torsional barrier and conformational energy profile of TA (Figure 58 and Table 53)
depend upon the selected 4 atoms that define the flexible torsion
Table 54 shows no correlation between shorter (stronger) intramolecular H-bond
distances and smaller energy penalties However a closer inspection of the atom-atom
distances between the H atom of the secondary amine and the H atom of the methyl group
(Group 1 of Table 55) suggest that steric hindrance also contributes to the intramolecular
energy because conformations with higher energy penalties correlate with shorter atom-
atom distances
53 Results
119
Table 53 Torsional barrier height of the relaxed conformational energy profiles in Figure
58 for TA
Torsion Barrier Barrier relative to
kJ mol-1
Group 1 3585 0 2 3572 -013
Group 2 3 2453 -1132
4 3148 -437
Table 54 Comparison of intramolecular energies and hydrogen bond distances of TA for
the near-planar conformer
Torsion N-H∙∙∙O=CAring ∆EintrakJ mol-1
Group 1
= 0deg 1850 706
2= 180deg 1847 648
Δ -0003 -058
Group 2 3= 180deg 1880 1574
4= 0deg 1881 1257
Δ 0001 -317
3(180)-(0) 0030 868
Table 55 Comparison of the intramolecular energies and the N-H7∙∙∙HX-C14 bond
distances of TA for the near-planar conformer where HX-C14 is the methyl group
Group 1 N-H7∙∙∙H10-C14 N-H7∙∙∙H11-C14 N-H7∙∙∙H12-C14
(Aring)
∆Eintra
kJ mol-1
= 0deg 3491 2284 2194 706 2= 180deg 3486 2272 2199 648
Δ -0005 -0012 0005 -058
Group 2
3= 180deg 3358 2135 2090 1574
4= 0deg 3386 2157 2117 1257
∆ 0028 0022 0027 -317
3(180)-(0) -0133 -0149 -0104 868
532 Effect of Step Size on the Conformation Profile of Fenamate Molecule Given that conformational profiles depend on small correlated changes in atomic
positions I investigated the effect of step size on the conformational profiles For FA the
conformation profile is unaffected by the small step size of 1 and 2 for the minima and
maximum respectively (compare Figure 510 with Figure 511) Over all possible
conformations of FA the barrier to rotation is approximately 6 kJ mol-1 (see Figure 510
and Figure 511)
Although the phenyl ring of FA is symmetric the rotation of this ring produces
asymmetry conformational profiles around the maximum and minima points (Figure
510) The slight asymmetry observed for the conformational profile of FA (Chapter 4) is
53 Results
120
therefore not due to the small step size These changes can be substantial for example
the two minima for FA scan at =3894deg and 14471deg (Figure 510) correspond to
conformations that differ by 061 Aring in the 1-4 distance between the amide proton and C13
(or C9) even though the minima only differ in energy by 188 x 10-3 kJ mol-1 (716 x 10-
7 au) Even the C8-C9 and C8-C13 aromatic bond lengths differ by 00037 Aring for =0 or
180deg but only by 00004 Aring for =80deg or 100deg with larger changes in the bonded
hydrogen positions for FA It is therefore clear that the molecular structure of the phenyl
ring is not perfectly symmetric (Figure 59) and that it changes with torsion
Figure 59 Molecular conformation of the relaxed gas phase at PBE06-31+G(d) showing
the bond lengths of the phenyl C-C bond (=180) of FA
For the definitive scans full optimization was performed near each symmetry-
independent potential minimum with a step size of Δ=5deg The highly repulsive points
for the substituted fenamates (TA and MA) were omitted due to the huge energy penalty
as approached 180deg (section 431 and Figure 58)
53 Results
121
Figure 510 Relaxed scans of FA at PBE06-31+G(d) with step sizes 2 and 1deg around the
maxima and minima respectively The red circles indicate the starting points of the scans
while the arrows indicate the directions of the scans
53 Results
122
533 Conformational Energy Profile of the Fenamates The conformational profile for four fenamate molecules (Figure 511) shows that there
are two distinct minima which are only close in energy for the symmetric FA and R2-
substituted ClFA (Figure 51) The ClFA molecule has one global minimum at 14838deg
in addition to the local minimum at 3586deg while FA has two global minima at 3894deg
and 14471deg (Figure 511) There is one potential maximum that varies slightly between
the molecules for the planar conformation (as drawn in Figure 51) there is a second
maximum when the aromatic rings are approximately perpendicular and there is a third
where there is a significant steric clash for the R1-substituted fenamates TA and MA as
the other planar conformation is approached An analysis of the observed values of this
torsion angle in experimental crystal structures containing the fenamate fragment shows
that the observed angles were clustered around the two minima (Chapter 4 Figure 412)
a finding that is consistent with the expectation that most molecules adopt low-energy
conformations in crystal structures208 Hence the two low-energy barriers although only
~5-9 kJ mol-1 clearly have a major effect on the crystal packing Indeed this
conformational energy is very significant it is large compared with most measured
polymorphic energy differences including those of TA which cover less than 2 kJ mol-1
(Chapter 4)
Figure 511 Relaxed conformational scans at the PBE06-31+G(d) level of theory for the
fenamates The minima were at ξ=3894deg and 14471deg for FA 4063deg and 11186deg for
TA 4408deg and 11048deg for MA and 3586deg and 14838deg for ClFA
53 Results
123
(a) (b)
(c) (d)
Figure 512 Relaxed conformational scans of fenamates (a) FA (b) TA (c) MA and (d)
ClFA at HF and PBE0 method with 6-31+G(d) basis set These are contrasted with the
single-point energies at the MP26-31+G(d) level and within a polarizable continuum
model (PCM) with =3 for the PBE06-31+G(d) conformations
By testing the sensitivity of this conformational profile to the choice of ab initio method
(Figure 512) it becomes clear that even obtaining a conformational profile that is in
qualitative agreement with the profile derived from experimental crystal structures is
sensitive to method The SCF scan has only one minimum as seen in Figure 512 at a
conformation that was not observed in the crystal structures of fenamates (section 433
Figure 412) If the CSP study of Chapter 4 were based on a SCF conformational profile
the crystal structures generated for FA and TA would have been qualitatively incorrect
Therefore it is essential that the ab initio methods include some description of the
electron correlation that produces a maximum at around 90deg Although there is moderate
agreement on the barriers to conformational change for TA and MA it is notable that
single-point MP2 calculations swap the relative energy positions of the two minima
(Figure 512) The PBE0 calculations are in better agreement with the analysis of the
53 Results
124
crystalline conformations of fenamate-like fragments with a substituent at C13 (Chapter
4)
The scans carried out within PCM with =3 showed a reduction in energy penalty
around the energy maxima (ξ~90deg) for all three fenamates (Figure 512) This reduction
is more pronounced for TA and MA around the local minima (ξ~110deg) than it is for FA
This finding suggests that the effect of solution or the crystalline environment the method
used for generating the final energy landscapes of FA and TA in Figure 414 of section
436 does not qualitatively change the conformational profile Hence the clustering of
observed torsion angles in fenamate crystal structures around the minima is not an artefact
of the neglect of the environment (Figure 412 in section 433) The results shown in
Figure 512 confirm that the definitive ab initio conformational profiles cannot be
obtained Nonetheless the scans in Figure 511 are adequate for the purposes of this study
534 Rigid Versus Relaxed Scans of Fenamates To establish the importance of changes in the other torsion angles bond angles and
bond lengths during the relaxed scans in Figure 511 the conformation scans were
repeated for the three fenamates starting with the fully optimized structure at the PBE06-
31+G(d) level of theory Only torsion angle was allowed to vary which meant that each
point had an identical conformation for all three ab initio methods (HF MP2 and PBE0)
The difference between rigid (solid lines in Figure 513) and relaxed (dotted line in Figure
513) scans was very marked for all the fenamates even in the lowest energy regions
where the changes in the benzoic acid ring and the intramolecular hydrogen bond were
small
53 Results
125
Figure 513 Comparison of relaxed (solid) and rigid (dotted line) scan of FA (top) TA
(middle) and MA (right) For the rigid scans calculations were performed using HF MP2
and PBE0 methods with 6-31+G(d) basis set as a function of torsion angle The relaxed
scans from Figure 511 were performed at the PBE06-31+G(d) level of theory
53 Results
126
0deg 80deg 110deg
Figure 514 Overlay of relaxed (coloured by element Figure 511) and rigid (red Figure
513) conformations of FA (top) TA (middle) and MA (bottom) overlaying the atoms
defining the ξ torsion angle at the PBE06-31+G(d) level of theory
Figure 514 shows a comparison of the rigid and relaxed conformations at the repulsive
barrier and the second minimum for FA TA and MA For TA the differences in the
relaxed and rigid scan conformations are very marked around the energy maxima (Figure
514 ξ=80deg) even though these maxima are less than 7 kJ mol-1 in the relaxed scans
(Figure 513) For FA there is a significant change in the relative orientation of the
benzoic acid group changing the internal hydrogen bond around all maxima The methyl
torsion is clearly playing a role in reducing the energy penalty around the 90deg maximum
for TA and MA (Figure 514) Indeed even for FA the changes in the other
conformational variables are vital to produce a low energy maximum at 90deg to the extent
that it is not surprising that even the relaxed scans differed in this region producing the
slight asymmetry between the two minima (Figure 511)
The contrast between the relaxed and rigid (Figure 513) scans and the corresponding
conformations (Figure 514) confirm that the changes in the other conformational
variables played a major role in lowering the conformational barriers providing low
values over a wide range of angles as implied by the crystallographic data (Chapter 4)
53 Results
127
535 Splitting electronic from steric contributions to the barrier to rotation
(a) (b)
(c) (d)
(e) (f)
Figure 515 The solid black lines show the relaxed torsional scans of planar-N-
constrained models for the phenyl rotation (Figure 56) where the benzoic acid group of
FA has been replaced by (a) hydrogen atom (PA) (b) methyl (c) vinyl and (d) prop-2-
enoic acid and the hydrogen in the meta position of PA has been replaced by (e) chlorine
and (f) methyl using HF PBE0 and MP2 methods with the 6-31+G(d) basis set Plots of
(h2)(1-cos(2)) where h is the height of the barrier of relaxed PBE06-31+G(d) scans
are shown in green For (c)-(f) the PBE06-31+G(d) relaxed scans of PA from (a) are
shown in grey for comparison In (a) and (b) a rigid scan at the PBE06-31+G(d) level of
theory is shown by a dotted line
53 Results
128
To establish the importance of the intramolecular steric clashes the rigid and relaxed
scans were repeated with model molecules that replaced the benzoic acid group of FA
with smaller fragments and the bonds around the nitrogen constrained to be planar (Figure
56) in order to avoid the pyramidalization of the amine (Figure 57) The potential energy
scan has a very large maximum at 90deg for planar-N-constrained phenylamine (PA)
approximately 6 times higher than the barrier in the fenamates (reflected in the scale
change between Figure 515a and Figure 511) Replacing one constrained hydrogen with
a methyl (Figure 56) produces a slightly larger barrier but very little asymmetry strongly
suggesting that this is an electronic effect of conjugation between the lone pair on the
nitrogen and the aromatic ring
Adding a double bond to PA reduces the barrier to rotation by 1110 kJ mol-1 (Figure
515c) Adding a carboxylic acid that forms an intramolecular H-bond to the N-H group
further reduces this barrier by almost 7 kJ mol-1 (Figure 515d) These observations imply
that the conjugation of the benzoic acid ring of the fenamates contributed significantly to
reducing the electronic barrier The intramolecular hydrogen bond in this model molecule
(Figure 515d) varies in length from 194 to 192 Aring as changes from 0 to 180deg by
comparison the FA hydrogen bond varies from 187 to 184 Aring Thus it is evident that the
intramolecular H-bonding in the fenamates reduces the electronic barrier In contrast
substituting Cl and CH3 at the meta position of PA (Figure 515e and f) shows little change
to the barrier height with half-height (h2) values of 3-chloroaniline (185 kJ mol-1) and
3-methylaniline (178 kJ mol-1) representing only a small increase over that of PA (176
kJ mol-1)
The scans in Figures 515a b e and f have no maxima at 0 or 180deg confirming that
the steric clash between the aromatic C6-H and C13-R1 (Figure 51) of the phenyl ring is
responsible for this maximum These curves are very well reproduced by ((h2)(1-
cos(2ξ)) where h is the potential maximum As the nitrogen substituents (Figures 515c
and d) get larger there are signs of additional steric effects particularly at the MP2 level
suggesting more changes in intramolecular dispersion The difference between a rigid
scan and a relaxed one is small (Figures 515a and b) and the differences in the curves
according to the type of calculation are relatively minor compared with the qualitative
differences between the HF and correlated methods for the fenamates (Figure 512) From
contrasting the conformational scans of model molecules with minimal steric effects
(Figure 515) with those of the fenamates (Figure 511) the overriding conclusion is that
there is an electronic contribution to the torsional barrier at =90 which can be
53 Results
129
represented by a (h2)(1-cos(2ξ)) term where h is the maximum energy from the
electronic contribution
There is a dramatic change in the HOMO isosurfaces of the phenyl ring with torsion
angle (Figure 516) which is remarkably similar between PA and the fenamates FA and
TA This finding suggests that the electronic contribution observed for PA is fundamental
to the fenamates The destructive interference of the MOs at =90 (Figure 516 and
Figure 517b) is the origin of the huge torsional barrier that is seen in each of the model
molecules in Figure 515 The smaller torsional barriers after adding a double bond
(Figure 515c) and acidic (Figure 515d) substituents to PA (Figure 515a) was a result of
increased electron delocalisation (compare Figure 517a with Figure 517b)
0deg 40deg 90deg
Figure 516 The electron density surface of HOMO frontier orbitals for different
conformations of PA (top) FA (middle) and TA (bottom) obtained from the PBE06-
31+G(d) level of theory Contour map isovalues were drawn at a 002 au level
(a) (b)
Figure 517 Alternative HOMO isosurface view of (a) FA and (b) PA molecule at =90
from Figure 516
My attempt at modelling delocalisation over the entire FA molecule even for the lowest
occupied orbital failed (Figure 518) which suggests that a completely flat model of
53 Results
130
FA ( = 0) is unrealistic This is because of the huge steric barrier (Figure 513) of a planar
conformation and the linear combinations of atomic orbitals in many molecular orbitals
are sensitive to conformation The electronic effects are not well defined for TA ie no
Figure 518 equivalent for TA due to the bulky substituent hence excluded in the analysis
= 0 = 40 = 90
Figure 518 HOMO-10 (46 MOs) isosurface view of side (top) and front (bottom) FA
molecule at =0 40 and 90
The MOsrsquo picture can only give a qualitative guide to the electronic contribution
because it is not possible to have an aromatic substitution at R2 or a methyl group
substitution on C13 (as in MA and TA) without steric interactions At present
independently investigating how the electronic barrier varies among the fenamates is not
possible However it is clear from Figure 515 that whilst the benzoic acid substituents
will have a dramatic effect on lowering the barrier the meta-substitution of chlorine and
methyl on the phenyl ring has a much smaller effect on the barrier
536 Estimating the Steric Contributions with an Atom-Atom Potential The steric effects of FA and TA can be analysed by using Gavezzottirsquos parameters
(Table 52) to produce a conformational profile (see Figure 519) which can then be
subdivided into the repulsion (Aexp(minusBRik)) and dispersion (minusCRik6) contributions
This subdivision (Figure 519) suggests that the repulsion terms dominate producing
maxima at 0 and 180deg and minimum at 90deg a finding that is consistent with the
supposition that these maxima occur because of steric clashes However the repulsions
are severely overestimated The dispersion contribution gives a maximum at ~90deg
which is of the same order of magnitude as the ab initio maxima particularly for FA This
confirms the observation from Figure 512 that electron correlation the origin of
dispersion interactions makes a significant contribution to this maximum supplementing
53 Results
131
the electronic effect (cf Figure 515) The difference between TA and FA in Figure 519
is consistent with the large dispersion interaction of the Cl substituent as well as the
repulsion from the methyl substituent
Figure 519 Comparison of the ab initio (black) intramolecular energy scans at the
PBE06-31+G(d) level of theory for FA (top) and TA (bottom) with Gavezzottirsquos exp-6
intramolecular energy models summed over all intramolecular atom-atom distances from
the third nearest neighbour (1-4) and above The net effect (purple) is subdivided into the
repulsive (red) and dispersion (blue) contributions
537 Investigating the Important Interactions with Atom-Atom Potential For FA and TA the dominant interactions involve C H and HB (Table 56) while the
dominant interactions involving N and Cl (Table 57) were exclusive to TA Although FA
and TA have the N atom only TA has the methyl substituent (N1∙∙∙C14 f and N1∙∙∙H12
f
Table 57) Of all the dominant interacting atoms for FA and TA only Cl of TA interacts
with atoms (methyl substituent) belonging to the same aromatic ring (dfC14∙∙∙Cl1
dfCl1∙∙∙H10 and dfCl1∙∙∙H11 Table 57) These results confirm the observation that the
53 Results
132
methyl substituent plays a role in reducing the energy penalty for TA (section 534
Figure 514)
Table 56 Atom-atom interactions of FA that dominate the intramolecular energies as
estimated using Gavezzottirsquos exp-6 potential The interaction is listed as dominant if the
difference between the minimum and maximum total energy (Erepul-dis) is greater than or
equal to 1 kJ mol-1
ati∙∙∙atk neigh RikkJ mol-1 ErepulkJ mol-1 EdispkJ mol-1 Erepul-dispkJ mol-1
min max(∆) min max(∆) Min max(∆) min max(∆)
C7∙∙∙C9 4 307 371(064) 057 533(476) -289 -092(196) -035 245(280)
C7∙∙∙C13 4 307 371(064) 057 532(475) -288 -092(196) -035 244(279)
C6∙∙∙C9 5 310 443(133) 005 475(470) -270 -032(239) -039 205(243)
C6∙∙∙C13 5 311 444(133) 005 468(463) -268 -032(236) -039 200(238)
C6∙∙∙H7 6 252 488(236) 000 398(398) -186 -003(182) -021 212(233)
C8∙∙∙H5 5 254 288(034) 089 357(268) -175 -083(092) 007 182(176)
C9∙∙∙H5 6 257 416(159) 000 317(316) -163 -009(154) -020 154(174)
H5∙∙∙H7 7 208 476(268) 000 578(578) -135 -001(134) -004 443(447)
C13∙∙∙HB6 4 251 330(078) 016 403(387) -187 -037(151) -021 216(236)
HB6∙∙∙H11 5 230 368(138) 001 240(239) -074 -004(070) -004 166(170)
C6∙∙∙H8 4 289 310(020) 485 985(500) -412 -274 (138) 212 573(362)
C6∙∙∙H11 6 252 488(237) 000 396(396) -185 -003(182) -020 211(231)
C13∙∙∙H5 6 257 417(159) 000 314(314) -162 -009(153) -020 152(172)
H5∙∙∙H11 7 209 476(267) 000 548(548) -130 -001(129) -004 418(422)
C9∙∙∙HB6 4 251 330(079) 016 406(390) -188 -036(152) -021 218(238)
HB6∙∙∙H7 5 230 369(139) 001 238(237) -074 -004(069) -004 164(169)
Table 57 Atom-atom interactions of TA that dominate the intramolecular energies as
estimated from Gavezzottirsquos exp-6 potential The interaction is listed as dominant if the
difference between the minimum and maximum total energy (Erepul-dis) is greater than or
equal to 1 kJ mol-1 dInteractions between atoms on the same aromatic ring fInteractions
involving the methyl substituent
ati∙∙∙atk neigh RikkJ mol-1 ErepulkJ mol-1 EdispkJ mol-1 Erepul-dispkJ mol-1
min max(∆) min max(∆) min max(∆) min max(∆)
C7∙∙∙C9 4 302 361(059) 081 630(549) -317 -109(209) -028 313(340)
C7∙∙∙C13 4 314 372(058) 056 417(361) -252 -091(161) -035 165(201)
C6∙∙∙C9 5 308 412(104) 014 513(499) -282 -050(233) -039 231(269)
C6∙∙∙C13 5 324 444(119) 005 292(287) -207 -032(176) -039 085(123)
C6∙∙∙H7 6 248 445(197) 000 458(458) -202 -006(196) -020 256(276)
C8∙∙∙H5 5 254 289(035) 086 363(277) -176 -081(095) 005 187(182)
C9∙∙∙H5 6 260 369(109) 003 286(283) -154 -019(135) -021 132(153)
H5∙∙∙H7 7 214 418(204) 000 451(450) -113 -002(111) -004 337(342)
C13∙∙∙HB6 4 254 322(068) 022 364(341) -176 -043(134) -020 187(207)
HB6∙∙∙H11f 6 219 450(231) 000 364(364) -098 -001(096) -004 266(271)
HB6∙∙∙H12 f 6 228 315(087) 008 254(246) -077 -011(066) -003 177(180)
C6∙∙∙C8 4 289 310(021) 485 995(511) -414 -273(141) 211 581(370)
C6∙∙∙C14 f 6 310 510(200) 000 482(482) -273 -014(259) -039 210(248)
C7∙∙∙C14 f 5 312 414(102) 013 455(442) -264 -048(216) -039 191(230)
C7∙∙∙H12 f 6 255 385(130) 002 344(342) -171 -014(156) -020 173(194)
N1∙∙∙C14 f 4 278 298(021) 487 1081(594) -607 -395(212) 093 474(382)
N1∙∙∙H12 f 5 243 262(019) 162 385(222) -243 -154(088) 008 142(134)
dfC14∙∙∙Cl1 4 304 311(007) 688 875(187) -488 -427(061) 261 387(126) fC14∙∙∙HB6 5 241 371(130) 003 618(615) -241 -018(223) -021 377(397) dfCl1∙∙∙H10 5 257 324(068) 051 813(762) -410 -100(309) -049 404(453) dfCl1∙∙∙H11 5 269 374(105) 007 489(483) -308 -042(266) -050 181(231)
54 Discussion The Physical Origins of Torsional Potentials
133
Analysis of which particular atom-atom interactions vary most with conformation
(Table 56 and Table 57) reveals that intramolecular interactions involving the N-H
proton type HB as well as certain aromatic and TA methyl protons type H vary strongly
with conformation as expected based on Figure 514 Therefore the poorly determined
parameters for HB and H strongly affect the energy profiles of Figure 519
54 Discussion The Physical Origins of Torsional Potentials The torsional barriers for fenamates apart from gt 140 are smaller than for PA and
ethane For the fenamates the difference in energy penalty arises from the high degree of
conjugation between the two aromatic rings of the fenamates via ∙∙∙ overlap involving
the lone pair of electrons of the N atom (Figure 516)234 This conjugation effect is absent
for ethane and reduced for PA because these have just one aromatic ring It is clear that
compared to PA the barrier to rotation reduces as the model molecules tend toward two
aromatic rings These observations confirm that the delocalisation of electrons plays a
role in the origin of the torsional barrier for fenamate molecules FA and TA
The maximum at = 90 (Figure 515) is due to dispersion effects The investigation
of different methods for producing conformational profiles demonstrates the importance
of accounting for correlation effects For example the HF method is hopeless for
reproducing the correct conformation profiles around the minima for fenamate molecules
FA TA MA and ClFA (Figure 512) because the method excludes the correction effects
Therefore it is vital that methods of examining the conformational profiles include the
correlation effects This is most important in CSP where accurate ranking of generated
crystal structures depends upon accurately evaluating the energy penalty contribution to
the total lattice energy (equation 51)
Although the conformational profiles are dependent on specific atoms that define
flexible torsion (Figure 58) the comparison of the rigid and relaxed scans shows the
important role that the atomic positions of other atoms play (Figure 513 and Figure 514)
during relaxation For example during the relaxation of TA methyl rotation plays a role
in reducing the energy penalty and barrier to rotation (section 534) The enormous
difference between the relaxed and rigid conformational profiles (Figure 513) and their
conformers (Figure 514) suggests that the atomic positions of most atoms in a molecule
during relaxation are important Consequently we can conclude that the origin of the
torsional barrier involves most atoms in a molecule
By analysing the low-energy torsional barriers in fenamates (Figure 511) it has
become clear that larger organic molecules retain the contributions as identified for small-
55 Summary
134
model molecules such as ethane There is both an electronic and a steric component to
these torsional barriers in fenamates However as the model molecules become larger
the effects of small correlated changes in the other bond angles and the dispersion
contributions become very significant (Figure 515c and d) As the size of the molecule
increases in both the number of atoms and the electron density there is an increasing
contribution to the torsional profile from the intra-molecular equivalent of the
intermolecular dispersion
Separating the ldquothrough spacerdquo intramolecular dispersion from the other electron
correlation effectsmdashspecifically those that contribute to the (h2)(1-cos(2)) electronic
barrier from ldquoconjugationrdquo or delocalization between the two aromatic ringsmdashis unlikely
to be meaningful when using an ab initio method that is still approaching the quantitative
accuracy needed
55 Summary I could not use the definitive ab initio torsional potential for each fenamate as the
torsional potentials of organic molecules containing aromatic rings are very demanding
of the electronic structure method used However PBE0 method and 6-31+G(d) basis set
were sufficient to investigate the origin of the barrier to rotation for FA and TA
The analysis of the fenamatesrsquo torsional potential reveals that like the classical small-
molecule torsional potentials of ethane there is both an electronic effect (loosely
described as changes in MOs involving ∙∙∙ between the aromatic rings and the nitrogen
lone pair destabilizing the non-planar conformations) and a steric effect from the variation
in overlap of non-bonded atoms For larger molecules like the fenamate molecules the
intramolecular dispersion and small changes in the other conformational variables also
make significant contributions to the torsional profile
When the aromatic rings are perpendicular to each other the destructive interference of
MOs creates an intrinsic barrier The two rings in fenamate molecules stabilise the
expected high-energy barrier A cos2 term accurately represents the torsional barrier of
model molecules with minimal steric effects that have been constrained to prevent
pyramidalization Finally this chapter showed that the torsional barriers for FA and TA
depend on small correlated changes in degrees of freedom other than the most flexible
torsion We observed this by contrasting the conformations and their corresponding
energies of rigid scans against relaxed scans for FA and TA
The origin of the torsional barrier of fenamates is therefore a combination of intrinsic
intramolecular dispersion electronic contribution and the steric repulsion A new
55 Summary
135
analytical form for intramolecular energies (Chapter 6) of fenamates that is physically
justified must incorporate these origins and account for small correlated changes among
different conformations
61 Introduction
136
Chapter 6 Toward New Force fields for Fenamate Molecules
ldquoAvoid complexities Make everything as simple as possiblerdquo
mdash Henry Maudslay
61 Introduction
611 Background Force field methods (section 25) for calculating a systemrsquos energy ignore electronic
motions and instead calculate the systemrsquos energy as a function of the nuclear positions
alone63 Such force field methods are less computationally demanding than quantum
mechanical calculations but they cannot predict properties that depend upon a moleculersquos
electronic distribution In addition the limitations of electronic structure calculations as
discussed in Chapters 2 (section 27) and 4 (sections 438 and 439) suggest the need
for a new analytical model that can combine the accuracy of electronic methods and the
speed of force field methods This chapter proposes a solution to this problem
In general force field methods are based on two important components (i) the
functional form of the potential energy functions and (ii) the parameterisation of these
functions235236 In Chapter 5 I investigated the first component the origin of the torsional
barrier for fenamate molecules For small molecules that were constrained to have
minimal steric clashes the origin is mainly an electronic effect and can be expressed as a
cos2ξ term However for larger molecules like fenamic (FA) and tolfenamic acids (TA)
there are additional correlated changes namely the repulsion and dispersion effects
Chapter 5 by investigating these contributions with an exp-6 term dealt with the first
component required for building a force field
The present chapter deals with the second component of force fields re-
parameterisation In this chapter I will derive an analytical model for FA and TA (Figure
61) by fitting the conformational profiles (Figure 511) to analytical expressions
discussed in Chapter 5 One of the key conclusions of Chapter 5 was that definitive ab
initio conformational energy scans could not be obtained However the ab initio scans at
the PBE06-31+G(d) level of theory (Figure 511) are adequate for the purposes of
creating a new analytical model
61 Introduction
137
1
6
2
1
9
1
1
813
7
16
Figure 61 The fenamate family showing the low-barrier torsion angle (=C7-N1-C8-C9)
and atomic numbering =0 when the aromatic rings are coplanar as drawn The
fenamates mentioned in this chapter are fenamic acid (FA) R1= R2= H tolfenamic acid
(TA) R1= CH3 R2= Cl mefenamic acid (MA) R1= R2= CH3 flufenamic acid (FFA) R1=
H R2= CF3 and clorofenamic acid (ClFA) R1=H R2=Cl The dotted line represents an
intramolecular hydrogen bond
Figure 62 Relaxed conformational scans at the PBE06-31+G(d) level of theory for the
fenamates from section 533 Fenamic acid (FA) tolfenamic acid (TA) mefenamic acid
(MA) and chlorofenamic acid (ClFA)
612 A Case for Modelling Decoupled Intramolecular Energy For challenging applications involving molecular recognition of pharmaceuticals such
as computer-aided drug design the importance of an accurate balance of intermolecular
and intramolecular forces cannot be overemphasized93 The success of CSP studies17127
(Chapters 3 and 4) and the limitations of current force field (section 254) and electronic
structure methods (sections 27 and 439) suggest decoupling the models for the
intermolecular forces from those for the intramolecular forces (ie conformational
61 Introduction
138
changes) as a means of more accurately modelling force fields for pharmaceutical
molecules should be attempted
613 Analytical Models of Intramolecular Energies Traditional force field modelling includes an explicit torsional term237 of the general
form
where defines the phase shift and n the periodicity For FA as defined in Figure 61
requires that = 0 and the near-symmetry dictates that n is an even integer For
substituted fenamates odd values of n could contribute although the conformational
profile should be symmetric about = 0
Non-bonded atomndashatom interactions should be able to represent the intramolecular
energies well if the origin of the conformational profile is predominantly steric (caused
by the varying repulsion between the overlapping charge distributions of 1-4 atoms with
) An exp-6 atomndashatom model (Chapter 5) would be expected to give a better
representation than a Lennard-Jones (R-12) model of the variation of the repulsion with
distance given the success of the overlap model in parameterizing intermolecular
repulsion potentials238239 Thus a crude starting point for my investigation of the ldquonon-
bondedrdquo contribution to the torsion potential is the exp-6 atomndashatom model potential with
a parameterization that was developed for modelling the intermolecular forces between
organic molecules in crystal structures42231
where atoms i and k of atomic types and are separated by intramolecular distances Rik
calculated from the molecular conformation with torsion angle ξ This functional form
with no assumed relationship between the like (and ) and unlike () interactions
means that the parameters (A B and C) have at least partially absorbed the
electrostatic effects in fitting This chapter seeks to re-parameterize the equations of the
origin of torsional potential (equations 61 and 62) in order to derive analytical models
that accurately represent the conformational profiles of fenamic (FA) and tolfenamic
acids (TA)
614 Overview The goal of this chapter is to develop a generalizable method that uses a FORTRAN
code to derive analytical models for the conformational profiles of FA and TA This
( ) [1 cos( )]2
nVE n 61
6
( ) exp( )ik ik
i k
E A B R C R 62
62 Methodology Fitting Analytical Models to Conformational Profiles
139
chapter will investigate three analytical forms the cosine series rescaling repulsion and
combined physical models Each of these new analytical forms will have different
parameters for intramolecular and intermolecular contributions I will discuss the
methodology of fitting analytical models to conformational profiles and test the
transferability properties of the combined physical models for FA and TA to other
fenamate molecules (Figure 61)
This chapter will show that the cosine series and rescaled repulsion models are
inadequate for modelling the conformational energy profiles of fenamates More
importantly this chapter will show that combining a cos2 term to represent the
electronic barrier with an intramolecular atomndashatom exp-6 repulsion-dispersion term for
all atom pairs separated by three or more bonds (bond-paths ge 1-4) allows a very effective
representation of the ab initio conformational energies
62 Methodology Fitting Analytical Models to Conformational Profiles The only weighting applied to the conformational profiles of all the fenamate molecules
(Figure 511 at the PBE06-31+G(d) level of theory) in this chapter was the restriction of
conformational energies to 10 kJ mol-1 or below This weighting was appropriate because
this chapter does not seek to represent the steric barrier above 145deg for TA (and MA)
accurately Hence this chapter considers Np = 37 points for the FA and Np = 30 points for
TA (and MA) Because the definition of the ab initio energies Eab are relative to the
lowest energy conformation for each molecule the analytical modelrsquos energies Emodel
were adjusted by a constant Ebase such that the lowest energy conformation of both the
ab initio and analytical model were zero The algorithms (Figure 63 and Figure 64) in
this chapter fit a constant c that matched the overall conformational curves rather than
the minima As such c differs from Ebase by a fraction of a kJ mol-1 The standard error
σintra in Emodel was
where Np and Nk are the number of data points and fitted coefficients respectively
However there were only Nk -1 physical parameters as one (c ~ Ebase) served only to
adjust the baseline
621 Torsional Potential Model The explicit torsional term (equation 61) can be simplified as the following cosine
series
2
mod
int
ab el
ra
p k
E E
N N
63
62 Methodology Fitting Analytical Models to Conformational Profiles
140
where Nk and Np are the number of fitted coefficients and data points respectively The
intercept c is 0 Using the linear least squares method (section 26) the cosine series
(equation 64) were fitted to the conformational profiles of FA and TA (Figure 511) to
determine the unknown coefficients k Below is a flowchart of the cosine series
algorithm (Figure 63)
Figure 63 An algorithm showing the overview of modelling ab initio intramolecular
energy using a cosine series potential The source codes are included in the CD ROM
attached to this thesis (see Appendix A)
In the initialization step (step 1) the algorithm required the ab initio intramolecular
energies and the inputs of their equivalent torsion angles (Figure 511) These inputs
(generated from the ab initio scans reported in Chapter 5) were used to construct a
regression model (step 2) The G02DDFE97 NAG subroutine (section 262) solved the
resulting linear regression problem that is the unknown coefficients k were
determined Finally the standard error σintra of the modelled intramolecular energy
Emodel (equation 63) was calculated
0
( ) cos( 1 ) 5 1kN
k k p
k
E k N N
64
62 Methodology Fitting Analytical Models to Conformational Profiles
141
622 AtomndashAtom Model Due to the considerable correlation between the atomndashatom coefficients particularly
the two repulsion parameters (A and B) it is difficult to vary both repulsion parameters
simultaneously240241 This section discusses the derivation of analytical atomndashatom
models for conformational profiles of FA and TA as expressed in the algorithm shown
in Figure 64 In particular this section discusses the rescaling of selected repulsion (and
dispersion) coefficients which gives a linear model that contains (an appropriate cosine
term and) a baseline constant c
Figure 64 An algorithm showing the modelling of ab initio intramolecular energy by a
physical potential The source codes are included in the CD ROM attached to this thesis
(see Appendix A)
This algorithm (Figure 64) which uses NAG129 library routines shows the systematic
comparison of how well various selections of linear parameters ( and c) can
represent the conformational profiles of fenamates The algorithm first extracted the
geometries and the corresponding intramolecular energies of the fenamate molecules
which were generated from ab initio calculations These geometries were converted to an
atomic type-friendly mol2 format (Sybyl typing230) using the Babel242 chemical toolbox
The other inputs are the starting values of Gavezzottirsquos atomndashatom exp-6 potential
parameters41231232 (Table 52 of Chapter 5) The covalent 1-1 connectivity (from the mol2
file) helped to distinguish the polar hydrogen HB from the non-polar hydrogen H
atoms The remaining atomndashatom connectivity (ie nearest neighbour or bond-path) and
6
( ) cos(2 ) exp( )ik ik
i k
E A B R C R c 65
62 Methodology Fitting Analytical Models to Conformational Profiles
142
distances Rik within the molecule were determined using the H03ADF subroutine and
the 1-1 connectivity H03ADF subroutine evaluates the nearest neighbour by finding the
shortest path between two atoms
Next the atom-atom interactions were summed over all 1-4 atom-atom distances and
higher bond-paths in the entire molecule (equation 65) The maximum bond-path was 1-
11 for all three fenamates and most pharmaceutical molecules were sufficiently small
that there was no need to define a summation limit in terms of intramolecular distance or
bond-path length for a single molecule The use of 1-4 distances as the shortest
intramolecular interactions included in the atomndashatom summation was traditional
Although it should be noted that 1-3 interactions were used elsewhere eg in the CSP
code of GRACE where they have sometimes been found to be problematic including the
recent case of a bulky side group attached to an aromatic ring which required specific
scaling down13 The atomndashatom formulation resulted in many virtually constant terms
such as the H∙∙∙H C∙∙∙C and H∙∙∙C contributions from within the aromatic rings These
terms contributed to the baseline energy Ebase defined as the minimum energy found in
the scan with a specific parameterized model
The atomndashatom model involved far too many coefficients for all to be fitted
independently to the ab initio data In addition many atomndashatom distances did not change
significantly with the torsion angle as observed from investigating the atomndashatom
interaction that dominated the intermolecular contribution in Chapter 5 There were only
16 and 21 dominant interactions out of 351 and 435 total atomndashatom interactions for FA
and TA Therefore only interactions that were classed as dominant were rescaled The
algorithm in Figure 64 determined the dominant interaction by using a cut-off value of
one ie Ecutoff = 1 kJ mol-1 The dominant atomndashatom interactions for FA and TA were
reported in Chapter 5 (Table 66 and Table 57) which are summarised in Table 61 If
atomndashatom interaction of a given type (∙∙∙) varied less than the Ecutoff (for example Cl∙∙∙O
and O∙∙∙HB) then these parameters were not rescaled but may vary the contribution to
Ebase One notable observation was the significant interaction between atoms of the same
aromatic ring for TA (Table 61d) which was absent in FA
62 Methodology Fitting Analytical Models to Conformational Profiles
143
Table 61 Contrasting the atomndashatom interactions of FA and TA that dominated the
intramolecular energies formed by combining Table 56 and Table 57 from Chapter 5
Interactions unique to FA and TA are coloured blue and red respectively dInteractions
between atoms of the same aromatic ring fInteractions involving the methyl substituent
FA TA FA TA ati∙∙∙atk neigh RikkJ mol-1 RikkJ mol-1 Erepul-dispkJ mol-1 Erepul-dispkJ mol-1
min max(∆) min max(∆) min max(∆) min max(∆) C∙∙∙C
C7∙∙∙C9 4 307 371(064) 302 361(059) -035 245(280) -028 313(340)
C7∙∙∙C13 4 307 371(064) 314 372(058) -035 244(279) -035 165(201)
C6∙∙∙C9 5 310 443(133) 308 412(104) -039 205(243) -039 231(269)
C6∙∙∙C8 4 289 310(021) 211 581(370)
C6∙∙∙C13 5 311 444(133) 324 444(119) -039 200(238) -039 085(123) fC6∙∙∙C14 6 310 510(200) -039 210(248) fC7∙∙∙C14 5 312 414(102) -039 191(230)
C∙∙∙H fC7∙∙∙H12 6 255 385(130) -020 173(194)
C6∙∙∙H7 6 252 488(236) 248 445(197) -021 212(233) -020 256(276)
C6∙∙∙H8 4 289 310(020) 212 573(362) C6∙∙∙H11 6 252 488(237) -020 211(231) C8∙∙∙H5 5 254 288(034) 254 289(035) 007 182(176) 005 187(182)
C9∙∙∙H5 6 257 416(159) 260 369(109) -020 154(174) -021 132(153)
C13∙∙∙H5 6 257 417(159) -020 152(172) H∙∙∙H
H5∙∙∙H7 7 208 476(268) 214 418(204) -004 443(447) -004 337(342)
H5∙∙∙H11 7 209 476(267) -004 418(422) C∙∙∙HB
C13∙∙∙HB6 4 251 330(078) 254 322(068) -021 216(236) -020 187(207)
C9∙∙∙HB6 4 251 330(079) -021 218(238) C14∙∙∙HB6 5 241 371(130) -021 377(397)
HB∙∙∙H
HB6∙∙∙H11 5 230 368(138) -004 166(170) HB6∙∙∙H7 5 230 369(139) -004 164(169)
fHB6∙∙∙H11 6 219 450(231) -004 266(271) fHB6∙∙∙H12 6 228 315(087) -003 177(180)
N∙∙∙C fN1∙∙∙C14 4 278 298(021) 093 474(382)
N∙∙∙H fN1∙∙∙H12 5 243 262(019) 008 142(134)
C∙∙∙Cl fC14∙∙∙Cl1 4 304 311(007) 261 387(126)
Cl∙∙∙H dfCl1∙∙∙H10 5 257 324(068) -049 404(453) dfCl1∙∙∙H11 5 269 374(105) -050 181(231)
63 Results
144
These atomndashatom interactions were grouped into unique atom-type∙∙∙atom-type sets
(∙∙∙) The algorithm then systematically fit different subsets of the ∙∙∙rescaling
parameters using combination mathematics243 Eg for interactions C∙∙∙H C∙∙∙HB and
H∙∙∙HB the following seven subsets of interactions were rescaled
1 C∙∙∙H or C∙∙∙HB or H∙∙∙HB
2 C∙∙∙H and C∙∙∙HB or C∙∙∙H and H∙∙∙HB or C∙∙∙HB and H∙∙∙HB
3 C∙∙∙H C∙∙∙HB and H∙∙∙HB
For each fit the subroutine G02DDFE97 (section 262) calculated the Nk coefficients
( c) being fitted and minimized the residual sum of squares (RSS) using a
general linear regression model244 Within the routine a matrix decomposition process
established whether a solution was unique or whether the parameters were linearly
dependent and therefore had no unique solution Unless otherwise noted all fits reported
in this chapter had a unique solution Finally the standard error intra in the modelrsquos
intramolecular energy was calculated after adjusting the minimum to 0 kJ mol-1 (equation
63)
This chapter used the method discussed above to investigate two analytical models
(1) Rescaling only the repulsion contribution of the atomndashatom exp-6 potential ie
equation 65 with and set at 0 and 1 respectively
(2) Rescaling all the parameters ie equation 65
63 Results
631 Cosine Series Model The traditional cosine series expansion for a torsional potential (equation 64) must
include cos4 to have the correct number of minima for the fenamates Alone this term
gave a poor position of the minima for FA and it was qualitatively wrong for TA (Figure
65) A least squares fit that included the lower cosine terms (Nk=5 equation 64) gave a
qualitatively reasonable representation (Figure 65) but further improvement is slowly
converging (Figure 66) For FA the fitting steadily improved in quality particularly
upon the addition of cos4n terms where n are integers For TA the fitting became
unstable after 21 terms even though there was no attempt to represent the large steric clash
beyond 10 kJ mol-1
This result demonstrated that the cosine series was a fitting exercise and did not reflect
the physics It was effectively an exercise in modelling the relaxed scans by a functional
6
( ) exp( )ik ik
i k
E A B R C R c 66
63 Results
145
form that assumed the scan was rigid (ie only the torsion angle changed) This
assumption is a crude approximation since rigid scans are different from relaxed scans
(see Figure 513) Poor convergence of the cosine model expansion were also reported
for biphenyl245 a dye which required 7 terms while polynorbornene246 required 6 and 15
terms for the meso and racemic dimer respectively
Figure 65 Comparison of the ab initio relaxed scan at the PBE06-31+G(d) level of
theory with linearly fitted least square cosine series model for FA (top) and TA (bottom)
with Nk=5 (red lines) the optimal cos4 terms (blue lines) and Nk=21 (green lines σintra
=017 kJ mol-1 for FA and TA)
63 Results
146
Figure 66 Plot of the standard error of the intramolecular energies against the number of
cosine terms Nk for FA (top) and TA (bottom) The fit is ill-determined ie there is no
unique solution for TA after Nk=21
632 Rescaled Repulsion Model From Chapter 5 it is clear that the repulsion contributions were severely overestimated
for FA and TA with Gavezzottirsquos exp-6 potential Therefore an alternative model is to
rescale just the repulsion terms (ie fit selected in equation 66) as the intermolecular
atomndashatom model clearly overestimated the intramolecular steric effects (Figure 519)
Rescaling just a few of Gavezzottirsquos repulsion parameters for example those involving
the poorly parameterized H∙∙∙H interactions resulted in a qualitatively good fit (Figure
67) as shown by the results for fitting all combinations of repulsion parameters for FA
(Table 62) and the summary in Table 63 of the 511 such fits for TA Rescaling just two
(C∙∙∙H and H∙∙∙H) repulsion contributions for FA and five (C∙∙∙H C∙∙∙HB C∙∙∙N H∙∙∙H and
H∙∙∙HB) for TA produced a model that reproduced the torsional profile well (Figure 67)
63 Results
147
Figure 67 Comparison of the relative energies from ab initio calculations (solid black
lines) of FA (top) and TA (bottom) with selected best-fit exp-6 rescaled repulsion models
For FA the selected Nk=3 intra=032 kJ mol-1 model had βC-H=-453 βH-H=270 and
Ebase=-506 while the Nk =4 intra=027 kJ mol-1 model had βCH=-446 βH-H=210 βH-
HB=257 and Ebase=-875 For TA the selected Nk=6 (intra=034 kJ mol-1) and 10
(intra=022 kJ mol-1) parameter fits are shown bold in Table 63
The rescaling of the C∙∙∙N interaction seemed particularly critical for TA (Table 63)
which can be attributed to the importance of the C(methyl)∙∙∙N interaction in describing
the steric clash involving the methyl group (Figure 514) However many of the fitted
rescaling parameters were negative (which suggested that the exponential steric
repulsion had become attractive Thus again this appeared to be a fitting exercise so that
exponential terms were reducing the over-estimate of the barrier at 90 by the
intermolecular dispersion parameters (Figure 519)
63 Results
148
Table 62 Complete set of results after rescaling Nk (repulsion contributions and
baseline energy Ebase) parameters of various interacting atomic types for FA
ικ Ebase σintra kJ mol-1
Nk C -C C -H C -HB H -H H -HB 2 - -226 - - - 437 168 2 - - -148 - - 1076 284 2 - - - -088 - 2215 287 2 - - - - -423 3579 299 2 -332 - - - - -39948 451 3 - -453 - 269 - -506 032 3 - -428 - - 539 -1511 032 3 -210 -217 - - - -31011 036 3 - -523 365 - - 278 04 3 -523 - -173 - - -62622 045 3 -621 - - -124 - -71356 065 3 -666 - - - -549 -74317 066 3 - - -991 - 2082 -7537 127 3 - - -909 722 - -2278 174 3 - - - -738 1972 -2577 247 4 - -446 - 210 257 -875 027 4 - -467 144 243 - -388 03 4 079 -438 - 258 - -2557 032 4 041 -390 - - 459 -7101 032 4 - -432 109 - 525 -1456 033 4 -173 -254 133 - - -27252 037 4 -458 - -296 - 394 -57220 04 4 -507 - -218 137 - -61133 045 4 -639 - - -035 -157 -72571 064 4 - - -958 006 2275 -7893 125 5 130 -467 - 218 278 2069 028 5 - -448 104 210 251 -849 028 5 236 -591 218 270 - 13231 029 5 -016 -327 037 - 481 -12963 031 5 -456 - -284 061 479 -57209 039 6 208 -550 170 237 225 10068 028
Table 63 Summary table of the best results after rescaling Nk (repulsion contributions
and baseline energy Ebase) parameters of various interacting atomic types for TA
βικ Ebase σintra kJ mol-1 Nk C-C C-Cl C-H C-HB Cl-H C-N H-H H-HB H-N
2 - 909 - - - - - - - 11281 130 3 -008 - - - - -299 - - - -13547 093 4 - - - - 751 -269 - - 1454 11747 087 5 - - -279 622 - -464 - -549 - -5429 051 6 - - -306 472 - -447 426 -529 - -5279 034 7 - - -392 472 - -487 532 -611 -054 -7690 025 8 - 503 -359 387 265 -340 581 -570 - 300 022 9 - 531 -343 355 318 -327 596 -539 190 1748 021
10 084 541 -319 330 347 -331 611 -527 219 681 022
63 Results
149
633 Combined Physical Model Assuming a model that both describes the electronic effects and allows rescaling of the
atomndashatom interactions
Then there is a huge number of ways for finding a satisfactory fitting of the data The
rescaling of the three contributions in equation 67 is physically justified since
(1) The α term represents the electronic barrier that arises from the conjugation of
benzoic acid rings (section 535)
(2) The rescale term is necessary due to the overestimation of the repulsion
contribution (section 536)
(3) The rescale term accounts for electron correlation ie dispersion Section 275
emphasised the importance of the dispersion term while section 533 showed the
consequence of ignoring the electron correlation eg HF method
Cases where and gt 0 retained the repulsive and attractive (dispersion) nature ie
repulsion did not become attraction and vice versa It was also required that was less
than zero ( lt 0) to give a maximum around =90deg corresponding to conjugation (Figure
515) Table 64 contains all the fits to FA which have the physically correct sign for all
parameters and the full set of results for fitting up to 12 parameters (including the baseline
estimate Ebase as given in Table 65) This shows that fitting and only rescaling a few
atomndashatom interactions gives a qualitatively accurate fit (Figure 69) It is notable that the
parameters involving H and HB usually needed the greatest rescaling a finding that is
consistent with the fact that HB parameters were not fitted in the intermolecular potential
model In addition the intermolecular parameterization of H∙∙∙H is a notable exception in
that its minimum is very shallow (Figure 68) and is not sharply defined being repulsive
for a wide range of intermolecular H∙∙∙H distances42 Furthermore there is a huge
difference between other polar H (HB) interactions and H∙∙∙H interactions therefore it is
not surprising that the interactions that involve HB atoms required the greatest rescaling
Table 64 All fits obtained for FA with the physically correct sign for the repulsion
and dispersion and electronic parameters βικ γικ α Ebase σintra
kJ mol-1 Nk C-C C-H C-HB H-H H-HB C-C C-H C-HB H-H H-HB
6 - - 801 1074 - - - 1654 5800 - -339 -12383 026
6 - 028 - - 1109 - 783 - - 3479 -117 -7549 028
4 - - - 1108 - - - - 5003 - -391 -5926 033
4 - 619 - - - - 2082 - - - -157 -18049 036
4 - - - - 3467 - - - - 13698 -530 -1246 057
4 - - 3630 - - - - 11038 - - -945 -33466 076
6
( ) cos(2 ) exp( )ik ik
i k
E A B R C R 67
63 Results
150
Figure 68 Gavezzotti exp-6 potential for all atomndashatom interactions in fenamates
displayed in two different energy scales The parameters are from Chapter 5 (Table 52)
Although virtually perfect fits can be obtained (Table 65) the variation in the fitted
parameters is significant given the exponential sensitivity of the repulsion to changes in
atomndashatom distances These could be substantial for example the lack of symmetry for
the FA torsional scan where the two minima were found at =3894deg and 14471deg though
only differing in energy by 188 x 10-3 kJ mol-1 (716 x 10-7 au) corresponded to a change
of 061 Aring in the 1-4 interaction between the amide proton and C13 or C9 Even the C8-C9
and C8-C13 aromatic bond lengths differed by 00037 Aring for =0 or 180deg but only by
00004 Aring for =80deg or 100deg with larger changes in the bonded hydrogen positions for
FA Hence the systematic consideration of all combinations of sets of parameters that
could be meaningfully fitted and the resulting coefficients only provided a qualitative
guide to which of the atomndashatom interactions dominated the intramolecular energy
(Chapter 5 Table 66) and were most critical
63 Results
151
Table 65 The rescale parameters for the repulsion ικ dispersion ικ and electronic contributions of
the physical exp-6 and cos2 model for all possible combinations of atom type interactions C∙∙∙C C∙∙∙H
C∙∙∙HB H∙∙∙H and H∙∙∙HB for FA Nk are the number of fitted rescale parameters ικ and ικ and the baseline
energy Ebase ικ ικ α Ebase σintra
kJ mol-1 Nk C-C C-H C-HB H-H H-HB C-C C-H C-HB H-H H-HB
4 - - - 1108 - - - - 5003 - -391 -5926 033
4 - 619 - - - - 2082 - - - -157 -18049 036 4 -797 - - - - -1508 - - - - -272 -10530 045
4 - - - - 3467 - - - - 13698 -530 -1246 057
4 - - 3630 - - - - 11038 - - -945 -33466 076
6 -366 461 - - - -1053 1477 - - - -080 -3768 010 6 -436 - - 610 - -764 - - 2966 - -114 -15833 012
6 -852 - -188 - - -1227 - -229 - - 055 -30621 017
6 -600 - - - 1135 -862 - - - 5415 -143 -23513 018 6 - -103 1476 - - - 574 4073 - - -220 -17385 023
6 - - - 1208 -182 - - - 6537 -2918 -208 -9576 024
6 - -255 - 619 - - 013 - 2048 - -216 -1513 025 6 - - 801 1074 - - - 1654 5800 - -339 -12383 026
6 - 028 - - 1109 - 783 - - 3479 -117 -7549 028
6 - - -1326 - 6519 - - -6960 - 32879 -539 24422 036
8 -275 351 - - 271 -935 1344 - - 412 -075 534 008
8 -236 414 - -157 - -1078 1876 - -1719 - -076 9374 009
8 -373 - - 626 334 -681 - - 3475 222 -066 -15208 009
8 -493 551 -189 - - -1218 1530 -642 - - -047 -6499 010 8 -530 - -737 725 - -1054 - -2417 3267 - -044 -3345 010
8 -698 - -1655 - 3047 -1263 - -6095 - 14774 012 5842 013
8 - -419 520 1195 - - -846 691 6039 - -246 -995 019 8 - - 1843 1185 -1677 - - 5881 7251 -11125 -196 -30353 019
8 - -089 2697 - -3196 - 952 9622 - -18054 -082 -40433 021
8 - -445 - 1541 -1016 - -970 - 7719 -6385 -166 -770 021
10 -445 686 -555 -541 - -1577 2664 -1489 -4179 - 017 13752 005 10 -524 469 -740 - 953 -1247 1257 -2481 - 3880 -022 -075 007
10 -320 465 - -026 593 -977 1532 - -349 1763 -064 -3403 008
10 -598 - -1429 455 1804 -1188 - -5112 1825 8695 -025 6986 009 10 - 166 2717 671 -2944 - 788 9384 4350 -17854 -113 -44769 014
12 -383 709 -155 -570 -447 -1498 2835 -035 -4260 -2903 018 9708 006
152
Table 66 The rescale parameters for the repulsion ικ dispersion ικ and electronic contributions of the physical exp-6 and cos2 model for all possible combinations of atom
type interactions C∙∙∙C C∙∙∙Cl C∙∙∙H C∙∙∙HB Cl∙∙∙H C∙∙∙N H∙∙∙H and H∙∙∙HB for TA Nk are the number of fitted rescale parameters and Ebase is the baseline energy ghThe parameters
used in Figure 69b and ifor testing transferability in Figure 610b and Figure 611 ικ ικ α Ebase σintra
kJ mol-1 Nk C-C C-Cl C-H C-HB Cl-H C-N H-H H-HB H-N C-C C-Cl C-H C-HB Cl-H C-N H-H H-HB H-N
4 - 1019 - - - - - - - - 593 - - - - - - - -135 8690 108
4 - - - - - 930 - - - - - - - - 2901 - - - -530 -24891 111
4 - - - - - - - - 1839 - - - - - - - - 5101 -293 -14115 149 4 - - - - - - - 861 - - - - - - - - 3884 - -254 2058 165
4 - - - 303 - - - - - - - - 1102 - - - - - -167 -1133 168
4 181 - - - - - - - - 095 - - - - - - - - -761 13228 193
6 - - - - - 2237 173 - - - - - - - 6517 1810 - - -135 -63604 049 6 - 484 - - - 1974 - - - - 4173 - - - 7186 - - - -848 -99438 067
6 - - 1560 - - - 1856 - - - - 817 - - - 11967 - - -1311 -8678 077
6 - - - - 967 2171 - - - - - - - 4431 6977 - - - -167 -89172 078 6 659 - - - - 4409 - - - 955 - - - - 12397 - - - -1602 -99338 102
6 - - - - - - 604 - 2288 - - - - - - 2012 - 7506 -674 -27619 120 g8 - 1933 - 567 - 2165 - - - - 7289 - 2207 - 6976 - - - -102 -114180 015
8 - - - - 1957 3068 - 498 - - - - - 8130 9634 - 2647 - -096 -133767 016 8 - 1618 - - - 2874 - 676 - - 6263 - - - 8952 - 3754 - -361 -119616 023
8 - 038 - - - 2451 133 - - - 1139 - - - 7574 1528 - - -320 -83684 028
8 - - 1015 801 - - 505 - - - - 083 437 - - 11123 - - -962 -4165 037 8 - - - - 634 2650 027 - - - - - - 2075 7927 1106 - - -313 -86212 041
8 - - - - - 2211 127 367 - - - - - - 6326 1898 1248 - -009 -62350 047
8 - - 156 - - 2356 105 - - - - 189 - - 6873 1561 - - -178 -67559 051 8 - - 1422 - - - 1194 1225 - - - 1118 - - - 8625 5331 - -621 -14314 063
8 - - 768 - - - 1497 - 1353 - - 221 - - - 8154 - 2730 -436 -9301 071 h10 - 1049 - - 2600 2731 - 679 - - 366 - - 9102 8140 - 3889 - -426 -112247 008
10 - - 135 - 853 2173 - 426 - - - 404 - 2724 6867 - 2476 - -193 -83710 009 10 - 853 - - - 2386 227 583 - - 3742 - - - 7431 1238 2941 - -222 -94694 010
10 - - - - 1465 2785 089 542 - - - - - 5788 8569 720 2568 - -107 -112106 011
10 - 1143 194 457 - 2086 - - - - 4833 341 1829 - 6762 - - - -096 -102646 016 10 050 - - - 1763 2692 - 496 - 085 - - - 7084 8615 - 2744 - -032 -123424 018 i10 - - 180 - - 2079 - 604 089 - - 627 - - 6176 - 3544 883 -051 -71971 026
10 - - 413 506 - 1334 018 - - - - 473 1146 - 4010 2532 - - -067 -48308 031 10 314 - 945 1122 - - 535 - - 531 - 110 1833 - - 10029 - - -966 -9528 032
10 - 1160 743 925 - - 365 - - - 2757 057 1532 - - 8017 - - -487 -17128 036
12 - - - 093 1321 2831 314 - 1519 - - - 569 4186 8238 941 - 3812 -414 -110966 007
12 - 709 - 253 1721 2653 - - 903 - 1198 - 1091 5530 7956 - - 1792 -350 -111102 008 12 - - 237 137 1032 2350 - - 700 - - 432 702 2719 7255 - - 1037 -351 -88568 008
12 - - 425 - 843 2274 065 656 - - - 588 - 2415 6938 1356 3101 - -440 -84012 008
12 - - 046 - - 2081 536 274 1391 - - 344 - - 5722 1360 2319 5007 -245 -78093 027
14 - - 384 214 886 2010 190 - 805 - - 456 690 2056 6136 1635 - 1462 -532 -76472 008 14 - - 249 012 954 2442 - 316 410 - - 457 214 2439 7563 - 1279 209 -360 -86183 009
63 Results
153
Figure 69 Comparison of the relative energies from ab initio calculations (solid black
lines) of FA (top) and TA (bottom) with selected physical models For FA the selected
Nk=6 intra=026 kJ mol-1 model has βC-HB =801 γC-HB =1654 βH-H =1074 γH-H =58 α=-
339 and Ebase=-12383 whilst the Nk =6 intra=028 kJ mol-1 model has β C-H =028 γ C-
H =783 β H-HB = 1109 γ H-HB =3479 α=-117 and Ebase=-7549 For TA parameters for
the selected Nk=8 (intra=015 kJ mol-1) and 10 (intra=008 kJ mol-1) are in ghTable 66
In contrast to FA TA (Table 66) gave a qualitatively accurate fit only when at least
three types of atomndashatom parameters were rescaled (Nk=8) including C∙∙∙N as shown in
Figure 69 The relaxed scans were sensitive to a large number of atomndashatom distances
so that the 5 change in did not necessarily give a smooth curve between the analytical
values This was because of the differences in the molecular relaxation and resulting
atomndashatom distances not the step size because Figure 510 of Chapter 5 showed that
smaller step size for FA produced a smooth but asymmetric ab initio energy-curve All
the fits with the physically correct parameters were unique solutions (section 262)
63 Results
154
Depending on which atomic types were being fitted there were some variations in the
parameters for a given atomndashatom interaction I noticed that for TA (Table 66) the C∙∙∙N
parameters consistently needed to be drastically rescaled reflecting the importance of the
methyl carbon (R1=CH3 Figure 61) in the conformational profile of TA Indeed TA
differed from FA in having many more intramolecular atomndashatom distances that changed
significantly within the range = 0 to 145 including some within the same aromatic ring
such as the methylndashchloro interactions (Table 61 or compare Table 56 with Table 57 in
Chapter 5) Day6 also observed that pyramidalizations of atoms (eg the nitrogen atom in
an amine group) significantly affect the intramolecular parameters
By following the procedure described in the methodology (section 622) I obtained a
variety of analytical models of the form of equation 67 that could reproduce the torsional
profiles of FA and TA with a high degree of accuracy despite the significant variation in
many atomndashatom distances during the relaxed torsional scans However the analytical
model had a maximum number of parameters for FA and TA (12 and 22 respectively)
with 5 (plus 1) atomic types C H N O HB (plus Cl) when considering atomic-
type∙∙∙atomic-type interaction that contributed significantly to energy changes with
conformation Fitting too many parameters led to models where some of the fitted
parameters had the wrong sign for their physical interpretation and some of these fits for
TA showed a linear dependence between the parameters (ie the fitted parameters were
not unique section 262) Nonetheless the ease with which this physically justified model
(equation 67) could reproduce the conformational dependence of FA and TA shows that
this approach to modelling the intramolecular energies of fenamates is promising
634 Transferability A further investigation of the physical reasonableness of the atomndashatom plus electronic
functional form (equation 67) is to test whether the models transfer to related molecules
The difference between the energy scans when the substituents are far from the varying
torsion angle for example the change of H to Cl atom ie from FA to ClFA or between
TA and MA (Figure 511) should not change the main steric interactions and should only
have a small effect on the electronic term (Figure 515e and f)
Transferring a set of parameters fitted to FA and adding Gavezzottirsquos Cl parameters
did indeed (Figure 610) give some of the asymmetry in the well depths seen for ClFA
and the higher central barrier as compared to FA (Figure 511) when the electronic term
was fitted Similarly a set of parameters fitted to TA could reproduce the lower barrier
at = 90 and higher barrier at = 0 in MA (Figure 610b) despite the fact that the
63 Results
155
conformational relaxation of the methylndashmethyl interaction was somewhat different from
that of the methyl-chloro geometry (Figure 513)
Figure 610 Comparison of the relative energies from ab initio calculations (solid black
lines) with models using transferred βικ and γικ parameters from FA and TA (dotted grey
plots) to ClFA (top) and MA (bottom) respectively The red curve has only had the
baseline adjusted whereas the blue curve had the parameter refitted to ClFA or MA
respectively The transferred FA parameters are those Nk=6 fit=028 kJ mol-1 in Figure
69 while those of TA Nk= 10 fit= =026 kJ mol-1 are shown in iTable 66
A more stringent test would be to apply the same TA parameters to FA and ClFA
which gave qualitatively correct results around the minima (Figure 611) and the steric
barriers at 0 and 180 However the barrier height around 90 would remain similar to
that in TA and this underestimation would be only partially corrected by refitting the
cos(2) term Given the limitations in the parameter optimization the qualitative
63 Results
156
accuracy is promising In particular the poorer transferability may be attributable to the
fact that the fitting of parameters for C and H interactions in TA was modelling both the
aromatic and methyl atoms and the methyl∙∙∙N interaction was critical in fitting the
parameters to the TA profile
Figure 611 Comparison of the relative energies from ab initio calculations (solid black
lines) with models using βικ and γικ parameters transferred from TA (dotted grey plots) to
(a) FA and (b) ClFA The red curve has only had the baseline adjusted whereas the blue
curve has the parameter refitted to FA or ClFA respectively The transferred TA
parameters are those of Nk= 10 fit= 026 kJ mol-1 as shown in iTable 66
64 Summary
157
64 Summary Neither the cosine terms nor the analytical models that rescaled overestimated repulsion
contributions were adequate for modelling the conformational profile of fenamates
However a physically justified modelmdashone that combined a cos2 term with an
intramolecular exp-6 atomndashatom term for all atom pairs separated by three or more bonds
(1-4 and above)mdashallowed for a very effective representation of the ab initio
conformational energies In this chapter I successfully fitted conformational profiles of
FA and TA to the cos2 plus exp-6 model This success suggests that the separation of
intramolecular and intermolecular forces is a promising new method for discovering force
fields that are more accurate which could in turn pave the way for modelling the
condensed phases of pharmaceutical-like organic molecules Considering a wide range of
molecules and bigger dataset could improve the transferability of this physical model
71 Position of CSP in the Context of this Thesis
158
Chapter 7 Conclusions and Future Work
ldquoIt is good to have an end to journey toward but it is the journey that matters in the
endrdquo
mdash Ernest Hemingway
71 Position of CSP in the Context of this Thesis The CSP results of Chapters 3 and 4 successfully validated the ability of
CrystalPredictor to generate crystal structures of flexible molecules In Chapter 3 I
successfully predicted the crystal structure of BT which has an unusual and unexpected
packing The success required the use of distributed multipoles and ab initio calculations
of intramolecular energy This success inspires hope that the use of multipolar
electrostatic models (as being implemented in the second-generation force fields such as
AMOEBA91) with careful evaluation of the accuracy of the intramolecular forces will
provide a route to greater reliability for computer-aided drug design with uncommon
ligands However the failure of a conventional point charge electrostatic model used in
the intermediate step has considerable implications for other studies that rely on
modelling the intermolecular interactions of 1-substituted 1H-tetrazoles
Chapter 4 successfully investigated the concept of polymorphophore via CSP studies
of FA and TA in an attempt to understand why polymorphism occurs I discovered that
the fenamate fragment did qualify as a polymorphophore in that the dimeric unit could
pack in a variety of ways with different torsion angles of the phenyl groups due to the
torsional flexibility of FA and TA Once the aromatic rings had interdigitated with their
nearest neighbours there was a large barrier to rearrangement to a very different packing
and the polymorphs were long-lived with the torsion angles varying slightly to optimize
the packing for a given structure as we saw for TA It was however the comparison
between the FA and TA crystal energy landscapes that showed that it was the substituents
that played the major role in determining the possible packing and relative energies and
hence the polymorphic behaviours of FA and TA These observations clearly
demonstrate the links among conformational flexibility polymorphism and
polymorphophore
The considerable similarity in large clusters of the known and hypothetical structures
of TA and the closeness of their energies suggested that crystal growth errors were very
likely More importantly though this finding guided my colleague in the discovery of a
new polymorph of TA (form VI) which was nucleated by solution evaporation after
72 Towards more accurate force-fields for pharmaceutical molecules
159
dissolving TA (form I) in ethanol and seeding it with mefenamic acid (form I) The major
component of this new form (form VI is disordered 65 and 35) was not among the
crystal structures on the final energy landscape despite generating the corresponding
hypothetical structure during an intermediate step (CrystalPredictor) Although this
observation emphasised the success of the CrystalPredictor algorithm it also showed the
need for larger numbers of crystal structures to go through CrystalOptimizer This need
for a larger dataset in the subsequent CrystalOptimizer step raises the question ldquoIs there
a clear cut-off in energy for flexible moleculesrdquo This question is even more relevant
when you consider that desolvated solvates can have much higher energy than organic
crystal structures247 In fact it might even be desirable to go even higher in energy due to
likely high conformation energy of the desolvated solvates The CrystalOptimizer
algorithm does allow the build-up of a database known as Local Approximate Models
(LAMs) but it would be preferable to be able to check many more structures If we could
better fit intramolecular energy which requires the bulk of the computing time to a force
field we would be able to compute the energies of many more structures of a target
molecule In addition computing the energies of the higher-energy structures would be
much cheaper
Chapters 3 and 4 used methods suitable for studying flexible molecules17 as the ab
initio charge density for the specific conformation was used in modelling the
intermolecular interactions thus representing the interplay between molecular
conformation and intermolecular interactions which have been shown to be important for
TA211 Conformational changes can optimise the directionality of strong interactions
such as H-bonding and increase the packing density and hence the stabilization of the
structure by dispersion forces Although CSP methodologies have advanced to aid solid
form screening in pharmaceutical development247-250 it is nevertheless desirable to
calculate the relative free energies of organic polymorphs via molecular dynamics
methods251-253 Although there has been a great push to include the kinetics and their
ability to control the polymorphs formed1 a vital first step is to develop a sound
understanding of thermodynamics
72 Towards more accurate force-fields for pharmaceutical molecules The challenge of extending the reliability and accuracy of quantum mechanical
methods to larger molecules which are more typical of pharmaceuticals and realistic
biological molecules in isolation or condensed phases is the subject of active research
This research ranges from empirical corrections to DFT methods to the use of better
73 Future Work
160
functionals254 as well as implementing explicitly correlated wavefunction methods more
effectively
Chapter 5 emphasized the challenges with using a sufficiently realistic method for the
ab initio determination of conformational energies for larger molecules For example the
HF method provides a qualitatively wrong and misleading conformational profile of FA
and TA due to the absence of the dispersion (correlation effect) contribution Dispersion
also plays an important role in the barrier to rotation for the fenamates especially when
the aromatic rings are perpendicular to one another The analysis of the fenamatesrsquo
torsional potential revealed that the origin of the torsional barrier of the fenamates is a
combination of intrinsic intramolecular dispersion electronic contribution and the steric
repulsion In addition small changes to other conformational angles made significant
contributions to the torsional profile of the fenamate molecules
In Chapter 6 a physically motivated analytical modelndashndashcos2 term combined with an
intramolecular exp-6 atomndashatom term for all atom pairs separated by three or more
bondsndashndashwas derived using knowledge gained from Chapter 5 This model accurately fits
the intramolecular energy profiles of FA and TA This approach of modelling the
conformational energies of the fenamates could be extended to pharmaceutical-like
flexible organics
73 Future Work One can envisage a general scheme for determining the physically motivated potentials
(Chapter 6) for a given molecule following a CSP study by an approach that is being
developed127 and applied to pharmaceutical molecules247-249255 The refinement of the
molecular conformations simultaneously with the crystallographic cell using
CrystalOptimizer72 involves the calculation and storage of a large database (LAMs) of ab
initio conformational energies and forces for the molecule For example the CSP studies
for FA and TA contain the results of hundreds of molecular wavefunction calculations
with varying torsion and bond angles
The database generated in a CSP study will cover most of the range of conformations
that are likely to be sampled in a Molecular Dynamics study of the molecules in
condensed phases with a strong bias towards the conformations that occur in low-energy
crystal structures both observed and potential polymorphs1 The LAMs database could
be used to improve the parameterization of the analytical conformational energy model
adapting the potential fitting routines (Appendix A) used in Chapter 6 An advantage of
using an analytical functional form rather than the LAMs to interpolate between the ab
73 Future Work
161
initio points in the CSP study is that the extrapolation to other conformations will be more
realistic The great benefit of this scheme of building up from a CSP study for a specific
molecule is that the model intramolecular force field could be validated by ensuring that
the model reproduces the crystal energy landscape ie the energies of different packing
H-bonding and stacking modes are correctly balanced with the accompanying
conformational changes
The application of separate analytical potentials for both intra- and intermolecular terms
will require adaptation of molecular modelling codes However the coding for the
energies forces and second derivatives of the proposed intramolecular force field
(equation 67) is already present in most codes After inserting the new parameters the
major adaptation that will be required for an existing codendashndashone that uses traditional force
fields such as DL_POLY251256 for Molecular Dynamics simulationsndashndashis separating out
the calculation of inter- and intramolecular terms Accurate intramolecular forces are
most needed in combination with the accurate anisotropic atom-atom intermolecular
potentials for organic molecules where the electrostatic term is represented by atomic
multipoles for example the static organic crystal structure modelling code
DMACRYS34 or the rigid molecule molecular dynamics code DL_MULTI257
Furthermore the adaptation of molecular modelling code would require an adequate
representation for the conformation dependence of the distributed multipoles for specific
molecules but the dependency could be represented by an analytical model258
Although this change in approach to pharmaceutical force fields involves envisaging a
specific model fitted for each molecule the physical basis of the current model and the
results from Chapter 6 suggest that a reasonably transferable set of atom-atom
intramolecular exp-6 potentials could be fitted for families of molecules Deriving a
transferable model would require a very large dataset of ab initio conformational profiles
of many molecules calculated at an appropriate accuracy The transferability of the
electronic term ( coefficients) would need investigating However the use of separate
atom-atom models for the forces within and between molecules appears to provide a
significant improvement in the realism of current force fields In conclusion this
approach could potentially provide an affordable route for Molecular Dynamics
simulations of flexible pharmaceuticals that have the accuracy of CSP
Appendix A
162
Appendix A Contents of enclosed CD-ROM
The CD-ROM attached to this thesis contains FORTRAN source codes of the analytical
models presented in Chapter 6 as well as some of the input files The input data for FA
TA MFA and ClFA that were used in conjunction with the source codes are in directory
A1 The inputs files included for each molecule are as follows
a) The summaryr contains a summary of the flexible degree of freedom ξ and
the intramolecular energy relative to the most stable conformation ΔEintra
b) The geometries of all the optimised conformation in mol2 file format
The source codes and example input files are in directories A2 (cosine model) A3
(rescaled repulsion model) and A4 (physical model) The A2 directory contains
a) an executable file (cos_modelexe)
b) FORTRAN source code (cos_modelf90)
c) input (summaryr) file
d) output (dominantr) file
The A3 and A4 directories contain
a) an executable file (exe)
b) FORTRAN source code (f90)
c) output (dominantr) file
d) an input subdirectory that contains
i Gavezzottirsquos exp-6 atom-atom parameters from Table 52
ii h03adfe subroutine computes the nearest neighbour of two atoms and
iii summaryr file
The A5 directory contains a utility file (extract_mol2sh) that extracts the input data
(summaryr and all the optimised conformations in mol2) from the GAUSSIAN0353
(log) file
Bibliography
163
Bibliography
1 Price S L Why dont we find more polymorphs Acta Crystallogr Sect B
2013 69 313-328
2 Price S L Predicting crystal structures of organic compounds Chem Soc Rev
2014 43 (7) 2098-2111
3 Svaumlrd M Structural Kinetic and Thermodynamic Aspects of the Crystal
Polymorphism of Substituted Monocyclic Aromatic Compounds 2011
4 Svaumlrd M Nordstroumlm F L Jasnobulka T Rasmuson Aring C Thermodynamics
and Nucleation Kinetics of m-Aminobenzoic Acid Polymorphs Cryst Growth
Des 2009 10 (1) 195-204
5 Chemburkar S R Bauer J Deming K Spiwek H Patel K Morris J
Henry R Spanton S Dziki W Porter W Quick J Bauer P Donaubauer
J Narayanan B A Soldani M Riley D McFarland K Dealing with the
impact of ritonavir polymorphs on the late stages of bulk drug process
development Org Process Res Dev 2000 4 (5) 413-417
6 Day G M Current approaches to predicting molecular organic crystal structures
Crystallography Reviews 2011 17 (1) 3-52
7 Byrn S R Pfeiffer R Ganey M Hoiberg C Poochikian G Pharmaceutical
Solids - A Strategic Approach to Regulatory Considerations Pharmaceut Res
1995 12 (7) 945-954
8 Price S L Lattice energy nailed Science 2014 345 (6197) 619-620
9 Newman A Specialized Solid Form Screening Techniques Org Process Res
Dev 2013 17 (3) 457-471
10 Day G M Cooper T G Cruz-Cabeza A J Hejczyk K E Ammon H L
Boerrigter S X M Tan J Della Valle R G Venuti E Jose J Gadre S R
Desiraju G R Thakur T S van Eijck B P Facelli J C Bazterra V E
Ferraro M B Hofmann D W M Neumann M Leusen F J J Kendrick J
Price S L Misquitta A J Karamertzanis P G Welch G W A Scheraga
H A Arnautova Y A Schmidt M U van de Streek J Wolf A Schweizer
B Significant progress in predicting the crystal structures of small organic
molecules - a report on the fourth blind test Acta Crystallogr Sect B 2009 65
(2) 107-125
11 Bardwell D A Adjiman C S Arnautova Y A Bartashevich E Boerrigter
S X Braun D E Cruz-Cabeza A J Day G M la Valle R G Desiraju G
R van Eijck B P Facelli J C Ferraro M B Grillo D Habgood M
Hofmann D W Hofmann F Jose K V Karamertzanis P G Kazantsev A
V Kendrick J Kuleshova L N Leusen F J Maleev A V Misquitta A J
Mohamed S Needs R J Neumann M A Nikylov D Orendt A M Pal R
Pantelides C C Pickard C J Price L S Price S L Scheraga H A van de
Bibliography
164
Streek J Thakur T S Tiwari S Venuti E Zhitkov I K Towards crystal
structure prediction of complex organic compounds - a report on the fifth blind
test Acta Crystallogr Sect B 2011 67 (6) 535-551
12 Price S L Developing Methods of Crystal Structure and Polymorph Prediction
Implications of Molecular and Materials Structures for New Technologies 1999
315-320
13 Neumann M A Tailor-made force fields for crystal-structure prediction J Phys
Chem B 2008 112 (32) 9810-9829
14 Price S L Computed crystal energy landscapes for understanding and predicting
organic crystal structures and polymorphism Accounts Chem Res 2009 42 (1)
117-126
15 Groom C R Reilly A M Sixth blind test of organic crystal-structure prediction
methods Acta Crystallogr Sect B 2014 70 (4) 776-777
16 Beyer T Lewis T Price S L Which organic crystal structures are predictable
by lattice energy minimisation CrystEngComm 2001 3 (44) 178-212
17 Kazantsev A V Karamertzanis P G Adjiman C S Pantelides C C Price
S L Galek P T Day G M Cruz-Cabeza A J Successful prediction of a
model pharmaceutical in the fifth blind test of crystal structure prediction Int J
Pharm 2011 418 (2) 168-178
18 Lopez-Mejias V Kampf J W Matzger A J Nonamorphism in Flufenamic
Acid and a New Record for a Polymorphic Compound with Solved Structures J
Am Chem Soc 2012 134 (24) 9872-9875
19 Lopez-Mejias V Kampf J W Matzger A J Polymer-Induced
Heteronucleation of Tolfenamic Acid Structural Investigation of a Pentamorph
J Am Chem Soc 2009 131 (13) 4554-4555
20 Yu L Polymorphism in Molecular Solids An Extraordinary System of Red
Orange and Yellow Crystals Accounts Chem Res 2010 43 (9) 1257-1266
21 Chen S A Xi H M Yu L Cross-nucleation between ROY polymorphs J
Am Chem Soc 2005 127 (49) 17439-17444
22 Murthy H K Bhat T N Vijayan M Structural studies of analgesics and their
interactions 9 Structure of a new crystal form of 2-([3-(trifluoromethyl) phenyl]
amino) benzoic acid (flufenamic acid) Acta Crystallogr Sect B 1982 38 (JAN)
315-317
23 Lutker K M Tolstyka Z P Matzger A J Investigation of a privileged
polymorphic motif A dimeric ROY derivative Cryst Growth Des 2008 8 (1)
136-139
24 Price S L Price L S Modelling Intermolecular Forces for Organic Crystal
Structure Prediction In Intermolecular Forces and Clusters I Wales D J Ed
Springer-Verlag Berlin Heidelberg Germany 2005 pp 81-123
Bibliography
165
25 Bernstein J Polymorphism in Molecular Crystals Clarendon Press Oxford
2002
26 Stone A J The Theory of Intermolecular Forces 2 ed Oxford University Press
Oxford 2013
27 Buckingham A D Utting B D Intermolecular Forces Annu Rev Phys Chem
1970 21 (1) 287-316
28 Maitland G C Rigby M Smith E B Wakeham W A Intermolecular
Forces Their Origin and Determination Clarendon Press Oxford 1981
29 Israelachvili J Intermolecular and Surface Forces Third Edition Academic
Press 2010
30 London F The general theory of molecular forces Trans Faraday Soc 1937
33 8b-26
31 Spencer N D Moore J H Encyclopedia of Chemical Physics and Physical
Chemistry Fundamentals 1 ed Taylor amp Francis 2001pp 1004
32 Welch G W A Karamertzanis P G Misquitta A J Stone A J Price S L
Is the induction energy important for modeling organic crystals J Chem Theory
Comput 2008 4 (3) 522-532
33 Price S L From crystal structure prediction to polymorph prediction interpreting
the crystal energy landscape Phys Chem Chem Phys 2008 10 (15) 1996-2009
34 Price S L Leslie M Welch G W A Habgood M Price L S
Karamertzanis P G Day G M Modelling Organic Crystal Structures using
Distributed Multipole and Polarizability-Based Model Intermolecular Potentials
Phys Chem Chem Phys 2010 12 (30) 8478-8490
35 Freitag M A Gordon M S Jensen J H Stevens W J Evaluation of charge
penetration between distributed multipolar expansions J Chem Phys 2000 112
(17) 7300-7306
36 Lund A M Orendt A M Pagola G I Ferraro M B Facelli J C
Optimization of Crystal Structures of Archetypical Pharmaceutical Compounds
A Plane-Wave DFT-D Study Using Quantum Espresso Crystal Growth amp Design
2013 13 (5) 2181-2189
37 Neumann M A Perrin M A Energy ranking of molecular crystals using
density functional theory calculations and an empirical van der Waals correction
J Phys Chem B 2005 109 (32) 15531-15541
38 Cox S R Hsu L Y Williams D E Nonbonded Potential Function Models for
Crystalline Oxohydrocarbons Acta Crystallogr Sect A 1981 37 (MAY) 293-
301
Bibliography
166
39 Williams D E Cox S R Nonbonded Potentials For Azahydrocarbons the
Importance of the Coulombic Interaction Acta Crystallogr Sect B 1984 40 (8)
404-417
40 Coombes D S Price S L Willock D J Leslie M Role of Electrostatic
Interactions in Determining the Crystal Structures of Polar Organic Molecules A
Distributed Multipole Study J Phys Chem 1996 100 (18) 7352-7360
41 Gavezzotti A Theoretical Aspects and Computer Modeling of the Molecular
Solid State John Wiley Chichester 1997 Vol 1
42 Filippini G Gavezzotti A Empirical Intermolecular Potentials For Organic-
Crystals the 6-Exp Approximation Revisited Acta Crystallogr Sect B 1993
B49 868-880
43 Williams D E Weller R R Lone-Pair Electronic Effects On the Calculated
Abinitio Scf-Mo Electric-Potential and the Crystal-Structures of Azabenzenes J
Am Chem Soc 1983 105 (13) 4143-4148
44 Karamertzanis P G Pantelides C C Optimal site charge models for molecular
electrostatic potentials Mol Simulat 2004 30 (7) 413-436
45 Spackman M A Molecular Electric Moments from X-ray Diffraction Data
Chem Rev 1992 92 1769-1797
46 Breneman C M Wiberg K B Determining Atom-Centered Monopoles From
Molecular Electrostatic Potentials - the Need For High Sampling Density in
Formamide Conformational-Analysis J Comput Chem 1990 11 (3) 361-373
47 Francl M M Carey C Chirlian L E Gange D M Charges fit to electrostatic
potentials II Can atomic charges be unambiguously fit to electrostatic potentials
J Comput Chem 1996 17 (3) 367-383
48 Stone A J Alderton M Distributed Multipole Analysis - Methods and
Applications Molecular Physics 1985 56 (5) 1047-1064
49 Welch G W A The induction contribution to the lattice energy of organic
crystals PhD 2010
50 Stone A J Distributed Multipole Analysis or How to Describe a Molecular
Charge Distribution Chemical Physics Letters 1981 83 (2) 233-239
51 Stone A J Distributed multipole analysis Stability for large basis sets J Chem
Theory Comput 2005 1 (6) 1128-1132
52 GDMA A Program for Performing Distributed Multipole Analysis of Wave
Functions Calculated Using the Gaussian Program System version 22
University of Cambridge Cambridge United Kingdom 2010
53 Gaussian 03 Gaussian Inc Wallingford CT 2004
Bibliography
167
54 GDMA A Program for Performing Distributed Multipole Analysis of Wave
Functions Calculated Using the Gaussian Program System version 10
University of Cambridge Cambridge United Kingdom 1999
55 Price S L Computational prediction of organic crystal structures and
polymorphism Int Rev Phys Chem 2008 27 (3) 541-568
56 Kazantsev A V Molecular Flexibility in Crystal Structure Prediction PhD
Imperial College London 2011
57 Smith W Point multipoles in the Ewald summation CCP5 Quarterly 1982 4
13-25
58 Cruz-Cabeza A J Bernstein J Conformational Polymorphism Chem Rev
2014 114 (4) 2170-2191
59 Cornell W D Cieplak P Bayly C I Gould I R Merz K M Ferguson D
M Spellmeyer D C Fox T Caldwell J W Kollman P A A Second
Generation Force-Field For the Simulation of Proteins Nucleic-Acids and
Organic-Molecules (Vol 117 Pg 5179 1995) J Am Chem Soc 1996 118 (9)
2309
60 van Mourik T Karamertzanis P G Price S L Molecular conformations and
relative stabilities can be as demanding of the electronic structure method as
intermolecular calculations J Phys Chem A 2006 110 (1) 8-12
61 van Mourik T Assessment of Density Functionals for Intramolecular Dispersion-
Rich Interactions J Chem Theory Comput 2008 4 (10) 1610-1619
62 Comba P Hambley T W Martin B Molecular modeling of inorganic
compounds John Wiley amp Sons 2009
63 Leach A R Molecular Modelling Principles and Applications Longman
Harlow 1996
64 Goodman J M Chemical Applications of Molecular Modelling Royal Society
of Chemistry Cambridge UK 1998
65 Brodersen S Wilke S Leusen F J J Engel G A study of different
approaches to the electrostatic interaction in force field methods for organic
crystals Phys Chem Chem Phys 2003 5 (21) 4923-4931
66 Lommerse J P M Motherwell W D S Ammon H L Dunitz J D
Gavezzotti A Hofmann D W M Leusen F J J Mooij W T M Price S
L Schweizer B Schmidt M U van Eijck B P Verwer P Williams D E
A test of crystal structure prediction of small organic molecules Acta Crystallogr
Sect B 2000 56 697-714
67 Motherwell W D S Ammon H L Dunitz J D Dzyabchenko A Erk P
Gavezzotti A Hofmann D W M Leusen F J J Lommerse J P M Mooij
W T M Price S L Scheraga H Schweizer B Schmidt M U van Eijck
Bibliography
168
B P Verwer P Williams D E Crystal structure prediction of small organic
molecules a second blind test Acta Crystallogr Sect B 2002 58 647-661
68 Ponder J W Case D A Force fields for protein simulations Protein
Simulations 2003 66 27-86
69 Cornell W D Howard A E Kollman P Molecular mechanical potential
functions and their application to study molecular systems Current Opinion in
Structural Biology 1991 201-212 Curr Opin Struc Biol 1991 1 (2) 201-212
70 Comba P Hambley T W Martin B Molecular modeling of inorganic
compounds 2009 3rd completely rev and enlarged ed
71 Kazantsev A V Karamertzanis P G Adjiman C S Pantelides C C
CrystalOptimizer An efficient Algorithm for Lattice Energy Minimisation of
Organic Crystal using Isolated-Molecule Quantum Mechanical Calculations In
Molecular System Engineering Adjiman C S Galindo A Eds WILEY-VCH
Verlag GmbH amp Co Weinheim 2010 Vol 6 pp 1-42
72 Kazantsev A V Karamertzanis P G Adjiman C S Pantelides C C
Efficient Handling of Molecular Flexibility in Lattice Energy Minimization of
Organic Crystals J Chem Theory Comput 2011 7 (6) 1998-2016
73 Jones J E On the Determination of Molecular Fields II From the Equation of
State of a Gas Proceedings of the Royal Society of London Series A 1924 106
(738) 463-477
74 Weiner S J Kollman P A Case D A Singh U C Ghio C Alagona G
Profeta S Weiner P A New Force-Field for Molecular Mechanical Simulation
of Nucleic-Acids and Proteins J Am Chem Soc 1984 106 (3) 765-784
75 Momany F A McGuire R F Burgess A W Scheraga H A Energy
parameters in polypeptides VII Geometric parameters partial atomic charges
nonbonded interactions hydrogen bond interactions and intrinsic torsional
potentials for the naturally occurring amino acids J Phys Chem 1975 79 (22)
2361-2381
76 Nemethy G Pottle M S Scheraga H A Energy parameters in polypeptides
9 Updating of geometrical parameters nonbonded interactions and hydrogen
bond interactions for the naturally occurring amino acids J Phys Chem 1983
87 (11) 1883-1887
77 Hagler A T Lifson S Energy functions for peptides and proteins II Amide
hydrogen bond and calculation of amide crystal properties J Am Chem Soc
1974 96 (17) 5327-5335
78 Hagler A T Huler E Lifson S Energy functions for peptides and proteins I
Derivation of a consistent force field including the hydrogen bond from amide
crystals J Am Chem Soc 1974 96 (17) 5319-5327
Bibliography
169
79 Jorgensen W L Quantum and statistical mechanical studies of liquids 10
Transferable intermolecular potential functions for water alcohols and ethers
Application to liquid water J Am Chem Soc 1981 103 (2) 335-340
80 Wang J M Wolf R M Caldwell J W Kollman P A Case D A
Development and testing of a general amber force field J Comput Chem 2004
25 (9) 1157-1174
81 Brooks B R Bruccoleri R E Olafson B D States D J Swaminathan S
Karplus M CHARMM A Program for Macromolecular Energy Minimization
and Dynamics Calculations J Comput Chem 1983 4 (2) 187-217
82 Becker O M Computational biochemistry and biophysics M Dekker New
York 2001
83 MacKerell A D Bashford D Bellott Dunbrack R L Evanseck J D Field
M J Fischer S Gao J Guo H Ha S Joseph-McCarthy D Kuchnir L
Kuczera K Lau F T K Mattos C Michnick S Ngo T Nguyen D T
Prodhom B Reiher W E Roux B Schlenkrich M Smith J C Stote R
Straub J Watanabe M Wiorkiewicz-Kuczera J Yin D Karplus M All-
Atom Empirical Potential for Molecular Modeling and Dynamics Studies of
Proteins J Phys Chem B 1998 102 (18) 3586-3616
84 Vanommeslaeghe K Hatcher E Acharya C Kundu S Zhong S Shim J
Darian E Guvench O Lopes P Vorobyov I Mackerell A D CHARMM
general force field A force field for drug-like molecules compatible with the
CHARMM all-atom additive biological force fields J Comput Chem 2010 31
(4) 671-690
85 Jorgensen W L Tirado-Rives J Potential energy functions for atomic-level
simulations of water and organic and biomolecular systems P Natl Acad Sci
USA 2005 102 (19) 6665-6670
86 Allinger N L Chen K Lii J H An improved force field (MM4) for saturated
hydrocarbons J Comput Chem 1996 17 (5-6) 642-668
87 Halgren T A Merck molecular force field 1 Basis form scope
parameterization and performance of MMFF94 J Comput Chem 1996 17 (5-
6) 490-519
88 Allinger N L Conformational analysis 130 MM2 A hydrocarbon force field
utilizing V1 and V2 torsional terms J Am Chem Soc 1977 99 (25) 8127-8134
89 Caleman C van Maaren P J Hong M Hub J S Costa L T van der Spoel
D Force Field Benchmark of Organic Liquids Density Enthalpy of
Vaporization Heat Capacities Surface Tension Isothermal Compressibility
Volumetric Expansion Coefficient and Dielectric Constant J Chem Theory
Comput 2011 8 (1) 61-74
90 Stouch T R The errors of our ways taking account of error in computer-aided
drug design to build confidence intervals for our next 25 years J Comput -Aided
Mol Des 2012 26 (1) 125-134
Bibliography
170
91 Ponder J W Wu C J Ren P Y Pande V S Chodera J D Schnieders M
J Haque I Mobley D L Lambrecht D S DiStasio R A Head-Gordon
M Clark G N I Johnson M E Head-Gordon T Current Status of the
AMOEBA Polarizable Force Field J Phys Chem B 2010 114 (8) 2549-2564
92 Day G M Motherwell W D S Jones W Beyond the isotropic atom model in
crystal structure prediction of rigid molecules Atomic multipoles versus point
charges Cryst Growth Des 2005 5 (3) 1023-1033
93 Marshall G R Limiting assumptions in molecular modeling electrostatics J
Comput -Aided Mol Des 2013 27 (2) 107-114
94 Payne R S Rowe R C Roberts R J Charlton M H Docherty R Potential
polymorphs of aspirin J Comput Chem 1999 20 (2) 262-273
95 Gourlay M D Kendrick J Leusen F J J Rationalization of racemate
resolution Predicting spontaneous resolution through crystal structure prediction
Cryst Growth Des 2007 7 (1) 56-63
96 Uzoh O G Analytically Modelling Intramolecular Energies of Fenamic and
Tolfenamic Acids Unpublished Work 2013
97 NAG Fortran Library Routine Document G02DDF Oxford United Kingdom
1989
98 Beran G J Hirata S Fragment and localized orbital methods in electronic
structure theory Physical Chemistry Chemical Physics 2012 14 (21) 7559-7561
99 Orio M Pantazis D A Neese F Density functional theory Photosynthesis
Research 2009 102 (2-3) 443-453
100 Sherrill C D An introduction to Hartree-Fock molecular orbital theory School
of Chemistry and Biochemistry Georgia Institute of Technology 2000
101 Shaik S S Hiberty P C A chemists guide to valence bond theory John Wiley
amp Sons 2007
102 Wu W Su P F Shaik S Hiberty P C Classical Valence Bond Approach by
Modern Methods Chem Rev 2011 111 (11) 7557-7593
103 Gasteiger J Engel T Chemoinformatics a textbook John Wiley amp Sons 2006
104 Fukui K Yonezawa T Shingu H A Molecular Orbital Theory of Reactivity in
Aromatic Hydrocarbons J Chem Phys 1952 20 (4) 722-725
105 Bell S Dines T J Chowdhry B Z Withnall R Computational chemistry
using modern electronic structure methods J Chem Educ 2007 84 (8) 1364-
1370
106 Moller C Plesset M S Note on an approximation treatment for many-electron
systems Phys Rev 1934 46 618-622
Bibliography
171
107 Valdes H Klusak V Pitonak M Exner O Stary I Hobza P Rulisek L
Evaluation of the intramolecular basis set superposition error in the calculations
of larger molecules [n]Helicenes and Phe-Gly-Phe tripeptide J Comput Chem
2008 29 (6) 861-870
108 Simon S Duran M Dannenberg J J How does basis set superposition error
change the potential surfaces for hydrogen bonded dimers Journal of Chemical
Physics 1996 105 (24) 11024-11031
109 Szczesniak M M Scheiner S Correction of the Basis Set Superposition Error
in SCF and MP2 Interaction Energies - the Water Dimer J Chem Phys 1986 84
(11) 6328-6335
110 Stephens P J Devlin F J Chabalowski C F Frisch M J Ab-Initio
Calculation of Vibrational Absorption and Circular-Dichroism Spectra Using
Density-Functional Force-Fields J Phys Chem 1994 98 (45) 11623-11627
111 Car R Introduction to density-functional theory and ab-initio molecular
dynamics Quant Struct -Act Rel 2002 21 (2) 97-104
112 Grimme S Antony J Schwabe T Muck-Lichtenfeld C Density functional
theory with dispersion corrections for supramolecular structures aggregates and
complexes of (bio)organic molecules Organic amp Biomolecular Chemistry 2007
5 (5) 741-758
113 Kohn W Becke A D Parr R G Density functional theory of electronic
structure J Phys Chem 1996 100 (31) 12974-12980
114 Hohenberg P Kohn W Inhomogeneous Electron Gas Physical Review B 1964
136 (3B) B864-B871
115 Kohn W Sham L J Self-consistent equations including exchange and
correlation effects Phys Rev 1965 140 (4A) A1133
116 Becke A D Density-Functional Thermochemistry 3 the Role of Exact
Exchange J Chem Phys 1993 98 (7) 5648-5652
117 Lee C T Yang W T Parr R G Development of the Colle-Salvetti
Correlation-Energy Formula Into A Functional of the Electron-Density Phys
Rev B 1988 37 (2) 785-789
118 Adamo C Barone V Toward reliable density functional methods without
adjustable parameters The PBE0 model J Chem Phys 1999 110 (13) 6158-
6170
119 Sherrill C D Introduction to Electron Correlation School of Chemistry and
Biochemistry Georgia Institute of Technology 2008
120 Grafenstein J Cremer D An efficient algorithm for the density-functional
theory treatment of dispersion interactions J Chem Phys 2009 130 (12)
Bibliography
172
121 Grimme S Density functional theory with London dispersion corrections Wiley
Interdisciplinary Reviews-Computational Molecular Science 2011 1 (2) 211-
228
122 Grimme S Antony J Ehrlich S Krieg H A consistent and accurate ab initio
parametrization of density functional dispersion correction (DFT-D) for the 94
elements H-Pu J Chem Phys 2010 132 (15) 154104
123 Brown T L Chemistry The Central Science Pearson Education 2009
124 Gavezzotti A Filippini G Polymorphic Forms of Organic-Crystals at Room
Conditions - Thermodynamic and Structural Implications J Am Chem Soc
1995 117 (49) 12299-12305
125 Karamertzanis P G Prediction of crystal structure of molecular solids PhD
Imperial College London 2004
126 Karamertzanis P G Pantelides C C Ab initio crystal structure prediction II
Flexible molecules Mol Phys 2007 105 (2-3) 273-291
127 Vasileiadis M Kazantsev A V Karamertzanis P G Adjiman C S
Pantelides C C The polymorphs of ROY application of a systematic crystal
structure prediction technique Acta Crystallogr Sect B 2012 68 (6) 677-685
128 Sobol I M On the distribution of points in a cube and the approximate evaluation
of integrals USSR Comp Math Math Phys 1967 7 86-112
129 The NAG Fortran Library Oxford United Kingdom 2013
130 Karamertzanis P G Price S L Energy Minimization of Crystal Structures
Containing Flexible Molecules J Chem Theory Comput 2006 2 (4) 1184-1199
131 Cooper T G Hejczyk K E Jones W Day G M Molecular Polarization
Effects on the Relative Energies of the Real and Putative Crystal Structures of
Valine J Chem Theory Comput 2008 4 (10) 1795-1805
132 Mennucci B Tomasi J Continuum solvation models A new approach to the
problem of solutes charge distribution and cavity boundaries J Chem Phys
1997 106 (12) 5151-5158
133 Habgood M Price S L Portalone G Irrera S Testing a Variety of Electronic-
Structure-Based Methods for the Relative Energies of 5-Formyluracil Crystals J
Chem Theory Comput 2011 7 (9) 2685-2688
134 Karamertzanis P G Pantelides C C Ab initio crystal structure prediction - I
Rigid molecules Journal of Computational Chemistry 2005 26 (3) 304-324
135 Williams D E Improved intermolecular force field for molecules containing H
C N and O atoms with application to nucleoside and peptide crystals J Comput
Chem 2001 22 (11) 1154-1166
Bibliography
173
136 Day G M Motherwell W D S Jones W A strategy for predicting the crystal
structures of flexible molecules the polymorphism of phenobarbital Physical
Chemistry Chemical Physics 2007 9 (14) 1693-1704
137 Kendrick J Leusen F J Neumann M A van de Streek J Progress in Crystal
Structure Prediction Chemistry - A European Journal 2011 17 (38) 10735-
10743
138 Braun D E Karamertzanis P G Price S L Which if any hydrates will
crystallise Predicting hydrate formation of two dihydroxybenzoic acids Chem
Commun 2011 47 (19) 5443-5445
139 Cruz-Cabeza A J Karki S Fabian L Friscic T Day G M Jones W
Predicting stoichiometry and structure of solvates Chem Commun 2010 46 (13)
2224-2226
140 Karamertzanis P G Kazantsev A V Issa N Welch G W A Adjiman C
S Pantelides C C Price S L Can the Formation of Pharmaceutical Co-
Crystals Be Computationally Predicted II Crystal Structure Prediction J Chem
Theory Comput 2009 5 (5) 1432-1448
141 Issa N Barnett S A Mohamed S Braun D E Copley R C B Tocher D
A Price S L Screening for cocrystals of succinic acid and 4-aminobenzoic acid
CrystEngComm 2012 14 (7) 2454-2464
142 Cruz-Cabeza A J Day G M Jones W Structure prediction disorder and
dynamics in a DMSO solvate of carbamazepine Phys Chem Chem Phys 2011
13 (28) 12808-12816
143 Habgood M Form II Caffeine A Case Study for Confirming and Predicting
Disorder in Organic Crystals Cryst Growth Des 2011 11 (8) 3600-3608
144 Torrisi A Leech C K Shankland K David W I F Ibberson R M Benet-
Buchholz J Boese R Leslie M Catlow C R A Price S L The solid phases
of cyclopentane a combined experimental and simulation study J Phys Chem
B 2008 112 (12) 3746-3758
145 Braun D E Karamertzanis P G Arlin J B Florence A J Kahlenberg V
Tocher D A Griesser U J Price S L Solid-State Forms of beta-Resorcylic
Acid How Exhaustive Should a Polymorph Screen Be Cryst Growth Des 2011
11 (1) 210-220
146 Llinas A Goodman J M Polymorph Control past present and future Drug
Discover Today 2008 13 (56) 198-210
147 Arlin J B Price L S Price S L Florence A J A strategy for producing
predicted polymorphs catemeric carbamazepine form V Chem Commun 2011
47 (25) 7074-7076
148 Maddox J Crystals from first Principles Nature 1988 335 (6187) 201
Bibliography
174
149 Day G M Motherwell W D S Ammon H L Boerrigter S X M Della
Valle R G Venuti E Dzyabchenko A Dunitz J D Schweizer B van Eijck
B P Erk P Facelli J C Bazterra V E Ferraro M B Hofmann D W M
Leusen F J J Liang C Pantelides C C Karamertzanis P G Price S L
Lewis T C Nowell H Torrisi A Scheraga H A Arnautova Y A Schmidt
M U Verwer P A third blind test of crystal structure prediction Acta
Crystallogr Sect B 2005 61 (5) 511-527
150 Collins A Wilson C C Gilmore C J Comparing entire crystal structures
using cluster analysis and fingerprint plots CrystEngComm 2010 12 (3) 801-
809
151 Chisholm J A Motherwell S COMPACK a program for identifying crystal
structure similarity using distances J Appl Crystallogr 2005 38 228-231
152 Asmadi A Kendrick J Leusen F J J Crystal Structure Prediction and
Isostructurality of Three Small Molecules Chem Eur J 2010 16 (42) 12701-
12709
153 Macrae C F Bruno I J Chisholm J A Edgington P R McCabe P
Pidcock E Rodriguez-Monge L Taylor R van de Streek J Wood P A
Mercury CSD 20 - new features for the visualization and investigation of crystal
structures J Appl Crystallogr 2008 41 466-470
154 Chisholm J A Motherwell S A new algorithm for performing three-
dimensional searches of the Cambridge Structural Database J Appl Crystallogr
2004 37 331-334
155 Gelbrich T Hursthouse M B Systematic investigation of the relationships
between 25 crystal structures containing the carbamazepine molecule or a close
analogue a case study of the XPac method CrystEngComm 2006 8 (6) 448-460
156 Gelbrich T Hursthouse M B A versatile procedure for the identification
description and quantification of structural similarity in molecular crystals
CrystEngComm 2005 7 324-336
157 McKinnon J J Spackman M A Mitchell A S Novel tools for visualizing and
exploring intermolecular interactions in molecular crystals Acta Crystallogr
Sect B 2004 60 627-668
158 Spackman M A McKinnon J J Fingerprinting intermolecular interactions in
molecular crystals CrystEngComm 2002 378-392
159 Parkin A Barr G Dong W Gilmore C G Jayatilaka D McKinnon J J
Spackman M A Wilson C C Comparing entire crystal structures structural
genetic fingerprinting CrystEngComm 2007 9 648-652
160 McKinnon J J Mitchell A S Spackman M A Hirshfeld surfaces A new tool
for visualising and exploring molecular crystals Chem Eur J 1998 4 (11) 2136-
2141
Bibliography
175
161 Etter M C MacDonald J C Bernstein J Graph-Set Analysis of Hydrogen-
Bond Patterns in Organic- Crystals Acta Crystallogr Sect B 1990 46 256-262
162 Grell J Bernstein J Tinhofer G Graph-set analysis of hydrogen-bond patterns
some mathematical concepts Acta Crystallogr Sect B 1999 55 1030-1043
163 Press W H Flannery B P Teukolsky S A Vetterling W T Numerical
methods the art of scientific computing (Fortran version) Cambridge University
Press Cambridge 1989
164 Galek P T A Novel comparison of crystal packing by moments of inertia
CrystEngComm 2011 13 (3) 841-849
165 Bonnet P A Streek J v d Trask A V Motherwell W D S Jones W The
crystal structure of an unstable polymorph of beta-D-allose CrystEngComm
2004 6 (86) 535-539
166 Potter B S Palmer R A Withnall R Chowdhry B Z Price S L Aza
analogues of nucleic acid bases experimental determination and computational
prediction of the crystal structure of anhydrous 5-azauracil J Mol Struct 1999
486 349-361
167 Nowell H Frampton C S Waite J Price S L Blind crystal structure
prediction of a novel second polymorph of 1-hydroxy-7-azabenzotriazole Acta
Crystallogr Sect B 2006 62 (4) 642-650
168 DOria E Karamertzanis P G Price S L Spontaneous Resolution of
Enantiomers by Crystallization Insights from Computed Crystal Energy
Landscapes Cryst Growth Des 2010 10 (4) 1749-1756
169 Thornber C W Isosterism and molecular modification in drug design Chem
Soc Rev 1979 8 (4) 563-580
170 Singh H Singh Chawla A Kapoor V K Paul D Malhotra R K 4
Medicinal Chemistry of Tetrazoles In Progress in Medicinal Chemistry Volume
17 ed Ellis and G P Ed Elsevier 1980 pp 151-183
171 Lipinski C A Chapter 27 Bioisosterism in Drug Design In Annual Reports in
Medicinal Chemistry Volume 21 ed Denis M B Ed Academic Press 1986
pp 283-291
172 SHELXL97 University of Goumlttingen Goumlttingen Germany 1997
173 Sheldrick G M A short history of SHELX Acta Crystallogr Sect A 2008 64
(1) 112-122
174 Farrugia L WinGX suite for small-molecule single-crystal crystallography J
Appl Crystallogr 1999 32 (4) 837-838
175 Ladd M F C Palmer R A Structure Determination by X-Ray Crystallography
Springer 2003
Bibliography
176
176 Khan S A Reshak A H First Principle Study of Electronic Structure Chemical
Bonding and Optical Properties of 5-azido-1H-tetrazole International Journal of
Electrochemical Science 2013 8 (7) 9459-9473
177 Desiraju G R Hydrogen bridges in crystal engineering Interactions without
borders Accounts Chem Res 2002 35 (7) 565-573
178 Herrebout W A Suhm M A Weak hydrogen bonds - strong effects Phys
Chem Chem Phys 2011 13 (31)
179 Schmidt M W Baldridge K K Boatz J A Elbert S T Gordon M S
Jensen J H Koseki S Matsunaga N Nguyen K A Su S Windus T L
Dupuis M Montgomery J A General Atomic and Molecular Electronic
Structure Systems J Comput Chem 1993 14 1347-1363
180 Cossi M Scalmani G Rega N Barone V New developments in the
polarizable continuum model for quantum mechanical and classical calculations
on molecules in solution J Chem Phys 2002 117 (1) 43-45
181 An email message sent Febrary 2012 to Rex Palmer stated the following we
would be delighted if it were 2nd_23res P21 a = 79 or 1st_120res P21c a =
100 as our two lowest energy structures
182 Allen F H The Cambridge Structural Database A quarter of a million crystal
structures and rising Acta Crystallogr Sect B 2002 58 (3) 380-388
183 Thakur T S Desiraju G R Crystal Structure Prediction of a Co-Crystal Using
a Supramolecular Synthon Approach 2-Methylbenzoic Acid-2-Amino-4-
methylpyrimidine Cryst Growth Des 2008 8 (11) 4031-4044
184 Surov A O Perlovich G L Thermodynamics of sublimation thermophysical
and structural aspects of the molecular crystals of fenamates J Struct Chem
2010 51 (2) 308-315
185 Li H Stowell J G Borchardt T B Byrn S R Synthesis Conformational
Polymorphism and Construction of a GT Diagram of 2-[(2-Nitrophenyl)amino]-
3-thiophenecarbonitrile Cryst Growth Des 2006 6 (11) 2469-2474
186 Pagola S Stephens P W He X Byrn S R Crystal structure solution of the
dark red light red and orange pollymorphs of 5-methyl-2-[(2-nitro-4-
methylphenyl)amino]-3-thiophenecarbonitrile by high resolution X-ray powder
diffraction and simulated annealing techniques Delhez R Mittemeijer E J
Eds 2001 pp 789-794
187 Zhou T Li F Fan Y Song W Mu X Zhang H Wang Y Hydrogen-
bonded dimer stacking induced emission of aminobenzoic acid compounds
Chem Commun 2009 (22) 3199-3201
188 Mei X F August A T Wolf C Regioselective copper-catalyzed amination of
chlorobenzoic acids Synthesis and solid-state structures of N-aryl anthranilic acid
derivatives Journal of Organic Chemistry 2006 71 (1) 142-149
Bibliography
177
189 Alvarez A J Singh A Myerson A S Polymorph Screening Comparing a
Semi-Automated Approach with a High Throughput Method Cryst Growth Des
2009 9 (9) 4181-4188
190 SeethaLekshmi S Guru Row T N Conformational polymorphism in a non-
steroidal anti-inflammatory drug mefenamic acid Cryst Growth Des 2012 12
(8) 4283-4289
191 Dokorou V Kovala-Demertzi D Jasinski J P Galani A Demertzis M A
Synthesis Spectroscopic Studies and Crystal Structures of Phenylorganotin
Derivatives with [Bis(26-dimethylphenyl)amino]benzoic Acid Novel
Antituberculosis Agents Helv Chim Acta 2004 87 (8) 1940-1950
192 Bernstein J Polymorphism - A Perspective Cryst Growth Des 2011 11 (3)
632-650
193 Yu L Stephenson G A Mitchell C A Bunnell C A Snorek S V Bowyer
J J Borchardt T B Stowell J G Byrn S R Thermochemistry and
Conformational Polymorphism of a Hexamorphic Crystal System J Am Chem
Soc 2000 122 (4) 585-591
194 Yang S S Guillory J K Polymorphism in sulfonamides J Pharm Sci 1972
61 (1) 26-40
195 Rossi D Gelbrich T Kahlenberg V Griesser U J Supramolecular constructs
and thermodynamic stability of four polymorphs and a co-crystal of pentobarbital
(nembutal) CrystEngComm 2012 14 (7) 2494-2506
196 Lutker K M Matzger A J Crystal polymorphism in a carbamazepine
derivative Oxcarbazepine J Pharm Sci 2010 99 (2) 794-803
197 Costantino L Barlocco D Privileged Structures as Leads in Medicinal
Chemistry Current Medicinal Chemistry 2006 13 (1) 65-85
198 Keinaumlnen S Similauml S Kouvalainen K Oral antipyretic therapy Evaluation of the
N-aryl-anthranilic acid derivatives mefenamic acid tolfenamic acid and
flufenamic acid Eur J Clin Pharmacol 1978 13 (5) 331-334
199 Andersen K V Larsen S Alhede B Gelting N Buchardt O
Characterization of two polymorphic forms of tolfenamic acid N-(2-methyl-3-
chlorophenyl)anthranilic acid their crystal structures and relative stabilities J
Chem Soc Perkin Trans 2 1989 (10) 1443-1447
200 Mattei A Li T Polymorph Formation and Nucleation Mechanism of
Tolfenamic Acid in Solution An Investigation of Pre-nucleation Solute
Association Pharmaceut Res 2012 29 (2) 460-470
201 Surov A O Szterner P Zielenkiewicz W Perlovich G L Thermodynamic
and structural study of tolfenamic acid polymorphs J Pharm Biomed Anal
2009 50 (5) 831-840
Bibliography
178
202 Brittain H G Polymorphism in Pharmaceutical Solids Informa Healthcare New
York London 2009 Vol 192
203 van de Streek J Motherwell S Searching the Cambridge Structural Database
for polymorphs Acta Crystallogr Sect B 2005 61 504-510
204 Desiraju G R Polymorphism The same and not quite the same Cryst Growth
Des 2008 8 (1) 3-5
205 Bhatt P M Desiraju G R Tautomeric polymorphism in omeprazole Chem
Commun 2007 (20) 2057-2059
206 de Gelder R Wehrens R Hageman J A A generalized expression for the
similarity of spectra Application to powder diffraction pattern classification J
Comput Chem 2001 22 (3) 273-289
207 Bruno I J Cole J C Edgington P R Kessler M Macrae C F McCabe
P Pearson J Taylor R New software for searching the Cambridge Structural
Database and visualizing crystal structures Acta Crystallogr Sect B 2002 58
389-397
208 Allen F H Taylor R Research applications of the Cambridge Structural
Database (CSD) Chem Soc Rev 2004 33 (8) 463-475
209 Kazantsev A V Karamertzanis P G Adjiman C S Pantelides C C Price
S L Galek P T A Day G M Cruz-Cabeza A J Successful Prediction of a
Model Pharmaceutical in the Fifth Blind Test of Crystal Structure Prediction Int
J Pharm 2011 418 (2) 168-178
210 Macrae C F Edgington P R McCabe P Pidcock E Shields G P Taylor
R Towler M van de Streek J Mercury visualization and analysis of crystal
structures J Appl Crystallogr 2006 39 453-457
211 Mattei A Li T L Interplay between molecular conformation and
intermolecular interactions in conformational polymorphism A molecular
perspective from electronic calculations of tolfenamic acid Int J Pharm 2011
418 (2) 179-186
212 Habgood M Grau-Crespo R Price S L Substitutional and orientational
disorder in organic crystals a symmetry-adapted ensemble model Phys Chem
Chem Phys 2011 13 (20) 9590-9600
213 Lancaster R W Karamertzanis P G Hulme A T Tocher D A Lewis T
C Price S L The Polymorphism of Progesterone Stabilization of a
Disappearing Polymorph by Co-Crystallization J Pharm Sci 2007 96 (12)
3419-3431
214 Gavezzotti A The Calculation of Molecular Volumes and the Use of Volume
Analysis in the Investigation of Structured Media and of Solid-State Organic-
Reactivity J Am Chem Soc 1983 105 (16) 5220-5225
Bibliography
179
215 The Free Dictionary defines herringbone as a way of assembling in a diagonal
zigzag manner
216 Desiraju G R On the presence of multiple molecules in the crystal asymmetric
unit (Z gt 1) CrystEngComm 2007 9 (1) 91-92
217 Anderson K M Steed J W Comment on On the presence of multiple
molecules in the crystal asymmetric unit (Z gt 1) by Gautam R Desiraju
CrystEngComm 2007 9 91 CrystEngComm 2007 9 (4) 328-330
218 Delaney S P Smith T M Pan D Yin S Korter T M Cryogenic Phase
Transition in Crystalline Aripiprazole Leads to an Eighth Polymorph Cryst
Growth Des 2014
219 From private communication with Rona Watson at University College London
220 Thompson H P G Day G M Which conformations make stable crystal
structures Mapping crystalline molecular geometries to the conformational
energy landscape Chem Sci 2014 5 (8) 3173-3182
221 Mo Y Gao J Theoretical Analysis of the Rotational Barrier of Ethane Accounts
Chem Res 2007 40 (2) 113-119
222 Pophristic V Goodman L Hyperconjugation not steric repulsion leads to the
staggered structure of ethane Nature 2001 411 (6837) 565-568
223 Halpern A M Glendening E D An intrinsic reaction coordinate calculation of
the torsional potential in ethane Comparison of the computationally and
experimentally derived torsional transitions and the rotational barrier Journal of
Chemical Physics 2003 119 (21) 11186-11191
224 Mulliken R S Intensities of Electronic Transitions in Molecular Spectra IV
Cyclic Dienes and Hyperconjugation 2004 7 (5) 339-352
225 Mo Y Song L Lin Y Block-Localized Wavefunction (BLW) Method at the
Density Functional Theory (DFT) Level J Phys Chem A 2007 111 (34) 8291-
8301
226 Brunck T K Weinhold F Quantum-Mechanical Studies on the Origin of
Barriers to Internal-Rotation About Single Bonds J Am Chem Soc 1979 101
(7) 1700-1709
227 Pendas A Blanco M Francisco E Steric Repulsions Rotation Barriers and
Stereoelectronic Effects A Real Space Perspective J Comput Chem 2009 30
(1) 98-109
228 Surov A O Perlovich G L Emelyanenko V N Verevkin S P
Thermochemistry of Drugs Experimental and First-Principles Study of
Fenamates J Chem Eng Data 2011 56 (12) 4325-4332
229 GaussView version 5 2009
Bibliography
180
230 Clark M Cramer R D Van Opdenbosch N Validation of the general purpose
tripos 52 force field J Comput Chem 1989 10 (8) 982-1012
231 Gavezzotti A Filippini G Geometry of the Intermolecular X-HY (X Y=N
O) Hydrogen- Bond and the Calibration of Empirical Hydrogen-Bond Potentials
J Phys Chem 1994 98 (18) 4831-4837
232 Gavezzotti A Are Crystal-Structures Predictable Accounts Chem Res 1994 27
(10) 309-314
233 Mercury version 31 2013
234 Lozano J J Pouplana R Loacutepez M Ruiz J Conformational analysis of the
antiinflammatory fenamates a molecular mechanics and semiempirical molecular
orbital study Journal of Molecular Structure THEOCHEM 1995 335 (13)
215-227
235 Rappe A K Casewit C J Colwell K S Goddard W A Skiff W M Uff a
Full Periodic-Table Force-Field For Molecular Mechanics and Molecular-
Dynamics Simulations J Am Chem Soc 1992 114 (25) 10024-10035
236 Jorgensen W L Tirado-Rives J The OPLS potential functions for proteins
energy minimizations and crystals of cyclic peptides and crambin J Am Chem
Soc 1988 110 (6) 1657-1666
237 Hopkins C W Roitberg A E Fitting of Dihedral Terms in Classical Force
Fields as an Analytic Linear Least-Squares Problem J Chem Inf Model 2014
54 (7) 1978-1986
238 Wheatley R J Price S L An Overlap Model For Estimating the Anisotropy of
Repulsion Mol Phys 1990 69 (3) 507-533
239 Totton T S Misquitta A J Kraft M A First Principles Development of a
General Anisotropic Potential for Polycyclic Aromatic Hydrocarbons J Chem
Theory Comput 2010 6 (3) 683-695
240 Sorescu D C Rice B M Thompson D L Intermolecular potential for the
hexahydro-135-trinitro-135-s- triazine crystal (RDX) A crystal packing
Monte Carlo and molecular dynamics study J Phys Chem B 1997 101 (5) 798-
808
241 Williams D E Houpt D J Fluorine Nonbonded Potential Parameters Derived
From Crystalline Perfluorocarbons Acta Crystallogr Sect B 1986 42 (JUN)
286-295
242 OBoyle N Banck M James C Morley C Vandermeersch T Hutchison
G Open Babel An open chemical toolbox Journal of Cheminformatics 2011 3
(1) 33
243 Combinations - Rosetta Code
Bibliography
181
244 Hastie T Tibshirani R Friedman J The Elements of Statistical Learning Data
Mining Inference and Prediction Second Edition 2nd ed 2009 Corr 7th
printing 2013 edition ed Springer New York 2011pp 745
245 Schmidt M U Dinnebier R E Kalkhof H Crystal engineering on industrial
diaryl pigments using lattice energy minimizations and X-ray powder diffraction
J Phys Chem B 2007 111 (33) 9722-9732
246 Ahmed S Bidstrup S A Kohl P A Ludovice P J Development of a new
force field for polynorbornene J Phys Chem B 1998 102 (49) 9783-9790
247 Braun D E McMahon J A Koztecki L H Price S L Reutzel-Edens S M
Contrasting Polymorphism of Related Small Molecule Drugs Correlated and
Guided by the Computed Crystal Energy Landscape Cryst Growth Des 2014
14 (4) 2056-2072
248 Ismail S Z Anderton C L Copley R C Price L S Price S L Evaluating
a Crystal Energy Landscape in the Context of Industrial Polymorph Screening
Cryst Growth Des 2013 13 (6) 2396-2406
249 Price L S McMahon J A Lingireddy S R Lau S-F Diseroad B A Price
S L Reutzel-Edens S M A molecular picture of the problems in ensuring
structural purity of tazofelone J Mol Struct 2014 ASAP
250 Kendrick J Stephenson G A Neumann M A Leusen F J Crystal Structure
Prediction of a Flexible Molecule of Pharmaceutical Interest with Unusual
Polymorphic Behavior Cryst Growth Des 2013 13 (2) 581-589
251 Price S L Hamad S Torrisi A Karamertzanis P G Leslie M Catlow C
R A Applications of DL_POLY and DL_MULTI to organic molecular crystals
Mol Simulat 2006 32 (12-13) 985-997
252 Abramov Y A QTAIM Application in Drug Development Prediction of
Relative Stability of Drug Polymorphs from Experimental Crystal Structures J
Phys Chem A 2011 115 (45) 12809-12817
253 Campeta A M Chekal B P Abramov Y A Meenan P A Henson M J
Shi B Singer R A Horspool K R Development of a Targeted Polymorph
Screening Approach for a Complex Polymorphic and Highly Solvating API J
Pharm Sci 2010 99 (9) 3874-3886
254 Klimes J Michaelides A Perspective Advances and challenges in treating van
der Waals dispersion forces in density functional theory J Chem Phys 2012
137 (12) 120901
255 Vasileiadis M Pantelides C C Adjiman C S Prediction of the crystal
structures of axitinib a polymorphic pharmaceutical molecule Chem Eng Sci
2015 121 60-76
256 Smith W Todorov I T Leslie M The DL_POLY molecular dynamics
package Z Kristallogr 2005 220 (5-6) 563-566
Bibliography
182
257 Leslie M DL_MULTI - A molecular dynamics program to use distributed
multipole electrostatic models to simulate the dynamics of organic crystals Mol
Phys 2008 106 (12-13) 1567-1578
258 Koch U Popelier P L A Stone A J Conformational Dependence of Atomic
Multipole Moments Chem Phys Lett 1995 238 (4-6) 253-260

Declaration
2
Declaration
I Ogaga Glory Uzoh confirm that the work presented in this thesis is my own Where
information has been derived from other sources I confirm that this has been indicated
in the thesis
_______________
Ogaga Glory Uzoh
January 2015
Abstract
3
Abstract
In the crystal packing of molecules wherein a single bond links aromatic groups a
change in the torsion angle can optimise close packing of the molecule The improved
intermolecular interactions Uinter outweigh the conformational energy penalty Eintra to
give a more stable lattice energy Elatt = Uinter +Eintra This thesis uses this lattice energy
model hierarchically in a new Crystal Structure Prediction (CSP) algorithm
CrystalPredictor version 16 which varies the low-barrier torsion angles at the start of
generating hypothetical crystal structures
The crystal structure of 1-benzyl-1H-tetrazole was successfully predicted in an
informal lsquoblind testrsquo when given the chemical diagram and the number of molecules in
the asymmetric unit cell Then the concept of whether specific molecular fragments
favour polymorphism (ie polymorphophore) was investigated by analysing the crystal
energy landscapes of the monomorphic fenamic acid and the polymorphic derivative
tolfenamic acid The CSP results show that the polymorphophore promotes but does not
guarantee polymorphism and that the substituents on the polymorphophore fragment
decide the relative energies of the crystal structures
Molecular Dynamics (MD) cannot use this lattice energy model because many ab initio
calculations of Eintra on a single molecule are expensive However the examination of
the physical origin of the torsional barrier in fenamates aided the derivation of an
analytical model forEintra This thesis develops codes for fitting analytical
intramolecular force fields to ab initio conformational profiles of fenamates An
intramolecular exp-6 atom-atom term (for the non-bonded repulsion-dispersion
contributions) plus a cosine term (that represents the changes to the Molecular Orbitals)
accurately model the ab initio conformational energy surfaces of fenamic and tolfenamic
acids This thesis provides a first step in extendingEintra data generated from CSP
studies to help MD on condensed phases of pharmaceutical-like organic molecules
Dedication
4
Dedication
I dedicate this thesis to my wife Jodi Uzoh my mother Felicia Uzoh and my father
Emmanuel Uzoh For their endless love support and encouragement
Acknowledgments
5
Acknowledgments
Foremost I would like to thank my supervisor Professor Sally Price for her support
and direction throughout my time at UCL Her encouragement and wise words at the start
of my doctorate program were vital
My sincere gratitude to Louise Price for helping me to understand the practical aspects
of the computational methods of Crystal Structure Prediction (CSP) and for the interesting
and insightful discussions about research and life My colleagues in Room G18 and
friends at UCL made my time there fun inspiring and exciting I would like to thank Rex
Palmer for setting the informal blind test of Chapter 3 and for the subsequent collaborative
paper
Many thanks to the Centre for Doctoral Training in Molecular Modelling and Materials
Science (CDTM3S) at UCL for the rigorous training they gave me during the first year
and the yearly industrial day invitation to present my research The opportunity to work
with sixth form students in the third year sponsored by CDTM3S was one of the most
rewarding experiences I had at UCL
My industrial sponsor Cambridge Crystallographic Data Centre (CCDC) has been
instrumental at every research stage The encouragement received after presenting my
work at the annual CCDC student day was invaluable My industrial supervisors at
CCDCndashndashAurora J Cruz-Cabeza (a year and a half) and Peter Galek (two and a half years)
ndashndashhave been instrumental in collaborative research and publications I appreciate their
insight energy time and encouragement during our many meetings
Finally this work would not be possible without the financial support from the CCDC
and the Engineering and Physical Science Research Council (EPSRC) under the
CDTM3S grant EPG0366751
List of Publications
6
List of Publications
1 Uzoh O G Cruz-Cabeza A J Price S L Is the Fenamate Group a
Polymorphophore Contrasting the Crystal Energy Landscapes of Fenamic and
Tolfenamic Acids Cryst Growth Des 2012 12 (8) 4230-4239
2 Spencer J Patel H Deadman J J Palmer R A Male L Coles S J Uzoh
O G Price S L The Unexpected but Predictable Tetrazole Packing in Flexible
1-Benzyl-1H-Tetrazole CrystEngComm 2012 14 (20) 6441-6446
I carried out all the computational work and prepared the manuscript
3 Uzoh O G Galek P T A Price S L Towards more Accurate Force Fields for
pharmaceutical molecules ndash Analysing the Conformational Energy Profiles of
Fenamates 2014 (Submitted)
Table of Contents
7
Table of Contents
Modelling Molecular Flexibility for Crystal Structure Prediction 1
Declaration 2
Abstract 3
Dedication 4
Acknowledgments 5
List of Publications 6
Table of Contents 7
List of Figures 11
List of Tables 18
List of Abbreviations 20
List of Symbols 21
Chapter 1 Introduction 22
11 Background 22
12 Scope and Outline of Thesis 26
Chapter 2 Theoretical Background 27
21 Overview 27
22 Intermolecular Forces 27
221 Pairwise Additivity 28
222 Physical Origin of Intermolecular Force 29
223 Long-range Interactions 30
224 Short-range Interactions 31
225 Penetration Energy and Charge Transfer 32
23 Modelling the Intermolecular Forces for Organic Molecules 32
231 Repulsion-Dispersion Potentials 33
232 Electrostatics Potential 34
24 Intramolecular Energy 36
25 Force Fields (Atomistic Modelling) 38
251 AMBER 41
252 CHARMM 42
253 Other Force Fields 42
254 The Limits of Current Force Fields 43
Table of Contents
8
26 The Fitting Routine 44
261 Linear Least Square Method 44
262 Subroutine for Solving Least Squares 46
27 Electronic Structure Methods 47
271 Hartree Fock Theory 48
271 Molecular Orbital Theory 48
272 Correlation Effects 49
273 Moslashller-Plesset Perturbation Theory 49
274 Density Functional Theory 50
275 The DFT-D Approach 51
28 Crystal Structure Prediction (CSP) 52
281 CrystalPredictor 54
282 CrystalOptimizer 55
283 Polarizable Continuum Model (PCM) 56
284 Other Approaches to Lattice Energy Minimisation 56
285 The Crystal Energy Landscapes 58
286 The Blind Tests 58
29 Crystal Structure Comparison 59
Chapter 3 An Informal Blind Test A Crystal Structure Prediction of 1-
Benzyl-1H-tetrazole 62
31 Introduction 62
311 Background 62
312 Experimental Determination of 1-Benzyl-1H-Tetrazole 63
313 Molecular Geometry of the Experimental Structure 63
314 Crystal Packing Weak Hydrogen Bonding 64
315 Overview of the Challenge 65
32 Computational Methodology 66
321 Conformational Analysis 66
322 Crystal Structure Prediction 66
33 Results and Discussion 67
331 Conformational Energy Grid 67
332 The CrystalPredictor Energy Landscape 68
333 The CrystalOptimizer and PCM Energy Landscapes 68
334 Did the Predicted Structure Really Match the Experimental 70
335 The Global Minimum Structure on the PCM Energy Landscape 71
336 Post Analysis Comparison of Structure with CSD 73
Table of Contents
9
34 Summary 76
Chapter 4 Is the fenamate group a polymorphophore Contrasting the crystal
energy landscapes of fenamic and tolfenamic acids 77
41 Introduction 77
411 Polymorphism and Polymorphophores 79
412 Conformations in known Crystal Structures 79
413 Experimental Data of FA and TA 80
414 Similarities between the known forms of FA and TA 83
415 Solving the Connectivity Problem of a Disordered Form 84
416 Overview 87
42 Computational Methods 87
421 Ab initio Conformational Profile of TA 87
422 CSD Survey for Fenamates 87
423 Crystal Structure Prediction 88
424 Experimental Crystal Structures with Z´ gt1 90
425 Comparison of Crystal Structures 90
43 Results 91
431 Dependence of Conformational Energy on Method 91
432 Consideration of H-bonded Torsion 92
433 CSD Survey of Fenamates 93
434 Validation of the CrystalOptimizer plus PCM Models 95
435 Energy Landscapes of Intermediate Steps 96
436 Finding and Explaining the Known Structures with CSP 97
437 Other Known Fenamates and their Hypothetical Structures 103
438 Update on a Recently Discovered Polymorph of TA 105
439 The Cost of Lattice Energy Minimisation 106
44 Summary 107
Chapter 5 The Origin of conformational energy barriers in Fenamates 109
51 Introduction 109
511 Background 109
512 Torsional Barrier for Ethane 110
513 Overview 113
52 Method 114
521 Determining Conformation Energy Scan for Isolated Molecule 114
522 Ab initio Conformational Energy Profiles for Fenamates 114
523 Investigation of Electronic Effects 115
Table of Contents
10
524 Investigation of the Steric (Non-Bonded) Effects 116
53 Results 117
531 Effect of Different Definitions of the Same Flexible Bond 117
532 Effect of Step Size on the Conformation Profile of Fenamate Molecule 119
533 Conformational Energy Profile of the Fenamates 122
534 Rigid Versus Relaxed Scans of Fenamates 124
535 Splitting electronic from steric contributions to the barrier to rotation 127
536 Estimating the Steric Contributions with an Atom-Atom Potential 130
537 Investigating the Important Interactions with Atom-Atom Potential 131
54 Discussion The Physical Origins of Torsional Potentials 133
55 Summary 134
Chapter 6 Toward New Force fields for Fenamate Molecules 136
61 Introduction 136
611 Background 136
612 A Case for Modelling Decoupled Intramolecular Energy 137
613 Analytical Models of Intramolecular Energies 138
614 Overview 138
62 Methodology Fitting Analytical Models to Conformational Profiles 139
621 Torsional Potential Model 139
622 AtomndashAtom Model 141
63 Results 144
631 Cosine Series Model 144
632 Rescaled Repulsion Model 146
633 Combined Physical Model 149
634 Transferability 154
64 Summary 157
Chapter 7 Conclusions and Future Work 158
71 Position of CSP in the Context of this Thesis 158
72 Towards more accurate force-fields for pharmaceutical molecules 159
73 Future Work 160
Appendix A 162
Contents of enclosed CD-ROM 162
Bibliography 163
List of Figures
11
List of Figures
Figure 11 Diagrammatic illustration of crystal structure prediction (CSP) methodology
23
Figure 12 A chemical diagram of a target molecule XX from the fifth blind test17 24
Figure 13 The chemical diagram of tolfenamic (TA) and flufenamic (FFA) acids 25
Figure 14 Polymorphs of ROY numbered in the order of discovery The polymorphs
have different colours melting points and molecular conformations (most pronounced in
the torsion angle θ) (Source Ref [20]) 25
Figure 15 Overlay of the experimental conformers of ROY viewed with the overlaid
nitrobenzene fragment horizontal (Source Ref [2]) 26
Figure 21 Typical intermolecular force potential energy functions for spherical atoms
28
Figure 22 Charge distributions corresponding to pure multipoles Blue portions
represent regions where the function is positive and yellow portions represents where it
is negative Qlk is the spherical harmonic multipole where l is angular momentum
quantum number and k = l l-1hellip -l specifies the component of the angular momentum
around the z-axis (Source httpenwikipediaorgwikiSpherical_harmonics [Accessed
11012015]) 35
Figure 23 Schematic representation of conformational change and conformational
adjustment (Source Ref [58]) 37
Figure 24 The schematic view of force field interactions Covalent bonds are solid lines
while the dotted line indicates non-bonded interaction (Source Ref [68]) 39
Figure 25 Schematic view of four key contributions to a molecular mechanics force
field These forces are bond stretching bond stretching angle bending torsional terms
and non-bonded interactions (Source Ref [63]) 39
Figure 26 Schematic view of the torsion angle ξ using the ethane molecule (Source
quantumwisecomdocumentsmanualsvnl-200810_Manualchapmolbuilderhtml
[Accessed 11012015]) 40
Figure 27 Schematic view of some of the common cross terms (Source Ref [63]) 43
Figure 31 The chemical diagram of BT determined from the crystal structure Torsion
angles 1=C7-C6-N1-C5 and 2 = C12-C7-C6-N1 62
Figure 32 The crystal structure of BT (a) Partial view of the crystal packing showing
close CH∙∙∙N contacts between a central tetrazole and six surrounding tetrazoles (b)
Partial view showing CH∙∙∙N CH∙∙∙C and CH∙∙∙ contacts 64
Figure 33 BT crystal structure (a) View of the infinite S-shaped layers held together by
weak CH∙∙∙N and CH∙∙∙C H-bonds (b) Partial view of the layer structure showing
List of Figures
12
alternative B(benzyl) and T(tetrazole) layers and the repeating layer sequence [BTBT |
TBTB] 65
Figure 34 The conformational energy grid used in the search Relative intramolecular
energies ΔEintra (kJ mol-1) for isolated molecule calculations at the MP26-31G(d p)
level of theory 67
Figure 35 The CrystalPredictor energy landscape of BT generated with a crude lattice
energy model The generated structure that matched the experimental structure is
highlighted in the open red symbol 68
Figure 36 (a) The CrystalOptimizer (step 3) and (b) PCM (step 4) energy landscape
of BT GM is the global energy minimum The open red symbol represents a match
between the experimental crystal structure and the generated structure The energy
ranking of the crystal structure that matches the experimental has improved from fourth
most stable 4 to second most stable 2 69
Figure 37 The 15-molecule overlay between the experimental (atomic colours) and the
second most stable computed structure 2BT_23 (green) The direction of the view
obscures some of the molecules 71
Figure 38 Crystal Packing Similarity between experimental (grey) and the most stable
predicted structure (1BT_120 green) with only 2 molecules matching (RMSD2 = 1072
Aring) 72
Figure 39 The structure corresponding to the global minimum in lattice energy
(1BT_120) showing the dominant weak H-bonds (Aring) eight of type CH∙∙∙N and one
CH∙∙∙C and the weak ∙∙∙ interaction (benzylmiddotmiddotmiddotbenzyl) 72
Figure 310 Query used in Conquest to search the CSD for similar fragments 73
Figure 311 Histograms showing the bond length distributions of 32 1-susbtituted 1H-
tetrazole rings in the CSD The red square denotes the experimental bond lengths in BT
while the black square denotes the ab initio bond lengths in the corresponding calculated
structure 2BT_23 74
Figure 312 Histograms showing the distributions of the torsions and angles of the 32-
tetrazole rings found during the CSD survey The experimental bond length in BT is
denoted by the red square while the ab initio bond length in the corresponding calculated
structure 2BT_23 is denoted by the black square 75
Figure 41 The polymorphophore families of ROY and fenamic acid The numbers of
polymorphs in the Cambridge Structural Database (CSD) follow the refcodes for each
specific molecule and (x) denotes the number of additional polymorphs that whose
crystal structures were not available The lowest two rows are fenamates whose structures
are used in Table 46 78
Figure 42 Overlay of the experimental conformers of FA (top) and TA (bottom) viewed
with the overlaid benzoic acid fragment arranged horizontal FA QQQBTY02 (Z´=2
light blue and magenta) TA KAXXAI01 (Form I Z´=1 blue) KAXXAI (Form II Z´=1
red) KAXXAI02 (Form III Z´=2 green and purple) KAXXAI03 (Form IV Z´=3
yellow brown (obscured by yellow) and black) and KAXXAI04 (Form V Z´=1
disordered on both sites (section 415) violet and grey) The arrows point to the main
List of Figures
13
variation (ξ1) between the conformers of FA and TA in the experimental crystal
structures 80
Figure 43 Temperature dependence of the enthalpy (H) and free energy (G) diagrams
for forms I and II of TA showing a monotropic (top) relationship from data from
Surov201 which are qualitatively the same as data from Andersen199 and an enantiotropic
(bottom) relationship from data from Mattei and Li200 82
Figure 44 Features of the experimental crystal structures (a) The hydrogen-bonded
dimer motif found in all structures with variations in the phenyl ring orientations (ξ1)
The specific illustration shows the packing similarity between FA (QQQBTY02) and TA
form II (KAXXAI) (b) The unique packing of TA form II with short contacts between
chlorine and the aromatic ring (c) Crystal Packing Similarity between form III and form
IV of TA showing the 11-molecule overlay which includes only two dimers 84
Figure 45 (a) Crystal structure KAXXAI04 of form V of TA (b) The atom connectivity
of the two new components (colour red and blue) the original C-N connectivity is
labelled green (c) Chemical diagram showing the atomic connectivity of TA 85
Figure 46 Ordered Z=2 crystal structures formed from the disordered components of TA
form V (a) Form V_a (b) Form V_b and (c) Form V_c 86
Figure 47 Query fragment and the torsion angle ξ1 measured in the Conquest207 survey
of the CSD structures There were 131 organic structures where Y=H and 94 where Yne
H 88
Figure 48 The fragment used in the CrystalPredictor search for TA Each fragment was
kept rigid during the search for hypothetical crystal structures 89
Figure 49 The degrees of freedom optimized by CrystalOptimizer for crystal structures
of FA and TA (ξ1equiv C7-N1-C8-C9 ξ2equiv C2-C7-N1-C8 ξ3equiv O1-C1-C2-C7 ξ4equiv H1-O1-C1-C2
and ξ5equiv C8-C13-C14-H10 θ1equiv H6-N1-C8 θ2equiv H1-O1-C1) 89
Figure 410 The relative conformational energy of isolated TA molecules as a function
of the ξ1 The MP2 and PBE0 method at 6-31G(dp) basis set compared with the other
method (top) and the other basis sets (bottom) for the PBE0 method 91
Figure 411 The relative conformational energy as a function of the ξ2 (Figure 49) for
FA and TA calculated at the PBE06-31G(dp) level of theory 92
Figure 412 The relaxed conformational energy scan of FA and TA as a function of ξ1 at
the PBE06-31+G(d) level of theory (a) Includes the experimental values of ξ1 marked
for TA and FA with the symmetry equivalent FA conformations denoted by open black
squares and an insert diagram showing the steric hindrance for TA in the high-energy
region A histogram of (b) 131 crystal structures found in the CSD search (Figure 47)
with Y=H plus symmetry equivalent structures and (c) 94 crystal structures with YneH
94
Figure 413 Crystal energy landscape of TA for the Z´=1 structure after (a)
CrystalPredictor (Step 1) (b) the single conformer calculation of Eintra and the atomic
multipoles at the PBE06-31G(dp) level of theory (Step 2 of section 423) 96
Figure 414 The crystal energy landscapes of FA (top) and TA (bottom) Each symbol
represents a crystal structure of the specified space group which is a minimum in the
List of Figures
14
lattice energy (calculated within the polarizable continuum) The open symbols
correspond to the minima starting from the experimental structures (Table 43) The
packing coefficient is the proportion of the cell volume occupied by the molecule214
calculated using a grid spacing of 01 Aring 98
Figure 415 (a) Overlay of the only known form of FA (grey) and the most stable
structure on the Z´=1 crystal energy landscape (Figure 414a) 1FA_22 (green) with an
RMSD5 value of 175Aring (b) Overlay of the conformers of form I (pink and light blue) and
1FA_22 (black) 100
Figure 416 (a) Overlay of the two most stable hypothetical crystal structures on the
crystal energy landscape global minimum 1FA_22 (grey) and 2FA_2 (green) with
ΔElatt=20 kJ mol-1 The crystal structures overlaid 12 molecules with RMSD12 of 051 Aring
and the conformations had an RMSD1 of 009 Aring (b) Overlay of 2FA_2 (green) and the
experimental crystal structure of FA (grey) with a RMSD15 of 123 Aring obtained with a
distance and angle tolerance of 50 and 50deg (c) Overlay of the two independent
molecules in the experimental structure (grey) with 2FA_2 (green) 101
Figure 417 The overlay of the experimental Z´=1 crystal structures (grey) of TA with
the closest structure found in the search (green) (a) Form I and 1TA_8 overlaid with an
RMSD15 value of 032Aring (b) Form II and 5TA_38 overlaid with an RMSD15 value of
026Aring 102
Figure 418 Classification of the crystal energy landscape of FA in terms of the similarity
of the structures to those of known TA polymorphs (I-IV) without PCM (hence the
different y-axis compared to Figure 414a) Numbers in bold indicate the number of
molecules that overlay with the known structure of FA Hence a label 5 6 on a structure
represented by a blue circle means that the structure overlaid 5 molecules with the
experimental form of FA but 6 with form I of TAEach point is coloured by the TA
polymorph with which it overlaid the greatest number n of molecules in a Crystal Packing
Similarity calculation that ignored the CH3 and Cl 103
Figure 419 Overlay of FA_137 (green) and the major component of experimental
crystal structure of TA form VI (grey) with a RMSD15 of 030 Aring obtained with a distance
and angle tolerance of 50 and 50deg 106
Figure 420 CPU timings of (a) 38_TA (form II) and (b) 137_TA (form VI section
438) after lattice energy minimisation using CrystalOptimizer (step 3) 107
Figure 51 The fenamate family showing the low barrier torsion angle (=C7-N1-C8-C9)
=0 when the aromatic rings are coplanar as drawn The fenamates family mentioned in
this chapter includes fenamic acid (FA) R1= R2= H tolfenamic acid (TA) R1= CH3 R2=
Cl mefenamic acid (MA) R1= R2= CH3 clofenamic acid (ClFA) R1=H R2=Cl and
flufenamic aid (FFA) R1=H R2=CF3 The dotted line represents an intramolecular
hydrogen bond 109
Figure 52 Illustration of the barrier to rotation with the relaxed conformational energy
profile of FA 110
Figure 53 The staggered and eclipsed conformations of the ethane molecule (Sources
Ref [222] and enwikipediaorgwikiAlkane_stereochemistry [Accessed 11012015])
111
List of Figures
15
Figure 54 (a) Hyperconjugation effects on the staggered (b) Pauli exchange repulsion
in the eclipsed conformation (Source enwikipediaorgwikiHyperconjugation
[Accessed 11012015]) 112
Figure 55 Electrostatic steric repulsion (between electrons on the bond black arrow) for
the eclipsed conformation of ethane The red arrow indicates exclusion of van der Waals
repulsion since the van der Waals radii of the hydrogen are too small to make contact
(Source enwikipediaorgwikiConformational_isomerism [Accessed 11012015]) 113
Figure 56 Chemical diagram of model molecules used to investigate the electronic
contributions The bonds around N1 are constrained to be planar (ie R2-N1-H6-C8=180deg)
for phenylamine (PA) R1=R2=H N-methylaniline R1=H R2= CH3 N-vinylaniline R1=H
R2 = CH=CH2 and 3-anilinoprop-2-enoic acid R1=H R2 = CH=CHCO2H for 3-
chloroaniline R1= Cl R2=H and 3-methylaniline R1=CH3 R2=H (=R2-N1-C8-C9) 115
Figure 57 Pyramidalization in unconstrained phenylamine (PA) molecule caused by
lone pair on nitrogen atom 115
Figure 58 Relaxed scan of TA at the PBE06-31+G(d) level of theory with the different
definitions of flexible N1-C8 bond (= C7-N1-C8-C9 2= C7-N1-C8-C13
3=H6-N1-C8-C9
and 4= H6-N1-C8-C13) used as the constrained geometric parameter 118
Figure 59 Molecular conformation of the relaxed gas phase at PBE06-31+G(d) showing
the bond lengths of the phenyl C-C bond (=180) of FA 120
Figure 510 Relaxed scans of FA at PBE06-31+G(d) with step sizes 2 and 1deg around the
maxima and minima respectively The red circles indicate the starting points of the scans
while the arrows indicate the directions of the scans 121
Figure 511 Relaxed conformational scans at the PBE06-31+G(d) level of theory for the
fenamates The minima were at ξ=3894deg and 14471deg for FA 4063deg and 11186deg for
TA 4408deg and 11048deg for MA and 3586deg and 14838deg for ClFA 122
Figure 512 Relaxed conformational scans of fenamates (a) FA (b) TA (c) MA and (d)
ClFA at HF and PBE0 method with 6-31+G(d) basis set These are contrasted with the
single-point energies at the MP26-31+G(d) level and within a polarizable continuum
model (PCM) with =3 for the PBE06-31+G(d) conformations 123
Figure 513 Comparison of relaxed (solid) and rigid (dotted line) scan of FA (top) TA
(middle) and MA (right) For the rigid scans calculations were performed using HF MP2
and PBE0 methods with 6-31+G(d) basis set as a function of torsion angle The relaxed
scans from Figure 511 were performed at the PBE06-31+G(d) level of theory 125
Figure 514 Overlay of relaxed (coloured by element Figure 511) and rigid (red Figure
513) conformations of FA (top) TA (middle) and MA (bottom) overlaying the atoms
defining the ξ torsion angle at the PBE06-31+G(d) level of theory 126
Figure 515 The solid black lines show the relaxed torsional scans of planar-N-
constrained models for the phenyl rotation (Figure 56) where the benzoic acid group of
FA has been replaced by (a) hydrogen atom (PA) (b) methyl (c) vinyl and (d) prop-2-
enoic acid and the hydrogen in the meta position of PA has been replaced by (e) chlorine
and (f) methyl using HF PBE0 and MP2 methods with the 6-31+G(d) basis set Plots of
(h2)(1-cos(2)) where h is the height of the barrier of relaxed PBE06-31+G(d) scans
List of Figures
16
are shown in green For (c)-(f) the PBE06-31+G(d) relaxed scans of PA from (a) are
shown in grey for comparison In (a) and (b) a rigid scan at the PBE06-31+G(d) level of
theory is shown by a dotted line 127
Figure 516 The electron density surface of HOMO frontier orbitals for different
conformations of PA (top) FA (middle) and TA (bottom) obtained from the PBE06-
31+G(d) level of theory Contour map isovalues were drawn at a 002 au level 129
Figure 517 Alternative HOMO isosurface view of (a) FA and (b) PA molecule at =90
from Figure 516 129
Figure 518 HOMO-10 (46 MOs) isosurface view of side (top) and front (bottom) FA
molecule at =0 40 and 90 130
Figure 519 Comparison of the ab initio (black) intramolecular energy scans at the
PBE06-31+G(d) level of theory for FA (top) and TA (bottom) with Gavezzottirsquos exp-6
intramolecular energy models summed over all intramolecular atom-atom distances from
the third nearest neighbour (1-4) and above The net effect (purple) is subdivided into the
repulsive (red) and dispersion (blue) contributions 131
Figure 61 The fenamate family showing the low-barrier torsion angle (=C7-N1-C8-C9)
and atomic numbering =0 when the aromatic rings are coplanar as drawn The
fenamates mentioned in this chapter are fenamic acid (FA) R1= R2= H tolfenamic acid
(TA) R1= CH3 R2= Cl mefenamic acid (MA) R1= R2= CH3 flufenamic acid (FFA) R1=
H R2= CF3 and clorofenamic acid (ClFA) R1=H R2=Cl The dotted line represents an
intramolecular hydrogen bond 137
Figure 62 Relaxed conformational scans at the PBE06-31+G(d) level of theory for the
fenamates from section 533 Fenamic acid (FA) tolfenamic acid (TA) mefenamic acid
(MA) and chlorofenamic acid (ClFA) 137
Figure 63 An algorithm showing the overview of modelling ab initio intramolecular
energy using a cosine series potential The source codes are included in the CD ROM
attached to this thesis (see Appendix A) 140
Figure 64 An algorithm showing the modelling of ab initio intramolecular energy by a
physical potential The source codes are included in the CD ROM attached to this thesis
(see Appendix A) 141
Figure 65 Comparison of the ab initio relaxed scan at the PBE06-31+G(d) level of
theory with linearly fitted least square cosine series model for FA (top) and TA (bottom)
with Nk=5 (red lines) the optimal cos4 terms (blue lines) and Nk=21 (green lines σintra
=017 kJ mol-1 for FA and TA) 145
Figure 66 Plot of the standard error of the intramolecular energies against the number of
cosine terms Nk for FA (top) and TA (bottom) The fit is ill-determined ie there is no
unique solution for TA after Nk=21 146
Figure 67 Comparison of the relative energies from ab initio calculations (solid black
lines) of FA (top) and TA (bottom) with selected best-fit exp-6 rescaled repulsion models
For FA the selected Nk=3 intra=032 kJ mol-1 model had βC-H=-453 βH-H=270 and
Ebase=-506 while the Nk =4 intra=027 kJ mol-1 model had βCH=-446 βH-H=210 βH-
List of Figures
17
HB=257 and Ebase=-875 For TA the selected Nk=6 (intra=034 kJ mol-1) and 10
(intra=022 kJ mol-1) parameter fits are shown bold in Table 63 147
Figure 68 Gavezzotti exp-6 potential for all atomndashatom interactions in fenamates
displayed in two different energy scales The parameters are from Chapter 5 (Table 52)
150
Figure 69 Comparison of the relative energies from ab initio calculations (solid black
lines) of FA (top) and TA (bottom) with selected physical models For FA the selected
Nk=6 intra=026 kJ mol-1 model has βC-HB =801 γC-HB =1654 βH-H =1074 γH-H =58 α=-
339 and Ebase=-12383 whilst the Nk =6 intra=028 kJ mol-1 model has β C-H =028 γ C-
H =783 β H-HB = 1109 γ H-HB =3479 α=-117 and Ebase=-7549 For TA parameters for
the selected Nk=8 (intra=015 kJ mol-1) and 10 (intra=008 kJ mol-1) are in ghTable 66
153
Figure 610 Comparison of the relative energies from ab initio calculations (solid black
lines) with models using transferred βικ and γικ parameters from FA and TA (dotted grey
plots) to ClFA (top) and MA (bottom) respectively The red curve has only had the
baseline adjusted whereas the blue curve had the parameter refitted to ClFA or MA
respectively The transferred FA parameters are those Nk=6 fit=028 kJ mol-1 in Figure
69 while those of TA Nk= 10 fit= =026 kJ mol-1 are shown in iTable 66 155
Figure 611 Comparison of the relative energies from ab initio calculations (solid black
lines) with models using βικ and γικ parameters transferred from TA (dotted grey plots) to
(a) FA and (b) ClFA The red curve has only had the baseline adjusted whereas the blue
curve has the parameter refitted to FA or ClFA respectively The transferred TA
parameters are those of Nk= 10 fit= 026 kJ mol-1 as shown in iTable 66 156
List of Tables
18
List of Tables
Table 31 Angles and bond lengths of the tetrazole ring in BT No information about the
bonds or angles were given to me prior to submission of the candidate structures 64
Table 32 Summary of experimental (highlighted in blue) and computed crystal
structures on the PCM energy landscape (Figure 36) The computed structure that
matched the experimental structure (section 312) is highlighted in bold For label
xBT_y x and y are energy ranked after steps 4 and 1 of CSP respectively (section 322)
70
Table 41 The experimental data of the known forms of FA and TA Crystal structures
and Hfus values were taken from ref [19] unless otherwise specified aThe most widely
varying torsion angle ξ1 is defined in Figure 49 bTemperature of crystal structure
determination cMelting temperature 81
Table 42 Quantification of the similarities of FA and TA crystal structures showing the
packing similarity (RMSDn) and powder X-ray diffraction (PXRD) similarity206 The
bold numbers indicate the number of molecules n that match within distance and angle
tolerances of 20 and 20deg respectively with the RMSDn values in brackets See section
425 83
Table 43 Comparison of the lattice energy minimum with the experimental structure
used as a starting point for the final lattice energy model (PBE06-31+G(d) PCM) for
the ordered structures of FA and TA The three form V Z=2 model structures derived
from the disorder components of TA (section 415) are also compared with the starting
model RMSDn corresponds to n=15 unless (n) is given 95
Table 44 The lattice energy minima of FA shown in Figure 414a The minimum found
starting from the experimental structure is in bold 99
Table 45 The lattice energy minima of TA shown in Figure 414b Minima found starting
from the experimental structures or ordered models are in bold 99
Table 46 Crystal Packing Similarity comparisons of the experimental structures of FA
and TA and their most stable hypothetical crystal structures with the crystal structures of
the other fenamates shown in Figure 13 The similarity is given in the form n(RMSDn)
with n gt 4 molecules highlighted 104
Table 47 An extension of Table 46 showing Crystal Packing Similarity comparisons of
the latest structures of flufenamic acid18 and the experimental structures of FA and TA
and their most stable hypothetical crystal structures 105
Table 48 Crystal Packing Similarity calculations of the known forms of TA and
unobserved thermodynamically competitive crystal structures The similarity between
the structures is given in the form n(RMSDn) where n is the number of molecules overlaid
and the value in brackets is the RMSDn overlay Structures with the highest similarity are
highlighted 105
Table 51 Torsional barrier height of ethane (Source Reproduced from Ref [223]) 111
List of Tables
19
Table 52 Gavezzottirsquos exp-6 atom-atom parameters E=Aexp(-BR)-CR-6 is the well
depth and Rm is the distance at the minimum41231232 Italics represent the hydrogen-
bonded interactions aFrom the UNI intermolecular potential function of Mercury233 116
Table 53 Torsional barrier height of the relaxed conformational energy profiles in Figure
58 for TA 119
Table 54 Comparison of intramolecular energies and hydrogen bond distances of TA for
the near-planar conformer 119
Table 55 Comparison of the intramolecular energies and the N-H7∙∙∙HX-C14 bond
distances of TA for the near-planar conformer where HX-C14 is the methyl group 119
Table 56 Atom-atom interactions of FA that dominate the intramolecular energies as
estimated using Gavezzottirsquos exp-6 potential The interaction is listed as dominant if the
difference between the minimum and maximum total energy (Erepul-dis) is greater than or
equal to 1 kJ mol-1 132
Table 57 Atom-atom interactions of TA that dominate the intramolecular energies as
estimated from Gavezzottirsquos exp-6 potential The interaction is listed as dominant if the
difference between the minimum and maximum total energy (Erepul-dis) is greater than or
equal to 1 kJ mol-1 dInteractions between atoms on the same aromatic ring fInteractions
involving the methyl substituent 132
Table 61 Contrasting the atomndashatom interactions of FA and TA that dominated the
intramolecular energies formed by combining Table 56 and Table 57 from Chapter 5
Interactions unique to FA and TA are coloured blue and red respectively dInteractions
between atoms of the same aromatic ring fInteractions involving the methyl substituent
143
Table 62 Complete set of results after rescaling Nk (repulsion contributions and
baseline energy Ebase) parameters of various interacting atomic types for FA 148
Table 63 Summary table of the best results after rescaling Nk (repulsion contributions
and baseline energy Ebase) parameters of various interacting atomic types for TA
148
Table 64 All fits obtained for FA with the physically correct sign for the repulsion
and dispersion and electronic parameters 149
Table 65 The rescale parameters for the repulsion ικ dispersion ικ and electronic
contributions of the physical exp-6 and cos2 model for all possible combinations of atom
type interactions C∙∙∙C C∙∙∙H C∙∙∙HB H∙∙∙H and H∙∙∙HB for FA Nk are the number of
fitted rescale parameters ικ and ικ and the baseline energy Ebase 151
Table 66 The rescale parameters for the repulsion ικ dispersion ικ and electronic
contributions of the physical exp-6 and cos2 model for all possible combinations of atom
type interactions C∙∙∙C C∙∙∙Cl C∙∙∙H C∙∙∙HB Cl∙∙∙H C∙∙∙N H∙∙∙H and H∙∙∙HB for TA Nk
are the number of fitted rescale parameters and Ebase is the baseline energy ghThe
parameters used in Figure 69b and ifor testing transferability in Figure 610b and Figure
611 152
List of Abbreviations
20
List of Abbreviations
CCDC Cambridge Crystallographic Data Centre
CSP Crystal Structure Prediction
API Active Pharmaceutical Ingredient
DFT Density Functional Theory
HFSCF Hatree ForkSelf Consistent Field
PBE Perdew Burke and Ernzerhof exchange-correlation functional
B3LYP Becke three-parameter Lee-Yang-Parr
MP-n Moslashller-Plessett nth order of pertubabtion
PCM Polarizable Continuum Model
DMA Distributed Multipole Analysis
GDMA Gaussian Distributed Multipole Analysis
BT 1-Benzyl-1H-Tetrazole
FA Fenamic Acid
TA Tolfenamic Acid
PA Phenylamine (Aniline)
n-MA N-Methylaniline
MA Mefenamic Acid
List of Symbols
21
List of Symbols
Flexible torsion angle
Np Number of data points
Nk Number of fitted coefficients
Na Number of atoms
Xij Regressors i = 1hellip Np j = 1hellip Nk
Yi Regressand i = 1hellip Np
Elatt Lattice energy
Eintra Intramolecular energy relative to the most stable conformation
Uinter Intermolecular energy
11 Background
22
Chapter 1 Introduction
ldquoMay the Force be with yourdquo
mdash General Dodonna Star Wars A New Hope
11 Background Polymorphism the ability of a molecule to crystallise or pack in more than one
structural form1 is a phenomenon that though common is not completely understood
The phenomenon which has been the subject of long and extensive research is of crucial
importance in many branches of the chemical industry Most of all in the pharmaceutical
industry because polymorphs can show significant differences in properties such as
solubility and dissolution rate2 which in turn affect the bioavailability of drug
formulations as well as their melting point physicochemical stability and mechanical
properties3
Researchers recognise that the polymorphic differences among molecules can be
exploited to take advantage of better compactibility or powder flow rate In addition a
thermodynamically metastable form may be chosen to improve drug administration as
such a form may have a higher dissolution rate than a more stable polymorph3 A third
reason for the increasing industrial interest in polymorphism is the need to protect
intellectual property as different patents can protect the different polymorphs of an active
pharmaceutical ingredient (API)
Polymorphism is common with about one-third of all APIs confirmed to be
polymorphic4 yet not so long ago the concept of polymorphism was either treated as an
annoyance or completely ignored by academics The dismissive attitude changed after the
sudden emergence of a new polymorph of the drug ritonavir a protease inhibitor for the
HIV virus Production had to stop as Abbott Laboratories (the manufacturer) was forced
to embark upon an expensive reformulation of the drug The more stable polymorph of
the API was discovered after capsules suddenly started failing dissolution tests two years
after the drug had been launched on the market5 The ritonavir incident taught the
pharmaceutical industry that the best insurance against such surprises is to conduct an
exhaustive experimental search before going to market6 a view that has since led to
regulations requiring extensive screening and process control for polymorphs in APIs and
inactive pharmaceutical ingredients 7
11 Background
23
The unexpected emergence of the new ritonavir polymorph despite proactive attempts
to discover polymorphs before the drug was marketed forcibly reminded us that
metastable polymorphs can appear to be kinetically stable1 If Abbot Laboratories had
computed the energies of possible polymorphs for ritonavir before marketing the drug
the company may have been able to prevent a multi-million dollar problem As Graeme
Day6 noted lsquocomputational methods of predicting crystal structures could play a large
part in this research both in identifying all possible polymorphic forms and judging their
relative stabilities ndash an examination and evaluation of all possible crystal structures of a
given compound is a step towards the understanding and perhaps control of
polymorphismrsquo Given the ubiquity and importance of polymorphs it is clear that
researchers need a computer tool that is capable of postulating possible crystal structures
of organic molecules before synthesis especially since a ldquostandardrdquo experiment that
guarantees the finding of all crystalline forms is impossible89
Crystal Structure Prediction (CSP Figure 11) is the ability to predict using
computational methods how a molecule will crystallise (ie unit cell space group and all
atomic positions) given only its chemical diagram10-12 CSP has been a long-standing
goal in computational materials chemistry for its potential to predict possible polymorphs
CSP is vital to the pharmaceutical industry because a successful search method would
smooth the process of manufacturing and patenting crystalline products13
Figure 11 Diagrammatic illustration of crystal structure prediction (CSP) methodology
11 Background
24
The international blind tests14 organised by the Cambridge Crystallographic Data
Centre (CCDC) is a collaborative effort that charts the progress and state of the art in
predicting the crystal structures of small organic molecules Since the first blind test in
1999 there have been five more challenges issued by the CCDC and Figure 12 shows
how complex the target molecule can be The sixth and most recent blind test15 was issued
on September 1 2014 Scientific insight can be gained from successful CSP studies as
these methods reflect the factors that control the crystallisation process16
Figure 12 A chemical diagram of a target molecule XX from the fifth blind test17
Most CSP methodologies as we shall see in section 28 assume that the experimentally
observed crystal structures are the most stable thermodynamic structures on the crystal
energy surface In other words the temperature effects are ignored because of poor
thermal results obtained in the past for organic molecules Therefore a better method is
needed for computing the thermal effects of organic molecules This thesis takes the first
step towards accurate thermal effects calculations and Molecular Dynamics simulations
by deriving new force fields that accurately model the intramolecular energies These
discoveries on thermal effects will advance polymorph prediction
Conformational flexibility is an important property to consider when generating
hypothetical crystal structures for a flexible molecule The modelling of conformation
flexibility is the central theme of this thesis because in many organic molecules the
flexibility leads to polymorphism For example flufenamic acid18 (FFA Figure 13) a
non-steroidal anti-inflammatory drug (NSAID) has nine known polymorphs Another
NSAID tolfenamic acid19 (TA Figure 13) has five polymorphs while ROY (Figure
13) named after its red orange and yellow crystals (Figure 14) has ten known
polymorphs2021
11 Background
25
FFA1822 TA19 ROY20
Figure 13 The chemical diagram of tolfenamic (TA) and flufenamic (FFA) acids
Figure 14 Polymorphs of ROY numbered in the order of discovery The polymorphs
have different colours melting points and molecular conformations (most pronounced in
the torsion angle θ) (Source Ref [20])
Just like FFA and TA the wide range of values for the torsion angle is also present in
ROY (Figure 15) Therefore the origin of polymorphism in these compounds is partly
due to the conformational flexibility of the molecules (see Figure 15 and the red curly
arrows in Figure 13) FFA TA and ROY are also examples of organic compounds that
are considered polymorphophores1923 A polymorphophore is a structural element that
favours the formation of polymorphic crystal forms when incorporated into a molecule
ie molecules with similar fragments are likely to be polymorphic Consequently
conformational flexibility polymorphism and polymorphophore are linked
12 Scope and Outline of Thesis
26
Figure 15 Overlay of the experimental conformers of ROY viewed with the overlaid
nitrobenzene fragment horizontal (Source Ref [2])
12 Scope and Outline of Thesis Chapter 2 examines the theoretical methods relevant to the work presented in this thesis
I will discuss these in several parts intermolecular forces and their models intramolecular
forces electronic structure methods force field methods least square estimation CSP
and crystal structure comparisons Chapters 3 to 6 contain the original work of this thesis
A CSP algorithm CrystalPredictor version 16 is used in Chapters 3 and 4 This
algorithm generates crystal structures while simultaneously varying the low-energy
barrier torsion angles of the flexible molecule Chapter 3 tests the ability of CSP to predict
the crystal structure of the flexible 1-benzyl-1H-tetrazole molecule This chapter is an
informal lsquoblind testrsquo challenge Following this Chapter 4 examines the polymorphophore
concept by investigating two flexible fenamates that are similar but have different
polymorphic behaviours I use CSP and compare the two fenamatesrsquo crystal energy
landscapes Then Chapter 5 investigates the origin of the barrier to rotation of fenamate
molecules Chapter 6 develops new analytical force field models that fit the
intramolecular energy of flexible fenamate molecules as the conformation changes This
chapter investigates three analytical forms the cosine series rescaling repulsion and
combined physical models Finally Chapter 7 offers conclusions and suggests areas for
further research and development
21 Overview
27
Chapter 2 Theoretical Background
ldquoA people without the knowledge of their past history origin and culture is like a tree
without rootsrdquo
mdash Marcus Garvey
21 Overview This chapter discusses the theoretical methods that are relevant to the work completed
in this thesis Central to this research is the evaluation of the lattice energy Elattndashndashthe
sum of the intermolecular energy Uinter and the intramolecular energy ΔEintrandashndashof a
flexible organic molecule Thus section 22 sets out the physical basis for the lattice
energy model by introducing the origin of intermolecular forces Section 23 then
discusses the models of intermolecular contributions of organic molecules Section 24
provides a brief discussion of intramolecular forces because Chapters 5 and 6 investigate
the origin of and derive an analytical model for the intramolecular energies of flexible
molecules Next section 25 discusses some force field methods by way of laying a strong
foundation for the new analytical force fields derived in Chapter 6 After this section 26
discusses the fitting routines coded into the new analytical intramolecular force fields for
flexible organic molecules Section 27 highlights the theoretical background of the
electronic structure methods used to calculate the intramolecular energy of isolated
molecules (Chapters 3 to 5) and the electrostatic contribution to intermolecular energy
(Chapters 3 and 4) Section 28 further discusses Crystal Structure Prediction (CSP)
which was introduced in Chapter 1 Finally section 29 discusses various tools for crystal
structure comparison
22 Intermolecular Forces This section discusses the importance relevance origin and categories of
intermolecular forces The intermolecular force is fundamental in the evaluation of lattice
energy which is central to CSP studies (section 28) in Chapters 3 and 4 Intermolecular
forces are present everywhere in nature and control properties of gases liquids solids
and complexes In science the quantitative study of intermolecular forces can reconcile
diverse phenomena at the atomic and increasingly electronic level24 In pharmaceutical
industries the use of intermolecular forces as a computational tool for predicting new
polymorphs is necessary because of the experimental problems in establishing all
polymorphs that could be manufactured in a controlled way This is essential in
22 Intermolecular Forces
28
preventing another ritonavir disaster (section 11) where a new thermodynamically stable
polymorph started precipitating out of the anti-HIV drug25
Figure 21 Typical intermolecular force potential energy functions for spherical atoms
The intermolecular pair potential U is the interaction energy of a pair of molecules as
a function of their separation R and orientation This definition applies to rigid
molecules Intermolecular forces are repulsive at short-range and attractive at long-range
Liquids and solids exist because molecules attract one another when they are far apart26
The fact that water has a definite density meaning it cannot be easily compressed to a
smaller volume shows that at short-range the forces between the molecules become
repulsive26 The relationship between this energy of interaction U as a function of
distance R takes the form shown in Figure 21 Figure 21 has an attractive region at
long-range where the force is negative and a steep repulsive region at short-range to
account for the low compressibility of condensed materials
221 Pairwise Additivity Due to the difficulty and computational expense of modelling intermolecular
interactions this thesis makes some approximations to the sum of the intermolecular
energies One such approximation is the pairwise additivity which assumes that the
energy of a system is the sum of all two-body interactions26 For instance for three
molecules A B and C the pairwise approximation to the total energy is UAB+UBC+UAC
22 Intermolecular Forces
29
222 Physical Origin of Intermolecular Force The significant forces between molecules have an electromagnetic origin27 Strong and
weak nuclear forces do not contribute to the intermolecular force because they are
significant over a range of the order of 10-4 nm this is extremely small compared to
molecular dimensions which are typically 05 nm The gravitational force which is long-
range does not contribute to the intermolecular force because the gravitational potential
energy of two atoms 04 nm apart is only 7 x 10-52 J some thirty orders of magnitude
smaller than the typical intermolecular force28 Consequently the intermolecular forces
have an electromagnetic origin
The work reported in this thesis will focus on closed-shell ground state molecules
Resonance interactions do not occur between ordinary closed-shell molecules in their
ground state Magnetic interactions are several orders of magnitude smaller and are not
significant to the intermolecular forces Therefore these two contributions will not be
considered any further
Intermolecular forces are of quantum mechanical origin and can in principle be
determined by solving Schroumldingerrsquos equation and using the Born-Oppenheimer
approximation (ie nuclei are in fixed positions) The physical origin of the
intermolecular force from perturbation theory is as follows
4
a b
a A b B o ab
e eH
r
21
where ea is the charge on particle a one of the particles of molecule A and rab is the
distance between it and the particle b in molecule B The Hʹ is the perturbation on HA +
HB and consists of electrostatic interactions between the particles of a (electron and
nuclei) and those of b
The intermolecular force F and intermolecular energy U are related
U
FR
22
where R is the distance between the spherical molecules
When considering the intermolecular potentials it is helpful to separate various
contributions These contributions of intermolecular energy can be separated into two
Perturbation theory finds approximate solution to problem by starting from the exact
solution of a related problem It is can be used for describing intermolecular forces
because they are relatively weak
22 Intermolecular Forces
30
main types short-range and long-range interactions Israelachvili29 argued against
making this distinction due to the danger of counting twice which can happen in
theoretical analysis when forces with the same physical origin are both short-ranged and
long-ranged
223 Long-range Interactions If the interacting molecules are far enough apart ie long-range then the perturbation
theory becomes simpler because the overlap between the wavefunctions of the two
molecules can be neglected This is called the polarization approximation which was
first formulated by London30 in 193631 Three main types of long-range interactions exist
electrostatic induction and dispersion These long-range contributions vary by R-n
Electrostatic
The electrostatic force is a classical Coulombic interaction which arises from the
interaction between the static charge distributions of two molecules This force can be
attractive or repulsive but is strictly pairwise additive and dependent on orientation
Therefore the electrostatic force plays an important role in determining the structure
adopted by the solid state If ρA(r) is the charge density for molecule A then equation 21
becomes
3 3
00
( ) ( )d d 0 0 0 0
4
A BA B A B
o
H W
r r
r rr r
23
The first-order energy described the electrostatic interaction The electrostatic
expression in equation 23 is the exact classical Coulombic interaction energy of two
molecular charge distributions at long-range
Induction
The induction effects a second-order energy arise from the distortion of a particular
molecule in the electric field of all its neighbours and are always attractive These effects
are non-additive because the fields of several neighbouring molecules may reinforce or
nullify each other26 The induction energy of molecules A and B are considered separately
The induction contribution of molecule A in state m and non-degenerate ground state 0
is
The induction energies are always attractive because distortion only occurs when there
is a lowering of energy Because the energies are non-additive they are difficult to
implement computationally32 The inclusion of the explicit induction to the
0 0
0 0 0 0 0 0A B A B A B A B
A
ind A Am m
H m m HU
W W
24
22 Intermolecular Forces
31
intermolecular energy can significantly reorder the relative energies of a molecule33
especially for large molecules like carbamazepine32 The distributed polarizability can be
used to model the induction energy as Gareth Welch34 did However this approach is
computationally demanding because a large basis set and high-quality wavefunctions are
often required32 for convergence criteria to be met In this thesis the induction energy is
not modelled explicitly Instead it uses PCM (Polarizable Continuum Model section
283) to model the polarization effect that arises from the electrostatic interactions in a
solvent medium29
Dispersion
Dispersion is a universal force of quantum mechanical origin We know that because
electrons are in continuous motion their electron density oscillates continuously
producing instantaneous electric dipoles that change as the electron density changes The
instantaneous dipole in one molecule induces another electric dipole in the other
molecule There is an instantaneous correlation of fluctuation of charge density This is
why this contribution is universal and requires a description of electron correlation
Dispersion is an attractive force and is approximately pairwise additive The perturbation
theory expression for dispersion contribution is as follows
0 0 0 0
00 00disp A B A B
m n m m
H mn mn HU
W W W W
25
London30 provided the most widely understood treatment of dispersion forces where
atoms can be visualised as a set of harmonic oscillators In this treatment the coupling of
the oscillators leads to the lowering of the energy The dispersion energy depends on the
square of the coupling constant The leading term in the dispersion energy is proportional
to R-6 because the coupling for a pair of interacting dipoles is proportional to R-3
224 Short-range Interactions
Exchange-Repulsion
When electron clouds of two molecules approach each other and become sufficiently
close they overlap At short-range the most important contributions are exchange and
repulsion these two are often taken together despite having opposite signs and are called
exchange-repulsion31 The exchange contribution is the attractive energy resulting from
electrons of one molecule becoming free to move over both molecules This increases the
uncertainty of the electronrsquos position allowing the momentum and energy to decrease
Repulsion contribution arises from the slight overlap of electrons that are trying to occupy
the same region of space This overlap which is prohibited by the Pauli Exclusion
23 Modelling the Intermolecular Forces for Organic Molecules
32
Principle leads to redistribution of electrons and increase of the repulsion between the
nuclei The exponential repulsion domination leads to an overall repulsive effect and is
approximately pairwise
225 Penetration Energy and Charge Transfer The overlap at short-range leads to modification of the long-range terms When charge
densities overlap at short-range the electron density will no longer shield the nuclei of
one molecule and therefore the molecules will experience a greater attraction of electron
density associated with other species The energy difference from this increased attraction
is the charge penetration it is the modification of the electrostatic energy at short-range
and so is a first-order effect Charge transfer also occurs during redistribution of electrons
at short-range It is a part of the short-range induction energy and so is a second-order
effect The energy contributions from charge transfer and penetration are small and are
often negligible35 Some of these effects may be absorbed in the empirically fitted models
of the dispersion and repulsion terms (section 27)
In summary for the organic molecules studied in this thesis repulsion dominates at
short-range while electrostatic and dispersion contributions dominate the intermolecular
energy at long-range Therefore the total intermolecular energy can be expressed as the
summation of the electrostatic Uelec repulsion Urepul and dispersion Udisp contributions
inter elec repul disp elec repul dispU U U U U U 26
23 Modelling the Intermolecular Forces for Organic Molecules The potential model used in this thesis for evaluating the intermolecular energy Uinter
is an intermediary between conventional force fields and periodic electronic structure
calculations The functional form of conventional force fields have limitations because
the same charges are used for intermolecular and intramolecular interactions2 (section
254) Periodic electronic structure calculations are very expensive and were not
available at the start of my research in 2010 For example the plane-wave DFT-D study
of selected pharmaceutical crystal structures using Quantum Espresso was published in
201336 The Generation Ranking and Characterisation Engine (GRACE37 program
section 284) which when coupled to another periodic DFT-D code (section 275) was
successful in the fourth blind test10 is still not available to researchers as of this writing
The work presented in this thesis models the dispersion repulsion and electrostatic
interactions (equation 26) explicitly The dispersion and repulsion contributions were
modelled using a transferrable empirically fitted model In contrast the electrostatic
23 Modelling the Intermolecular Forces for Organic Molecules
33
contribution was modelled using ab initio wavefunction calculation on an isolated
molecule for each molecular conformation due to limited transferability
231 Repulsion-Dispersion Potentials The dispersion and repulsion terms are modelled with an empirical exp-6 atomndashatom
potential that is assumed to be transferrable3839 The repulsion term is represented by the
exponential-based term and the dispersion is represented by the inverse sixth power term
6
exp( )
repul disp ik ik
i k
U A B R C R 27
where atom i in molecule 1 is of type ι atom k in molecule 2 is of type κ and they are
separated by interatomic distances Rik This potential (equation 27) was derived by fitting
the parameters to known crystal structures and it obeys the following combining rules
1 1
2 21
( ) ( ) ( )2
A A A B B B C C C 28
Parameters for carbon non-polar H and N atoms were derived from fitting to
azahydrocarbon crystal structures39 while the parameters for the oxygen atom were
derived from fitting to oxohydrocarbon crystal structures38 The polar H atom parameters
were derived from azabenzenes nitrobenzenes and other simple molecules40 To account
for the smaller effective van der Waals radius of protons the distinction between polar
and non-polar H atoms is necessary41 In Chapters 3 and 4 the repulsion-dispersion
contributions to the intermolecular energy will be calculated using the potential of
equation 27 and the ldquoFITrdquo34 parameters These FIT parameters were fitted using a model
that had explicit electrostatic interactions Once the repulsion and dispersion terms were
generated they were summed over all intermolecular atomndashatom distances up to a defined
cut-off This is typically 15 Aring for small organic molecules for fast calculations and 30 Aring
for large molecules34 It should be noted that some of the other intermolecular
contributions not modelled explicitly by equation 27 and any electrostatic model might
have been absorbed by the empirically fitted models of dispersion and repulsion terms
because these other contributions will be present to some extent in the sample crystal used
in deriving the parameters A B and C
In contrast to ldquoFITrdquo the empirical intermolecular potential by Gavezzotti42ndashndashanother
exp-6 potential that will be used in Chapters 5 and 6 to investigate the origin of
intramolecular energy and design new analytical force fieldsndashndashdoes not use combining
rules and has no atomic or site charges
23 Modelling the Intermolecular Forces for Organic Molecules
34
232 Electrostatics Potential This section discusses the two methods used in this thesis for modelling the electrostatic
contribution to the intermolecular energy (equation 26) in Chapters 3 and 4
(1) The Atomic Charge Model is a crude but inexpensive approach It uses Coulombrsquos
law through pairwise interaction of isotropic (spherical) point charge q placed on each
atom separated by distance R
0
1(R )
4 R i k
elec ik
ik
q qU 29
where ε0 is the dielectric vacuum constant It assumes that the charge density of the
molecule can be described by superimposing spherical atomic electron densities The
atomic charge model cannot represent non-spherical features such as lone pairs and
electrons or short-distance directional intermolecular interactions like the geometry of
the H-bond41 As a result extensions to the isotropic model have been proposed to define
lone pair sites as dummy atoms having isotropic electrostatic interactions43 or at satellite
positions that are optimised to provide best fit to the electrostatic field44
Although atomic charges can be derived from the experimental X-ray diffraction data
these results are unreliable due to the many approximations and assumptions that must be
made during their calculation45 On the other hand atomic charges can be generated from
an ab initio wavefunction calculation of the isolated molecule to estimate the electrostatic
contribution41 This involves using the CHELPG scheme (an acronym for CHarges from
ELectrostatic Potentials Grid based method) which performs the least-squares fit of the
atomic charges to reproduce the molecular electrostatic potential as evaluated from ab
initio density on a regularly spaced grid46 Unfortunately higher moments such as
octupoles hexadecapoles and so on make a small contribution to the potential when the
CHELPG scheme is used Indeed Francl et al47 showed that the CHELPG procedure is
ill conditioned for higher atomic multipoles so that the charges are not well determined
however they did show that Singular Value Decomposition (section 262) could improve
the condition numberdagger
(2) The Distributed Multipole Moments The electrostatic potential around a molecule
can be represented by an expansion of multipole moments At long range this
daggerThe condition number is the ratio of the largest to smallest singular value in the singular
value decomposition of a matrix A matrix is ill conditioned if the condition number is
too large
23 Modelling the Intermolecular Forces for Organic Molecules
35
electrostatic potential is exact since the charge distribution is approximately spherical as
the distance approaches infinity At shorter range the more apparent anisotropic nature
of charge density is not easily represented by the central multipole expansion48 A better
approach is to use a multiple expansion about several sites in the molecule which can be
achieved with the distributed multipole expansion
The distributed multipole expansion is an explicit method of generating higher-order
atomic multipoles that involves modelling the atomic charge distribution using a series
of distributed multipoles (charge dipole quadrupole octupole hexadecapole etc as
illustrated in Figure 22)26 Consequently the derivation of the distributed moments is
essential There are two ways of achieving this computational analysis of the charge
density and fitting to experimental data Deriving the multipole moments experimentally
is challenging and often the data are insufficient to deduce any particular distribution of
multipoles across specific sites49 For example the Stark effect gives the magnitude but
not the sign of the components of the dipole moment along the inertial axes26
Figure 22 Charge distributions corresponding to pure multipoles Blue portions
represent regions where the function is positive and yellow portions represents where it
is negative Qlk is the spherical harmonic multipole where l is angular momentum
quantum number and k = l l-1hellip -l specifies the component of the angular momentum
around the z-axis (Source httpenwikipediaorgwikiSpherical_harmonics [Accessed
11012015])
Distributed Multipole Analysis (DMA) is a systematic way of determining the
distributed moments50 This computational approach derives charge distribution from an
24 Intramolecular Energy
36
ab initio wavefunction51 and describes it in terms of distributed multipoles (Figure 22)
located at a number of site in the molecule using the Gaussian Distributed Multipole
Analysis (GDMA)52 program The GDMA program carries out a DMA of the density
matrix (Fchk) file produced by GAUSSIAN53 for the isolated molecule in the molecular
axis system34 This thesis uses version 252 of GDMA because it handles diffuse functions
more satisfactorily51 than version 154
In contrast to the atomic charge model the distributed multipole moments have
successfully predicted the directional (anisotropic) lone pair interactions π-π stacking
arrangements in aromatic rings and electrons and H-bond geometries in molecular
organic crystal5556 The long-range interactions which include the chargendashcharge (R-1)
chargendashdipole (R-2) and dipolendashdipole (R-3) terms are evaluated using the Ewald
summation method57 while the remaining long-range interactions are summed by direct
method
In summary the electrostatic contribution is modelled by using either an atomic charge
model or distributed multipole moments obtained from ab initio methods while the
repulsion and dispersion contribution are modelled using an empirical exp-6 potential
24 Intramolecular Energy The lattice energy of a crystal structure is the sum of the intermolecular and
intramolecular energies The focus of this section is the intramolecular part of the lattice
energy In Chapters 5 and 6 I investigate the origin and derive analytical models for the
intramolecular energies of flexible molecules (Chapter 6) Therefore this section
concisely examines the intramolecular energy of flexible molecules
The intramolecular energy of rigid molecules is negligible so the early work of crystal
structure prediction (section 11) focussed on the easier problem of rigid molecules In
this thesis a flexible molecule has one or more internal degrees of freedom that change
between phases for example torsion angles around single bonds The intramolecular
energy for a flexible molecule is the energy difference between the molecule in a specific
conformation (eg in a crystal) and in the lowest energy of the isolated gas phase
conformation As evident from ROY in Chapter 1 polymorphic forms can exhibit very
different torsion angles (Figure 15) ie can display conformational polymorphism
Cruz-Cabeza and Bernstein58 argued that when referring to conformations in crystal
structures a distinction should be made between conformational adjustment and
conformational change Conformational adjustment arises when a flexible molecule
adjusts to the crystal environment by slightly varying the conformation to minimise the
24 Intramolecular Energy
37
lattice energy of the crystal while conformational change involves a change of gas phase
conformer (Figure 23) In the context of the polymorphism of flexible molecules Cruz-
Cabeza and Bernstein58 referred to two polymorphs whose independent conformations
are related by conformational change as conformational polymorphs For example crystal
structures A and B in Figure 23 are conformational polymorphs
Figure 23 Schematic representation of conformational change and conformational
adjustment (Source Ref [58])
The simplest approach to calculate the intramolecular energies is to use force field
methods (section 25) which involve summing the contributions that arise from bond
stretching angle bending and dihedral torsion angles However despite the speed and
successes of force field methods in Molecular Dynamics and in modelling proteins59 the
molecular mechanics descriptions of the intramolecular energies and molecular
geometries are not sufficiently accurate for evaluating the lattice energy of crystal
structures (section 254)
Another method for evaluating intramolecular energy is electronic structure calculation
(section 27) This approach avoids the problem encountered in force field methods but
at the cost of higher computing time The conformations of flexible molecules and their
relative energies can be sensitive to the electron correlation method (because of the
important dispersion contribution) and to the basis set that is used (since large basis sets
are required to avoid intramolecular BSSE60 during electronic structure calculations) The
errors from intramolecular dispersion (section 275) can lead to the failure of quantum
mechanical calculations for molecules that adopt a folded conformation6061
One way of solving this problem is the dispersion-corrected (ndashD section 275) method
Warnings of the intramolecular energy sensitivity toward the electronic structure level of
25 Force Fields (Atomistic Modelling)
38
theory are relevant to the CSP studies of Chapter 3 and 4 where the focus is on other
aspects of the computational model and not on the rigorous test of these errors However
it is a common practise to use one electronic structure method for evaluating the
intramolecular contributions toward the final lattice energies A necessary compromise
then is to conduct prior analysis of the effect that different levels of theory have on the
intramolecular energy for a specific molecule
The frequently used DFT level of theory such as B3LYP6-31G(d) may not give
reliable results for molecular systems where the intramolecular dispersion energy is likely
to be a major factor in determining the conformation60 Due to this limitation I did not
use the 6-31G(d) basis set in Chapters 3 and 4 when computing the final intramolecular
and intermolecular energies of the crystal structures
25 Force Fields (Atomistic Modelling) Force field methods (also known molecular mechanics methods) ignore the moleculersquos
electronic motions and calculate the energy of a system as a function of the nuclear
positions These methods are a cheap alternative to electronic structure methods (section
27) The basis of understanding the force field is the Born-Oppenheimer approximation
which assumes that the motions of the nuclei are independent of the motions of the
electrons In force field calculations the arrangement of the electrons is assumed to be
fixed62 Thus traditional force field methods cannot predict properties based on electronic
motions such as the breaking and formation of chemical bonds polarization effects and
proton transfer
The parameters determined for small molecules can be transferred to larger systems
such as polymers63 and can also be used for billions of atoms on supercomputers Indeed
the ability to transfer force fields from one system to anotherndashndashfor systems that are too
large for quantum mechanical calculationsndashndashis arguably the most valuable property of
many force fields6364
The downside to these classical force fields is that conformation and energy results are
often prone to inaccuracies These inaccuracies were observed when force fields methods
were used in CSP to calculate the final lattice energies65-67 (section 254)
25 Force Fields (Atomistic Modelling)
39
Figure 24 The schematic view of force field interactions Covalent bonds are solid lines
while the dotted line indicates non-bonded interaction (Source Ref [68])
Figure 25 Schematic view of four key contributions to a molecular mechanics force
field These forces are bond stretching bond stretching angle bending torsional terms
and non-bonded interactions (Source Ref [63])
The application of force fields involves choosing an energy functional form followed
by evaluating all unknown parameters A typical force field method arises from four
principal energy terms of intermolecular and intramolecular forces within the system6970
( )MM b nbE E E E E 210
where sumEb sumEθ sumEξ and sumEnb are the total energy of bond deformation valence angle
deformation torsion deformation and non-bonded interactions (van der Waals and
electrostatic) respectively The deviation of bond angle and torsion from equilibrium
describes the penalty of deformation (intramolecular) while non-bonded term describes
the interaction between non-bonded parts of the system (intermolecular)
Hookersquos law models bonds between atoms as a spring
2( )b r eq
bonds
E K b b
211
25 Force Fields (Atomistic Modelling)
40
where Kr is the force constant and beq is the ideal bond length A common mistake is to
assume that the equilibrium value (eg beq) is the global minimum value in actuality beq
is the value that b adopts when all force field terms equal zero This Hookersquos functional
form is an example of applying the harmonic oscillator in which the relationship between
force and displacement is linear A more accurate description of the relationship between
force and displacement is non-linearity ie anharmonic oscillator Hence Hookersquos
functional form is not as accurate as using cubic and higher terms (anharmonic terms)
Valence angles have a similar model to equation 211
angles
eqKE 2)(
212
where K is the strength of the spring holding the angle at ideal valence angle eq
Compared to a bond model less energy is required to distort the valence angle away from
the reference and the force constants are smaller The higher terms such as cubic and
quartic terms improve the valence angle model The 1-2 and 1-3 interactions (defined in
Figure 24) are also known as hard degrees of freedom because large amounts of energy
are required to deform bonds or angles from their equilibrium positions However
CrystalOptimizer71 (section 282)ndashndashan algorithm used in Chapters 3 and 4 to compute
the lattice energy accuratelyndashndashassumes that some 1-3 interactions are soft degrees of
freedom For example hydroxyl (HndashOndashC) and amide (HndashNndashC) bond angles were treated
as flexible in three model systems72
Figure 26 Schematic view of the torsion angle ξ using the ethane molecule (Source
quantumwisecomdocumentsmanualsvnl-200810_Manualchapmolbuilderhtml
[Accessed 11012015])
25 Force Fields (Atomistic Modelling)
41
The major change between crystal structures is their torsion angles The torsion angle
ξ in the ethane molecule shown in Figure 26 is defined as the intersection angle between
the two planes α and β spanned by the respective atom chains 1ndash2ndash3 and 2ndash3ndash4 It is clear
that the value of the torsion angle ξ between atoms 3 and 2 depends on the four atoms
selected Due to the periodic nature of torsion angles the model is expressed as a periodic
function
[1 cos( )]2
n
torsions
VE 213
where is the periodicity and represents the number of minima as the bond rotates about
360deg The phase factor term is the torsion angle as the rotating bond passes the
minimum or minima Vn is the barrier height to rotation about torsion angle ξ The value
of Vn is larger for double bonds than for single bonds The definition of Vn is ambiguous
when more than one term is needed to model the torsional energy64 Even more
misleading is that the 1-4 non-bonded (Figure 24) and higher interactions contribute to
the torsional potential The additional term with the correct qualitative behaviour of the
barrier to rotation63 is a better description of Vn
The last term in equation 210 is the non-bonded interactions
12 6
[ ]nonbond
ij ij i j
nb
i j ij ij ij
q qE
r r r
214
where the adjustable parameter σij is the collision diameter and is defined as the separation
for which the van der Waals energy is zero The qi and qj terms are the partial or net
atomic charges63 Equation 210 is a combination of the repulsion-dispersion (also known
as the van der Waals term and is often fitted to a Lennard-Jones 6-12 potential73 because
of the computational ease) and an electrostatic term It should be noted that intermolecular
and intramolecular contributions have the same set of parameters Many of the more
recent developments in protein force fields include electronic polarizability or a solvation
effect in an approximate way68
251 AMBER The AMBER force fields are widely used for modelling proteins and nucleic acids74
AMBER which is in continual development has relied on the past knowledge of force
fields such as ECEPP potentials75 and Consistent Force Field (CFF76) The exclusion of
H atoms from an earlier version of an AMBER force field was due to limited computer
power However a compromise was adopted in later versions due to the importance of
the H-bond68
25 Force Fields (Atomistic Modelling)
42
The charges were derived by fitting partial charges to ESP (electrostatics potential)
charges obtained via ab initio calculations (HFSTO-3G) An adapted version of van der
Waalsrsquo term from amide data fitting by Lifsonrsquos group7778 and liquid state simulations79
by Jorgensen was used The first two terms (bonds and angles) of equation 230 were
fitted from crystal structure data while the torsional terms were extracted from either
experimental data or ab initio calculations
The fact that AMBER has limited parameters for organic molecules prevented this force
field from being widely used in drug design and other studies of ligandndashprotein or ligandndash
DNA interactions80 Hence a Generalised Amber Force Field (GAFF) was introduced by
Wang et al80 to describe a wider variety of organic molecules including most
pharmaceutical molecules
252 CHARMM CHARMM81 (Chemistry at HARvard using Molecular Mechanics) has some overlaps
with AMBER in part because the first versions of both force fields were developed
around the same time Like AMBER H atoms were excluded in the earlier version but
were later replaced with a compromise solution Although ab initio calculations were
used in fitting this model a different level of theory (HF6-31G) was employed The
interaction energies were scaled to match water dimerization energy predicted via a
TIP3P model to achieve a balanced solutendashwater and waterndashwater interaction A rough
continuum solvation model can be implemented by using the force field with distance-
dependent dielectric constant The second version of CHARMM from 1985 is used
today because of the respectable results obtained from solvated simulation68
Subsequent developments were made in later versions of CHARMM8283 to improve
the balance of interaction energies in solvent simulations More recently a force field for
all atoms often called the CHARMM general force field (CGenFF) was published84
This force field covers a wide range of chemical groups present in biomolecules and drug-
like molecules and focusses on quality of result rather than on transferability
253 Other Force Fields There are more complex force fields than those discussed above For example cubic
and quartic terms can be added to equations 210 and 211 to reflect anharmonicity and
stretch-bend cross terms or the Lennard-Jones function can be replaced with a more
flexible Buckingham (exp-6) or Morse potential85 Examples of such force fields are
MM486 and Merck Molecular Force Field (MMFF)87 The cubic and quartic terms are
also used in MM288
25 Force Fields (Atomistic Modelling)
43
Figure 27 Schematic view of some of the common cross terms (Source Ref [63])
The cross terms in force fields represent coupling between internal coordinates For
example an increase or decrease of valence angle can affect adjacent bonds Stretch-
stretch stretch-bend stretch-torsion bend-torsion and bend-bend (Figure 27) are
examples of cross terms believed to be the most important in force fields these cross
terms in force fields are designed to predict vibrational spectra63
Another very popular force field is OPLS-AA (Optimized Parameters for Liquid
SimulationsndashAll Atoms) which specialises in simple liquids8589 Although huge
advances have been made in the understanding of biomolecular behaviour there is still a
demand for more accurate prediction of energies90 even for proteins and nucleic acid
polymers that have been studied extensively eg AMOEBA91 which uses atomic
multipoles
254 The Limits of Current Force Fields A major limitation of current force fields is the use of atomic charges in the description
of electrostatic contributions9293 Another limitation is that the intermolecular and
intramolecular forces have the same parameters It is therefore not surprising that in the
blind tests of organic CSP there have been no success based on the use of force fields for
final lattice energy (sum of intermolecular and intermolecular energy) evaluations11 In
specific cases like aspirin the intramolecular force field clearly has too strong a
preference for the wrong conformation so that the lowest-energy crystal structures have
that conformation94
Indeed some force fieldsrsquo lattice energy minimizations were shown to change the
conformation of the crystal structure so much that the crystal structure could not be
26 The Fitting Routine
44
reproduced65 In other cases the force fields were able to reproduce the crystal structures
but failed to rank the energy of these crystal structures accurately These failures have
been traced to using the same charges and van der Waals interactions for the
intermolecular and intramolecular forces95
Generally force field potentials that are more accurate tend to have more terms because
they usually yield better fit with experimental or ab initio data However additional
parameters make the fitting procedure more complicated and time consuming with no
scientific basis Therefore an ideal analytical model for the intramolecular energies
should have terms that are few in number (Chapter 6) based on a consistent scientific
origin (Chapter 5) and transferrable
In summary the traditional force field includes explicit periodic torsional potentials
and non-bonded terms including the electrostatic term that are applied to all atom pairs
separated by three or more covalent bonds (1-4 interactions and above) Researchers built
these traditional force fields on the reasonable assumption that in biomolecules the
intramolecular non-bonded interactions are the same as intermolecular non-bonded
interactions This is clearly a limitation2 because intramolecular atom-atom distances are
often much shorter than intermolecular (van der Waals) distances I exploited this
limitation in Chapter 6 by decoupling the intermolecular and intramolecular contributions
and derived new analytical intramolecular force fields
26 The Fitting Routine The Gavezzotti exp-6 and ldquoFITrdquo potentials (section 231) and many force field methods
were fitted to experimental or ab initio data These potentials all depended on an assumed
functional form the ability to extrapolate the quality of data the range of sampling a
method of fitting (the focus of this section) and so on
In Chapter 6 I developed codes (Appendix A) for fitting a new analytical
intramolecular force field to ab initio conformational profiles of fenamates which use
one method of fitting I assumed that the new analytical intramolecular force field was
approximately linear This section explains what a linear problem is solves the problem
and outlines an alternative solution that uses a Numerical Algorithm Group (NAG) library
that was implemented in the design of new analytical force fields (Appendix A)
261 Linear Least Square Method A model is linear if given a random data of (Yi Xi1hellip Xip-1 i =1hellip n) the relationship
between the response variable or observation Yi and the explanatory or independent
variable Xij can be formulated as follows
26 The Fitting Routine
45
Yi=β0+ β1Xi1 + β2Xi2 +hellip+ βp-1X ip-1 + εi i=1hellipn 215
where εi is the error β0 β1 β2 hellip βp-1 are the intercept and regression coefficients for the
explanatory variables
The linear regression model of equation 215 in matrix form is
0 1 11 1 1 11 1
0 1 22 1 2 12 2
0 1 1 1 1
p p
p p
n nn p n p
X XY
X XY
Y X X
216
or
11 1 11 0 1
22 2 12 1 2
11 1
1
1
1
p
p
n p nn n p
X XY
X XY
Y X X
217
or 1 1 1n n p p n Y X ε 218
where Y is ntimes1 X is ntimesp (an ntimesp matrix has n rows and p columns) β is ptimes1 and ε is
ntimes1 matrix
We can solve this linear regression model by using the least squares method The basic
idea behind the least squares is minimising the sum of squares for the errors ie
2n T
ii ε ε where T is the transpose Rearranging equation 218 as a function of errors
and evaluating least square problem gives
( ) ( )
( ( ) ( ) ( ))
( ( ) ( ))
( ( ) ( ) ( ))
( )
( 2 )
T T
T T T T
T T T T T
T T T T T T
T T T T T
T T T T
ε ε Y X Y X
Y Y Y X X Y X X
Y Y Y X X Y X X
Y Y Y X X Y X X
Y Y Y X Y X X X
Y Y Y X X X
219
Then differentiating the least square (equation 219) with respect to the coefficient gives
( ) ( 2 ) 0
2( ) 2 0
2 2 0
T T T T T
T T T
T T
T T
ε ε Y Y Y X X X
Y X X X
X Y X X
X X X Y
220
26 The Fitting Routine
46
Then multiply both sides by 1( )T X X
1
1 1( )T T
p p n p n p n n
X X X Y 221
The expectedmodel value Ŷ is
1 1ˆ
n p p n Y X 222
Equations 221 and 222 can be coded explicitly which I did for cosine fits in my upgrade
report96
262 Subroutine for Solving Least Squares An alternative to coding equations 221 and 222 explicitly is to use the G02DDFE97
NAG routine This NAG routine computes the error of each coefficient and states whether
a solution is unique or not in addition to computing the coefficients Here I discuss some
key concepts that will help in understanding the G02DDFE97 NAG routine used in
Chapter 6
If X is an n times p matrix the rank of X is the number of nonzero rows in the row echelon
derived through the Gaussian elimination method If matrix A has a rank as large as
possible then the matrix is a full rank otherwise the matrix is rank deficient A matrix
that is full rank has one unique solution The G02DDFE97 NAG routine can work out if
any matrix is full ranked or rank deficient
QR decomposition is the first step used for solving the least squares problem in the
G02DDFE97 NAG routine QR decomposition transforms matrix X into a QR matrix that
consists of an orthogonal matrix Q and an upper triangle matrix R
1 2 1
R RX = Q = Q Q = Q R
0 0 223
where Q1 is the first p columns of Q and Q2 is the last n-p columns of Q
G02DDFE97 subroutine calculates the regression parametersndashndash and in Chapter
6ndashndashand Residual Sum of Squares (RSS) for a general linear regression model by
minimising the sum squares residual G02DEFE a routine within G02DDFE carries out
QR decomposition of the matrix data X If R is of a full rank ie the matrix has a rank
as large as possible then R-1 exists and the solution of the regression model is as follows
1ˆ( ) ik
T
ik y R Q 224
where Q and R are the decomposed matrices of data being rescaled and y is the ab initio
data minus any remaining contributions not being fitted If R is not full rank Singular
27 Electronic Structure Methods
47
Value Decomposition (SVD) of X (ie X=U1DVT) helps to extract just one solution of
the linear regression model
1ˆ ( ) ik
T
ik y VD U 225
where V D and U are respectively the orthogonal the non-negative diagonal element
and the orthogonal decomposed matrices RSS and the standard error fit are related
fit
p k
RSS
N N
226
where Np and Nk are the number of observations and regression coefficients for each of
the independent variables plus the intercept
Solving the least squares problem is a key feature of the algorithm in Chapter 6 The
algorithm undertakes the challenge of deriving a new analytical model for intramolecular
energies of flexible fenamate molecules The remaining features of the algorithm are
discussed in Chapter 6
27 Electronic Structure Methods The development of electronic structure methods and rapid advances in computing
technology have transformed the role of quantitative numerical calculations in both
theoretical and experimental studies of chemistry98 The first era from the 1960s to 1980s
established the basic mathematical foundations and computational machinery of todays
standard electronic structure methods They included HartreendashFock (HF) theory Moslashller-
Plesset (MP) perturbation theory Density Functional Theory (DFT) and many others98
This thesis classifies HF MP and DFT as ab initio methods
This thesis uses electronic structure methods to calculate the molecular properties of a
single molecule (and in principle of dimers and crystals) The electronic structure
methods seek to calculate the molecular properties from the first principles ie solving
Schroumldingerrsquos equation without using empirical data26 However approximations are
always necessary DFT is a modern arsenal of quantum chemical methods99 and to get a
better appreciation of this method it will be useful to look at more traditional
wavefunction-based approaches One of the simplest of these approaches is the Hartree
Fock (HF) theory
27 Electronic Structure Methods
48
271 Hartree Fock Theory The HF theory was developed to solve the electronic Schroumldinger equation that results
from the time-independent Schroumldinger equation after invoking the Born-Oppenheimer
approximation100 There are two good reasons for solving the Schroumldinger equation First
the solution gives the potential energy experienced by the nuclei ie the potential energy
surface Second the electronic wavefunction has lots of useful information about
molecular properties such as dipole and multipole moments polarizability etc
The HF method assumes that the exact N-body wavefunction of the system can be
approximated by a single Slater determinant of N spin-orbitals By employing the
variational theorem which states that the energy is always an upper bound to the true
energy one can derive a set of N-coupled equations for the N spin-orbitals The solution
to this equation yields the energy of the system and the wavefunction
The HF method is called the ldquoSelf-Consistent Field (SCF) methodrdquo because the HF
equations are solved using an iterative process The SCF process starts with an initial
guess for the orbitals and successive iterations are performed with new orbitals until the
self-consistent condition is achieved ie until the solution no longer changes
271 Molecular Orbital Theory With the new Quantum Mechanics (QM) of Heisenberg and Schroumldinger came two
general theories the Valence Bond (VB) and the Molecular Orbital (MO) theories These
two theories developed at around the same time quickly became rivals101 See ref102 for
a review of the classical valence bond approach The focus of this section is the MO
theory
The MO theory based on the HF theory theorises that each electronrsquos motion can be
described as a single-particle function (orbital) that does not depend on the instantaneous
motions of the other electrons MOs are calculated using the Linear Combination of
Atomic Orbitals (LCAO) which is a quantum superposition of Atomic Orbitals (AOs)
MO is a theory of bonding that can give insight into the forces involved in making and
breaking chemical bonds which are often the focus of organic chemistry
The early complexities of Quantum Mechanics led to the visualisation of MOs that are
easier to understand than numerical orbital coefficients103 Using SCF calculations we
can represent MOs using isosurfaces that correspond to the electron density The two
isosurfaces of particular importance are usually the Highest Occupied Molecular Orbital
(HOMO) and the Lowest Unoccupied Molecular Orbital (LUMO) These are known as
the frontier-orbitals104 It is not clear why the frontier-orbital theory is so successful26 but
27 Electronic Structure Methods
49
this theory is used extensively in computational chemistry to understand many
phenomena Frontier orbitals will be used in Chapter 5 of this thesis to understand the
origin of barriers to rotation for flexible molecules
HOMO is the isosurface from which it is energetically easiest to remove electrons from
(eg electron density donation to form a bond) as well as the most relevant MO in this
thesis The only requirement of the empty MOs is that they form an orthogonal set with
the filled MOs These unoccupied MOs are not optimised during the SCF process because
the energy of the molecule does not depend on them As a result these unoccupied MOs
including LUMOs are less reliable than occupied MOs such as the HOMOs Thus
Chapter 5 will focus on the HOMO isosurfaces of flexible molecules
272 Correlation Effects The major limitation of the HF method is that it treats each electron as moving under
the influence of the average effect of all other electrons the method does not take into
account the electronsrsquo instantaneous repulsion26 (correlation effect) One of the most
important effects of electron correlation is the dispersion interaction In fact the
dispersion interaction (section 22) is a correlation effect26100 The correlation energy is
the difference between HF energy in a complete basis (HF limit) and the exact energy
excluding the relativistic effects ie the electrons are propagating at speeds much slower
than light
The HF method is now used merely as a starting point for more elaborate lsquopost-HFrsquo ab
initio quantum chemical approaches99 because the poor performance of the HF method
offsets its efficiency and simplicity Correlation effects modify the electrostatic
interaction between the molecules due to changes in electron distribution and they tend
to reduce charge separations Electron correlation can be handled in quantum chemical
theory calculations using Moslashller-Plesset Perturbation Theory (MPPT) Density
Functional Theory (DFT)105 etc
273 Moslashller-Plesset Perturbation Theory In perturbation theory we start from a known solution and add a perturbation
Hamiltonian (equation 21) Moslashller and Plesset106 used perturbation theory to determine
the correlation energy (small perturbation) after solving the HF problem (the known
solution) Correlation corrections appear at the second order and beyond The zeroth-
order energy is the sum of the occupied orbital (eg HOMO) The first-order energy is
the HF energy26 MPn is the nth-order energy (n 2) In this thesis I did not perform
27 Electronic Structure Methods
50
geometry optimisations using MP2 methods for molecule(s) with 20 or more atoms due
to the computational expense
Although MP2 methods are used as the standard they have limitations For example
van Mourik61 noted that the MP2 description of intramolecular interactions with a -
electron system for flexible molecules is affected by a large intramolecular basis set
superposition error (BSSE) This large BSSE of MP2 was responsible for the wrong order
of stability for Phe-Gly-Phe tripetide107
BSSE is relevant in this thesis because many of the MP2 calculations were carried out
on flexible molecules that contained at least one aromatic ring (Chapters 3 to 5) The
origin of this error lies in the possibility that the unused basis functions of the second unit
B in the associated complex A∙∙∙B may augment the basis set of the first unit A thereby
lowering unit Arsquos energy compared to a calculation of this unit alone26108 This lowering
can be attributed to the variation principle that arises from the mutual enlargement of the
basis set of each monomer by the presence of the orbitals of its partner molecule109 Rather
than using an infinite basis set an impossible task the method for correcting this error is
to use a counterpoise (CP)
274 Density Functional Theory Density Functional Theory (DFT) is a cheaper alternative to MPPT Indeed P J
Stephens et al110 suggested in 1994 that in the future DFT might be preferred over the
MP2 method due to the lower computational demands of DFT That future is now for
DFT is currently the method of choice for first-principles electronic structure calculations
in condensed phase and complex molecular environments111112 Over the last 30 years
physicists working on the electronic structure of solids surfaces defects etc have used
DFT More recently DFT has become popular with theoretical and computational
chemists113
DFT is a theory of electronic structure exact in principle that is based on the electron
density distribution instead of the many-electron wave function111 DFT is based on a
theorem proposed by Hohenberg and Kohn114 which states that knowledge of the
electron density of a system in the ground state is enough to determine the energy lsquothe
energy is a functional of the densityrsquo2699105 A generalized DFT expression is
EDFT[ρ] = ENe[ρ] + T[ρ] + Eee[ρ] 227
where T[ρ] is the kinetic energy associated with the given electron density Eee[ρ] is the
electron-electron interaction energy and ENe[ρ] is the energy of interaction between the
electrons and lsquoexternalrsquo fields The ENe normally includes the interaction between the
27 Electronic Structure Methods
51
electrons and the nuclei but it can also include other fields imposed on the molecule
Each term depends on the electron density ρ
The exact form of T[ρ] and Eee[ρ] are not known and no fundamental theory for
determining them exists at present The usual route for solving this problem is to use the
method proposed by Kohn and Sham115 in 1965 that involves non-interacting electrons
For this system the electron density ρ(r) and the kinetic energy TS[ρ] (S denotes that
the kinetic energy is obtained from a Slater determinant) are exact while the Coulomb
(classical) part J[ρ] of the electron repulsion energy can be calculated The energy of the
system now takes the form
EDFT[ρ] = ENe[ρ] + TS[ρ] + J[ρ] + EXC[ρ] 228
where EXC the exchange-correlation functional is
EXC[ρ]=( T[ρ] - TS[ρ])+( Eee[ρ]- J[ρ]) 229
The exchange and correlation energy EXC is the functional that contains everything that
is not known Local-Density Approximation (LDA) and Generalized Gradient
Approximation (GGA) are used to approximate the EXC LDA the simpler
approximation assumes that the density corresponds to that of a homogeneous electron
cloud It proved to be an improvement over HF but is too inaccurate to be useful for
chemistry26 GGA an improvement on LDA incorporates dependency on electron
density and its gradient In practise hybrid (HF-DFT) functionals are used which
incorporate a portion of the lsquoexact exchangersquo from HF theory105 with exchange and
correlation from other sources (ab initio or empirical)
One of the most widely used hybrid functionals used is B3LYP which incorporates
Beckersquos three exchange-functionals116 (B3) with Lee Yang and Parr correlation
functional LYP117 PBE0118 another widely used functional was used in this thesis
(Chapters 3 to 6) These DFT methods are attractive because their results are comparable
to those obtained using MP perturbation methods but come at a much smaller
computational cost105
275 The DFT-D Approach DFT methods have drawbacks For one they are non-convergent in that no one knows
how to improve the results in a systematic way99119 The success of a particular functional
in one setting does not guarantee the performance in a different setting These drawbacks
led Orio99 to stress the importance of enhancing the credibility of DFT either by including
some form of validation or by estimating the error range through careful comparison
between the calculated and measured observable
28 Crystal Structure Prediction (CSP)
52
Another drawback is that the density functional cannot describe long-range electron
correlations responsible for dispersion forces112120 To overcome this defect researchers
have introduced corrections See refs120121 for a review of the impressive ongoing
attempts to improve the description of dispersion forces of DFT methods From a practical
viewpoint empirically damped ndashC6∙R-6 corrections to the standard density functional
approach provide robustness122 and speed We can solve the difficult dispersion
interactions classically This well-tested approach is DFT-D where -D stands for
dispersion correction The total energy is
EDFT-D = EDFT + Edisp 230
where EDFT is the self-consistent Kohn-Sham energy (equation 227) as obtained from the
chosen density functional and Edisp is an empirical dispersion correction Although DFT-
D was not used in this thesis it is nevertheless relevant because this discussion highlights
the importance of the dispersion contribution (ie correlation effect) to the overall energy
of the system
28 Crystal Structure Prediction (CSP) CSP assumes that the experimentally determined polymorphs correspond to local
minima in the crystal energy surface Elatt To put this approximation in context it is
important to note that the prediction of the relative thermodynamic stability of
polymorphs at a given temperature T and pressure p requires the minimisation of the
Gibbs free energy (G) with respect to the unit cell dimensions and the positions of all
atoms in the unit cell
where E is the internal energy V is volume and S is the entropy123 The variation in the
free energy arises from the differences in packing energy crystal density and entropy
Therefore all three terms associated with the Gibbs free energy (equation 233) should
be evaluated when determining the relative stability of polymorphs It is often the case
that only the lattice energy component of the first term (min E) is evaluated for two
reasons
The TΔS term is often neglected because the difference in lattice vibrational
energies between polymorphs is usually very small25124 At present the thermal
entropic and zero-point contributions to the Gibbs free energy cannot be readily
and accurate evaluated56
min G = min[E + pV ndash TS] 231
28 Crystal Structure Prediction (CSP)
53
The pΔV term could be calculated but is often neglected because of its small ΔV
value The compressibility of solids being low they contribute very little to Gibbs
free energy at normal pressure The pΔV term dominates at high pressure ie
10kbar125
Most of the computational approaches to CSP focus on minimising the lattice energy
The lattice energy Elatt is the internal energy at 0 K and 0 Pa ignoring the zero-point
energy The thermodynamic stability is not always the decisive factor in the packing
patterns of the molecules kinetics also plays an important role because it strongly
influences crystallisation conditions and solvent environment Nonetheless the
experimental structure is expected to appear within a narrow energy range of the global
lattice energy minimum56
Elatt can be calculated in several different ways depending upon the relative importance
of accuracy ease of implementation and computational cost in a given situation56
Ideally the lattice energy of a crystal should be calculated quantum mechanically but
such calculations are expensive Thus most approaches use force field methods andor a
cheap method to generate and evaluating the lattice energy in a hierarchal manner The
most successful CSP approaches rely on some form of the computationally demanding
but accurate electronic structure calculations either on an isolated molecule (to evaluate
the intramolecular contribution combined with the intermolecular contribution that has
been empirical fitted) or on a crystal (using periodic calculations)
Thus the key to successful CSP methods is not just the generation of all possible crystal
structures but also the accurate ranking of these generated crystal structures This ranking
requires balancing the intermolecular Uinter and intramolecular ΔEintra energy
contributions
where Uinter is the sum of the dominant electrostatics Uelec and repulsion-dispersion
Urepul-disp contributions and Eintra is the energy required to distort the molecule from its
gas phase conformation71 X denotes degrees of freedom that define the intermolecular
contacts while vector θ denotes the intramolecular degrees of freedom ie bond lengths
bond angles and torsion angles For rigid molecules there is no θ hence the ΔEintra (θ)
term vanishes For flexible molecules θ and hence ΔEintra (θ) must be accounted for from
the beginning
Elatt = Uinter (X θ) + ΔEintra (θ) 232
28 Crystal Structure Prediction (CSP)
54
281 CrystalPredictor
Chapters 3 and 4 use version 16 of CrystalPredictor126 which is different from rigid
or multiple rigid searches in that it incorporates conformation flexibility during the initial
search stage of crystal structures CrystalPredictor is not a black box it requires careful
analysis clear thinking and learning from earlier CSP studies CrystalPredictor performs
global lattice energy minimisation in order to predict the crystal structures of organic
molecules whose conformation is likely to be significantly affected by the packing forces
CrystalPredictor can find many plausible crystal structures in a multi-dimensional
space defined by the conformational degrees of freedom and lattice variables ie the
positions of the centre(s) of mass of the molecule(s) in the unit cell the orientation of the
molecules and the unit-cell dimensions and angles127 Within CrystalPredictor are two
important algorithms the Sobolrsquo128 sequence and the E04UFF NAG routine129 The
Sobolrsquo sequence generates the initial structures a characteristic of this approach is that
each Sobolrsquo corresponds to a distinct combination of every decision variable and thus
ensures a uniform and efficient sampling This prevents the problematic gaps and clusters
that random sampling can exhibit11 For more detail on how Sobolrsquo works see ref [128]
The E04UFF NAG routine129 carries out an extensive search for local minima of the
lattice energy surface using deterministic low-discrepancy sequences to ensure an optimal
coverage of the search space
CrystalPredictor models the lattice energy as the sum of the intramolecular and
intermolecular energy (equation 232) This lattice energy evaluation is crude but its
computational efficiency is necessary because CSP studies often require hundreds of
thousands of minimisations to sample the entire crystal energy surface The algorithm
computes the intramolecular energy as a function of flexible torsion angles using an
interpolation method on a set of quantum mechanically pre-computed intramolecular
energies by modelling the molecule as a set of rigid fragments connected by flexible
torsion angles The electrostatic contribution Uelec is evaluated by interpolating on pre-
computed atomic charges while an empirically fitted potential FIT34 computes the
repulsive-dispersive interactions Urepul-disp The sum of these two contributions is the
intermolecular energy Uinter=Uelec + Urepul-disp
In short CrystalPredictor is a minimisation algorithm
min Elatt = min[Uinter(X θ) + ΔEintra(θ)] 233
28 Crystal Structure Prediction (CSP)
55
that can generate crystal structures in the 59 most common space groups and with more
than 1 molecule in the asymmetric unit126 Z´gt1 However Chapters 3 and 4 limit the
search of hypothetical crystal structures to Z´=1 due to the huge computing time required
to generate Z´gt1 crystal structures
282 CrystalOptimizer CrystalOptimizer71130 refines crystal structures generated by CrystalPredictor126 To
account for the molecular flexibility accurately the CrystalOptimizer71130 algorithm is
required This algorithm solves the lattice energy problem (equation 233) as a two-level
optimization problem
The outer problem varies and ultimately optimizes the flexible conformational degrees
of freedom the remaining degrees of freedom are adjusted to minimize the intramolecular
energy127 A quasi-Newton scheme which ensures rapid convergence with many
optimization variable (X θ) solves the outer minimisation problem71 The inner
minimization problem optimizes the lattice energy for the fixed molecular conformation
determined by the outer problem The DMACRYS34 (section 26) program performs this
rigid body minimization CrystalOptimizer achieved a significant increase in the accuracy
of lattice energy calculations by127
1 allowing additional flexibility during lattice energy minimization (for example
considering more torsion angles andor bond angles as flexible degrees of
freedom)
2 accurately computing the intramolecular energy throughout optimization and
3 modelling the electrostatic interactions using distributed multipoles (up to
hexadecapole) obtained using the GDMA package52
Multiple ab initio calculations a very time-consuming process were often required
For this reason only the most promising structures from CrystalPredictor were used as
initial points for optimization Sometimes an intermediate step such as single-point ab
initio calculations (see Chapters 3 and 4) can improve the ranking of the lattice energy so
that only a handful of crystal structures (energy cut-off or a set number of unique crystal
structures minima) are optimized with CrystalOptimizer
CrystalOptimizer has one of the major featuresndashndashLocal Approximate Models (LAMs)ndash
ndashthat models the conformational energy and the multipole representation of the charge
density these are updated with explicit quantum mechanical calculations only when
necessary and not at every minimisation step The conformational energies their first and
min Elatt = min [ΔEintra(θ) + min Uinter(X θ)] 234
28 Crystal Structure Prediction (CSP)
56
second gradients and the distributed multipoles are also stored in the LAMs database
Re-using expensive electronic structure calculations (if the same conformational ranges
are encountered while minimising different hypothetical or experimentally determined
crystal structures) reduces the computing time without sacrificing accuracy7172130
283 Polarizable Continuum Model (PCM) Accurately modelling the balance between intramolecular and intermolecular energy is
important (eg using CrystalOptimizer) but just as important is modelling the effect of
the environment in distorting the conformer especially in cases where there is a
considerable difference in molecular conformations Cooper et al131 noticed that the total
calculated crystal energies which combine atom-atom model potential calculations of
intermolecular interactions with DFT intramolecular energies do not effectively
distinguish the real (known) crystal structures from the rest of the low-energy computer-
generated alternatives when the molecular electrostatic models are derived from isolated
molecule calculations They found that introducing a simple model for the bulk crystalline
environment when calculating the molecular energy and electron density distribution led
to important changes in relative total crystal energies and made possible the correct
distinction between the observed crystal structures and the set of computer-generated
possibilities This finding highlights the importance in CSP calculations of the
polarization of the molecular charge distribution especially for polar flexible
molecules131
In Chapters 3 and 4 PCM132 is used to account for the effect of organic environment
after generating and accurately computing the lattice energies using CrystalPredictor
that is an intermediate step that improves the electrostatic contribution to the
intermolecular energy and CrystalOptimizer I will model the polarizable continuum
environment with dielectric constants that is typical of molecular organic crystals ie ε =
3133 The PCM calculations only affect the final energy The geometry is not affected
because there is no molecular geometry minimisation of the crystal structure during the
PCM calculation
284 Other Approaches to Lattice Energy Minimisation There are other well-known approaches to lattice energy minimisations for flexible
molecules One computationally efficient approach is the Rigid CrystalPredictor-
Molecular Mechanics Method (RCM)17 by Graeme Day a variant on the method used in
Chapters 3 and 4 The first step performs constrained geometry optimization on a set
number of distinct conformations obtained from conformational analysis (the flexible
28 Crystal Structure Prediction (CSP)
57
torsion angles are fixed at the expected values from conformational analysis and all other
degrees of freedom are optimized) From this first step we can obtain the geometry
intramolecular energy and atomic charges The second step generates crystal structures
in 21 of the most common space groups by using a rigid CrystalPredictor134 search for
each distinct conformation17 Essentially the molecular geometries are treated as rigid
during the process of generating crystal structures The Uinter is calculated from the atomic
charges and an empirical exp-6 repulsionndashdispersion potential W99135 The third step
refines the most stable crystal structures obtained from the rigid-molecule searches For
this a two-stage procedure proposed by Day136 and co-workers is used The first stage
minimises the crystal structures by allowing the molecular geometry to relax using a
molecular mechanics description of energies associated with changes to the flexible
torsion angles This method trusts the molecular mechanics force field to provide the
correct molecular geometries but discards the energy which is not of sufficient accuracy
for the final ranking of crystal structures Then the resulting crystal structures are re-
optimized without further changes to the molecular conformations DMACRYS34 is used
to model the electrostatic interactions Uelec using the atomic multipole model The
remaining intermolecular terms Urepul and Udisp are obtained using the empirical W99
potential135 The intramolecular energy ΔEintra and the atomic multipole moments for
each conformation are derived from a single-point DFT calculation that incorporates the
PCM with a constant dielectric value of three to reflect the polarization effects in the
crystalline environment
Another approach is GRACE one of the most accurate minimisation methods This
approach presented by Neumann and Perrin was the first case wherein DFT-D methods
(sections 275) were applied to the CSP of molecular organic crystals First during the
crystal structure generation procedure a Tailor-Made Force Field (TMFF)13 developed
for fitting an atom-atom force field (non-bonded and bonding terms) specifically for each
molecule is used Then GRACE uses a hybrid method that combines the sum of the DFT
component and an empirical van der Waals correction ndashD (sections 274 and 275) to
re-optimise the lowest-energy crystal structures During this re-optimisation stage all
nuclear positions and electron density are optimised simultaneously which naturally
accounts for the molecular flexibility and other charge density reorganisation effects such
as polarization This approach reproduces experimental structures very accurately and
ranks the structures favourably amongst other hypothetically generated structures in many
(but not all) cases However these periodic DFT-D calculations are very expensive137
28 Crystal Structure Prediction (CSP)
58
285 The Crystal Energy Landscapes The CSP methods611 discussed above and many others sample a wide range of
possible crystal structures and determine the lattice energy in a hierarchal manner thus
generating a crystal energy landscape14 A crystal energy landscape is a plot of the lattice
energy against the density or the packing coefficient and it tells us how well the crystal
packs These landscapes often include the experimental structures as well as other low-
lying energy crystal structures that are worth comparing with the known polymorphs in
order to determine the types of intermolecular interactions and conformations that could
be feasible for a given molecule
In a crystal energy landscape in which only one crystal structure is calculated to be
more stable than any other by over a few kJ mol-1 typical of polymorphic energy
differences the molecule should only be found in that global minimum structure
Experiments or more demanding searches are needed to determine the stability relative
to multicomponent forms such as hydrates138 solvates139 or cocrystals140141 etc
However in most generated crystal energy landscapes there is typically a cluster of
structures within the energy range of plausible polymorphs These structures have to be
qualitatively assessed to see whether the barriers between the different structures are so
low that thermal motion in the crystal or molecular rearrangement during nucleation and
growth will ensure that only the most thermodynamically stable structure is seen Closely
related structures may also give rise to disorder142143 or plastic phases144 at higher
temperatures
The crystal energy landscape may suggest that alternatives to the known structures
could be found either as more stable or as kinetically trapped metastable polymorphs In
this case the calculations can complement experimental screening145 by suggesting
alternative methods146 such as a templating to produce new polymorphs147 The
knowledge of the crystal energy landscape can help avert problems in pharmaceutical
industries during the manufacturing process and guide the experimentalist search for
undiscovered structure In fact the study of the crystal energy landscape in Chapter 4
helped my colleague to discover a new polymorph (section 438) A way of testing
methodologies developed for predicting crystal structures is through lsquoblind testsrsquo
286 The Blind Tests The early lack of progress in CSP was termed a lsquocontinuing scandalrsquo in Nature in 1988
by John Maddox148 In response the Cambridge Crystallographic Data Centre (CCDC)
organised five lsquoblind testsrsquo10116667149 of organic CSP with the first lsquoblind testrsquo held in
29 Crystal Structure Comparison
59
1999 The blind test provided many researchers the opportunity to test their CSP methods
The fourth blind test results showed a dramatic improvement in the rates of success over
previous blind tests with one group (GRACE) correctly predicting four crystal structures
as their first ranked choice albeit at a considerable computational expense10
In the fifth blind test our research group successfully predicted the crystal structure of
molecule XX1117 which has eight flexible degrees of freedom (internal degrees of
freedom) using CrystalPredictor and CrystalOptimizer algorithms I use a similar
approach in Chapters 3 and 4 The fifth blind test showed that methodologies such as
DFT-D could reliably predict the structures of small organic molecules but GRACE was
unsuccessful for molecule XX11 CCDC released the sixth lsquoblind testrsquo molecules in mid-
September 201415 too late for me to take part By chance an informal lsquoblind testrsquo
challenge did arise during the second year of my research which is the focus of Chapter
3
29 Crystal Structure Comparison Collins et al150 argued that one of the problems modern scientists face is the issue of
structural similarity and difference They noted ldquocriteria for deciding when two crystal
structures are the same is an issue that divides many structural analystsrdquo Indeed this
problem of determining how similar or different two or more crystal structures are was
what inspired researchers to create methods for comparing crystal structures that exist
today The visual inspection of similarities and differences between crystal structures
does have its benefits but the method is slow and susceptible to human bias Thus
researchers need a practical computational method that enables them to identify identical
or similar structures
Identifying the similarities among crystal structures is important when deciding
whether a newly discovered structure is the same as an existing structure151 Sometimes
there is also a need to determine similarities when comparing many structures that are
related as in the case of 50 structures of carbamazepine (CBZ)150 Another reason for
identifying similarities lies in the field of CSP67152 where thousands of hypothetical
structures are generated and many structures converge to the same or approximately the
same structure during lattice optimization Therefore the removal of duplicates and the
production of unique lists of crystal structures are essential
The Mercury153 material module which has COMPACK151 embedded in it allows
graphical representation of the similarity among the polymorphs while standalone
COMPACK scripts can compare hundreds of thousands of crystal structures There are
29 Crystal Structure Comparison
60
three main tools in the material module153 motif search crystal packing feature and
crystal packing similarity tools The crystal packing similarity tool calculates the level of
packing similarities between crystal structures that have the same or similar compound
COMPACK computes these calculations by analysing the geometry of the cluster of
molecules There are two basic steps in comparing two crystal structures using
COMPACK The first step renders the chemical search query subject to several geometric
constraints using the reference molecular structure The second step is the structure
similarity search which involves searching the 3-D coordinates of a target for an
arrangement that matches the query to within specified tolerances The search is
performed by 3DSEARCH154 which is an efficient general search algorithm designed to
find chemical queries within 3D crystal structures information Once 3DSEARCH finds
a match the two structures can be superimposed to obtain a visual impression of their
similarity
The default values for a cluster size of 15 molecules a distance tolerance of 20 and
angle tolerance of 20 are usually used The default cluster size is 15 because the same
clustering results of 30 molecules instead of the default 15 molecules for 1000 predicted
structures of 2-amino-3-nitropyridine led Chisholm and Motherwell151 to the conclusion
that a cluster of 15 molecules is a sufficient size for identifying the same crystal structure
Other methods of comparing crystal structures do exist For example XPac155156
identifies similar sub-components of complete crystal structures of 0- 1- or 2-D in
polymorphs or crystal structures of similar molecules as well as of 3-D in isostructural
assemblies Hirshfeld surface (a way of exploring packing modes157) and fingerprint plots
(a visual representation of all intermolecular interactions simultaneously158) are examples
of Hirshfeld-based methods150159160 of analysing similarities The graphndashset analysis for
H-bonds compares and contrasts sets of molecules161-163 and is based on graph theory for
categorising H-bond motifs Moments of inertia tensors is a technique for comparing
crystal packing based on moments of inertia tensors irrespective of chemical connectivity
and hence the comparison of compounds of diverse chemical composition is possible164
Simulated powder X-ray diffraction165 is another example of comparing crystal
structures In short the comparison of compounds of diverse chemical composition is
possible
COMPACKrsquos ability to give just one number (the distance between matched atoms in
a cluster-root-mean-square-deviation) that shows the relationship between two structures
makes this similarity tool one of the simplest and most effective ways of quantitatively
29 Crystal Structure Comparison
61
rationalising similarity This is why COMPACK will be the primary choice for comparing
crystal structures in this thesis
31 Introduction
62
Chapter 3 An Informal Blind Test A Crystal Structure Prediction of
1-Benzyl-1H-tetrazole
ldquoOne of the continuing scandals in the physical sciences is that it remains in general
impossible to predict the structure of even the simplest crystalline solids from a
knowledge of their chemical compositionrdquo
mdash John Maddox Nature (1988)
31 Introduction
311 Background This chapter reports an informal lsquoblind testrsquo of flexible 1-benzyl-1H-tetrazole BT
(Figure 31) using similar CSP methodology that successfully predicted the very flexible
molecule XX in the fifth blind test1117 In essence I will test the viability of the CSP
method (sections 11 and 28) which has evolved over the years from predicting the
crystal structures of rigid molecules166-168 to molecules that are so flexible that their
conformational flexibilities are accounted for at the start of CSP1117
9
10
1
8
7
2
11
123
65
4
2
1
Figure 31 The chemical diagram of BT determined from the crystal structure Torsion
angles 1=C7-C6-N1-C5 and 2 = C12-C7-C6-N1
In the previous chapters I mentioned that the emergence of a new polymorph of
ritonavir two years after market lunch (section 11) as well as John Maddoxrsquos148
ldquocontinuing scandalrdquo remark in 1988 (section 286) were the catalysts of the lsquoblind testrsquo
challenge organised by the Cambridge Crystallographic Data Centre (CCDC) in 1999
These lsquoblind testsrsquo provided researchers all over the world an opportunity to test their
CSP methods But unfortunately the CCDCndashndashmy industrial sponsorndashndashdid not organise
any lsquoblind testsrsquo during the course of the research reported in this thesis15 By chance my
colleague Rex Palmer observed an unusual packing of BT crystal structures and
subsequently issued me a lsquoblind testrsquo challenge This challenge was to predict the crystal
structure of BT given just the chemical diagram (Figure 31) and given that Z´=1
31 Introduction
63
The drug discovery literature frequently mentions the motifs of 5-substituted 1H-
tetrazole as bioisosteres for the carboxylic acid group169-171 due to the motifsrsquo similar pKa
values shapes and steric interactions Bioisosteres are structural moieties with broadly
similar shapes and functions For pharmaceutical industries the ability to model the
interactions of tetrazoles including BT is of great interest due to tetrazolersquos bioisosteres
feature
312 Experimental Determination of 1-Benzyl-1H-Tetrazole My collaborators (John Spencer Hiren Patel John J Deadman Rex Palmer Louise
Male and Simon J Coles) carried out the following experiments (their findings in
sections 313 and 314 were not made available to me until the end of the lsquoblind testrsquo
ie the submission of my candidate structures)
Synthesis and X-Ray Crystallography
John J Deadman synthesized BT on a ca 50 mmol scale from benzylamine sodium
azide and triethyl formate Hiren Patel under the supervision of John Spencer grew the
single crystals of BT from dichloromethanendashhexane
Louise Male and Simon J Coles collected the X-ray data and did the preliminary
analysis A colourless crystal fragment of dimensions 009 003 002 mm3 was
mounted on a glass fibre and flash-frozen to 120 K The X-ray data were collected on a
Bruker diffractometer using Mo K radiation The crystal structure was solved by direct
methods SHELXL-97172-174 was used to refine the crystal structure
313 Molecular Geometry of the Experimental Structure My collaborators discovered that BT crystallised in the monoclinic space group P21
with unit cell dimensions a = 76843(5) b = 55794(4) c = 94459(7) Aring = 100949(4)
deg V = 39761(5) Aring3 Z´= 1 and density = 1338 g cm-3 Overall the benzyl and tetrazole
rings were essentially planar including the H atom on the CH group (see C5 in Figure
31) belonging to the 5-membered tetrazole ring The individual rings were also co-planar
with the inter-ring link C6 atom (Figure 31) The N-N bonds (see bond lengths in Table
31) were of three different types consistent with Figure 31 N1-N2 = 1343(2) Aring N2-N3
= 1301(2) Aring is longer than a typical N = N bond175 but shorter than a typical aromatic
bond N3-N4 = 1368(2) Aring was also largely aromatic in character175 The two C-N bonds
have different characteristics C5-N4 = 1314(2) Aring was a double bond C5-N1 = 1336(2)
Aring was typically aromatic175 The phenyl rings of BT have a normal geometry with
average CndashC bond length of 1386(4) Aring average bond angle of 1200(7) and ring
planarity root mean square (rms) deviation of 00057 Aring The bond angles in the tetrazole
31 Introduction
64
ring have an average of 1080(17) which is consistent with the planarity of the ring
having an rms deviation of 0012 Aring including the link C atom and H5 on C5 These bond
lengths and angle measurements are similar to those of 5-azido-1H-tetrazole176
Table 31 Angles and bond lengths of the tetrazole ring in BT No information about the
bonds or angles were given to me prior to submission of the candidate structures
Angles X-ray
deg Bond lengths X-ray
Aring
N1-N2-N3 1069(2) N1-N2 1343(2)
N2-N3-N4 1102(2) N2-N3 1301(2)
N3-N4-C5 1052(2) N3-N4 1368(2)
N4-C5-N1 1096(2) N4-C5 1314(2)
C5-N1-N2 1080 (2) C5-N1 1336(2)
C5-N1-C6 1305(2) N2-C1 1472(2)
N2-C1-C6 1215(2)
314 Crystal Packing Weak Hydrogen Bonding Rex Palmer noticed that the mode in which the molecules in the experimental crystal
structure BT were packed was unusual He noted that a molecule such as BT based on
linked delocalized rings might be expected to form crystal structures involving ∙∙∙
bonding (ring stacking) However no such interactions occurred in the experimental
structure (Figure 32) Instead the structure was held together by a large number of weak
intermolecular contacts177178 12 of these were of the CH∙∙∙N interaction and 3 were of
the weaker CH∙∙∙C interaction which involve atoms in the phenyl ring This unusual
packing resulted in a structure composed of infinite S-shaped layers and produced a
sequence of benzyl and tetrazole layers (Figure 33) Another unexpected feature of the
packing was the formation of tetrazole clusters (Figure 32a) each having a central
tetrazole ring coordinated by six other tetrazoles
Figure 32 The crystal structure of BT (a) Partial view of the crystal packing showing
close CH∙∙∙N contacts between a central tetrazole and six surrounding tetrazoles (b)
Partial view showing CH∙∙∙N CH∙∙∙C and CH∙∙∙ contacts
(a) (b)
31 Introduction
65
Figure 33 BT crystal structure (a) View of the infinite S-shaped layers held together by
weak CH∙∙∙N and CH∙∙∙C H-bonds (b) Partial view of the layer structure showing
alternative B(benzyl) and T(tetrazole) layers and the repeating layer sequence [BTBT |
TBTB]
315 Overview of the Challenge After my experimental collaborators grew single crystals of BT from a non-polar
solvent mixture and determined the crystal structure at 120 K I was issued a lsquoblind testrsquo
challenge by Rex Palmer to predict the crystal structure of BT because of the unusual
mode of crystal packing (section 314) No experimental information was given prior to
the submission of the candidate structures The subsequent part of this chapter presents
the computational work I carried out independently upon receiving the chemical diagram
of BT (Figure 31)
This chapter uses CSP methodology (section 322) to predict the crystal structure of a
molecule that can adopt a wide range of molecular shapes due to the conformational
flexibility of the molecule Consequently the conformational flexibility must be
accounted for at the start of CSP (CrystalPredictor 16 section 281) In addition this
method relies on the systematic improvement of the evaluation of the lattice energy Elatt
where Uinter and Eintra are the intermolecular and intramolecular contributions X and
vector θ denote intermolecular and intramolecular degrees These systematic
improvements increase the computing time As a result it is essential to reduce the
number of crystal structures that will be examined as the confidence in the lattice energy
ranking improves in each step
This chapter will also test the transferability of the intermolecular energy potential to
BT since this molecule contains a functional group that differs from those used in
determining the parameters of the intermolecular potentials (section 23)3839
Elatt = Uinter(X θ) + ΔEintra(θ)
31
(b) (a)
32 Computational Methodology
66
To determine whether this study is a success the predicted structures of BT will be
compared with the experimental crystal structures using a similarity tool In addition I
will compare and contrast the most stable generated structures of BT with the similar
tetrazole fragment structures to determine whether the packing of the experimental
structure of BT was unusual In this chapter I will show that the crystal structure of BT
can be successfully predicted starting from just the chemical diagram (Figure 31)
32 Computational Methodology
321 Conformational Analysis To restrict the search space of BT to energetically meaningful regions I carried out
quantum mechanical (MP26-31G(dp) single-point calculations on HF6-31G(dp)
optimised geometries) scans of the two flexible torsions 1 and 2 (Figure 31) using the
GAMESS179 program
322 Crystal Structure Prediction Step 1 The search was carried out using the CrystalPredictor126 program which
covered the 59 most commonly occurring space groups The lattice energy was minimised
by varying the cell parameters and torsion angles 1 and 2 within energetically
meaningful regions (section 321) At this stage the lattice energies (equation 31) were
crudely estimated and then using the grid of the ab initio results from section 321 the
ΔEintra contribution were interpolated The intermolecular electrostatic interactions were
modelled using the atomic charges derived from section 321 All other intermolecular
energy terms were derived from an empirical exp-6 potential FIT40 Approximately a
quarter of a million lattice energy minimisations were performed This produced
approximately 170000 distinct structures of which 44000 structures were unique These
generated structures were labelled by their energy ordering The result of step 1 is the
CrystalPredictor energy landscape
Step 2 Next the lattice energy model was improved For each of the lowest 10000
crystal structures the energy of the isolated molecule and its charge distribution were
calculated at the PBE06-31G(dp) level of theory using GAUSSIAN0353 This
calculation provided a better estimate of ΔEintra and a more accurate representation of the
charge density in terms of a distributed multipole model51 These two contributions were
then combined with an atomndashatom exp-6 repulsion-dispersion potential using parameters
that had been fitted to azahydrocarbons39 and polar crystal structures40 which were
assumed to be transferable to this tetrazole At this stage the lattice energy was
minimised with the molecule held rigid using DMACRYS34
33 Results and Discussion
67
Step 3 Approximately 100 of the most stable structures were then further refined at
the PBE06-31+G(d) level of theory by allowing the molecular conformation to adjust
more accurately to the intermolecular forces using the program CrystalOptimizer7172
(section 282) This algorithm allowed the intermolecular and intramolecular energy to
be minimised simultaneously The CrystalOptimizer program uses the Quasi-Newton
algorithm coupled with a line search to solve the minimisation program It also makes use
of GAUSSIAN0353 calculations on the molecular conformations and DMACRYS34
optimisations of the crystal structure
Step 4 The effect of the crystal environment on the conformational energies ΔEintra and
charge densities was estimated by calculating the conformational energy and charge
distribution in a Polarizable Continuum Model (PCM)180 with =3 a value typical of
organic molecules131 This calculation was implemented in GAUSSIAN0353 at the
PBE06-31+G(d) level of theory The result of step 4 is the PCM crystal energy landscape
33 Results and Discussion
331 Conformational Energy Grid
Figure 34 The conformational energy grid used in the search Relative intramolecular
energies ΔEintra (kJ mol-1) for isolated molecule calculations at the MP26-31G(d p)
level of theory
Prior to the generation of hypothetical structures it was necessary to investigate the
possible steric hindrances to rotation about the two flexible torsion angles 1 and 2
(Figure 31) The result shown in Figure 34 indicates a high degree of flexibility in the
molecule The purple colours represent regions with the smallest energy penalty ie the
33 Results and Discussion
68
most stable conformations This high degree of flexibility makes possible a wide range
of crystal structures with different molecular shapes For this reason the generation stage
(step 1 of sections 322 and 332) incorporates conformational flexibility from the start
332 The CrystalPredictor Energy Landscape The analyses presented here are post-process ie after submitting the ten most likely
crystal structures on the PCM (final) energy landscape (step 4 section 333) The energy
landscape after step 1 (CrystalPredictor) is displayed in Figure 35 This step estimated
the lattice energies Elatt very crudely by interpolating the atomic charges and
intramolecular energies (Figure 34) Yet the generated structure that matched the
experimental structure of BT at this stage was only ranked 23rd This structure BT_23
which is highlighted in red on Figure 35 has only a 3 kJ mol-1 energy difference in
comparison with the global minimum structure
Figure 35 The CrystalPredictor energy landscape of BT generated with a crude lattice
energy model The generated structure that matched the experimental structure is
highlighted in the open red symbol
333 The CrystalOptimizer and PCM Energy Landscapes The two most stable crystal structures on the PCM energy landscape (Figure 36b) have
similar lattice energy less than 01 kJ mol-1 The lsquoblind testrsquo was deemed a success
because the experimental structure matched the second most stable crystal structure
2BT_23 on the PCM energy landscape (Figure 36b and Table 32) This PCM energy
landscape was generated after CrystalPredictor (step 1 Figure 35) lattice energy
refinement (step 2) CrystalOptimizer (step 3 Figure 36a) and PCM calculations (step
33 Results and Discussion
69
4 Figure 36b) Compared to the first step (step 1 Figure 35) the lattice energy rank of
the experimental structure improved significantly from 23rd to 2nd
Figure 36 (a) The CrystalOptimizer (step 3) and (b) PCM (step 4) energy landscape of
BT GM is the global energy minimum The open red symbol represents a match between
the experimental crystal structure and the generated structure The energy ranking of the
crystal structure that matches the experimental has improved from fourth most stable 4
to second most stable 2
(a)
(b)
33 Results and Discussion
70
I submitted a list of 10 structures in which the 2BT_23 structure was selected as the
first choice while the global minimum (labelled GM on Figure 36b) was selected as the
second choice181 The main reason for selecting 2BT_23 as the first choice was the
notable improvement of energy rank from fourth (Figure 36a step 3) to second (Figure
36b step 4) In addition the two most stable crystal structures on the PCM energy
landscape (Figure 36b step 4) were only 01 kJ mol-1 apart
Table 32 Summary of experimental (highlighted in blue) and computed crystal
structures on the PCM energy landscape (Figure 36) The computed structure that
matched the experimental structure (section 312) is highlighted in bold For label
xBT_y x and y are energy ranked after steps 4 and 1 of CSP respectively (section 322)
Label Space Group
a b c
Aring
β
deg
ρ
g cm-3
Uinter ΔEintra Elatt
kJ mol-1
1BT_120 P21c 999 817 1104 11750 133 -12176 225 -11952
2BT_23 P21 793 555 944 10132 131 -12152 208 -11944
Experiment P21 768 558 945 10095 134 - - -
3BT_165 P21c 1086 554 1597 12141 130 -12109 270 -11839
4BT_335 P212121 938 1581 556 9000 129 -12032 200 -11833
5BT_767 P21c 941 553 1580 10234 132 -12044 214 -11830
6BT_167 P21 568 839 881 10322 130 -12289 504 -11785
7BT_912 P21 557 869 861 10365 132 -11882 143 -11739
8BT_34 P21c 809 553 1859 10166 131 -11919 219 -11700
9BT_491 Pna21 1666 566 858 9000 131 -12299 626 -11673
10BT_250 P212121 1904 557 778 9000 129 -11916 325 -11591
11BT_55 P21c 1080 556 1582 12232 132 -11979 396 -11583
12BT_490 P21c 653 866 1394 9428 135 -12098 521 -11577
13BT_178 P212121 833 561 1764 9000 129 -11789 232 -11557
334 Did the Predicted Structure Really Match the Experimental Rex Palmer provided the cif file of the experimental structure once ten of the most
stable structures on the PCM landscape were submitted (Figure 36b) Then I compared
the experimental structure with the submitted crystal structures using COMPACK151 The
computed 2BT_23 structure my first choice (section 333) gave an excellent overlay
with 15 molecules of the experimental structure with a root mean square difference
RMSD value of only 0148 Aring (Figure 37) This computed 2BT_23 structure has similar
unit cell dimensions (Table 32) and is in the same space group P21 as the experimental
structure
33 Results and Discussion
71
Figure 37 The 15-molecule overlay between the experimental (atomic colours) and the
second most stable computed structure 2BT_23 (green) The direction of the view
obscures some of the molecules
In addition to excellent RMSD15 overlay the 2BT_23-generated structure provided a
starting model that was easily refined in SHELXL-97 which was further proof that the
structure was a genuine reproduction of the experimental crystal structure (section 312)
Hence it is clear that the CSP method outlined in this chapter which uses only the
chemical diagram as prior information can successfully predict the crystal structure of a
flexible molecule
335 The Global Minimum Structure on the PCM Energy Landscape The global minimum GM structure labelled 1BT_120 on the PCM energy landscape
(Figure 36) was very different from the experimental crystal structure as only two
molecules overlaid (Figure 38) during similarity calculations From the overlay of the
similarity calculations (Figure 38) it is clear that the GM and the experimental structure
have different conformations The GM structure 1BT_120 (Table 32) is in space group
P21c and has a very different spatial arrangement (as shown in Figure 39) when
compared to the experimental structure (Figure 32 and Figure 33) This structure also
has dominant weak H-bonds 8 CH∙∙∙N and 1 CH∙∙∙C interactions There was also one
weak ∙∙∙ benzyl∙∙∙benzyl interaction (Figure 39)
The similar lattice energy values of the two most stable structures generated (Figure
36b) suggest that the GM structure could a polymorph This GM structure could be
33 Results and Discussion
72
synthesised at high pressure because it is the denser of the two most stable structures
Also growing the experimental structure using a non-polar solvent (section 312) may
have prevented H-bonding formation
After the generation step (CrystalPredictor) the initial rank of the most stable crystal
structure after step 4 GM was 120th The eventual rank was first despite the fact that
only about 100 structures were optimised this shows the importance of the novel
intermediate step 2 in the CSP method After the CrystalPredictor step 1 the GM
structure was 9 kJ mol-1 less stable than the experimental 2BT_23 structure and had
distinctly fewer close contacts than the experimental 2BT_23 structure Therefore the
rearrangement of lattice energy depends on the method used
Figure 38 Crystal Packing Similarity between experimental (grey) and the most stable
predicted structure (1BT_120 green) with only 2 molecules matching (RMSD2 = 1072
Aring)
Figure 39 The structure corresponding to the global minimum in lattice energy
(1BT_120) showing the dominant weak H-bonds (Aring) eight of type CH∙∙∙N and one
CH∙∙∙C and the weak ∙∙∙ interaction (benzylmiddotmiddotmiddotbenzyl)
33 Results and Discussion
73
336 Post Analysis Comparison of Structure with CSD The motivation for the lsquoblind testrsquo challenge was the unusual packing of the
experimental structure Thus a database containing over half-million crystal structures
was searched in an effort to investigate the breadth of variation in the packing of the
experimental structures of BT A Cambridge Structural Database (CSD)182 survey was
carried out to compare BT with other 1-substituted 1H-tetrazole crystal structures (Figure
310) The CSD version 533 March 2012 was searched for fragments defined in Figure
310 The bond lengths bond angles and torsion were analysed and compared with the
experimental structure using histogram plots
1
6
23
5
4
Figure 310 Query used in Conquest to search the CSD for similar fragments
The query of the CSD yielded 34 structures including two redeterminations The
refcodes of these 32 structures were ACIROU ACIRUA BEGRIP CAZWIK
DOKQEA DOKQIE EKAJOQ HISYEO IQUJEK ABMIL LUVPIC MEVWOZ
MUKMAG PHTETZ01 PUGLUZ QALNOH QALNUN QALPAV QALPID
QALPOJ QALPUP QALQAW QALQEA01 QALQIE QEBPUI01 REVMOV
REZNUG RIZXEE SOLHAD TIJLIH VUNNUO and OBAREQ
The experimental bond lengths were typical of those in the other crystal structures
containing the 1-substituted 1H-tetrazole group (Figure 311) Some significant
differences ( 002 Aring) were observed between the ab initio computed values and the
experimental bond lengths but both were within the observed ranges The variations in
tetrazole bond angles (Figure 312) were consistent with the bond length variations for
this moiety176 which was always close to planar The external torsions angles ξ1 and ξ2
exhibited a wide range of values (Figure 312) a result that was consistent with the large
range of low-energy conformations (Figure 34) despite the range of functional groups
bonded to C6
No tetrazole clusters were observed for the 32 1-substituted 1H-tetrazole structures
found in the CSD There were however some tetrazole layers in 1BT_120 and the
33 Results and Discussion
74
experimental structures DOKQIE EKAJOQ QALPAV QALPOJ QALPUP and
REVMOV All 32 structures had the tetrazole bonded to a sp3 carbon and were tetrazole
hydrocarbons (except QALPAV which also contained an iodine atom) Hence there was
no strong driving force for the tetrazole cluster Still a layer structure seemed to be quite
favourable in cases where there were no competing strong interactions There were more
similarities between the CSD tetrazole structures and the GM structure than there were
between the experimental structures This finding suggests that the use of informatics of
CSD in CSP such as Desirajursquos supramolecular synthon approach183 would weight the
global minimum structure more than the experimental structure
Figure 311 Histograms showing the bond length distributions of 32 1-susbtituted 1H-
tetrazole rings in the CSD The red square denotes the experimental bond lengths in BT
while the black square denotes the ab initio bond lengths in the corresponding calculated
structure 2BT_23
33 Results and Discussion
75
Figure 312 Histograms showing the distributions of the torsions and angles of the 32-
tetrazole rings found during the CSD survey The experimental bond length in BT is
denoted by the red square while the ab initio bond length in the corresponding calculated
structure 2BT_23 is denoted by the black square
34 Summary
76
34 Summary I successful predicted the unusual crystal packing of BT given just the chemical
diagram and the Z´ number The packing was predicted by using a model that accurately
determines the electrostatic forces arising from molecular charge density including the
anisotropic forces from the lone pair and electrons but otherwise was not tailored to
the tetrazole∙∙∙tetrazole interactions Thus the intermolecular energy potential is
transferable to BT crystal structure even though the functional group used in determining
the parameters of the intermolecular potentials did not include a single tetrazole molecule
The successful prediction of the experimental structure as one of the two distinct most
stable structures shows that the unusual layers do present an optimal compromise between
the many different weak hydrogen bonds and other intermolecular interactions The most
stable crystal structure GM could well have been an undiscovered polymorph In fact
informatics weighting may have selected this structure Thus this study shows the
potential value of CSP for generating unexpected structures
This study also showed that the level of computational chemistry modelling that was
used is suitable for modelling the molecular recognition of this functional group This
level of modelling could become increasingly useful in pharmaceutical design due to
tetrazolesrsquo bioisosteres properties In the next chapter more will demanded of CSP Will
this method deliver
41 Introduction
77
Chapter 4 Is the fenamate group a polymorphophore Contrasting the
crystal energy landscapes of fenamic and tolfenamic acids
ldquoIts the little details that are vital Little things make big things happenrdquo
mdash John Wooden
41 Introduction This chapter builds on Chapter 3rsquos description of a procedure that successfully
predicted the experimental crystal structure of a flexible molecule in order to address two
specific questions First in a given molecular structure is the presence of a
polymorphophore (section 11) substructure sufficient to ensure polymorphism Second
what role do substituents play in determining the range of polymorphs that are present in
a molecule
In this investigation of the concept of polymorphophore I will use CSP to contrast the
crystal energy landscapes of two fenamates (Figure 13) monomorphic fenamic acid (2-
(phenylamino)-benzoic acid FA) and one of its highly polymorphic derivatives
tolfenamic acid (2-[(3-chloro-2-methylphenyl)amino]-benzoic acid TA) TA is a good
test case for this investigation into whether the fenamate group is a polymorphophore
because at the start of this study TA had five known polymorphs19
The term ldquofenamaterdquo can refer to a range of molecules that vary widely in molecular
structure including niflumic acid which contains an aromatic nitrogen Although some
researchers who have conducted thermodynamic and structural investigations of
fenamate molecular crystals have included an extraordinarily wide range of molecules
even dichlofenac184 the present study is restricted to the fenamates shown in Figure 13
Essentially I will focus on cases where the dominant interactions that determine the
crystal or drug binding are inherent in the proposed polymorphophore families of fenamic
acid (Figure 13)
41 Introduction
78
ROY fragment
WIFHUP 2185
R=H
ROY
QAXMEH 7(3)20
R2=CH3
OGIDEN 3186
R2=R5=CH3
Fenamate fragment
Fenamic acid (FA)
QQQBTY 1187
R=H
Tolfenamic acid (TA)
KAXXAI 519
R1=CH3 R2=Cl
Flufenamic acid (FFA)
FPAMCA
2(1)22
8(1)18 in 2012
R2=CF3
PEFMET 1188
R1=CH3
PEFNAQ 1188
R2=CH3
SURMEY 1187
R3=CH3
Mefenamic acid
XYANAC 2(1)189190
R1=R2=CH3
SURMOI 1187
R2=R4=CH3
LAHLOW 1191
R1=R5=CH3
Figure 41 The polymorphophore families of ROY and fenamic acid The numbers of
polymorphs in the Cambridge Structural Database (CSD) follow the refcodes for each
specific molecule and (x) denotes the number of additional polymorphs that whose
crystal structures were not available The lowest two rows are fenamates whose structures
are used in Table 46
41 Introduction
79
411 Polymorphism and Polymorphophores Polymorphism (section 11) the occurrence of multiple crystal structures with the same
chemical content is now known to be a widespread phenomenon among organic
molecules192 and is of great importance in the industrial manufacture of specialty
chemicals and pharmaceutical products Relatively few systems have several polymorphs
whose crystal structures and relative stabilities have been determined the most
thoroughly investigated20 being the polymorphs of 2-[(2-nitrophenyl)amino]-3-
thiophenecarbonitrile commonly known as ROY (Figure 13) after the red orange and
yellow colour spectrum of the first six polymorphs to be reported193 Some families of
related molecules23194 such as the sulphonamides194 ROY derivatives23 barbiturates195
carbamazepine derivatives147196 and fenamates19 appear to have a strong tendency
toward polymorphism This fact has given rise to the study of a polymorphophore1923196
a term coined by Matzger23 that refers to a structural element that when incorporated into
a molecule favours the formation of polymorphic crystal forms Hence
polymorphophore is a descriptive term and not a quantifiable hypothesis
The focus of this chapter is the polymorphophore concept Some families of molecules
contain a common substructure (the polymorphophore) wherein many members but not
necessarily all exhibit polymorphism For example removing or adding a methyl group
to ROY creates molecules (Figure 13) that are also polymorphic indicating that ROY is
a polymorphophore (Figure 13) However the number of related molecules is limited
probably because ROY is only a precursor in the synthesis of the blockbuster drug
olanzapine Studying polymorphophores is like studying pharmacophores a particularly
promising way of finding new leads in drug discovery especially in cases when a
receptorrsquos 3D structure is unknown197
This chapter considers the fenamates that conserve the H-bonding groups and dominant
molecular shapes by having small non-polar substituent groups for the aromatic protons
as exemplified in Figure 13 These types of substituent(s) might be expected to have
minimal effects on the strongest intermolecular interactions and hence on either crystal
packing or drug receptor binding The fenamates contain a proposed
polymorphophore1819 that is related to that of ROY (Figure 13) in having a phenyl group
attached via an N-H group to a further aromatic ring
412 Conformations in known Crystal Structures The overlay of the conformers of FA and TA in the experimental crystal structures
(Figure 42) confirms that the main variation in conformation is the ξ1 torsion angle The
41 Introduction
80
two most stable polymorphs of TA forms I and II (blue and red in Figure 42) have the
greatest difference in ξ1 The benzoic acid ring and the N-H groups are coplanar with the
ξ2 torsion angle being approximately zero concordant with the intramolecular H-bond
Figure 42 Overlay of the experimental conformers of FA (top) and TA (bottom) viewed
with the overlaid benzoic acid fragment arranged horizontal FA QQQBTY02 (Z´=2
light blue and magenta) TA KAXXAI01 (Form I Z´=1 blue) KAXXAI (Form II Z´=1
red) KAXXAI02 (Form III Z´=2 green and purple) KAXXAI03 (Form IV Z´=3
yellow brown (obscured by yellow) and black) and KAXXAI04 (Form V Z´=1
disordered on both sites (section 415) violet and grey) The arrows point to the main
variation (ξ1) between the conformers of FA and TA in the experimental crystal
structures
413 Experimental Data of FA and TA FA has just one known form187 which has two molecules in its asymmetric unit Z FA
serves as a parent structure for several fenamates including TA TA is a non-steroidal
anti-inflammatory drug used for the treatment of rheumatic conditions198 At the start of
this study TA had at least five polymorphs forms I-V19199 It currently has six
polymorphs (see section 438) Unlike ROY the polymorphs of TA vary in the number
ξ1
ξ1
41 Introduction
81
of molecules in the asymmetric unit Z´ (Table 41) The variation in colour that is
observed between form I (colourless) and II (yellow) is due to the conformational
difference as observed for ROY2023 There were three undisputedly metastable
polymorphs including form V whose disorder is analysed further in section 415
Here it is necessary to discuss further the relative stability of forms I and II (Table 41)
The enthalpy and temperature of fusionHfus and Tfus measurements provide a way of
classifying polymorphs as either being monotropic or enantiotropic Four different
papers19199-201 have presented evidence for the thermodynamic relationship between
forms I and II but each paper gives slightly different conclusions Surov et al showed
that the yellow form (form II) is more stable than the white form (form I)201 and that these
polymorphs have a monotropic relationship because the form with the higher melting
temperature form II has a higher enthalpy of fusion Hfus (by the enthalpy of fusion
rule)202 as illustrated in Figure 43(a) However Mattei and Li200 measured an
endothermic transformation going from II to I with temperature increasing to 1418 degC
with a Differential Scanning Calorimetry (DSC) implying that forms I and II have an
enantiotropic relationship as shown in Figure 43(b) The observed transformation from
form II to I in a slurry experiment indicated that the thermodynamic transition point was
below room temperature All three sets of measurements199-201 that were extrapolated to
0 K had form II more stable than form I
Table 41 The experimental data of the known forms of FA and TA Crystal structures
and Hfus values were taken from ref [19] unless otherwise specified aThe most widely
varying torsion angle ξ1 is defined in Figure 49 bTemperature of crystal structure
determination cMelting temperature
REFCODE (form)
Space Group
Z´ ξ1a
deg Tb
K
Hfus
kJ mol-1
Tmc
K
FA QQQBTY02 P-1 2 4721 7045 283-303187 - - TA KAXXAI01(I) P21c 1 10774 3937 48625-4886
110 4250 48405199
410plusmn05 48418plusmn02201
4127 48585200
KAXXAI(II) P21n 1 4223 387 48667
110 4840 48765199 490plusmn05 48578plusmn02201
4240 41495200
KAXXAI02 (III) P21c 2 4419 5764 85 - KAXXAI03 (IV) P-1 3 673457584784 85 3188 KAXXAI04 (V) P-1 1 5562 85 -
41 Introduction
82
Figure 43 Temperature dependence of the enthalpy (H) and free energy (G) diagrams
for forms I and II of TA showing a monotropic (top) relationship from data from
Surov201 which are qualitatively the same as data from Andersen199 and an enantiotropic
(bottom) relationship from data from Mattei and Li200
Lopez-Mejias et al19 provided the only thermodynamic data available for forms IIIndashV
The researchers noted that heating forms III and V at 80degC caused a transformation to
form I within a period of minutes to hours In solution forms III IV and V transformed
to form I or a mixture of form I and II Hence forms III IV and V were shown to be
metastable polymorphs The heats of fusion given in Lopez-Mejiasrsquo supplementary
information19 were listed by the initial form and forms III and V may well have
transformed to form I rather than form II Therefore these sets of data were inconclusive
as to the relationship between forms I and II
(a)
(b)
41 Introduction
83
414 Similarities between the known forms of FA and TA The known polymorphs of TA and FA showed some similarities (Table 42) as all were
based on the H-bonded dimer (Figure 44a) The graph-set analysis161162 for the (two)
types of H-bonds are identical for all the crystal structures of TA and FA intermolecular
dimers with 2 donors 2 acceptors and 8 atoms in total (11987722(8)) and intramolecular with 1
donor 1 acceptor and 6 atoms in total (S(6))201
Form II had the most distinctive packing (Figure 44b) as well as conformation (Figure
42b) and was the only structure with a short contact involving the chlorine atom and the
aromatic ring The most striking result from Table 42 was the similarity between the
metastable forms III and IV where 11 molecules could be overlaid (Figure 44c) The
two independent molecules in form III had similar conformations to two of the three
independent molecules in form IV (compare the open circle and closed triangle symbols
in Figure 412a) The polymorphs had sufficiently similar simulated powder patterns to
have a PXRD similarity measure in the grey area between polymorphism and
redeterminations203 and for this reason they exemplify the challenges in defining
polymorphism204205
Table 42 Quantification of the similarities of FA and TA crystal structures showing the
packing similarity (RMSDn) and powder X-ray diffraction (PXRD) similarity206 The
bold numbers indicate the number of molecules n that match within distance and angle
tolerances of 20 and 20deg respectively with the RMSDn values in brackets See section
425
n(RMSDnAring)
FA TA(I) TA(II) TA(III) TA(IV)
FA - 6(066) 2(048) 3(074) 5(108)
TA(I) 078 - 1(087) 3(078) 3(107)
TA(II) 085 086 - 2(077) 2(074)
TA(III) 078 083 090 - 11(045)
TA(IV) 078 084 092 098 -
TA(V) 086 089 093 091 093
PXRD Similarity
41 Introduction
84
Figure 44 Features of the experimental crystal structures (a) The hydrogen-bonded
dimer motif found in all structures with variations in the phenyl ring orientations (ξ1)
The specific illustration shows the packing similarity between FA (QQQBTY02) and TA
form II (KAXXAI) (b) The unique packing of TA form II with short contacts between
chlorine and the aromatic ring (c) Crystal Packing Similarity between form III and form
IV of TA showing the 11-molecule overlay which includes only two dimers
415 Solving the Connectivity Problem of a Disordered Form The crystal structure of Form V of TA was solved with an R-factor of 658 the whole
molecule was equally disordered over two sites19 I found that separating the two
components of disorder gave the wrong connectivity between the C8 and N1 atoms (green
in Figure 45b) The C8-N1 bond length of 170 Aring was unusually long and this caused the
breakdown of the trigonal planar relationship of nitrogen C7-N1(H6)-C8 connectivity
(c)
(b) (a)
41 Introduction
85
(Figure 45c) A model with the two components both corresponding to the expected
molecular geometry can be made by redefining the connectivity (Figure 45b) to link half
of one disordered molecule (the bonded molecule in Figure 45a) with half of the other
disordered molecule (the atoms-only component in Figure 45a) The second component
was formed by combining the remaining halves The resulting molecules (red and blue in
Figure 45b) have the expected C-N bond length of 143 Aring and a trigonal planar geometry
around the nitrogen atom
The above procedure results in three ordered Z=2 crystal structures with the unit cell of
form V by using the two resulting molecules (Figure 46a b for Z´=1 and Figure 46c for
Z´=2)
Figure 45 (a) Crystal structure KAXXAI04 of form V of TA (b) The atom connectivity
of the two new components (colour red and blue) the original C-N connectivity is
labelled green (c) Chemical diagram showing the atomic connectivity of TA
9
1
1
2
10
1
813
14
7
164
21
1 53
2
(a)
(b)
(c)
41 Introduction
86
Figure 46 Ordered Z=2 crystal structures formed from the disordered components of TA
form V (a) Form V_a (b) Form V_b and (c) Form V_c
(a)
(b)
(c)
42 Computational Methods
87
416 Overview The focus of this chapter is the polymorphophore concept which I will investigate by
generating crystal energy landscapes (section 285) of FA and TA These crystal energy
landscapes are a valuable tool for examining the known forms of different molecules
because the same level of polymorph screening is rarely applied to entire families of
molecules This is likely the case for FA and TA since TA is a drug molecule while FA
is not In addition there were far more publications for TA than FA (see section 413)
For these reasons FA and TA provide a good test for the concept of polymorphophore
In this chapter the energy landscapes of FA and TA will be generated by first selecting
a suitable ab initio level of theory for the conformational energy of the isolated molecule
I will achieve this by performing ab initio scans at various levels of theory Then these
ab initio scans will be compared with histogram plots of crystal structures whose
fragments are similar to FA and TA The analysis of these scans and plots will guide the
methodology I will use to generate the hypothetical structures The final energy
landscapes of FA and TA will be generated by systematically increasing the accuracy of
evaluating the lattice energies while reducing the number of generated structures Finally
I will compare the crystal structures on the energy landscapes for FA and TA using a
similarity tool
I will show the conformational flexibility of fenamate fragments allows the potential
for a large number of structures and that it is the substituents that determine if a molecule
is polymorphic or not In other words polymorphophore promotes but does not guarantee
polymorphism Concisely CSP goes beyond the lsquoblind testrsquo described in Chapter 3
42 Computational Methods
421 Ab initio Conformational Profile of TA To test the effects of ab initio methods on the conformation profile of TA I compared
relaxed scans at various levels of theory of the main torsion ξ1 (Figure 49) with single-
point energy calculations at the MP26-31G(dp) level of theory The effect of rotating
the H-bonded torsion ξ2 (see Figure 49) was investigated by performing a relaxed scan
at the PBE06-31+G(dp) level of theory The results from these scans helped in selecting
the appropriate level of theory as well as the torsion that would be allowed to rotate during
the generation of hypothetical structures (step 1 section 423)
422 CSD Survey for Fenamates The relaxed conformational scans of the main torsion angle ξ1 (section 421) at the
PBE06-31+G(d) level of theory were complemented by a Conquest207 search of the
Cambridge Structural Database (CSD 208) for the crystal structures containing the
42 Computational Methods
88
molecular fragment shown in Figure 47 This comparison allowed us to see the variation
in ξ1 when there was an internal H-bond (ZmiddotmiddotmiddotH lt 26 Aring) that constrained part of the
molecule to planarity
dlt26Aring
Figure 47 Query fragment and the torsion angle ξ1 measured in the Conquest207 survey
of the CSD structures There were 131 organic structures where Y=H and 94 where Yne
H
423 Crystal Structure Prediction I calculated the crystal energy landscapes14 of FA and TA using a method209 that was
adapted from that used for the highly flexible molecule XX in the fifth blind test of CSP11
a method that called for an approximate conformational energy surface in the initial
search stage (see section 281) The final energy landscapes of FA and TA were generated
in four steps with the quality of the methods increasing and estimated the conformational
energy penalty Eintra and the intermolecular contribution Uinter to the lattice energy Elatt
Step 1 (Generation of hypothetical crystal structure) Crystal structures with Z´=1 were
generated in 15 common space groups P1 P-1 P21 P21c P21212 P212121 Pna21
Pca21 Pbca Pbcn C2c Cc C2 Pc and P2c using CrystalPredictor126 The grid was
used to extrapolate the atomic charges and intramolecular energy Eintra This grid was
pre-computed as a function of just ξ1 (Figure 48) using GAMESS179 at the MP26-
31G(dp) level of theory (single-point calculation) after the molecular geometries were
optimized at the HF6-31G(dp) level The intermolecular contributions to the lattice
energy were calculated crudely from the atomic charges and the Williams135 exp-6
repulsion-dispersion potential The CrystalPredictor program carried out 250000 lattice
energy minimizations This resulted in 162288 and 182615 distinct structures for TA
and FA respectively of which 16543 and 22884 were unique for TA and FA
respectively
Elatt = Uinter + Eintra = Uinter + Uelec + Eintra 41
42 Computational Methods
89
Figure 48 The fragment used in the CrystalPredictor search for TA Each fragment was
kept rigid during the search for hypothetical crystal structures
Step 2 (Accurate evaluation of the electrostatic contribution (Uelec)) Single-point ab
initio calculations were carried out on the conformation for each of the unique structures
from step 1 using GAUSSIAN0353 at the PBE06-31G(dp) level of theory to improve
the estimate of Eintra and provide the atomic multipoles by distributed multipole
analysis51 using GDMA The crystal structures were re-optimized using DMACRYS34
keeping the molecule rigid with the intermolecular energy Uinter calculated from the
distributed multipoles and the FIT parameterization38-40 of the exp-6 atomndashatom
repulsionndashdispersion potential
9
1
1
2
10
1
813
14
7
164
21
1 53
2
TA
Figure 49 The degrees of freedom optimized by CrystalOptimizer for crystal structures
of FA and TA (ξ1equiv C7-N1-C8-C9 ξ2equiv C2-C7-N1-C8 ξ3equiv O1-C1-C2-C7 ξ4equiv H1-O1-C1-C2
and ξ5equiv C8-C13-C14-H10 θ1equiv H6-N1-C8 θ2equiv H1-O1-C1)
Step 3 (Accurate evaluation of lattice energy (Elatt=Uinter and Eintra)) Approximately
100 of the most stable crystal structures from step 2 were re-minimized due to the limited
time constraints of submitting this study as my first year report Six and seven
conformational degrees of freedom for FA and TA respectively (Figure 49) were
allowed to change as was the crystal structure using CrystalOptimizer7172 and
calculating Eintra and the distributed multipoles at the PBE06-31+G(d) level of theory
for the isolated molecule
Step 4 (Modelling the effect of the crystalline environment) Finally I estimated the
effect of the crystal environment using a Polarizable Continuum Model (PCM)180 that I
42 Computational Methods
90
obtained by calculating the wavefunction of the molecular structure in a dielectric of ε=3
(typical of molecular organic crystals)131 as implemented in GAUSSIAN03 The crystal
structures were then re-minimized using the distributed multipoles calculated in the PCM
environment while keeping the molecule rigid the resulting Uinter was combined with the
Eintra to evaluate the lattice energies The CSP-generated crystal structures for FA were
labelled xFA_y where x was the final energy ordering and y the ordering after the
CrystalPredictor stage A comparison of x and y shows the extent of re-ranking by
increasing the accuracy of the lattice energy model
424 Experimental Crystal Structures with Z´ gt1 The complexity of the task of generating Z´gt1 crystal energy landscapes (steps 1-4) for
flexible molecules limited the search (section 423) to Z´=1 Analogous CrystalOptimizer
(step 3) and PCM calculations (step 4) were performed starting from all the experimental
crystal structures of TA and FA which included Z´gt1 structures FA form I and TA
forms III IV and V (section 415) This allowed comparison between Z´=1 generated
crystal structures and the experimental crystal structures of FA and TA
425 Comparison of Crystal Structures The experimental crystal structures the corresponding lattice energy minima and the
structures on the crystal energy landscapes were compared using the Crystal Packing
Similarity151 module (section 29) implemented in Mercury210 This crystal structure
similarity tool returns the highest number of molecules n (where n 15) that can be
overlaid between two different structures when all non-hydrogen atomndashatom distances
are within a 20 distance tolerance and angles are within 20 The calculated RMSDn is
the root mean square deviation of all non-hydrogen atom positions in the clusters of n
molecules The program allows for comparisons of crystal structures of different
molecules with the RMSDn being calculated from only the common non-hydrogen
atoms This Crystal Packing Similarity calculation determines the similarity in the
coordination environment of the two crystal structures rather than of the crystallographic
cell
43 Results
91
43 Results
431 Dependence of Conformational Energy on Method An appropriate grid of intramolecular energies was essential in order to search all the
likely conformations of TA and FA and thereby generate all likely Z´=1 crystal structures
To observe the effects that changing the level of theory had on the relative intramolecular
energy the torsion angle was scanned at HF PBE0 MP2 and B3LYP levels of theory
using GAUSSIAN0353 with the rest of the molecule allowed to relax
Figure 410 The relative conformational energy of isolated TA molecules as a function
of the ξ1 The MP2 and PBE0 method at 6-31G(dp) basis set compared with the other
method (top) and the other basis sets (bottom) for the PBE0 method
43 Results
92
The HF6-31G(dp) level of theory produced one minimum for the torsion angle
(Figure 410a) This result was qualitatively incorrect so the PBE0 level was selected as
the best compromise because it reproduced the correlation effect present in TA its
minima coincided in the same torsion angle region as that of MP2 and was
computationally cheaper than MP2 Since the conformational profile of TA converged at
the 6-31+G(d) basis set (Figure 410b) I selected PBE06-31+G(d) as the appropriate
level of theory for the final lattice energy calculation (steps 3 and 4 of section 423) of
the crystal structures This level of theory produced the standard plots of Chapters 4 to 6
432 Consideration of H-bonded Torsion
Figure 411 The relative conformational energy as a function of the ξ2 (Figure 49) for
FA and TA calculated at the PBE06-31G(dp) level of theory
The conformational energy scans of ξ2 (Figure 411) of TA and FA are very similar
The decrease in the torsion angle from 180deg strainedmdashand eventually brokemdashthe
intramolecular H-bond between the carbonyl group and N-H This H-bond strain accounts
for the huge energy penalty observed when this torsion angle changed Therefore
torsion was kept rigid during the search for hypothetical crystal structures even as the
torsion was optimized within the crystal structures to enable an accurate evaluation of the
balance between intermolecular and intramolecular energy in step 3 (section 423)
Chapters 5 and 6 present a more thorough investigation of the conformational energy
scans of fenamates
43 Results
93
433 CSD Survey of Fenamates The conformational potential energy surfaces of isolated TA and FA molecules (Figure
412a) were similar for a wide range of conformations around those found in experimental
structures (Figure 42) but were different as the bulky methyl substituent of TA
approached the benzoic acid ring (Figure 412a) For FA the energy penalty for
conformational changeEintra was less than 6 kJ mol-1 for a complete rotation of the
phenyl ring whereas for TA there was a conformational region that was far too high in
energy to occur in crystal structures The observed conformations of FA and TA in their
crystal structures corresponded to low-energy isolated molecule conformations (Figure
412a) with a relative intramolecular energyEintra of less than 3 kJ mol-1 The
conformational profile for TA was in qualitative agreement with that calculated by other
high-quality ab initio methods (see MP2 and B3LYP in Figure 410) but the profile was
quantitatively affected by the subtle balance between intramolecular dispersion and
intramolecular basis set superposition error60 Other studies have also suggested that the
barriers to conformational change would be lower in solvents from calculations in a
dielectric continuum simulating CCl4 and methanol211
The crystal structures in the CSD that contain the search criterion of Figure 47 also
show the same preference for the lower energy conformations That is the distribution
maxima coincide with the conformational minima (Figure 412b c) with very few
structures having the two rings near coplanar or perpendicular (ξ1=0 90) around the local
maxima in the conformational energy scans For the Y=H search because both ortho
substituents were hydrogen atoms two torsion angle values arose per conformation in a
crystal structure (one value between 0 and 90 and the second value between 90 and
180) giving a symmetric plot (Figure 412b) For YH on the other hand each structure
had only one torsion angle value and an asymmetric distribution (Figure 412c) reflecting
the steric hindrance of the ortho substituent
43 Results
94
Figure 412 The relaxed conformational energy scan of FA and TA as a function of ξ1 at
the PBE06-31+G(d) level of theory (a) Includes the experimental values of ξ1 marked
for TA and FA with the symmetry equivalent FA conformations denoted by open black
squares and an insert diagram showing the steric hindrance for TA in the high-energy
region A histogram of (b) 131 crystal structures found in the CSD search (Figure 47)
with Y=H plus symmetry equivalent structures and (c) 94 crystal structures with YneH
(b)
(c)
(a)
43 Results
95
434 Validation of the CrystalOptimizer plus PCM Models The computational model (steps 3 and 4 of section 423) is able to reproduce all ordered
crystal structures satisfactorily as minima in the lattice energy (Table 43) with these
static 0 K structures overlaying the finite temperature crystal structures with similar
accuracy The range of lattice energies is less than 2 kJ mol-1 consistent with both the
small energy range expected for polymorphs and with the thermodynamic data (Table
41) Form I is the most stable at 0 K in disagreement with the monotropic relationship
between forms I and II as determined by DSC measurements199201 and other data (section
412) Forms III and IV are metastable and very close in energy to form II Of the three
form V Z=2 ordered model crystal structures two have a nearby lattice energy minimum
Because all are quite high in energy the disordered structure is likely to be more complex
than a combination of these structures However a full symmetry adapted ensemble study
of a large supercell143212 would not be appropriate without more detailed experimental
studies
Table 43 Comparison of the lattice energy minimum with the experimental structure
used as a starting point for the final lattice energy model (PBE06-31+G(d) PCM) for
the ordered structures of FA and TA The three form V Z=2 model structures derived
from the disorder components of TA (section 415) are also compared with the starting
model RMSDn corresponds to n=15 unless (n) is given
Space
Group
ρ
gcm-
3
Elatt
kJ mol-1
a b c
Aring
α β γ
deg
RMSDn
Aring
FA
Expt P-1 133 808 9811404 8596 8864 7345
Opt P-1 134 -13663 848 9911333 9094 8816 7130 046
TA
Expt I P21c 144 4833213 804 900010488 9000
Opt I P21c 139 -14724 4863154 832 900010200 9000 033
Expt II P21n 145 38422001421 9000 9411 9000
Opt II P21n 141 -14521 38622061460 9000 9621 9000 026
Expt III P21c 144 76411312807 9000 9303 9000
Opt III P21c 139 -14555 78311642748 9000 9332 9000 030
Expt IV P-1 144 75214331759 10368 9825 9304
Opt IV P-1 138 -14514 76514001828 10256 9932 9152 037(14)Dagger
Expt V P-1 144 765 902 942 10740 920610166
Opt V_a P-1 138 -13954 767 919 961 10756 939910087 021
Opt V_b P-1 137 -14177 6781077 897 9275 850310348 089(6)
Opt V_c P-1 139 -14437 768 928 949 10695 925110249 019
DaggerThe Expt and Opt IV crystal structures overlaid 14 out of 15 molecules
43 Results
96
It is clear from Table 43 that the lattice energy minimization of the ordered structures
V_a and V_c produces a fairly small change in the cell constants but the nearest
minimum to V_b is rather different probably because the initial structure contained a
close ClmiddotmiddotmiddotCl contact These ordered structures correspond to the most stable of three
models of form V All three structures have a lattice energy that is 6-8 kJ mol-1 above
form I and so these ordered models of form V are not competitive in energy with the
other known polymorphs of TA
435 Energy Landscapes of Intermediate Steps
Figure 413 Crystal energy landscape of TA for the Z´=1 structure after (a)
CrystalPredictor (Step 1) (b) the single conformer calculation of Eintra and the atomic
multipoles at the PBE06-31G(dp) level of theory (Step 2 of section 423)
(a)
(b)
43 Results
97
I refined the lattice energy calculation in stages and systematically reduced the number
of crystal structures as my confidence in the energy ranking increased After conducting
single-point calculations to get accurate Eintra and distributed multipoles (which
improved the Uelec and thus the Uinter see equation 41) on all of the unique crystal
structures (step 2 of section 423) the gap between the known forms (I and II of TA) and
the global minima reduced from 40 kJ mol-1 to 6 kJ mol-1 (Figure 413) This intermediate
step was vital in reducing the computing time of the subsequent step 3 (section 423
only about 100 crystal structures were refined) due to the increased confidence in ranking
of the known forms (Figure 413)
436 Finding and Explaining the Known Structures with CSP The known forms of FA and TA were at or close to the global minimum on the final
crystal energy landscapes (Figure 414) which generated all the known Z´=1 ordered
polymorphs The crystal energy landscapes of FA and TA were similar in that they each
had an energy gap of approximately 2 kJ mol-1 between the global minimum cluster and
the other structures although the cluster of low-energy structures was far larger for TA
Although this difference suggested that TA would be more polymorphic than FA I
compared the structures to see whether it was plausible that TA and FA could crystallize
as distinct polymorphs allowing for thermal motion at crystallization temperatures
All the crystal structures of FA and TA whose energies were plotted in Figure 414 (and
tabulated in Table 44 and Table 45) contain the carboxylic acid dimer (Figure 44a)
However the orientation of the phenyl substituents could differ so markedly that this
dimer did not always satisfy the distance criterion to be overlaid by the default Crystal
Packing Similarity comparison This observation suggests that these structures on the
final energy landscape for FA and TA differ by the packing of the aromatic rings It was
necessary to perform a qualitative assessment of the barriers that prevented the
rearrangement of the molecules into a more stable form
The lowest-energy hypothetical structure on the crystal energy landscape for FA was a
Z´=1 structure (1FA_22) that was very similar in density and lattice energy to the only
known experimental Z´=2 form (Figure 414a) with a PXRD similarity of 085 This
1FA_22 hypothetical crystal structure overlaid 5 molecules (Figure 415a) with the
experimental form and it matched the conformation of one of the independent molecules
(Figure 415b) The difference between these two structures lay in the packing of the
layers a difference that is seen in many polymorphs such as progesterone213
43 Results
98
Figure 414 The crystal energy landscapes of FA (top) and TA (bottom) Each symbol
represents a crystal structure of the specified space group which is a minimum in the
lattice energy (calculated within the polarizable continuum) The open symbols
correspond to the minima starting from the experimental structures (Table 43) The
packing coefficient is the proportion of the cell volume occupied by the molecule214
calculated using a grid spacing of 01 Aring
43 Results
99
Table 44 The lattice energy minima of FA shown in Figure 414a The minimum found
starting from the experimental structure is in bold
Label Space
Group a b c
Aring
α β γ
deg
ρ
g cm-3
Uinter ΔEintra Elatt
kJ mol-1
1FA_22 P21c 868 4682709 9000 7404 9000 134 -13765 137-13628
QQQBTY02 P-1 848 9911333 9094 8816 7130 134 -13920 316-13599
2FA_2 P-1 454 9271493 6910 9201 6858 132 -13483 152-13331
3FA_59 P21c 457 8802695 9000 9956 9000 132 -13381 113-13269
4FA_1 P21c 451 8992682 9000 7877 9000 133 -13435 175-13260
5FA_10 P21c 4582686 880 9000 8526 9000 131 -13350 144-13206
6FA_151 P-1 1285 744 666 66291027411127 131 -13418 221-13197
7FA_4 P21c 1788 5341283 9000 6136 9000 132 -145121363-13149
8FA_16 P21n 1395 5201508 9000 7809 9000 132 -145051361-13144
9FA_287 P21n 1429 4591770 9000 7060 9000 129 -13279 240-13039
10FA_192 P21c 46019181231 9000 9792 9000 132 -13641 636-13005
11FA_19 P21c 50121791004 9000 7377 9000 135 -143771419-12958
12FA_23 P21c 6443425 653 900013152 9000 131 -13855 917-12938
13FA_2880 P21n 1490 4931456 9000 8825 9000 133 -13666 791-12875
14FA_33 P21c 4302600 997 900010250 9000 130 -13039 166-12873
15FA_18 P-1 870 799 935 105831022011301 132 -13040 187-12853
16FA_5226 P-1 10211325 990 1410911696 4347 127 -13013 186-12827
17FA_484 C2c 3864 897 750 9000 5874 9000 128 -12962 155-12807
18FA_7 P-1 4991113 995 844610467 9266 133 -141671409-12758
Table 45 The lattice energy minima of TA shown in Figure 414b Minima found starting
from the experimental structures or ordered models are in bold
Label Space
Group a b c
Aring
α β γ
deg
ρ
g cm-3
Uinter ΔEintra Elatt
kJ mol-1
FORM I P21c 4863154 832 900010200 9000 139 -14874150-14724
1TA_8 P21c 4853160 833 9000 7787 9000 139 -14865148-14717
2TA_15 P-1 1772 847 484 79491123711171 140 -14832163-14669
3TA_876 P-1 1698 744 734 9440 9376 4181 141 -14952357-14595
4TA_6243 P-1 12061015 871 7176 617011737 142 -14774196-14579
FORM III P21c 78311642748 9000 9332 9000 139 -14853298-14555
FORM II P21n 38622061460 9000 9621 9000 141 -14784263-14521
5TA_38 P21n 38622051460 9000 8376 9000 141 -14781263-14518
FORM IV P-1 76514001828 10256 9932 9152 138 -14773259-14514
6TA_82 P21c 39014332374 9000 6805 9000 141 -14611234-14377
FORM V_b P-1 6781077 897 9275 850310348 137 -14505328-14177
FORM V_c P-1 768 928 949 10695 925110249 139 -14437313-14124
FORM V_a P-1 767 919 961 10756 939910087 138 -14219265-13954
7TA_45 P-1 14441231 385 10950 8330 7631 142 -14171263-13908
8TA_88 C2c 2697 4792067 900010567 9000 135 -14113218-13895
9TA_64 P-1 756 900 986 753110145 8029 141 -14744889-13855
10TA_153 P21c 49212392217 9000 7574 9000 133 -13951196-13755
11TA_80 P2n 1492 3982150 9000 7536 9000 141 -13910180-13730
12TA_3630 P21c 1655 3842338 9000 5714 9000 139 -13930222-13708
43 Results
100
Figure 415 (a) Overlay of the only known form of FA (grey) and the most stable
structure on the Z´=1 crystal energy landscape (Figure 414a) 1FA_22 (green) with an
RMSD5 value of 175Aring (b) Overlay of the conformers of form I (pink and light blue) and
1FA_22 (black)
A significant energy gap was observed between the experimental and lowest energy
Z´=1 structure and the other structures generated for FA (Figure 414a) Remarkably this
gap was between two hypothetical structures that had a 12-molecule overlay and only
differed in the packing of the layers (Figure 414a) The lower-energy structure
(1FA_22) had more close contacts and a higher packing coefficient than the higher-
energy structure The second most stable hypothetical structure (2FA_2) was also
closely related to the experimental structure in it half of the molecules had changed the
phenyl torsion angle to a less stable conformation changing the stacking with the
phenyl ring in the neighbouring molecule to a herringbone215 (C-Hmiddotmiddotmiddot) interaction
(Figure 416bc) Thus there were two ways that the 2FA_2 structure could gain 2 kJ
mol-1 of stabilisation energy (Figure 416) The relationship between the two most stable
structures (1FA_22 and the experimental structure) means that it may be very difficult
to produce the Z´=1 structure as a polymorph Clearly Z´=1 and Z´=2 structures are very
close in energy and are related (via 2FA_2) It is therefore difficult to establish whether
the observed form is in fact a ldquocrystal on the wayrdquo216 that is trapped by a barrier from
rearranging into the Z´=1 form or whether the observed form is the more stable
structure217
(a) (b)
43 Results
101
Figure 416 (a) Overlay of the two most stable hypothetical crystal structures on the
crystal energy landscape global minimum 1FA_22 (grey) and 2FA_2 (green) with
ΔElatt=20 kJ mol-1 The crystal structures overlaid 12 molecules with RMSD12 of 051 Aring
and the conformations had an RMSD1 of 009 Aring (b) Overlay of 2FA_2 (green) and the
experimental crystal structure of FA (grey) with a RMSD15 of 123 Aring obtained with a
distance and angle tolerance of 50 and 50deg (c) Overlay of the two independent
molecules in the experimental structure (grey) with 2FA_2 (green)
For TA the crystal energy landscape successfully found the Z´=1 polymorphs forms
II and I to be the first and fifth most stable crystal structures within 2 kJ mol-1 of the
global minimum (Figure 414b) the landscape also provided a good reproduction of the
experimental crystal structures (Figure 417 and Table 43) Four other structures were
observed all of which were competitive in lattice energy with the known metastable
forms These crystal structures had somewhat similar packing to the known forms of TA
(Table 48) some being more similar to the form V Z=2 model structures constructed
from the disorder components of TA than to the other polymorphs (contrast Table 42 and
Table 48) Some of the similarities (Table 46) between the hypothetical structure and
the other fenamates in Table 41 were even more striking One of the computed structures
(a) (b)
(c)
43 Results
102
6TA_82 (highlighted in Table 45) matched 15 molecules of SURMOI (Table 41)
suggesting that crystals of this dimethyl-substituted molecule might template the
nucleation of a novel polymorph of TA This observation led to the joint experimental
and computational project discussed in section 438
Figure 417 The overlay of the experimental Z´=1 crystal structures (grey) of TA with
the closest structure found in the search (green) (a) Form I and 1TA_8 overlaid with an
RMSD15 value of 032Aring (b) Form II and 5TA_38 overlaid with an RMSD15 value of
026Aring
(b)
(a)
43 Results
103
437 Other Known Fenamates and their Hypothetical Structures Further marked similarities were observed between the structures on the crystal energy
landscapes of FA and TA (Figure 418) The hypothetical crystal structures on the crystal
energy landscape of FA in Figure 418 were similar to some of the known forms of TA
(forms I-IV) with some of these hypothetical crystal structures overlaying up to 13
molecules (forms I and III of TA Figure 418) Many of the low-energy structures of FA
had more in common with a polymorph of TA than with the only known form of FA that
is with a few exceptions the second numbers are greater than the first bold numbers
(Figure 418) There exist distinct crystal structures of FA with the planar molecules
(highlighted in Figure 418)
Figure 418 Classification of the crystal energy landscape of FA in terms of the similarity
of the structures to those of known TA polymorphs (I-IV) without PCM (hence the
different y-axis compared to Figure 414a) Numbers in bold indicate the number of
molecules that overlay with the known structure of FA Hence a label 5 6 on a structure
represented by a blue circle means that the structure overlaid 5 molecules with the
experimental form of FA but 6 with form I of TA Each point is coloured by the TA
polymorph with which it overlaid the greatest number n of molecules in a Crystal Packing
Similarity calculation that ignored the CH3 and Cl
The similarities between the known forms of TA and the hypothetically generated
structures of FA confirmed that because of the effect of TArsquos substituents (CH3 and Cl)
on the moleculesrsquo relative energies the energy landscape of TA was more polymorphic
than that of FA (Figure 414) The common clusters produced by the similarity overlays
between different fenamates usually had the differing substituents in the exterior region
43 Results
104
where there was no overlay of the coordinating molecule consistent with the substituents
causing the differences in the packing This in marked contrast to the large common
cluster between forms III and IV of TA (Figure 44c) where the packing of the aromatic
rings is similar
Table 46 Crystal Packing Similarity comparisons of the experimental structures of FA
and TA and their most stable hypothetical crystal structures with the crystal structures of
the other fenamates shown in Figure 13 The similarity is given in the form n(RMSDn)
with n gt 4 molecules highlighted
n(RMSDnAring)
FPAM- CA
FPAM- CA11
LAH- LOW
PEF- MET
PEF- NAQ
SUR- MEY
SUR- MOI
XYA- NAC
FA
QQQBTY02 2(071) 4(133) 7(084) 3(128) 6(062) 3(05) 3(12) 4(049)
1FA_22 2(041) 5(191) 6(131) 2(013) 11(096) 4(098) 4(108) 3(18)
2FA_2 2(043) 3(056) 7(101) 2(01) 11(051) 3(107) 7(098) 3(086)
TA
II 1(089) 2(015) 2(059) 2(011) 1(061) 2(012) 12(187) 2(029)
I 2(059) 2(048) 3(061) 1(07) 13(038) 6(178) 4(12) 2(062)
III 1(081) 7(075) 2(048) 13(033) 2(055) 13(061) 3(041) 13(045)
IV 2(087) 6(071) 3(109) 11(049) 2(046) 13(084) 3(056) 15(03)
V_a 2(057) 2(046) 5(042) 1(068) 3(039) 2(022) 2(018) 2(057)
V_b 2(075) 3(032) 7(064) 2(047) 4(110) 5(041) 4(119) 5(072)
V_c 2(095) 2(084) 5(041) 1(042) 4(110) 4(051) 2(029) 3(046)
2TA_15 2(052) 2(053) 3(091) 1(077) 14(04) 4(082) 4(122) 2(07)
3TA_876 1(093) 4(156) 7(142) 3(043) 1(066) 3(071) 4(047) 2(037)
4TA_6243 2(054) 3(115) 3(176) 1(069) 4(016) 4(149) 2(017) 3(091)
6TA_82 1(092) 2(017) 2(061) 2(012) 2(064) 2(008) 15(028) 2(028)
Some fenamate crystal structures are specific to the molecule One observed example
(Table 46) is the FPAMCA polymorph of flufenamic acid In 2012 through the use of
polymer-induced heteronucleation and solidndashsolid transformations flufenamic acid set a
new record18 for a polymorphic compound with eight solved structures which was
recently equalled by aripiprazole218 These fenamate structures are all based on the
carboxylic acid dimer with some having more similarity to the TA and FA low-energy
structures (Table 47) The specific substituents affect the range of packing of the aromatic
rings For example the low-energy unobserved structures of FA which are based on a
planar conformation of the entire molecule (Figure 414) are probably also specific to
FA because the lowest-energy crystal structure of TA with a planar molecule is 14 kJ
mol-1 above the global minimum structure The energy difference between crystal
structures of TA is caused by substituent intermolecular interactions that destabilize the
43 Results
105
structures containing planar molecules the intramolecular energy penalty Eintra for this
planar conformation is similar for FA and TA (6 kJ mol-1 Figure 412)
Table 47 An extension of Table 46 showing Crystal Packing Similarity comparisons of
the latest structures of flufenamic acid18 and the experimental structures of FA and TA
and their most stable hypothetical crystal structures
n(RMSDnAring)
FPAMCA_z
z=2 z=4 z=5 z=6 z=7 z=8
FA
QQQBTY02 5(149) 3(079) 2(073) 4(160) 2(043) 3(082)
1FA_22 4(162) 5(142) 2(105) 5(202) 2(022) 2(026)
2FA_2 4(151) 4(034) 3(119) 5(080) 2(021) 3(130)
TA
II 2(010) 2(016) 2(04) 2(017) 1(071) 2(081)
I 3(158) 2(054) 2(069) 4(210) 2(034) 2(041)
III 2(022) 2(024) 4(052) 2(025) 1(064) 2(077)
IV 2(020) 2(023) 4(168) 3(084) 2(064) 2(070)
V_a 3(124) 2(048) 2(064) 2(050) 3(068) 3(080)
V_b 5(054) 3(067) 2(045) 3(063) 1(059) 2(078)
V_c 2(085) 2(041) 2(079) 2(042) 2(077) 3(127)
2TA_15 4(304) 2(080) 2(017) 2(062) 3(042) 4(280)
3TA_876 4(134) 2(018) 4(210) 2(019) 1(076) 2(082)
4TA_6243 4(110) 2(058) 2(040) 2(060) 2(031) 2(038)
6TA_82 2(018) 2(019) 2(025) 2(020) 1(073) 2(081)
Table 48 Crystal Packing Similarity calculations of the known forms of TA and
unobserved thermodynamically competitive crystal structures The similarity between
the structures is given in the form n(RMSDn) where n is the number of molecules overlaid
and the value in brackets is the RMSDn overlay Structures with the highest similarity are
highlighted
n(RMSDnAring)
2TA_15 3TA_876 4TA_6243 6TA_82
KAXXAI 1(095) 4(033) 1(088) 9(043)
KAXXAI01 1(049) 1(096) 5(132) 1(090)
KAXXAI02 2(087) 3(108) 2(095) 3(059)
KAXXAI03 2(083) 3(081) 3(255) 3(081)
KAXXAI04_a 4(125) 1(092) 3(016) 1(086)
KAXXAI04_b 4(128) 3(092) 6(107) 2(069)
KAXXAI04_c 1(013) 2(120) 4(105) 1(059)
438 Update on a Recently Discovered Polymorph of TA Section 436 theorized that experimentalists could nucleate a novel polymorph of TA
by using the SURMOI molecule as a template However my colleague at UCL used
mefenamic acid (Figure 13) because SURMOI is very expensive A novel polymorph of
TA was nucleated by solution evaporation after dissolving TA (form I) in ethanol and
43 Results
106
seeding it with mefenamic acid (form I)219 This procedure resulted in the nucleation of
form VI of TA which was disordered (65 and 35) with same unit cells as form I of
mefenamic acid
Although the major component of this novel form VI was generated in step 1
137_TA the form was not among the structures on the final energy landscape of Figure
414b The major component of form VI and 137_TA overlaid 15 molecules with a
RMSD15 value of 030 Aring (Figure 419) This structure 137_TA had a final lattice energy
of -14497 kJ mol-1 which was competitive with form IV of TA (Table 45 -14514 kJ
mol-1) It should be noted that steps 3 and 4 of CSP (section 423) involved just over 100
crystal structures Clearly lattice energy refinements (steps 3 and 4 section 423) of
more hypothetical crystal structures are vital
Figure 419 Overlay of FA_137 (green) and the major component of experimental
crystal structure of TA form VI (grey) with a RMSD15 of 030 Aring obtained with a distance
and angle tolerance of 50 and 50deg
439 The Cost of Lattice Energy Minimisation The lattice energy minimization (CrystalOptimizer step 3) of one crystal structure
accounted for as much as 75 of the computing time and took as long as 4 days (Figure
420a) because multiple ab initio calculations were required to balance Uinter and Eintra
The computing time was approximately half as long for the optimisation of the last
structure (form VI of TA Figure 420b) This last optimisation (Figure 420b) was faster
44 Summary
107
because there were about hundred structures stored in the Local Approximation Models
(LAMs)71 database (LAMs71 database stores and reuses conformational energy and
multipole representations of the charge density) This final calculation was performed
after the discovery of a novel polymorph of TA as discussed in section 438 Even with
the help of LAMs71 database the computational cost was still very high
Figure 420 CPU timings of (a) 38_TA (form II) and (b) 137_TA (form VI section
438) after lattice energy minimisation using CrystalOptimizer (step 3)
44 Summary This chapter described the successful use of the CSP method (see Chapter 3) to examine
the computer-generated low-energy crystal structures of the unsubstituted structural
fragment FA and a derivative TA This chapter showed that all structures were based
on the same 11987722(8) H-bonded dimer and that the structures differed only in the packing
of the phenyl rings The crystal energy landscape of TA had several crystal structures
including the observed polymorphs which were tightly clustered around the global
minimum whereas the corresponding cluster for FA contained only the observed and a
closely related structure This observation is supported by past experiments
Many of the crystal structures on the energy landscape for FA overlaid a significant
portion of the coordination environment with other observed or calculated structures
Therefore the phenyl ring substituents determined the relative energies of the crystal
structures and hence whether a specific fenamate would be very polymorphic or not The
FA fragment can be described as a polymorphophore despite only two structures
clustered around the global minimum since the molecular fragment packed in a wide
range of distinct crystal structures with different conformations that were energetically
favourable This finding indicates that being a polymorphophore correlates with but does
(a)
(b)
44 Summary
108
not guarantee polymorphism It is perhaps not surprising that this term has not been more
widely accepted
The similarities between the structures on the final energy landscapes of TA and other
fenamates led my colleague to conduct a templating experiment on TA (section 438)
The subsequent discovery of a new polymorph of TA (form VI section 438) exemplified
one problem with the CSP discussed earlier Restricting the number of crystal structures
that were accurately optimised (step 3 CrystalOptimizer) to just over 100 structures
meant excluding the recently discovered crystal structure of TA (section 438) from the
final crystal energy landscape (Figure 414b) As a result current intermediate steps like
the single-point calculations used in this chapter (step 2) although successful (section
435) had their limitations
The findings of Chapters 3 and 4 indicate the need for a cheaper and more accurate
approach to modelling lattice energy If the evaluation of Eintra (the bulk of computer
time section 439) can be realized through a less expensive method (Chapter 6) then
molecular dynamics calculations and the temperature effects (eg free energies) can be
better accounted for However we must first understand the origin of intramolecular
forces and energies (Chapter 5)
51 Introduction
109
Chapter 5 The Origin of conformational energy barriers in Fenamates
ldquohelliplsquoBegin at the beginningrsquo the King said gravely lsquoand go on till you come to the
end then stoprsquohelliprdquo
mdash Lewis Carroll Alice in Wonderland
51 Introduction
511 Background Chapters 3 and 4 established that lattice energy Elatt could be partitioned into
intermolecular Uinter and intramolecular components Eintra
where Uinter is the sum of the dominant electrostatics Uelec plus the contributions of
repulsion-dispersion Urepul-disp and Eintra is the energy required to distort the molecule
from its gas phase conformation71 The conformation determines the overall molecular
shape so different conformers may lead the crystal to arrange itself in different ways
ultimately influencing the properties of the crystal220 (Chapter 1)
1
6
2
1
9
1
1
813
7
16
Figure 51 The fenamate family showing the low barrier torsion angle (=C7-N1-C8-C9)
=0 when the aromatic rings are coplanar as drawn The fenamates family mentioned in
this chapter includes fenamic acid (FA) R1= R2= H tolfenamic acid (TA) R1= CH3 R2=
Cl mefenamic acid (MA) R1= R2= CH3 clofenamic acid (ClFA) R1=H R2=Cl and
flufenamic aid (FFA) R1=H R2=CF3 The dotted line represents an intramolecular
hydrogen bond
This chapter will investigate the conformational flexibility of fenamate molecules in
isolation Through this investigation we will come to a better understanding of the origin
of torsional barriers which will enable the derivation of an analytical model for the
intramolecular energies of the fenamate molecules FA and TA (Chapter 6) To put this
problem in context there is still an ongoing debate about the origin of the torsional barrier
of the ethane molecule which has only 8 atoms as compared to the 27 and 30 atoms of
FA and TA respectively
Elatt = Uinter + Eintra 51
51 Introduction
110
512 Torsional Barrier for Ethane The torsional barrier is defined as the difference in energy between the least stable and
the most stable conformations in rotation around a bond In order for one full rotation
around a bond to occur this energy barrier must be overcome (Figure 52) The energy
barrier for fenamic acid FA is smaller (Chapter 4) than ethane (Figure 53)
Figure 52 Illustration of the barrier to rotation with the relaxed conformational energy
profile of FA
Previous studies of torsional barriers have focussed on small molecules such as ethane
The torsional barrier for the ethane molecule is one of the most fundamental puzzles in
conformational analysis and researchers have great interest in understanding its origin221
The experimental (1203 to 1225 kJ mol-1) and quantum mechanical (1124 to 1303 kJ
mol-1) calculations of ethanersquos torsional barrier are in good agreement (Table 51)
However researchers disagree upon the origin of the torsional barrier in ethane The
root of the controversy is whether the origin of the torsional barrier in ethane results from
stronger hyperconjugation stabilization222 in the staggered conformation (Figure 53) than
the eclipsed form or whether the barrier originates from greater steric repulsion221 in the
eclipsed conformation (Figure 53) due to electrostatic interaction and Pauli exchange
repulsion Three physical factors may play a role in ethanersquos structural preference
hyperconjugation electrostatic interactions and exchange interactions
51 Introduction
111
Figure 53 The staggered and eclipsed conformations of the ethane molecule (Sources
Ref [222] and enwikipediaorgwikiAlkane_stereochemistry [Accessed 11012015])
Table 51 Torsional barrier height of ethane (Source Reproduced from Ref [223])
Hyperconjugation and exchange repulsion are quantum mechanical effects arising from
orbital overlap The hyperconjugation effect for the ethane molecule is constituted of the
vicinal interactions between the occupied CH bond orbitals of one of the methyl group
and the virtual antibonding CH orbitals of the other methyl group221 The staggered
51 Introduction
112
conformation (Figure 54a) is stabilised through the delocalization of electron charge
density involving these orbitals an attractive contribution
Pophristic and Goodman222 used natural bond orbitals (NBOs) to argue that
hyperconjugation or stabilization of the staggered ethane conformation is the origin of
the barrier to rotation in ethane By showing that if the CH-CH hyperconjugative
interactions were removed and by adding electrons to the unoccupied CH virtual
orbital the steric repulsion favoured the less stable eclipsed conformation (Figure 53)
This model of hyperconjugation interactions relies on NBOs and is not so obvious if
molecular orbitals (MOs) are used let alone if correlated wave functions are used
(a) (b)
Figure 54 (a) Hyperconjugation effects on the staggered (b) Pauli exchange repulsion
in the eclipsed conformation (Source enwikipediaorgwikiHyperconjugation
[Accessed 11012015])
Pauli exchange repulsion which requires that pairs of electrons do not occupy the same
spatial region occurs in the eclipsed conformation (Figure 54b) Electrostatic (Figure
55 also see section 223) repulsion involves the classical R-1 repulsion between charges
At short distances the 1-4 (third nearest neighbour) interactions still have an electrostatic
effect but there are also considerable penetration-effects (section 225) The Pauli
exchange and electrostatic repulsion frequently regarded as the steric factor destabilise
the eclipsed conformation of ethane These interactions are the same as intermolecular
interactions but at shorter distances
51 Introduction
113
Figure 55 Electrostatic steric repulsion (between electrons on the bond black arrow) for
the eclipsed conformation of ethane The red arrow indicates exclusion of van der Waals
repulsion since the van der Waals radii of the hydrogen are too small to make contact
(Source enwikipediaorgwikiConformational_isomerism [Accessed 11012015])
Mo and Gao221 made three arguments in favour of steric repulsion being the origin of
the barrier to rotation One argument was that hyperconjugation is a second-order effect
and hence should have little or no direct role in restricting free rotation224 Second these
researchers argued that overestimation of the hyperconjugative effects led others to
misidentify hyperconjugation as the origin of the rotation barrier Third Mo and Gao
argued that the experimental work on heats of hydrogenation for propene supported a
specific energy decomposition scheme225 In short the researchers argued that their three
points supported the claim that steric repulsion is the origin of the torsional barrier
The origin of the torsional barrier remains controversial226 even for a small molecule
such as ethane The question remains Is the torsion defined by the origin
hyperconjugation221222 or by a similar electronic effect from changes in MOs on the
atoms Or is the barrier equivalent to intermolecular non-bonded repulsion and
electrostatic effects227 at short distances ie as though there were no single covalent
bond The quantitative distinction can be highly dependent upon the precise definitions
and upon the type of charge density calculation that is used
513 Overview The conformational energy barrier of FA (622 kJ mol-1) is smaller than that of the
ethane molecule (123 kJ mol-1) The goal of this chapter is to investigate the qualitative
origin of the conformational barrier to rotation for fenamate molecules in isolation First
I will investigate the effects that different definitions of the same flexible bond have on
the calculated conformational profile of TA The step size of torsion angles various ab
initio methods and relaxation effects will be investigated for various fenamates (Figure
51) Following this I will investigate the electronic contributions using constrained
model molecules that avoid pyramidization (Figure 57) with minimal or no steric effects
Finally an exp-6 atom-atom model which contains both a repulsive and a dispersive part
will be used to investigate the steric effect of FA and TA
52 Method
114
This chapter will show that the barrier to rotation for FA and TA (Figure 51) depends
significantly upon small correlated changes in the entire molecule rather than on the
atomic position of the atoms that define the rotating torsion It will also show that there
is an intrinsic dispersion and electronic energy barrier when the aromatic rings are
perpendicular to one another the barrier to rotation for small model molecules can be
represented by a simple cos2 term
52 Method In section 431 it was established that the PBE06-31+G(d) level of theory is the best
compromise between the cheap but inaccurate HF method and the expensive but accurate
MP2 method for calculating the packing (intermolecular) and conformational
(intermolecular) energies (equation 51) of FA and TA This chapter examines the ab
initio conformational profiles of fenamate molecules in more detail All the ab initio
calculations reported in this chapter were performed using GAUSSIAN0353
521 Determining Conformation Energy Scan for Isolated Molecule
For TA there are 4 definitions of the N1-C8 rotatable bond (Figure 51) (1) = C7-N1-
C8-C9 (2) 2= C7-N1-C8-C13 (3) 3= H6-N1-C8-C9 and (4) 4= H6-N1-C8-C13 The effects
of these different definitions upon the conformational profile of TA were investigated
using the PBE06-31+G(d) level of theory Preliminary relaxed conformation energy
scans were also performed on FA using 2 and 1 step sizes around the maxima and
minima (section 431) respectively at the same level of theory in order to investigate the
origin of the slight asymmetry in FA
522 Ab initio Conformational Energy Profiles for Fenamates To test the sensitivity to method of the different fenamate moleculesrsquo conformational
profiles (Figure 51) I carried out a relaxed scan at the HF6-31+G(d) level of theory as
well as single-point energy calculations at the MP26-31+G(d) level of theory on the
optimized PBE06-31+G(d) conformations The PBE06-31+G(d) energies were then
revaluated within a polarizable continuum model (PCM)180 with dielectric continuum
value of 3 a typical dielectric environment of organic crystals PCM has been shown to
help the relative energy ranking of some conformational polymorphs (Chapter 4)131
The primary aim of this research was not to seek a definitive ab initio conformational
profile for all molecules as this would have been beyond the capability of the available
computational resources Indeed many studies have emphasized the difficulty in
evaluating the relative energies of fenamate polymorphs184211228 Instead the objective
52 Method
115
of this chapter is to present qualitatively correct scans that can be compared among the
fenamate molecules
523 Investigation of Electronic Effects In an attempt to distinguish the steric effects from the electronic effects I studied a
series of model molecules where the steric effects had been minimized (Figure 56)
12
9
1 813
6
Figure 56 Chemical diagram of model molecules used to investigate the electronic
contributions The bonds around N1 are constrained to be planar (ie R2-N1-H6-C8=180deg)
for phenylamine (PA) R1=R2=H N-methylaniline R1=H R2= CH3 N-vinylaniline R1=H
R2 = CH=CH2 and 3-anilinoprop-2-enoic acid R1=H R2 = CH=CHCO2H for 3-
chloroaniline R1= Cl R2=H and 3-methylaniline R1=CH3 R2=H (=R2-N1-C8-C9)
The benzoic acid group was replaced by a series of smaller molecular fragments (Figure
56) for example a hydrogen atom The three bonds to the nitrogen atoms were
constrained to be planar by fixing the torsion involving these atoms (eg H7-N1-H6-
C8=180deg for PA) This constraint prevents the normal pyramidalization at the nitrogen in
the torsional potential of phenylamine227 (Figure 57) or the major rearrangement of the
second hydrogen that occurs in a relaxed scan of H7-N1-C8-C9
Figure 57 Pyramidalization in unconstrained phenylamine (PA) molecule caused by
lone pair on nitrogen atom
The difference in electronic structure with torsion angle was estimated by using the
lowest occupied molecular orbital (ie the highest occupied molecular orbital (HOMO)-
n where n is an integer) and HOMO electron density for the PA model FA and TA For
52 Method
116
selected constrained (fixed ) conformations in the PBE06-31+G(d) scan a single-point
calculation with GAUSSIAN03 was used to generate a density file which was then used
to produce the molecular orbitals (MOs) isovalue surfaces of 002 au The graphical
interface used was GaussView 5229
524 Investigation of the Steric (Non-Bonded) Effects Within organic molecules that are typically used in pharmaceuticals many of the atom-
atom distances are similar to intermolecular distances although some are considerably
shorter The intramolecular steric interactions can be represented as the exp-6 atom-atom
intermolecular parameters which were derived by fitting to crystal structures and heats
of sublimation of hydrocarbons oxahydrocarbons azahydrocarbons chlorohydrocarbons
and nitro compounds42 This provides the parameters for all intramolecular interactions
involving C N O Cl and H but the same parameters are used for all C and H atoms
whether aromatic or in the methyl or carboxylic acid groups which is an approximation
to the most force field eg Sybyl typing230 This approximation is better justified for FA
than for TA (Figure 51) because of the importance of distinguishing C in different
chemical environments That is the chemical environment of aromatic C is different from
that of methyl C There is a polar hydrogen type HB which was used for both polar
hydrogens (H1 and H6 in Figure 51) because the intramolecular energy is expected to be
insensitive to the interactions of the carboxylic acid group
Table 52 Gavezzottirsquos exp-6 atom-atom parameters E=Aexp(-BR)-CR-6 is the well
depth and Rm is the distance at the minimum41231232 Italics represent the hydrogen-
bonded interactions aFrom the UNI intermolecular potential function of Mercury233
Interactions AkJ mol-1 BAring-1 CkJ mol-1Aring-6 kJ mol-1 RmAring
H∙∙∙H 241584 401 1092 004 336
H∙∙∙C 1207921 410 4728 021 329
H∙∙∙N 2282790 452 5021 039 299
H∙∙∙O 2954322 482 4393 051 280
H∙∙∙Cl 2929637 409 11673 050 330
C∙∙∙C 2261452 347 24184 039 389
C∙∙∙N 4914945 386 27907 084 350
C∙∙∙O 3930868 374 26819 067 361
C∙∙∙Cl 3906601 352 38618 067 383
N∙∙∙O 2685710 386 15230 046 350
O∙∙∙O 1953091 374 13347 033 361
O∙∙∙Cl 3382973 363 27824 058 372
HB∙∙∙O (acids) 264163953 875 8577 2929 160
HB∙∙∙N (-NH∙∙∙OH) 238673400a 778a 15774a 2661 180
53 Results
117
The Gavezzotti parameters used for FA and TA are given in Table 52 Although exp-
6 does not model the electrostatic contributions explicitly some of the parameters have
absorbed some electrostatic contributions during the fitting process The energies were
partitioned into repulsion (Aexp(-BR)) and dispersion (-CR6) contributions
The extension of the exp-6 parameterization to hydrogen bonding interactions required
potentials with a particularly deep well at the short hydrogen bonding distances to absorb
the electrostatic interactions in hydrogen bonding231 The polar hydrogens were assumed
not to have significant intermolecular interactions with any atoms other than the hydrogen
bond acceptor interactions which is a reasonable assumption for intermolecular
interactions The parameters for the H∙∙∙HB and C∙∙∙HB that were not determined by
Gavezzotti may be important
Interactions that are three atoms or more apart from each other (ie 1-4 and above) were
then investigated The longest bond path for FA and TA is 1-11 The atom∙∙∙atom
interactions that dominated the intramolecular contributions were analysed with the exp-
6 potential For each fenamate molecule interactions were classed as dominant if the
difference between the minimum and maximum total energy (Erepul-dis) of the conformers
was greater than or equal to 1 kJ mol-1 It is expected that some interactions in FA and
TA will vary with conformations however a few interactions will have constant
contribution (eg HB∙∙∙O (acid) an important intramolecular H-bond) The interactions
with constant contributions are not classed as dominant interactions
53 Results
531 Effect of Different Definitions of the Same Flexible Bond The N1-C8 rotatable bond can be defined in four ways C7-N1-C8-C9 C7-N1-C8-C13 H6-
N1-C8-C9 and H6-N1-C8-C13 (Figure 51) The conformational energy profile of TA
(Figure 58) is sensitive to the atoms used in defining the N1-C8 rotatable bond For
example the intramolecular energy penalty at ξ= 0deg for the C7 torsions (=C7-N1-C8-C9
and 2=C7-N1-C8-C13) are approximately half that of the H6 torsions (3=H6-N1-C8-C9 and
4=H6-N1-C8-C13) (Figure 58) The relaxation of the hydrogen atom (H6) was clearly
playing a vital role in stabilizing the molecular conformation at ξ= 0deg There were some
differences in intramolecular energy penalties as approached 180deg for the C7 torsions (
and 2 in Figure 58)
53 Results
118
Figure 58 Relaxed scan of TA at the PBE06-31+G(d) level of theory with the different
definitions of flexible N1-C8 bond (= C7-N1-C8-C9 2= C7-N1-C8-C13
3=H6-N1-C8-C9
and 4= H6-N1-C8-C13) used as the constrained geometric parameter
The torsional barriers for TA are sensitive to the atoms used in defining the N1-C8
rotatable bond (Table 53) The C7 torsional barriers (Group 2 of Table 53) are larger
than the H6 torsional barriers (Group 2 of Table 53) For the C7 torsions the H6 proton
relaxes to maintain the intramolecular H-bond while for the H6 torsions the benzoic acid
(including the C7 atom) deviates minimally to prevent deformation of aromatic ring and
form better pyramidalization (Figure 57) at N1 for TA These results show that the
torsional barrier and conformational energy profile of TA (Figure 58 and Table 53)
depend upon the selected 4 atoms that define the flexible torsion
Table 54 shows no correlation between shorter (stronger) intramolecular H-bond
distances and smaller energy penalties However a closer inspection of the atom-atom
distances between the H atom of the secondary amine and the H atom of the methyl group
(Group 1 of Table 55) suggest that steric hindrance also contributes to the intramolecular
energy because conformations with higher energy penalties correlate with shorter atom-
atom distances
53 Results
119
Table 53 Torsional barrier height of the relaxed conformational energy profiles in Figure
58 for TA
Torsion Barrier Barrier relative to
kJ mol-1
Group 1 3585 0 2 3572 -013
Group 2 3 2453 -1132
4 3148 -437
Table 54 Comparison of intramolecular energies and hydrogen bond distances of TA for
the near-planar conformer
Torsion N-H∙∙∙O=CAring ∆EintrakJ mol-1
Group 1
= 0deg 1850 706
2= 180deg 1847 648
Δ -0003 -058
Group 2 3= 180deg 1880 1574
4= 0deg 1881 1257
Δ 0001 -317
3(180)-(0) 0030 868
Table 55 Comparison of the intramolecular energies and the N-H7∙∙∙HX-C14 bond
distances of TA for the near-planar conformer where HX-C14 is the methyl group
Group 1 N-H7∙∙∙H10-C14 N-H7∙∙∙H11-C14 N-H7∙∙∙H12-C14
(Aring)
∆Eintra
kJ mol-1
= 0deg 3491 2284 2194 706 2= 180deg 3486 2272 2199 648
Δ -0005 -0012 0005 -058
Group 2
3= 180deg 3358 2135 2090 1574
4= 0deg 3386 2157 2117 1257
∆ 0028 0022 0027 -317
3(180)-(0) -0133 -0149 -0104 868
532 Effect of Step Size on the Conformation Profile of Fenamate Molecule Given that conformational profiles depend on small correlated changes in atomic
positions I investigated the effect of step size on the conformational profiles For FA the
conformation profile is unaffected by the small step size of 1 and 2 for the minima and
maximum respectively (compare Figure 510 with Figure 511) Over all possible
conformations of FA the barrier to rotation is approximately 6 kJ mol-1 (see Figure 510
and Figure 511)
Although the phenyl ring of FA is symmetric the rotation of this ring produces
asymmetry conformational profiles around the maximum and minima points (Figure
510) The slight asymmetry observed for the conformational profile of FA (Chapter 4) is
53 Results
120
therefore not due to the small step size These changes can be substantial for example
the two minima for FA scan at =3894deg and 14471deg (Figure 510) correspond to
conformations that differ by 061 Aring in the 1-4 distance between the amide proton and C13
(or C9) even though the minima only differ in energy by 188 x 10-3 kJ mol-1 (716 x 10-
7 au) Even the C8-C9 and C8-C13 aromatic bond lengths differ by 00037 Aring for =0 or
180deg but only by 00004 Aring for =80deg or 100deg with larger changes in the bonded
hydrogen positions for FA It is therefore clear that the molecular structure of the phenyl
ring is not perfectly symmetric (Figure 59) and that it changes with torsion
Figure 59 Molecular conformation of the relaxed gas phase at PBE06-31+G(d) showing
the bond lengths of the phenyl C-C bond (=180) of FA
For the definitive scans full optimization was performed near each symmetry-
independent potential minimum with a step size of Δ=5deg The highly repulsive points
for the substituted fenamates (TA and MA) were omitted due to the huge energy penalty
as approached 180deg (section 431 and Figure 58)
53 Results
121
Figure 510 Relaxed scans of FA at PBE06-31+G(d) with step sizes 2 and 1deg around the
maxima and minima respectively The red circles indicate the starting points of the scans
while the arrows indicate the directions of the scans
53 Results
122
533 Conformational Energy Profile of the Fenamates The conformational profile for four fenamate molecules (Figure 511) shows that there
are two distinct minima which are only close in energy for the symmetric FA and R2-
substituted ClFA (Figure 51) The ClFA molecule has one global minimum at 14838deg
in addition to the local minimum at 3586deg while FA has two global minima at 3894deg
and 14471deg (Figure 511) There is one potential maximum that varies slightly between
the molecules for the planar conformation (as drawn in Figure 51) there is a second
maximum when the aromatic rings are approximately perpendicular and there is a third
where there is a significant steric clash for the R1-substituted fenamates TA and MA as
the other planar conformation is approached An analysis of the observed values of this
torsion angle in experimental crystal structures containing the fenamate fragment shows
that the observed angles were clustered around the two minima (Chapter 4 Figure 412)
a finding that is consistent with the expectation that most molecules adopt low-energy
conformations in crystal structures208 Hence the two low-energy barriers although only
~5-9 kJ mol-1 clearly have a major effect on the crystal packing Indeed this
conformational energy is very significant it is large compared with most measured
polymorphic energy differences including those of TA which cover less than 2 kJ mol-1
(Chapter 4)
Figure 511 Relaxed conformational scans at the PBE06-31+G(d) level of theory for the
fenamates The minima were at ξ=3894deg and 14471deg for FA 4063deg and 11186deg for
TA 4408deg and 11048deg for MA and 3586deg and 14838deg for ClFA
53 Results
123
(a) (b)
(c) (d)
Figure 512 Relaxed conformational scans of fenamates (a) FA (b) TA (c) MA and (d)
ClFA at HF and PBE0 method with 6-31+G(d) basis set These are contrasted with the
single-point energies at the MP26-31+G(d) level and within a polarizable continuum
model (PCM) with =3 for the PBE06-31+G(d) conformations
By testing the sensitivity of this conformational profile to the choice of ab initio method
(Figure 512) it becomes clear that even obtaining a conformational profile that is in
qualitative agreement with the profile derived from experimental crystal structures is
sensitive to method The SCF scan has only one minimum as seen in Figure 512 at a
conformation that was not observed in the crystal structures of fenamates (section 433
Figure 412) If the CSP study of Chapter 4 were based on a SCF conformational profile
the crystal structures generated for FA and TA would have been qualitatively incorrect
Therefore it is essential that the ab initio methods include some description of the
electron correlation that produces a maximum at around 90deg Although there is moderate
agreement on the barriers to conformational change for TA and MA it is notable that
single-point MP2 calculations swap the relative energy positions of the two minima
(Figure 512) The PBE0 calculations are in better agreement with the analysis of the
53 Results
124
crystalline conformations of fenamate-like fragments with a substituent at C13 (Chapter
4)
The scans carried out within PCM with =3 showed a reduction in energy penalty
around the energy maxima (ξ~90deg) for all three fenamates (Figure 512) This reduction
is more pronounced for TA and MA around the local minima (ξ~110deg) than it is for FA
This finding suggests that the effect of solution or the crystalline environment the method
used for generating the final energy landscapes of FA and TA in Figure 414 of section
436 does not qualitatively change the conformational profile Hence the clustering of
observed torsion angles in fenamate crystal structures around the minima is not an artefact
of the neglect of the environment (Figure 412 in section 433) The results shown in
Figure 512 confirm that the definitive ab initio conformational profiles cannot be
obtained Nonetheless the scans in Figure 511 are adequate for the purposes of this study
534 Rigid Versus Relaxed Scans of Fenamates To establish the importance of changes in the other torsion angles bond angles and
bond lengths during the relaxed scans in Figure 511 the conformation scans were
repeated for the three fenamates starting with the fully optimized structure at the PBE06-
31+G(d) level of theory Only torsion angle was allowed to vary which meant that each
point had an identical conformation for all three ab initio methods (HF MP2 and PBE0)
The difference between rigid (solid lines in Figure 513) and relaxed (dotted line in Figure
513) scans was very marked for all the fenamates even in the lowest energy regions
where the changes in the benzoic acid ring and the intramolecular hydrogen bond were
small
53 Results
125
Figure 513 Comparison of relaxed (solid) and rigid (dotted line) scan of FA (top) TA
(middle) and MA (right) For the rigid scans calculations were performed using HF MP2
and PBE0 methods with 6-31+G(d) basis set as a function of torsion angle The relaxed
scans from Figure 511 were performed at the PBE06-31+G(d) level of theory
53 Results
126
0deg 80deg 110deg
Figure 514 Overlay of relaxed (coloured by element Figure 511) and rigid (red Figure
513) conformations of FA (top) TA (middle) and MA (bottom) overlaying the atoms
defining the ξ torsion angle at the PBE06-31+G(d) level of theory
Figure 514 shows a comparison of the rigid and relaxed conformations at the repulsive
barrier and the second minimum for FA TA and MA For TA the differences in the
relaxed and rigid scan conformations are very marked around the energy maxima (Figure
514 ξ=80deg) even though these maxima are less than 7 kJ mol-1 in the relaxed scans
(Figure 513) For FA there is a significant change in the relative orientation of the
benzoic acid group changing the internal hydrogen bond around all maxima The methyl
torsion is clearly playing a role in reducing the energy penalty around the 90deg maximum
for TA and MA (Figure 514) Indeed even for FA the changes in the other
conformational variables are vital to produce a low energy maximum at 90deg to the extent
that it is not surprising that even the relaxed scans differed in this region producing the
slight asymmetry between the two minima (Figure 511)
The contrast between the relaxed and rigid (Figure 513) scans and the corresponding
conformations (Figure 514) confirm that the changes in the other conformational
variables played a major role in lowering the conformational barriers providing low
values over a wide range of angles as implied by the crystallographic data (Chapter 4)
53 Results
127
535 Splitting electronic from steric contributions to the barrier to rotation
(a) (b)
(c) (d)
(e) (f)
Figure 515 The solid black lines show the relaxed torsional scans of planar-N-
constrained models for the phenyl rotation (Figure 56) where the benzoic acid group of
FA has been replaced by (a) hydrogen atom (PA) (b) methyl (c) vinyl and (d) prop-2-
enoic acid and the hydrogen in the meta position of PA has been replaced by (e) chlorine
and (f) methyl using HF PBE0 and MP2 methods with the 6-31+G(d) basis set Plots of
(h2)(1-cos(2)) where h is the height of the barrier of relaxed PBE06-31+G(d) scans
are shown in green For (c)-(f) the PBE06-31+G(d) relaxed scans of PA from (a) are
shown in grey for comparison In (a) and (b) a rigid scan at the PBE06-31+G(d) level of
theory is shown by a dotted line
53 Results
128
To establish the importance of the intramolecular steric clashes the rigid and relaxed
scans were repeated with model molecules that replaced the benzoic acid group of FA
with smaller fragments and the bonds around the nitrogen constrained to be planar (Figure
56) in order to avoid the pyramidalization of the amine (Figure 57) The potential energy
scan has a very large maximum at 90deg for planar-N-constrained phenylamine (PA)
approximately 6 times higher than the barrier in the fenamates (reflected in the scale
change between Figure 515a and Figure 511) Replacing one constrained hydrogen with
a methyl (Figure 56) produces a slightly larger barrier but very little asymmetry strongly
suggesting that this is an electronic effect of conjugation between the lone pair on the
nitrogen and the aromatic ring
Adding a double bond to PA reduces the barrier to rotation by 1110 kJ mol-1 (Figure
515c) Adding a carboxylic acid that forms an intramolecular H-bond to the N-H group
further reduces this barrier by almost 7 kJ mol-1 (Figure 515d) These observations imply
that the conjugation of the benzoic acid ring of the fenamates contributed significantly to
reducing the electronic barrier The intramolecular hydrogen bond in this model molecule
(Figure 515d) varies in length from 194 to 192 Aring as changes from 0 to 180deg by
comparison the FA hydrogen bond varies from 187 to 184 Aring Thus it is evident that the
intramolecular H-bonding in the fenamates reduces the electronic barrier In contrast
substituting Cl and CH3 at the meta position of PA (Figure 515e and f) shows little change
to the barrier height with half-height (h2) values of 3-chloroaniline (185 kJ mol-1) and
3-methylaniline (178 kJ mol-1) representing only a small increase over that of PA (176
kJ mol-1)
The scans in Figures 515a b e and f have no maxima at 0 or 180deg confirming that
the steric clash between the aromatic C6-H and C13-R1 (Figure 51) of the phenyl ring is
responsible for this maximum These curves are very well reproduced by ((h2)(1-
cos(2ξ)) where h is the potential maximum As the nitrogen substituents (Figures 515c
and d) get larger there are signs of additional steric effects particularly at the MP2 level
suggesting more changes in intramolecular dispersion The difference between a rigid
scan and a relaxed one is small (Figures 515a and b) and the differences in the curves
according to the type of calculation are relatively minor compared with the qualitative
differences between the HF and correlated methods for the fenamates (Figure 512) From
contrasting the conformational scans of model molecules with minimal steric effects
(Figure 515) with those of the fenamates (Figure 511) the overriding conclusion is that
there is an electronic contribution to the torsional barrier at =90 which can be
53 Results
129
represented by a (h2)(1-cos(2ξ)) term where h is the maximum energy from the
electronic contribution
There is a dramatic change in the HOMO isosurfaces of the phenyl ring with torsion
angle (Figure 516) which is remarkably similar between PA and the fenamates FA and
TA This finding suggests that the electronic contribution observed for PA is fundamental
to the fenamates The destructive interference of the MOs at =90 (Figure 516 and
Figure 517b) is the origin of the huge torsional barrier that is seen in each of the model
molecules in Figure 515 The smaller torsional barriers after adding a double bond
(Figure 515c) and acidic (Figure 515d) substituents to PA (Figure 515a) was a result of
increased electron delocalisation (compare Figure 517a with Figure 517b)
0deg 40deg 90deg
Figure 516 The electron density surface of HOMO frontier orbitals for different
conformations of PA (top) FA (middle) and TA (bottom) obtained from the PBE06-
31+G(d) level of theory Contour map isovalues were drawn at a 002 au level
(a) (b)
Figure 517 Alternative HOMO isosurface view of (a) FA and (b) PA molecule at =90
from Figure 516
My attempt at modelling delocalisation over the entire FA molecule even for the lowest
occupied orbital failed (Figure 518) which suggests that a completely flat model of
53 Results
130
FA ( = 0) is unrealistic This is because of the huge steric barrier (Figure 513) of a planar
conformation and the linear combinations of atomic orbitals in many molecular orbitals
are sensitive to conformation The electronic effects are not well defined for TA ie no
Figure 518 equivalent for TA due to the bulky substituent hence excluded in the analysis
= 0 = 40 = 90
Figure 518 HOMO-10 (46 MOs) isosurface view of side (top) and front (bottom) FA
molecule at =0 40 and 90
The MOsrsquo picture can only give a qualitative guide to the electronic contribution
because it is not possible to have an aromatic substitution at R2 or a methyl group
substitution on C13 (as in MA and TA) without steric interactions At present
independently investigating how the electronic barrier varies among the fenamates is not
possible However it is clear from Figure 515 that whilst the benzoic acid substituents
will have a dramatic effect on lowering the barrier the meta-substitution of chlorine and
methyl on the phenyl ring has a much smaller effect on the barrier
536 Estimating the Steric Contributions with an Atom-Atom Potential The steric effects of FA and TA can be analysed by using Gavezzottirsquos parameters
(Table 52) to produce a conformational profile (see Figure 519) which can then be
subdivided into the repulsion (Aexp(minusBRik)) and dispersion (minusCRik6) contributions
This subdivision (Figure 519) suggests that the repulsion terms dominate producing
maxima at 0 and 180deg and minimum at 90deg a finding that is consistent with the
supposition that these maxima occur because of steric clashes However the repulsions
are severely overestimated The dispersion contribution gives a maximum at ~90deg
which is of the same order of magnitude as the ab initio maxima particularly for FA This
confirms the observation from Figure 512 that electron correlation the origin of
dispersion interactions makes a significant contribution to this maximum supplementing
53 Results
131
the electronic effect (cf Figure 515) The difference between TA and FA in Figure 519
is consistent with the large dispersion interaction of the Cl substituent as well as the
repulsion from the methyl substituent
Figure 519 Comparison of the ab initio (black) intramolecular energy scans at the
PBE06-31+G(d) level of theory for FA (top) and TA (bottom) with Gavezzottirsquos exp-6
intramolecular energy models summed over all intramolecular atom-atom distances from
the third nearest neighbour (1-4) and above The net effect (purple) is subdivided into the
repulsive (red) and dispersion (blue) contributions
537 Investigating the Important Interactions with Atom-Atom Potential For FA and TA the dominant interactions involve C H and HB (Table 56) while the
dominant interactions involving N and Cl (Table 57) were exclusive to TA Although FA
and TA have the N atom only TA has the methyl substituent (N1∙∙∙C14 f and N1∙∙∙H12
f
Table 57) Of all the dominant interacting atoms for FA and TA only Cl of TA interacts
with atoms (methyl substituent) belonging to the same aromatic ring (dfC14∙∙∙Cl1
dfCl1∙∙∙H10 and dfCl1∙∙∙H11 Table 57) These results confirm the observation that the
53 Results
132
methyl substituent plays a role in reducing the energy penalty for TA (section 534
Figure 514)
Table 56 Atom-atom interactions of FA that dominate the intramolecular energies as
estimated using Gavezzottirsquos exp-6 potential The interaction is listed as dominant if the
difference between the minimum and maximum total energy (Erepul-dis) is greater than or
equal to 1 kJ mol-1
ati∙∙∙atk neigh RikkJ mol-1 ErepulkJ mol-1 EdispkJ mol-1 Erepul-dispkJ mol-1
min max(∆) min max(∆) Min max(∆) min max(∆)
C7∙∙∙C9 4 307 371(064) 057 533(476) -289 -092(196) -035 245(280)
C7∙∙∙C13 4 307 371(064) 057 532(475) -288 -092(196) -035 244(279)
C6∙∙∙C9 5 310 443(133) 005 475(470) -270 -032(239) -039 205(243)
C6∙∙∙C13 5 311 444(133) 005 468(463) -268 -032(236) -039 200(238)
C6∙∙∙H7 6 252 488(236) 000 398(398) -186 -003(182) -021 212(233)
C8∙∙∙H5 5 254 288(034) 089 357(268) -175 -083(092) 007 182(176)
C9∙∙∙H5 6 257 416(159) 000 317(316) -163 -009(154) -020 154(174)
H5∙∙∙H7 7 208 476(268) 000 578(578) -135 -001(134) -004 443(447)
C13∙∙∙HB6 4 251 330(078) 016 403(387) -187 -037(151) -021 216(236)
HB6∙∙∙H11 5 230 368(138) 001 240(239) -074 -004(070) -004 166(170)
C6∙∙∙H8 4 289 310(020) 485 985(500) -412 -274 (138) 212 573(362)
C6∙∙∙H11 6 252 488(237) 000 396(396) -185 -003(182) -020 211(231)
C13∙∙∙H5 6 257 417(159) 000 314(314) -162 -009(153) -020 152(172)
H5∙∙∙H11 7 209 476(267) 000 548(548) -130 -001(129) -004 418(422)
C9∙∙∙HB6 4 251 330(079) 016 406(390) -188 -036(152) -021 218(238)
HB6∙∙∙H7 5 230 369(139) 001 238(237) -074 -004(069) -004 164(169)
Table 57 Atom-atom interactions of TA that dominate the intramolecular energies as
estimated from Gavezzottirsquos exp-6 potential The interaction is listed as dominant if the
difference between the minimum and maximum total energy (Erepul-dis) is greater than or
equal to 1 kJ mol-1 dInteractions between atoms on the same aromatic ring fInteractions
involving the methyl substituent
ati∙∙∙atk neigh RikkJ mol-1 ErepulkJ mol-1 EdispkJ mol-1 Erepul-dispkJ mol-1
min max(∆) min max(∆) min max(∆) min max(∆)
C7∙∙∙C9 4 302 361(059) 081 630(549) -317 -109(209) -028 313(340)
C7∙∙∙C13 4 314 372(058) 056 417(361) -252 -091(161) -035 165(201)
C6∙∙∙C9 5 308 412(104) 014 513(499) -282 -050(233) -039 231(269)
C6∙∙∙C13 5 324 444(119) 005 292(287) -207 -032(176) -039 085(123)
C6∙∙∙H7 6 248 445(197) 000 458(458) -202 -006(196) -020 256(276)
C8∙∙∙H5 5 254 289(035) 086 363(277) -176 -081(095) 005 187(182)
C9∙∙∙H5 6 260 369(109) 003 286(283) -154 -019(135) -021 132(153)
H5∙∙∙H7 7 214 418(204) 000 451(450) -113 -002(111) -004 337(342)
C13∙∙∙HB6 4 254 322(068) 022 364(341) -176 -043(134) -020 187(207)
HB6∙∙∙H11f 6 219 450(231) 000 364(364) -098 -001(096) -004 266(271)
HB6∙∙∙H12 f 6 228 315(087) 008 254(246) -077 -011(066) -003 177(180)
C6∙∙∙C8 4 289 310(021) 485 995(511) -414 -273(141) 211 581(370)
C6∙∙∙C14 f 6 310 510(200) 000 482(482) -273 -014(259) -039 210(248)
C7∙∙∙C14 f 5 312 414(102) 013 455(442) -264 -048(216) -039 191(230)
C7∙∙∙H12 f 6 255 385(130) 002 344(342) -171 -014(156) -020 173(194)
N1∙∙∙C14 f 4 278 298(021) 487 1081(594) -607 -395(212) 093 474(382)
N1∙∙∙H12 f 5 243 262(019) 162 385(222) -243 -154(088) 008 142(134)
dfC14∙∙∙Cl1 4 304 311(007) 688 875(187) -488 -427(061) 261 387(126) fC14∙∙∙HB6 5 241 371(130) 003 618(615) -241 -018(223) -021 377(397) dfCl1∙∙∙H10 5 257 324(068) 051 813(762) -410 -100(309) -049 404(453) dfCl1∙∙∙H11 5 269 374(105) 007 489(483) -308 -042(266) -050 181(231)
54 Discussion The Physical Origins of Torsional Potentials
133
Analysis of which particular atom-atom interactions vary most with conformation
(Table 56 and Table 57) reveals that intramolecular interactions involving the N-H
proton type HB as well as certain aromatic and TA methyl protons type H vary strongly
with conformation as expected based on Figure 514 Therefore the poorly determined
parameters for HB and H strongly affect the energy profiles of Figure 519
54 Discussion The Physical Origins of Torsional Potentials The torsional barriers for fenamates apart from gt 140 are smaller than for PA and
ethane For the fenamates the difference in energy penalty arises from the high degree of
conjugation between the two aromatic rings of the fenamates via ∙∙∙ overlap involving
the lone pair of electrons of the N atom (Figure 516)234 This conjugation effect is absent
for ethane and reduced for PA because these have just one aromatic ring It is clear that
compared to PA the barrier to rotation reduces as the model molecules tend toward two
aromatic rings These observations confirm that the delocalisation of electrons plays a
role in the origin of the torsional barrier for fenamate molecules FA and TA
The maximum at = 90 (Figure 515) is due to dispersion effects The investigation
of different methods for producing conformational profiles demonstrates the importance
of accounting for correlation effects For example the HF method is hopeless for
reproducing the correct conformation profiles around the minima for fenamate molecules
FA TA MA and ClFA (Figure 512) because the method excludes the correction effects
Therefore it is vital that methods of examining the conformational profiles include the
correlation effects This is most important in CSP where accurate ranking of generated
crystal structures depends upon accurately evaluating the energy penalty contribution to
the total lattice energy (equation 51)
Although the conformational profiles are dependent on specific atoms that define
flexible torsion (Figure 58) the comparison of the rigid and relaxed scans shows the
important role that the atomic positions of other atoms play (Figure 513 and Figure 514)
during relaxation For example during the relaxation of TA methyl rotation plays a role
in reducing the energy penalty and barrier to rotation (section 534) The enormous
difference between the relaxed and rigid conformational profiles (Figure 513) and their
conformers (Figure 514) suggests that the atomic positions of most atoms in a molecule
during relaxation are important Consequently we can conclude that the origin of the
torsional barrier involves most atoms in a molecule
By analysing the low-energy torsional barriers in fenamates (Figure 511) it has
become clear that larger organic molecules retain the contributions as identified for small-
55 Summary
134
model molecules such as ethane There is both an electronic and a steric component to
these torsional barriers in fenamates However as the model molecules become larger
the effects of small correlated changes in the other bond angles and the dispersion
contributions become very significant (Figure 515c and d) As the size of the molecule
increases in both the number of atoms and the electron density there is an increasing
contribution to the torsional profile from the intra-molecular equivalent of the
intermolecular dispersion
Separating the ldquothrough spacerdquo intramolecular dispersion from the other electron
correlation effectsmdashspecifically those that contribute to the (h2)(1-cos(2)) electronic
barrier from ldquoconjugationrdquo or delocalization between the two aromatic ringsmdashis unlikely
to be meaningful when using an ab initio method that is still approaching the quantitative
accuracy needed
55 Summary I could not use the definitive ab initio torsional potential for each fenamate as the
torsional potentials of organic molecules containing aromatic rings are very demanding
of the electronic structure method used However PBE0 method and 6-31+G(d) basis set
were sufficient to investigate the origin of the barrier to rotation for FA and TA
The analysis of the fenamatesrsquo torsional potential reveals that like the classical small-
molecule torsional potentials of ethane there is both an electronic effect (loosely
described as changes in MOs involving ∙∙∙ between the aromatic rings and the nitrogen
lone pair destabilizing the non-planar conformations) and a steric effect from the variation
in overlap of non-bonded atoms For larger molecules like the fenamate molecules the
intramolecular dispersion and small changes in the other conformational variables also
make significant contributions to the torsional profile
When the aromatic rings are perpendicular to each other the destructive interference of
MOs creates an intrinsic barrier The two rings in fenamate molecules stabilise the
expected high-energy barrier A cos2 term accurately represents the torsional barrier of
model molecules with minimal steric effects that have been constrained to prevent
pyramidalization Finally this chapter showed that the torsional barriers for FA and TA
depend on small correlated changes in degrees of freedom other than the most flexible
torsion We observed this by contrasting the conformations and their corresponding
energies of rigid scans against relaxed scans for FA and TA
The origin of the torsional barrier of fenamates is therefore a combination of intrinsic
intramolecular dispersion electronic contribution and the steric repulsion A new
55 Summary
135
analytical form for intramolecular energies (Chapter 6) of fenamates that is physically
justified must incorporate these origins and account for small correlated changes among
different conformations
61 Introduction
136
Chapter 6 Toward New Force fields for Fenamate Molecules
ldquoAvoid complexities Make everything as simple as possiblerdquo
mdash Henry Maudslay
61 Introduction
611 Background Force field methods (section 25) for calculating a systemrsquos energy ignore electronic
motions and instead calculate the systemrsquos energy as a function of the nuclear positions
alone63 Such force field methods are less computationally demanding than quantum
mechanical calculations but they cannot predict properties that depend upon a moleculersquos
electronic distribution In addition the limitations of electronic structure calculations as
discussed in Chapters 2 (section 27) and 4 (sections 438 and 439) suggest the need
for a new analytical model that can combine the accuracy of electronic methods and the
speed of force field methods This chapter proposes a solution to this problem
In general force field methods are based on two important components (i) the
functional form of the potential energy functions and (ii) the parameterisation of these
functions235236 In Chapter 5 I investigated the first component the origin of the torsional
barrier for fenamate molecules For small molecules that were constrained to have
minimal steric clashes the origin is mainly an electronic effect and can be expressed as a
cos2ξ term However for larger molecules like fenamic (FA) and tolfenamic acids (TA)
there are additional correlated changes namely the repulsion and dispersion effects
Chapter 5 by investigating these contributions with an exp-6 term dealt with the first
component required for building a force field
The present chapter deals with the second component of force fields re-
parameterisation In this chapter I will derive an analytical model for FA and TA (Figure
61) by fitting the conformational profiles (Figure 511) to analytical expressions
discussed in Chapter 5 One of the key conclusions of Chapter 5 was that definitive ab
initio conformational energy scans could not be obtained However the ab initio scans at
the PBE06-31+G(d) level of theory (Figure 511) are adequate for the purposes of
creating a new analytical model
61 Introduction
137
1
6
2
1
9
1
1
813
7
16
Figure 61 The fenamate family showing the low-barrier torsion angle (=C7-N1-C8-C9)
and atomic numbering =0 when the aromatic rings are coplanar as drawn The
fenamates mentioned in this chapter are fenamic acid (FA) R1= R2= H tolfenamic acid
(TA) R1= CH3 R2= Cl mefenamic acid (MA) R1= R2= CH3 flufenamic acid (FFA) R1=
H R2= CF3 and clorofenamic acid (ClFA) R1=H R2=Cl The dotted line represents an
intramolecular hydrogen bond
Figure 62 Relaxed conformational scans at the PBE06-31+G(d) level of theory for the
fenamates from section 533 Fenamic acid (FA) tolfenamic acid (TA) mefenamic acid
(MA) and chlorofenamic acid (ClFA)
612 A Case for Modelling Decoupled Intramolecular Energy For challenging applications involving molecular recognition of pharmaceuticals such
as computer-aided drug design the importance of an accurate balance of intermolecular
and intramolecular forces cannot be overemphasized93 The success of CSP studies17127
(Chapters 3 and 4) and the limitations of current force field (section 254) and electronic
structure methods (sections 27 and 439) suggest decoupling the models for the
intermolecular forces from those for the intramolecular forces (ie conformational
61 Introduction
138
changes) as a means of more accurately modelling force fields for pharmaceutical
molecules should be attempted
613 Analytical Models of Intramolecular Energies Traditional force field modelling includes an explicit torsional term237 of the general
form
where defines the phase shift and n the periodicity For FA as defined in Figure 61
requires that = 0 and the near-symmetry dictates that n is an even integer For
substituted fenamates odd values of n could contribute although the conformational
profile should be symmetric about = 0
Non-bonded atomndashatom interactions should be able to represent the intramolecular
energies well if the origin of the conformational profile is predominantly steric (caused
by the varying repulsion between the overlapping charge distributions of 1-4 atoms with
) An exp-6 atomndashatom model (Chapter 5) would be expected to give a better
representation than a Lennard-Jones (R-12) model of the variation of the repulsion with
distance given the success of the overlap model in parameterizing intermolecular
repulsion potentials238239 Thus a crude starting point for my investigation of the ldquonon-
bondedrdquo contribution to the torsion potential is the exp-6 atomndashatom model potential with
a parameterization that was developed for modelling the intermolecular forces between
organic molecules in crystal structures42231
where atoms i and k of atomic types and are separated by intramolecular distances Rik
calculated from the molecular conformation with torsion angle ξ This functional form
with no assumed relationship between the like (and ) and unlike () interactions
means that the parameters (A B and C) have at least partially absorbed the
electrostatic effects in fitting This chapter seeks to re-parameterize the equations of the
origin of torsional potential (equations 61 and 62) in order to derive analytical models
that accurately represent the conformational profiles of fenamic (FA) and tolfenamic
acids (TA)
614 Overview The goal of this chapter is to develop a generalizable method that uses a FORTRAN
code to derive analytical models for the conformational profiles of FA and TA This
( ) [1 cos( )]2
nVE n 61
6
( ) exp( )ik ik
i k
E A B R C R 62
62 Methodology Fitting Analytical Models to Conformational Profiles
139
chapter will investigate three analytical forms the cosine series rescaling repulsion and
combined physical models Each of these new analytical forms will have different
parameters for intramolecular and intermolecular contributions I will discuss the
methodology of fitting analytical models to conformational profiles and test the
transferability properties of the combined physical models for FA and TA to other
fenamate molecules (Figure 61)
This chapter will show that the cosine series and rescaled repulsion models are
inadequate for modelling the conformational energy profiles of fenamates More
importantly this chapter will show that combining a cos2 term to represent the
electronic barrier with an intramolecular atomndashatom exp-6 repulsion-dispersion term for
all atom pairs separated by three or more bonds (bond-paths ge 1-4) allows a very effective
representation of the ab initio conformational energies
62 Methodology Fitting Analytical Models to Conformational Profiles The only weighting applied to the conformational profiles of all the fenamate molecules
(Figure 511 at the PBE06-31+G(d) level of theory) in this chapter was the restriction of
conformational energies to 10 kJ mol-1 or below This weighting was appropriate because
this chapter does not seek to represent the steric barrier above 145deg for TA (and MA)
accurately Hence this chapter considers Np = 37 points for the FA and Np = 30 points for
TA (and MA) Because the definition of the ab initio energies Eab are relative to the
lowest energy conformation for each molecule the analytical modelrsquos energies Emodel
were adjusted by a constant Ebase such that the lowest energy conformation of both the
ab initio and analytical model were zero The algorithms (Figure 63 and Figure 64) in
this chapter fit a constant c that matched the overall conformational curves rather than
the minima As such c differs from Ebase by a fraction of a kJ mol-1 The standard error
σintra in Emodel was
where Np and Nk are the number of data points and fitted coefficients respectively
However there were only Nk -1 physical parameters as one (c ~ Ebase) served only to
adjust the baseline
621 Torsional Potential Model The explicit torsional term (equation 61) can be simplified as the following cosine
series
2
mod
int
ab el
ra
p k
E E
N N
63
62 Methodology Fitting Analytical Models to Conformational Profiles
140
where Nk and Np are the number of fitted coefficients and data points respectively The
intercept c is 0 Using the linear least squares method (section 26) the cosine series
(equation 64) were fitted to the conformational profiles of FA and TA (Figure 511) to
determine the unknown coefficients k Below is a flowchart of the cosine series
algorithm (Figure 63)
Figure 63 An algorithm showing the overview of modelling ab initio intramolecular
energy using a cosine series potential The source codes are included in the CD ROM
attached to this thesis (see Appendix A)
In the initialization step (step 1) the algorithm required the ab initio intramolecular
energies and the inputs of their equivalent torsion angles (Figure 511) These inputs
(generated from the ab initio scans reported in Chapter 5) were used to construct a
regression model (step 2) The G02DDFE97 NAG subroutine (section 262) solved the
resulting linear regression problem that is the unknown coefficients k were
determined Finally the standard error σintra of the modelled intramolecular energy
Emodel (equation 63) was calculated
0
( ) cos( 1 ) 5 1kN
k k p
k
E k N N
64
62 Methodology Fitting Analytical Models to Conformational Profiles
141
622 AtomndashAtom Model Due to the considerable correlation between the atomndashatom coefficients particularly
the two repulsion parameters (A and B) it is difficult to vary both repulsion parameters
simultaneously240241 This section discusses the derivation of analytical atomndashatom
models for conformational profiles of FA and TA as expressed in the algorithm shown
in Figure 64 In particular this section discusses the rescaling of selected repulsion (and
dispersion) coefficients which gives a linear model that contains (an appropriate cosine
term and) a baseline constant c
Figure 64 An algorithm showing the modelling of ab initio intramolecular energy by a
physical potential The source codes are included in the CD ROM attached to this thesis
(see Appendix A)
This algorithm (Figure 64) which uses NAG129 library routines shows the systematic
comparison of how well various selections of linear parameters ( and c) can
represent the conformational profiles of fenamates The algorithm first extracted the
geometries and the corresponding intramolecular energies of the fenamate molecules
which were generated from ab initio calculations These geometries were converted to an
atomic type-friendly mol2 format (Sybyl typing230) using the Babel242 chemical toolbox
The other inputs are the starting values of Gavezzottirsquos atomndashatom exp-6 potential
parameters41231232 (Table 52 of Chapter 5) The covalent 1-1 connectivity (from the mol2
file) helped to distinguish the polar hydrogen HB from the non-polar hydrogen H
atoms The remaining atomndashatom connectivity (ie nearest neighbour or bond-path) and
6
( ) cos(2 ) exp( )ik ik
i k
E A B R C R c 65
62 Methodology Fitting Analytical Models to Conformational Profiles
142
distances Rik within the molecule were determined using the H03ADF subroutine and
the 1-1 connectivity H03ADF subroutine evaluates the nearest neighbour by finding the
shortest path between two atoms
Next the atom-atom interactions were summed over all 1-4 atom-atom distances and
higher bond-paths in the entire molecule (equation 65) The maximum bond-path was 1-
11 for all three fenamates and most pharmaceutical molecules were sufficiently small
that there was no need to define a summation limit in terms of intramolecular distance or
bond-path length for a single molecule The use of 1-4 distances as the shortest
intramolecular interactions included in the atomndashatom summation was traditional
Although it should be noted that 1-3 interactions were used elsewhere eg in the CSP
code of GRACE where they have sometimes been found to be problematic including the
recent case of a bulky side group attached to an aromatic ring which required specific
scaling down13 The atomndashatom formulation resulted in many virtually constant terms
such as the H∙∙∙H C∙∙∙C and H∙∙∙C contributions from within the aromatic rings These
terms contributed to the baseline energy Ebase defined as the minimum energy found in
the scan with a specific parameterized model
The atomndashatom model involved far too many coefficients for all to be fitted
independently to the ab initio data In addition many atomndashatom distances did not change
significantly with the torsion angle as observed from investigating the atomndashatom
interaction that dominated the intermolecular contribution in Chapter 5 There were only
16 and 21 dominant interactions out of 351 and 435 total atomndashatom interactions for FA
and TA Therefore only interactions that were classed as dominant were rescaled The
algorithm in Figure 64 determined the dominant interaction by using a cut-off value of
one ie Ecutoff = 1 kJ mol-1 The dominant atomndashatom interactions for FA and TA were
reported in Chapter 5 (Table 66 and Table 57) which are summarised in Table 61 If
atomndashatom interaction of a given type (∙∙∙) varied less than the Ecutoff (for example Cl∙∙∙O
and O∙∙∙HB) then these parameters were not rescaled but may vary the contribution to
Ebase One notable observation was the significant interaction between atoms of the same
aromatic ring for TA (Table 61d) which was absent in FA
62 Methodology Fitting Analytical Models to Conformational Profiles
143
Table 61 Contrasting the atomndashatom interactions of FA and TA that dominated the
intramolecular energies formed by combining Table 56 and Table 57 from Chapter 5
Interactions unique to FA and TA are coloured blue and red respectively dInteractions
between atoms of the same aromatic ring fInteractions involving the methyl substituent
FA TA FA TA ati∙∙∙atk neigh RikkJ mol-1 RikkJ mol-1 Erepul-dispkJ mol-1 Erepul-dispkJ mol-1
min max(∆) min max(∆) min max(∆) min max(∆) C∙∙∙C
C7∙∙∙C9 4 307 371(064) 302 361(059) -035 245(280) -028 313(340)
C7∙∙∙C13 4 307 371(064) 314 372(058) -035 244(279) -035 165(201)
C6∙∙∙C9 5 310 443(133) 308 412(104) -039 205(243) -039 231(269)
C6∙∙∙C8 4 289 310(021) 211 581(370)
C6∙∙∙C13 5 311 444(133) 324 444(119) -039 200(238) -039 085(123) fC6∙∙∙C14 6 310 510(200) -039 210(248) fC7∙∙∙C14 5 312 414(102) -039 191(230)
C∙∙∙H fC7∙∙∙H12 6 255 385(130) -020 173(194)
C6∙∙∙H7 6 252 488(236) 248 445(197) -021 212(233) -020 256(276)
C6∙∙∙H8 4 289 310(020) 212 573(362) C6∙∙∙H11 6 252 488(237) -020 211(231) C8∙∙∙H5 5 254 288(034) 254 289(035) 007 182(176) 005 187(182)
C9∙∙∙H5 6 257 416(159) 260 369(109) -020 154(174) -021 132(153)
C13∙∙∙H5 6 257 417(159) -020 152(172) H∙∙∙H
H5∙∙∙H7 7 208 476(268) 214 418(204) -004 443(447) -004 337(342)
H5∙∙∙H11 7 209 476(267) -004 418(422) C∙∙∙HB
C13∙∙∙HB6 4 251 330(078) 254 322(068) -021 216(236) -020 187(207)
C9∙∙∙HB6 4 251 330(079) -021 218(238) C14∙∙∙HB6 5 241 371(130) -021 377(397)
HB∙∙∙H
HB6∙∙∙H11 5 230 368(138) -004 166(170) HB6∙∙∙H7 5 230 369(139) -004 164(169)
fHB6∙∙∙H11 6 219 450(231) -004 266(271) fHB6∙∙∙H12 6 228 315(087) -003 177(180)
N∙∙∙C fN1∙∙∙C14 4 278 298(021) 093 474(382)
N∙∙∙H fN1∙∙∙H12 5 243 262(019) 008 142(134)
C∙∙∙Cl fC14∙∙∙Cl1 4 304 311(007) 261 387(126)
Cl∙∙∙H dfCl1∙∙∙H10 5 257 324(068) -049 404(453) dfCl1∙∙∙H11 5 269 374(105) -050 181(231)
63 Results
144
These atomndashatom interactions were grouped into unique atom-type∙∙∙atom-type sets
(∙∙∙) The algorithm then systematically fit different subsets of the ∙∙∙rescaling
parameters using combination mathematics243 Eg for interactions C∙∙∙H C∙∙∙HB and
H∙∙∙HB the following seven subsets of interactions were rescaled
1 C∙∙∙H or C∙∙∙HB or H∙∙∙HB
2 C∙∙∙H and C∙∙∙HB or C∙∙∙H and H∙∙∙HB or C∙∙∙HB and H∙∙∙HB
3 C∙∙∙H C∙∙∙HB and H∙∙∙HB
For each fit the subroutine G02DDFE97 (section 262) calculated the Nk coefficients
( c) being fitted and minimized the residual sum of squares (RSS) using a
general linear regression model244 Within the routine a matrix decomposition process
established whether a solution was unique or whether the parameters were linearly
dependent and therefore had no unique solution Unless otherwise noted all fits reported
in this chapter had a unique solution Finally the standard error intra in the modelrsquos
intramolecular energy was calculated after adjusting the minimum to 0 kJ mol-1 (equation
63)
This chapter used the method discussed above to investigate two analytical models
(1) Rescaling only the repulsion contribution of the atomndashatom exp-6 potential ie
equation 65 with and set at 0 and 1 respectively
(2) Rescaling all the parameters ie equation 65
63 Results
631 Cosine Series Model The traditional cosine series expansion for a torsional potential (equation 64) must
include cos4 to have the correct number of minima for the fenamates Alone this term
gave a poor position of the minima for FA and it was qualitatively wrong for TA (Figure
65) A least squares fit that included the lower cosine terms (Nk=5 equation 64) gave a
qualitatively reasonable representation (Figure 65) but further improvement is slowly
converging (Figure 66) For FA the fitting steadily improved in quality particularly
upon the addition of cos4n terms where n are integers For TA the fitting became
unstable after 21 terms even though there was no attempt to represent the large steric clash
beyond 10 kJ mol-1
This result demonstrated that the cosine series was a fitting exercise and did not reflect
the physics It was effectively an exercise in modelling the relaxed scans by a functional
6
( ) exp( )ik ik
i k
E A B R C R c 66
63 Results
145
form that assumed the scan was rigid (ie only the torsion angle changed) This
assumption is a crude approximation since rigid scans are different from relaxed scans
(see Figure 513) Poor convergence of the cosine model expansion were also reported
for biphenyl245 a dye which required 7 terms while polynorbornene246 required 6 and 15
terms for the meso and racemic dimer respectively
Figure 65 Comparison of the ab initio relaxed scan at the PBE06-31+G(d) level of
theory with linearly fitted least square cosine series model for FA (top) and TA (bottom)
with Nk=5 (red lines) the optimal cos4 terms (blue lines) and Nk=21 (green lines σintra
=017 kJ mol-1 for FA and TA)
63 Results
146
Figure 66 Plot of the standard error of the intramolecular energies against the number of
cosine terms Nk for FA (top) and TA (bottom) The fit is ill-determined ie there is no
unique solution for TA after Nk=21
632 Rescaled Repulsion Model From Chapter 5 it is clear that the repulsion contributions were severely overestimated
for FA and TA with Gavezzottirsquos exp-6 potential Therefore an alternative model is to
rescale just the repulsion terms (ie fit selected in equation 66) as the intermolecular
atomndashatom model clearly overestimated the intramolecular steric effects (Figure 519)
Rescaling just a few of Gavezzottirsquos repulsion parameters for example those involving
the poorly parameterized H∙∙∙H interactions resulted in a qualitatively good fit (Figure
67) as shown by the results for fitting all combinations of repulsion parameters for FA
(Table 62) and the summary in Table 63 of the 511 such fits for TA Rescaling just two
(C∙∙∙H and H∙∙∙H) repulsion contributions for FA and five (C∙∙∙H C∙∙∙HB C∙∙∙N H∙∙∙H and
H∙∙∙HB) for TA produced a model that reproduced the torsional profile well (Figure 67)
63 Results
147
Figure 67 Comparison of the relative energies from ab initio calculations (solid black
lines) of FA (top) and TA (bottom) with selected best-fit exp-6 rescaled repulsion models
For FA the selected Nk=3 intra=032 kJ mol-1 model had βC-H=-453 βH-H=270 and
Ebase=-506 while the Nk =4 intra=027 kJ mol-1 model had βCH=-446 βH-H=210 βH-
HB=257 and Ebase=-875 For TA the selected Nk=6 (intra=034 kJ mol-1) and 10
(intra=022 kJ mol-1) parameter fits are shown bold in Table 63
The rescaling of the C∙∙∙N interaction seemed particularly critical for TA (Table 63)
which can be attributed to the importance of the C(methyl)∙∙∙N interaction in describing
the steric clash involving the methyl group (Figure 514) However many of the fitted
rescaling parameters were negative (which suggested that the exponential steric
repulsion had become attractive Thus again this appeared to be a fitting exercise so that
exponential terms were reducing the over-estimate of the barrier at 90 by the
intermolecular dispersion parameters (Figure 519)
63 Results
148
Table 62 Complete set of results after rescaling Nk (repulsion contributions and
baseline energy Ebase) parameters of various interacting atomic types for FA
ικ Ebase σintra kJ mol-1
Nk C -C C -H C -HB H -H H -HB 2 - -226 - - - 437 168 2 - - -148 - - 1076 284 2 - - - -088 - 2215 287 2 - - - - -423 3579 299 2 -332 - - - - -39948 451 3 - -453 - 269 - -506 032 3 - -428 - - 539 -1511 032 3 -210 -217 - - - -31011 036 3 - -523 365 - - 278 04 3 -523 - -173 - - -62622 045 3 -621 - - -124 - -71356 065 3 -666 - - - -549 -74317 066 3 - - -991 - 2082 -7537 127 3 - - -909 722 - -2278 174 3 - - - -738 1972 -2577 247 4 - -446 - 210 257 -875 027 4 - -467 144 243 - -388 03 4 079 -438 - 258 - -2557 032 4 041 -390 - - 459 -7101 032 4 - -432 109 - 525 -1456 033 4 -173 -254 133 - - -27252 037 4 -458 - -296 - 394 -57220 04 4 -507 - -218 137 - -61133 045 4 -639 - - -035 -157 -72571 064 4 - - -958 006 2275 -7893 125 5 130 -467 - 218 278 2069 028 5 - -448 104 210 251 -849 028 5 236 -591 218 270 - 13231 029 5 -016 -327 037 - 481 -12963 031 5 -456 - -284 061 479 -57209 039 6 208 -550 170 237 225 10068 028
Table 63 Summary table of the best results after rescaling Nk (repulsion contributions
and baseline energy Ebase) parameters of various interacting atomic types for TA
βικ Ebase σintra kJ mol-1 Nk C-C C-Cl C-H C-HB Cl-H C-N H-H H-HB H-N
2 - 909 - - - - - - - 11281 130 3 -008 - - - - -299 - - - -13547 093 4 - - - - 751 -269 - - 1454 11747 087 5 - - -279 622 - -464 - -549 - -5429 051 6 - - -306 472 - -447 426 -529 - -5279 034 7 - - -392 472 - -487 532 -611 -054 -7690 025 8 - 503 -359 387 265 -340 581 -570 - 300 022 9 - 531 -343 355 318 -327 596 -539 190 1748 021
10 084 541 -319 330 347 -331 611 -527 219 681 022
63 Results
149
633 Combined Physical Model Assuming a model that both describes the electronic effects and allows rescaling of the
atomndashatom interactions
Then there is a huge number of ways for finding a satisfactory fitting of the data The
rescaling of the three contributions in equation 67 is physically justified since
(1) The α term represents the electronic barrier that arises from the conjugation of
benzoic acid rings (section 535)
(2) The rescale term is necessary due to the overestimation of the repulsion
contribution (section 536)
(3) The rescale term accounts for electron correlation ie dispersion Section 275
emphasised the importance of the dispersion term while section 533 showed the
consequence of ignoring the electron correlation eg HF method
Cases where and gt 0 retained the repulsive and attractive (dispersion) nature ie
repulsion did not become attraction and vice versa It was also required that was less
than zero ( lt 0) to give a maximum around =90deg corresponding to conjugation (Figure
515) Table 64 contains all the fits to FA which have the physically correct sign for all
parameters and the full set of results for fitting up to 12 parameters (including the baseline
estimate Ebase as given in Table 65) This shows that fitting and only rescaling a few
atomndashatom interactions gives a qualitatively accurate fit (Figure 69) It is notable that the
parameters involving H and HB usually needed the greatest rescaling a finding that is
consistent with the fact that HB parameters were not fitted in the intermolecular potential
model In addition the intermolecular parameterization of H∙∙∙H is a notable exception in
that its minimum is very shallow (Figure 68) and is not sharply defined being repulsive
for a wide range of intermolecular H∙∙∙H distances42 Furthermore there is a huge
difference between other polar H (HB) interactions and H∙∙∙H interactions therefore it is
not surprising that the interactions that involve HB atoms required the greatest rescaling
Table 64 All fits obtained for FA with the physically correct sign for the repulsion
and dispersion and electronic parameters βικ γικ α Ebase σintra
kJ mol-1 Nk C-C C-H C-HB H-H H-HB C-C C-H C-HB H-H H-HB
6 - - 801 1074 - - - 1654 5800 - -339 -12383 026
6 - 028 - - 1109 - 783 - - 3479 -117 -7549 028
4 - - - 1108 - - - - 5003 - -391 -5926 033
4 - 619 - - - - 2082 - - - -157 -18049 036
4 - - - - 3467 - - - - 13698 -530 -1246 057
4 - - 3630 - - - - 11038 - - -945 -33466 076
6
( ) cos(2 ) exp( )ik ik
i k
E A B R C R 67
63 Results
150
Figure 68 Gavezzotti exp-6 potential for all atomndashatom interactions in fenamates
displayed in two different energy scales The parameters are from Chapter 5 (Table 52)
Although virtually perfect fits can be obtained (Table 65) the variation in the fitted
parameters is significant given the exponential sensitivity of the repulsion to changes in
atomndashatom distances These could be substantial for example the lack of symmetry for
the FA torsional scan where the two minima were found at =3894deg and 14471deg though
only differing in energy by 188 x 10-3 kJ mol-1 (716 x 10-7 au) corresponded to a change
of 061 Aring in the 1-4 interaction between the amide proton and C13 or C9 Even the C8-C9
and C8-C13 aromatic bond lengths differed by 00037 Aring for =0 or 180deg but only by
00004 Aring for =80deg or 100deg with larger changes in the bonded hydrogen positions for
FA Hence the systematic consideration of all combinations of sets of parameters that
could be meaningfully fitted and the resulting coefficients only provided a qualitative
guide to which of the atomndashatom interactions dominated the intramolecular energy
(Chapter 5 Table 66) and were most critical
63 Results
151
Table 65 The rescale parameters for the repulsion ικ dispersion ικ and electronic contributions of
the physical exp-6 and cos2 model for all possible combinations of atom type interactions C∙∙∙C C∙∙∙H
C∙∙∙HB H∙∙∙H and H∙∙∙HB for FA Nk are the number of fitted rescale parameters ικ and ικ and the baseline
energy Ebase ικ ικ α Ebase σintra
kJ mol-1 Nk C-C C-H C-HB H-H H-HB C-C C-H C-HB H-H H-HB
4 - - - 1108 - - - - 5003 - -391 -5926 033
4 - 619 - - - - 2082 - - - -157 -18049 036 4 -797 - - - - -1508 - - - - -272 -10530 045
4 - - - - 3467 - - - - 13698 -530 -1246 057
4 - - 3630 - - - - 11038 - - -945 -33466 076
6 -366 461 - - - -1053 1477 - - - -080 -3768 010 6 -436 - - 610 - -764 - - 2966 - -114 -15833 012
6 -852 - -188 - - -1227 - -229 - - 055 -30621 017
6 -600 - - - 1135 -862 - - - 5415 -143 -23513 018 6 - -103 1476 - - - 574 4073 - - -220 -17385 023
6 - - - 1208 -182 - - - 6537 -2918 -208 -9576 024
6 - -255 - 619 - - 013 - 2048 - -216 -1513 025 6 - - 801 1074 - - - 1654 5800 - -339 -12383 026
6 - 028 - - 1109 - 783 - - 3479 -117 -7549 028
6 - - -1326 - 6519 - - -6960 - 32879 -539 24422 036
8 -275 351 - - 271 -935 1344 - - 412 -075 534 008
8 -236 414 - -157 - -1078 1876 - -1719 - -076 9374 009
8 -373 - - 626 334 -681 - - 3475 222 -066 -15208 009
8 -493 551 -189 - - -1218 1530 -642 - - -047 -6499 010 8 -530 - -737 725 - -1054 - -2417 3267 - -044 -3345 010
8 -698 - -1655 - 3047 -1263 - -6095 - 14774 012 5842 013
8 - -419 520 1195 - - -846 691 6039 - -246 -995 019 8 - - 1843 1185 -1677 - - 5881 7251 -11125 -196 -30353 019
8 - -089 2697 - -3196 - 952 9622 - -18054 -082 -40433 021
8 - -445 - 1541 -1016 - -970 - 7719 -6385 -166 -770 021
10 -445 686 -555 -541 - -1577 2664 -1489 -4179 - 017 13752 005 10 -524 469 -740 - 953 -1247 1257 -2481 - 3880 -022 -075 007
10 -320 465 - -026 593 -977 1532 - -349 1763 -064 -3403 008
10 -598 - -1429 455 1804 -1188 - -5112 1825 8695 -025 6986 009 10 - 166 2717 671 -2944 - 788 9384 4350 -17854 -113 -44769 014
12 -383 709 -155 -570 -447 -1498 2835 -035 -4260 -2903 018 9708 006
152
Table 66 The rescale parameters for the repulsion ικ dispersion ικ and electronic contributions of the physical exp-6 and cos2 model for all possible combinations of atom
type interactions C∙∙∙C C∙∙∙Cl C∙∙∙H C∙∙∙HB Cl∙∙∙H C∙∙∙N H∙∙∙H and H∙∙∙HB for TA Nk are the number of fitted rescale parameters and Ebase is the baseline energy ghThe parameters
used in Figure 69b and ifor testing transferability in Figure 610b and Figure 611 ικ ικ α Ebase σintra
kJ mol-1 Nk C-C C-Cl C-H C-HB Cl-H C-N H-H H-HB H-N C-C C-Cl C-H C-HB Cl-H C-N H-H H-HB H-N
4 - 1019 - - - - - - - - 593 - - - - - - - -135 8690 108
4 - - - - - 930 - - - - - - - - 2901 - - - -530 -24891 111
4 - - - - - - - - 1839 - - - - - - - - 5101 -293 -14115 149 4 - - - - - - - 861 - - - - - - - - 3884 - -254 2058 165
4 - - - 303 - - - - - - - - 1102 - - - - - -167 -1133 168
4 181 - - - - - - - - 095 - - - - - - - - -761 13228 193
6 - - - - - 2237 173 - - - - - - - 6517 1810 - - -135 -63604 049 6 - 484 - - - 1974 - - - - 4173 - - - 7186 - - - -848 -99438 067
6 - - 1560 - - - 1856 - - - - 817 - - - 11967 - - -1311 -8678 077
6 - - - - 967 2171 - - - - - - - 4431 6977 - - - -167 -89172 078 6 659 - - - - 4409 - - - 955 - - - - 12397 - - - -1602 -99338 102
6 - - - - - - 604 - 2288 - - - - - - 2012 - 7506 -674 -27619 120 g8 - 1933 - 567 - 2165 - - - - 7289 - 2207 - 6976 - - - -102 -114180 015
8 - - - - 1957 3068 - 498 - - - - - 8130 9634 - 2647 - -096 -133767 016 8 - 1618 - - - 2874 - 676 - - 6263 - - - 8952 - 3754 - -361 -119616 023
8 - 038 - - - 2451 133 - - - 1139 - - - 7574 1528 - - -320 -83684 028
8 - - 1015 801 - - 505 - - - - 083 437 - - 11123 - - -962 -4165 037 8 - - - - 634 2650 027 - - - - - - 2075 7927 1106 - - -313 -86212 041
8 - - - - - 2211 127 367 - - - - - - 6326 1898 1248 - -009 -62350 047
8 - - 156 - - 2356 105 - - - - 189 - - 6873 1561 - - -178 -67559 051 8 - - 1422 - - - 1194 1225 - - - 1118 - - - 8625 5331 - -621 -14314 063
8 - - 768 - - - 1497 - 1353 - - 221 - - - 8154 - 2730 -436 -9301 071 h10 - 1049 - - 2600 2731 - 679 - - 366 - - 9102 8140 - 3889 - -426 -112247 008
10 - - 135 - 853 2173 - 426 - - - 404 - 2724 6867 - 2476 - -193 -83710 009 10 - 853 - - - 2386 227 583 - - 3742 - - - 7431 1238 2941 - -222 -94694 010
10 - - - - 1465 2785 089 542 - - - - - 5788 8569 720 2568 - -107 -112106 011
10 - 1143 194 457 - 2086 - - - - 4833 341 1829 - 6762 - - - -096 -102646 016 10 050 - - - 1763 2692 - 496 - 085 - - - 7084 8615 - 2744 - -032 -123424 018 i10 - - 180 - - 2079 - 604 089 - - 627 - - 6176 - 3544 883 -051 -71971 026
10 - - 413 506 - 1334 018 - - - - 473 1146 - 4010 2532 - - -067 -48308 031 10 314 - 945 1122 - - 535 - - 531 - 110 1833 - - 10029 - - -966 -9528 032
10 - 1160 743 925 - - 365 - - - 2757 057 1532 - - 8017 - - -487 -17128 036
12 - - - 093 1321 2831 314 - 1519 - - - 569 4186 8238 941 - 3812 -414 -110966 007
12 - 709 - 253 1721 2653 - - 903 - 1198 - 1091 5530 7956 - - 1792 -350 -111102 008 12 - - 237 137 1032 2350 - - 700 - - 432 702 2719 7255 - - 1037 -351 -88568 008
12 - - 425 - 843 2274 065 656 - - - 588 - 2415 6938 1356 3101 - -440 -84012 008
12 - - 046 - - 2081 536 274 1391 - - 344 - - 5722 1360 2319 5007 -245 -78093 027
14 - - 384 214 886 2010 190 - 805 - - 456 690 2056 6136 1635 - 1462 -532 -76472 008 14 - - 249 012 954 2442 - 316 410 - - 457 214 2439 7563 - 1279 209 -360 -86183 009
63 Results
153
Figure 69 Comparison of the relative energies from ab initio calculations (solid black
lines) of FA (top) and TA (bottom) with selected physical models For FA the selected
Nk=6 intra=026 kJ mol-1 model has βC-HB =801 γC-HB =1654 βH-H =1074 γH-H =58 α=-
339 and Ebase=-12383 whilst the Nk =6 intra=028 kJ mol-1 model has β C-H =028 γ C-
H =783 β H-HB = 1109 γ H-HB =3479 α=-117 and Ebase=-7549 For TA parameters for
the selected Nk=8 (intra=015 kJ mol-1) and 10 (intra=008 kJ mol-1) are in ghTable 66
In contrast to FA TA (Table 66) gave a qualitatively accurate fit only when at least
three types of atomndashatom parameters were rescaled (Nk=8) including C∙∙∙N as shown in
Figure 69 The relaxed scans were sensitive to a large number of atomndashatom distances
so that the 5 change in did not necessarily give a smooth curve between the analytical
values This was because of the differences in the molecular relaxation and resulting
atomndashatom distances not the step size because Figure 510 of Chapter 5 showed that
smaller step size for FA produced a smooth but asymmetric ab initio energy-curve All
the fits with the physically correct parameters were unique solutions (section 262)
63 Results
154
Depending on which atomic types were being fitted there were some variations in the
parameters for a given atomndashatom interaction I noticed that for TA (Table 66) the C∙∙∙N
parameters consistently needed to be drastically rescaled reflecting the importance of the
methyl carbon (R1=CH3 Figure 61) in the conformational profile of TA Indeed TA
differed from FA in having many more intramolecular atomndashatom distances that changed
significantly within the range = 0 to 145 including some within the same aromatic ring
such as the methylndashchloro interactions (Table 61 or compare Table 56 with Table 57 in
Chapter 5) Day6 also observed that pyramidalizations of atoms (eg the nitrogen atom in
an amine group) significantly affect the intramolecular parameters
By following the procedure described in the methodology (section 622) I obtained a
variety of analytical models of the form of equation 67 that could reproduce the torsional
profiles of FA and TA with a high degree of accuracy despite the significant variation in
many atomndashatom distances during the relaxed torsional scans However the analytical
model had a maximum number of parameters for FA and TA (12 and 22 respectively)
with 5 (plus 1) atomic types C H N O HB (plus Cl) when considering atomic-
type∙∙∙atomic-type interaction that contributed significantly to energy changes with
conformation Fitting too many parameters led to models where some of the fitted
parameters had the wrong sign for their physical interpretation and some of these fits for
TA showed a linear dependence between the parameters (ie the fitted parameters were
not unique section 262) Nonetheless the ease with which this physically justified model
(equation 67) could reproduce the conformational dependence of FA and TA shows that
this approach to modelling the intramolecular energies of fenamates is promising
634 Transferability A further investigation of the physical reasonableness of the atomndashatom plus electronic
functional form (equation 67) is to test whether the models transfer to related molecules
The difference between the energy scans when the substituents are far from the varying
torsion angle for example the change of H to Cl atom ie from FA to ClFA or between
TA and MA (Figure 511) should not change the main steric interactions and should only
have a small effect on the electronic term (Figure 515e and f)
Transferring a set of parameters fitted to FA and adding Gavezzottirsquos Cl parameters
did indeed (Figure 610) give some of the asymmetry in the well depths seen for ClFA
and the higher central barrier as compared to FA (Figure 511) when the electronic term
was fitted Similarly a set of parameters fitted to TA could reproduce the lower barrier
at = 90 and higher barrier at = 0 in MA (Figure 610b) despite the fact that the
63 Results
155
conformational relaxation of the methylndashmethyl interaction was somewhat different from
that of the methyl-chloro geometry (Figure 513)
Figure 610 Comparison of the relative energies from ab initio calculations (solid black
lines) with models using transferred βικ and γικ parameters from FA and TA (dotted grey
plots) to ClFA (top) and MA (bottom) respectively The red curve has only had the
baseline adjusted whereas the blue curve had the parameter refitted to ClFA or MA
respectively The transferred FA parameters are those Nk=6 fit=028 kJ mol-1 in Figure
69 while those of TA Nk= 10 fit= =026 kJ mol-1 are shown in iTable 66
A more stringent test would be to apply the same TA parameters to FA and ClFA
which gave qualitatively correct results around the minima (Figure 611) and the steric
barriers at 0 and 180 However the barrier height around 90 would remain similar to
that in TA and this underestimation would be only partially corrected by refitting the
cos(2) term Given the limitations in the parameter optimization the qualitative
63 Results
156
accuracy is promising In particular the poorer transferability may be attributable to the
fact that the fitting of parameters for C and H interactions in TA was modelling both the
aromatic and methyl atoms and the methyl∙∙∙N interaction was critical in fitting the
parameters to the TA profile
Figure 611 Comparison of the relative energies from ab initio calculations (solid black
lines) with models using βικ and γικ parameters transferred from TA (dotted grey plots) to
(a) FA and (b) ClFA The red curve has only had the baseline adjusted whereas the blue
curve has the parameter refitted to FA or ClFA respectively The transferred TA
parameters are those of Nk= 10 fit= 026 kJ mol-1 as shown in iTable 66
64 Summary
157
64 Summary Neither the cosine terms nor the analytical models that rescaled overestimated repulsion
contributions were adequate for modelling the conformational profile of fenamates
However a physically justified modelmdashone that combined a cos2 term with an
intramolecular exp-6 atomndashatom term for all atom pairs separated by three or more bonds
(1-4 and above)mdashallowed for a very effective representation of the ab initio
conformational energies In this chapter I successfully fitted conformational profiles of
FA and TA to the cos2 plus exp-6 model This success suggests that the separation of
intramolecular and intermolecular forces is a promising new method for discovering force
fields that are more accurate which could in turn pave the way for modelling the
condensed phases of pharmaceutical-like organic molecules Considering a wide range of
molecules and bigger dataset could improve the transferability of this physical model
71 Position of CSP in the Context of this Thesis
158
Chapter 7 Conclusions and Future Work
ldquoIt is good to have an end to journey toward but it is the journey that matters in the
endrdquo
mdash Ernest Hemingway
71 Position of CSP in the Context of this Thesis The CSP results of Chapters 3 and 4 successfully validated the ability of
CrystalPredictor to generate crystal structures of flexible molecules In Chapter 3 I
successfully predicted the crystal structure of BT which has an unusual and unexpected
packing The success required the use of distributed multipoles and ab initio calculations
of intramolecular energy This success inspires hope that the use of multipolar
electrostatic models (as being implemented in the second-generation force fields such as
AMOEBA91) with careful evaluation of the accuracy of the intramolecular forces will
provide a route to greater reliability for computer-aided drug design with uncommon
ligands However the failure of a conventional point charge electrostatic model used in
the intermediate step has considerable implications for other studies that rely on
modelling the intermolecular interactions of 1-substituted 1H-tetrazoles
Chapter 4 successfully investigated the concept of polymorphophore via CSP studies
of FA and TA in an attempt to understand why polymorphism occurs I discovered that
the fenamate fragment did qualify as a polymorphophore in that the dimeric unit could
pack in a variety of ways with different torsion angles of the phenyl groups due to the
torsional flexibility of FA and TA Once the aromatic rings had interdigitated with their
nearest neighbours there was a large barrier to rearrangement to a very different packing
and the polymorphs were long-lived with the torsion angles varying slightly to optimize
the packing for a given structure as we saw for TA It was however the comparison
between the FA and TA crystal energy landscapes that showed that it was the substituents
that played the major role in determining the possible packing and relative energies and
hence the polymorphic behaviours of FA and TA These observations clearly
demonstrate the links among conformational flexibility polymorphism and
polymorphophore
The considerable similarity in large clusters of the known and hypothetical structures
of TA and the closeness of their energies suggested that crystal growth errors were very
likely More importantly though this finding guided my colleague in the discovery of a
new polymorph of TA (form VI) which was nucleated by solution evaporation after
72 Towards more accurate force-fields for pharmaceutical molecules
159
dissolving TA (form I) in ethanol and seeding it with mefenamic acid (form I) The major
component of this new form (form VI is disordered 65 and 35) was not among the
crystal structures on the final energy landscape despite generating the corresponding
hypothetical structure during an intermediate step (CrystalPredictor) Although this
observation emphasised the success of the CrystalPredictor algorithm it also showed the
need for larger numbers of crystal structures to go through CrystalOptimizer This need
for a larger dataset in the subsequent CrystalOptimizer step raises the question ldquoIs there
a clear cut-off in energy for flexible moleculesrdquo This question is even more relevant
when you consider that desolvated solvates can have much higher energy than organic
crystal structures247 In fact it might even be desirable to go even higher in energy due to
likely high conformation energy of the desolvated solvates The CrystalOptimizer
algorithm does allow the build-up of a database known as Local Approximate Models
(LAMs) but it would be preferable to be able to check many more structures If we could
better fit intramolecular energy which requires the bulk of the computing time to a force
field we would be able to compute the energies of many more structures of a target
molecule In addition computing the energies of the higher-energy structures would be
much cheaper
Chapters 3 and 4 used methods suitable for studying flexible molecules17 as the ab
initio charge density for the specific conformation was used in modelling the
intermolecular interactions thus representing the interplay between molecular
conformation and intermolecular interactions which have been shown to be important for
TA211 Conformational changes can optimise the directionality of strong interactions
such as H-bonding and increase the packing density and hence the stabilization of the
structure by dispersion forces Although CSP methodologies have advanced to aid solid
form screening in pharmaceutical development247-250 it is nevertheless desirable to
calculate the relative free energies of organic polymorphs via molecular dynamics
methods251-253 Although there has been a great push to include the kinetics and their
ability to control the polymorphs formed1 a vital first step is to develop a sound
understanding of thermodynamics
72 Towards more accurate force-fields for pharmaceutical molecules The challenge of extending the reliability and accuracy of quantum mechanical
methods to larger molecules which are more typical of pharmaceuticals and realistic
biological molecules in isolation or condensed phases is the subject of active research
This research ranges from empirical corrections to DFT methods to the use of better
73 Future Work
160
functionals254 as well as implementing explicitly correlated wavefunction methods more
effectively
Chapter 5 emphasized the challenges with using a sufficiently realistic method for the
ab initio determination of conformational energies for larger molecules For example the
HF method provides a qualitatively wrong and misleading conformational profile of FA
and TA due to the absence of the dispersion (correlation effect) contribution Dispersion
also plays an important role in the barrier to rotation for the fenamates especially when
the aromatic rings are perpendicular to one another The analysis of the fenamatesrsquo
torsional potential revealed that the origin of the torsional barrier of the fenamates is a
combination of intrinsic intramolecular dispersion electronic contribution and the steric
repulsion In addition small changes to other conformational angles made significant
contributions to the torsional profile of the fenamate molecules
In Chapter 6 a physically motivated analytical modelndashndashcos2 term combined with an
intramolecular exp-6 atomndashatom term for all atom pairs separated by three or more
bondsndashndashwas derived using knowledge gained from Chapter 5 This model accurately fits
the intramolecular energy profiles of FA and TA This approach of modelling the
conformational energies of the fenamates could be extended to pharmaceutical-like
flexible organics
73 Future Work One can envisage a general scheme for determining the physically motivated potentials
(Chapter 6) for a given molecule following a CSP study by an approach that is being
developed127 and applied to pharmaceutical molecules247-249255 The refinement of the
molecular conformations simultaneously with the crystallographic cell using
CrystalOptimizer72 involves the calculation and storage of a large database (LAMs) of ab
initio conformational energies and forces for the molecule For example the CSP studies
for FA and TA contain the results of hundreds of molecular wavefunction calculations
with varying torsion and bond angles
The database generated in a CSP study will cover most of the range of conformations
that are likely to be sampled in a Molecular Dynamics study of the molecules in
condensed phases with a strong bias towards the conformations that occur in low-energy
crystal structures both observed and potential polymorphs1 The LAMs database could
be used to improve the parameterization of the analytical conformational energy model
adapting the potential fitting routines (Appendix A) used in Chapter 6 An advantage of
using an analytical functional form rather than the LAMs to interpolate between the ab
73 Future Work
161
initio points in the CSP study is that the extrapolation to other conformations will be more
realistic The great benefit of this scheme of building up from a CSP study for a specific
molecule is that the model intramolecular force field could be validated by ensuring that
the model reproduces the crystal energy landscape ie the energies of different packing
H-bonding and stacking modes are correctly balanced with the accompanying
conformational changes
The application of separate analytical potentials for both intra- and intermolecular terms
will require adaptation of molecular modelling codes However the coding for the
energies forces and second derivatives of the proposed intramolecular force field
(equation 67) is already present in most codes After inserting the new parameters the
major adaptation that will be required for an existing codendashndashone that uses traditional force
fields such as DL_POLY251256 for Molecular Dynamics simulationsndashndashis separating out
the calculation of inter- and intramolecular terms Accurate intramolecular forces are
most needed in combination with the accurate anisotropic atom-atom intermolecular
potentials for organic molecules where the electrostatic term is represented by atomic
multipoles for example the static organic crystal structure modelling code
DMACRYS34 or the rigid molecule molecular dynamics code DL_MULTI257
Furthermore the adaptation of molecular modelling code would require an adequate
representation for the conformation dependence of the distributed multipoles for specific
molecules but the dependency could be represented by an analytical model258
Although this change in approach to pharmaceutical force fields involves envisaging a
specific model fitted for each molecule the physical basis of the current model and the
results from Chapter 6 suggest that a reasonably transferable set of atom-atom
intramolecular exp-6 potentials could be fitted for families of molecules Deriving a
transferable model would require a very large dataset of ab initio conformational profiles
of many molecules calculated at an appropriate accuracy The transferability of the
electronic term ( coefficients) would need investigating However the use of separate
atom-atom models for the forces within and between molecules appears to provide a
significant improvement in the realism of current force fields In conclusion this
approach could potentially provide an affordable route for Molecular Dynamics
simulations of flexible pharmaceuticals that have the accuracy of CSP
Appendix A
162
Appendix A Contents of enclosed CD-ROM
The CD-ROM attached to this thesis contains FORTRAN source codes of the analytical
models presented in Chapter 6 as well as some of the input files The input data for FA
TA MFA and ClFA that were used in conjunction with the source codes are in directory
A1 The inputs files included for each molecule are as follows
a) The summaryr contains a summary of the flexible degree of freedom ξ and
the intramolecular energy relative to the most stable conformation ΔEintra
b) The geometries of all the optimised conformation in mol2 file format
The source codes and example input files are in directories A2 (cosine model) A3
(rescaled repulsion model) and A4 (physical model) The A2 directory contains
a) an executable file (cos_modelexe)
b) FORTRAN source code (cos_modelf90)
c) input (summaryr) file
d) output (dominantr) file
The A3 and A4 directories contain
a) an executable file (exe)
b) FORTRAN source code (f90)
c) output (dominantr) file
d) an input subdirectory that contains
i Gavezzottirsquos exp-6 atom-atom parameters from Table 52
ii h03adfe subroutine computes the nearest neighbour of two atoms and
iii summaryr file
The A5 directory contains a utility file (extract_mol2sh) that extracts the input data
(summaryr and all the optimised conformations in mol2) from the GAUSSIAN0353
(log) file
Bibliography
163
Bibliography
1 Price S L Why dont we find more polymorphs Acta Crystallogr Sect B
2013 69 313-328
2 Price S L Predicting crystal structures of organic compounds Chem Soc Rev
2014 43 (7) 2098-2111
3 Svaumlrd M Structural Kinetic and Thermodynamic Aspects of the Crystal
Polymorphism of Substituted Monocyclic Aromatic Compounds 2011
4 Svaumlrd M Nordstroumlm F L Jasnobulka T Rasmuson Aring C Thermodynamics
and Nucleation Kinetics of m-Aminobenzoic Acid Polymorphs Cryst Growth
Des 2009 10 (1) 195-204
5 Chemburkar S R Bauer J Deming K Spiwek H Patel K Morris J
Henry R Spanton S Dziki W Porter W Quick J Bauer P Donaubauer
J Narayanan B A Soldani M Riley D McFarland K Dealing with the
impact of ritonavir polymorphs on the late stages of bulk drug process
development Org Process Res Dev 2000 4 (5) 413-417
6 Day G M Current approaches to predicting molecular organic crystal structures
Crystallography Reviews 2011 17 (1) 3-52
7 Byrn S R Pfeiffer R Ganey M Hoiberg C Poochikian G Pharmaceutical
Solids - A Strategic Approach to Regulatory Considerations Pharmaceut Res
1995 12 (7) 945-954
8 Price S L Lattice energy nailed Science 2014 345 (6197) 619-620
9 Newman A Specialized Solid Form Screening Techniques Org Process Res
Dev 2013 17 (3) 457-471
10 Day G M Cooper T G Cruz-Cabeza A J Hejczyk K E Ammon H L
Boerrigter S X M Tan J Della Valle R G Venuti E Jose J Gadre S R
Desiraju G R Thakur T S van Eijck B P Facelli J C Bazterra V E
Ferraro M B Hofmann D W M Neumann M Leusen F J J Kendrick J
Price S L Misquitta A J Karamertzanis P G Welch G W A Scheraga
H A Arnautova Y A Schmidt M U van de Streek J Wolf A Schweizer
B Significant progress in predicting the crystal structures of small organic
molecules - a report on the fourth blind test Acta Crystallogr Sect B 2009 65
(2) 107-125
11 Bardwell D A Adjiman C S Arnautova Y A Bartashevich E Boerrigter
S X Braun D E Cruz-Cabeza A J Day G M la Valle R G Desiraju G
R van Eijck B P Facelli J C Ferraro M B Grillo D Habgood M
Hofmann D W Hofmann F Jose K V Karamertzanis P G Kazantsev A
V Kendrick J Kuleshova L N Leusen F J Maleev A V Misquitta A J
Mohamed S Needs R J Neumann M A Nikylov D Orendt A M Pal R
Pantelides C C Pickard C J Price L S Price S L Scheraga H A van de
Bibliography
164
Streek J Thakur T S Tiwari S Venuti E Zhitkov I K Towards crystal
structure prediction of complex organic compounds - a report on the fifth blind
test Acta Crystallogr Sect B 2011 67 (6) 535-551
12 Price S L Developing Methods of Crystal Structure and Polymorph Prediction
Implications of Molecular and Materials Structures for New Technologies 1999
315-320
13 Neumann M A Tailor-made force fields for crystal-structure prediction J Phys
Chem B 2008 112 (32) 9810-9829
14 Price S L Computed crystal energy landscapes for understanding and predicting
organic crystal structures and polymorphism Accounts Chem Res 2009 42 (1)
117-126
15 Groom C R Reilly A M Sixth blind test of organic crystal-structure prediction
methods Acta Crystallogr Sect B 2014 70 (4) 776-777
16 Beyer T Lewis T Price S L Which organic crystal structures are predictable
by lattice energy minimisation CrystEngComm 2001 3 (44) 178-212
17 Kazantsev A V Karamertzanis P G Adjiman C S Pantelides C C Price
S L Galek P T Day G M Cruz-Cabeza A J Successful prediction of a
model pharmaceutical in the fifth blind test of crystal structure prediction Int J
Pharm 2011 418 (2) 168-178
18 Lopez-Mejias V Kampf J W Matzger A J Nonamorphism in Flufenamic
Acid and a New Record for a Polymorphic Compound with Solved Structures J
Am Chem Soc 2012 134 (24) 9872-9875
19 Lopez-Mejias V Kampf J W Matzger A J Polymer-Induced
Heteronucleation of Tolfenamic Acid Structural Investigation of a Pentamorph
J Am Chem Soc 2009 131 (13) 4554-4555
20 Yu L Polymorphism in Molecular Solids An Extraordinary System of Red
Orange and Yellow Crystals Accounts Chem Res 2010 43 (9) 1257-1266
21 Chen S A Xi H M Yu L Cross-nucleation between ROY polymorphs J
Am Chem Soc 2005 127 (49) 17439-17444
22 Murthy H K Bhat T N Vijayan M Structural studies of analgesics and their
interactions 9 Structure of a new crystal form of 2-([3-(trifluoromethyl) phenyl]
amino) benzoic acid (flufenamic acid) Acta Crystallogr Sect B 1982 38 (JAN)
315-317
23 Lutker K M Tolstyka Z P Matzger A J Investigation of a privileged
polymorphic motif A dimeric ROY derivative Cryst Growth Des 2008 8 (1)
136-139
24 Price S L Price L S Modelling Intermolecular Forces for Organic Crystal
Structure Prediction In Intermolecular Forces and Clusters I Wales D J Ed
Springer-Verlag Berlin Heidelberg Germany 2005 pp 81-123
Bibliography
165
25 Bernstein J Polymorphism in Molecular Crystals Clarendon Press Oxford
2002
26 Stone A J The Theory of Intermolecular Forces 2 ed Oxford University Press
Oxford 2013
27 Buckingham A D Utting B D Intermolecular Forces Annu Rev Phys Chem
1970 21 (1) 287-316
28 Maitland G C Rigby M Smith E B Wakeham W A Intermolecular
Forces Their Origin and Determination Clarendon Press Oxford 1981
29 Israelachvili J Intermolecular and Surface Forces Third Edition Academic
Press 2010
30 London F The general theory of molecular forces Trans Faraday Soc 1937
33 8b-26
31 Spencer N D Moore J H Encyclopedia of Chemical Physics and Physical
Chemistry Fundamentals 1 ed Taylor amp Francis 2001pp 1004
32 Welch G W A Karamertzanis P G Misquitta A J Stone A J Price S L
Is the induction energy important for modeling organic crystals J Chem Theory
Comput 2008 4 (3) 522-532
33 Price S L From crystal structure prediction to polymorph prediction interpreting
the crystal energy landscape Phys Chem Chem Phys 2008 10 (15) 1996-2009
34 Price S L Leslie M Welch G W A Habgood M Price L S
Karamertzanis P G Day G M Modelling Organic Crystal Structures using
Distributed Multipole and Polarizability-Based Model Intermolecular Potentials
Phys Chem Chem Phys 2010 12 (30) 8478-8490
35 Freitag M A Gordon M S Jensen J H Stevens W J Evaluation of charge
penetration between distributed multipolar expansions J Chem Phys 2000 112
(17) 7300-7306
36 Lund A M Orendt A M Pagola G I Ferraro M B Facelli J C
Optimization of Crystal Structures of Archetypical Pharmaceutical Compounds
A Plane-Wave DFT-D Study Using Quantum Espresso Crystal Growth amp Design
2013 13 (5) 2181-2189
37 Neumann M A Perrin M A Energy ranking of molecular crystals using
density functional theory calculations and an empirical van der Waals correction
J Phys Chem B 2005 109 (32) 15531-15541
38 Cox S R Hsu L Y Williams D E Nonbonded Potential Function Models for
Crystalline Oxohydrocarbons Acta Crystallogr Sect A 1981 37 (MAY) 293-
301
Bibliography
166
39 Williams D E Cox S R Nonbonded Potentials For Azahydrocarbons the
Importance of the Coulombic Interaction Acta Crystallogr Sect B 1984 40 (8)
404-417
40 Coombes D S Price S L Willock D J Leslie M Role of Electrostatic
Interactions in Determining the Crystal Structures of Polar Organic Molecules A
Distributed Multipole Study J Phys Chem 1996 100 (18) 7352-7360
41 Gavezzotti A Theoretical Aspects and Computer Modeling of the Molecular
Solid State John Wiley Chichester 1997 Vol 1
42 Filippini G Gavezzotti A Empirical Intermolecular Potentials For Organic-
Crystals the 6-Exp Approximation Revisited Acta Crystallogr Sect B 1993
B49 868-880
43 Williams D E Weller R R Lone-Pair Electronic Effects On the Calculated
Abinitio Scf-Mo Electric-Potential and the Crystal-Structures of Azabenzenes J
Am Chem Soc 1983 105 (13) 4143-4148
44 Karamertzanis P G Pantelides C C Optimal site charge models for molecular
electrostatic potentials Mol Simulat 2004 30 (7) 413-436
45 Spackman M A Molecular Electric Moments from X-ray Diffraction Data
Chem Rev 1992 92 1769-1797
46 Breneman C M Wiberg K B Determining Atom-Centered Monopoles From
Molecular Electrostatic Potentials - the Need For High Sampling Density in
Formamide Conformational-Analysis J Comput Chem 1990 11 (3) 361-373
47 Francl M M Carey C Chirlian L E Gange D M Charges fit to electrostatic
potentials II Can atomic charges be unambiguously fit to electrostatic potentials
J Comput Chem 1996 17 (3) 367-383
48 Stone A J Alderton M Distributed Multipole Analysis - Methods and
Applications Molecular Physics 1985 56 (5) 1047-1064
49 Welch G W A The induction contribution to the lattice energy of organic
crystals PhD 2010
50 Stone A J Distributed Multipole Analysis or How to Describe a Molecular
Charge Distribution Chemical Physics Letters 1981 83 (2) 233-239
51 Stone A J Distributed multipole analysis Stability for large basis sets J Chem
Theory Comput 2005 1 (6) 1128-1132
52 GDMA A Program for Performing Distributed Multipole Analysis of Wave
Functions Calculated Using the Gaussian Program System version 22
University of Cambridge Cambridge United Kingdom 2010
53 Gaussian 03 Gaussian Inc Wallingford CT 2004
Bibliography
167
54 GDMA A Program for Performing Distributed Multipole Analysis of Wave
Functions Calculated Using the Gaussian Program System version 10
University of Cambridge Cambridge United Kingdom 1999
55 Price S L Computational prediction of organic crystal structures and
polymorphism Int Rev Phys Chem 2008 27 (3) 541-568
56 Kazantsev A V Molecular Flexibility in Crystal Structure Prediction PhD
Imperial College London 2011
57 Smith W Point multipoles in the Ewald summation CCP5 Quarterly 1982 4
13-25
58 Cruz-Cabeza A J Bernstein J Conformational Polymorphism Chem Rev
2014 114 (4) 2170-2191
59 Cornell W D Cieplak P Bayly C I Gould I R Merz K M Ferguson D
M Spellmeyer D C Fox T Caldwell J W Kollman P A A Second
Generation Force-Field For the Simulation of Proteins Nucleic-Acids and
Organic-Molecules (Vol 117 Pg 5179 1995) J Am Chem Soc 1996 118 (9)
2309
60 van Mourik T Karamertzanis P G Price S L Molecular conformations and
relative stabilities can be as demanding of the electronic structure method as
intermolecular calculations J Phys Chem A 2006 110 (1) 8-12
61 van Mourik T Assessment of Density Functionals for Intramolecular Dispersion-
Rich Interactions J Chem Theory Comput 2008 4 (10) 1610-1619
62 Comba P Hambley T W Martin B Molecular modeling of inorganic
compounds John Wiley amp Sons 2009
63 Leach A R Molecular Modelling Principles and Applications Longman
Harlow 1996
64 Goodman J M Chemical Applications of Molecular Modelling Royal Society
of Chemistry Cambridge UK 1998
65 Brodersen S Wilke S Leusen F J J Engel G A study of different
approaches to the electrostatic interaction in force field methods for organic
crystals Phys Chem Chem Phys 2003 5 (21) 4923-4931
66 Lommerse J P M Motherwell W D S Ammon H L Dunitz J D
Gavezzotti A Hofmann D W M Leusen F J J Mooij W T M Price S
L Schweizer B Schmidt M U van Eijck B P Verwer P Williams D E
A test of crystal structure prediction of small organic molecules Acta Crystallogr
Sect B 2000 56 697-714
67 Motherwell W D S Ammon H L Dunitz J D Dzyabchenko A Erk P
Gavezzotti A Hofmann D W M Leusen F J J Lommerse J P M Mooij
W T M Price S L Scheraga H Schweizer B Schmidt M U van Eijck
Bibliography
168
B P Verwer P Williams D E Crystal structure prediction of small organic
molecules a second blind test Acta Crystallogr Sect B 2002 58 647-661
68 Ponder J W Case D A Force fields for protein simulations Protein
Simulations 2003 66 27-86
69 Cornell W D Howard A E Kollman P Molecular mechanical potential
functions and their application to study molecular systems Current Opinion in
Structural Biology 1991 201-212 Curr Opin Struc Biol 1991 1 (2) 201-212
70 Comba P Hambley T W Martin B Molecular modeling of inorganic
compounds 2009 3rd completely rev and enlarged ed
71 Kazantsev A V Karamertzanis P G Adjiman C S Pantelides C C
CrystalOptimizer An efficient Algorithm for Lattice Energy Minimisation of
Organic Crystal using Isolated-Molecule Quantum Mechanical Calculations In
Molecular System Engineering Adjiman C S Galindo A Eds WILEY-VCH
Verlag GmbH amp Co Weinheim 2010 Vol 6 pp 1-42
72 Kazantsev A V Karamertzanis P G Adjiman C S Pantelides C C
Efficient Handling of Molecular Flexibility in Lattice Energy Minimization of
Organic Crystals J Chem Theory Comput 2011 7 (6) 1998-2016
73 Jones J E On the Determination of Molecular Fields II From the Equation of
State of a Gas Proceedings of the Royal Society of London Series A 1924 106
(738) 463-477
74 Weiner S J Kollman P A Case D A Singh U C Ghio C Alagona G
Profeta S Weiner P A New Force-Field for Molecular Mechanical Simulation
of Nucleic-Acids and Proteins J Am Chem Soc 1984 106 (3) 765-784
75 Momany F A McGuire R F Burgess A W Scheraga H A Energy
parameters in polypeptides VII Geometric parameters partial atomic charges
nonbonded interactions hydrogen bond interactions and intrinsic torsional
potentials for the naturally occurring amino acids J Phys Chem 1975 79 (22)
2361-2381
76 Nemethy G Pottle M S Scheraga H A Energy parameters in polypeptides
9 Updating of geometrical parameters nonbonded interactions and hydrogen
bond interactions for the naturally occurring amino acids J Phys Chem 1983
87 (11) 1883-1887
77 Hagler A T Lifson S Energy functions for peptides and proteins II Amide
hydrogen bond and calculation of amide crystal properties J Am Chem Soc
1974 96 (17) 5327-5335
78 Hagler A T Huler E Lifson S Energy functions for peptides and proteins I
Derivation of a consistent force field including the hydrogen bond from amide
crystals J Am Chem Soc 1974 96 (17) 5319-5327
Bibliography
169
79 Jorgensen W L Quantum and statistical mechanical studies of liquids 10
Transferable intermolecular potential functions for water alcohols and ethers
Application to liquid water J Am Chem Soc 1981 103 (2) 335-340
80 Wang J M Wolf R M Caldwell J W Kollman P A Case D A
Development and testing of a general amber force field J Comput Chem 2004
25 (9) 1157-1174
81 Brooks B R Bruccoleri R E Olafson B D States D J Swaminathan S
Karplus M CHARMM A Program for Macromolecular Energy Minimization
and Dynamics Calculations J Comput Chem 1983 4 (2) 187-217
82 Becker O M Computational biochemistry and biophysics M Dekker New
York 2001
83 MacKerell A D Bashford D Bellott Dunbrack R L Evanseck J D Field
M J Fischer S Gao J Guo H Ha S Joseph-McCarthy D Kuchnir L
Kuczera K Lau F T K Mattos C Michnick S Ngo T Nguyen D T
Prodhom B Reiher W E Roux B Schlenkrich M Smith J C Stote R
Straub J Watanabe M Wiorkiewicz-Kuczera J Yin D Karplus M All-
Atom Empirical Potential for Molecular Modeling and Dynamics Studies of
Proteins J Phys Chem B 1998 102 (18) 3586-3616
84 Vanommeslaeghe K Hatcher E Acharya C Kundu S Zhong S Shim J
Darian E Guvench O Lopes P Vorobyov I Mackerell A D CHARMM
general force field A force field for drug-like molecules compatible with the
CHARMM all-atom additive biological force fields J Comput Chem 2010 31
(4) 671-690
85 Jorgensen W L Tirado-Rives J Potential energy functions for atomic-level
simulations of water and organic and biomolecular systems P Natl Acad Sci
USA 2005 102 (19) 6665-6670
86 Allinger N L Chen K Lii J H An improved force field (MM4) for saturated
hydrocarbons J Comput Chem 1996 17 (5-6) 642-668
87 Halgren T A Merck molecular force field 1 Basis form scope
parameterization and performance of MMFF94 J Comput Chem 1996 17 (5-
6) 490-519
88 Allinger N L Conformational analysis 130 MM2 A hydrocarbon force field
utilizing V1 and V2 torsional terms J Am Chem Soc 1977 99 (25) 8127-8134
89 Caleman C van Maaren P J Hong M Hub J S Costa L T van der Spoel
D Force Field Benchmark of Organic Liquids Density Enthalpy of
Vaporization Heat Capacities Surface Tension Isothermal Compressibility
Volumetric Expansion Coefficient and Dielectric Constant J Chem Theory
Comput 2011 8 (1) 61-74
90 Stouch T R The errors of our ways taking account of error in computer-aided
drug design to build confidence intervals for our next 25 years J Comput -Aided
Mol Des 2012 26 (1) 125-134
Bibliography
170
91 Ponder J W Wu C J Ren P Y Pande V S Chodera J D Schnieders M
J Haque I Mobley D L Lambrecht D S DiStasio R A Head-Gordon
M Clark G N I Johnson M E Head-Gordon T Current Status of the
AMOEBA Polarizable Force Field J Phys Chem B 2010 114 (8) 2549-2564
92 Day G M Motherwell W D S Jones W Beyond the isotropic atom model in
crystal structure prediction of rigid molecules Atomic multipoles versus point
charges Cryst Growth Des 2005 5 (3) 1023-1033
93 Marshall G R Limiting assumptions in molecular modeling electrostatics J
Comput -Aided Mol Des 2013 27 (2) 107-114
94 Payne R S Rowe R C Roberts R J Charlton M H Docherty R Potential
polymorphs of aspirin J Comput Chem 1999 20 (2) 262-273
95 Gourlay M D Kendrick J Leusen F J J Rationalization of racemate
resolution Predicting spontaneous resolution through crystal structure prediction
Cryst Growth Des 2007 7 (1) 56-63
96 Uzoh O G Analytically Modelling Intramolecular Energies of Fenamic and
Tolfenamic Acids Unpublished Work 2013
97 NAG Fortran Library Routine Document G02DDF Oxford United Kingdom
1989
98 Beran G J Hirata S Fragment and localized orbital methods in electronic
structure theory Physical Chemistry Chemical Physics 2012 14 (21) 7559-7561
99 Orio M Pantazis D A Neese F Density functional theory Photosynthesis
Research 2009 102 (2-3) 443-453
100 Sherrill C D An introduction to Hartree-Fock molecular orbital theory School
of Chemistry and Biochemistry Georgia Institute of Technology 2000
101 Shaik S S Hiberty P C A chemists guide to valence bond theory John Wiley
amp Sons 2007
102 Wu W Su P F Shaik S Hiberty P C Classical Valence Bond Approach by
Modern Methods Chem Rev 2011 111 (11) 7557-7593
103 Gasteiger J Engel T Chemoinformatics a textbook John Wiley amp Sons 2006
104 Fukui K Yonezawa T Shingu H A Molecular Orbital Theory of Reactivity in
Aromatic Hydrocarbons J Chem Phys 1952 20 (4) 722-725
105 Bell S Dines T J Chowdhry B Z Withnall R Computational chemistry
using modern electronic structure methods J Chem Educ 2007 84 (8) 1364-
1370
106 Moller C Plesset M S Note on an approximation treatment for many-electron
systems Phys Rev 1934 46 618-622
Bibliography
171
107 Valdes H Klusak V Pitonak M Exner O Stary I Hobza P Rulisek L
Evaluation of the intramolecular basis set superposition error in the calculations
of larger molecules [n]Helicenes and Phe-Gly-Phe tripeptide J Comput Chem
2008 29 (6) 861-870
108 Simon S Duran M Dannenberg J J How does basis set superposition error
change the potential surfaces for hydrogen bonded dimers Journal of Chemical
Physics 1996 105 (24) 11024-11031
109 Szczesniak M M Scheiner S Correction of the Basis Set Superposition Error
in SCF and MP2 Interaction Energies - the Water Dimer J Chem Phys 1986 84
(11) 6328-6335
110 Stephens P J Devlin F J Chabalowski C F Frisch M J Ab-Initio
Calculation of Vibrational Absorption and Circular-Dichroism Spectra Using
Density-Functional Force-Fields J Phys Chem 1994 98 (45) 11623-11627
111 Car R Introduction to density-functional theory and ab-initio molecular
dynamics Quant Struct -Act Rel 2002 21 (2) 97-104
112 Grimme S Antony J Schwabe T Muck-Lichtenfeld C Density functional
theory with dispersion corrections for supramolecular structures aggregates and
complexes of (bio)organic molecules Organic amp Biomolecular Chemistry 2007
5 (5) 741-758
113 Kohn W Becke A D Parr R G Density functional theory of electronic
structure J Phys Chem 1996 100 (31) 12974-12980
114 Hohenberg P Kohn W Inhomogeneous Electron Gas Physical Review B 1964
136 (3B) B864-B871
115 Kohn W Sham L J Self-consistent equations including exchange and
correlation effects Phys Rev 1965 140 (4A) A1133
116 Becke A D Density-Functional Thermochemistry 3 the Role of Exact
Exchange J Chem Phys 1993 98 (7) 5648-5652
117 Lee C T Yang W T Parr R G Development of the Colle-Salvetti
Correlation-Energy Formula Into A Functional of the Electron-Density Phys
Rev B 1988 37 (2) 785-789
118 Adamo C Barone V Toward reliable density functional methods without
adjustable parameters The PBE0 model J Chem Phys 1999 110 (13) 6158-
6170
119 Sherrill C D Introduction to Electron Correlation School of Chemistry and
Biochemistry Georgia Institute of Technology 2008
120 Grafenstein J Cremer D An efficient algorithm for the density-functional
theory treatment of dispersion interactions J Chem Phys 2009 130 (12)
Bibliography
172
121 Grimme S Density functional theory with London dispersion corrections Wiley
Interdisciplinary Reviews-Computational Molecular Science 2011 1 (2) 211-
228
122 Grimme S Antony J Ehrlich S Krieg H A consistent and accurate ab initio
parametrization of density functional dispersion correction (DFT-D) for the 94
elements H-Pu J Chem Phys 2010 132 (15) 154104
123 Brown T L Chemistry The Central Science Pearson Education 2009
124 Gavezzotti A Filippini G Polymorphic Forms of Organic-Crystals at Room
Conditions - Thermodynamic and Structural Implications J Am Chem Soc
1995 117 (49) 12299-12305
125 Karamertzanis P G Prediction of crystal structure of molecular solids PhD
Imperial College London 2004
126 Karamertzanis P G Pantelides C C Ab initio crystal structure prediction II
Flexible molecules Mol Phys 2007 105 (2-3) 273-291
127 Vasileiadis M Kazantsev A V Karamertzanis P G Adjiman C S
Pantelides C C The polymorphs of ROY application of a systematic crystal
structure prediction technique Acta Crystallogr Sect B 2012 68 (6) 677-685
128 Sobol I M On the distribution of points in a cube and the approximate evaluation
of integrals USSR Comp Math Math Phys 1967 7 86-112
129 The NAG Fortran Library Oxford United Kingdom 2013
130 Karamertzanis P G Price S L Energy Minimization of Crystal Structures
Containing Flexible Molecules J Chem Theory Comput 2006 2 (4) 1184-1199
131 Cooper T G Hejczyk K E Jones W Day G M Molecular Polarization
Effects on the Relative Energies of the Real and Putative Crystal Structures of
Valine J Chem Theory Comput 2008 4 (10) 1795-1805
132 Mennucci B Tomasi J Continuum solvation models A new approach to the
problem of solutes charge distribution and cavity boundaries J Chem Phys
1997 106 (12) 5151-5158
133 Habgood M Price S L Portalone G Irrera S Testing a Variety of Electronic-
Structure-Based Methods for the Relative Energies of 5-Formyluracil Crystals J
Chem Theory Comput 2011 7 (9) 2685-2688
134 Karamertzanis P G Pantelides C C Ab initio crystal structure prediction - I
Rigid molecules Journal of Computational Chemistry 2005 26 (3) 304-324
135 Williams D E Improved intermolecular force field for molecules containing H
C N and O atoms with application to nucleoside and peptide crystals J Comput
Chem 2001 22 (11) 1154-1166
Bibliography
173
136 Day G M Motherwell W D S Jones W A strategy for predicting the crystal
structures of flexible molecules the polymorphism of phenobarbital Physical
Chemistry Chemical Physics 2007 9 (14) 1693-1704
137 Kendrick J Leusen F J Neumann M A van de Streek J Progress in Crystal
Structure Prediction Chemistry - A European Journal 2011 17 (38) 10735-
10743
138 Braun D E Karamertzanis P G Price S L Which if any hydrates will
crystallise Predicting hydrate formation of two dihydroxybenzoic acids Chem
Commun 2011 47 (19) 5443-5445
139 Cruz-Cabeza A J Karki S Fabian L Friscic T Day G M Jones W
Predicting stoichiometry and structure of solvates Chem Commun 2010 46 (13)
2224-2226
140 Karamertzanis P G Kazantsev A V Issa N Welch G W A Adjiman C
S Pantelides C C Price S L Can the Formation of Pharmaceutical Co-
Crystals Be Computationally Predicted II Crystal Structure Prediction J Chem
Theory Comput 2009 5 (5) 1432-1448
141 Issa N Barnett S A Mohamed S Braun D E Copley R C B Tocher D
A Price S L Screening for cocrystals of succinic acid and 4-aminobenzoic acid
CrystEngComm 2012 14 (7) 2454-2464
142 Cruz-Cabeza A J Day G M Jones W Structure prediction disorder and
dynamics in a DMSO solvate of carbamazepine Phys Chem Chem Phys 2011
13 (28) 12808-12816
143 Habgood M Form II Caffeine A Case Study for Confirming and Predicting
Disorder in Organic Crystals Cryst Growth Des 2011 11 (8) 3600-3608
144 Torrisi A Leech C K Shankland K David W I F Ibberson R M Benet-
Buchholz J Boese R Leslie M Catlow C R A Price S L The solid phases
of cyclopentane a combined experimental and simulation study J Phys Chem
B 2008 112 (12) 3746-3758
145 Braun D E Karamertzanis P G Arlin J B Florence A J Kahlenberg V
Tocher D A Griesser U J Price S L Solid-State Forms of beta-Resorcylic
Acid How Exhaustive Should a Polymorph Screen Be Cryst Growth Des 2011
11 (1) 210-220
146 Llinas A Goodman J M Polymorph Control past present and future Drug
Discover Today 2008 13 (56) 198-210
147 Arlin J B Price L S Price S L Florence A J A strategy for producing
predicted polymorphs catemeric carbamazepine form V Chem Commun 2011
47 (25) 7074-7076
148 Maddox J Crystals from first Principles Nature 1988 335 (6187) 201
Bibliography
174
149 Day G M Motherwell W D S Ammon H L Boerrigter S X M Della
Valle R G Venuti E Dzyabchenko A Dunitz J D Schweizer B van Eijck
B P Erk P Facelli J C Bazterra V E Ferraro M B Hofmann D W M
Leusen F J J Liang C Pantelides C C Karamertzanis P G Price S L
Lewis T C Nowell H Torrisi A Scheraga H A Arnautova Y A Schmidt
M U Verwer P A third blind test of crystal structure prediction Acta
Crystallogr Sect B 2005 61 (5) 511-527
150 Collins A Wilson C C Gilmore C J Comparing entire crystal structures
using cluster analysis and fingerprint plots CrystEngComm 2010 12 (3) 801-
809
151 Chisholm J A Motherwell S COMPACK a program for identifying crystal
structure similarity using distances J Appl Crystallogr 2005 38 228-231
152 Asmadi A Kendrick J Leusen F J J Crystal Structure Prediction and
Isostructurality of Three Small Molecules Chem Eur J 2010 16 (42) 12701-
12709
153 Macrae C F Bruno I J Chisholm J A Edgington P R McCabe P
Pidcock E Rodriguez-Monge L Taylor R van de Streek J Wood P A
Mercury CSD 20 - new features for the visualization and investigation of crystal
structures J Appl Crystallogr 2008 41 466-470
154 Chisholm J A Motherwell S A new algorithm for performing three-
dimensional searches of the Cambridge Structural Database J Appl Crystallogr
2004 37 331-334
155 Gelbrich T Hursthouse M B Systematic investigation of the relationships
between 25 crystal structures containing the carbamazepine molecule or a close
analogue a case study of the XPac method CrystEngComm 2006 8 (6) 448-460
156 Gelbrich T Hursthouse M B A versatile procedure for the identification
description and quantification of structural similarity in molecular crystals
CrystEngComm 2005 7 324-336
157 McKinnon J J Spackman M A Mitchell A S Novel tools for visualizing and
exploring intermolecular interactions in molecular crystals Acta Crystallogr
Sect B 2004 60 627-668
158 Spackman M A McKinnon J J Fingerprinting intermolecular interactions in
molecular crystals CrystEngComm 2002 378-392
159 Parkin A Barr G Dong W Gilmore C G Jayatilaka D McKinnon J J
Spackman M A Wilson C C Comparing entire crystal structures structural
genetic fingerprinting CrystEngComm 2007 9 648-652
160 McKinnon J J Mitchell A S Spackman M A Hirshfeld surfaces A new tool
for visualising and exploring molecular crystals Chem Eur J 1998 4 (11) 2136-
2141
Bibliography
175
161 Etter M C MacDonald J C Bernstein J Graph-Set Analysis of Hydrogen-
Bond Patterns in Organic- Crystals Acta Crystallogr Sect B 1990 46 256-262
162 Grell J Bernstein J Tinhofer G Graph-set analysis of hydrogen-bond patterns
some mathematical concepts Acta Crystallogr Sect B 1999 55 1030-1043
163 Press W H Flannery B P Teukolsky S A Vetterling W T Numerical
methods the art of scientific computing (Fortran version) Cambridge University
Press Cambridge 1989
164 Galek P T A Novel comparison of crystal packing by moments of inertia
CrystEngComm 2011 13 (3) 841-849
165 Bonnet P A Streek J v d Trask A V Motherwell W D S Jones W The
crystal structure of an unstable polymorph of beta-D-allose CrystEngComm
2004 6 (86) 535-539
166 Potter B S Palmer R A Withnall R Chowdhry B Z Price S L Aza
analogues of nucleic acid bases experimental determination and computational
prediction of the crystal structure of anhydrous 5-azauracil J Mol Struct 1999
486 349-361
167 Nowell H Frampton C S Waite J Price S L Blind crystal structure
prediction of a novel second polymorph of 1-hydroxy-7-azabenzotriazole Acta
Crystallogr Sect B 2006 62 (4) 642-650
168 DOria E Karamertzanis P G Price S L Spontaneous Resolution of
Enantiomers by Crystallization Insights from Computed Crystal Energy
Landscapes Cryst Growth Des 2010 10 (4) 1749-1756
169 Thornber C W Isosterism and molecular modification in drug design Chem
Soc Rev 1979 8 (4) 563-580
170 Singh H Singh Chawla A Kapoor V K Paul D Malhotra R K 4
Medicinal Chemistry of Tetrazoles In Progress in Medicinal Chemistry Volume
17 ed Ellis and G P Ed Elsevier 1980 pp 151-183
171 Lipinski C A Chapter 27 Bioisosterism in Drug Design In Annual Reports in
Medicinal Chemistry Volume 21 ed Denis M B Ed Academic Press 1986
pp 283-291
172 SHELXL97 University of Goumlttingen Goumlttingen Germany 1997
173 Sheldrick G M A short history of SHELX Acta Crystallogr Sect A 2008 64
(1) 112-122
174 Farrugia L WinGX suite for small-molecule single-crystal crystallography J
Appl Crystallogr 1999 32 (4) 837-838
175 Ladd M F C Palmer R A Structure Determination by X-Ray Crystallography
Springer 2003
Bibliography
176
176 Khan S A Reshak A H First Principle Study of Electronic Structure Chemical
Bonding and Optical Properties of 5-azido-1H-tetrazole International Journal of
Electrochemical Science 2013 8 (7) 9459-9473
177 Desiraju G R Hydrogen bridges in crystal engineering Interactions without
borders Accounts Chem Res 2002 35 (7) 565-573
178 Herrebout W A Suhm M A Weak hydrogen bonds - strong effects Phys
Chem Chem Phys 2011 13 (31)
179 Schmidt M W Baldridge K K Boatz J A Elbert S T Gordon M S
Jensen J H Koseki S Matsunaga N Nguyen K A Su S Windus T L
Dupuis M Montgomery J A General Atomic and Molecular Electronic
Structure Systems J Comput Chem 1993 14 1347-1363
180 Cossi M Scalmani G Rega N Barone V New developments in the
polarizable continuum model for quantum mechanical and classical calculations
on molecules in solution J Chem Phys 2002 117 (1) 43-45
181 An email message sent Febrary 2012 to Rex Palmer stated the following we
would be delighted if it were 2nd_23res P21 a = 79 or 1st_120res P21c a =
100 as our two lowest energy structures
182 Allen F H The Cambridge Structural Database A quarter of a million crystal
structures and rising Acta Crystallogr Sect B 2002 58 (3) 380-388
183 Thakur T S Desiraju G R Crystal Structure Prediction of a Co-Crystal Using
a Supramolecular Synthon Approach 2-Methylbenzoic Acid-2-Amino-4-
methylpyrimidine Cryst Growth Des 2008 8 (11) 4031-4044
184 Surov A O Perlovich G L Thermodynamics of sublimation thermophysical
and structural aspects of the molecular crystals of fenamates J Struct Chem
2010 51 (2) 308-315
185 Li H Stowell J G Borchardt T B Byrn S R Synthesis Conformational
Polymorphism and Construction of a GT Diagram of 2-[(2-Nitrophenyl)amino]-
3-thiophenecarbonitrile Cryst Growth Des 2006 6 (11) 2469-2474
186 Pagola S Stephens P W He X Byrn S R Crystal structure solution of the
dark red light red and orange pollymorphs of 5-methyl-2-[(2-nitro-4-
methylphenyl)amino]-3-thiophenecarbonitrile by high resolution X-ray powder
diffraction and simulated annealing techniques Delhez R Mittemeijer E J
Eds 2001 pp 789-794
187 Zhou T Li F Fan Y Song W Mu X Zhang H Wang Y Hydrogen-
bonded dimer stacking induced emission of aminobenzoic acid compounds
Chem Commun 2009 (22) 3199-3201
188 Mei X F August A T Wolf C Regioselective copper-catalyzed amination of
chlorobenzoic acids Synthesis and solid-state structures of N-aryl anthranilic acid
derivatives Journal of Organic Chemistry 2006 71 (1) 142-149
Bibliography
177
189 Alvarez A J Singh A Myerson A S Polymorph Screening Comparing a
Semi-Automated Approach with a High Throughput Method Cryst Growth Des
2009 9 (9) 4181-4188
190 SeethaLekshmi S Guru Row T N Conformational polymorphism in a non-
steroidal anti-inflammatory drug mefenamic acid Cryst Growth Des 2012 12
(8) 4283-4289
191 Dokorou V Kovala-Demertzi D Jasinski J P Galani A Demertzis M A
Synthesis Spectroscopic Studies and Crystal Structures of Phenylorganotin
Derivatives with [Bis(26-dimethylphenyl)amino]benzoic Acid Novel
Antituberculosis Agents Helv Chim Acta 2004 87 (8) 1940-1950
192 Bernstein J Polymorphism - A Perspective Cryst Growth Des 2011 11 (3)
632-650
193 Yu L Stephenson G A Mitchell C A Bunnell C A Snorek S V Bowyer
J J Borchardt T B Stowell J G Byrn S R Thermochemistry and
Conformational Polymorphism of a Hexamorphic Crystal System J Am Chem
Soc 2000 122 (4) 585-591
194 Yang S S Guillory J K Polymorphism in sulfonamides J Pharm Sci 1972
61 (1) 26-40
195 Rossi D Gelbrich T Kahlenberg V Griesser U J Supramolecular constructs
and thermodynamic stability of four polymorphs and a co-crystal of pentobarbital
(nembutal) CrystEngComm 2012 14 (7) 2494-2506
196 Lutker K M Matzger A J Crystal polymorphism in a carbamazepine
derivative Oxcarbazepine J Pharm Sci 2010 99 (2) 794-803
197 Costantino L Barlocco D Privileged Structures as Leads in Medicinal
Chemistry Current Medicinal Chemistry 2006 13 (1) 65-85
198 Keinaumlnen S Similauml S Kouvalainen K Oral antipyretic therapy Evaluation of the
N-aryl-anthranilic acid derivatives mefenamic acid tolfenamic acid and
flufenamic acid Eur J Clin Pharmacol 1978 13 (5) 331-334
199 Andersen K V Larsen S Alhede B Gelting N Buchardt O
Characterization of two polymorphic forms of tolfenamic acid N-(2-methyl-3-
chlorophenyl)anthranilic acid their crystal structures and relative stabilities J
Chem Soc Perkin Trans 2 1989 (10) 1443-1447
200 Mattei A Li T Polymorph Formation and Nucleation Mechanism of
Tolfenamic Acid in Solution An Investigation of Pre-nucleation Solute
Association Pharmaceut Res 2012 29 (2) 460-470
201 Surov A O Szterner P Zielenkiewicz W Perlovich G L Thermodynamic
and structural study of tolfenamic acid polymorphs J Pharm Biomed Anal
2009 50 (5) 831-840
Bibliography
178
202 Brittain H G Polymorphism in Pharmaceutical Solids Informa Healthcare New
York London 2009 Vol 192
203 van de Streek J Motherwell S Searching the Cambridge Structural Database
for polymorphs Acta Crystallogr Sect B 2005 61 504-510
204 Desiraju G R Polymorphism The same and not quite the same Cryst Growth
Des 2008 8 (1) 3-5
205 Bhatt P M Desiraju G R Tautomeric polymorphism in omeprazole Chem
Commun 2007 (20) 2057-2059
206 de Gelder R Wehrens R Hageman J A A generalized expression for the
similarity of spectra Application to powder diffraction pattern classification J
Comput Chem 2001 22 (3) 273-289
207 Bruno I J Cole J C Edgington P R Kessler M Macrae C F McCabe
P Pearson J Taylor R New software for searching the Cambridge Structural
Database and visualizing crystal structures Acta Crystallogr Sect B 2002 58
389-397
208 Allen F H Taylor R Research applications of the Cambridge Structural
Database (CSD) Chem Soc Rev 2004 33 (8) 463-475
209 Kazantsev A V Karamertzanis P G Adjiman C S Pantelides C C Price
S L Galek P T A Day G M Cruz-Cabeza A J Successful Prediction of a
Model Pharmaceutical in the Fifth Blind Test of Crystal Structure Prediction Int
J Pharm 2011 418 (2) 168-178
210 Macrae C F Edgington P R McCabe P Pidcock E Shields G P Taylor
R Towler M van de Streek J Mercury visualization and analysis of crystal
structures J Appl Crystallogr 2006 39 453-457
211 Mattei A Li T L Interplay between molecular conformation and
intermolecular interactions in conformational polymorphism A molecular
perspective from electronic calculations of tolfenamic acid Int J Pharm 2011
418 (2) 179-186
212 Habgood M Grau-Crespo R Price S L Substitutional and orientational
disorder in organic crystals a symmetry-adapted ensemble model Phys Chem
Chem Phys 2011 13 (20) 9590-9600
213 Lancaster R W Karamertzanis P G Hulme A T Tocher D A Lewis T
C Price S L The Polymorphism of Progesterone Stabilization of a
Disappearing Polymorph by Co-Crystallization J Pharm Sci 2007 96 (12)
3419-3431
214 Gavezzotti A The Calculation of Molecular Volumes and the Use of Volume
Analysis in the Investigation of Structured Media and of Solid-State Organic-
Reactivity J Am Chem Soc 1983 105 (16) 5220-5225
Bibliography
179
215 The Free Dictionary defines herringbone as a way of assembling in a diagonal
zigzag manner
216 Desiraju G R On the presence of multiple molecules in the crystal asymmetric
unit (Z gt 1) CrystEngComm 2007 9 (1) 91-92
217 Anderson K M Steed J W Comment on On the presence of multiple
molecules in the crystal asymmetric unit (Z gt 1) by Gautam R Desiraju
CrystEngComm 2007 9 91 CrystEngComm 2007 9 (4) 328-330
218 Delaney S P Smith T M Pan D Yin S Korter T M Cryogenic Phase
Transition in Crystalline Aripiprazole Leads to an Eighth Polymorph Cryst
Growth Des 2014
219 From private communication with Rona Watson at University College London
220 Thompson H P G Day G M Which conformations make stable crystal
structures Mapping crystalline molecular geometries to the conformational
energy landscape Chem Sci 2014 5 (8) 3173-3182
221 Mo Y Gao J Theoretical Analysis of the Rotational Barrier of Ethane Accounts
Chem Res 2007 40 (2) 113-119
222 Pophristic V Goodman L Hyperconjugation not steric repulsion leads to the
staggered structure of ethane Nature 2001 411 (6837) 565-568
223 Halpern A M Glendening E D An intrinsic reaction coordinate calculation of
the torsional potential in ethane Comparison of the computationally and
experimentally derived torsional transitions and the rotational barrier Journal of
Chemical Physics 2003 119 (21) 11186-11191
224 Mulliken R S Intensities of Electronic Transitions in Molecular Spectra IV
Cyclic Dienes and Hyperconjugation 2004 7 (5) 339-352
225 Mo Y Song L Lin Y Block-Localized Wavefunction (BLW) Method at the
Density Functional Theory (DFT) Level J Phys Chem A 2007 111 (34) 8291-
8301
226 Brunck T K Weinhold F Quantum-Mechanical Studies on the Origin of
Barriers to Internal-Rotation About Single Bonds J Am Chem Soc 1979 101
(7) 1700-1709
227 Pendas A Blanco M Francisco E Steric Repulsions Rotation Barriers and
Stereoelectronic Effects A Real Space Perspective J Comput Chem 2009 30
(1) 98-109
228 Surov A O Perlovich G L Emelyanenko V N Verevkin S P
Thermochemistry of Drugs Experimental and First-Principles Study of
Fenamates J Chem Eng Data 2011 56 (12) 4325-4332
229 GaussView version 5 2009
Bibliography
180
230 Clark M Cramer R D Van Opdenbosch N Validation of the general purpose
tripos 52 force field J Comput Chem 1989 10 (8) 982-1012
231 Gavezzotti A Filippini G Geometry of the Intermolecular X-HY (X Y=N
O) Hydrogen- Bond and the Calibration of Empirical Hydrogen-Bond Potentials
J Phys Chem 1994 98 (18) 4831-4837
232 Gavezzotti A Are Crystal-Structures Predictable Accounts Chem Res 1994 27
(10) 309-314
233 Mercury version 31 2013
234 Lozano J J Pouplana R Loacutepez M Ruiz J Conformational analysis of the
antiinflammatory fenamates a molecular mechanics and semiempirical molecular
orbital study Journal of Molecular Structure THEOCHEM 1995 335 (13)
215-227
235 Rappe A K Casewit C J Colwell K S Goddard W A Skiff W M Uff a
Full Periodic-Table Force-Field For Molecular Mechanics and Molecular-
Dynamics Simulations J Am Chem Soc 1992 114 (25) 10024-10035
236 Jorgensen W L Tirado-Rives J The OPLS potential functions for proteins
energy minimizations and crystals of cyclic peptides and crambin J Am Chem
Soc 1988 110 (6) 1657-1666
237 Hopkins C W Roitberg A E Fitting of Dihedral Terms in Classical Force
Fields as an Analytic Linear Least-Squares Problem J Chem Inf Model 2014
54 (7) 1978-1986
238 Wheatley R J Price S L An Overlap Model For Estimating the Anisotropy of
Repulsion Mol Phys 1990 69 (3) 507-533
239 Totton T S Misquitta A J Kraft M A First Principles Development of a
General Anisotropic Potential for Polycyclic Aromatic Hydrocarbons J Chem
Theory Comput 2010 6 (3) 683-695
240 Sorescu D C Rice B M Thompson D L Intermolecular potential for the
hexahydro-135-trinitro-135-s- triazine crystal (RDX) A crystal packing
Monte Carlo and molecular dynamics study J Phys Chem B 1997 101 (5) 798-
808
241 Williams D E Houpt D J Fluorine Nonbonded Potential Parameters Derived
From Crystalline Perfluorocarbons Acta Crystallogr Sect B 1986 42 (JUN)
286-295
242 OBoyle N Banck M James C Morley C Vandermeersch T Hutchison
G Open Babel An open chemical toolbox Journal of Cheminformatics 2011 3
(1) 33
243 Combinations - Rosetta Code
Bibliography
181
244 Hastie T Tibshirani R Friedman J The Elements of Statistical Learning Data
Mining Inference and Prediction Second Edition 2nd ed 2009 Corr 7th
printing 2013 edition ed Springer New York 2011pp 745
245 Schmidt M U Dinnebier R E Kalkhof H Crystal engineering on industrial
diaryl pigments using lattice energy minimizations and X-ray powder diffraction
J Phys Chem B 2007 111 (33) 9722-9732
246 Ahmed S Bidstrup S A Kohl P A Ludovice P J Development of a new
force field for polynorbornene J Phys Chem B 1998 102 (49) 9783-9790
247 Braun D E McMahon J A Koztecki L H Price S L Reutzel-Edens S M
Contrasting Polymorphism of Related Small Molecule Drugs Correlated and
Guided by the Computed Crystal Energy Landscape Cryst Growth Des 2014
14 (4) 2056-2072
248 Ismail S Z Anderton C L Copley R C Price L S Price S L Evaluating
a Crystal Energy Landscape in the Context of Industrial Polymorph Screening
Cryst Growth Des 2013 13 (6) 2396-2406
249 Price L S McMahon J A Lingireddy S R Lau S-F Diseroad B A Price
S L Reutzel-Edens S M A molecular picture of the problems in ensuring
structural purity of tazofelone J Mol Struct 2014 ASAP
250 Kendrick J Stephenson G A Neumann M A Leusen F J Crystal Structure
Prediction of a Flexible Molecule of Pharmaceutical Interest with Unusual
Polymorphic Behavior Cryst Growth Des 2013 13 (2) 581-589
251 Price S L Hamad S Torrisi A Karamertzanis P G Leslie M Catlow C
R A Applications of DL_POLY and DL_MULTI to organic molecular crystals
Mol Simulat 2006 32 (12-13) 985-997
252 Abramov Y A QTAIM Application in Drug Development Prediction of
Relative Stability of Drug Polymorphs from Experimental Crystal Structures J
Phys Chem A 2011 115 (45) 12809-12817
253 Campeta A M Chekal B P Abramov Y A Meenan P A Henson M J
Shi B Singer R A Horspool K R Development of a Targeted Polymorph
Screening Approach for a Complex Polymorphic and Highly Solvating API J
Pharm Sci 2010 99 (9) 3874-3886
254 Klimes J Michaelides A Perspective Advances and challenges in treating van
der Waals dispersion forces in density functional theory J Chem Phys 2012
137 (12) 120901
255 Vasileiadis M Pantelides C C Adjiman C S Prediction of the crystal
structures of axitinib a polymorphic pharmaceutical molecule Chem Eng Sci
2015 121 60-76
256 Smith W Todorov I T Leslie M The DL_POLY molecular dynamics
package Z Kristallogr 2005 220 (5-6) 563-566
Bibliography
182
257 Leslie M DL_MULTI - A molecular dynamics program to use distributed
multipole electrostatic models to simulate the dynamics of organic crystals Mol
Phys 2008 106 (12-13) 1567-1578
258 Koch U Popelier P L A Stone A J Conformational Dependence of Atomic
Multipole Moments Chem Phys Lett 1995 238 (4-6) 253-260
Abstract
3
Abstract
In the crystal packing of molecules wherein a single bond links aromatic groups a
change in the torsion angle can optimise close packing of the molecule The improved
intermolecular interactions Uinter outweigh the conformational energy penalty Eintra to
give a more stable lattice energy Elatt = Uinter +Eintra This thesis uses this lattice energy
model hierarchically in a new Crystal Structure Prediction (CSP) algorithm
CrystalPredictor version 16 which varies the low-barrier torsion angles at the start of
generating hypothetical crystal structures
The crystal structure of 1-benzyl-1H-tetrazole was successfully predicted in an
informal lsquoblind testrsquo when given the chemical diagram and the number of molecules in
the asymmetric unit cell Then the concept of whether specific molecular fragments
favour polymorphism (ie polymorphophore) was investigated by analysing the crystal
energy landscapes of the monomorphic fenamic acid and the polymorphic derivative
tolfenamic acid The CSP results show that the polymorphophore promotes but does not
guarantee polymorphism and that the substituents on the polymorphophore fragment
decide the relative energies of the crystal structures
Molecular Dynamics (MD) cannot use this lattice energy model because many ab initio
calculations of Eintra on a single molecule are expensive However the examination of
the physical origin of the torsional barrier in fenamates aided the derivation of an
analytical model forEintra This thesis develops codes for fitting analytical
intramolecular force fields to ab initio conformational profiles of fenamates An
intramolecular exp-6 atom-atom term (for the non-bonded repulsion-dispersion
contributions) plus a cosine term (that represents the changes to the Molecular Orbitals)
accurately model the ab initio conformational energy surfaces of fenamic and tolfenamic
acids This thesis provides a first step in extendingEintra data generated from CSP
studies to help MD on condensed phases of pharmaceutical-like organic molecules
Dedication
4
Dedication
I dedicate this thesis to my wife Jodi Uzoh my mother Felicia Uzoh and my father
Emmanuel Uzoh For their endless love support and encouragement
Acknowledgments
5
Acknowledgments
Foremost I would like to thank my supervisor Professor Sally Price for her support
and direction throughout my time at UCL Her encouragement and wise words at the start
of my doctorate program were vital
My sincere gratitude to Louise Price for helping me to understand the practical aspects
of the computational methods of Crystal Structure Prediction (CSP) and for the interesting
and insightful discussions about research and life My colleagues in Room G18 and
friends at UCL made my time there fun inspiring and exciting I would like to thank Rex
Palmer for setting the informal blind test of Chapter 3 and for the subsequent collaborative
paper
Many thanks to the Centre for Doctoral Training in Molecular Modelling and Materials
Science (CDTM3S) at UCL for the rigorous training they gave me during the first year
and the yearly industrial day invitation to present my research The opportunity to work
with sixth form students in the third year sponsored by CDTM3S was one of the most
rewarding experiences I had at UCL
My industrial sponsor Cambridge Crystallographic Data Centre (CCDC) has been
instrumental at every research stage The encouragement received after presenting my
work at the annual CCDC student day was invaluable My industrial supervisors at
CCDCndashndashAurora J Cruz-Cabeza (a year and a half) and Peter Galek (two and a half years)
ndashndashhave been instrumental in collaborative research and publications I appreciate their
insight energy time and encouragement during our many meetings
Finally this work would not be possible without the financial support from the CCDC
and the Engineering and Physical Science Research Council (EPSRC) under the
CDTM3S grant EPG0366751
List of Publications
6
List of Publications
1 Uzoh O G Cruz-Cabeza A J Price S L Is the Fenamate Group a
Polymorphophore Contrasting the Crystal Energy Landscapes of Fenamic and
Tolfenamic Acids Cryst Growth Des 2012 12 (8) 4230-4239
2 Spencer J Patel H Deadman J J Palmer R A Male L Coles S J Uzoh
O G Price S L The Unexpected but Predictable Tetrazole Packing in Flexible
1-Benzyl-1H-Tetrazole CrystEngComm 2012 14 (20) 6441-6446
I carried out all the computational work and prepared the manuscript
3 Uzoh O G Galek P T A Price S L Towards more Accurate Force Fields for
pharmaceutical molecules ndash Analysing the Conformational Energy Profiles of
Fenamates 2014 (Submitted)
Table of Contents
7
Table of Contents
Modelling Molecular Flexibility for Crystal Structure Prediction 1
Declaration 2
Abstract 3
Dedication 4
Acknowledgments 5
List of Publications 6
Table of Contents 7
List of Figures 11
List of Tables 18
List of Abbreviations 20
List of Symbols 21
Chapter 1 Introduction 22
11 Background 22
12 Scope and Outline of Thesis 26
Chapter 2 Theoretical Background 27
21 Overview 27
22 Intermolecular Forces 27
221 Pairwise Additivity 28
222 Physical Origin of Intermolecular Force 29
223 Long-range Interactions 30
224 Short-range Interactions 31
225 Penetration Energy and Charge Transfer 32
23 Modelling the Intermolecular Forces for Organic Molecules 32
231 Repulsion-Dispersion Potentials 33
232 Electrostatics Potential 34
24 Intramolecular Energy 36
25 Force Fields (Atomistic Modelling) 38
251 AMBER 41
252 CHARMM 42
253 Other Force Fields 42
254 The Limits of Current Force Fields 43
Table of Contents
8
26 The Fitting Routine 44
261 Linear Least Square Method 44
262 Subroutine for Solving Least Squares 46
27 Electronic Structure Methods 47
271 Hartree Fock Theory 48
271 Molecular Orbital Theory 48
272 Correlation Effects 49
273 Moslashller-Plesset Perturbation Theory 49
274 Density Functional Theory 50
275 The DFT-D Approach 51
28 Crystal Structure Prediction (CSP) 52
281 CrystalPredictor 54
282 CrystalOptimizer 55
283 Polarizable Continuum Model (PCM) 56
284 Other Approaches to Lattice Energy Minimisation 56
285 The Crystal Energy Landscapes 58
286 The Blind Tests 58
29 Crystal Structure Comparison 59
Chapter 3 An Informal Blind Test A Crystal Structure Prediction of 1-
Benzyl-1H-tetrazole 62
31 Introduction 62
311 Background 62
312 Experimental Determination of 1-Benzyl-1H-Tetrazole 63
313 Molecular Geometry of the Experimental Structure 63
314 Crystal Packing Weak Hydrogen Bonding 64
315 Overview of the Challenge 65
32 Computational Methodology 66
321 Conformational Analysis 66
322 Crystal Structure Prediction 66
33 Results and Discussion 67
331 Conformational Energy Grid 67
332 The CrystalPredictor Energy Landscape 68
333 The CrystalOptimizer and PCM Energy Landscapes 68
334 Did the Predicted Structure Really Match the Experimental 70
335 The Global Minimum Structure on the PCM Energy Landscape 71
336 Post Analysis Comparison of Structure with CSD 73
Table of Contents
9
34 Summary 76
Chapter 4 Is the fenamate group a polymorphophore Contrasting the crystal
energy landscapes of fenamic and tolfenamic acids 77
41 Introduction 77
411 Polymorphism and Polymorphophores 79
412 Conformations in known Crystal Structures 79
413 Experimental Data of FA and TA 80
414 Similarities between the known forms of FA and TA 83
415 Solving the Connectivity Problem of a Disordered Form 84
416 Overview 87
42 Computational Methods 87
421 Ab initio Conformational Profile of TA 87
422 CSD Survey for Fenamates 87
423 Crystal Structure Prediction 88
424 Experimental Crystal Structures with Z´ gt1 90
425 Comparison of Crystal Structures 90
43 Results 91
431 Dependence of Conformational Energy on Method 91
432 Consideration of H-bonded Torsion 92
433 CSD Survey of Fenamates 93
434 Validation of the CrystalOptimizer plus PCM Models 95
435 Energy Landscapes of Intermediate Steps 96
436 Finding and Explaining the Known Structures with CSP 97
437 Other Known Fenamates and their Hypothetical Structures 103
438 Update on a Recently Discovered Polymorph of TA 105
439 The Cost of Lattice Energy Minimisation 106
44 Summary 107
Chapter 5 The Origin of conformational energy barriers in Fenamates 109
51 Introduction 109
511 Background 109
512 Torsional Barrier for Ethane 110
513 Overview 113
52 Method 114
521 Determining Conformation Energy Scan for Isolated Molecule 114
522 Ab initio Conformational Energy Profiles for Fenamates 114
523 Investigation of Electronic Effects 115
Table of Contents
10
524 Investigation of the Steric (Non-Bonded) Effects 116
53 Results 117
531 Effect of Different Definitions of the Same Flexible Bond 117
532 Effect of Step Size on the Conformation Profile of Fenamate Molecule 119
533 Conformational Energy Profile of the Fenamates 122
534 Rigid Versus Relaxed Scans of Fenamates 124
535 Splitting electronic from steric contributions to the barrier to rotation 127
536 Estimating the Steric Contributions with an Atom-Atom Potential 130
537 Investigating the Important Interactions with Atom-Atom Potential 131
54 Discussion The Physical Origins of Torsional Potentials 133
55 Summary 134
Chapter 6 Toward New Force fields for Fenamate Molecules 136
61 Introduction 136
611 Background 136
612 A Case for Modelling Decoupled Intramolecular Energy 137
613 Analytical Models of Intramolecular Energies 138
614 Overview 138
62 Methodology Fitting Analytical Models to Conformational Profiles 139
621 Torsional Potential Model 139
622 AtomndashAtom Model 141
63 Results 144
631 Cosine Series Model 144
632 Rescaled Repulsion Model 146
633 Combined Physical Model 149
634 Transferability 154
64 Summary 157
Chapter 7 Conclusions and Future Work 158
71 Position of CSP in the Context of this Thesis 158
72 Towards more accurate force-fields for pharmaceutical molecules 159
73 Future Work 160
Appendix A 162
Contents of enclosed CD-ROM 162
Bibliography 163
List of Figures
11
List of Figures
Figure 11 Diagrammatic illustration of crystal structure prediction (CSP) methodology
23
Figure 12 A chemical diagram of a target molecule XX from the fifth blind test17 24
Figure 13 The chemical diagram of tolfenamic (TA) and flufenamic (FFA) acids 25
Figure 14 Polymorphs of ROY numbered in the order of discovery The polymorphs
have different colours melting points and molecular conformations (most pronounced in
the torsion angle θ) (Source Ref [20]) 25
Figure 15 Overlay of the experimental conformers of ROY viewed with the overlaid
nitrobenzene fragment horizontal (Source Ref [2]) 26
Figure 21 Typical intermolecular force potential energy functions for spherical atoms
28
Figure 22 Charge distributions corresponding to pure multipoles Blue portions
represent regions where the function is positive and yellow portions represents where it
is negative Qlk is the spherical harmonic multipole where l is angular momentum
quantum number and k = l l-1hellip -l specifies the component of the angular momentum
around the z-axis (Source httpenwikipediaorgwikiSpherical_harmonics [Accessed
11012015]) 35
Figure 23 Schematic representation of conformational change and conformational
adjustment (Source Ref [58]) 37
Figure 24 The schematic view of force field interactions Covalent bonds are solid lines
while the dotted line indicates non-bonded interaction (Source Ref [68]) 39
Figure 25 Schematic view of four key contributions to a molecular mechanics force
field These forces are bond stretching bond stretching angle bending torsional terms
and non-bonded interactions (Source Ref [63]) 39
Figure 26 Schematic view of the torsion angle ξ using the ethane molecule (Source
quantumwisecomdocumentsmanualsvnl-200810_Manualchapmolbuilderhtml
[Accessed 11012015]) 40
Figure 27 Schematic view of some of the common cross terms (Source Ref [63]) 43
Figure 31 The chemical diagram of BT determined from the crystal structure Torsion
angles 1=C7-C6-N1-C5 and 2 = C12-C7-C6-N1 62
Figure 32 The crystal structure of BT (a) Partial view of the crystal packing showing
close CH∙∙∙N contacts between a central tetrazole and six surrounding tetrazoles (b)
Partial view showing CH∙∙∙N CH∙∙∙C and CH∙∙∙ contacts 64
Figure 33 BT crystal structure (a) View of the infinite S-shaped layers held together by
weak CH∙∙∙N and CH∙∙∙C H-bonds (b) Partial view of the layer structure showing
List of Figures
12
alternative B(benzyl) and T(tetrazole) layers and the repeating layer sequence [BTBT |
TBTB] 65
Figure 34 The conformational energy grid used in the search Relative intramolecular
energies ΔEintra (kJ mol-1) for isolated molecule calculations at the MP26-31G(d p)
level of theory 67
Figure 35 The CrystalPredictor energy landscape of BT generated with a crude lattice
energy model The generated structure that matched the experimental structure is
highlighted in the open red symbol 68
Figure 36 (a) The CrystalOptimizer (step 3) and (b) PCM (step 4) energy landscape
of BT GM is the global energy minimum The open red symbol represents a match
between the experimental crystal structure and the generated structure The energy
ranking of the crystal structure that matches the experimental has improved from fourth
most stable 4 to second most stable 2 69
Figure 37 The 15-molecule overlay between the experimental (atomic colours) and the
second most stable computed structure 2BT_23 (green) The direction of the view
obscures some of the molecules 71
Figure 38 Crystal Packing Similarity between experimental (grey) and the most stable
predicted structure (1BT_120 green) with only 2 molecules matching (RMSD2 = 1072
Aring) 72
Figure 39 The structure corresponding to the global minimum in lattice energy
(1BT_120) showing the dominant weak H-bonds (Aring) eight of type CH∙∙∙N and one
CH∙∙∙C and the weak ∙∙∙ interaction (benzylmiddotmiddotmiddotbenzyl) 72
Figure 310 Query used in Conquest to search the CSD for similar fragments 73
Figure 311 Histograms showing the bond length distributions of 32 1-susbtituted 1H-
tetrazole rings in the CSD The red square denotes the experimental bond lengths in BT
while the black square denotes the ab initio bond lengths in the corresponding calculated
structure 2BT_23 74
Figure 312 Histograms showing the distributions of the torsions and angles of the 32-
tetrazole rings found during the CSD survey The experimental bond length in BT is
denoted by the red square while the ab initio bond length in the corresponding calculated
structure 2BT_23 is denoted by the black square 75
Figure 41 The polymorphophore families of ROY and fenamic acid The numbers of
polymorphs in the Cambridge Structural Database (CSD) follow the refcodes for each
specific molecule and (x) denotes the number of additional polymorphs that whose
crystal structures were not available The lowest two rows are fenamates whose structures
are used in Table 46 78
Figure 42 Overlay of the experimental conformers of FA (top) and TA (bottom) viewed
with the overlaid benzoic acid fragment arranged horizontal FA QQQBTY02 (Z´=2
light blue and magenta) TA KAXXAI01 (Form I Z´=1 blue) KAXXAI (Form II Z´=1
red) KAXXAI02 (Form III Z´=2 green and purple) KAXXAI03 (Form IV Z´=3
yellow brown (obscured by yellow) and black) and KAXXAI04 (Form V Z´=1
disordered on both sites (section 415) violet and grey) The arrows point to the main
List of Figures
13
variation (ξ1) between the conformers of FA and TA in the experimental crystal
structures 80
Figure 43 Temperature dependence of the enthalpy (H) and free energy (G) diagrams
for forms I and II of TA showing a monotropic (top) relationship from data from
Surov201 which are qualitatively the same as data from Andersen199 and an enantiotropic
(bottom) relationship from data from Mattei and Li200 82
Figure 44 Features of the experimental crystal structures (a) The hydrogen-bonded
dimer motif found in all structures with variations in the phenyl ring orientations (ξ1)
The specific illustration shows the packing similarity between FA (QQQBTY02) and TA
form II (KAXXAI) (b) The unique packing of TA form II with short contacts between
chlorine and the aromatic ring (c) Crystal Packing Similarity between form III and form
IV of TA showing the 11-molecule overlay which includes only two dimers 84
Figure 45 (a) Crystal structure KAXXAI04 of form V of TA (b) The atom connectivity
of the two new components (colour red and blue) the original C-N connectivity is
labelled green (c) Chemical diagram showing the atomic connectivity of TA 85
Figure 46 Ordered Z=2 crystal structures formed from the disordered components of TA
form V (a) Form V_a (b) Form V_b and (c) Form V_c 86
Figure 47 Query fragment and the torsion angle ξ1 measured in the Conquest207 survey
of the CSD structures There were 131 organic structures where Y=H and 94 where Yne
H 88
Figure 48 The fragment used in the CrystalPredictor search for TA Each fragment was
kept rigid during the search for hypothetical crystal structures 89
Figure 49 The degrees of freedom optimized by CrystalOptimizer for crystal structures
of FA and TA (ξ1equiv C7-N1-C8-C9 ξ2equiv C2-C7-N1-C8 ξ3equiv O1-C1-C2-C7 ξ4equiv H1-O1-C1-C2
and ξ5equiv C8-C13-C14-H10 θ1equiv H6-N1-C8 θ2equiv H1-O1-C1) 89
Figure 410 The relative conformational energy of isolated TA molecules as a function
of the ξ1 The MP2 and PBE0 method at 6-31G(dp) basis set compared with the other
method (top) and the other basis sets (bottom) for the PBE0 method 91
Figure 411 The relative conformational energy as a function of the ξ2 (Figure 49) for
FA and TA calculated at the PBE06-31G(dp) level of theory 92
Figure 412 The relaxed conformational energy scan of FA and TA as a function of ξ1 at
the PBE06-31+G(d) level of theory (a) Includes the experimental values of ξ1 marked
for TA and FA with the symmetry equivalent FA conformations denoted by open black
squares and an insert diagram showing the steric hindrance for TA in the high-energy
region A histogram of (b) 131 crystal structures found in the CSD search (Figure 47)
with Y=H plus symmetry equivalent structures and (c) 94 crystal structures with YneH
94
Figure 413 Crystal energy landscape of TA for the Z´=1 structure after (a)
CrystalPredictor (Step 1) (b) the single conformer calculation of Eintra and the atomic
multipoles at the PBE06-31G(dp) level of theory (Step 2 of section 423) 96
Figure 414 The crystal energy landscapes of FA (top) and TA (bottom) Each symbol
represents a crystal structure of the specified space group which is a minimum in the
List of Figures
14
lattice energy (calculated within the polarizable continuum) The open symbols
correspond to the minima starting from the experimental structures (Table 43) The
packing coefficient is the proportion of the cell volume occupied by the molecule214
calculated using a grid spacing of 01 Aring 98
Figure 415 (a) Overlay of the only known form of FA (grey) and the most stable
structure on the Z´=1 crystal energy landscape (Figure 414a) 1FA_22 (green) with an
RMSD5 value of 175Aring (b) Overlay of the conformers of form I (pink and light blue) and
1FA_22 (black) 100
Figure 416 (a) Overlay of the two most stable hypothetical crystal structures on the
crystal energy landscape global minimum 1FA_22 (grey) and 2FA_2 (green) with
ΔElatt=20 kJ mol-1 The crystal structures overlaid 12 molecules with RMSD12 of 051 Aring
and the conformations had an RMSD1 of 009 Aring (b) Overlay of 2FA_2 (green) and the
experimental crystal structure of FA (grey) with a RMSD15 of 123 Aring obtained with a
distance and angle tolerance of 50 and 50deg (c) Overlay of the two independent
molecules in the experimental structure (grey) with 2FA_2 (green) 101
Figure 417 The overlay of the experimental Z´=1 crystal structures (grey) of TA with
the closest structure found in the search (green) (a) Form I and 1TA_8 overlaid with an
RMSD15 value of 032Aring (b) Form II and 5TA_38 overlaid with an RMSD15 value of
026Aring 102
Figure 418 Classification of the crystal energy landscape of FA in terms of the similarity
of the structures to those of known TA polymorphs (I-IV) without PCM (hence the
different y-axis compared to Figure 414a) Numbers in bold indicate the number of
molecules that overlay with the known structure of FA Hence a label 5 6 on a structure
represented by a blue circle means that the structure overlaid 5 molecules with the
experimental form of FA but 6 with form I of TAEach point is coloured by the TA
polymorph with which it overlaid the greatest number n of molecules in a Crystal Packing
Similarity calculation that ignored the CH3 and Cl 103
Figure 419 Overlay of FA_137 (green) and the major component of experimental
crystal structure of TA form VI (grey) with a RMSD15 of 030 Aring obtained with a distance
and angle tolerance of 50 and 50deg 106
Figure 420 CPU timings of (a) 38_TA (form II) and (b) 137_TA (form VI section
438) after lattice energy minimisation using CrystalOptimizer (step 3) 107
Figure 51 The fenamate family showing the low barrier torsion angle (=C7-N1-C8-C9)
=0 when the aromatic rings are coplanar as drawn The fenamates family mentioned in
this chapter includes fenamic acid (FA) R1= R2= H tolfenamic acid (TA) R1= CH3 R2=
Cl mefenamic acid (MA) R1= R2= CH3 clofenamic acid (ClFA) R1=H R2=Cl and
flufenamic aid (FFA) R1=H R2=CF3 The dotted line represents an intramolecular
hydrogen bond 109
Figure 52 Illustration of the barrier to rotation with the relaxed conformational energy
profile of FA 110
Figure 53 The staggered and eclipsed conformations of the ethane molecule (Sources
Ref [222] and enwikipediaorgwikiAlkane_stereochemistry [Accessed 11012015])
111
List of Figures
15
Figure 54 (a) Hyperconjugation effects on the staggered (b) Pauli exchange repulsion
in the eclipsed conformation (Source enwikipediaorgwikiHyperconjugation
[Accessed 11012015]) 112
Figure 55 Electrostatic steric repulsion (between electrons on the bond black arrow) for
the eclipsed conformation of ethane The red arrow indicates exclusion of van der Waals
repulsion since the van der Waals radii of the hydrogen are too small to make contact
(Source enwikipediaorgwikiConformational_isomerism [Accessed 11012015]) 113
Figure 56 Chemical diagram of model molecules used to investigate the electronic
contributions The bonds around N1 are constrained to be planar (ie R2-N1-H6-C8=180deg)
for phenylamine (PA) R1=R2=H N-methylaniline R1=H R2= CH3 N-vinylaniline R1=H
R2 = CH=CH2 and 3-anilinoprop-2-enoic acid R1=H R2 = CH=CHCO2H for 3-
chloroaniline R1= Cl R2=H and 3-methylaniline R1=CH3 R2=H (=R2-N1-C8-C9) 115
Figure 57 Pyramidalization in unconstrained phenylamine (PA) molecule caused by
lone pair on nitrogen atom 115
Figure 58 Relaxed scan of TA at the PBE06-31+G(d) level of theory with the different
definitions of flexible N1-C8 bond (= C7-N1-C8-C9 2= C7-N1-C8-C13
3=H6-N1-C8-C9
and 4= H6-N1-C8-C13) used as the constrained geometric parameter 118
Figure 59 Molecular conformation of the relaxed gas phase at PBE06-31+G(d) showing
the bond lengths of the phenyl C-C bond (=180) of FA 120
Figure 510 Relaxed scans of FA at PBE06-31+G(d) with step sizes 2 and 1deg around the
maxima and minima respectively The red circles indicate the starting points of the scans
while the arrows indicate the directions of the scans 121
Figure 511 Relaxed conformational scans at the PBE06-31+G(d) level of theory for the
fenamates The minima were at ξ=3894deg and 14471deg for FA 4063deg and 11186deg for
TA 4408deg and 11048deg for MA and 3586deg and 14838deg for ClFA 122
Figure 512 Relaxed conformational scans of fenamates (a) FA (b) TA (c) MA and (d)
ClFA at HF and PBE0 method with 6-31+G(d) basis set These are contrasted with the
single-point energies at the MP26-31+G(d) level and within a polarizable continuum
model (PCM) with =3 for the PBE06-31+G(d) conformations 123
Figure 513 Comparison of relaxed (solid) and rigid (dotted line) scan of FA (top) TA
(middle) and MA (right) For the rigid scans calculations were performed using HF MP2
and PBE0 methods with 6-31+G(d) basis set as a function of torsion angle The relaxed
scans from Figure 511 were performed at the PBE06-31+G(d) level of theory 125
Figure 514 Overlay of relaxed (coloured by element Figure 511) and rigid (red Figure
513) conformations of FA (top) TA (middle) and MA (bottom) overlaying the atoms
defining the ξ torsion angle at the PBE06-31+G(d) level of theory 126
Figure 515 The solid black lines show the relaxed torsional scans of planar-N-
constrained models for the phenyl rotation (Figure 56) where the benzoic acid group of
FA has been replaced by (a) hydrogen atom (PA) (b) methyl (c) vinyl and (d) prop-2-
enoic acid and the hydrogen in the meta position of PA has been replaced by (e) chlorine
and (f) methyl using HF PBE0 and MP2 methods with the 6-31+G(d) basis set Plots of
(h2)(1-cos(2)) where h is the height of the barrier of relaxed PBE06-31+G(d) scans
List of Figures
16
are shown in green For (c)-(f) the PBE06-31+G(d) relaxed scans of PA from (a) are
shown in grey for comparison In (a) and (b) a rigid scan at the PBE06-31+G(d) level of
theory is shown by a dotted line 127
Figure 516 The electron density surface of HOMO frontier orbitals for different
conformations of PA (top) FA (middle) and TA (bottom) obtained from the PBE06-
31+G(d) level of theory Contour map isovalues were drawn at a 002 au level 129
Figure 517 Alternative HOMO isosurface view of (a) FA and (b) PA molecule at =90
from Figure 516 129
Figure 518 HOMO-10 (46 MOs) isosurface view of side (top) and front (bottom) FA
molecule at =0 40 and 90 130
Figure 519 Comparison of the ab initio (black) intramolecular energy scans at the
PBE06-31+G(d) level of theory for FA (top) and TA (bottom) with Gavezzottirsquos exp-6
intramolecular energy models summed over all intramolecular atom-atom distances from
the third nearest neighbour (1-4) and above The net effect (purple) is subdivided into the
repulsive (red) and dispersion (blue) contributions 131
Figure 61 The fenamate family showing the low-barrier torsion angle (=C7-N1-C8-C9)
and atomic numbering =0 when the aromatic rings are coplanar as drawn The
fenamates mentioned in this chapter are fenamic acid (FA) R1= R2= H tolfenamic acid
(TA) R1= CH3 R2= Cl mefenamic acid (MA) R1= R2= CH3 flufenamic acid (FFA) R1=
H R2= CF3 and clorofenamic acid (ClFA) R1=H R2=Cl The dotted line represents an
intramolecular hydrogen bond 137
Figure 62 Relaxed conformational scans at the PBE06-31+G(d) level of theory for the
fenamates from section 533 Fenamic acid (FA) tolfenamic acid (TA) mefenamic acid
(MA) and chlorofenamic acid (ClFA) 137
Figure 63 An algorithm showing the overview of modelling ab initio intramolecular
energy using a cosine series potential The source codes are included in the CD ROM
attached to this thesis (see Appendix A) 140
Figure 64 An algorithm showing the modelling of ab initio intramolecular energy by a
physical potential The source codes are included in the CD ROM attached to this thesis
(see Appendix A) 141
Figure 65 Comparison of the ab initio relaxed scan at the PBE06-31+G(d) level of
theory with linearly fitted least square cosine series model for FA (top) and TA (bottom)
with Nk=5 (red lines) the optimal cos4 terms (blue lines) and Nk=21 (green lines σintra
=017 kJ mol-1 for FA and TA) 145
Figure 66 Plot of the standard error of the intramolecular energies against the number of
cosine terms Nk for FA (top) and TA (bottom) The fit is ill-determined ie there is no
unique solution for TA after Nk=21 146
Figure 67 Comparison of the relative energies from ab initio calculations (solid black
lines) of FA (top) and TA (bottom) with selected best-fit exp-6 rescaled repulsion models
For FA the selected Nk=3 intra=032 kJ mol-1 model had βC-H=-453 βH-H=270 and
Ebase=-506 while the Nk =4 intra=027 kJ mol-1 model had βCH=-446 βH-H=210 βH-
List of Figures
17
HB=257 and Ebase=-875 For TA the selected Nk=6 (intra=034 kJ mol-1) and 10
(intra=022 kJ mol-1) parameter fits are shown bold in Table 63 147
Figure 68 Gavezzotti exp-6 potential for all atomndashatom interactions in fenamates
displayed in two different energy scales The parameters are from Chapter 5 (Table 52)
150
Figure 69 Comparison of the relative energies from ab initio calculations (solid black
lines) of FA (top) and TA (bottom) with selected physical models For FA the selected
Nk=6 intra=026 kJ mol-1 model has βC-HB =801 γC-HB =1654 βH-H =1074 γH-H =58 α=-
339 and Ebase=-12383 whilst the Nk =6 intra=028 kJ mol-1 model has β C-H =028 γ C-
H =783 β H-HB = 1109 γ H-HB =3479 α=-117 and Ebase=-7549 For TA parameters for
the selected Nk=8 (intra=015 kJ mol-1) and 10 (intra=008 kJ mol-1) are in ghTable 66
153
Figure 610 Comparison of the relative energies from ab initio calculations (solid black
lines) with models using transferred βικ and γικ parameters from FA and TA (dotted grey
plots) to ClFA (top) and MA (bottom) respectively The red curve has only had the
baseline adjusted whereas the blue curve had the parameter refitted to ClFA or MA
respectively The transferred FA parameters are those Nk=6 fit=028 kJ mol-1 in Figure
69 while those of TA Nk= 10 fit= =026 kJ mol-1 are shown in iTable 66 155
Figure 611 Comparison of the relative energies from ab initio calculations (solid black
lines) with models using βικ and γικ parameters transferred from TA (dotted grey plots) to
(a) FA and (b) ClFA The red curve has only had the baseline adjusted whereas the blue
curve has the parameter refitted to FA or ClFA respectively The transferred TA
parameters are those of Nk= 10 fit= 026 kJ mol-1 as shown in iTable 66 156
List of Tables
18
List of Tables
Table 31 Angles and bond lengths of the tetrazole ring in BT No information about the
bonds or angles were given to me prior to submission of the candidate structures 64
Table 32 Summary of experimental (highlighted in blue) and computed crystal
structures on the PCM energy landscape (Figure 36) The computed structure that
matched the experimental structure (section 312) is highlighted in bold For label
xBT_y x and y are energy ranked after steps 4 and 1 of CSP respectively (section 322)
70
Table 41 The experimental data of the known forms of FA and TA Crystal structures
and Hfus values were taken from ref [19] unless otherwise specified aThe most widely
varying torsion angle ξ1 is defined in Figure 49 bTemperature of crystal structure
determination cMelting temperature 81
Table 42 Quantification of the similarities of FA and TA crystal structures showing the
packing similarity (RMSDn) and powder X-ray diffraction (PXRD) similarity206 The
bold numbers indicate the number of molecules n that match within distance and angle
tolerances of 20 and 20deg respectively with the RMSDn values in brackets See section
425 83
Table 43 Comparison of the lattice energy minimum with the experimental structure
used as a starting point for the final lattice energy model (PBE06-31+G(d) PCM) for
the ordered structures of FA and TA The three form V Z=2 model structures derived
from the disorder components of TA (section 415) are also compared with the starting
model RMSDn corresponds to n=15 unless (n) is given 95
Table 44 The lattice energy minima of FA shown in Figure 414a The minimum found
starting from the experimental structure is in bold 99
Table 45 The lattice energy minima of TA shown in Figure 414b Minima found starting
from the experimental structures or ordered models are in bold 99
Table 46 Crystal Packing Similarity comparisons of the experimental structures of FA
and TA and their most stable hypothetical crystal structures with the crystal structures of
the other fenamates shown in Figure 13 The similarity is given in the form n(RMSDn)
with n gt 4 molecules highlighted 104
Table 47 An extension of Table 46 showing Crystal Packing Similarity comparisons of
the latest structures of flufenamic acid18 and the experimental structures of FA and TA
and their most stable hypothetical crystal structures 105
Table 48 Crystal Packing Similarity calculations of the known forms of TA and
unobserved thermodynamically competitive crystal structures The similarity between
the structures is given in the form n(RMSDn) where n is the number of molecules overlaid
and the value in brackets is the RMSDn overlay Structures with the highest similarity are
highlighted 105
Table 51 Torsional barrier height of ethane (Source Reproduced from Ref [223]) 111
List of Tables
19
Table 52 Gavezzottirsquos exp-6 atom-atom parameters E=Aexp(-BR)-CR-6 is the well
depth and Rm is the distance at the minimum41231232 Italics represent the hydrogen-
bonded interactions aFrom the UNI intermolecular potential function of Mercury233 116
Table 53 Torsional barrier height of the relaxed conformational energy profiles in Figure
58 for TA 119
Table 54 Comparison of intramolecular energies and hydrogen bond distances of TA for
the near-planar conformer 119
Table 55 Comparison of the intramolecular energies and the N-H7∙∙∙HX-C14 bond
distances of TA for the near-planar conformer where HX-C14 is the methyl group 119
Table 56 Atom-atom interactions of FA that dominate the intramolecular energies as
estimated using Gavezzottirsquos exp-6 potential The interaction is listed as dominant if the
difference between the minimum and maximum total energy (Erepul-dis) is greater than or
equal to 1 kJ mol-1 132
Table 57 Atom-atom interactions of TA that dominate the intramolecular energies as
estimated from Gavezzottirsquos exp-6 potential The interaction is listed as dominant if the
difference between the minimum and maximum total energy (Erepul-dis) is greater than or
equal to 1 kJ mol-1 dInteractions between atoms on the same aromatic ring fInteractions
involving the methyl substituent 132
Table 61 Contrasting the atomndashatom interactions of FA and TA that dominated the
intramolecular energies formed by combining Table 56 and Table 57 from Chapter 5
Interactions unique to FA and TA are coloured blue and red respectively dInteractions
between atoms of the same aromatic ring fInteractions involving the methyl substituent
143
Table 62 Complete set of results after rescaling Nk (repulsion contributions and
baseline energy Ebase) parameters of various interacting atomic types for FA 148
Table 63 Summary table of the best results after rescaling Nk (repulsion contributions
and baseline energy Ebase) parameters of various interacting atomic types for TA
148
Table 64 All fits obtained for FA with the physically correct sign for the repulsion
and dispersion and electronic parameters 149
Table 65 The rescale parameters for the repulsion ικ dispersion ικ and electronic
contributions of the physical exp-6 and cos2 model for all possible combinations of atom
type interactions C∙∙∙C C∙∙∙H C∙∙∙HB H∙∙∙H and H∙∙∙HB for FA Nk are the number of
fitted rescale parameters ικ and ικ and the baseline energy Ebase 151
Table 66 The rescale parameters for the repulsion ικ dispersion ικ and electronic
contributions of the physical exp-6 and cos2 model for all possible combinations of atom
type interactions C∙∙∙C C∙∙∙Cl C∙∙∙H C∙∙∙HB Cl∙∙∙H C∙∙∙N H∙∙∙H and H∙∙∙HB for TA Nk
are the number of fitted rescale parameters and Ebase is the baseline energy ghThe
parameters used in Figure 69b and ifor testing transferability in Figure 610b and Figure
611 152
List of Abbreviations
20
List of Abbreviations
CCDC Cambridge Crystallographic Data Centre
CSP Crystal Structure Prediction
API Active Pharmaceutical Ingredient
DFT Density Functional Theory
HFSCF Hatree ForkSelf Consistent Field
PBE Perdew Burke and Ernzerhof exchange-correlation functional
B3LYP Becke three-parameter Lee-Yang-Parr
MP-n Moslashller-Plessett nth order of pertubabtion
PCM Polarizable Continuum Model
DMA Distributed Multipole Analysis
GDMA Gaussian Distributed Multipole Analysis
BT 1-Benzyl-1H-Tetrazole
FA Fenamic Acid
TA Tolfenamic Acid
PA Phenylamine (Aniline)
n-MA N-Methylaniline
MA Mefenamic Acid
List of Symbols
21
List of Symbols
Flexible torsion angle
Np Number of data points
Nk Number of fitted coefficients
Na Number of atoms
Xij Regressors i = 1hellip Np j = 1hellip Nk
Yi Regressand i = 1hellip Np
Elatt Lattice energy
Eintra Intramolecular energy relative to the most stable conformation
Uinter Intermolecular energy
11 Background
22
Chapter 1 Introduction
ldquoMay the Force be with yourdquo
mdash General Dodonna Star Wars A New Hope
11 Background Polymorphism the ability of a molecule to crystallise or pack in more than one
structural form1 is a phenomenon that though common is not completely understood
The phenomenon which has been the subject of long and extensive research is of crucial
importance in many branches of the chemical industry Most of all in the pharmaceutical
industry because polymorphs can show significant differences in properties such as
solubility and dissolution rate2 which in turn affect the bioavailability of drug
formulations as well as their melting point physicochemical stability and mechanical
properties3
Researchers recognise that the polymorphic differences among molecules can be
exploited to take advantage of better compactibility or powder flow rate In addition a
thermodynamically metastable form may be chosen to improve drug administration as
such a form may have a higher dissolution rate than a more stable polymorph3 A third
reason for the increasing industrial interest in polymorphism is the need to protect
intellectual property as different patents can protect the different polymorphs of an active
pharmaceutical ingredient (API)
Polymorphism is common with about one-third of all APIs confirmed to be
polymorphic4 yet not so long ago the concept of polymorphism was either treated as an
annoyance or completely ignored by academics The dismissive attitude changed after the
sudden emergence of a new polymorph of the drug ritonavir a protease inhibitor for the
HIV virus Production had to stop as Abbott Laboratories (the manufacturer) was forced
to embark upon an expensive reformulation of the drug The more stable polymorph of
the API was discovered after capsules suddenly started failing dissolution tests two years
after the drug had been launched on the market5 The ritonavir incident taught the
pharmaceutical industry that the best insurance against such surprises is to conduct an
exhaustive experimental search before going to market6 a view that has since led to
regulations requiring extensive screening and process control for polymorphs in APIs and
inactive pharmaceutical ingredients 7
11 Background
23
The unexpected emergence of the new ritonavir polymorph despite proactive attempts
to discover polymorphs before the drug was marketed forcibly reminded us that
metastable polymorphs can appear to be kinetically stable1 If Abbot Laboratories had
computed the energies of possible polymorphs for ritonavir before marketing the drug
the company may have been able to prevent a multi-million dollar problem As Graeme
Day6 noted lsquocomputational methods of predicting crystal structures could play a large
part in this research both in identifying all possible polymorphic forms and judging their
relative stabilities ndash an examination and evaluation of all possible crystal structures of a
given compound is a step towards the understanding and perhaps control of
polymorphismrsquo Given the ubiquity and importance of polymorphs it is clear that
researchers need a computer tool that is capable of postulating possible crystal structures
of organic molecules before synthesis especially since a ldquostandardrdquo experiment that
guarantees the finding of all crystalline forms is impossible89
Crystal Structure Prediction (CSP Figure 11) is the ability to predict using
computational methods how a molecule will crystallise (ie unit cell space group and all
atomic positions) given only its chemical diagram10-12 CSP has been a long-standing
goal in computational materials chemistry for its potential to predict possible polymorphs
CSP is vital to the pharmaceutical industry because a successful search method would
smooth the process of manufacturing and patenting crystalline products13
Figure 11 Diagrammatic illustration of crystal structure prediction (CSP) methodology
11 Background
24
The international blind tests14 organised by the Cambridge Crystallographic Data
Centre (CCDC) is a collaborative effort that charts the progress and state of the art in
predicting the crystal structures of small organic molecules Since the first blind test in
1999 there have been five more challenges issued by the CCDC and Figure 12 shows
how complex the target molecule can be The sixth and most recent blind test15 was issued
on September 1 2014 Scientific insight can be gained from successful CSP studies as
these methods reflect the factors that control the crystallisation process16
Figure 12 A chemical diagram of a target molecule XX from the fifth blind test17
Most CSP methodologies as we shall see in section 28 assume that the experimentally
observed crystal structures are the most stable thermodynamic structures on the crystal
energy surface In other words the temperature effects are ignored because of poor
thermal results obtained in the past for organic molecules Therefore a better method is
needed for computing the thermal effects of organic molecules This thesis takes the first
step towards accurate thermal effects calculations and Molecular Dynamics simulations
by deriving new force fields that accurately model the intramolecular energies These
discoveries on thermal effects will advance polymorph prediction
Conformational flexibility is an important property to consider when generating
hypothetical crystal structures for a flexible molecule The modelling of conformation
flexibility is the central theme of this thesis because in many organic molecules the
flexibility leads to polymorphism For example flufenamic acid18 (FFA Figure 13) a
non-steroidal anti-inflammatory drug (NSAID) has nine known polymorphs Another
NSAID tolfenamic acid19 (TA Figure 13) has five polymorphs while ROY (Figure
13) named after its red orange and yellow crystals (Figure 14) has ten known
polymorphs2021
11 Background
25
FFA1822 TA19 ROY20
Figure 13 The chemical diagram of tolfenamic (TA) and flufenamic (FFA) acids
Figure 14 Polymorphs of ROY numbered in the order of discovery The polymorphs
have different colours melting points and molecular conformations (most pronounced in
the torsion angle θ) (Source Ref [20])
Just like FFA and TA the wide range of values for the torsion angle is also present in
ROY (Figure 15) Therefore the origin of polymorphism in these compounds is partly
due to the conformational flexibility of the molecules (see Figure 15 and the red curly
arrows in Figure 13) FFA TA and ROY are also examples of organic compounds that
are considered polymorphophores1923 A polymorphophore is a structural element that
favours the formation of polymorphic crystal forms when incorporated into a molecule
ie molecules with similar fragments are likely to be polymorphic Consequently
conformational flexibility polymorphism and polymorphophore are linked
12 Scope and Outline of Thesis
26
Figure 15 Overlay of the experimental conformers of ROY viewed with the overlaid
nitrobenzene fragment horizontal (Source Ref [2])
12 Scope and Outline of Thesis Chapter 2 examines the theoretical methods relevant to the work presented in this thesis
I will discuss these in several parts intermolecular forces and their models intramolecular
forces electronic structure methods force field methods least square estimation CSP
and crystal structure comparisons Chapters 3 to 6 contain the original work of this thesis
A CSP algorithm CrystalPredictor version 16 is used in Chapters 3 and 4 This
algorithm generates crystal structures while simultaneously varying the low-energy
barrier torsion angles of the flexible molecule Chapter 3 tests the ability of CSP to predict
the crystal structure of the flexible 1-benzyl-1H-tetrazole molecule This chapter is an
informal lsquoblind testrsquo challenge Following this Chapter 4 examines the polymorphophore
concept by investigating two flexible fenamates that are similar but have different
polymorphic behaviours I use CSP and compare the two fenamatesrsquo crystal energy
landscapes Then Chapter 5 investigates the origin of the barrier to rotation of fenamate
molecules Chapter 6 develops new analytical force field models that fit the
intramolecular energy of flexible fenamate molecules as the conformation changes This
chapter investigates three analytical forms the cosine series rescaling repulsion and
combined physical models Finally Chapter 7 offers conclusions and suggests areas for
further research and development
21 Overview
27
Chapter 2 Theoretical Background
ldquoA people without the knowledge of their past history origin and culture is like a tree
without rootsrdquo
mdash Marcus Garvey
21 Overview This chapter discusses the theoretical methods that are relevant to the work completed
in this thesis Central to this research is the evaluation of the lattice energy Elattndashndashthe
sum of the intermolecular energy Uinter and the intramolecular energy ΔEintrandashndashof a
flexible organic molecule Thus section 22 sets out the physical basis for the lattice
energy model by introducing the origin of intermolecular forces Section 23 then
discusses the models of intermolecular contributions of organic molecules Section 24
provides a brief discussion of intramolecular forces because Chapters 5 and 6 investigate
the origin of and derive an analytical model for the intramolecular energies of flexible
molecules Next section 25 discusses some force field methods by way of laying a strong
foundation for the new analytical force fields derived in Chapter 6 After this section 26
discusses the fitting routines coded into the new analytical intramolecular force fields for
flexible organic molecules Section 27 highlights the theoretical background of the
electronic structure methods used to calculate the intramolecular energy of isolated
molecules (Chapters 3 to 5) and the electrostatic contribution to intermolecular energy
(Chapters 3 and 4) Section 28 further discusses Crystal Structure Prediction (CSP)
which was introduced in Chapter 1 Finally section 29 discusses various tools for crystal
structure comparison
22 Intermolecular Forces This section discusses the importance relevance origin and categories of
intermolecular forces The intermolecular force is fundamental in the evaluation of lattice
energy which is central to CSP studies (section 28) in Chapters 3 and 4 Intermolecular
forces are present everywhere in nature and control properties of gases liquids solids
and complexes In science the quantitative study of intermolecular forces can reconcile
diverse phenomena at the atomic and increasingly electronic level24 In pharmaceutical
industries the use of intermolecular forces as a computational tool for predicting new
polymorphs is necessary because of the experimental problems in establishing all
polymorphs that could be manufactured in a controlled way This is essential in
22 Intermolecular Forces
28
preventing another ritonavir disaster (section 11) where a new thermodynamically stable
polymorph started precipitating out of the anti-HIV drug25
Figure 21 Typical intermolecular force potential energy functions for spherical atoms
The intermolecular pair potential U is the interaction energy of a pair of molecules as
a function of their separation R and orientation This definition applies to rigid
molecules Intermolecular forces are repulsive at short-range and attractive at long-range
Liquids and solids exist because molecules attract one another when they are far apart26
The fact that water has a definite density meaning it cannot be easily compressed to a
smaller volume shows that at short-range the forces between the molecules become
repulsive26 The relationship between this energy of interaction U as a function of
distance R takes the form shown in Figure 21 Figure 21 has an attractive region at
long-range where the force is negative and a steep repulsive region at short-range to
account for the low compressibility of condensed materials
221 Pairwise Additivity Due to the difficulty and computational expense of modelling intermolecular
interactions this thesis makes some approximations to the sum of the intermolecular
energies One such approximation is the pairwise additivity which assumes that the
energy of a system is the sum of all two-body interactions26 For instance for three
molecules A B and C the pairwise approximation to the total energy is UAB+UBC+UAC
22 Intermolecular Forces
29
222 Physical Origin of Intermolecular Force The significant forces between molecules have an electromagnetic origin27 Strong and
weak nuclear forces do not contribute to the intermolecular force because they are
significant over a range of the order of 10-4 nm this is extremely small compared to
molecular dimensions which are typically 05 nm The gravitational force which is long-
range does not contribute to the intermolecular force because the gravitational potential
energy of two atoms 04 nm apart is only 7 x 10-52 J some thirty orders of magnitude
smaller than the typical intermolecular force28 Consequently the intermolecular forces
have an electromagnetic origin
The work reported in this thesis will focus on closed-shell ground state molecules
Resonance interactions do not occur between ordinary closed-shell molecules in their
ground state Magnetic interactions are several orders of magnitude smaller and are not
significant to the intermolecular forces Therefore these two contributions will not be
considered any further
Intermolecular forces are of quantum mechanical origin and can in principle be
determined by solving Schroumldingerrsquos equation and using the Born-Oppenheimer
approximation (ie nuclei are in fixed positions) The physical origin of the
intermolecular force from perturbation theory is as follows
4
a b
a A b B o ab
e eH
r
21
where ea is the charge on particle a one of the particles of molecule A and rab is the
distance between it and the particle b in molecule B The Hʹ is the perturbation on HA +
HB and consists of electrostatic interactions between the particles of a (electron and
nuclei) and those of b
The intermolecular force F and intermolecular energy U are related
U
FR
22
where R is the distance between the spherical molecules
When considering the intermolecular potentials it is helpful to separate various
contributions These contributions of intermolecular energy can be separated into two
Perturbation theory finds approximate solution to problem by starting from the exact
solution of a related problem It is can be used for describing intermolecular forces
because they are relatively weak
22 Intermolecular Forces
30
main types short-range and long-range interactions Israelachvili29 argued against
making this distinction due to the danger of counting twice which can happen in
theoretical analysis when forces with the same physical origin are both short-ranged and
long-ranged
223 Long-range Interactions If the interacting molecules are far enough apart ie long-range then the perturbation
theory becomes simpler because the overlap between the wavefunctions of the two
molecules can be neglected This is called the polarization approximation which was
first formulated by London30 in 193631 Three main types of long-range interactions exist
electrostatic induction and dispersion These long-range contributions vary by R-n
Electrostatic
The electrostatic force is a classical Coulombic interaction which arises from the
interaction between the static charge distributions of two molecules This force can be
attractive or repulsive but is strictly pairwise additive and dependent on orientation
Therefore the electrostatic force plays an important role in determining the structure
adopted by the solid state If ρA(r) is the charge density for molecule A then equation 21
becomes
3 3
00
( ) ( )d d 0 0 0 0
4
A BA B A B
o
H W
r r
r rr r
23
The first-order energy described the electrostatic interaction The electrostatic
expression in equation 23 is the exact classical Coulombic interaction energy of two
molecular charge distributions at long-range
Induction
The induction effects a second-order energy arise from the distortion of a particular
molecule in the electric field of all its neighbours and are always attractive These effects
are non-additive because the fields of several neighbouring molecules may reinforce or
nullify each other26 The induction energy of molecules A and B are considered separately
The induction contribution of molecule A in state m and non-degenerate ground state 0
is
The induction energies are always attractive because distortion only occurs when there
is a lowering of energy Because the energies are non-additive they are difficult to
implement computationally32 The inclusion of the explicit induction to the
0 0
0 0 0 0 0 0A B A B A B A B
A
ind A Am m
H m m HU
W W
24
22 Intermolecular Forces
31
intermolecular energy can significantly reorder the relative energies of a molecule33
especially for large molecules like carbamazepine32 The distributed polarizability can be
used to model the induction energy as Gareth Welch34 did However this approach is
computationally demanding because a large basis set and high-quality wavefunctions are
often required32 for convergence criteria to be met In this thesis the induction energy is
not modelled explicitly Instead it uses PCM (Polarizable Continuum Model section
283) to model the polarization effect that arises from the electrostatic interactions in a
solvent medium29
Dispersion
Dispersion is a universal force of quantum mechanical origin We know that because
electrons are in continuous motion their electron density oscillates continuously
producing instantaneous electric dipoles that change as the electron density changes The
instantaneous dipole in one molecule induces another electric dipole in the other
molecule There is an instantaneous correlation of fluctuation of charge density This is
why this contribution is universal and requires a description of electron correlation
Dispersion is an attractive force and is approximately pairwise additive The perturbation
theory expression for dispersion contribution is as follows
0 0 0 0
00 00disp A B A B
m n m m
H mn mn HU
W W W W
25
London30 provided the most widely understood treatment of dispersion forces where
atoms can be visualised as a set of harmonic oscillators In this treatment the coupling of
the oscillators leads to the lowering of the energy The dispersion energy depends on the
square of the coupling constant The leading term in the dispersion energy is proportional
to R-6 because the coupling for a pair of interacting dipoles is proportional to R-3
224 Short-range Interactions
Exchange-Repulsion
When electron clouds of two molecules approach each other and become sufficiently
close they overlap At short-range the most important contributions are exchange and
repulsion these two are often taken together despite having opposite signs and are called
exchange-repulsion31 The exchange contribution is the attractive energy resulting from
electrons of one molecule becoming free to move over both molecules This increases the
uncertainty of the electronrsquos position allowing the momentum and energy to decrease
Repulsion contribution arises from the slight overlap of electrons that are trying to occupy
the same region of space This overlap which is prohibited by the Pauli Exclusion
23 Modelling the Intermolecular Forces for Organic Molecules
32
Principle leads to redistribution of electrons and increase of the repulsion between the
nuclei The exponential repulsion domination leads to an overall repulsive effect and is
approximately pairwise
225 Penetration Energy and Charge Transfer The overlap at short-range leads to modification of the long-range terms When charge
densities overlap at short-range the electron density will no longer shield the nuclei of
one molecule and therefore the molecules will experience a greater attraction of electron
density associated with other species The energy difference from this increased attraction
is the charge penetration it is the modification of the electrostatic energy at short-range
and so is a first-order effect Charge transfer also occurs during redistribution of electrons
at short-range It is a part of the short-range induction energy and so is a second-order
effect The energy contributions from charge transfer and penetration are small and are
often negligible35 Some of these effects may be absorbed in the empirically fitted models
of the dispersion and repulsion terms (section 27)
In summary for the organic molecules studied in this thesis repulsion dominates at
short-range while electrostatic and dispersion contributions dominate the intermolecular
energy at long-range Therefore the total intermolecular energy can be expressed as the
summation of the electrostatic Uelec repulsion Urepul and dispersion Udisp contributions
inter elec repul disp elec repul dispU U U U U U 26
23 Modelling the Intermolecular Forces for Organic Molecules The potential model used in this thesis for evaluating the intermolecular energy Uinter
is an intermediary between conventional force fields and periodic electronic structure
calculations The functional form of conventional force fields have limitations because
the same charges are used for intermolecular and intramolecular interactions2 (section
254) Periodic electronic structure calculations are very expensive and were not
available at the start of my research in 2010 For example the plane-wave DFT-D study
of selected pharmaceutical crystal structures using Quantum Espresso was published in
201336 The Generation Ranking and Characterisation Engine (GRACE37 program
section 284) which when coupled to another periodic DFT-D code (section 275) was
successful in the fourth blind test10 is still not available to researchers as of this writing
The work presented in this thesis models the dispersion repulsion and electrostatic
interactions (equation 26) explicitly The dispersion and repulsion contributions were
modelled using a transferrable empirically fitted model In contrast the electrostatic
23 Modelling the Intermolecular Forces for Organic Molecules
33
contribution was modelled using ab initio wavefunction calculation on an isolated
molecule for each molecular conformation due to limited transferability
231 Repulsion-Dispersion Potentials The dispersion and repulsion terms are modelled with an empirical exp-6 atomndashatom
potential that is assumed to be transferrable3839 The repulsion term is represented by the
exponential-based term and the dispersion is represented by the inverse sixth power term
6
exp( )
repul disp ik ik
i k
U A B R C R 27
where atom i in molecule 1 is of type ι atom k in molecule 2 is of type κ and they are
separated by interatomic distances Rik This potential (equation 27) was derived by fitting
the parameters to known crystal structures and it obeys the following combining rules
1 1
2 21
( ) ( ) ( )2
A A A B B B C C C 28
Parameters for carbon non-polar H and N atoms were derived from fitting to
azahydrocarbon crystal structures39 while the parameters for the oxygen atom were
derived from fitting to oxohydrocarbon crystal structures38 The polar H atom parameters
were derived from azabenzenes nitrobenzenes and other simple molecules40 To account
for the smaller effective van der Waals radius of protons the distinction between polar
and non-polar H atoms is necessary41 In Chapters 3 and 4 the repulsion-dispersion
contributions to the intermolecular energy will be calculated using the potential of
equation 27 and the ldquoFITrdquo34 parameters These FIT parameters were fitted using a model
that had explicit electrostatic interactions Once the repulsion and dispersion terms were
generated they were summed over all intermolecular atomndashatom distances up to a defined
cut-off This is typically 15 Aring for small organic molecules for fast calculations and 30 Aring
for large molecules34 It should be noted that some of the other intermolecular
contributions not modelled explicitly by equation 27 and any electrostatic model might
have been absorbed by the empirically fitted models of dispersion and repulsion terms
because these other contributions will be present to some extent in the sample crystal used
in deriving the parameters A B and C
In contrast to ldquoFITrdquo the empirical intermolecular potential by Gavezzotti42ndashndashanother
exp-6 potential that will be used in Chapters 5 and 6 to investigate the origin of
intramolecular energy and design new analytical force fieldsndashndashdoes not use combining
rules and has no atomic or site charges
23 Modelling the Intermolecular Forces for Organic Molecules
34
232 Electrostatics Potential This section discusses the two methods used in this thesis for modelling the electrostatic
contribution to the intermolecular energy (equation 26) in Chapters 3 and 4
(1) The Atomic Charge Model is a crude but inexpensive approach It uses Coulombrsquos
law through pairwise interaction of isotropic (spherical) point charge q placed on each
atom separated by distance R
0
1(R )
4 R i k
elec ik
ik
q qU 29
where ε0 is the dielectric vacuum constant It assumes that the charge density of the
molecule can be described by superimposing spherical atomic electron densities The
atomic charge model cannot represent non-spherical features such as lone pairs and
electrons or short-distance directional intermolecular interactions like the geometry of
the H-bond41 As a result extensions to the isotropic model have been proposed to define
lone pair sites as dummy atoms having isotropic electrostatic interactions43 or at satellite
positions that are optimised to provide best fit to the electrostatic field44
Although atomic charges can be derived from the experimental X-ray diffraction data
these results are unreliable due to the many approximations and assumptions that must be
made during their calculation45 On the other hand atomic charges can be generated from
an ab initio wavefunction calculation of the isolated molecule to estimate the electrostatic
contribution41 This involves using the CHELPG scheme (an acronym for CHarges from
ELectrostatic Potentials Grid based method) which performs the least-squares fit of the
atomic charges to reproduce the molecular electrostatic potential as evaluated from ab
initio density on a regularly spaced grid46 Unfortunately higher moments such as
octupoles hexadecapoles and so on make a small contribution to the potential when the
CHELPG scheme is used Indeed Francl et al47 showed that the CHELPG procedure is
ill conditioned for higher atomic multipoles so that the charges are not well determined
however they did show that Singular Value Decomposition (section 262) could improve
the condition numberdagger
(2) The Distributed Multipole Moments The electrostatic potential around a molecule
can be represented by an expansion of multipole moments At long range this
daggerThe condition number is the ratio of the largest to smallest singular value in the singular
value decomposition of a matrix A matrix is ill conditioned if the condition number is
too large
23 Modelling the Intermolecular Forces for Organic Molecules
35
electrostatic potential is exact since the charge distribution is approximately spherical as
the distance approaches infinity At shorter range the more apparent anisotropic nature
of charge density is not easily represented by the central multipole expansion48 A better
approach is to use a multiple expansion about several sites in the molecule which can be
achieved with the distributed multipole expansion
The distributed multipole expansion is an explicit method of generating higher-order
atomic multipoles that involves modelling the atomic charge distribution using a series
of distributed multipoles (charge dipole quadrupole octupole hexadecapole etc as
illustrated in Figure 22)26 Consequently the derivation of the distributed moments is
essential There are two ways of achieving this computational analysis of the charge
density and fitting to experimental data Deriving the multipole moments experimentally
is challenging and often the data are insufficient to deduce any particular distribution of
multipoles across specific sites49 For example the Stark effect gives the magnitude but
not the sign of the components of the dipole moment along the inertial axes26
Figure 22 Charge distributions corresponding to pure multipoles Blue portions
represent regions where the function is positive and yellow portions represents where it
is negative Qlk is the spherical harmonic multipole where l is angular momentum
quantum number and k = l l-1hellip -l specifies the component of the angular momentum
around the z-axis (Source httpenwikipediaorgwikiSpherical_harmonics [Accessed
11012015])
Distributed Multipole Analysis (DMA) is a systematic way of determining the
distributed moments50 This computational approach derives charge distribution from an
24 Intramolecular Energy
36
ab initio wavefunction51 and describes it in terms of distributed multipoles (Figure 22)
located at a number of site in the molecule using the Gaussian Distributed Multipole
Analysis (GDMA)52 program The GDMA program carries out a DMA of the density
matrix (Fchk) file produced by GAUSSIAN53 for the isolated molecule in the molecular
axis system34 This thesis uses version 252 of GDMA because it handles diffuse functions
more satisfactorily51 than version 154
In contrast to the atomic charge model the distributed multipole moments have
successfully predicted the directional (anisotropic) lone pair interactions π-π stacking
arrangements in aromatic rings and electrons and H-bond geometries in molecular
organic crystal5556 The long-range interactions which include the chargendashcharge (R-1)
chargendashdipole (R-2) and dipolendashdipole (R-3) terms are evaluated using the Ewald
summation method57 while the remaining long-range interactions are summed by direct
method
In summary the electrostatic contribution is modelled by using either an atomic charge
model or distributed multipole moments obtained from ab initio methods while the
repulsion and dispersion contribution are modelled using an empirical exp-6 potential
24 Intramolecular Energy The lattice energy of a crystal structure is the sum of the intermolecular and
intramolecular energies The focus of this section is the intramolecular part of the lattice
energy In Chapters 5 and 6 I investigate the origin and derive analytical models for the
intramolecular energies of flexible molecules (Chapter 6) Therefore this section
concisely examines the intramolecular energy of flexible molecules
The intramolecular energy of rigid molecules is negligible so the early work of crystal
structure prediction (section 11) focussed on the easier problem of rigid molecules In
this thesis a flexible molecule has one or more internal degrees of freedom that change
between phases for example torsion angles around single bonds The intramolecular
energy for a flexible molecule is the energy difference between the molecule in a specific
conformation (eg in a crystal) and in the lowest energy of the isolated gas phase
conformation As evident from ROY in Chapter 1 polymorphic forms can exhibit very
different torsion angles (Figure 15) ie can display conformational polymorphism
Cruz-Cabeza and Bernstein58 argued that when referring to conformations in crystal
structures a distinction should be made between conformational adjustment and
conformational change Conformational adjustment arises when a flexible molecule
adjusts to the crystal environment by slightly varying the conformation to minimise the
24 Intramolecular Energy
37
lattice energy of the crystal while conformational change involves a change of gas phase
conformer (Figure 23) In the context of the polymorphism of flexible molecules Cruz-
Cabeza and Bernstein58 referred to two polymorphs whose independent conformations
are related by conformational change as conformational polymorphs For example crystal
structures A and B in Figure 23 are conformational polymorphs
Figure 23 Schematic representation of conformational change and conformational
adjustment (Source Ref [58])
The simplest approach to calculate the intramolecular energies is to use force field
methods (section 25) which involve summing the contributions that arise from bond
stretching angle bending and dihedral torsion angles However despite the speed and
successes of force field methods in Molecular Dynamics and in modelling proteins59 the
molecular mechanics descriptions of the intramolecular energies and molecular
geometries are not sufficiently accurate for evaluating the lattice energy of crystal
structures (section 254)
Another method for evaluating intramolecular energy is electronic structure calculation
(section 27) This approach avoids the problem encountered in force field methods but
at the cost of higher computing time The conformations of flexible molecules and their
relative energies can be sensitive to the electron correlation method (because of the
important dispersion contribution) and to the basis set that is used (since large basis sets
are required to avoid intramolecular BSSE60 during electronic structure calculations) The
errors from intramolecular dispersion (section 275) can lead to the failure of quantum
mechanical calculations for molecules that adopt a folded conformation6061
One way of solving this problem is the dispersion-corrected (ndashD section 275) method
Warnings of the intramolecular energy sensitivity toward the electronic structure level of
25 Force Fields (Atomistic Modelling)
38
theory are relevant to the CSP studies of Chapter 3 and 4 where the focus is on other
aspects of the computational model and not on the rigorous test of these errors However
it is a common practise to use one electronic structure method for evaluating the
intramolecular contributions toward the final lattice energies A necessary compromise
then is to conduct prior analysis of the effect that different levels of theory have on the
intramolecular energy for a specific molecule
The frequently used DFT level of theory such as B3LYP6-31G(d) may not give
reliable results for molecular systems where the intramolecular dispersion energy is likely
to be a major factor in determining the conformation60 Due to this limitation I did not
use the 6-31G(d) basis set in Chapters 3 and 4 when computing the final intramolecular
and intermolecular energies of the crystal structures
25 Force Fields (Atomistic Modelling) Force field methods (also known molecular mechanics methods) ignore the moleculersquos
electronic motions and calculate the energy of a system as a function of the nuclear
positions These methods are a cheap alternative to electronic structure methods (section
27) The basis of understanding the force field is the Born-Oppenheimer approximation
which assumes that the motions of the nuclei are independent of the motions of the
electrons In force field calculations the arrangement of the electrons is assumed to be
fixed62 Thus traditional force field methods cannot predict properties based on electronic
motions such as the breaking and formation of chemical bonds polarization effects and
proton transfer
The parameters determined for small molecules can be transferred to larger systems
such as polymers63 and can also be used for billions of atoms on supercomputers Indeed
the ability to transfer force fields from one system to anotherndashndashfor systems that are too
large for quantum mechanical calculationsndashndashis arguably the most valuable property of
many force fields6364
The downside to these classical force fields is that conformation and energy results are
often prone to inaccuracies These inaccuracies were observed when force fields methods
were used in CSP to calculate the final lattice energies65-67 (section 254)
25 Force Fields (Atomistic Modelling)
39
Figure 24 The schematic view of force field interactions Covalent bonds are solid lines
while the dotted line indicates non-bonded interaction (Source Ref [68])
Figure 25 Schematic view of four key contributions to a molecular mechanics force
field These forces are bond stretching bond stretching angle bending torsional terms
and non-bonded interactions (Source Ref [63])
The application of force fields involves choosing an energy functional form followed
by evaluating all unknown parameters A typical force field method arises from four
principal energy terms of intermolecular and intramolecular forces within the system6970
( )MM b nbE E E E E 210
where sumEb sumEθ sumEξ and sumEnb are the total energy of bond deformation valence angle
deformation torsion deformation and non-bonded interactions (van der Waals and
electrostatic) respectively The deviation of bond angle and torsion from equilibrium
describes the penalty of deformation (intramolecular) while non-bonded term describes
the interaction between non-bonded parts of the system (intermolecular)
Hookersquos law models bonds between atoms as a spring
2( )b r eq
bonds
E K b b
211
25 Force Fields (Atomistic Modelling)
40
where Kr is the force constant and beq is the ideal bond length A common mistake is to
assume that the equilibrium value (eg beq) is the global minimum value in actuality beq
is the value that b adopts when all force field terms equal zero This Hookersquos functional
form is an example of applying the harmonic oscillator in which the relationship between
force and displacement is linear A more accurate description of the relationship between
force and displacement is non-linearity ie anharmonic oscillator Hence Hookersquos
functional form is not as accurate as using cubic and higher terms (anharmonic terms)
Valence angles have a similar model to equation 211
angles
eqKE 2)(
212
where K is the strength of the spring holding the angle at ideal valence angle eq
Compared to a bond model less energy is required to distort the valence angle away from
the reference and the force constants are smaller The higher terms such as cubic and
quartic terms improve the valence angle model The 1-2 and 1-3 interactions (defined in
Figure 24) are also known as hard degrees of freedom because large amounts of energy
are required to deform bonds or angles from their equilibrium positions However
CrystalOptimizer71 (section 282)ndashndashan algorithm used in Chapters 3 and 4 to compute
the lattice energy accuratelyndashndashassumes that some 1-3 interactions are soft degrees of
freedom For example hydroxyl (HndashOndashC) and amide (HndashNndashC) bond angles were treated
as flexible in three model systems72
Figure 26 Schematic view of the torsion angle ξ using the ethane molecule (Source
quantumwisecomdocumentsmanualsvnl-200810_Manualchapmolbuilderhtml
[Accessed 11012015])
25 Force Fields (Atomistic Modelling)
41
The major change between crystal structures is their torsion angles The torsion angle
ξ in the ethane molecule shown in Figure 26 is defined as the intersection angle between
the two planes α and β spanned by the respective atom chains 1ndash2ndash3 and 2ndash3ndash4 It is clear
that the value of the torsion angle ξ between atoms 3 and 2 depends on the four atoms
selected Due to the periodic nature of torsion angles the model is expressed as a periodic
function
[1 cos( )]2
n
torsions
VE 213
where is the periodicity and represents the number of minima as the bond rotates about
360deg The phase factor term is the torsion angle as the rotating bond passes the
minimum or minima Vn is the barrier height to rotation about torsion angle ξ The value
of Vn is larger for double bonds than for single bonds The definition of Vn is ambiguous
when more than one term is needed to model the torsional energy64 Even more
misleading is that the 1-4 non-bonded (Figure 24) and higher interactions contribute to
the torsional potential The additional term with the correct qualitative behaviour of the
barrier to rotation63 is a better description of Vn
The last term in equation 210 is the non-bonded interactions
12 6
[ ]nonbond
ij ij i j
nb
i j ij ij ij
q qE
r r r
214
where the adjustable parameter σij is the collision diameter and is defined as the separation
for which the van der Waals energy is zero The qi and qj terms are the partial or net
atomic charges63 Equation 210 is a combination of the repulsion-dispersion (also known
as the van der Waals term and is often fitted to a Lennard-Jones 6-12 potential73 because
of the computational ease) and an electrostatic term It should be noted that intermolecular
and intramolecular contributions have the same set of parameters Many of the more
recent developments in protein force fields include electronic polarizability or a solvation
effect in an approximate way68
251 AMBER The AMBER force fields are widely used for modelling proteins and nucleic acids74
AMBER which is in continual development has relied on the past knowledge of force
fields such as ECEPP potentials75 and Consistent Force Field (CFF76) The exclusion of
H atoms from an earlier version of an AMBER force field was due to limited computer
power However a compromise was adopted in later versions due to the importance of
the H-bond68
25 Force Fields (Atomistic Modelling)
42
The charges were derived by fitting partial charges to ESP (electrostatics potential)
charges obtained via ab initio calculations (HFSTO-3G) An adapted version of van der
Waalsrsquo term from amide data fitting by Lifsonrsquos group7778 and liquid state simulations79
by Jorgensen was used The first two terms (bonds and angles) of equation 230 were
fitted from crystal structure data while the torsional terms were extracted from either
experimental data or ab initio calculations
The fact that AMBER has limited parameters for organic molecules prevented this force
field from being widely used in drug design and other studies of ligandndashprotein or ligandndash
DNA interactions80 Hence a Generalised Amber Force Field (GAFF) was introduced by
Wang et al80 to describe a wider variety of organic molecules including most
pharmaceutical molecules
252 CHARMM CHARMM81 (Chemistry at HARvard using Molecular Mechanics) has some overlaps
with AMBER in part because the first versions of both force fields were developed
around the same time Like AMBER H atoms were excluded in the earlier version but
were later replaced with a compromise solution Although ab initio calculations were
used in fitting this model a different level of theory (HF6-31G) was employed The
interaction energies were scaled to match water dimerization energy predicted via a
TIP3P model to achieve a balanced solutendashwater and waterndashwater interaction A rough
continuum solvation model can be implemented by using the force field with distance-
dependent dielectric constant The second version of CHARMM from 1985 is used
today because of the respectable results obtained from solvated simulation68
Subsequent developments were made in later versions of CHARMM8283 to improve
the balance of interaction energies in solvent simulations More recently a force field for
all atoms often called the CHARMM general force field (CGenFF) was published84
This force field covers a wide range of chemical groups present in biomolecules and drug-
like molecules and focusses on quality of result rather than on transferability
253 Other Force Fields There are more complex force fields than those discussed above For example cubic
and quartic terms can be added to equations 210 and 211 to reflect anharmonicity and
stretch-bend cross terms or the Lennard-Jones function can be replaced with a more
flexible Buckingham (exp-6) or Morse potential85 Examples of such force fields are
MM486 and Merck Molecular Force Field (MMFF)87 The cubic and quartic terms are
also used in MM288
25 Force Fields (Atomistic Modelling)
43
Figure 27 Schematic view of some of the common cross terms (Source Ref [63])
The cross terms in force fields represent coupling between internal coordinates For
example an increase or decrease of valence angle can affect adjacent bonds Stretch-
stretch stretch-bend stretch-torsion bend-torsion and bend-bend (Figure 27) are
examples of cross terms believed to be the most important in force fields these cross
terms in force fields are designed to predict vibrational spectra63
Another very popular force field is OPLS-AA (Optimized Parameters for Liquid
SimulationsndashAll Atoms) which specialises in simple liquids8589 Although huge
advances have been made in the understanding of biomolecular behaviour there is still a
demand for more accurate prediction of energies90 even for proteins and nucleic acid
polymers that have been studied extensively eg AMOEBA91 which uses atomic
multipoles
254 The Limits of Current Force Fields A major limitation of current force fields is the use of atomic charges in the description
of electrostatic contributions9293 Another limitation is that the intermolecular and
intramolecular forces have the same parameters It is therefore not surprising that in the
blind tests of organic CSP there have been no success based on the use of force fields for
final lattice energy (sum of intermolecular and intermolecular energy) evaluations11 In
specific cases like aspirin the intramolecular force field clearly has too strong a
preference for the wrong conformation so that the lowest-energy crystal structures have
that conformation94
Indeed some force fieldsrsquo lattice energy minimizations were shown to change the
conformation of the crystal structure so much that the crystal structure could not be
26 The Fitting Routine
44
reproduced65 In other cases the force fields were able to reproduce the crystal structures
but failed to rank the energy of these crystal structures accurately These failures have
been traced to using the same charges and van der Waals interactions for the
intermolecular and intramolecular forces95
Generally force field potentials that are more accurate tend to have more terms because
they usually yield better fit with experimental or ab initio data However additional
parameters make the fitting procedure more complicated and time consuming with no
scientific basis Therefore an ideal analytical model for the intramolecular energies
should have terms that are few in number (Chapter 6) based on a consistent scientific
origin (Chapter 5) and transferrable
In summary the traditional force field includes explicit periodic torsional potentials
and non-bonded terms including the electrostatic term that are applied to all atom pairs
separated by three or more covalent bonds (1-4 interactions and above) Researchers built
these traditional force fields on the reasonable assumption that in biomolecules the
intramolecular non-bonded interactions are the same as intermolecular non-bonded
interactions This is clearly a limitation2 because intramolecular atom-atom distances are
often much shorter than intermolecular (van der Waals) distances I exploited this
limitation in Chapter 6 by decoupling the intermolecular and intramolecular contributions
and derived new analytical intramolecular force fields
26 The Fitting Routine The Gavezzotti exp-6 and ldquoFITrdquo potentials (section 231) and many force field methods
were fitted to experimental or ab initio data These potentials all depended on an assumed
functional form the ability to extrapolate the quality of data the range of sampling a
method of fitting (the focus of this section) and so on
In Chapter 6 I developed codes (Appendix A) for fitting a new analytical
intramolecular force field to ab initio conformational profiles of fenamates which use
one method of fitting I assumed that the new analytical intramolecular force field was
approximately linear This section explains what a linear problem is solves the problem
and outlines an alternative solution that uses a Numerical Algorithm Group (NAG) library
that was implemented in the design of new analytical force fields (Appendix A)
261 Linear Least Square Method A model is linear if given a random data of (Yi Xi1hellip Xip-1 i =1hellip n) the relationship
between the response variable or observation Yi and the explanatory or independent
variable Xij can be formulated as follows
26 The Fitting Routine
45
Yi=β0+ β1Xi1 + β2Xi2 +hellip+ βp-1X ip-1 + εi i=1hellipn 215
where εi is the error β0 β1 β2 hellip βp-1 are the intercept and regression coefficients for the
explanatory variables
The linear regression model of equation 215 in matrix form is
0 1 11 1 1 11 1
0 1 22 1 2 12 2
0 1 1 1 1
p p
p p
n nn p n p
X XY
X XY
Y X X
216
or
11 1 11 0 1
22 2 12 1 2
11 1
1
1
1
p
p
n p nn n p
X XY
X XY
Y X X
217
or 1 1 1n n p p n Y X ε 218
where Y is ntimes1 X is ntimesp (an ntimesp matrix has n rows and p columns) β is ptimes1 and ε is
ntimes1 matrix
We can solve this linear regression model by using the least squares method The basic
idea behind the least squares is minimising the sum of squares for the errors ie
2n T
ii ε ε where T is the transpose Rearranging equation 218 as a function of errors
and evaluating least square problem gives
( ) ( )
( ( ) ( ) ( ))
( ( ) ( ))
( ( ) ( ) ( ))
( )
( 2 )
T T
T T T T
T T T T T
T T T T T T
T T T T T
T T T T
ε ε Y X Y X
Y Y Y X X Y X X
Y Y Y X X Y X X
Y Y Y X X Y X X
Y Y Y X Y X X X
Y Y Y X X X
219
Then differentiating the least square (equation 219) with respect to the coefficient gives
( ) ( 2 ) 0
2( ) 2 0
2 2 0
T T T T T
T T T
T T
T T
ε ε Y Y Y X X X
Y X X X
X Y X X
X X X Y
220
26 The Fitting Routine
46
Then multiply both sides by 1( )T X X
1
1 1( )T T
p p n p n p n n
X X X Y 221
The expectedmodel value Ŷ is
1 1ˆ
n p p n Y X 222
Equations 221 and 222 can be coded explicitly which I did for cosine fits in my upgrade
report96
262 Subroutine for Solving Least Squares An alternative to coding equations 221 and 222 explicitly is to use the G02DDFE97
NAG routine This NAG routine computes the error of each coefficient and states whether
a solution is unique or not in addition to computing the coefficients Here I discuss some
key concepts that will help in understanding the G02DDFE97 NAG routine used in
Chapter 6
If X is an n times p matrix the rank of X is the number of nonzero rows in the row echelon
derived through the Gaussian elimination method If matrix A has a rank as large as
possible then the matrix is a full rank otherwise the matrix is rank deficient A matrix
that is full rank has one unique solution The G02DDFE97 NAG routine can work out if
any matrix is full ranked or rank deficient
QR decomposition is the first step used for solving the least squares problem in the
G02DDFE97 NAG routine QR decomposition transforms matrix X into a QR matrix that
consists of an orthogonal matrix Q and an upper triangle matrix R
1 2 1
R RX = Q = Q Q = Q R
0 0 223
where Q1 is the first p columns of Q and Q2 is the last n-p columns of Q
G02DDFE97 subroutine calculates the regression parametersndashndash and in Chapter
6ndashndashand Residual Sum of Squares (RSS) for a general linear regression model by
minimising the sum squares residual G02DEFE a routine within G02DDFE carries out
QR decomposition of the matrix data X If R is of a full rank ie the matrix has a rank
as large as possible then R-1 exists and the solution of the regression model is as follows
1ˆ( ) ik
T
ik y R Q 224
where Q and R are the decomposed matrices of data being rescaled and y is the ab initio
data minus any remaining contributions not being fitted If R is not full rank Singular
27 Electronic Structure Methods
47
Value Decomposition (SVD) of X (ie X=U1DVT) helps to extract just one solution of
the linear regression model
1ˆ ( ) ik
T
ik y VD U 225
where V D and U are respectively the orthogonal the non-negative diagonal element
and the orthogonal decomposed matrices RSS and the standard error fit are related
fit
p k
RSS
N N
226
where Np and Nk are the number of observations and regression coefficients for each of
the independent variables plus the intercept
Solving the least squares problem is a key feature of the algorithm in Chapter 6 The
algorithm undertakes the challenge of deriving a new analytical model for intramolecular
energies of flexible fenamate molecules The remaining features of the algorithm are
discussed in Chapter 6
27 Electronic Structure Methods The development of electronic structure methods and rapid advances in computing
technology have transformed the role of quantitative numerical calculations in both
theoretical and experimental studies of chemistry98 The first era from the 1960s to 1980s
established the basic mathematical foundations and computational machinery of todays
standard electronic structure methods They included HartreendashFock (HF) theory Moslashller-
Plesset (MP) perturbation theory Density Functional Theory (DFT) and many others98
This thesis classifies HF MP and DFT as ab initio methods
This thesis uses electronic structure methods to calculate the molecular properties of a
single molecule (and in principle of dimers and crystals) The electronic structure
methods seek to calculate the molecular properties from the first principles ie solving
Schroumldingerrsquos equation without using empirical data26 However approximations are
always necessary DFT is a modern arsenal of quantum chemical methods99 and to get a
better appreciation of this method it will be useful to look at more traditional
wavefunction-based approaches One of the simplest of these approaches is the Hartree
Fock (HF) theory
27 Electronic Structure Methods
48
271 Hartree Fock Theory The HF theory was developed to solve the electronic Schroumldinger equation that results
from the time-independent Schroumldinger equation after invoking the Born-Oppenheimer
approximation100 There are two good reasons for solving the Schroumldinger equation First
the solution gives the potential energy experienced by the nuclei ie the potential energy
surface Second the electronic wavefunction has lots of useful information about
molecular properties such as dipole and multipole moments polarizability etc
The HF method assumes that the exact N-body wavefunction of the system can be
approximated by a single Slater determinant of N spin-orbitals By employing the
variational theorem which states that the energy is always an upper bound to the true
energy one can derive a set of N-coupled equations for the N spin-orbitals The solution
to this equation yields the energy of the system and the wavefunction
The HF method is called the ldquoSelf-Consistent Field (SCF) methodrdquo because the HF
equations are solved using an iterative process The SCF process starts with an initial
guess for the orbitals and successive iterations are performed with new orbitals until the
self-consistent condition is achieved ie until the solution no longer changes
271 Molecular Orbital Theory With the new Quantum Mechanics (QM) of Heisenberg and Schroumldinger came two
general theories the Valence Bond (VB) and the Molecular Orbital (MO) theories These
two theories developed at around the same time quickly became rivals101 See ref102 for
a review of the classical valence bond approach The focus of this section is the MO
theory
The MO theory based on the HF theory theorises that each electronrsquos motion can be
described as a single-particle function (orbital) that does not depend on the instantaneous
motions of the other electrons MOs are calculated using the Linear Combination of
Atomic Orbitals (LCAO) which is a quantum superposition of Atomic Orbitals (AOs)
MO is a theory of bonding that can give insight into the forces involved in making and
breaking chemical bonds which are often the focus of organic chemistry
The early complexities of Quantum Mechanics led to the visualisation of MOs that are
easier to understand than numerical orbital coefficients103 Using SCF calculations we
can represent MOs using isosurfaces that correspond to the electron density The two
isosurfaces of particular importance are usually the Highest Occupied Molecular Orbital
(HOMO) and the Lowest Unoccupied Molecular Orbital (LUMO) These are known as
the frontier-orbitals104 It is not clear why the frontier-orbital theory is so successful26 but
27 Electronic Structure Methods
49
this theory is used extensively in computational chemistry to understand many
phenomena Frontier orbitals will be used in Chapter 5 of this thesis to understand the
origin of barriers to rotation for flexible molecules
HOMO is the isosurface from which it is energetically easiest to remove electrons from
(eg electron density donation to form a bond) as well as the most relevant MO in this
thesis The only requirement of the empty MOs is that they form an orthogonal set with
the filled MOs These unoccupied MOs are not optimised during the SCF process because
the energy of the molecule does not depend on them As a result these unoccupied MOs
including LUMOs are less reliable than occupied MOs such as the HOMOs Thus
Chapter 5 will focus on the HOMO isosurfaces of flexible molecules
272 Correlation Effects The major limitation of the HF method is that it treats each electron as moving under
the influence of the average effect of all other electrons the method does not take into
account the electronsrsquo instantaneous repulsion26 (correlation effect) One of the most
important effects of electron correlation is the dispersion interaction In fact the
dispersion interaction (section 22) is a correlation effect26100 The correlation energy is
the difference between HF energy in a complete basis (HF limit) and the exact energy
excluding the relativistic effects ie the electrons are propagating at speeds much slower
than light
The HF method is now used merely as a starting point for more elaborate lsquopost-HFrsquo ab
initio quantum chemical approaches99 because the poor performance of the HF method
offsets its efficiency and simplicity Correlation effects modify the electrostatic
interaction between the molecules due to changes in electron distribution and they tend
to reduce charge separations Electron correlation can be handled in quantum chemical
theory calculations using Moslashller-Plesset Perturbation Theory (MPPT) Density
Functional Theory (DFT)105 etc
273 Moslashller-Plesset Perturbation Theory In perturbation theory we start from a known solution and add a perturbation
Hamiltonian (equation 21) Moslashller and Plesset106 used perturbation theory to determine
the correlation energy (small perturbation) after solving the HF problem (the known
solution) Correlation corrections appear at the second order and beyond The zeroth-
order energy is the sum of the occupied orbital (eg HOMO) The first-order energy is
the HF energy26 MPn is the nth-order energy (n 2) In this thesis I did not perform
27 Electronic Structure Methods
50
geometry optimisations using MP2 methods for molecule(s) with 20 or more atoms due
to the computational expense
Although MP2 methods are used as the standard they have limitations For example
van Mourik61 noted that the MP2 description of intramolecular interactions with a -
electron system for flexible molecules is affected by a large intramolecular basis set
superposition error (BSSE) This large BSSE of MP2 was responsible for the wrong order
of stability for Phe-Gly-Phe tripetide107
BSSE is relevant in this thesis because many of the MP2 calculations were carried out
on flexible molecules that contained at least one aromatic ring (Chapters 3 to 5) The
origin of this error lies in the possibility that the unused basis functions of the second unit
B in the associated complex A∙∙∙B may augment the basis set of the first unit A thereby
lowering unit Arsquos energy compared to a calculation of this unit alone26108 This lowering
can be attributed to the variation principle that arises from the mutual enlargement of the
basis set of each monomer by the presence of the orbitals of its partner molecule109 Rather
than using an infinite basis set an impossible task the method for correcting this error is
to use a counterpoise (CP)
274 Density Functional Theory Density Functional Theory (DFT) is a cheaper alternative to MPPT Indeed P J
Stephens et al110 suggested in 1994 that in the future DFT might be preferred over the
MP2 method due to the lower computational demands of DFT That future is now for
DFT is currently the method of choice for first-principles electronic structure calculations
in condensed phase and complex molecular environments111112 Over the last 30 years
physicists working on the electronic structure of solids surfaces defects etc have used
DFT More recently DFT has become popular with theoretical and computational
chemists113
DFT is a theory of electronic structure exact in principle that is based on the electron
density distribution instead of the many-electron wave function111 DFT is based on a
theorem proposed by Hohenberg and Kohn114 which states that knowledge of the
electron density of a system in the ground state is enough to determine the energy lsquothe
energy is a functional of the densityrsquo2699105 A generalized DFT expression is
EDFT[ρ] = ENe[ρ] + T[ρ] + Eee[ρ] 227
where T[ρ] is the kinetic energy associated with the given electron density Eee[ρ] is the
electron-electron interaction energy and ENe[ρ] is the energy of interaction between the
electrons and lsquoexternalrsquo fields The ENe normally includes the interaction between the
27 Electronic Structure Methods
51
electrons and the nuclei but it can also include other fields imposed on the molecule
Each term depends on the electron density ρ
The exact form of T[ρ] and Eee[ρ] are not known and no fundamental theory for
determining them exists at present The usual route for solving this problem is to use the
method proposed by Kohn and Sham115 in 1965 that involves non-interacting electrons
For this system the electron density ρ(r) and the kinetic energy TS[ρ] (S denotes that
the kinetic energy is obtained from a Slater determinant) are exact while the Coulomb
(classical) part J[ρ] of the electron repulsion energy can be calculated The energy of the
system now takes the form
EDFT[ρ] = ENe[ρ] + TS[ρ] + J[ρ] + EXC[ρ] 228
where EXC the exchange-correlation functional is
EXC[ρ]=( T[ρ] - TS[ρ])+( Eee[ρ]- J[ρ]) 229
The exchange and correlation energy EXC is the functional that contains everything that
is not known Local-Density Approximation (LDA) and Generalized Gradient
Approximation (GGA) are used to approximate the EXC LDA the simpler
approximation assumes that the density corresponds to that of a homogeneous electron
cloud It proved to be an improvement over HF but is too inaccurate to be useful for
chemistry26 GGA an improvement on LDA incorporates dependency on electron
density and its gradient In practise hybrid (HF-DFT) functionals are used which
incorporate a portion of the lsquoexact exchangersquo from HF theory105 with exchange and
correlation from other sources (ab initio or empirical)
One of the most widely used hybrid functionals used is B3LYP which incorporates
Beckersquos three exchange-functionals116 (B3) with Lee Yang and Parr correlation
functional LYP117 PBE0118 another widely used functional was used in this thesis
(Chapters 3 to 6) These DFT methods are attractive because their results are comparable
to those obtained using MP perturbation methods but come at a much smaller
computational cost105
275 The DFT-D Approach DFT methods have drawbacks For one they are non-convergent in that no one knows
how to improve the results in a systematic way99119 The success of a particular functional
in one setting does not guarantee the performance in a different setting These drawbacks
led Orio99 to stress the importance of enhancing the credibility of DFT either by including
some form of validation or by estimating the error range through careful comparison
between the calculated and measured observable
28 Crystal Structure Prediction (CSP)
52
Another drawback is that the density functional cannot describe long-range electron
correlations responsible for dispersion forces112120 To overcome this defect researchers
have introduced corrections See refs120121 for a review of the impressive ongoing
attempts to improve the description of dispersion forces of DFT methods From a practical
viewpoint empirically damped ndashC6∙R-6 corrections to the standard density functional
approach provide robustness122 and speed We can solve the difficult dispersion
interactions classically This well-tested approach is DFT-D where -D stands for
dispersion correction The total energy is
EDFT-D = EDFT + Edisp 230
where EDFT is the self-consistent Kohn-Sham energy (equation 227) as obtained from the
chosen density functional and Edisp is an empirical dispersion correction Although DFT-
D was not used in this thesis it is nevertheless relevant because this discussion highlights
the importance of the dispersion contribution (ie correlation effect) to the overall energy
of the system
28 Crystal Structure Prediction (CSP) CSP assumes that the experimentally determined polymorphs correspond to local
minima in the crystal energy surface Elatt To put this approximation in context it is
important to note that the prediction of the relative thermodynamic stability of
polymorphs at a given temperature T and pressure p requires the minimisation of the
Gibbs free energy (G) with respect to the unit cell dimensions and the positions of all
atoms in the unit cell
where E is the internal energy V is volume and S is the entropy123 The variation in the
free energy arises from the differences in packing energy crystal density and entropy
Therefore all three terms associated with the Gibbs free energy (equation 233) should
be evaluated when determining the relative stability of polymorphs It is often the case
that only the lattice energy component of the first term (min E) is evaluated for two
reasons
The TΔS term is often neglected because the difference in lattice vibrational
energies between polymorphs is usually very small25124 At present the thermal
entropic and zero-point contributions to the Gibbs free energy cannot be readily
and accurate evaluated56
min G = min[E + pV ndash TS] 231
28 Crystal Structure Prediction (CSP)
53
The pΔV term could be calculated but is often neglected because of its small ΔV
value The compressibility of solids being low they contribute very little to Gibbs
free energy at normal pressure The pΔV term dominates at high pressure ie
10kbar125
Most of the computational approaches to CSP focus on minimising the lattice energy
The lattice energy Elatt is the internal energy at 0 K and 0 Pa ignoring the zero-point
energy The thermodynamic stability is not always the decisive factor in the packing
patterns of the molecules kinetics also plays an important role because it strongly
influences crystallisation conditions and solvent environment Nonetheless the
experimental structure is expected to appear within a narrow energy range of the global
lattice energy minimum56
Elatt can be calculated in several different ways depending upon the relative importance
of accuracy ease of implementation and computational cost in a given situation56
Ideally the lattice energy of a crystal should be calculated quantum mechanically but
such calculations are expensive Thus most approaches use force field methods andor a
cheap method to generate and evaluating the lattice energy in a hierarchal manner The
most successful CSP approaches rely on some form of the computationally demanding
but accurate electronic structure calculations either on an isolated molecule (to evaluate
the intramolecular contribution combined with the intermolecular contribution that has
been empirical fitted) or on a crystal (using periodic calculations)
Thus the key to successful CSP methods is not just the generation of all possible crystal
structures but also the accurate ranking of these generated crystal structures This ranking
requires balancing the intermolecular Uinter and intramolecular ΔEintra energy
contributions
where Uinter is the sum of the dominant electrostatics Uelec and repulsion-dispersion
Urepul-disp contributions and Eintra is the energy required to distort the molecule from its
gas phase conformation71 X denotes degrees of freedom that define the intermolecular
contacts while vector θ denotes the intramolecular degrees of freedom ie bond lengths
bond angles and torsion angles For rigid molecules there is no θ hence the ΔEintra (θ)
term vanishes For flexible molecules θ and hence ΔEintra (θ) must be accounted for from
the beginning
Elatt = Uinter (X θ) + ΔEintra (θ) 232
28 Crystal Structure Prediction (CSP)
54
281 CrystalPredictor
Chapters 3 and 4 use version 16 of CrystalPredictor126 which is different from rigid
or multiple rigid searches in that it incorporates conformation flexibility during the initial
search stage of crystal structures CrystalPredictor is not a black box it requires careful
analysis clear thinking and learning from earlier CSP studies CrystalPredictor performs
global lattice energy minimisation in order to predict the crystal structures of organic
molecules whose conformation is likely to be significantly affected by the packing forces
CrystalPredictor can find many plausible crystal structures in a multi-dimensional
space defined by the conformational degrees of freedom and lattice variables ie the
positions of the centre(s) of mass of the molecule(s) in the unit cell the orientation of the
molecules and the unit-cell dimensions and angles127 Within CrystalPredictor are two
important algorithms the Sobolrsquo128 sequence and the E04UFF NAG routine129 The
Sobolrsquo sequence generates the initial structures a characteristic of this approach is that
each Sobolrsquo corresponds to a distinct combination of every decision variable and thus
ensures a uniform and efficient sampling This prevents the problematic gaps and clusters
that random sampling can exhibit11 For more detail on how Sobolrsquo works see ref [128]
The E04UFF NAG routine129 carries out an extensive search for local minima of the
lattice energy surface using deterministic low-discrepancy sequences to ensure an optimal
coverage of the search space
CrystalPredictor models the lattice energy as the sum of the intramolecular and
intermolecular energy (equation 232) This lattice energy evaluation is crude but its
computational efficiency is necessary because CSP studies often require hundreds of
thousands of minimisations to sample the entire crystal energy surface The algorithm
computes the intramolecular energy as a function of flexible torsion angles using an
interpolation method on a set of quantum mechanically pre-computed intramolecular
energies by modelling the molecule as a set of rigid fragments connected by flexible
torsion angles The electrostatic contribution Uelec is evaluated by interpolating on pre-
computed atomic charges while an empirically fitted potential FIT34 computes the
repulsive-dispersive interactions Urepul-disp The sum of these two contributions is the
intermolecular energy Uinter=Uelec + Urepul-disp
In short CrystalPredictor is a minimisation algorithm
min Elatt = min[Uinter(X θ) + ΔEintra(θ)] 233
28 Crystal Structure Prediction (CSP)
55
that can generate crystal structures in the 59 most common space groups and with more
than 1 molecule in the asymmetric unit126 Z´gt1 However Chapters 3 and 4 limit the
search of hypothetical crystal structures to Z´=1 due to the huge computing time required
to generate Z´gt1 crystal structures
282 CrystalOptimizer CrystalOptimizer71130 refines crystal structures generated by CrystalPredictor126 To
account for the molecular flexibility accurately the CrystalOptimizer71130 algorithm is
required This algorithm solves the lattice energy problem (equation 233) as a two-level
optimization problem
The outer problem varies and ultimately optimizes the flexible conformational degrees
of freedom the remaining degrees of freedom are adjusted to minimize the intramolecular
energy127 A quasi-Newton scheme which ensures rapid convergence with many
optimization variable (X θ) solves the outer minimisation problem71 The inner
minimization problem optimizes the lattice energy for the fixed molecular conformation
determined by the outer problem The DMACRYS34 (section 26) program performs this
rigid body minimization CrystalOptimizer achieved a significant increase in the accuracy
of lattice energy calculations by127
1 allowing additional flexibility during lattice energy minimization (for example
considering more torsion angles andor bond angles as flexible degrees of
freedom)
2 accurately computing the intramolecular energy throughout optimization and
3 modelling the electrostatic interactions using distributed multipoles (up to
hexadecapole) obtained using the GDMA package52
Multiple ab initio calculations a very time-consuming process were often required
For this reason only the most promising structures from CrystalPredictor were used as
initial points for optimization Sometimes an intermediate step such as single-point ab
initio calculations (see Chapters 3 and 4) can improve the ranking of the lattice energy so
that only a handful of crystal structures (energy cut-off or a set number of unique crystal
structures minima) are optimized with CrystalOptimizer
CrystalOptimizer has one of the major featuresndashndashLocal Approximate Models (LAMs)ndash
ndashthat models the conformational energy and the multipole representation of the charge
density these are updated with explicit quantum mechanical calculations only when
necessary and not at every minimisation step The conformational energies their first and
min Elatt = min [ΔEintra(θ) + min Uinter(X θ)] 234
28 Crystal Structure Prediction (CSP)
56
second gradients and the distributed multipoles are also stored in the LAMs database
Re-using expensive electronic structure calculations (if the same conformational ranges
are encountered while minimising different hypothetical or experimentally determined
crystal structures) reduces the computing time without sacrificing accuracy7172130
283 Polarizable Continuum Model (PCM) Accurately modelling the balance between intramolecular and intermolecular energy is
important (eg using CrystalOptimizer) but just as important is modelling the effect of
the environment in distorting the conformer especially in cases where there is a
considerable difference in molecular conformations Cooper et al131 noticed that the total
calculated crystal energies which combine atom-atom model potential calculations of
intermolecular interactions with DFT intramolecular energies do not effectively
distinguish the real (known) crystal structures from the rest of the low-energy computer-
generated alternatives when the molecular electrostatic models are derived from isolated
molecule calculations They found that introducing a simple model for the bulk crystalline
environment when calculating the molecular energy and electron density distribution led
to important changes in relative total crystal energies and made possible the correct
distinction between the observed crystal structures and the set of computer-generated
possibilities This finding highlights the importance in CSP calculations of the
polarization of the molecular charge distribution especially for polar flexible
molecules131
In Chapters 3 and 4 PCM132 is used to account for the effect of organic environment
after generating and accurately computing the lattice energies using CrystalPredictor
that is an intermediate step that improves the electrostatic contribution to the
intermolecular energy and CrystalOptimizer I will model the polarizable continuum
environment with dielectric constants that is typical of molecular organic crystals ie ε =
3133 The PCM calculations only affect the final energy The geometry is not affected
because there is no molecular geometry minimisation of the crystal structure during the
PCM calculation
284 Other Approaches to Lattice Energy Minimisation There are other well-known approaches to lattice energy minimisations for flexible
molecules One computationally efficient approach is the Rigid CrystalPredictor-
Molecular Mechanics Method (RCM)17 by Graeme Day a variant on the method used in
Chapters 3 and 4 The first step performs constrained geometry optimization on a set
number of distinct conformations obtained from conformational analysis (the flexible
28 Crystal Structure Prediction (CSP)
57
torsion angles are fixed at the expected values from conformational analysis and all other
degrees of freedom are optimized) From this first step we can obtain the geometry
intramolecular energy and atomic charges The second step generates crystal structures
in 21 of the most common space groups by using a rigid CrystalPredictor134 search for
each distinct conformation17 Essentially the molecular geometries are treated as rigid
during the process of generating crystal structures The Uinter is calculated from the atomic
charges and an empirical exp-6 repulsionndashdispersion potential W99135 The third step
refines the most stable crystal structures obtained from the rigid-molecule searches For
this a two-stage procedure proposed by Day136 and co-workers is used The first stage
minimises the crystal structures by allowing the molecular geometry to relax using a
molecular mechanics description of energies associated with changes to the flexible
torsion angles This method trusts the molecular mechanics force field to provide the
correct molecular geometries but discards the energy which is not of sufficient accuracy
for the final ranking of crystal structures Then the resulting crystal structures are re-
optimized without further changes to the molecular conformations DMACRYS34 is used
to model the electrostatic interactions Uelec using the atomic multipole model The
remaining intermolecular terms Urepul and Udisp are obtained using the empirical W99
potential135 The intramolecular energy ΔEintra and the atomic multipole moments for
each conformation are derived from a single-point DFT calculation that incorporates the
PCM with a constant dielectric value of three to reflect the polarization effects in the
crystalline environment
Another approach is GRACE one of the most accurate minimisation methods This
approach presented by Neumann and Perrin was the first case wherein DFT-D methods
(sections 275) were applied to the CSP of molecular organic crystals First during the
crystal structure generation procedure a Tailor-Made Force Field (TMFF)13 developed
for fitting an atom-atom force field (non-bonded and bonding terms) specifically for each
molecule is used Then GRACE uses a hybrid method that combines the sum of the DFT
component and an empirical van der Waals correction ndashD (sections 274 and 275) to
re-optimise the lowest-energy crystal structures During this re-optimisation stage all
nuclear positions and electron density are optimised simultaneously which naturally
accounts for the molecular flexibility and other charge density reorganisation effects such
as polarization This approach reproduces experimental structures very accurately and
ranks the structures favourably amongst other hypothetically generated structures in many
(but not all) cases However these periodic DFT-D calculations are very expensive137
28 Crystal Structure Prediction (CSP)
58
285 The Crystal Energy Landscapes The CSP methods611 discussed above and many others sample a wide range of
possible crystal structures and determine the lattice energy in a hierarchal manner thus
generating a crystal energy landscape14 A crystal energy landscape is a plot of the lattice
energy against the density or the packing coefficient and it tells us how well the crystal
packs These landscapes often include the experimental structures as well as other low-
lying energy crystal structures that are worth comparing with the known polymorphs in
order to determine the types of intermolecular interactions and conformations that could
be feasible for a given molecule
In a crystal energy landscape in which only one crystal structure is calculated to be
more stable than any other by over a few kJ mol-1 typical of polymorphic energy
differences the molecule should only be found in that global minimum structure
Experiments or more demanding searches are needed to determine the stability relative
to multicomponent forms such as hydrates138 solvates139 or cocrystals140141 etc
However in most generated crystal energy landscapes there is typically a cluster of
structures within the energy range of plausible polymorphs These structures have to be
qualitatively assessed to see whether the barriers between the different structures are so
low that thermal motion in the crystal or molecular rearrangement during nucleation and
growth will ensure that only the most thermodynamically stable structure is seen Closely
related structures may also give rise to disorder142143 or plastic phases144 at higher
temperatures
The crystal energy landscape may suggest that alternatives to the known structures
could be found either as more stable or as kinetically trapped metastable polymorphs In
this case the calculations can complement experimental screening145 by suggesting
alternative methods146 such as a templating to produce new polymorphs147 The
knowledge of the crystal energy landscape can help avert problems in pharmaceutical
industries during the manufacturing process and guide the experimentalist search for
undiscovered structure In fact the study of the crystal energy landscape in Chapter 4
helped my colleague to discover a new polymorph (section 438) A way of testing
methodologies developed for predicting crystal structures is through lsquoblind testsrsquo
286 The Blind Tests The early lack of progress in CSP was termed a lsquocontinuing scandalrsquo in Nature in 1988
by John Maddox148 In response the Cambridge Crystallographic Data Centre (CCDC)
organised five lsquoblind testsrsquo10116667149 of organic CSP with the first lsquoblind testrsquo held in
29 Crystal Structure Comparison
59
1999 The blind test provided many researchers the opportunity to test their CSP methods
The fourth blind test results showed a dramatic improvement in the rates of success over
previous blind tests with one group (GRACE) correctly predicting four crystal structures
as their first ranked choice albeit at a considerable computational expense10
In the fifth blind test our research group successfully predicted the crystal structure of
molecule XX1117 which has eight flexible degrees of freedom (internal degrees of
freedom) using CrystalPredictor and CrystalOptimizer algorithms I use a similar
approach in Chapters 3 and 4 The fifth blind test showed that methodologies such as
DFT-D could reliably predict the structures of small organic molecules but GRACE was
unsuccessful for molecule XX11 CCDC released the sixth lsquoblind testrsquo molecules in mid-
September 201415 too late for me to take part By chance an informal lsquoblind testrsquo
challenge did arise during the second year of my research which is the focus of Chapter
3
29 Crystal Structure Comparison Collins et al150 argued that one of the problems modern scientists face is the issue of
structural similarity and difference They noted ldquocriteria for deciding when two crystal
structures are the same is an issue that divides many structural analystsrdquo Indeed this
problem of determining how similar or different two or more crystal structures are was
what inspired researchers to create methods for comparing crystal structures that exist
today The visual inspection of similarities and differences between crystal structures
does have its benefits but the method is slow and susceptible to human bias Thus
researchers need a practical computational method that enables them to identify identical
or similar structures
Identifying the similarities among crystal structures is important when deciding
whether a newly discovered structure is the same as an existing structure151 Sometimes
there is also a need to determine similarities when comparing many structures that are
related as in the case of 50 structures of carbamazepine (CBZ)150 Another reason for
identifying similarities lies in the field of CSP67152 where thousands of hypothetical
structures are generated and many structures converge to the same or approximately the
same structure during lattice optimization Therefore the removal of duplicates and the
production of unique lists of crystal structures are essential
The Mercury153 material module which has COMPACK151 embedded in it allows
graphical representation of the similarity among the polymorphs while standalone
COMPACK scripts can compare hundreds of thousands of crystal structures There are
29 Crystal Structure Comparison
60
three main tools in the material module153 motif search crystal packing feature and
crystal packing similarity tools The crystal packing similarity tool calculates the level of
packing similarities between crystal structures that have the same or similar compound
COMPACK computes these calculations by analysing the geometry of the cluster of
molecules There are two basic steps in comparing two crystal structures using
COMPACK The first step renders the chemical search query subject to several geometric
constraints using the reference molecular structure The second step is the structure
similarity search which involves searching the 3-D coordinates of a target for an
arrangement that matches the query to within specified tolerances The search is
performed by 3DSEARCH154 which is an efficient general search algorithm designed to
find chemical queries within 3D crystal structures information Once 3DSEARCH finds
a match the two structures can be superimposed to obtain a visual impression of their
similarity
The default values for a cluster size of 15 molecules a distance tolerance of 20 and
angle tolerance of 20 are usually used The default cluster size is 15 because the same
clustering results of 30 molecules instead of the default 15 molecules for 1000 predicted
structures of 2-amino-3-nitropyridine led Chisholm and Motherwell151 to the conclusion
that a cluster of 15 molecules is a sufficient size for identifying the same crystal structure
Other methods of comparing crystal structures do exist For example XPac155156
identifies similar sub-components of complete crystal structures of 0- 1- or 2-D in
polymorphs or crystal structures of similar molecules as well as of 3-D in isostructural
assemblies Hirshfeld surface (a way of exploring packing modes157) and fingerprint plots
(a visual representation of all intermolecular interactions simultaneously158) are examples
of Hirshfeld-based methods150159160 of analysing similarities The graphndashset analysis for
H-bonds compares and contrasts sets of molecules161-163 and is based on graph theory for
categorising H-bond motifs Moments of inertia tensors is a technique for comparing
crystal packing based on moments of inertia tensors irrespective of chemical connectivity
and hence the comparison of compounds of diverse chemical composition is possible164
Simulated powder X-ray diffraction165 is another example of comparing crystal
structures In short the comparison of compounds of diverse chemical composition is
possible
COMPACKrsquos ability to give just one number (the distance between matched atoms in
a cluster-root-mean-square-deviation) that shows the relationship between two structures
makes this similarity tool one of the simplest and most effective ways of quantitatively
29 Crystal Structure Comparison
61
rationalising similarity This is why COMPACK will be the primary choice for comparing
crystal structures in this thesis
31 Introduction
62
Chapter 3 An Informal Blind Test A Crystal Structure Prediction of
1-Benzyl-1H-tetrazole
ldquoOne of the continuing scandals in the physical sciences is that it remains in general
impossible to predict the structure of even the simplest crystalline solids from a
knowledge of their chemical compositionrdquo
mdash John Maddox Nature (1988)
31 Introduction
311 Background This chapter reports an informal lsquoblind testrsquo of flexible 1-benzyl-1H-tetrazole BT
(Figure 31) using similar CSP methodology that successfully predicted the very flexible
molecule XX in the fifth blind test1117 In essence I will test the viability of the CSP
method (sections 11 and 28) which has evolved over the years from predicting the
crystal structures of rigid molecules166-168 to molecules that are so flexible that their
conformational flexibilities are accounted for at the start of CSP1117
9
10
1
8
7
2
11
123
65
4
2
1
Figure 31 The chemical diagram of BT determined from the crystal structure Torsion
angles 1=C7-C6-N1-C5 and 2 = C12-C7-C6-N1
In the previous chapters I mentioned that the emergence of a new polymorph of
ritonavir two years after market lunch (section 11) as well as John Maddoxrsquos148
ldquocontinuing scandalrdquo remark in 1988 (section 286) were the catalysts of the lsquoblind testrsquo
challenge organised by the Cambridge Crystallographic Data Centre (CCDC) in 1999
These lsquoblind testsrsquo provided researchers all over the world an opportunity to test their
CSP methods But unfortunately the CCDCndashndashmy industrial sponsorndashndashdid not organise
any lsquoblind testsrsquo during the course of the research reported in this thesis15 By chance my
colleague Rex Palmer observed an unusual packing of BT crystal structures and
subsequently issued me a lsquoblind testrsquo challenge This challenge was to predict the crystal
structure of BT given just the chemical diagram (Figure 31) and given that Z´=1
31 Introduction
63
The drug discovery literature frequently mentions the motifs of 5-substituted 1H-
tetrazole as bioisosteres for the carboxylic acid group169-171 due to the motifsrsquo similar pKa
values shapes and steric interactions Bioisosteres are structural moieties with broadly
similar shapes and functions For pharmaceutical industries the ability to model the
interactions of tetrazoles including BT is of great interest due to tetrazolersquos bioisosteres
feature
312 Experimental Determination of 1-Benzyl-1H-Tetrazole My collaborators (John Spencer Hiren Patel John J Deadman Rex Palmer Louise
Male and Simon J Coles) carried out the following experiments (their findings in
sections 313 and 314 were not made available to me until the end of the lsquoblind testrsquo
ie the submission of my candidate structures)
Synthesis and X-Ray Crystallography
John J Deadman synthesized BT on a ca 50 mmol scale from benzylamine sodium
azide and triethyl formate Hiren Patel under the supervision of John Spencer grew the
single crystals of BT from dichloromethanendashhexane
Louise Male and Simon J Coles collected the X-ray data and did the preliminary
analysis A colourless crystal fragment of dimensions 009 003 002 mm3 was
mounted on a glass fibre and flash-frozen to 120 K The X-ray data were collected on a
Bruker diffractometer using Mo K radiation The crystal structure was solved by direct
methods SHELXL-97172-174 was used to refine the crystal structure
313 Molecular Geometry of the Experimental Structure My collaborators discovered that BT crystallised in the monoclinic space group P21
with unit cell dimensions a = 76843(5) b = 55794(4) c = 94459(7) Aring = 100949(4)
deg V = 39761(5) Aring3 Z´= 1 and density = 1338 g cm-3 Overall the benzyl and tetrazole
rings were essentially planar including the H atom on the CH group (see C5 in Figure
31) belonging to the 5-membered tetrazole ring The individual rings were also co-planar
with the inter-ring link C6 atom (Figure 31) The N-N bonds (see bond lengths in Table
31) were of three different types consistent with Figure 31 N1-N2 = 1343(2) Aring N2-N3
= 1301(2) Aring is longer than a typical N = N bond175 but shorter than a typical aromatic
bond N3-N4 = 1368(2) Aring was also largely aromatic in character175 The two C-N bonds
have different characteristics C5-N4 = 1314(2) Aring was a double bond C5-N1 = 1336(2)
Aring was typically aromatic175 The phenyl rings of BT have a normal geometry with
average CndashC bond length of 1386(4) Aring average bond angle of 1200(7) and ring
planarity root mean square (rms) deviation of 00057 Aring The bond angles in the tetrazole
31 Introduction
64
ring have an average of 1080(17) which is consistent with the planarity of the ring
having an rms deviation of 0012 Aring including the link C atom and H5 on C5 These bond
lengths and angle measurements are similar to those of 5-azido-1H-tetrazole176
Table 31 Angles and bond lengths of the tetrazole ring in BT No information about the
bonds or angles were given to me prior to submission of the candidate structures
Angles X-ray
deg Bond lengths X-ray
Aring
N1-N2-N3 1069(2) N1-N2 1343(2)
N2-N3-N4 1102(2) N2-N3 1301(2)
N3-N4-C5 1052(2) N3-N4 1368(2)
N4-C5-N1 1096(2) N4-C5 1314(2)
C5-N1-N2 1080 (2) C5-N1 1336(2)
C5-N1-C6 1305(2) N2-C1 1472(2)
N2-C1-C6 1215(2)
314 Crystal Packing Weak Hydrogen Bonding Rex Palmer noticed that the mode in which the molecules in the experimental crystal
structure BT were packed was unusual He noted that a molecule such as BT based on
linked delocalized rings might be expected to form crystal structures involving ∙∙∙
bonding (ring stacking) However no such interactions occurred in the experimental
structure (Figure 32) Instead the structure was held together by a large number of weak
intermolecular contacts177178 12 of these were of the CH∙∙∙N interaction and 3 were of
the weaker CH∙∙∙C interaction which involve atoms in the phenyl ring This unusual
packing resulted in a structure composed of infinite S-shaped layers and produced a
sequence of benzyl and tetrazole layers (Figure 33) Another unexpected feature of the
packing was the formation of tetrazole clusters (Figure 32a) each having a central
tetrazole ring coordinated by six other tetrazoles
Figure 32 The crystal structure of BT (a) Partial view of the crystal packing showing
close CH∙∙∙N contacts between a central tetrazole and six surrounding tetrazoles (b)
Partial view showing CH∙∙∙N CH∙∙∙C and CH∙∙∙ contacts
(a) (b)
31 Introduction
65
Figure 33 BT crystal structure (a) View of the infinite S-shaped layers held together by
weak CH∙∙∙N and CH∙∙∙C H-bonds (b) Partial view of the layer structure showing
alternative B(benzyl) and T(tetrazole) layers and the repeating layer sequence [BTBT |
TBTB]
315 Overview of the Challenge After my experimental collaborators grew single crystals of BT from a non-polar
solvent mixture and determined the crystal structure at 120 K I was issued a lsquoblind testrsquo
challenge by Rex Palmer to predict the crystal structure of BT because of the unusual
mode of crystal packing (section 314) No experimental information was given prior to
the submission of the candidate structures The subsequent part of this chapter presents
the computational work I carried out independently upon receiving the chemical diagram
of BT (Figure 31)
This chapter uses CSP methodology (section 322) to predict the crystal structure of a
molecule that can adopt a wide range of molecular shapes due to the conformational
flexibility of the molecule Consequently the conformational flexibility must be
accounted for at the start of CSP (CrystalPredictor 16 section 281) In addition this
method relies on the systematic improvement of the evaluation of the lattice energy Elatt
where Uinter and Eintra are the intermolecular and intramolecular contributions X and
vector θ denote intermolecular and intramolecular degrees These systematic
improvements increase the computing time As a result it is essential to reduce the
number of crystal structures that will be examined as the confidence in the lattice energy
ranking improves in each step
This chapter will also test the transferability of the intermolecular energy potential to
BT since this molecule contains a functional group that differs from those used in
determining the parameters of the intermolecular potentials (section 23)3839
Elatt = Uinter(X θ) + ΔEintra(θ)
31
(b) (a)
32 Computational Methodology
66
To determine whether this study is a success the predicted structures of BT will be
compared with the experimental crystal structures using a similarity tool In addition I
will compare and contrast the most stable generated structures of BT with the similar
tetrazole fragment structures to determine whether the packing of the experimental
structure of BT was unusual In this chapter I will show that the crystal structure of BT
can be successfully predicted starting from just the chemical diagram (Figure 31)
32 Computational Methodology
321 Conformational Analysis To restrict the search space of BT to energetically meaningful regions I carried out
quantum mechanical (MP26-31G(dp) single-point calculations on HF6-31G(dp)
optimised geometries) scans of the two flexible torsions 1 and 2 (Figure 31) using the
GAMESS179 program
322 Crystal Structure Prediction Step 1 The search was carried out using the CrystalPredictor126 program which
covered the 59 most commonly occurring space groups The lattice energy was minimised
by varying the cell parameters and torsion angles 1 and 2 within energetically
meaningful regions (section 321) At this stage the lattice energies (equation 31) were
crudely estimated and then using the grid of the ab initio results from section 321 the
ΔEintra contribution were interpolated The intermolecular electrostatic interactions were
modelled using the atomic charges derived from section 321 All other intermolecular
energy terms were derived from an empirical exp-6 potential FIT40 Approximately a
quarter of a million lattice energy minimisations were performed This produced
approximately 170000 distinct structures of which 44000 structures were unique These
generated structures were labelled by their energy ordering The result of step 1 is the
CrystalPredictor energy landscape
Step 2 Next the lattice energy model was improved For each of the lowest 10000
crystal structures the energy of the isolated molecule and its charge distribution were
calculated at the PBE06-31G(dp) level of theory using GAUSSIAN0353 This
calculation provided a better estimate of ΔEintra and a more accurate representation of the
charge density in terms of a distributed multipole model51 These two contributions were
then combined with an atomndashatom exp-6 repulsion-dispersion potential using parameters
that had been fitted to azahydrocarbons39 and polar crystal structures40 which were
assumed to be transferable to this tetrazole At this stage the lattice energy was
minimised with the molecule held rigid using DMACRYS34
33 Results and Discussion
67
Step 3 Approximately 100 of the most stable structures were then further refined at
the PBE06-31+G(d) level of theory by allowing the molecular conformation to adjust
more accurately to the intermolecular forces using the program CrystalOptimizer7172
(section 282) This algorithm allowed the intermolecular and intramolecular energy to
be minimised simultaneously The CrystalOptimizer program uses the Quasi-Newton
algorithm coupled with a line search to solve the minimisation program It also makes use
of GAUSSIAN0353 calculations on the molecular conformations and DMACRYS34
optimisations of the crystal structure
Step 4 The effect of the crystal environment on the conformational energies ΔEintra and
charge densities was estimated by calculating the conformational energy and charge
distribution in a Polarizable Continuum Model (PCM)180 with =3 a value typical of
organic molecules131 This calculation was implemented in GAUSSIAN0353 at the
PBE06-31+G(d) level of theory The result of step 4 is the PCM crystal energy landscape
33 Results and Discussion
331 Conformational Energy Grid
Figure 34 The conformational energy grid used in the search Relative intramolecular
energies ΔEintra (kJ mol-1) for isolated molecule calculations at the MP26-31G(d p)
level of theory
Prior to the generation of hypothetical structures it was necessary to investigate the
possible steric hindrances to rotation about the two flexible torsion angles 1 and 2
(Figure 31) The result shown in Figure 34 indicates a high degree of flexibility in the
molecule The purple colours represent regions with the smallest energy penalty ie the
33 Results and Discussion
68
most stable conformations This high degree of flexibility makes possible a wide range
of crystal structures with different molecular shapes For this reason the generation stage
(step 1 of sections 322 and 332) incorporates conformational flexibility from the start
332 The CrystalPredictor Energy Landscape The analyses presented here are post-process ie after submitting the ten most likely
crystal structures on the PCM (final) energy landscape (step 4 section 333) The energy
landscape after step 1 (CrystalPredictor) is displayed in Figure 35 This step estimated
the lattice energies Elatt very crudely by interpolating the atomic charges and
intramolecular energies (Figure 34) Yet the generated structure that matched the
experimental structure of BT at this stage was only ranked 23rd This structure BT_23
which is highlighted in red on Figure 35 has only a 3 kJ mol-1 energy difference in
comparison with the global minimum structure
Figure 35 The CrystalPredictor energy landscape of BT generated with a crude lattice
energy model The generated structure that matched the experimental structure is
highlighted in the open red symbol
333 The CrystalOptimizer and PCM Energy Landscapes The two most stable crystal structures on the PCM energy landscape (Figure 36b) have
similar lattice energy less than 01 kJ mol-1 The lsquoblind testrsquo was deemed a success
because the experimental structure matched the second most stable crystal structure
2BT_23 on the PCM energy landscape (Figure 36b and Table 32) This PCM energy
landscape was generated after CrystalPredictor (step 1 Figure 35) lattice energy
refinement (step 2) CrystalOptimizer (step 3 Figure 36a) and PCM calculations (step
33 Results and Discussion
69
4 Figure 36b) Compared to the first step (step 1 Figure 35) the lattice energy rank of
the experimental structure improved significantly from 23rd to 2nd
Figure 36 (a) The CrystalOptimizer (step 3) and (b) PCM (step 4) energy landscape of
BT GM is the global energy minimum The open red symbol represents a match between
the experimental crystal structure and the generated structure The energy ranking of the
crystal structure that matches the experimental has improved from fourth most stable 4
to second most stable 2
(a)
(b)
33 Results and Discussion
70
I submitted a list of 10 structures in which the 2BT_23 structure was selected as the
first choice while the global minimum (labelled GM on Figure 36b) was selected as the
second choice181 The main reason for selecting 2BT_23 as the first choice was the
notable improvement of energy rank from fourth (Figure 36a step 3) to second (Figure
36b step 4) In addition the two most stable crystal structures on the PCM energy
landscape (Figure 36b step 4) were only 01 kJ mol-1 apart
Table 32 Summary of experimental (highlighted in blue) and computed crystal
structures on the PCM energy landscape (Figure 36) The computed structure that
matched the experimental structure (section 312) is highlighted in bold For label
xBT_y x and y are energy ranked after steps 4 and 1 of CSP respectively (section 322)
Label Space Group
a b c
Aring
β
deg
ρ
g cm-3
Uinter ΔEintra Elatt
kJ mol-1
1BT_120 P21c 999 817 1104 11750 133 -12176 225 -11952
2BT_23 P21 793 555 944 10132 131 -12152 208 -11944
Experiment P21 768 558 945 10095 134 - - -
3BT_165 P21c 1086 554 1597 12141 130 -12109 270 -11839
4BT_335 P212121 938 1581 556 9000 129 -12032 200 -11833
5BT_767 P21c 941 553 1580 10234 132 -12044 214 -11830
6BT_167 P21 568 839 881 10322 130 -12289 504 -11785
7BT_912 P21 557 869 861 10365 132 -11882 143 -11739
8BT_34 P21c 809 553 1859 10166 131 -11919 219 -11700
9BT_491 Pna21 1666 566 858 9000 131 -12299 626 -11673
10BT_250 P212121 1904 557 778 9000 129 -11916 325 -11591
11BT_55 P21c 1080 556 1582 12232 132 -11979 396 -11583
12BT_490 P21c 653 866 1394 9428 135 -12098 521 -11577
13BT_178 P212121 833 561 1764 9000 129 -11789 232 -11557
334 Did the Predicted Structure Really Match the Experimental Rex Palmer provided the cif file of the experimental structure once ten of the most
stable structures on the PCM landscape were submitted (Figure 36b) Then I compared
the experimental structure with the submitted crystal structures using COMPACK151 The
computed 2BT_23 structure my first choice (section 333) gave an excellent overlay
with 15 molecules of the experimental structure with a root mean square difference
RMSD value of only 0148 Aring (Figure 37) This computed 2BT_23 structure has similar
unit cell dimensions (Table 32) and is in the same space group P21 as the experimental
structure
33 Results and Discussion
71
Figure 37 The 15-molecule overlay between the experimental (atomic colours) and the
second most stable computed structure 2BT_23 (green) The direction of the view
obscures some of the molecules
In addition to excellent RMSD15 overlay the 2BT_23-generated structure provided a
starting model that was easily refined in SHELXL-97 which was further proof that the
structure was a genuine reproduction of the experimental crystal structure (section 312)
Hence it is clear that the CSP method outlined in this chapter which uses only the
chemical diagram as prior information can successfully predict the crystal structure of a
flexible molecule
335 The Global Minimum Structure on the PCM Energy Landscape The global minimum GM structure labelled 1BT_120 on the PCM energy landscape
(Figure 36) was very different from the experimental crystal structure as only two
molecules overlaid (Figure 38) during similarity calculations From the overlay of the
similarity calculations (Figure 38) it is clear that the GM and the experimental structure
have different conformations The GM structure 1BT_120 (Table 32) is in space group
P21c and has a very different spatial arrangement (as shown in Figure 39) when
compared to the experimental structure (Figure 32 and Figure 33) This structure also
has dominant weak H-bonds 8 CH∙∙∙N and 1 CH∙∙∙C interactions There was also one
weak ∙∙∙ benzyl∙∙∙benzyl interaction (Figure 39)
The similar lattice energy values of the two most stable structures generated (Figure
36b) suggest that the GM structure could a polymorph This GM structure could be
33 Results and Discussion
72
synthesised at high pressure because it is the denser of the two most stable structures
Also growing the experimental structure using a non-polar solvent (section 312) may
have prevented H-bonding formation
After the generation step (CrystalPredictor) the initial rank of the most stable crystal
structure after step 4 GM was 120th The eventual rank was first despite the fact that
only about 100 structures were optimised this shows the importance of the novel
intermediate step 2 in the CSP method After the CrystalPredictor step 1 the GM
structure was 9 kJ mol-1 less stable than the experimental 2BT_23 structure and had
distinctly fewer close contacts than the experimental 2BT_23 structure Therefore the
rearrangement of lattice energy depends on the method used
Figure 38 Crystal Packing Similarity between experimental (grey) and the most stable
predicted structure (1BT_120 green) with only 2 molecules matching (RMSD2 = 1072
Aring)
Figure 39 The structure corresponding to the global minimum in lattice energy
(1BT_120) showing the dominant weak H-bonds (Aring) eight of type CH∙∙∙N and one
CH∙∙∙C and the weak ∙∙∙ interaction (benzylmiddotmiddotmiddotbenzyl)
33 Results and Discussion
73
336 Post Analysis Comparison of Structure with CSD The motivation for the lsquoblind testrsquo challenge was the unusual packing of the
experimental structure Thus a database containing over half-million crystal structures
was searched in an effort to investigate the breadth of variation in the packing of the
experimental structures of BT A Cambridge Structural Database (CSD)182 survey was
carried out to compare BT with other 1-substituted 1H-tetrazole crystal structures (Figure
310) The CSD version 533 March 2012 was searched for fragments defined in Figure
310 The bond lengths bond angles and torsion were analysed and compared with the
experimental structure using histogram plots
1
6
23
5
4
Figure 310 Query used in Conquest to search the CSD for similar fragments
The query of the CSD yielded 34 structures including two redeterminations The
refcodes of these 32 structures were ACIROU ACIRUA BEGRIP CAZWIK
DOKQEA DOKQIE EKAJOQ HISYEO IQUJEK ABMIL LUVPIC MEVWOZ
MUKMAG PHTETZ01 PUGLUZ QALNOH QALNUN QALPAV QALPID
QALPOJ QALPUP QALQAW QALQEA01 QALQIE QEBPUI01 REVMOV
REZNUG RIZXEE SOLHAD TIJLIH VUNNUO and OBAREQ
The experimental bond lengths were typical of those in the other crystal structures
containing the 1-substituted 1H-tetrazole group (Figure 311) Some significant
differences ( 002 Aring) were observed between the ab initio computed values and the
experimental bond lengths but both were within the observed ranges The variations in
tetrazole bond angles (Figure 312) were consistent with the bond length variations for
this moiety176 which was always close to planar The external torsions angles ξ1 and ξ2
exhibited a wide range of values (Figure 312) a result that was consistent with the large
range of low-energy conformations (Figure 34) despite the range of functional groups
bonded to C6
No tetrazole clusters were observed for the 32 1-substituted 1H-tetrazole structures
found in the CSD There were however some tetrazole layers in 1BT_120 and the
33 Results and Discussion
74
experimental structures DOKQIE EKAJOQ QALPAV QALPOJ QALPUP and
REVMOV All 32 structures had the tetrazole bonded to a sp3 carbon and were tetrazole
hydrocarbons (except QALPAV which also contained an iodine atom) Hence there was
no strong driving force for the tetrazole cluster Still a layer structure seemed to be quite
favourable in cases where there were no competing strong interactions There were more
similarities between the CSD tetrazole structures and the GM structure than there were
between the experimental structures This finding suggests that the use of informatics of
CSD in CSP such as Desirajursquos supramolecular synthon approach183 would weight the
global minimum structure more than the experimental structure
Figure 311 Histograms showing the bond length distributions of 32 1-susbtituted 1H-
tetrazole rings in the CSD The red square denotes the experimental bond lengths in BT
while the black square denotes the ab initio bond lengths in the corresponding calculated
structure 2BT_23
33 Results and Discussion
75
Figure 312 Histograms showing the distributions of the torsions and angles of the 32-
tetrazole rings found during the CSD survey The experimental bond length in BT is
denoted by the red square while the ab initio bond length in the corresponding calculated
structure 2BT_23 is denoted by the black square
34 Summary
76
34 Summary I successful predicted the unusual crystal packing of BT given just the chemical
diagram and the Z´ number The packing was predicted by using a model that accurately
determines the electrostatic forces arising from molecular charge density including the
anisotropic forces from the lone pair and electrons but otherwise was not tailored to
the tetrazole∙∙∙tetrazole interactions Thus the intermolecular energy potential is
transferable to BT crystal structure even though the functional group used in determining
the parameters of the intermolecular potentials did not include a single tetrazole molecule
The successful prediction of the experimental structure as one of the two distinct most
stable structures shows that the unusual layers do present an optimal compromise between
the many different weak hydrogen bonds and other intermolecular interactions The most
stable crystal structure GM could well have been an undiscovered polymorph In fact
informatics weighting may have selected this structure Thus this study shows the
potential value of CSP for generating unexpected structures
This study also showed that the level of computational chemistry modelling that was
used is suitable for modelling the molecular recognition of this functional group This
level of modelling could become increasingly useful in pharmaceutical design due to
tetrazolesrsquo bioisosteres properties In the next chapter more will demanded of CSP Will
this method deliver
41 Introduction
77
Chapter 4 Is the fenamate group a polymorphophore Contrasting the
crystal energy landscapes of fenamic and tolfenamic acids
ldquoIts the little details that are vital Little things make big things happenrdquo
mdash John Wooden
41 Introduction This chapter builds on Chapter 3rsquos description of a procedure that successfully
predicted the experimental crystal structure of a flexible molecule in order to address two
specific questions First in a given molecular structure is the presence of a
polymorphophore (section 11) substructure sufficient to ensure polymorphism Second
what role do substituents play in determining the range of polymorphs that are present in
a molecule
In this investigation of the concept of polymorphophore I will use CSP to contrast the
crystal energy landscapes of two fenamates (Figure 13) monomorphic fenamic acid (2-
(phenylamino)-benzoic acid FA) and one of its highly polymorphic derivatives
tolfenamic acid (2-[(3-chloro-2-methylphenyl)amino]-benzoic acid TA) TA is a good
test case for this investigation into whether the fenamate group is a polymorphophore
because at the start of this study TA had five known polymorphs19
The term ldquofenamaterdquo can refer to a range of molecules that vary widely in molecular
structure including niflumic acid which contains an aromatic nitrogen Although some
researchers who have conducted thermodynamic and structural investigations of
fenamate molecular crystals have included an extraordinarily wide range of molecules
even dichlofenac184 the present study is restricted to the fenamates shown in Figure 13
Essentially I will focus on cases where the dominant interactions that determine the
crystal or drug binding are inherent in the proposed polymorphophore families of fenamic
acid (Figure 13)
41 Introduction
78
ROY fragment
WIFHUP 2185
R=H
ROY
QAXMEH 7(3)20
R2=CH3
OGIDEN 3186
R2=R5=CH3
Fenamate fragment
Fenamic acid (FA)
QQQBTY 1187
R=H
Tolfenamic acid (TA)
KAXXAI 519
R1=CH3 R2=Cl
Flufenamic acid (FFA)
FPAMCA
2(1)22
8(1)18 in 2012
R2=CF3
PEFMET 1188
R1=CH3
PEFNAQ 1188
R2=CH3
SURMEY 1187
R3=CH3
Mefenamic acid
XYANAC 2(1)189190
R1=R2=CH3
SURMOI 1187
R2=R4=CH3
LAHLOW 1191
R1=R5=CH3
Figure 41 The polymorphophore families of ROY and fenamic acid The numbers of
polymorphs in the Cambridge Structural Database (CSD) follow the refcodes for each
specific molecule and (x) denotes the number of additional polymorphs that whose
crystal structures were not available The lowest two rows are fenamates whose structures
are used in Table 46
41 Introduction
79
411 Polymorphism and Polymorphophores Polymorphism (section 11) the occurrence of multiple crystal structures with the same
chemical content is now known to be a widespread phenomenon among organic
molecules192 and is of great importance in the industrial manufacture of specialty
chemicals and pharmaceutical products Relatively few systems have several polymorphs
whose crystal structures and relative stabilities have been determined the most
thoroughly investigated20 being the polymorphs of 2-[(2-nitrophenyl)amino]-3-
thiophenecarbonitrile commonly known as ROY (Figure 13) after the red orange and
yellow colour spectrum of the first six polymorphs to be reported193 Some families of
related molecules23194 such as the sulphonamides194 ROY derivatives23 barbiturates195
carbamazepine derivatives147196 and fenamates19 appear to have a strong tendency
toward polymorphism This fact has given rise to the study of a polymorphophore1923196
a term coined by Matzger23 that refers to a structural element that when incorporated into
a molecule favours the formation of polymorphic crystal forms Hence
polymorphophore is a descriptive term and not a quantifiable hypothesis
The focus of this chapter is the polymorphophore concept Some families of molecules
contain a common substructure (the polymorphophore) wherein many members but not
necessarily all exhibit polymorphism For example removing or adding a methyl group
to ROY creates molecules (Figure 13) that are also polymorphic indicating that ROY is
a polymorphophore (Figure 13) However the number of related molecules is limited
probably because ROY is only a precursor in the synthesis of the blockbuster drug
olanzapine Studying polymorphophores is like studying pharmacophores a particularly
promising way of finding new leads in drug discovery especially in cases when a
receptorrsquos 3D structure is unknown197
This chapter considers the fenamates that conserve the H-bonding groups and dominant
molecular shapes by having small non-polar substituent groups for the aromatic protons
as exemplified in Figure 13 These types of substituent(s) might be expected to have
minimal effects on the strongest intermolecular interactions and hence on either crystal
packing or drug receptor binding The fenamates contain a proposed
polymorphophore1819 that is related to that of ROY (Figure 13) in having a phenyl group
attached via an N-H group to a further aromatic ring
412 Conformations in known Crystal Structures The overlay of the conformers of FA and TA in the experimental crystal structures
(Figure 42) confirms that the main variation in conformation is the ξ1 torsion angle The
41 Introduction
80
two most stable polymorphs of TA forms I and II (blue and red in Figure 42) have the
greatest difference in ξ1 The benzoic acid ring and the N-H groups are coplanar with the
ξ2 torsion angle being approximately zero concordant with the intramolecular H-bond
Figure 42 Overlay of the experimental conformers of FA (top) and TA (bottom) viewed
with the overlaid benzoic acid fragment arranged horizontal FA QQQBTY02 (Z´=2
light blue and magenta) TA KAXXAI01 (Form I Z´=1 blue) KAXXAI (Form II Z´=1
red) KAXXAI02 (Form III Z´=2 green and purple) KAXXAI03 (Form IV Z´=3
yellow brown (obscured by yellow) and black) and KAXXAI04 (Form V Z´=1
disordered on both sites (section 415) violet and grey) The arrows point to the main
variation (ξ1) between the conformers of FA and TA in the experimental crystal
structures
413 Experimental Data of FA and TA FA has just one known form187 which has two molecules in its asymmetric unit Z FA
serves as a parent structure for several fenamates including TA TA is a non-steroidal
anti-inflammatory drug used for the treatment of rheumatic conditions198 At the start of
this study TA had at least five polymorphs forms I-V19199 It currently has six
polymorphs (see section 438) Unlike ROY the polymorphs of TA vary in the number
ξ1
ξ1
41 Introduction
81
of molecules in the asymmetric unit Z´ (Table 41) The variation in colour that is
observed between form I (colourless) and II (yellow) is due to the conformational
difference as observed for ROY2023 There were three undisputedly metastable
polymorphs including form V whose disorder is analysed further in section 415
Here it is necessary to discuss further the relative stability of forms I and II (Table 41)
The enthalpy and temperature of fusionHfus and Tfus measurements provide a way of
classifying polymorphs as either being monotropic or enantiotropic Four different
papers19199-201 have presented evidence for the thermodynamic relationship between
forms I and II but each paper gives slightly different conclusions Surov et al showed
that the yellow form (form II) is more stable than the white form (form I)201 and that these
polymorphs have a monotropic relationship because the form with the higher melting
temperature form II has a higher enthalpy of fusion Hfus (by the enthalpy of fusion
rule)202 as illustrated in Figure 43(a) However Mattei and Li200 measured an
endothermic transformation going from II to I with temperature increasing to 1418 degC
with a Differential Scanning Calorimetry (DSC) implying that forms I and II have an
enantiotropic relationship as shown in Figure 43(b) The observed transformation from
form II to I in a slurry experiment indicated that the thermodynamic transition point was
below room temperature All three sets of measurements199-201 that were extrapolated to
0 K had form II more stable than form I
Table 41 The experimental data of the known forms of FA and TA Crystal structures
and Hfus values were taken from ref [19] unless otherwise specified aThe most widely
varying torsion angle ξ1 is defined in Figure 49 bTemperature of crystal structure
determination cMelting temperature
REFCODE (form)
Space Group
Z´ ξ1a
deg Tb
K
Hfus
kJ mol-1
Tmc
K
FA QQQBTY02 P-1 2 4721 7045 283-303187 - - TA KAXXAI01(I) P21c 1 10774 3937 48625-4886
110 4250 48405199
410plusmn05 48418plusmn02201
4127 48585200
KAXXAI(II) P21n 1 4223 387 48667
110 4840 48765199 490plusmn05 48578plusmn02201
4240 41495200
KAXXAI02 (III) P21c 2 4419 5764 85 - KAXXAI03 (IV) P-1 3 673457584784 85 3188 KAXXAI04 (V) P-1 1 5562 85 -
41 Introduction
82
Figure 43 Temperature dependence of the enthalpy (H) and free energy (G) diagrams
for forms I and II of TA showing a monotropic (top) relationship from data from
Surov201 which are qualitatively the same as data from Andersen199 and an enantiotropic
(bottom) relationship from data from Mattei and Li200
Lopez-Mejias et al19 provided the only thermodynamic data available for forms IIIndashV
The researchers noted that heating forms III and V at 80degC caused a transformation to
form I within a period of minutes to hours In solution forms III IV and V transformed
to form I or a mixture of form I and II Hence forms III IV and V were shown to be
metastable polymorphs The heats of fusion given in Lopez-Mejiasrsquo supplementary
information19 were listed by the initial form and forms III and V may well have
transformed to form I rather than form II Therefore these sets of data were inconclusive
as to the relationship between forms I and II
(a)
(b)
41 Introduction
83
414 Similarities between the known forms of FA and TA The known polymorphs of TA and FA showed some similarities (Table 42) as all were
based on the H-bonded dimer (Figure 44a) The graph-set analysis161162 for the (two)
types of H-bonds are identical for all the crystal structures of TA and FA intermolecular
dimers with 2 donors 2 acceptors and 8 atoms in total (11987722(8)) and intramolecular with 1
donor 1 acceptor and 6 atoms in total (S(6))201
Form II had the most distinctive packing (Figure 44b) as well as conformation (Figure
42b) and was the only structure with a short contact involving the chlorine atom and the
aromatic ring The most striking result from Table 42 was the similarity between the
metastable forms III and IV where 11 molecules could be overlaid (Figure 44c) The
two independent molecules in form III had similar conformations to two of the three
independent molecules in form IV (compare the open circle and closed triangle symbols
in Figure 412a) The polymorphs had sufficiently similar simulated powder patterns to
have a PXRD similarity measure in the grey area between polymorphism and
redeterminations203 and for this reason they exemplify the challenges in defining
polymorphism204205
Table 42 Quantification of the similarities of FA and TA crystal structures showing the
packing similarity (RMSDn) and powder X-ray diffraction (PXRD) similarity206 The
bold numbers indicate the number of molecules n that match within distance and angle
tolerances of 20 and 20deg respectively with the RMSDn values in brackets See section
425
n(RMSDnAring)
FA TA(I) TA(II) TA(III) TA(IV)
FA - 6(066) 2(048) 3(074) 5(108)
TA(I) 078 - 1(087) 3(078) 3(107)
TA(II) 085 086 - 2(077) 2(074)
TA(III) 078 083 090 - 11(045)
TA(IV) 078 084 092 098 -
TA(V) 086 089 093 091 093
PXRD Similarity
41 Introduction
84
Figure 44 Features of the experimental crystal structures (a) The hydrogen-bonded
dimer motif found in all structures with variations in the phenyl ring orientations (ξ1)
The specific illustration shows the packing similarity between FA (QQQBTY02) and TA
form II (KAXXAI) (b) The unique packing of TA form II with short contacts between
chlorine and the aromatic ring (c) Crystal Packing Similarity between form III and form
IV of TA showing the 11-molecule overlay which includes only two dimers
415 Solving the Connectivity Problem of a Disordered Form The crystal structure of Form V of TA was solved with an R-factor of 658 the whole
molecule was equally disordered over two sites19 I found that separating the two
components of disorder gave the wrong connectivity between the C8 and N1 atoms (green
in Figure 45b) The C8-N1 bond length of 170 Aring was unusually long and this caused the
breakdown of the trigonal planar relationship of nitrogen C7-N1(H6)-C8 connectivity
(c)
(b) (a)
41 Introduction
85
(Figure 45c) A model with the two components both corresponding to the expected
molecular geometry can be made by redefining the connectivity (Figure 45b) to link half
of one disordered molecule (the bonded molecule in Figure 45a) with half of the other
disordered molecule (the atoms-only component in Figure 45a) The second component
was formed by combining the remaining halves The resulting molecules (red and blue in
Figure 45b) have the expected C-N bond length of 143 Aring and a trigonal planar geometry
around the nitrogen atom
The above procedure results in three ordered Z=2 crystal structures with the unit cell of
form V by using the two resulting molecules (Figure 46a b for Z´=1 and Figure 46c for
Z´=2)
Figure 45 (a) Crystal structure KAXXAI04 of form V of TA (b) The atom connectivity
of the two new components (colour red and blue) the original C-N connectivity is
labelled green (c) Chemical diagram showing the atomic connectivity of TA
9
1
1
2
10
1
813
14
7
164
21
1 53
2
(a)
(b)
(c)
41 Introduction
86
Figure 46 Ordered Z=2 crystal structures formed from the disordered components of TA
form V (a) Form V_a (b) Form V_b and (c) Form V_c
(a)
(b)
(c)
42 Computational Methods
87
416 Overview The focus of this chapter is the polymorphophore concept which I will investigate by
generating crystal energy landscapes (section 285) of FA and TA These crystal energy
landscapes are a valuable tool for examining the known forms of different molecules
because the same level of polymorph screening is rarely applied to entire families of
molecules This is likely the case for FA and TA since TA is a drug molecule while FA
is not In addition there were far more publications for TA than FA (see section 413)
For these reasons FA and TA provide a good test for the concept of polymorphophore
In this chapter the energy landscapes of FA and TA will be generated by first selecting
a suitable ab initio level of theory for the conformational energy of the isolated molecule
I will achieve this by performing ab initio scans at various levels of theory Then these
ab initio scans will be compared with histogram plots of crystal structures whose
fragments are similar to FA and TA The analysis of these scans and plots will guide the
methodology I will use to generate the hypothetical structures The final energy
landscapes of FA and TA will be generated by systematically increasing the accuracy of
evaluating the lattice energies while reducing the number of generated structures Finally
I will compare the crystal structures on the energy landscapes for FA and TA using a
similarity tool
I will show the conformational flexibility of fenamate fragments allows the potential
for a large number of structures and that it is the substituents that determine if a molecule
is polymorphic or not In other words polymorphophore promotes but does not guarantee
polymorphism Concisely CSP goes beyond the lsquoblind testrsquo described in Chapter 3
42 Computational Methods
421 Ab initio Conformational Profile of TA To test the effects of ab initio methods on the conformation profile of TA I compared
relaxed scans at various levels of theory of the main torsion ξ1 (Figure 49) with single-
point energy calculations at the MP26-31G(dp) level of theory The effect of rotating
the H-bonded torsion ξ2 (see Figure 49) was investigated by performing a relaxed scan
at the PBE06-31+G(dp) level of theory The results from these scans helped in selecting
the appropriate level of theory as well as the torsion that would be allowed to rotate during
the generation of hypothetical structures (step 1 section 423)
422 CSD Survey for Fenamates The relaxed conformational scans of the main torsion angle ξ1 (section 421) at the
PBE06-31+G(d) level of theory were complemented by a Conquest207 search of the
Cambridge Structural Database (CSD 208) for the crystal structures containing the
42 Computational Methods
88
molecular fragment shown in Figure 47 This comparison allowed us to see the variation
in ξ1 when there was an internal H-bond (ZmiddotmiddotmiddotH lt 26 Aring) that constrained part of the
molecule to planarity
dlt26Aring
Figure 47 Query fragment and the torsion angle ξ1 measured in the Conquest207 survey
of the CSD structures There were 131 organic structures where Y=H and 94 where Yne
H
423 Crystal Structure Prediction I calculated the crystal energy landscapes14 of FA and TA using a method209 that was
adapted from that used for the highly flexible molecule XX in the fifth blind test of CSP11
a method that called for an approximate conformational energy surface in the initial
search stage (see section 281) The final energy landscapes of FA and TA were generated
in four steps with the quality of the methods increasing and estimated the conformational
energy penalty Eintra and the intermolecular contribution Uinter to the lattice energy Elatt
Step 1 (Generation of hypothetical crystal structure) Crystal structures with Z´=1 were
generated in 15 common space groups P1 P-1 P21 P21c P21212 P212121 Pna21
Pca21 Pbca Pbcn C2c Cc C2 Pc and P2c using CrystalPredictor126 The grid was
used to extrapolate the atomic charges and intramolecular energy Eintra This grid was
pre-computed as a function of just ξ1 (Figure 48) using GAMESS179 at the MP26-
31G(dp) level of theory (single-point calculation) after the molecular geometries were
optimized at the HF6-31G(dp) level The intermolecular contributions to the lattice
energy were calculated crudely from the atomic charges and the Williams135 exp-6
repulsion-dispersion potential The CrystalPredictor program carried out 250000 lattice
energy minimizations This resulted in 162288 and 182615 distinct structures for TA
and FA respectively of which 16543 and 22884 were unique for TA and FA
respectively
Elatt = Uinter + Eintra = Uinter + Uelec + Eintra 41
42 Computational Methods
89
Figure 48 The fragment used in the CrystalPredictor search for TA Each fragment was
kept rigid during the search for hypothetical crystal structures
Step 2 (Accurate evaluation of the electrostatic contribution (Uelec)) Single-point ab
initio calculations were carried out on the conformation for each of the unique structures
from step 1 using GAUSSIAN0353 at the PBE06-31G(dp) level of theory to improve
the estimate of Eintra and provide the atomic multipoles by distributed multipole
analysis51 using GDMA The crystal structures were re-optimized using DMACRYS34
keeping the molecule rigid with the intermolecular energy Uinter calculated from the
distributed multipoles and the FIT parameterization38-40 of the exp-6 atomndashatom
repulsionndashdispersion potential
9
1
1
2
10
1
813
14
7
164
21
1 53
2
TA
Figure 49 The degrees of freedom optimized by CrystalOptimizer for crystal structures
of FA and TA (ξ1equiv C7-N1-C8-C9 ξ2equiv C2-C7-N1-C8 ξ3equiv O1-C1-C2-C7 ξ4equiv H1-O1-C1-C2
and ξ5equiv C8-C13-C14-H10 θ1equiv H6-N1-C8 θ2equiv H1-O1-C1)
Step 3 (Accurate evaluation of lattice energy (Elatt=Uinter and Eintra)) Approximately
100 of the most stable crystal structures from step 2 were re-minimized due to the limited
time constraints of submitting this study as my first year report Six and seven
conformational degrees of freedom for FA and TA respectively (Figure 49) were
allowed to change as was the crystal structure using CrystalOptimizer7172 and
calculating Eintra and the distributed multipoles at the PBE06-31+G(d) level of theory
for the isolated molecule
Step 4 (Modelling the effect of the crystalline environment) Finally I estimated the
effect of the crystal environment using a Polarizable Continuum Model (PCM)180 that I
42 Computational Methods
90
obtained by calculating the wavefunction of the molecular structure in a dielectric of ε=3
(typical of molecular organic crystals)131 as implemented in GAUSSIAN03 The crystal
structures were then re-minimized using the distributed multipoles calculated in the PCM
environment while keeping the molecule rigid the resulting Uinter was combined with the
Eintra to evaluate the lattice energies The CSP-generated crystal structures for FA were
labelled xFA_y where x was the final energy ordering and y the ordering after the
CrystalPredictor stage A comparison of x and y shows the extent of re-ranking by
increasing the accuracy of the lattice energy model
424 Experimental Crystal Structures with Z´ gt1 The complexity of the task of generating Z´gt1 crystal energy landscapes (steps 1-4) for
flexible molecules limited the search (section 423) to Z´=1 Analogous CrystalOptimizer
(step 3) and PCM calculations (step 4) were performed starting from all the experimental
crystal structures of TA and FA which included Z´gt1 structures FA form I and TA
forms III IV and V (section 415) This allowed comparison between Z´=1 generated
crystal structures and the experimental crystal structures of FA and TA
425 Comparison of Crystal Structures The experimental crystal structures the corresponding lattice energy minima and the
structures on the crystal energy landscapes were compared using the Crystal Packing
Similarity151 module (section 29) implemented in Mercury210 This crystal structure
similarity tool returns the highest number of molecules n (where n 15) that can be
overlaid between two different structures when all non-hydrogen atomndashatom distances
are within a 20 distance tolerance and angles are within 20 The calculated RMSDn is
the root mean square deviation of all non-hydrogen atom positions in the clusters of n
molecules The program allows for comparisons of crystal structures of different
molecules with the RMSDn being calculated from only the common non-hydrogen
atoms This Crystal Packing Similarity calculation determines the similarity in the
coordination environment of the two crystal structures rather than of the crystallographic
cell
43 Results
91
43 Results
431 Dependence of Conformational Energy on Method An appropriate grid of intramolecular energies was essential in order to search all the
likely conformations of TA and FA and thereby generate all likely Z´=1 crystal structures
To observe the effects that changing the level of theory had on the relative intramolecular
energy the torsion angle was scanned at HF PBE0 MP2 and B3LYP levels of theory
using GAUSSIAN0353 with the rest of the molecule allowed to relax
Figure 410 The relative conformational energy of isolated TA molecules as a function
of the ξ1 The MP2 and PBE0 method at 6-31G(dp) basis set compared with the other
method (top) and the other basis sets (bottom) for the PBE0 method
43 Results
92
The HF6-31G(dp) level of theory produced one minimum for the torsion angle
(Figure 410a) This result was qualitatively incorrect so the PBE0 level was selected as
the best compromise because it reproduced the correlation effect present in TA its
minima coincided in the same torsion angle region as that of MP2 and was
computationally cheaper than MP2 Since the conformational profile of TA converged at
the 6-31+G(d) basis set (Figure 410b) I selected PBE06-31+G(d) as the appropriate
level of theory for the final lattice energy calculation (steps 3 and 4 of section 423) of
the crystal structures This level of theory produced the standard plots of Chapters 4 to 6
432 Consideration of H-bonded Torsion
Figure 411 The relative conformational energy as a function of the ξ2 (Figure 49) for
FA and TA calculated at the PBE06-31G(dp) level of theory
The conformational energy scans of ξ2 (Figure 411) of TA and FA are very similar
The decrease in the torsion angle from 180deg strainedmdashand eventually brokemdashthe
intramolecular H-bond between the carbonyl group and N-H This H-bond strain accounts
for the huge energy penalty observed when this torsion angle changed Therefore
torsion was kept rigid during the search for hypothetical crystal structures even as the
torsion was optimized within the crystal structures to enable an accurate evaluation of the
balance between intermolecular and intramolecular energy in step 3 (section 423)
Chapters 5 and 6 present a more thorough investigation of the conformational energy
scans of fenamates
43 Results
93
433 CSD Survey of Fenamates The conformational potential energy surfaces of isolated TA and FA molecules (Figure
412a) were similar for a wide range of conformations around those found in experimental
structures (Figure 42) but were different as the bulky methyl substituent of TA
approached the benzoic acid ring (Figure 412a) For FA the energy penalty for
conformational changeEintra was less than 6 kJ mol-1 for a complete rotation of the
phenyl ring whereas for TA there was a conformational region that was far too high in
energy to occur in crystal structures The observed conformations of FA and TA in their
crystal structures corresponded to low-energy isolated molecule conformations (Figure
412a) with a relative intramolecular energyEintra of less than 3 kJ mol-1 The
conformational profile for TA was in qualitative agreement with that calculated by other
high-quality ab initio methods (see MP2 and B3LYP in Figure 410) but the profile was
quantitatively affected by the subtle balance between intramolecular dispersion and
intramolecular basis set superposition error60 Other studies have also suggested that the
barriers to conformational change would be lower in solvents from calculations in a
dielectric continuum simulating CCl4 and methanol211
The crystal structures in the CSD that contain the search criterion of Figure 47 also
show the same preference for the lower energy conformations That is the distribution
maxima coincide with the conformational minima (Figure 412b c) with very few
structures having the two rings near coplanar or perpendicular (ξ1=0 90) around the local
maxima in the conformational energy scans For the Y=H search because both ortho
substituents were hydrogen atoms two torsion angle values arose per conformation in a
crystal structure (one value between 0 and 90 and the second value between 90 and
180) giving a symmetric plot (Figure 412b) For YH on the other hand each structure
had only one torsion angle value and an asymmetric distribution (Figure 412c) reflecting
the steric hindrance of the ortho substituent
43 Results
94
Figure 412 The relaxed conformational energy scan of FA and TA as a function of ξ1 at
the PBE06-31+G(d) level of theory (a) Includes the experimental values of ξ1 marked
for TA and FA with the symmetry equivalent FA conformations denoted by open black
squares and an insert diagram showing the steric hindrance for TA in the high-energy
region A histogram of (b) 131 crystal structures found in the CSD search (Figure 47)
with Y=H plus symmetry equivalent structures and (c) 94 crystal structures with YneH
(b)
(c)
(a)
43 Results
95
434 Validation of the CrystalOptimizer plus PCM Models The computational model (steps 3 and 4 of section 423) is able to reproduce all ordered
crystal structures satisfactorily as minima in the lattice energy (Table 43) with these
static 0 K structures overlaying the finite temperature crystal structures with similar
accuracy The range of lattice energies is less than 2 kJ mol-1 consistent with both the
small energy range expected for polymorphs and with the thermodynamic data (Table
41) Form I is the most stable at 0 K in disagreement with the monotropic relationship
between forms I and II as determined by DSC measurements199201 and other data (section
412) Forms III and IV are metastable and very close in energy to form II Of the three
form V Z=2 ordered model crystal structures two have a nearby lattice energy minimum
Because all are quite high in energy the disordered structure is likely to be more complex
than a combination of these structures However a full symmetry adapted ensemble study
of a large supercell143212 would not be appropriate without more detailed experimental
studies
Table 43 Comparison of the lattice energy minimum with the experimental structure
used as a starting point for the final lattice energy model (PBE06-31+G(d) PCM) for
the ordered structures of FA and TA The three form V Z=2 model structures derived
from the disorder components of TA (section 415) are also compared with the starting
model RMSDn corresponds to n=15 unless (n) is given
Space
Group
ρ
gcm-
3
Elatt
kJ mol-1
a b c
Aring
α β γ
deg
RMSDn
Aring
FA
Expt P-1 133 808 9811404 8596 8864 7345
Opt P-1 134 -13663 848 9911333 9094 8816 7130 046
TA
Expt I P21c 144 4833213 804 900010488 9000
Opt I P21c 139 -14724 4863154 832 900010200 9000 033
Expt II P21n 145 38422001421 9000 9411 9000
Opt II P21n 141 -14521 38622061460 9000 9621 9000 026
Expt III P21c 144 76411312807 9000 9303 9000
Opt III P21c 139 -14555 78311642748 9000 9332 9000 030
Expt IV P-1 144 75214331759 10368 9825 9304
Opt IV P-1 138 -14514 76514001828 10256 9932 9152 037(14)Dagger
Expt V P-1 144 765 902 942 10740 920610166
Opt V_a P-1 138 -13954 767 919 961 10756 939910087 021
Opt V_b P-1 137 -14177 6781077 897 9275 850310348 089(6)
Opt V_c P-1 139 -14437 768 928 949 10695 925110249 019
DaggerThe Expt and Opt IV crystal structures overlaid 14 out of 15 molecules
43 Results
96
It is clear from Table 43 that the lattice energy minimization of the ordered structures
V_a and V_c produces a fairly small change in the cell constants but the nearest
minimum to V_b is rather different probably because the initial structure contained a
close ClmiddotmiddotmiddotCl contact These ordered structures correspond to the most stable of three
models of form V All three structures have a lattice energy that is 6-8 kJ mol-1 above
form I and so these ordered models of form V are not competitive in energy with the
other known polymorphs of TA
435 Energy Landscapes of Intermediate Steps
Figure 413 Crystal energy landscape of TA for the Z´=1 structure after (a)
CrystalPredictor (Step 1) (b) the single conformer calculation of Eintra and the atomic
multipoles at the PBE06-31G(dp) level of theory (Step 2 of section 423)
(a)
(b)
43 Results
97
I refined the lattice energy calculation in stages and systematically reduced the number
of crystal structures as my confidence in the energy ranking increased After conducting
single-point calculations to get accurate Eintra and distributed multipoles (which
improved the Uelec and thus the Uinter see equation 41) on all of the unique crystal
structures (step 2 of section 423) the gap between the known forms (I and II of TA) and
the global minima reduced from 40 kJ mol-1 to 6 kJ mol-1 (Figure 413) This intermediate
step was vital in reducing the computing time of the subsequent step 3 (section 423
only about 100 crystal structures were refined) due to the increased confidence in ranking
of the known forms (Figure 413)
436 Finding and Explaining the Known Structures with CSP The known forms of FA and TA were at or close to the global minimum on the final
crystal energy landscapes (Figure 414) which generated all the known Z´=1 ordered
polymorphs The crystal energy landscapes of FA and TA were similar in that they each
had an energy gap of approximately 2 kJ mol-1 between the global minimum cluster and
the other structures although the cluster of low-energy structures was far larger for TA
Although this difference suggested that TA would be more polymorphic than FA I
compared the structures to see whether it was plausible that TA and FA could crystallize
as distinct polymorphs allowing for thermal motion at crystallization temperatures
All the crystal structures of FA and TA whose energies were plotted in Figure 414 (and
tabulated in Table 44 and Table 45) contain the carboxylic acid dimer (Figure 44a)
However the orientation of the phenyl substituents could differ so markedly that this
dimer did not always satisfy the distance criterion to be overlaid by the default Crystal
Packing Similarity comparison This observation suggests that these structures on the
final energy landscape for FA and TA differ by the packing of the aromatic rings It was
necessary to perform a qualitative assessment of the barriers that prevented the
rearrangement of the molecules into a more stable form
The lowest-energy hypothetical structure on the crystal energy landscape for FA was a
Z´=1 structure (1FA_22) that was very similar in density and lattice energy to the only
known experimental Z´=2 form (Figure 414a) with a PXRD similarity of 085 This
1FA_22 hypothetical crystal structure overlaid 5 molecules (Figure 415a) with the
experimental form and it matched the conformation of one of the independent molecules
(Figure 415b) The difference between these two structures lay in the packing of the
layers a difference that is seen in many polymorphs such as progesterone213
43 Results
98
Figure 414 The crystal energy landscapes of FA (top) and TA (bottom) Each symbol
represents a crystal structure of the specified space group which is a minimum in the
lattice energy (calculated within the polarizable continuum) The open symbols
correspond to the minima starting from the experimental structures (Table 43) The
packing coefficient is the proportion of the cell volume occupied by the molecule214
calculated using a grid spacing of 01 Aring
43 Results
99
Table 44 The lattice energy minima of FA shown in Figure 414a The minimum found
starting from the experimental structure is in bold
Label Space
Group a b c
Aring
α β γ
deg
ρ
g cm-3
Uinter ΔEintra Elatt
kJ mol-1
1FA_22 P21c 868 4682709 9000 7404 9000 134 -13765 137-13628
QQQBTY02 P-1 848 9911333 9094 8816 7130 134 -13920 316-13599
2FA_2 P-1 454 9271493 6910 9201 6858 132 -13483 152-13331
3FA_59 P21c 457 8802695 9000 9956 9000 132 -13381 113-13269
4FA_1 P21c 451 8992682 9000 7877 9000 133 -13435 175-13260
5FA_10 P21c 4582686 880 9000 8526 9000 131 -13350 144-13206
6FA_151 P-1 1285 744 666 66291027411127 131 -13418 221-13197
7FA_4 P21c 1788 5341283 9000 6136 9000 132 -145121363-13149
8FA_16 P21n 1395 5201508 9000 7809 9000 132 -145051361-13144
9FA_287 P21n 1429 4591770 9000 7060 9000 129 -13279 240-13039
10FA_192 P21c 46019181231 9000 9792 9000 132 -13641 636-13005
11FA_19 P21c 50121791004 9000 7377 9000 135 -143771419-12958
12FA_23 P21c 6443425 653 900013152 9000 131 -13855 917-12938
13FA_2880 P21n 1490 4931456 9000 8825 9000 133 -13666 791-12875
14FA_33 P21c 4302600 997 900010250 9000 130 -13039 166-12873
15FA_18 P-1 870 799 935 105831022011301 132 -13040 187-12853
16FA_5226 P-1 10211325 990 1410911696 4347 127 -13013 186-12827
17FA_484 C2c 3864 897 750 9000 5874 9000 128 -12962 155-12807
18FA_7 P-1 4991113 995 844610467 9266 133 -141671409-12758
Table 45 The lattice energy minima of TA shown in Figure 414b Minima found starting
from the experimental structures or ordered models are in bold
Label Space
Group a b c
Aring
α β γ
deg
ρ
g cm-3
Uinter ΔEintra Elatt
kJ mol-1
FORM I P21c 4863154 832 900010200 9000 139 -14874150-14724
1TA_8 P21c 4853160 833 9000 7787 9000 139 -14865148-14717
2TA_15 P-1 1772 847 484 79491123711171 140 -14832163-14669
3TA_876 P-1 1698 744 734 9440 9376 4181 141 -14952357-14595
4TA_6243 P-1 12061015 871 7176 617011737 142 -14774196-14579
FORM III P21c 78311642748 9000 9332 9000 139 -14853298-14555
FORM II P21n 38622061460 9000 9621 9000 141 -14784263-14521
5TA_38 P21n 38622051460 9000 8376 9000 141 -14781263-14518
FORM IV P-1 76514001828 10256 9932 9152 138 -14773259-14514
6TA_82 P21c 39014332374 9000 6805 9000 141 -14611234-14377
FORM V_b P-1 6781077 897 9275 850310348 137 -14505328-14177
FORM V_c P-1 768 928 949 10695 925110249 139 -14437313-14124
FORM V_a P-1 767 919 961 10756 939910087 138 -14219265-13954
7TA_45 P-1 14441231 385 10950 8330 7631 142 -14171263-13908
8TA_88 C2c 2697 4792067 900010567 9000 135 -14113218-13895
9TA_64 P-1 756 900 986 753110145 8029 141 -14744889-13855
10TA_153 P21c 49212392217 9000 7574 9000 133 -13951196-13755
11TA_80 P2n 1492 3982150 9000 7536 9000 141 -13910180-13730
12TA_3630 P21c 1655 3842338 9000 5714 9000 139 -13930222-13708
43 Results
100
Figure 415 (a) Overlay of the only known form of FA (grey) and the most stable
structure on the Z´=1 crystal energy landscape (Figure 414a) 1FA_22 (green) with an
RMSD5 value of 175Aring (b) Overlay of the conformers of form I (pink and light blue) and
1FA_22 (black)
A significant energy gap was observed between the experimental and lowest energy
Z´=1 structure and the other structures generated for FA (Figure 414a) Remarkably this
gap was between two hypothetical structures that had a 12-molecule overlay and only
differed in the packing of the layers (Figure 414a) The lower-energy structure
(1FA_22) had more close contacts and a higher packing coefficient than the higher-
energy structure The second most stable hypothetical structure (2FA_2) was also
closely related to the experimental structure in it half of the molecules had changed the
phenyl torsion angle to a less stable conformation changing the stacking with the
phenyl ring in the neighbouring molecule to a herringbone215 (C-Hmiddotmiddotmiddot) interaction
(Figure 416bc) Thus there were two ways that the 2FA_2 structure could gain 2 kJ
mol-1 of stabilisation energy (Figure 416) The relationship between the two most stable
structures (1FA_22 and the experimental structure) means that it may be very difficult
to produce the Z´=1 structure as a polymorph Clearly Z´=1 and Z´=2 structures are very
close in energy and are related (via 2FA_2) It is therefore difficult to establish whether
the observed form is in fact a ldquocrystal on the wayrdquo216 that is trapped by a barrier from
rearranging into the Z´=1 form or whether the observed form is the more stable
structure217
(a) (b)
43 Results
101
Figure 416 (a) Overlay of the two most stable hypothetical crystal structures on the
crystal energy landscape global minimum 1FA_22 (grey) and 2FA_2 (green) with
ΔElatt=20 kJ mol-1 The crystal structures overlaid 12 molecules with RMSD12 of 051 Aring
and the conformations had an RMSD1 of 009 Aring (b) Overlay of 2FA_2 (green) and the
experimental crystal structure of FA (grey) with a RMSD15 of 123 Aring obtained with a
distance and angle tolerance of 50 and 50deg (c) Overlay of the two independent
molecules in the experimental structure (grey) with 2FA_2 (green)
For TA the crystal energy landscape successfully found the Z´=1 polymorphs forms
II and I to be the first and fifth most stable crystal structures within 2 kJ mol-1 of the
global minimum (Figure 414b) the landscape also provided a good reproduction of the
experimental crystal structures (Figure 417 and Table 43) Four other structures were
observed all of which were competitive in lattice energy with the known metastable
forms These crystal structures had somewhat similar packing to the known forms of TA
(Table 48) some being more similar to the form V Z=2 model structures constructed
from the disorder components of TA than to the other polymorphs (contrast Table 42 and
Table 48) Some of the similarities (Table 46) between the hypothetical structure and
the other fenamates in Table 41 were even more striking One of the computed structures
(a) (b)
(c)
43 Results
102
6TA_82 (highlighted in Table 45) matched 15 molecules of SURMOI (Table 41)
suggesting that crystals of this dimethyl-substituted molecule might template the
nucleation of a novel polymorph of TA This observation led to the joint experimental
and computational project discussed in section 438
Figure 417 The overlay of the experimental Z´=1 crystal structures (grey) of TA with
the closest structure found in the search (green) (a) Form I and 1TA_8 overlaid with an
RMSD15 value of 032Aring (b) Form II and 5TA_38 overlaid with an RMSD15 value of
026Aring
(b)
(a)
43 Results
103
437 Other Known Fenamates and their Hypothetical Structures Further marked similarities were observed between the structures on the crystal energy
landscapes of FA and TA (Figure 418) The hypothetical crystal structures on the crystal
energy landscape of FA in Figure 418 were similar to some of the known forms of TA
(forms I-IV) with some of these hypothetical crystal structures overlaying up to 13
molecules (forms I and III of TA Figure 418) Many of the low-energy structures of FA
had more in common with a polymorph of TA than with the only known form of FA that
is with a few exceptions the second numbers are greater than the first bold numbers
(Figure 418) There exist distinct crystal structures of FA with the planar molecules
(highlighted in Figure 418)
Figure 418 Classification of the crystal energy landscape of FA in terms of the similarity
of the structures to those of known TA polymorphs (I-IV) without PCM (hence the
different y-axis compared to Figure 414a) Numbers in bold indicate the number of
molecules that overlay with the known structure of FA Hence a label 5 6 on a structure
represented by a blue circle means that the structure overlaid 5 molecules with the
experimental form of FA but 6 with form I of TA Each point is coloured by the TA
polymorph with which it overlaid the greatest number n of molecules in a Crystal Packing
Similarity calculation that ignored the CH3 and Cl
The similarities between the known forms of TA and the hypothetically generated
structures of FA confirmed that because of the effect of TArsquos substituents (CH3 and Cl)
on the moleculesrsquo relative energies the energy landscape of TA was more polymorphic
than that of FA (Figure 414) The common clusters produced by the similarity overlays
between different fenamates usually had the differing substituents in the exterior region
43 Results
104
where there was no overlay of the coordinating molecule consistent with the substituents
causing the differences in the packing This in marked contrast to the large common
cluster between forms III and IV of TA (Figure 44c) where the packing of the aromatic
rings is similar
Table 46 Crystal Packing Similarity comparisons of the experimental structures of FA
and TA and their most stable hypothetical crystal structures with the crystal structures of
the other fenamates shown in Figure 13 The similarity is given in the form n(RMSDn)
with n gt 4 molecules highlighted
n(RMSDnAring)
FPAM- CA
FPAM- CA11
LAH- LOW
PEF- MET
PEF- NAQ
SUR- MEY
SUR- MOI
XYA- NAC
FA
QQQBTY02 2(071) 4(133) 7(084) 3(128) 6(062) 3(05) 3(12) 4(049)
1FA_22 2(041) 5(191) 6(131) 2(013) 11(096) 4(098) 4(108) 3(18)
2FA_2 2(043) 3(056) 7(101) 2(01) 11(051) 3(107) 7(098) 3(086)
TA
II 1(089) 2(015) 2(059) 2(011) 1(061) 2(012) 12(187) 2(029)
I 2(059) 2(048) 3(061) 1(07) 13(038) 6(178) 4(12) 2(062)
III 1(081) 7(075) 2(048) 13(033) 2(055) 13(061) 3(041) 13(045)
IV 2(087) 6(071) 3(109) 11(049) 2(046) 13(084) 3(056) 15(03)
V_a 2(057) 2(046) 5(042) 1(068) 3(039) 2(022) 2(018) 2(057)
V_b 2(075) 3(032) 7(064) 2(047) 4(110) 5(041) 4(119) 5(072)
V_c 2(095) 2(084) 5(041) 1(042) 4(110) 4(051) 2(029) 3(046)
2TA_15 2(052) 2(053) 3(091) 1(077) 14(04) 4(082) 4(122) 2(07)
3TA_876 1(093) 4(156) 7(142) 3(043) 1(066) 3(071) 4(047) 2(037)
4TA_6243 2(054) 3(115) 3(176) 1(069) 4(016) 4(149) 2(017) 3(091)
6TA_82 1(092) 2(017) 2(061) 2(012) 2(064) 2(008) 15(028) 2(028)
Some fenamate crystal structures are specific to the molecule One observed example
(Table 46) is the FPAMCA polymorph of flufenamic acid In 2012 through the use of
polymer-induced heteronucleation and solidndashsolid transformations flufenamic acid set a
new record18 for a polymorphic compound with eight solved structures which was
recently equalled by aripiprazole218 These fenamate structures are all based on the
carboxylic acid dimer with some having more similarity to the TA and FA low-energy
structures (Table 47) The specific substituents affect the range of packing of the aromatic
rings For example the low-energy unobserved structures of FA which are based on a
planar conformation of the entire molecule (Figure 414) are probably also specific to
FA because the lowest-energy crystal structure of TA with a planar molecule is 14 kJ
mol-1 above the global minimum structure The energy difference between crystal
structures of TA is caused by substituent intermolecular interactions that destabilize the
43 Results
105
structures containing planar molecules the intramolecular energy penalty Eintra for this
planar conformation is similar for FA and TA (6 kJ mol-1 Figure 412)
Table 47 An extension of Table 46 showing Crystal Packing Similarity comparisons of
the latest structures of flufenamic acid18 and the experimental structures of FA and TA
and their most stable hypothetical crystal structures
n(RMSDnAring)
FPAMCA_z
z=2 z=4 z=5 z=6 z=7 z=8
FA
QQQBTY02 5(149) 3(079) 2(073) 4(160) 2(043) 3(082)
1FA_22 4(162) 5(142) 2(105) 5(202) 2(022) 2(026)
2FA_2 4(151) 4(034) 3(119) 5(080) 2(021) 3(130)
TA
II 2(010) 2(016) 2(04) 2(017) 1(071) 2(081)
I 3(158) 2(054) 2(069) 4(210) 2(034) 2(041)
III 2(022) 2(024) 4(052) 2(025) 1(064) 2(077)
IV 2(020) 2(023) 4(168) 3(084) 2(064) 2(070)
V_a 3(124) 2(048) 2(064) 2(050) 3(068) 3(080)
V_b 5(054) 3(067) 2(045) 3(063) 1(059) 2(078)
V_c 2(085) 2(041) 2(079) 2(042) 2(077) 3(127)
2TA_15 4(304) 2(080) 2(017) 2(062) 3(042) 4(280)
3TA_876 4(134) 2(018) 4(210) 2(019) 1(076) 2(082)
4TA_6243 4(110) 2(058) 2(040) 2(060) 2(031) 2(038)
6TA_82 2(018) 2(019) 2(025) 2(020) 1(073) 2(081)
Table 48 Crystal Packing Similarity calculations of the known forms of TA and
unobserved thermodynamically competitive crystal structures The similarity between
the structures is given in the form n(RMSDn) where n is the number of molecules overlaid
and the value in brackets is the RMSDn overlay Structures with the highest similarity are
highlighted
n(RMSDnAring)
2TA_15 3TA_876 4TA_6243 6TA_82
KAXXAI 1(095) 4(033) 1(088) 9(043)
KAXXAI01 1(049) 1(096) 5(132) 1(090)
KAXXAI02 2(087) 3(108) 2(095) 3(059)
KAXXAI03 2(083) 3(081) 3(255) 3(081)
KAXXAI04_a 4(125) 1(092) 3(016) 1(086)
KAXXAI04_b 4(128) 3(092) 6(107) 2(069)
KAXXAI04_c 1(013) 2(120) 4(105) 1(059)
438 Update on a Recently Discovered Polymorph of TA Section 436 theorized that experimentalists could nucleate a novel polymorph of TA
by using the SURMOI molecule as a template However my colleague at UCL used
mefenamic acid (Figure 13) because SURMOI is very expensive A novel polymorph of
TA was nucleated by solution evaporation after dissolving TA (form I) in ethanol and
43 Results
106
seeding it with mefenamic acid (form I)219 This procedure resulted in the nucleation of
form VI of TA which was disordered (65 and 35) with same unit cells as form I of
mefenamic acid
Although the major component of this novel form VI was generated in step 1
137_TA the form was not among the structures on the final energy landscape of Figure
414b The major component of form VI and 137_TA overlaid 15 molecules with a
RMSD15 value of 030 Aring (Figure 419) This structure 137_TA had a final lattice energy
of -14497 kJ mol-1 which was competitive with form IV of TA (Table 45 -14514 kJ
mol-1) It should be noted that steps 3 and 4 of CSP (section 423) involved just over 100
crystal structures Clearly lattice energy refinements (steps 3 and 4 section 423) of
more hypothetical crystal structures are vital
Figure 419 Overlay of FA_137 (green) and the major component of experimental
crystal structure of TA form VI (grey) with a RMSD15 of 030 Aring obtained with a distance
and angle tolerance of 50 and 50deg
439 The Cost of Lattice Energy Minimisation The lattice energy minimization (CrystalOptimizer step 3) of one crystal structure
accounted for as much as 75 of the computing time and took as long as 4 days (Figure
420a) because multiple ab initio calculations were required to balance Uinter and Eintra
The computing time was approximately half as long for the optimisation of the last
structure (form VI of TA Figure 420b) This last optimisation (Figure 420b) was faster
44 Summary
107
because there were about hundred structures stored in the Local Approximation Models
(LAMs)71 database (LAMs71 database stores and reuses conformational energy and
multipole representations of the charge density) This final calculation was performed
after the discovery of a novel polymorph of TA as discussed in section 438 Even with
the help of LAMs71 database the computational cost was still very high
Figure 420 CPU timings of (a) 38_TA (form II) and (b) 137_TA (form VI section
438) after lattice energy minimisation using CrystalOptimizer (step 3)
44 Summary This chapter described the successful use of the CSP method (see Chapter 3) to examine
the computer-generated low-energy crystal structures of the unsubstituted structural
fragment FA and a derivative TA This chapter showed that all structures were based
on the same 11987722(8) H-bonded dimer and that the structures differed only in the packing
of the phenyl rings The crystal energy landscape of TA had several crystal structures
including the observed polymorphs which were tightly clustered around the global
minimum whereas the corresponding cluster for FA contained only the observed and a
closely related structure This observation is supported by past experiments
Many of the crystal structures on the energy landscape for FA overlaid a significant
portion of the coordination environment with other observed or calculated structures
Therefore the phenyl ring substituents determined the relative energies of the crystal
structures and hence whether a specific fenamate would be very polymorphic or not The
FA fragment can be described as a polymorphophore despite only two structures
clustered around the global minimum since the molecular fragment packed in a wide
range of distinct crystal structures with different conformations that were energetically
favourable This finding indicates that being a polymorphophore correlates with but does
(a)
(b)
44 Summary
108
not guarantee polymorphism It is perhaps not surprising that this term has not been more
widely accepted
The similarities between the structures on the final energy landscapes of TA and other
fenamates led my colleague to conduct a templating experiment on TA (section 438)
The subsequent discovery of a new polymorph of TA (form VI section 438) exemplified
one problem with the CSP discussed earlier Restricting the number of crystal structures
that were accurately optimised (step 3 CrystalOptimizer) to just over 100 structures
meant excluding the recently discovered crystal structure of TA (section 438) from the
final crystal energy landscape (Figure 414b) As a result current intermediate steps like
the single-point calculations used in this chapter (step 2) although successful (section
435) had their limitations
The findings of Chapters 3 and 4 indicate the need for a cheaper and more accurate
approach to modelling lattice energy If the evaluation of Eintra (the bulk of computer
time section 439) can be realized through a less expensive method (Chapter 6) then
molecular dynamics calculations and the temperature effects (eg free energies) can be
better accounted for However we must first understand the origin of intramolecular
forces and energies (Chapter 5)
51 Introduction
109
Chapter 5 The Origin of conformational energy barriers in Fenamates
ldquohelliplsquoBegin at the beginningrsquo the King said gravely lsquoand go on till you come to the
end then stoprsquohelliprdquo
mdash Lewis Carroll Alice in Wonderland
51 Introduction
511 Background Chapters 3 and 4 established that lattice energy Elatt could be partitioned into
intermolecular Uinter and intramolecular components Eintra
where Uinter is the sum of the dominant electrostatics Uelec plus the contributions of
repulsion-dispersion Urepul-disp and Eintra is the energy required to distort the molecule
from its gas phase conformation71 The conformation determines the overall molecular
shape so different conformers may lead the crystal to arrange itself in different ways
ultimately influencing the properties of the crystal220 (Chapter 1)
1
6
2
1
9
1
1
813
7
16
Figure 51 The fenamate family showing the low barrier torsion angle (=C7-N1-C8-C9)
=0 when the aromatic rings are coplanar as drawn The fenamates family mentioned in
this chapter includes fenamic acid (FA) R1= R2= H tolfenamic acid (TA) R1= CH3 R2=
Cl mefenamic acid (MA) R1= R2= CH3 clofenamic acid (ClFA) R1=H R2=Cl and
flufenamic aid (FFA) R1=H R2=CF3 The dotted line represents an intramolecular
hydrogen bond
This chapter will investigate the conformational flexibility of fenamate molecules in
isolation Through this investigation we will come to a better understanding of the origin
of torsional barriers which will enable the derivation of an analytical model for the
intramolecular energies of the fenamate molecules FA and TA (Chapter 6) To put this
problem in context there is still an ongoing debate about the origin of the torsional barrier
of the ethane molecule which has only 8 atoms as compared to the 27 and 30 atoms of
FA and TA respectively
Elatt = Uinter + Eintra 51
51 Introduction
110
512 Torsional Barrier for Ethane The torsional barrier is defined as the difference in energy between the least stable and
the most stable conformations in rotation around a bond In order for one full rotation
around a bond to occur this energy barrier must be overcome (Figure 52) The energy
barrier for fenamic acid FA is smaller (Chapter 4) than ethane (Figure 53)
Figure 52 Illustration of the barrier to rotation with the relaxed conformational energy
profile of FA
Previous studies of torsional barriers have focussed on small molecules such as ethane
The torsional barrier for the ethane molecule is one of the most fundamental puzzles in
conformational analysis and researchers have great interest in understanding its origin221
The experimental (1203 to 1225 kJ mol-1) and quantum mechanical (1124 to 1303 kJ
mol-1) calculations of ethanersquos torsional barrier are in good agreement (Table 51)
However researchers disagree upon the origin of the torsional barrier in ethane The
root of the controversy is whether the origin of the torsional barrier in ethane results from
stronger hyperconjugation stabilization222 in the staggered conformation (Figure 53) than
the eclipsed form or whether the barrier originates from greater steric repulsion221 in the
eclipsed conformation (Figure 53) due to electrostatic interaction and Pauli exchange
repulsion Three physical factors may play a role in ethanersquos structural preference
hyperconjugation electrostatic interactions and exchange interactions
51 Introduction
111
Figure 53 The staggered and eclipsed conformations of the ethane molecule (Sources
Ref [222] and enwikipediaorgwikiAlkane_stereochemistry [Accessed 11012015])
Table 51 Torsional barrier height of ethane (Source Reproduced from Ref [223])
Hyperconjugation and exchange repulsion are quantum mechanical effects arising from
orbital overlap The hyperconjugation effect for the ethane molecule is constituted of the
vicinal interactions between the occupied CH bond orbitals of one of the methyl group
and the virtual antibonding CH orbitals of the other methyl group221 The staggered
51 Introduction
112
conformation (Figure 54a) is stabilised through the delocalization of electron charge
density involving these orbitals an attractive contribution
Pophristic and Goodman222 used natural bond orbitals (NBOs) to argue that
hyperconjugation or stabilization of the staggered ethane conformation is the origin of
the barrier to rotation in ethane By showing that if the CH-CH hyperconjugative
interactions were removed and by adding electrons to the unoccupied CH virtual
orbital the steric repulsion favoured the less stable eclipsed conformation (Figure 53)
This model of hyperconjugation interactions relies on NBOs and is not so obvious if
molecular orbitals (MOs) are used let alone if correlated wave functions are used
(a) (b)
Figure 54 (a) Hyperconjugation effects on the staggered (b) Pauli exchange repulsion
in the eclipsed conformation (Source enwikipediaorgwikiHyperconjugation
[Accessed 11012015])
Pauli exchange repulsion which requires that pairs of electrons do not occupy the same
spatial region occurs in the eclipsed conformation (Figure 54b) Electrostatic (Figure
55 also see section 223) repulsion involves the classical R-1 repulsion between charges
At short distances the 1-4 (third nearest neighbour) interactions still have an electrostatic
effect but there are also considerable penetration-effects (section 225) The Pauli
exchange and electrostatic repulsion frequently regarded as the steric factor destabilise
the eclipsed conformation of ethane These interactions are the same as intermolecular
interactions but at shorter distances
51 Introduction
113
Figure 55 Electrostatic steric repulsion (between electrons on the bond black arrow) for
the eclipsed conformation of ethane The red arrow indicates exclusion of van der Waals
repulsion since the van der Waals radii of the hydrogen are too small to make contact
(Source enwikipediaorgwikiConformational_isomerism [Accessed 11012015])
Mo and Gao221 made three arguments in favour of steric repulsion being the origin of
the barrier to rotation One argument was that hyperconjugation is a second-order effect
and hence should have little or no direct role in restricting free rotation224 Second these
researchers argued that overestimation of the hyperconjugative effects led others to
misidentify hyperconjugation as the origin of the rotation barrier Third Mo and Gao
argued that the experimental work on heats of hydrogenation for propene supported a
specific energy decomposition scheme225 In short the researchers argued that their three
points supported the claim that steric repulsion is the origin of the torsional barrier
The origin of the torsional barrier remains controversial226 even for a small molecule
such as ethane The question remains Is the torsion defined by the origin
hyperconjugation221222 or by a similar electronic effect from changes in MOs on the
atoms Or is the barrier equivalent to intermolecular non-bonded repulsion and
electrostatic effects227 at short distances ie as though there were no single covalent
bond The quantitative distinction can be highly dependent upon the precise definitions
and upon the type of charge density calculation that is used
513 Overview The conformational energy barrier of FA (622 kJ mol-1) is smaller than that of the
ethane molecule (123 kJ mol-1) The goal of this chapter is to investigate the qualitative
origin of the conformational barrier to rotation for fenamate molecules in isolation First
I will investigate the effects that different definitions of the same flexible bond have on
the calculated conformational profile of TA The step size of torsion angles various ab
initio methods and relaxation effects will be investigated for various fenamates (Figure
51) Following this I will investigate the electronic contributions using constrained
model molecules that avoid pyramidization (Figure 57) with minimal or no steric effects
Finally an exp-6 atom-atom model which contains both a repulsive and a dispersive part
will be used to investigate the steric effect of FA and TA
52 Method
114
This chapter will show that the barrier to rotation for FA and TA (Figure 51) depends
significantly upon small correlated changes in the entire molecule rather than on the
atomic position of the atoms that define the rotating torsion It will also show that there
is an intrinsic dispersion and electronic energy barrier when the aromatic rings are
perpendicular to one another the barrier to rotation for small model molecules can be
represented by a simple cos2 term
52 Method In section 431 it was established that the PBE06-31+G(d) level of theory is the best
compromise between the cheap but inaccurate HF method and the expensive but accurate
MP2 method for calculating the packing (intermolecular) and conformational
(intermolecular) energies (equation 51) of FA and TA This chapter examines the ab
initio conformational profiles of fenamate molecules in more detail All the ab initio
calculations reported in this chapter were performed using GAUSSIAN0353
521 Determining Conformation Energy Scan for Isolated Molecule
For TA there are 4 definitions of the N1-C8 rotatable bond (Figure 51) (1) = C7-N1-
C8-C9 (2) 2= C7-N1-C8-C13 (3) 3= H6-N1-C8-C9 and (4) 4= H6-N1-C8-C13 The effects
of these different definitions upon the conformational profile of TA were investigated
using the PBE06-31+G(d) level of theory Preliminary relaxed conformation energy
scans were also performed on FA using 2 and 1 step sizes around the maxima and
minima (section 431) respectively at the same level of theory in order to investigate the
origin of the slight asymmetry in FA
522 Ab initio Conformational Energy Profiles for Fenamates To test the sensitivity to method of the different fenamate moleculesrsquo conformational
profiles (Figure 51) I carried out a relaxed scan at the HF6-31+G(d) level of theory as
well as single-point energy calculations at the MP26-31+G(d) level of theory on the
optimized PBE06-31+G(d) conformations The PBE06-31+G(d) energies were then
revaluated within a polarizable continuum model (PCM)180 with dielectric continuum
value of 3 a typical dielectric environment of organic crystals PCM has been shown to
help the relative energy ranking of some conformational polymorphs (Chapter 4)131
The primary aim of this research was not to seek a definitive ab initio conformational
profile for all molecules as this would have been beyond the capability of the available
computational resources Indeed many studies have emphasized the difficulty in
evaluating the relative energies of fenamate polymorphs184211228 Instead the objective
52 Method
115
of this chapter is to present qualitatively correct scans that can be compared among the
fenamate molecules
523 Investigation of Electronic Effects In an attempt to distinguish the steric effects from the electronic effects I studied a
series of model molecules where the steric effects had been minimized (Figure 56)
12
9
1 813
6
Figure 56 Chemical diagram of model molecules used to investigate the electronic
contributions The bonds around N1 are constrained to be planar (ie R2-N1-H6-C8=180deg)
for phenylamine (PA) R1=R2=H N-methylaniline R1=H R2= CH3 N-vinylaniline R1=H
R2 = CH=CH2 and 3-anilinoprop-2-enoic acid R1=H R2 = CH=CHCO2H for 3-
chloroaniline R1= Cl R2=H and 3-methylaniline R1=CH3 R2=H (=R2-N1-C8-C9)
The benzoic acid group was replaced by a series of smaller molecular fragments (Figure
56) for example a hydrogen atom The three bonds to the nitrogen atoms were
constrained to be planar by fixing the torsion involving these atoms (eg H7-N1-H6-
C8=180deg for PA) This constraint prevents the normal pyramidalization at the nitrogen in
the torsional potential of phenylamine227 (Figure 57) or the major rearrangement of the
second hydrogen that occurs in a relaxed scan of H7-N1-C8-C9
Figure 57 Pyramidalization in unconstrained phenylamine (PA) molecule caused by
lone pair on nitrogen atom
The difference in electronic structure with torsion angle was estimated by using the
lowest occupied molecular orbital (ie the highest occupied molecular orbital (HOMO)-
n where n is an integer) and HOMO electron density for the PA model FA and TA For
52 Method
116
selected constrained (fixed ) conformations in the PBE06-31+G(d) scan a single-point
calculation with GAUSSIAN03 was used to generate a density file which was then used
to produce the molecular orbitals (MOs) isovalue surfaces of 002 au The graphical
interface used was GaussView 5229
524 Investigation of the Steric (Non-Bonded) Effects Within organic molecules that are typically used in pharmaceuticals many of the atom-
atom distances are similar to intermolecular distances although some are considerably
shorter The intramolecular steric interactions can be represented as the exp-6 atom-atom
intermolecular parameters which were derived by fitting to crystal structures and heats
of sublimation of hydrocarbons oxahydrocarbons azahydrocarbons chlorohydrocarbons
and nitro compounds42 This provides the parameters for all intramolecular interactions
involving C N O Cl and H but the same parameters are used for all C and H atoms
whether aromatic or in the methyl or carboxylic acid groups which is an approximation
to the most force field eg Sybyl typing230 This approximation is better justified for FA
than for TA (Figure 51) because of the importance of distinguishing C in different
chemical environments That is the chemical environment of aromatic C is different from
that of methyl C There is a polar hydrogen type HB which was used for both polar
hydrogens (H1 and H6 in Figure 51) because the intramolecular energy is expected to be
insensitive to the interactions of the carboxylic acid group
Table 52 Gavezzottirsquos exp-6 atom-atom parameters E=Aexp(-BR)-CR-6 is the well
depth and Rm is the distance at the minimum41231232 Italics represent the hydrogen-
bonded interactions aFrom the UNI intermolecular potential function of Mercury233
Interactions AkJ mol-1 BAring-1 CkJ mol-1Aring-6 kJ mol-1 RmAring
H∙∙∙H 241584 401 1092 004 336
H∙∙∙C 1207921 410 4728 021 329
H∙∙∙N 2282790 452 5021 039 299
H∙∙∙O 2954322 482 4393 051 280
H∙∙∙Cl 2929637 409 11673 050 330
C∙∙∙C 2261452 347 24184 039 389
C∙∙∙N 4914945 386 27907 084 350
C∙∙∙O 3930868 374 26819 067 361
C∙∙∙Cl 3906601 352 38618 067 383
N∙∙∙O 2685710 386 15230 046 350
O∙∙∙O 1953091 374 13347 033 361
O∙∙∙Cl 3382973 363 27824 058 372
HB∙∙∙O (acids) 264163953 875 8577 2929 160
HB∙∙∙N (-NH∙∙∙OH) 238673400a 778a 15774a 2661 180
53 Results
117
The Gavezzotti parameters used for FA and TA are given in Table 52 Although exp-
6 does not model the electrostatic contributions explicitly some of the parameters have
absorbed some electrostatic contributions during the fitting process The energies were
partitioned into repulsion (Aexp(-BR)) and dispersion (-CR6) contributions
The extension of the exp-6 parameterization to hydrogen bonding interactions required
potentials with a particularly deep well at the short hydrogen bonding distances to absorb
the electrostatic interactions in hydrogen bonding231 The polar hydrogens were assumed
not to have significant intermolecular interactions with any atoms other than the hydrogen
bond acceptor interactions which is a reasonable assumption for intermolecular
interactions The parameters for the H∙∙∙HB and C∙∙∙HB that were not determined by
Gavezzotti may be important
Interactions that are three atoms or more apart from each other (ie 1-4 and above) were
then investigated The longest bond path for FA and TA is 1-11 The atom∙∙∙atom
interactions that dominated the intramolecular contributions were analysed with the exp-
6 potential For each fenamate molecule interactions were classed as dominant if the
difference between the minimum and maximum total energy (Erepul-dis) of the conformers
was greater than or equal to 1 kJ mol-1 It is expected that some interactions in FA and
TA will vary with conformations however a few interactions will have constant
contribution (eg HB∙∙∙O (acid) an important intramolecular H-bond) The interactions
with constant contributions are not classed as dominant interactions
53 Results
531 Effect of Different Definitions of the Same Flexible Bond The N1-C8 rotatable bond can be defined in four ways C7-N1-C8-C9 C7-N1-C8-C13 H6-
N1-C8-C9 and H6-N1-C8-C13 (Figure 51) The conformational energy profile of TA
(Figure 58) is sensitive to the atoms used in defining the N1-C8 rotatable bond For
example the intramolecular energy penalty at ξ= 0deg for the C7 torsions (=C7-N1-C8-C9
and 2=C7-N1-C8-C13) are approximately half that of the H6 torsions (3=H6-N1-C8-C9 and
4=H6-N1-C8-C13) (Figure 58) The relaxation of the hydrogen atom (H6) was clearly
playing a vital role in stabilizing the molecular conformation at ξ= 0deg There were some
differences in intramolecular energy penalties as approached 180deg for the C7 torsions (
and 2 in Figure 58)
53 Results
118
Figure 58 Relaxed scan of TA at the PBE06-31+G(d) level of theory with the different
definitions of flexible N1-C8 bond (= C7-N1-C8-C9 2= C7-N1-C8-C13
3=H6-N1-C8-C9
and 4= H6-N1-C8-C13) used as the constrained geometric parameter
The torsional barriers for TA are sensitive to the atoms used in defining the N1-C8
rotatable bond (Table 53) The C7 torsional barriers (Group 2 of Table 53) are larger
than the H6 torsional barriers (Group 2 of Table 53) For the C7 torsions the H6 proton
relaxes to maintain the intramolecular H-bond while for the H6 torsions the benzoic acid
(including the C7 atom) deviates minimally to prevent deformation of aromatic ring and
form better pyramidalization (Figure 57) at N1 for TA These results show that the
torsional barrier and conformational energy profile of TA (Figure 58 and Table 53)
depend upon the selected 4 atoms that define the flexible torsion
Table 54 shows no correlation between shorter (stronger) intramolecular H-bond
distances and smaller energy penalties However a closer inspection of the atom-atom
distances between the H atom of the secondary amine and the H atom of the methyl group
(Group 1 of Table 55) suggest that steric hindrance also contributes to the intramolecular
energy because conformations with higher energy penalties correlate with shorter atom-
atom distances
53 Results
119
Table 53 Torsional barrier height of the relaxed conformational energy profiles in Figure
58 for TA
Torsion Barrier Barrier relative to
kJ mol-1
Group 1 3585 0 2 3572 -013
Group 2 3 2453 -1132
4 3148 -437
Table 54 Comparison of intramolecular energies and hydrogen bond distances of TA for
the near-planar conformer
Torsion N-H∙∙∙O=CAring ∆EintrakJ mol-1
Group 1
= 0deg 1850 706
2= 180deg 1847 648
Δ -0003 -058
Group 2 3= 180deg 1880 1574
4= 0deg 1881 1257
Δ 0001 -317
3(180)-(0) 0030 868
Table 55 Comparison of the intramolecular energies and the N-H7∙∙∙HX-C14 bond
distances of TA for the near-planar conformer where HX-C14 is the methyl group
Group 1 N-H7∙∙∙H10-C14 N-H7∙∙∙H11-C14 N-H7∙∙∙H12-C14
(Aring)
∆Eintra
kJ mol-1
= 0deg 3491 2284 2194 706 2= 180deg 3486 2272 2199 648
Δ -0005 -0012 0005 -058
Group 2
3= 180deg 3358 2135 2090 1574
4= 0deg 3386 2157 2117 1257
∆ 0028 0022 0027 -317
3(180)-(0) -0133 -0149 -0104 868
532 Effect of Step Size on the Conformation Profile of Fenamate Molecule Given that conformational profiles depend on small correlated changes in atomic
positions I investigated the effect of step size on the conformational profiles For FA the
conformation profile is unaffected by the small step size of 1 and 2 for the minima and
maximum respectively (compare Figure 510 with Figure 511) Over all possible
conformations of FA the barrier to rotation is approximately 6 kJ mol-1 (see Figure 510
and Figure 511)
Although the phenyl ring of FA is symmetric the rotation of this ring produces
asymmetry conformational profiles around the maximum and minima points (Figure
510) The slight asymmetry observed for the conformational profile of FA (Chapter 4) is
53 Results
120
therefore not due to the small step size These changes can be substantial for example
the two minima for FA scan at =3894deg and 14471deg (Figure 510) correspond to
conformations that differ by 061 Aring in the 1-4 distance between the amide proton and C13
(or C9) even though the minima only differ in energy by 188 x 10-3 kJ mol-1 (716 x 10-
7 au) Even the C8-C9 and C8-C13 aromatic bond lengths differ by 00037 Aring for =0 or
180deg but only by 00004 Aring for =80deg or 100deg with larger changes in the bonded
hydrogen positions for FA It is therefore clear that the molecular structure of the phenyl
ring is not perfectly symmetric (Figure 59) and that it changes with torsion
Figure 59 Molecular conformation of the relaxed gas phase at PBE06-31+G(d) showing
the bond lengths of the phenyl C-C bond (=180) of FA
For the definitive scans full optimization was performed near each symmetry-
independent potential minimum with a step size of Δ=5deg The highly repulsive points
for the substituted fenamates (TA and MA) were omitted due to the huge energy penalty
as approached 180deg (section 431 and Figure 58)
53 Results
121
Figure 510 Relaxed scans of FA at PBE06-31+G(d) with step sizes 2 and 1deg around the
maxima and minima respectively The red circles indicate the starting points of the scans
while the arrows indicate the directions of the scans
53 Results
122
533 Conformational Energy Profile of the Fenamates The conformational profile for four fenamate molecules (Figure 511) shows that there
are two distinct minima which are only close in energy for the symmetric FA and R2-
substituted ClFA (Figure 51) The ClFA molecule has one global minimum at 14838deg
in addition to the local minimum at 3586deg while FA has two global minima at 3894deg
and 14471deg (Figure 511) There is one potential maximum that varies slightly between
the molecules for the planar conformation (as drawn in Figure 51) there is a second
maximum when the aromatic rings are approximately perpendicular and there is a third
where there is a significant steric clash for the R1-substituted fenamates TA and MA as
the other planar conformation is approached An analysis of the observed values of this
torsion angle in experimental crystal structures containing the fenamate fragment shows
that the observed angles were clustered around the two minima (Chapter 4 Figure 412)
a finding that is consistent with the expectation that most molecules adopt low-energy
conformations in crystal structures208 Hence the two low-energy barriers although only
~5-9 kJ mol-1 clearly have a major effect on the crystal packing Indeed this
conformational energy is very significant it is large compared with most measured
polymorphic energy differences including those of TA which cover less than 2 kJ mol-1
(Chapter 4)
Figure 511 Relaxed conformational scans at the PBE06-31+G(d) level of theory for the
fenamates The minima were at ξ=3894deg and 14471deg for FA 4063deg and 11186deg for
TA 4408deg and 11048deg for MA and 3586deg and 14838deg for ClFA
53 Results
123
(a) (b)
(c) (d)
Figure 512 Relaxed conformational scans of fenamates (a) FA (b) TA (c) MA and (d)
ClFA at HF and PBE0 method with 6-31+G(d) basis set These are contrasted with the
single-point energies at the MP26-31+G(d) level and within a polarizable continuum
model (PCM) with =3 for the PBE06-31+G(d) conformations
By testing the sensitivity of this conformational profile to the choice of ab initio method
(Figure 512) it becomes clear that even obtaining a conformational profile that is in
qualitative agreement with the profile derived from experimental crystal structures is
sensitive to method The SCF scan has only one minimum as seen in Figure 512 at a
conformation that was not observed in the crystal structures of fenamates (section 433
Figure 412) If the CSP study of Chapter 4 were based on a SCF conformational profile
the crystal structures generated for FA and TA would have been qualitatively incorrect
Therefore it is essential that the ab initio methods include some description of the
electron correlation that produces a maximum at around 90deg Although there is moderate
agreement on the barriers to conformational change for TA and MA it is notable that
single-point MP2 calculations swap the relative energy positions of the two minima
(Figure 512) The PBE0 calculations are in better agreement with the analysis of the
53 Results
124
crystalline conformations of fenamate-like fragments with a substituent at C13 (Chapter
4)
The scans carried out within PCM with =3 showed a reduction in energy penalty
around the energy maxima (ξ~90deg) for all three fenamates (Figure 512) This reduction
is more pronounced for TA and MA around the local minima (ξ~110deg) than it is for FA
This finding suggests that the effect of solution or the crystalline environment the method
used for generating the final energy landscapes of FA and TA in Figure 414 of section
436 does not qualitatively change the conformational profile Hence the clustering of
observed torsion angles in fenamate crystal structures around the minima is not an artefact
of the neglect of the environment (Figure 412 in section 433) The results shown in
Figure 512 confirm that the definitive ab initio conformational profiles cannot be
obtained Nonetheless the scans in Figure 511 are adequate for the purposes of this study
534 Rigid Versus Relaxed Scans of Fenamates To establish the importance of changes in the other torsion angles bond angles and
bond lengths during the relaxed scans in Figure 511 the conformation scans were
repeated for the three fenamates starting with the fully optimized structure at the PBE06-
31+G(d) level of theory Only torsion angle was allowed to vary which meant that each
point had an identical conformation for all three ab initio methods (HF MP2 and PBE0)
The difference between rigid (solid lines in Figure 513) and relaxed (dotted line in Figure
513) scans was very marked for all the fenamates even in the lowest energy regions
where the changes in the benzoic acid ring and the intramolecular hydrogen bond were
small
53 Results
125
Figure 513 Comparison of relaxed (solid) and rigid (dotted line) scan of FA (top) TA
(middle) and MA (right) For the rigid scans calculations were performed using HF MP2
and PBE0 methods with 6-31+G(d) basis set as a function of torsion angle The relaxed
scans from Figure 511 were performed at the PBE06-31+G(d) level of theory
53 Results
126
0deg 80deg 110deg
Figure 514 Overlay of relaxed (coloured by element Figure 511) and rigid (red Figure
513) conformations of FA (top) TA (middle) and MA (bottom) overlaying the atoms
defining the ξ torsion angle at the PBE06-31+G(d) level of theory
Figure 514 shows a comparison of the rigid and relaxed conformations at the repulsive
barrier and the second minimum for FA TA and MA For TA the differences in the
relaxed and rigid scan conformations are very marked around the energy maxima (Figure
514 ξ=80deg) even though these maxima are less than 7 kJ mol-1 in the relaxed scans
(Figure 513) For FA there is a significant change in the relative orientation of the
benzoic acid group changing the internal hydrogen bond around all maxima The methyl
torsion is clearly playing a role in reducing the energy penalty around the 90deg maximum
for TA and MA (Figure 514) Indeed even for FA the changes in the other
conformational variables are vital to produce a low energy maximum at 90deg to the extent
that it is not surprising that even the relaxed scans differed in this region producing the
slight asymmetry between the two minima (Figure 511)
The contrast between the relaxed and rigid (Figure 513) scans and the corresponding
conformations (Figure 514) confirm that the changes in the other conformational
variables played a major role in lowering the conformational barriers providing low
values over a wide range of angles as implied by the crystallographic data (Chapter 4)
53 Results
127
535 Splitting electronic from steric contributions to the barrier to rotation
(a) (b)
(c) (d)
(e) (f)
Figure 515 The solid black lines show the relaxed torsional scans of planar-N-
constrained models for the phenyl rotation (Figure 56) where the benzoic acid group of
FA has been replaced by (a) hydrogen atom (PA) (b) methyl (c) vinyl and (d) prop-2-
enoic acid and the hydrogen in the meta position of PA has been replaced by (e) chlorine
and (f) methyl using HF PBE0 and MP2 methods with the 6-31+G(d) basis set Plots of
(h2)(1-cos(2)) where h is the height of the barrier of relaxed PBE06-31+G(d) scans
are shown in green For (c)-(f) the PBE06-31+G(d) relaxed scans of PA from (a) are
shown in grey for comparison In (a) and (b) a rigid scan at the PBE06-31+G(d) level of
theory is shown by a dotted line
53 Results
128
To establish the importance of the intramolecular steric clashes the rigid and relaxed
scans were repeated with model molecules that replaced the benzoic acid group of FA
with smaller fragments and the bonds around the nitrogen constrained to be planar (Figure
56) in order to avoid the pyramidalization of the amine (Figure 57) The potential energy
scan has a very large maximum at 90deg for planar-N-constrained phenylamine (PA)
approximately 6 times higher than the barrier in the fenamates (reflected in the scale
change between Figure 515a and Figure 511) Replacing one constrained hydrogen with
a methyl (Figure 56) produces a slightly larger barrier but very little asymmetry strongly
suggesting that this is an electronic effect of conjugation between the lone pair on the
nitrogen and the aromatic ring
Adding a double bond to PA reduces the barrier to rotation by 1110 kJ mol-1 (Figure
515c) Adding a carboxylic acid that forms an intramolecular H-bond to the N-H group
further reduces this barrier by almost 7 kJ mol-1 (Figure 515d) These observations imply
that the conjugation of the benzoic acid ring of the fenamates contributed significantly to
reducing the electronic barrier The intramolecular hydrogen bond in this model molecule
(Figure 515d) varies in length from 194 to 192 Aring as changes from 0 to 180deg by
comparison the FA hydrogen bond varies from 187 to 184 Aring Thus it is evident that the
intramolecular H-bonding in the fenamates reduces the electronic barrier In contrast
substituting Cl and CH3 at the meta position of PA (Figure 515e and f) shows little change
to the barrier height with half-height (h2) values of 3-chloroaniline (185 kJ mol-1) and
3-methylaniline (178 kJ mol-1) representing only a small increase over that of PA (176
kJ mol-1)
The scans in Figures 515a b e and f have no maxima at 0 or 180deg confirming that
the steric clash between the aromatic C6-H and C13-R1 (Figure 51) of the phenyl ring is
responsible for this maximum These curves are very well reproduced by ((h2)(1-
cos(2ξ)) where h is the potential maximum As the nitrogen substituents (Figures 515c
and d) get larger there are signs of additional steric effects particularly at the MP2 level
suggesting more changes in intramolecular dispersion The difference between a rigid
scan and a relaxed one is small (Figures 515a and b) and the differences in the curves
according to the type of calculation are relatively minor compared with the qualitative
differences between the HF and correlated methods for the fenamates (Figure 512) From
contrasting the conformational scans of model molecules with minimal steric effects
(Figure 515) with those of the fenamates (Figure 511) the overriding conclusion is that
there is an electronic contribution to the torsional barrier at =90 which can be
53 Results
129
represented by a (h2)(1-cos(2ξ)) term where h is the maximum energy from the
electronic contribution
There is a dramatic change in the HOMO isosurfaces of the phenyl ring with torsion
angle (Figure 516) which is remarkably similar between PA and the fenamates FA and
TA This finding suggests that the electronic contribution observed for PA is fundamental
to the fenamates The destructive interference of the MOs at =90 (Figure 516 and
Figure 517b) is the origin of the huge torsional barrier that is seen in each of the model
molecules in Figure 515 The smaller torsional barriers after adding a double bond
(Figure 515c) and acidic (Figure 515d) substituents to PA (Figure 515a) was a result of
increased electron delocalisation (compare Figure 517a with Figure 517b)
0deg 40deg 90deg
Figure 516 The electron density surface of HOMO frontier orbitals for different
conformations of PA (top) FA (middle) and TA (bottom) obtained from the PBE06-
31+G(d) level of theory Contour map isovalues were drawn at a 002 au level
(a) (b)
Figure 517 Alternative HOMO isosurface view of (a) FA and (b) PA molecule at =90
from Figure 516
My attempt at modelling delocalisation over the entire FA molecule even for the lowest
occupied orbital failed (Figure 518) which suggests that a completely flat model of
53 Results
130
FA ( = 0) is unrealistic This is because of the huge steric barrier (Figure 513) of a planar
conformation and the linear combinations of atomic orbitals in many molecular orbitals
are sensitive to conformation The electronic effects are not well defined for TA ie no
Figure 518 equivalent for TA due to the bulky substituent hence excluded in the analysis
= 0 = 40 = 90
Figure 518 HOMO-10 (46 MOs) isosurface view of side (top) and front (bottom) FA
molecule at =0 40 and 90
The MOsrsquo picture can only give a qualitative guide to the electronic contribution
because it is not possible to have an aromatic substitution at R2 or a methyl group
substitution on C13 (as in MA and TA) without steric interactions At present
independently investigating how the electronic barrier varies among the fenamates is not
possible However it is clear from Figure 515 that whilst the benzoic acid substituents
will have a dramatic effect on lowering the barrier the meta-substitution of chlorine and
methyl on the phenyl ring has a much smaller effect on the barrier
536 Estimating the Steric Contributions with an Atom-Atom Potential The steric effects of FA and TA can be analysed by using Gavezzottirsquos parameters
(Table 52) to produce a conformational profile (see Figure 519) which can then be
subdivided into the repulsion (Aexp(minusBRik)) and dispersion (minusCRik6) contributions
This subdivision (Figure 519) suggests that the repulsion terms dominate producing
maxima at 0 and 180deg and minimum at 90deg a finding that is consistent with the
supposition that these maxima occur because of steric clashes However the repulsions
are severely overestimated The dispersion contribution gives a maximum at ~90deg
which is of the same order of magnitude as the ab initio maxima particularly for FA This
confirms the observation from Figure 512 that electron correlation the origin of
dispersion interactions makes a significant contribution to this maximum supplementing
53 Results
131
the electronic effect (cf Figure 515) The difference between TA and FA in Figure 519
is consistent with the large dispersion interaction of the Cl substituent as well as the
repulsion from the methyl substituent
Figure 519 Comparison of the ab initio (black) intramolecular energy scans at the
PBE06-31+G(d) level of theory for FA (top) and TA (bottom) with Gavezzottirsquos exp-6
intramolecular energy models summed over all intramolecular atom-atom distances from
the third nearest neighbour (1-4) and above The net effect (purple) is subdivided into the
repulsive (red) and dispersion (blue) contributions
537 Investigating the Important Interactions with Atom-Atom Potential For FA and TA the dominant interactions involve C H and HB (Table 56) while the
dominant interactions involving N and Cl (Table 57) were exclusive to TA Although FA
and TA have the N atom only TA has the methyl substituent (N1∙∙∙C14 f and N1∙∙∙H12
f
Table 57) Of all the dominant interacting atoms for FA and TA only Cl of TA interacts
with atoms (methyl substituent) belonging to the same aromatic ring (dfC14∙∙∙Cl1
dfCl1∙∙∙H10 and dfCl1∙∙∙H11 Table 57) These results confirm the observation that the
53 Results
132
methyl substituent plays a role in reducing the energy penalty for TA (section 534
Figure 514)
Table 56 Atom-atom interactions of FA that dominate the intramolecular energies as
estimated using Gavezzottirsquos exp-6 potential The interaction is listed as dominant if the
difference between the minimum and maximum total energy (Erepul-dis) is greater than or
equal to 1 kJ mol-1
ati∙∙∙atk neigh RikkJ mol-1 ErepulkJ mol-1 EdispkJ mol-1 Erepul-dispkJ mol-1
min max(∆) min max(∆) Min max(∆) min max(∆)
C7∙∙∙C9 4 307 371(064) 057 533(476) -289 -092(196) -035 245(280)
C7∙∙∙C13 4 307 371(064) 057 532(475) -288 -092(196) -035 244(279)
C6∙∙∙C9 5 310 443(133) 005 475(470) -270 -032(239) -039 205(243)
C6∙∙∙C13 5 311 444(133) 005 468(463) -268 -032(236) -039 200(238)
C6∙∙∙H7 6 252 488(236) 000 398(398) -186 -003(182) -021 212(233)
C8∙∙∙H5 5 254 288(034) 089 357(268) -175 -083(092) 007 182(176)
C9∙∙∙H5 6 257 416(159) 000 317(316) -163 -009(154) -020 154(174)
H5∙∙∙H7 7 208 476(268) 000 578(578) -135 -001(134) -004 443(447)
C13∙∙∙HB6 4 251 330(078) 016 403(387) -187 -037(151) -021 216(236)
HB6∙∙∙H11 5 230 368(138) 001 240(239) -074 -004(070) -004 166(170)
C6∙∙∙H8 4 289 310(020) 485 985(500) -412 -274 (138) 212 573(362)
C6∙∙∙H11 6 252 488(237) 000 396(396) -185 -003(182) -020 211(231)
C13∙∙∙H5 6 257 417(159) 000 314(314) -162 -009(153) -020 152(172)
H5∙∙∙H11 7 209 476(267) 000 548(548) -130 -001(129) -004 418(422)
C9∙∙∙HB6 4 251 330(079) 016 406(390) -188 -036(152) -021 218(238)
HB6∙∙∙H7 5 230 369(139) 001 238(237) -074 -004(069) -004 164(169)
Table 57 Atom-atom interactions of TA that dominate the intramolecular energies as
estimated from Gavezzottirsquos exp-6 potential The interaction is listed as dominant if the
difference between the minimum and maximum total energy (Erepul-dis) is greater than or
equal to 1 kJ mol-1 dInteractions between atoms on the same aromatic ring fInteractions
involving the methyl substituent
ati∙∙∙atk neigh RikkJ mol-1 ErepulkJ mol-1 EdispkJ mol-1 Erepul-dispkJ mol-1
min max(∆) min max(∆) min max(∆) min max(∆)
C7∙∙∙C9 4 302 361(059) 081 630(549) -317 -109(209) -028 313(340)
C7∙∙∙C13 4 314 372(058) 056 417(361) -252 -091(161) -035 165(201)
C6∙∙∙C9 5 308 412(104) 014 513(499) -282 -050(233) -039 231(269)
C6∙∙∙C13 5 324 444(119) 005 292(287) -207 -032(176) -039 085(123)
C6∙∙∙H7 6 248 445(197) 000 458(458) -202 -006(196) -020 256(276)
C8∙∙∙H5 5 254 289(035) 086 363(277) -176 -081(095) 005 187(182)
C9∙∙∙H5 6 260 369(109) 003 286(283) -154 -019(135) -021 132(153)
H5∙∙∙H7 7 214 418(204) 000 451(450) -113 -002(111) -004 337(342)
C13∙∙∙HB6 4 254 322(068) 022 364(341) -176 -043(134) -020 187(207)
HB6∙∙∙H11f 6 219 450(231) 000 364(364) -098 -001(096) -004 266(271)
HB6∙∙∙H12 f 6 228 315(087) 008 254(246) -077 -011(066) -003 177(180)
C6∙∙∙C8 4 289 310(021) 485 995(511) -414 -273(141) 211 581(370)
C6∙∙∙C14 f 6 310 510(200) 000 482(482) -273 -014(259) -039 210(248)
C7∙∙∙C14 f 5 312 414(102) 013 455(442) -264 -048(216) -039 191(230)
C7∙∙∙H12 f 6 255 385(130) 002 344(342) -171 -014(156) -020 173(194)
N1∙∙∙C14 f 4 278 298(021) 487 1081(594) -607 -395(212) 093 474(382)
N1∙∙∙H12 f 5 243 262(019) 162 385(222) -243 -154(088) 008 142(134)
dfC14∙∙∙Cl1 4 304 311(007) 688 875(187) -488 -427(061) 261 387(126) fC14∙∙∙HB6 5 241 371(130) 003 618(615) -241 -018(223) -021 377(397) dfCl1∙∙∙H10 5 257 324(068) 051 813(762) -410 -100(309) -049 404(453) dfCl1∙∙∙H11 5 269 374(105) 007 489(483) -308 -042(266) -050 181(231)
54 Discussion The Physical Origins of Torsional Potentials
133
Analysis of which particular atom-atom interactions vary most with conformation
(Table 56 and Table 57) reveals that intramolecular interactions involving the N-H
proton type HB as well as certain aromatic and TA methyl protons type H vary strongly
with conformation as expected based on Figure 514 Therefore the poorly determined
parameters for HB and H strongly affect the energy profiles of Figure 519
54 Discussion The Physical Origins of Torsional Potentials The torsional barriers for fenamates apart from gt 140 are smaller than for PA and
ethane For the fenamates the difference in energy penalty arises from the high degree of
conjugation between the two aromatic rings of the fenamates via ∙∙∙ overlap involving
the lone pair of electrons of the N atom (Figure 516)234 This conjugation effect is absent
for ethane and reduced for PA because these have just one aromatic ring It is clear that
compared to PA the barrier to rotation reduces as the model molecules tend toward two
aromatic rings These observations confirm that the delocalisation of electrons plays a
role in the origin of the torsional barrier for fenamate molecules FA and TA
The maximum at = 90 (Figure 515) is due to dispersion effects The investigation
of different methods for producing conformational profiles demonstrates the importance
of accounting for correlation effects For example the HF method is hopeless for
reproducing the correct conformation profiles around the minima for fenamate molecules
FA TA MA and ClFA (Figure 512) because the method excludes the correction effects
Therefore it is vital that methods of examining the conformational profiles include the
correlation effects This is most important in CSP where accurate ranking of generated
crystal structures depends upon accurately evaluating the energy penalty contribution to
the total lattice energy (equation 51)
Although the conformational profiles are dependent on specific atoms that define
flexible torsion (Figure 58) the comparison of the rigid and relaxed scans shows the
important role that the atomic positions of other atoms play (Figure 513 and Figure 514)
during relaxation For example during the relaxation of TA methyl rotation plays a role
in reducing the energy penalty and barrier to rotation (section 534) The enormous
difference between the relaxed and rigid conformational profiles (Figure 513) and their
conformers (Figure 514) suggests that the atomic positions of most atoms in a molecule
during relaxation are important Consequently we can conclude that the origin of the
torsional barrier involves most atoms in a molecule
By analysing the low-energy torsional barriers in fenamates (Figure 511) it has
become clear that larger organic molecules retain the contributions as identified for small-
55 Summary
134
model molecules such as ethane There is both an electronic and a steric component to
these torsional barriers in fenamates However as the model molecules become larger
the effects of small correlated changes in the other bond angles and the dispersion
contributions become very significant (Figure 515c and d) As the size of the molecule
increases in both the number of atoms and the electron density there is an increasing
contribution to the torsional profile from the intra-molecular equivalent of the
intermolecular dispersion
Separating the ldquothrough spacerdquo intramolecular dispersion from the other electron
correlation effectsmdashspecifically those that contribute to the (h2)(1-cos(2)) electronic
barrier from ldquoconjugationrdquo or delocalization between the two aromatic ringsmdashis unlikely
to be meaningful when using an ab initio method that is still approaching the quantitative
accuracy needed
55 Summary I could not use the definitive ab initio torsional potential for each fenamate as the
torsional potentials of organic molecules containing aromatic rings are very demanding
of the electronic structure method used However PBE0 method and 6-31+G(d) basis set
were sufficient to investigate the origin of the barrier to rotation for FA and TA
The analysis of the fenamatesrsquo torsional potential reveals that like the classical small-
molecule torsional potentials of ethane there is both an electronic effect (loosely
described as changes in MOs involving ∙∙∙ between the aromatic rings and the nitrogen
lone pair destabilizing the non-planar conformations) and a steric effect from the variation
in overlap of non-bonded atoms For larger molecules like the fenamate molecules the
intramolecular dispersion and small changes in the other conformational variables also
make significant contributions to the torsional profile
When the aromatic rings are perpendicular to each other the destructive interference of
MOs creates an intrinsic barrier The two rings in fenamate molecules stabilise the
expected high-energy barrier A cos2 term accurately represents the torsional barrier of
model molecules with minimal steric effects that have been constrained to prevent
pyramidalization Finally this chapter showed that the torsional barriers for FA and TA
depend on small correlated changes in degrees of freedom other than the most flexible
torsion We observed this by contrasting the conformations and their corresponding
energies of rigid scans against relaxed scans for FA and TA
The origin of the torsional barrier of fenamates is therefore a combination of intrinsic
intramolecular dispersion electronic contribution and the steric repulsion A new
55 Summary
135
analytical form for intramolecular energies (Chapter 6) of fenamates that is physically
justified must incorporate these origins and account for small correlated changes among
different conformations
61 Introduction
136
Chapter 6 Toward New Force fields for Fenamate Molecules
ldquoAvoid complexities Make everything as simple as possiblerdquo
mdash Henry Maudslay
61 Introduction
611 Background Force field methods (section 25) for calculating a systemrsquos energy ignore electronic
motions and instead calculate the systemrsquos energy as a function of the nuclear positions
alone63 Such force field methods are less computationally demanding than quantum
mechanical calculations but they cannot predict properties that depend upon a moleculersquos
electronic distribution In addition the limitations of electronic structure calculations as
discussed in Chapters 2 (section 27) and 4 (sections 438 and 439) suggest the need
for a new analytical model that can combine the accuracy of electronic methods and the
speed of force field methods This chapter proposes a solution to this problem
In general force field methods are based on two important components (i) the
functional form of the potential energy functions and (ii) the parameterisation of these
functions235236 In Chapter 5 I investigated the first component the origin of the torsional
barrier for fenamate molecules For small molecules that were constrained to have
minimal steric clashes the origin is mainly an electronic effect and can be expressed as a
cos2ξ term However for larger molecules like fenamic (FA) and tolfenamic acids (TA)
there are additional correlated changes namely the repulsion and dispersion effects
Chapter 5 by investigating these contributions with an exp-6 term dealt with the first
component required for building a force field
The present chapter deals with the second component of force fields re-
parameterisation In this chapter I will derive an analytical model for FA and TA (Figure
61) by fitting the conformational profiles (Figure 511) to analytical expressions
discussed in Chapter 5 One of the key conclusions of Chapter 5 was that definitive ab
initio conformational energy scans could not be obtained However the ab initio scans at
the PBE06-31+G(d) level of theory (Figure 511) are adequate for the purposes of
creating a new analytical model
61 Introduction
137
1
6
2
1
9
1
1
813
7
16
Figure 61 The fenamate family showing the low-barrier torsion angle (=C7-N1-C8-C9)
and atomic numbering =0 when the aromatic rings are coplanar as drawn The
fenamates mentioned in this chapter are fenamic acid (FA) R1= R2= H tolfenamic acid
(TA) R1= CH3 R2= Cl mefenamic acid (MA) R1= R2= CH3 flufenamic acid (FFA) R1=
H R2= CF3 and clorofenamic acid (ClFA) R1=H R2=Cl The dotted line represents an
intramolecular hydrogen bond
Figure 62 Relaxed conformational scans at the PBE06-31+G(d) level of theory for the
fenamates from section 533 Fenamic acid (FA) tolfenamic acid (TA) mefenamic acid
(MA) and chlorofenamic acid (ClFA)
612 A Case for Modelling Decoupled Intramolecular Energy For challenging applications involving molecular recognition of pharmaceuticals such
as computer-aided drug design the importance of an accurate balance of intermolecular
and intramolecular forces cannot be overemphasized93 The success of CSP studies17127
(Chapters 3 and 4) and the limitations of current force field (section 254) and electronic
structure methods (sections 27 and 439) suggest decoupling the models for the
intermolecular forces from those for the intramolecular forces (ie conformational
61 Introduction
138
changes) as a means of more accurately modelling force fields for pharmaceutical
molecules should be attempted
613 Analytical Models of Intramolecular Energies Traditional force field modelling includes an explicit torsional term237 of the general
form
where defines the phase shift and n the periodicity For FA as defined in Figure 61
requires that = 0 and the near-symmetry dictates that n is an even integer For
substituted fenamates odd values of n could contribute although the conformational
profile should be symmetric about = 0
Non-bonded atomndashatom interactions should be able to represent the intramolecular
energies well if the origin of the conformational profile is predominantly steric (caused
by the varying repulsion between the overlapping charge distributions of 1-4 atoms with
) An exp-6 atomndashatom model (Chapter 5) would be expected to give a better
representation than a Lennard-Jones (R-12) model of the variation of the repulsion with
distance given the success of the overlap model in parameterizing intermolecular
repulsion potentials238239 Thus a crude starting point for my investigation of the ldquonon-
bondedrdquo contribution to the torsion potential is the exp-6 atomndashatom model potential with
a parameterization that was developed for modelling the intermolecular forces between
organic molecules in crystal structures42231
where atoms i and k of atomic types and are separated by intramolecular distances Rik
calculated from the molecular conformation with torsion angle ξ This functional form
with no assumed relationship between the like (and ) and unlike () interactions
means that the parameters (A B and C) have at least partially absorbed the
electrostatic effects in fitting This chapter seeks to re-parameterize the equations of the
origin of torsional potential (equations 61 and 62) in order to derive analytical models
that accurately represent the conformational profiles of fenamic (FA) and tolfenamic
acids (TA)
614 Overview The goal of this chapter is to develop a generalizable method that uses a FORTRAN
code to derive analytical models for the conformational profiles of FA and TA This
( ) [1 cos( )]2
nVE n 61
6
( ) exp( )ik ik
i k
E A B R C R 62
62 Methodology Fitting Analytical Models to Conformational Profiles
139
chapter will investigate three analytical forms the cosine series rescaling repulsion and
combined physical models Each of these new analytical forms will have different
parameters for intramolecular and intermolecular contributions I will discuss the
methodology of fitting analytical models to conformational profiles and test the
transferability properties of the combined physical models for FA and TA to other
fenamate molecules (Figure 61)
This chapter will show that the cosine series and rescaled repulsion models are
inadequate for modelling the conformational energy profiles of fenamates More
importantly this chapter will show that combining a cos2 term to represent the
electronic barrier with an intramolecular atomndashatom exp-6 repulsion-dispersion term for
all atom pairs separated by three or more bonds (bond-paths ge 1-4) allows a very effective
representation of the ab initio conformational energies
62 Methodology Fitting Analytical Models to Conformational Profiles The only weighting applied to the conformational profiles of all the fenamate molecules
(Figure 511 at the PBE06-31+G(d) level of theory) in this chapter was the restriction of
conformational energies to 10 kJ mol-1 or below This weighting was appropriate because
this chapter does not seek to represent the steric barrier above 145deg for TA (and MA)
accurately Hence this chapter considers Np = 37 points for the FA and Np = 30 points for
TA (and MA) Because the definition of the ab initio energies Eab are relative to the
lowest energy conformation for each molecule the analytical modelrsquos energies Emodel
were adjusted by a constant Ebase such that the lowest energy conformation of both the
ab initio and analytical model were zero The algorithms (Figure 63 and Figure 64) in
this chapter fit a constant c that matched the overall conformational curves rather than
the minima As such c differs from Ebase by a fraction of a kJ mol-1 The standard error
σintra in Emodel was
where Np and Nk are the number of data points and fitted coefficients respectively
However there were only Nk -1 physical parameters as one (c ~ Ebase) served only to
adjust the baseline
621 Torsional Potential Model The explicit torsional term (equation 61) can be simplified as the following cosine
series
2
mod
int
ab el
ra
p k
E E
N N
63
62 Methodology Fitting Analytical Models to Conformational Profiles
140
where Nk and Np are the number of fitted coefficients and data points respectively The
intercept c is 0 Using the linear least squares method (section 26) the cosine series
(equation 64) were fitted to the conformational profiles of FA and TA (Figure 511) to
determine the unknown coefficients k Below is a flowchart of the cosine series
algorithm (Figure 63)
Figure 63 An algorithm showing the overview of modelling ab initio intramolecular
energy using a cosine series potential The source codes are included in the CD ROM
attached to this thesis (see Appendix A)
In the initialization step (step 1) the algorithm required the ab initio intramolecular
energies and the inputs of their equivalent torsion angles (Figure 511) These inputs
(generated from the ab initio scans reported in Chapter 5) were used to construct a
regression model (step 2) The G02DDFE97 NAG subroutine (section 262) solved the
resulting linear regression problem that is the unknown coefficients k were
determined Finally the standard error σintra of the modelled intramolecular energy
Emodel (equation 63) was calculated
0
( ) cos( 1 ) 5 1kN
k k p
k
E k N N
64
62 Methodology Fitting Analytical Models to Conformational Profiles
141
622 AtomndashAtom Model Due to the considerable correlation between the atomndashatom coefficients particularly
the two repulsion parameters (A and B) it is difficult to vary both repulsion parameters
simultaneously240241 This section discusses the derivation of analytical atomndashatom
models for conformational profiles of FA and TA as expressed in the algorithm shown
in Figure 64 In particular this section discusses the rescaling of selected repulsion (and
dispersion) coefficients which gives a linear model that contains (an appropriate cosine
term and) a baseline constant c
Figure 64 An algorithm showing the modelling of ab initio intramolecular energy by a
physical potential The source codes are included in the CD ROM attached to this thesis
(see Appendix A)
This algorithm (Figure 64) which uses NAG129 library routines shows the systematic
comparison of how well various selections of linear parameters ( and c) can
represent the conformational profiles of fenamates The algorithm first extracted the
geometries and the corresponding intramolecular energies of the fenamate molecules
which were generated from ab initio calculations These geometries were converted to an
atomic type-friendly mol2 format (Sybyl typing230) using the Babel242 chemical toolbox
The other inputs are the starting values of Gavezzottirsquos atomndashatom exp-6 potential
parameters41231232 (Table 52 of Chapter 5) The covalent 1-1 connectivity (from the mol2
file) helped to distinguish the polar hydrogen HB from the non-polar hydrogen H
atoms The remaining atomndashatom connectivity (ie nearest neighbour or bond-path) and
6
( ) cos(2 ) exp( )ik ik
i k
E A B R C R c 65
62 Methodology Fitting Analytical Models to Conformational Profiles
142
distances Rik within the molecule were determined using the H03ADF subroutine and
the 1-1 connectivity H03ADF subroutine evaluates the nearest neighbour by finding the
shortest path between two atoms
Next the atom-atom interactions were summed over all 1-4 atom-atom distances and
higher bond-paths in the entire molecule (equation 65) The maximum bond-path was 1-
11 for all three fenamates and most pharmaceutical molecules were sufficiently small
that there was no need to define a summation limit in terms of intramolecular distance or
bond-path length for a single molecule The use of 1-4 distances as the shortest
intramolecular interactions included in the atomndashatom summation was traditional
Although it should be noted that 1-3 interactions were used elsewhere eg in the CSP
code of GRACE where they have sometimes been found to be problematic including the
recent case of a bulky side group attached to an aromatic ring which required specific
scaling down13 The atomndashatom formulation resulted in many virtually constant terms
such as the H∙∙∙H C∙∙∙C and H∙∙∙C contributions from within the aromatic rings These
terms contributed to the baseline energy Ebase defined as the minimum energy found in
the scan with a specific parameterized model
The atomndashatom model involved far too many coefficients for all to be fitted
independently to the ab initio data In addition many atomndashatom distances did not change
significantly with the torsion angle as observed from investigating the atomndashatom
interaction that dominated the intermolecular contribution in Chapter 5 There were only
16 and 21 dominant interactions out of 351 and 435 total atomndashatom interactions for FA
and TA Therefore only interactions that were classed as dominant were rescaled The
algorithm in Figure 64 determined the dominant interaction by using a cut-off value of
one ie Ecutoff = 1 kJ mol-1 The dominant atomndashatom interactions for FA and TA were
reported in Chapter 5 (Table 66 and Table 57) which are summarised in Table 61 If
atomndashatom interaction of a given type (∙∙∙) varied less than the Ecutoff (for example Cl∙∙∙O
and O∙∙∙HB) then these parameters were not rescaled but may vary the contribution to
Ebase One notable observation was the significant interaction between atoms of the same
aromatic ring for TA (Table 61d) which was absent in FA
62 Methodology Fitting Analytical Models to Conformational Profiles
143
Table 61 Contrasting the atomndashatom interactions of FA and TA that dominated the
intramolecular energies formed by combining Table 56 and Table 57 from Chapter 5
Interactions unique to FA and TA are coloured blue and red respectively dInteractions
between atoms of the same aromatic ring fInteractions involving the methyl substituent
FA TA FA TA ati∙∙∙atk neigh RikkJ mol-1 RikkJ mol-1 Erepul-dispkJ mol-1 Erepul-dispkJ mol-1
min max(∆) min max(∆) min max(∆) min max(∆) C∙∙∙C
C7∙∙∙C9 4 307 371(064) 302 361(059) -035 245(280) -028 313(340)
C7∙∙∙C13 4 307 371(064) 314 372(058) -035 244(279) -035 165(201)
C6∙∙∙C9 5 310 443(133) 308 412(104) -039 205(243) -039 231(269)
C6∙∙∙C8 4 289 310(021) 211 581(370)
C6∙∙∙C13 5 311 444(133) 324 444(119) -039 200(238) -039 085(123) fC6∙∙∙C14 6 310 510(200) -039 210(248) fC7∙∙∙C14 5 312 414(102) -039 191(230)
C∙∙∙H fC7∙∙∙H12 6 255 385(130) -020 173(194)
C6∙∙∙H7 6 252 488(236) 248 445(197) -021 212(233) -020 256(276)
C6∙∙∙H8 4 289 310(020) 212 573(362) C6∙∙∙H11 6 252 488(237) -020 211(231) C8∙∙∙H5 5 254 288(034) 254 289(035) 007 182(176) 005 187(182)
C9∙∙∙H5 6 257 416(159) 260 369(109) -020 154(174) -021 132(153)
C13∙∙∙H5 6 257 417(159) -020 152(172) H∙∙∙H
H5∙∙∙H7 7 208 476(268) 214 418(204) -004 443(447) -004 337(342)
H5∙∙∙H11 7 209 476(267) -004 418(422) C∙∙∙HB
C13∙∙∙HB6 4 251 330(078) 254 322(068) -021 216(236) -020 187(207)
C9∙∙∙HB6 4 251 330(079) -021 218(238) C14∙∙∙HB6 5 241 371(130) -021 377(397)
HB∙∙∙H
HB6∙∙∙H11 5 230 368(138) -004 166(170) HB6∙∙∙H7 5 230 369(139) -004 164(169)
fHB6∙∙∙H11 6 219 450(231) -004 266(271) fHB6∙∙∙H12 6 228 315(087) -003 177(180)
N∙∙∙C fN1∙∙∙C14 4 278 298(021) 093 474(382)
N∙∙∙H fN1∙∙∙H12 5 243 262(019) 008 142(134)
C∙∙∙Cl fC14∙∙∙Cl1 4 304 311(007) 261 387(126)
Cl∙∙∙H dfCl1∙∙∙H10 5 257 324(068) -049 404(453) dfCl1∙∙∙H11 5 269 374(105) -050 181(231)
63 Results
144
These atomndashatom interactions were grouped into unique atom-type∙∙∙atom-type sets
(∙∙∙) The algorithm then systematically fit different subsets of the ∙∙∙rescaling
parameters using combination mathematics243 Eg for interactions C∙∙∙H C∙∙∙HB and
H∙∙∙HB the following seven subsets of interactions were rescaled
1 C∙∙∙H or C∙∙∙HB or H∙∙∙HB
2 C∙∙∙H and C∙∙∙HB or C∙∙∙H and H∙∙∙HB or C∙∙∙HB and H∙∙∙HB
3 C∙∙∙H C∙∙∙HB and H∙∙∙HB
For each fit the subroutine G02DDFE97 (section 262) calculated the Nk coefficients
( c) being fitted and minimized the residual sum of squares (RSS) using a
general linear regression model244 Within the routine a matrix decomposition process
established whether a solution was unique or whether the parameters were linearly
dependent and therefore had no unique solution Unless otherwise noted all fits reported
in this chapter had a unique solution Finally the standard error intra in the modelrsquos
intramolecular energy was calculated after adjusting the minimum to 0 kJ mol-1 (equation
63)
This chapter used the method discussed above to investigate two analytical models
(1) Rescaling only the repulsion contribution of the atomndashatom exp-6 potential ie
equation 65 with and set at 0 and 1 respectively
(2) Rescaling all the parameters ie equation 65
63 Results
631 Cosine Series Model The traditional cosine series expansion for a torsional potential (equation 64) must
include cos4 to have the correct number of minima for the fenamates Alone this term
gave a poor position of the minima for FA and it was qualitatively wrong for TA (Figure
65) A least squares fit that included the lower cosine terms (Nk=5 equation 64) gave a
qualitatively reasonable representation (Figure 65) but further improvement is slowly
converging (Figure 66) For FA the fitting steadily improved in quality particularly
upon the addition of cos4n terms where n are integers For TA the fitting became
unstable after 21 terms even though there was no attempt to represent the large steric clash
beyond 10 kJ mol-1
This result demonstrated that the cosine series was a fitting exercise and did not reflect
the physics It was effectively an exercise in modelling the relaxed scans by a functional
6
( ) exp( )ik ik
i k
E A B R C R c 66
63 Results
145
form that assumed the scan was rigid (ie only the torsion angle changed) This
assumption is a crude approximation since rigid scans are different from relaxed scans
(see Figure 513) Poor convergence of the cosine model expansion were also reported
for biphenyl245 a dye which required 7 terms while polynorbornene246 required 6 and 15
terms for the meso and racemic dimer respectively
Figure 65 Comparison of the ab initio relaxed scan at the PBE06-31+G(d) level of
theory with linearly fitted least square cosine series model for FA (top) and TA (bottom)
with Nk=5 (red lines) the optimal cos4 terms (blue lines) and Nk=21 (green lines σintra
=017 kJ mol-1 for FA and TA)
63 Results
146
Figure 66 Plot of the standard error of the intramolecular energies against the number of
cosine terms Nk for FA (top) and TA (bottom) The fit is ill-determined ie there is no
unique solution for TA after Nk=21
632 Rescaled Repulsion Model From Chapter 5 it is clear that the repulsion contributions were severely overestimated
for FA and TA with Gavezzottirsquos exp-6 potential Therefore an alternative model is to
rescale just the repulsion terms (ie fit selected in equation 66) as the intermolecular
atomndashatom model clearly overestimated the intramolecular steric effects (Figure 519)
Rescaling just a few of Gavezzottirsquos repulsion parameters for example those involving
the poorly parameterized H∙∙∙H interactions resulted in a qualitatively good fit (Figure
67) as shown by the results for fitting all combinations of repulsion parameters for FA
(Table 62) and the summary in Table 63 of the 511 such fits for TA Rescaling just two
(C∙∙∙H and H∙∙∙H) repulsion contributions for FA and five (C∙∙∙H C∙∙∙HB C∙∙∙N H∙∙∙H and
H∙∙∙HB) for TA produced a model that reproduced the torsional profile well (Figure 67)
63 Results
147
Figure 67 Comparison of the relative energies from ab initio calculations (solid black
lines) of FA (top) and TA (bottom) with selected best-fit exp-6 rescaled repulsion models
For FA the selected Nk=3 intra=032 kJ mol-1 model had βC-H=-453 βH-H=270 and
Ebase=-506 while the Nk =4 intra=027 kJ mol-1 model had βCH=-446 βH-H=210 βH-
HB=257 and Ebase=-875 For TA the selected Nk=6 (intra=034 kJ mol-1) and 10
(intra=022 kJ mol-1) parameter fits are shown bold in Table 63
The rescaling of the C∙∙∙N interaction seemed particularly critical for TA (Table 63)
which can be attributed to the importance of the C(methyl)∙∙∙N interaction in describing
the steric clash involving the methyl group (Figure 514) However many of the fitted
rescaling parameters were negative (which suggested that the exponential steric
repulsion had become attractive Thus again this appeared to be a fitting exercise so that
exponential terms were reducing the over-estimate of the barrier at 90 by the
intermolecular dispersion parameters (Figure 519)
63 Results
148
Table 62 Complete set of results after rescaling Nk (repulsion contributions and
baseline energy Ebase) parameters of various interacting atomic types for FA
ικ Ebase σintra kJ mol-1
Nk C -C C -H C -HB H -H H -HB 2 - -226 - - - 437 168 2 - - -148 - - 1076 284 2 - - - -088 - 2215 287 2 - - - - -423 3579 299 2 -332 - - - - -39948 451 3 - -453 - 269 - -506 032 3 - -428 - - 539 -1511 032 3 -210 -217 - - - -31011 036 3 - -523 365 - - 278 04 3 -523 - -173 - - -62622 045 3 -621 - - -124 - -71356 065 3 -666 - - - -549 -74317 066 3 - - -991 - 2082 -7537 127 3 - - -909 722 - -2278 174 3 - - - -738 1972 -2577 247 4 - -446 - 210 257 -875 027 4 - -467 144 243 - -388 03 4 079 -438 - 258 - -2557 032 4 041 -390 - - 459 -7101 032 4 - -432 109 - 525 -1456 033 4 -173 -254 133 - - -27252 037 4 -458 - -296 - 394 -57220 04 4 -507 - -218 137 - -61133 045 4 -639 - - -035 -157 -72571 064 4 - - -958 006 2275 -7893 125 5 130 -467 - 218 278 2069 028 5 - -448 104 210 251 -849 028 5 236 -591 218 270 - 13231 029 5 -016 -327 037 - 481 -12963 031 5 -456 - -284 061 479 -57209 039 6 208 -550 170 237 225 10068 028
Table 63 Summary table of the best results after rescaling Nk (repulsion contributions
and baseline energy Ebase) parameters of various interacting atomic types for TA
βικ Ebase σintra kJ mol-1 Nk C-C C-Cl C-H C-HB Cl-H C-N H-H H-HB H-N
2 - 909 - - - - - - - 11281 130 3 -008 - - - - -299 - - - -13547 093 4 - - - - 751 -269 - - 1454 11747 087 5 - - -279 622 - -464 - -549 - -5429 051 6 - - -306 472 - -447 426 -529 - -5279 034 7 - - -392 472 - -487 532 -611 -054 -7690 025 8 - 503 -359 387 265 -340 581 -570 - 300 022 9 - 531 -343 355 318 -327 596 -539 190 1748 021
10 084 541 -319 330 347 -331 611 -527 219 681 022
63 Results
149
633 Combined Physical Model Assuming a model that both describes the electronic effects and allows rescaling of the
atomndashatom interactions
Then there is a huge number of ways for finding a satisfactory fitting of the data The
rescaling of the three contributions in equation 67 is physically justified since
(1) The α term represents the electronic barrier that arises from the conjugation of
benzoic acid rings (section 535)
(2) The rescale term is necessary due to the overestimation of the repulsion
contribution (section 536)
(3) The rescale term accounts for electron correlation ie dispersion Section 275
emphasised the importance of the dispersion term while section 533 showed the
consequence of ignoring the electron correlation eg HF method
Cases where and gt 0 retained the repulsive and attractive (dispersion) nature ie
repulsion did not become attraction and vice versa It was also required that was less
than zero ( lt 0) to give a maximum around =90deg corresponding to conjugation (Figure
515) Table 64 contains all the fits to FA which have the physically correct sign for all
parameters and the full set of results for fitting up to 12 parameters (including the baseline
estimate Ebase as given in Table 65) This shows that fitting and only rescaling a few
atomndashatom interactions gives a qualitatively accurate fit (Figure 69) It is notable that the
parameters involving H and HB usually needed the greatest rescaling a finding that is
consistent with the fact that HB parameters were not fitted in the intermolecular potential
model In addition the intermolecular parameterization of H∙∙∙H is a notable exception in
that its minimum is very shallow (Figure 68) and is not sharply defined being repulsive
for a wide range of intermolecular H∙∙∙H distances42 Furthermore there is a huge
difference between other polar H (HB) interactions and H∙∙∙H interactions therefore it is
not surprising that the interactions that involve HB atoms required the greatest rescaling
Table 64 All fits obtained for FA with the physically correct sign for the repulsion
and dispersion and electronic parameters βικ γικ α Ebase σintra
kJ mol-1 Nk C-C C-H C-HB H-H H-HB C-C C-H C-HB H-H H-HB
6 - - 801 1074 - - - 1654 5800 - -339 -12383 026
6 - 028 - - 1109 - 783 - - 3479 -117 -7549 028
4 - - - 1108 - - - - 5003 - -391 -5926 033
4 - 619 - - - - 2082 - - - -157 -18049 036
4 - - - - 3467 - - - - 13698 -530 -1246 057
4 - - 3630 - - - - 11038 - - -945 -33466 076
6
( ) cos(2 ) exp( )ik ik
i k
E A B R C R 67
63 Results
150
Figure 68 Gavezzotti exp-6 potential for all atomndashatom interactions in fenamates
displayed in two different energy scales The parameters are from Chapter 5 (Table 52)
Although virtually perfect fits can be obtained (Table 65) the variation in the fitted
parameters is significant given the exponential sensitivity of the repulsion to changes in
atomndashatom distances These could be substantial for example the lack of symmetry for
the FA torsional scan where the two minima were found at =3894deg and 14471deg though
only differing in energy by 188 x 10-3 kJ mol-1 (716 x 10-7 au) corresponded to a change
of 061 Aring in the 1-4 interaction between the amide proton and C13 or C9 Even the C8-C9
and C8-C13 aromatic bond lengths differed by 00037 Aring for =0 or 180deg but only by
00004 Aring for =80deg or 100deg with larger changes in the bonded hydrogen positions for
FA Hence the systematic consideration of all combinations of sets of parameters that
could be meaningfully fitted and the resulting coefficients only provided a qualitative
guide to which of the atomndashatom interactions dominated the intramolecular energy
(Chapter 5 Table 66) and were most critical
63 Results
151
Table 65 The rescale parameters for the repulsion ικ dispersion ικ and electronic contributions of
the physical exp-6 and cos2 model for all possible combinations of atom type interactions C∙∙∙C C∙∙∙H
C∙∙∙HB H∙∙∙H and H∙∙∙HB for FA Nk are the number of fitted rescale parameters ικ and ικ and the baseline
energy Ebase ικ ικ α Ebase σintra
kJ mol-1 Nk C-C C-H C-HB H-H H-HB C-C C-H C-HB H-H H-HB
4 - - - 1108 - - - - 5003 - -391 -5926 033
4 - 619 - - - - 2082 - - - -157 -18049 036 4 -797 - - - - -1508 - - - - -272 -10530 045
4 - - - - 3467 - - - - 13698 -530 -1246 057
4 - - 3630 - - - - 11038 - - -945 -33466 076
6 -366 461 - - - -1053 1477 - - - -080 -3768 010 6 -436 - - 610 - -764 - - 2966 - -114 -15833 012
6 -852 - -188 - - -1227 - -229 - - 055 -30621 017
6 -600 - - - 1135 -862 - - - 5415 -143 -23513 018 6 - -103 1476 - - - 574 4073 - - -220 -17385 023
6 - - - 1208 -182 - - - 6537 -2918 -208 -9576 024
6 - -255 - 619 - - 013 - 2048 - -216 -1513 025 6 - - 801 1074 - - - 1654 5800 - -339 -12383 026
6 - 028 - - 1109 - 783 - - 3479 -117 -7549 028
6 - - -1326 - 6519 - - -6960 - 32879 -539 24422 036
8 -275 351 - - 271 -935 1344 - - 412 -075 534 008
8 -236 414 - -157 - -1078 1876 - -1719 - -076 9374 009
8 -373 - - 626 334 -681 - - 3475 222 -066 -15208 009
8 -493 551 -189 - - -1218 1530 -642 - - -047 -6499 010 8 -530 - -737 725 - -1054 - -2417 3267 - -044 -3345 010
8 -698 - -1655 - 3047 -1263 - -6095 - 14774 012 5842 013
8 - -419 520 1195 - - -846 691 6039 - -246 -995 019 8 - - 1843 1185 -1677 - - 5881 7251 -11125 -196 -30353 019
8 - -089 2697 - -3196 - 952 9622 - -18054 -082 -40433 021
8 - -445 - 1541 -1016 - -970 - 7719 -6385 -166 -770 021
10 -445 686 -555 -541 - -1577 2664 -1489 -4179 - 017 13752 005 10 -524 469 -740 - 953 -1247 1257 -2481 - 3880 -022 -075 007
10 -320 465 - -026 593 -977 1532 - -349 1763 -064 -3403 008
10 -598 - -1429 455 1804 -1188 - -5112 1825 8695 -025 6986 009 10 - 166 2717 671 -2944 - 788 9384 4350 -17854 -113 -44769 014
12 -383 709 -155 -570 -447 -1498 2835 -035 -4260 -2903 018 9708 006
152
Table 66 The rescale parameters for the repulsion ικ dispersion ικ and electronic contributions of the physical exp-6 and cos2 model for all possible combinations of atom
type interactions C∙∙∙C C∙∙∙Cl C∙∙∙H C∙∙∙HB Cl∙∙∙H C∙∙∙N H∙∙∙H and H∙∙∙HB for TA Nk are the number of fitted rescale parameters and Ebase is the baseline energy ghThe parameters
used in Figure 69b and ifor testing transferability in Figure 610b and Figure 611 ικ ικ α Ebase σintra
kJ mol-1 Nk C-C C-Cl C-H C-HB Cl-H C-N H-H H-HB H-N C-C C-Cl C-H C-HB Cl-H C-N H-H H-HB H-N
4 - 1019 - - - - - - - - 593 - - - - - - - -135 8690 108
4 - - - - - 930 - - - - - - - - 2901 - - - -530 -24891 111
4 - - - - - - - - 1839 - - - - - - - - 5101 -293 -14115 149 4 - - - - - - - 861 - - - - - - - - 3884 - -254 2058 165
4 - - - 303 - - - - - - - - 1102 - - - - - -167 -1133 168
4 181 - - - - - - - - 095 - - - - - - - - -761 13228 193
6 - - - - - 2237 173 - - - - - - - 6517 1810 - - -135 -63604 049 6 - 484 - - - 1974 - - - - 4173 - - - 7186 - - - -848 -99438 067
6 - - 1560 - - - 1856 - - - - 817 - - - 11967 - - -1311 -8678 077
6 - - - - 967 2171 - - - - - - - 4431 6977 - - - -167 -89172 078 6 659 - - - - 4409 - - - 955 - - - - 12397 - - - -1602 -99338 102
6 - - - - - - 604 - 2288 - - - - - - 2012 - 7506 -674 -27619 120 g8 - 1933 - 567 - 2165 - - - - 7289 - 2207 - 6976 - - - -102 -114180 015
8 - - - - 1957 3068 - 498 - - - - - 8130 9634 - 2647 - -096 -133767 016 8 - 1618 - - - 2874 - 676 - - 6263 - - - 8952 - 3754 - -361 -119616 023
8 - 038 - - - 2451 133 - - - 1139 - - - 7574 1528 - - -320 -83684 028
8 - - 1015 801 - - 505 - - - - 083 437 - - 11123 - - -962 -4165 037 8 - - - - 634 2650 027 - - - - - - 2075 7927 1106 - - -313 -86212 041
8 - - - - - 2211 127 367 - - - - - - 6326 1898 1248 - -009 -62350 047
8 - - 156 - - 2356 105 - - - - 189 - - 6873 1561 - - -178 -67559 051 8 - - 1422 - - - 1194 1225 - - - 1118 - - - 8625 5331 - -621 -14314 063
8 - - 768 - - - 1497 - 1353 - - 221 - - - 8154 - 2730 -436 -9301 071 h10 - 1049 - - 2600 2731 - 679 - - 366 - - 9102 8140 - 3889 - -426 -112247 008
10 - - 135 - 853 2173 - 426 - - - 404 - 2724 6867 - 2476 - -193 -83710 009 10 - 853 - - - 2386 227 583 - - 3742 - - - 7431 1238 2941 - -222 -94694 010
10 - - - - 1465 2785 089 542 - - - - - 5788 8569 720 2568 - -107 -112106 011
10 - 1143 194 457 - 2086 - - - - 4833 341 1829 - 6762 - - - -096 -102646 016 10 050 - - - 1763 2692 - 496 - 085 - - - 7084 8615 - 2744 - -032 -123424 018 i10 - - 180 - - 2079 - 604 089 - - 627 - - 6176 - 3544 883 -051 -71971 026
10 - - 413 506 - 1334 018 - - - - 473 1146 - 4010 2532 - - -067 -48308 031 10 314 - 945 1122 - - 535 - - 531 - 110 1833 - - 10029 - - -966 -9528 032
10 - 1160 743 925 - - 365 - - - 2757 057 1532 - - 8017 - - -487 -17128 036
12 - - - 093 1321 2831 314 - 1519 - - - 569 4186 8238 941 - 3812 -414 -110966 007
12 - 709 - 253 1721 2653 - - 903 - 1198 - 1091 5530 7956 - - 1792 -350 -111102 008 12 - - 237 137 1032 2350 - - 700 - - 432 702 2719 7255 - - 1037 -351 -88568 008
12 - - 425 - 843 2274 065 656 - - - 588 - 2415 6938 1356 3101 - -440 -84012 008
12 - - 046 - - 2081 536 274 1391 - - 344 - - 5722 1360 2319 5007 -245 -78093 027
14 - - 384 214 886 2010 190 - 805 - - 456 690 2056 6136 1635 - 1462 -532 -76472 008 14 - - 249 012 954 2442 - 316 410 - - 457 214 2439 7563 - 1279 209 -360 -86183 009
63 Results
153
Figure 69 Comparison of the relative energies from ab initio calculations (solid black
lines) of FA (top) and TA (bottom) with selected physical models For FA the selected
Nk=6 intra=026 kJ mol-1 model has βC-HB =801 γC-HB =1654 βH-H =1074 γH-H =58 α=-
339 and Ebase=-12383 whilst the Nk =6 intra=028 kJ mol-1 model has β C-H =028 γ C-
H =783 β H-HB = 1109 γ H-HB =3479 α=-117 and Ebase=-7549 For TA parameters for
the selected Nk=8 (intra=015 kJ mol-1) and 10 (intra=008 kJ mol-1) are in ghTable 66
In contrast to FA TA (Table 66) gave a qualitatively accurate fit only when at least
three types of atomndashatom parameters were rescaled (Nk=8) including C∙∙∙N as shown in
Figure 69 The relaxed scans were sensitive to a large number of atomndashatom distances
so that the 5 change in did not necessarily give a smooth curve between the analytical
values This was because of the differences in the molecular relaxation and resulting
atomndashatom distances not the step size because Figure 510 of Chapter 5 showed that
smaller step size for FA produced a smooth but asymmetric ab initio energy-curve All
the fits with the physically correct parameters were unique solutions (section 262)
63 Results
154
Depending on which atomic types were being fitted there were some variations in the
parameters for a given atomndashatom interaction I noticed that for TA (Table 66) the C∙∙∙N
parameters consistently needed to be drastically rescaled reflecting the importance of the
methyl carbon (R1=CH3 Figure 61) in the conformational profile of TA Indeed TA
differed from FA in having many more intramolecular atomndashatom distances that changed
significantly within the range = 0 to 145 including some within the same aromatic ring
such as the methylndashchloro interactions (Table 61 or compare Table 56 with Table 57 in
Chapter 5) Day6 also observed that pyramidalizations of atoms (eg the nitrogen atom in
an amine group) significantly affect the intramolecular parameters
By following the procedure described in the methodology (section 622) I obtained a
variety of analytical models of the form of equation 67 that could reproduce the torsional
profiles of FA and TA with a high degree of accuracy despite the significant variation in
many atomndashatom distances during the relaxed torsional scans However the analytical
model had a maximum number of parameters for FA and TA (12 and 22 respectively)
with 5 (plus 1) atomic types C H N O HB (plus Cl) when considering atomic-
type∙∙∙atomic-type interaction that contributed significantly to energy changes with
conformation Fitting too many parameters led to models where some of the fitted
parameters had the wrong sign for their physical interpretation and some of these fits for
TA showed a linear dependence between the parameters (ie the fitted parameters were
not unique section 262) Nonetheless the ease with which this physically justified model
(equation 67) could reproduce the conformational dependence of FA and TA shows that
this approach to modelling the intramolecular energies of fenamates is promising
634 Transferability A further investigation of the physical reasonableness of the atomndashatom plus electronic
functional form (equation 67) is to test whether the models transfer to related molecules
The difference between the energy scans when the substituents are far from the varying
torsion angle for example the change of H to Cl atom ie from FA to ClFA or between
TA and MA (Figure 511) should not change the main steric interactions and should only
have a small effect on the electronic term (Figure 515e and f)
Transferring a set of parameters fitted to FA and adding Gavezzottirsquos Cl parameters
did indeed (Figure 610) give some of the asymmetry in the well depths seen for ClFA
and the higher central barrier as compared to FA (Figure 511) when the electronic term
was fitted Similarly a set of parameters fitted to TA could reproduce the lower barrier
at = 90 and higher barrier at = 0 in MA (Figure 610b) despite the fact that the
63 Results
155
conformational relaxation of the methylndashmethyl interaction was somewhat different from
that of the methyl-chloro geometry (Figure 513)
Figure 610 Comparison of the relative energies from ab initio calculations (solid black
lines) with models using transferred βικ and γικ parameters from FA and TA (dotted grey
plots) to ClFA (top) and MA (bottom) respectively The red curve has only had the
baseline adjusted whereas the blue curve had the parameter refitted to ClFA or MA
respectively The transferred FA parameters are those Nk=6 fit=028 kJ mol-1 in Figure
69 while those of TA Nk= 10 fit= =026 kJ mol-1 are shown in iTable 66
A more stringent test would be to apply the same TA parameters to FA and ClFA
which gave qualitatively correct results around the minima (Figure 611) and the steric
barriers at 0 and 180 However the barrier height around 90 would remain similar to
that in TA and this underestimation would be only partially corrected by refitting the
cos(2) term Given the limitations in the parameter optimization the qualitative
63 Results
156
accuracy is promising In particular the poorer transferability may be attributable to the
fact that the fitting of parameters for C and H interactions in TA was modelling both the
aromatic and methyl atoms and the methyl∙∙∙N interaction was critical in fitting the
parameters to the TA profile
Figure 611 Comparison of the relative energies from ab initio calculations (solid black
lines) with models using βικ and γικ parameters transferred from TA (dotted grey plots) to
(a) FA and (b) ClFA The red curve has only had the baseline adjusted whereas the blue
curve has the parameter refitted to FA or ClFA respectively The transferred TA
parameters are those of Nk= 10 fit= 026 kJ mol-1 as shown in iTable 66
64 Summary
157
64 Summary Neither the cosine terms nor the analytical models that rescaled overestimated repulsion
contributions were adequate for modelling the conformational profile of fenamates
However a physically justified modelmdashone that combined a cos2 term with an
intramolecular exp-6 atomndashatom term for all atom pairs separated by three or more bonds
(1-4 and above)mdashallowed for a very effective representation of the ab initio
conformational energies In this chapter I successfully fitted conformational profiles of
FA and TA to the cos2 plus exp-6 model This success suggests that the separation of
intramolecular and intermolecular forces is a promising new method for discovering force
fields that are more accurate which could in turn pave the way for modelling the
condensed phases of pharmaceutical-like organic molecules Considering a wide range of
molecules and bigger dataset could improve the transferability of this physical model
71 Position of CSP in the Context of this Thesis
158
Chapter 7 Conclusions and Future Work
ldquoIt is good to have an end to journey toward but it is the journey that matters in the
endrdquo
mdash Ernest Hemingway
71 Position of CSP in the Context of this Thesis The CSP results of Chapters 3 and 4 successfully validated the ability of
CrystalPredictor to generate crystal structures of flexible molecules In Chapter 3 I
successfully predicted the crystal structure of BT which has an unusual and unexpected
packing The success required the use of distributed multipoles and ab initio calculations
of intramolecular energy This success inspires hope that the use of multipolar
electrostatic models (as being implemented in the second-generation force fields such as
AMOEBA91) with careful evaluation of the accuracy of the intramolecular forces will
provide a route to greater reliability for computer-aided drug design with uncommon
ligands However the failure of a conventional point charge electrostatic model used in
the intermediate step has considerable implications for other studies that rely on
modelling the intermolecular interactions of 1-substituted 1H-tetrazoles
Chapter 4 successfully investigated the concept of polymorphophore via CSP studies
of FA and TA in an attempt to understand why polymorphism occurs I discovered that
the fenamate fragment did qualify as a polymorphophore in that the dimeric unit could
pack in a variety of ways with different torsion angles of the phenyl groups due to the
torsional flexibility of FA and TA Once the aromatic rings had interdigitated with their
nearest neighbours there was a large barrier to rearrangement to a very different packing
and the polymorphs were long-lived with the torsion angles varying slightly to optimize
the packing for a given structure as we saw for TA It was however the comparison
between the FA and TA crystal energy landscapes that showed that it was the substituents
that played the major role in determining the possible packing and relative energies and
hence the polymorphic behaviours of FA and TA These observations clearly
demonstrate the links among conformational flexibility polymorphism and
polymorphophore
The considerable similarity in large clusters of the known and hypothetical structures
of TA and the closeness of their energies suggested that crystal growth errors were very
likely More importantly though this finding guided my colleague in the discovery of a
new polymorph of TA (form VI) which was nucleated by solution evaporation after
72 Towards more accurate force-fields for pharmaceutical molecules
159
dissolving TA (form I) in ethanol and seeding it with mefenamic acid (form I) The major
component of this new form (form VI is disordered 65 and 35) was not among the
crystal structures on the final energy landscape despite generating the corresponding
hypothetical structure during an intermediate step (CrystalPredictor) Although this
observation emphasised the success of the CrystalPredictor algorithm it also showed the
need for larger numbers of crystal structures to go through CrystalOptimizer This need
for a larger dataset in the subsequent CrystalOptimizer step raises the question ldquoIs there
a clear cut-off in energy for flexible moleculesrdquo This question is even more relevant
when you consider that desolvated solvates can have much higher energy than organic
crystal structures247 In fact it might even be desirable to go even higher in energy due to
likely high conformation energy of the desolvated solvates The CrystalOptimizer
algorithm does allow the build-up of a database known as Local Approximate Models
(LAMs) but it would be preferable to be able to check many more structures If we could
better fit intramolecular energy which requires the bulk of the computing time to a force
field we would be able to compute the energies of many more structures of a target
molecule In addition computing the energies of the higher-energy structures would be
much cheaper
Chapters 3 and 4 used methods suitable for studying flexible molecules17 as the ab
initio charge density for the specific conformation was used in modelling the
intermolecular interactions thus representing the interplay between molecular
conformation and intermolecular interactions which have been shown to be important for
TA211 Conformational changes can optimise the directionality of strong interactions
such as H-bonding and increase the packing density and hence the stabilization of the
structure by dispersion forces Although CSP methodologies have advanced to aid solid
form screening in pharmaceutical development247-250 it is nevertheless desirable to
calculate the relative free energies of organic polymorphs via molecular dynamics
methods251-253 Although there has been a great push to include the kinetics and their
ability to control the polymorphs formed1 a vital first step is to develop a sound
understanding of thermodynamics
72 Towards more accurate force-fields for pharmaceutical molecules The challenge of extending the reliability and accuracy of quantum mechanical
methods to larger molecules which are more typical of pharmaceuticals and realistic
biological molecules in isolation or condensed phases is the subject of active research
This research ranges from empirical corrections to DFT methods to the use of better
73 Future Work
160
functionals254 as well as implementing explicitly correlated wavefunction methods more
effectively
Chapter 5 emphasized the challenges with using a sufficiently realistic method for the
ab initio determination of conformational energies for larger molecules For example the
HF method provides a qualitatively wrong and misleading conformational profile of FA
and TA due to the absence of the dispersion (correlation effect) contribution Dispersion
also plays an important role in the barrier to rotation for the fenamates especially when
the aromatic rings are perpendicular to one another The analysis of the fenamatesrsquo
torsional potential revealed that the origin of the torsional barrier of the fenamates is a
combination of intrinsic intramolecular dispersion electronic contribution and the steric
repulsion In addition small changes to other conformational angles made significant
contributions to the torsional profile of the fenamate molecules
In Chapter 6 a physically motivated analytical modelndashndashcos2 term combined with an
intramolecular exp-6 atomndashatom term for all atom pairs separated by three or more
bondsndashndashwas derived using knowledge gained from Chapter 5 This model accurately fits
the intramolecular energy profiles of FA and TA This approach of modelling the
conformational energies of the fenamates could be extended to pharmaceutical-like
flexible organics
73 Future Work One can envisage a general scheme for determining the physically motivated potentials
(Chapter 6) for a given molecule following a CSP study by an approach that is being
developed127 and applied to pharmaceutical molecules247-249255 The refinement of the
molecular conformations simultaneously with the crystallographic cell using
CrystalOptimizer72 involves the calculation and storage of a large database (LAMs) of ab
initio conformational energies and forces for the molecule For example the CSP studies
for FA and TA contain the results of hundreds of molecular wavefunction calculations
with varying torsion and bond angles
The database generated in a CSP study will cover most of the range of conformations
that are likely to be sampled in a Molecular Dynamics study of the molecules in
condensed phases with a strong bias towards the conformations that occur in low-energy
crystal structures both observed and potential polymorphs1 The LAMs database could
be used to improve the parameterization of the analytical conformational energy model
adapting the potential fitting routines (Appendix A) used in Chapter 6 An advantage of
using an analytical functional form rather than the LAMs to interpolate between the ab
73 Future Work
161
initio points in the CSP study is that the extrapolation to other conformations will be more
realistic The great benefit of this scheme of building up from a CSP study for a specific
molecule is that the model intramolecular force field could be validated by ensuring that
the model reproduces the crystal energy landscape ie the energies of different packing
H-bonding and stacking modes are correctly balanced with the accompanying
conformational changes
The application of separate analytical potentials for both intra- and intermolecular terms
will require adaptation of molecular modelling codes However the coding for the
energies forces and second derivatives of the proposed intramolecular force field
(equation 67) is already present in most codes After inserting the new parameters the
major adaptation that will be required for an existing codendashndashone that uses traditional force
fields such as DL_POLY251256 for Molecular Dynamics simulationsndashndashis separating out
the calculation of inter- and intramolecular terms Accurate intramolecular forces are
most needed in combination with the accurate anisotropic atom-atom intermolecular
potentials for organic molecules where the electrostatic term is represented by atomic
multipoles for example the static organic crystal structure modelling code
DMACRYS34 or the rigid molecule molecular dynamics code DL_MULTI257
Furthermore the adaptation of molecular modelling code would require an adequate
representation for the conformation dependence of the distributed multipoles for specific
molecules but the dependency could be represented by an analytical model258
Although this change in approach to pharmaceutical force fields involves envisaging a
specific model fitted for each molecule the physical basis of the current model and the
results from Chapter 6 suggest that a reasonably transferable set of atom-atom
intramolecular exp-6 potentials could be fitted for families of molecules Deriving a
transferable model would require a very large dataset of ab initio conformational profiles
of many molecules calculated at an appropriate accuracy The transferability of the
electronic term ( coefficients) would need investigating However the use of separate
atom-atom models for the forces within and between molecules appears to provide a
significant improvement in the realism of current force fields In conclusion this
approach could potentially provide an affordable route for Molecular Dynamics
simulations of flexible pharmaceuticals that have the accuracy of CSP
Appendix A
162
Appendix A Contents of enclosed CD-ROM
The CD-ROM attached to this thesis contains FORTRAN source codes of the analytical
models presented in Chapter 6 as well as some of the input files The input data for FA
TA MFA and ClFA that were used in conjunction with the source codes are in directory
A1 The inputs files included for each molecule are as follows
a) The summaryr contains a summary of the flexible degree of freedom ξ and
the intramolecular energy relative to the most stable conformation ΔEintra
b) The geometries of all the optimised conformation in mol2 file format
The source codes and example input files are in directories A2 (cosine model) A3
(rescaled repulsion model) and A4 (physical model) The A2 directory contains
a) an executable file (cos_modelexe)
b) FORTRAN source code (cos_modelf90)
c) input (summaryr) file
d) output (dominantr) file
The A3 and A4 directories contain
a) an executable file (exe)
b) FORTRAN source code (f90)
c) output (dominantr) file
d) an input subdirectory that contains
i Gavezzottirsquos exp-6 atom-atom parameters from Table 52
ii h03adfe subroutine computes the nearest neighbour of two atoms and
iii summaryr file
The A5 directory contains a utility file (extract_mol2sh) that extracts the input data
(summaryr and all the optimised conformations in mol2) from the GAUSSIAN0353
(log) file
Bibliography
163
Bibliography
1 Price S L Why dont we find more polymorphs Acta Crystallogr Sect B
2013 69 313-328
2 Price S L Predicting crystal structures of organic compounds Chem Soc Rev
2014 43 (7) 2098-2111
3 Svaumlrd M Structural Kinetic and Thermodynamic Aspects of the Crystal
Polymorphism of Substituted Monocyclic Aromatic Compounds 2011
4 Svaumlrd M Nordstroumlm F L Jasnobulka T Rasmuson Aring C Thermodynamics
and Nucleation Kinetics of m-Aminobenzoic Acid Polymorphs Cryst Growth
Des 2009 10 (1) 195-204
5 Chemburkar S R Bauer J Deming K Spiwek H Patel K Morris J
Henry R Spanton S Dziki W Porter W Quick J Bauer P Donaubauer
J Narayanan B A Soldani M Riley D McFarland K Dealing with the
impact of ritonavir polymorphs on the late stages of bulk drug process
development Org Process Res Dev 2000 4 (5) 413-417
6 Day G M Current approaches to predicting molecular organic crystal structures
Crystallography Reviews 2011 17 (1) 3-52
7 Byrn S R Pfeiffer R Ganey M Hoiberg C Poochikian G Pharmaceutical
Solids - A Strategic Approach to Regulatory Considerations Pharmaceut Res
1995 12 (7) 945-954
8 Price S L Lattice energy nailed Science 2014 345 (6197) 619-620
9 Newman A Specialized Solid Form Screening Techniques Org Process Res
Dev 2013 17 (3) 457-471
10 Day G M Cooper T G Cruz-Cabeza A J Hejczyk K E Ammon H L
Boerrigter S X M Tan J Della Valle R G Venuti E Jose J Gadre S R
Desiraju G R Thakur T S van Eijck B P Facelli J C Bazterra V E
Ferraro M B Hofmann D W M Neumann M Leusen F J J Kendrick J
Price S L Misquitta A J Karamertzanis P G Welch G W A Scheraga
H A Arnautova Y A Schmidt M U van de Streek J Wolf A Schweizer
B Significant progress in predicting the crystal structures of small organic
molecules - a report on the fourth blind test Acta Crystallogr Sect B 2009 65
(2) 107-125
11 Bardwell D A Adjiman C S Arnautova Y A Bartashevich E Boerrigter
S X Braun D E Cruz-Cabeza A J Day G M la Valle R G Desiraju G
R van Eijck B P Facelli J C Ferraro M B Grillo D Habgood M
Hofmann D W Hofmann F Jose K V Karamertzanis P G Kazantsev A
V Kendrick J Kuleshova L N Leusen F J Maleev A V Misquitta A J
Mohamed S Needs R J Neumann M A Nikylov D Orendt A M Pal R
Pantelides C C Pickard C J Price L S Price S L Scheraga H A van de
Bibliography
164
Streek J Thakur T S Tiwari S Venuti E Zhitkov I K Towards crystal
structure prediction of complex organic compounds - a report on the fifth blind
test Acta Crystallogr Sect B 2011 67 (6) 535-551
12 Price S L Developing Methods of Crystal Structure and Polymorph Prediction
Implications of Molecular and Materials Structures for New Technologies 1999
315-320
13 Neumann M A Tailor-made force fields for crystal-structure prediction J Phys
Chem B 2008 112 (32) 9810-9829
14 Price S L Computed crystal energy landscapes for understanding and predicting
organic crystal structures and polymorphism Accounts Chem Res 2009 42 (1)
117-126
15 Groom C R Reilly A M Sixth blind test of organic crystal-structure prediction
methods Acta Crystallogr Sect B 2014 70 (4) 776-777
16 Beyer T Lewis T Price S L Which organic crystal structures are predictable
by lattice energy minimisation CrystEngComm 2001 3 (44) 178-212
17 Kazantsev A V Karamertzanis P G Adjiman C S Pantelides C C Price
S L Galek P T Day G M Cruz-Cabeza A J Successful prediction of a
model pharmaceutical in the fifth blind test of crystal structure prediction Int J
Pharm 2011 418 (2) 168-178
18 Lopez-Mejias V Kampf J W Matzger A J Nonamorphism in Flufenamic
Acid and a New Record for a Polymorphic Compound with Solved Structures J
Am Chem Soc 2012 134 (24) 9872-9875
19 Lopez-Mejias V Kampf J W Matzger A J Polymer-Induced
Heteronucleation of Tolfenamic Acid Structural Investigation of a Pentamorph
J Am Chem Soc 2009 131 (13) 4554-4555
20 Yu L Polymorphism in Molecular Solids An Extraordinary System of Red
Orange and Yellow Crystals Accounts Chem Res 2010 43 (9) 1257-1266
21 Chen S A Xi H M Yu L Cross-nucleation between ROY polymorphs J
Am Chem Soc 2005 127 (49) 17439-17444
22 Murthy H K Bhat T N Vijayan M Structural studies of analgesics and their
interactions 9 Structure of a new crystal form of 2-([3-(trifluoromethyl) phenyl]
amino) benzoic acid (flufenamic acid) Acta Crystallogr Sect B 1982 38 (JAN)
315-317
23 Lutker K M Tolstyka Z P Matzger A J Investigation of a privileged
polymorphic motif A dimeric ROY derivative Cryst Growth Des 2008 8 (1)
136-139
24 Price S L Price L S Modelling Intermolecular Forces for Organic Crystal
Structure Prediction In Intermolecular Forces and Clusters I Wales D J Ed
Springer-Verlag Berlin Heidelberg Germany 2005 pp 81-123
Bibliography
165
25 Bernstein J Polymorphism in Molecular Crystals Clarendon Press Oxford
2002
26 Stone A J The Theory of Intermolecular Forces 2 ed Oxford University Press
Oxford 2013
27 Buckingham A D Utting B D Intermolecular Forces Annu Rev Phys Chem
1970 21 (1) 287-316
28 Maitland G C Rigby M Smith E B Wakeham W A Intermolecular
Forces Their Origin and Determination Clarendon Press Oxford 1981
29 Israelachvili J Intermolecular and Surface Forces Third Edition Academic
Press 2010
30 London F The general theory of molecular forces Trans Faraday Soc 1937
33 8b-26
31 Spencer N D Moore J H Encyclopedia of Chemical Physics and Physical
Chemistry Fundamentals 1 ed Taylor amp Francis 2001pp 1004
32 Welch G W A Karamertzanis P G Misquitta A J Stone A J Price S L
Is the induction energy important for modeling organic crystals J Chem Theory
Comput 2008 4 (3) 522-532
33 Price S L From crystal structure prediction to polymorph prediction interpreting
the crystal energy landscape Phys Chem Chem Phys 2008 10 (15) 1996-2009
34 Price S L Leslie M Welch G W A Habgood M Price L S
Karamertzanis P G Day G M Modelling Organic Crystal Structures using
Distributed Multipole and Polarizability-Based Model Intermolecular Potentials
Phys Chem Chem Phys 2010 12 (30) 8478-8490
35 Freitag M A Gordon M S Jensen J H Stevens W J Evaluation of charge
penetration between distributed multipolar expansions J Chem Phys 2000 112
(17) 7300-7306
36 Lund A M Orendt A M Pagola G I Ferraro M B Facelli J C
Optimization of Crystal Structures of Archetypical Pharmaceutical Compounds
A Plane-Wave DFT-D Study Using Quantum Espresso Crystal Growth amp Design
2013 13 (5) 2181-2189
37 Neumann M A Perrin M A Energy ranking of molecular crystals using
density functional theory calculations and an empirical van der Waals correction
J Phys Chem B 2005 109 (32) 15531-15541
38 Cox S R Hsu L Y Williams D E Nonbonded Potential Function Models for
Crystalline Oxohydrocarbons Acta Crystallogr Sect A 1981 37 (MAY) 293-
301
Bibliography
166
39 Williams D E Cox S R Nonbonded Potentials For Azahydrocarbons the
Importance of the Coulombic Interaction Acta Crystallogr Sect B 1984 40 (8)
404-417
40 Coombes D S Price S L Willock D J Leslie M Role of Electrostatic
Interactions in Determining the Crystal Structures of Polar Organic Molecules A
Distributed Multipole Study J Phys Chem 1996 100 (18) 7352-7360
41 Gavezzotti A Theoretical Aspects and Computer Modeling of the Molecular
Solid State John Wiley Chichester 1997 Vol 1
42 Filippini G Gavezzotti A Empirical Intermolecular Potentials For Organic-
Crystals the 6-Exp Approximation Revisited Acta Crystallogr Sect B 1993
B49 868-880
43 Williams D E Weller R R Lone-Pair Electronic Effects On the Calculated
Abinitio Scf-Mo Electric-Potential and the Crystal-Structures of Azabenzenes J
Am Chem Soc 1983 105 (13) 4143-4148
44 Karamertzanis P G Pantelides C C Optimal site charge models for molecular
electrostatic potentials Mol Simulat 2004 30 (7) 413-436
45 Spackman M A Molecular Electric Moments from X-ray Diffraction Data
Chem Rev 1992 92 1769-1797
46 Breneman C M Wiberg K B Determining Atom-Centered Monopoles From
Molecular Electrostatic Potentials - the Need For High Sampling Density in
Formamide Conformational-Analysis J Comput Chem 1990 11 (3) 361-373
47 Francl M M Carey C Chirlian L E Gange D M Charges fit to electrostatic
potentials II Can atomic charges be unambiguously fit to electrostatic potentials
J Comput Chem 1996 17 (3) 367-383
48 Stone A J Alderton M Distributed Multipole Analysis - Methods and
Applications Molecular Physics 1985 56 (5) 1047-1064
49 Welch G W A The induction contribution to the lattice energy of organic
crystals PhD 2010
50 Stone A J Distributed Multipole Analysis or How to Describe a Molecular
Charge Distribution Chemical Physics Letters 1981 83 (2) 233-239
51 Stone A J Distributed multipole analysis Stability for large basis sets J Chem
Theory Comput 2005 1 (6) 1128-1132
52 GDMA A Program for Performing Distributed Multipole Analysis of Wave
Functions Calculated Using the Gaussian Program System version 22
University of Cambridge Cambridge United Kingdom 2010
53 Gaussian 03 Gaussian Inc Wallingford CT 2004
Bibliography
167
54 GDMA A Program for Performing Distributed Multipole Analysis of Wave
Functions Calculated Using the Gaussian Program System version 10
University of Cambridge Cambridge United Kingdom 1999
55 Price S L Computational prediction of organic crystal structures and
polymorphism Int Rev Phys Chem 2008 27 (3) 541-568
56 Kazantsev A V Molecular Flexibility in Crystal Structure Prediction PhD
Imperial College London 2011
57 Smith W Point multipoles in the Ewald summation CCP5 Quarterly 1982 4
13-25
58 Cruz-Cabeza A J Bernstein J Conformational Polymorphism Chem Rev
2014 114 (4) 2170-2191
59 Cornell W D Cieplak P Bayly C I Gould I R Merz K M Ferguson D
M Spellmeyer D C Fox T Caldwell J W Kollman P A A Second
Generation Force-Field For the Simulation of Proteins Nucleic-Acids and
Organic-Molecules (Vol 117 Pg 5179 1995) J Am Chem Soc 1996 118 (9)
2309
60 van Mourik T Karamertzanis P G Price S L Molecular conformations and
relative stabilities can be as demanding of the electronic structure method as
intermolecular calculations J Phys Chem A 2006 110 (1) 8-12
61 van Mourik T Assessment of Density Functionals for Intramolecular Dispersion-
Rich Interactions J Chem Theory Comput 2008 4 (10) 1610-1619
62 Comba P Hambley T W Martin B Molecular modeling of inorganic
compounds John Wiley amp Sons 2009
63 Leach A R Molecular Modelling Principles and Applications Longman
Harlow 1996
64 Goodman J M Chemical Applications of Molecular Modelling Royal Society
of Chemistry Cambridge UK 1998
65 Brodersen S Wilke S Leusen F J J Engel G A study of different
approaches to the electrostatic interaction in force field methods for organic
crystals Phys Chem Chem Phys 2003 5 (21) 4923-4931
66 Lommerse J P M Motherwell W D S Ammon H L Dunitz J D
Gavezzotti A Hofmann D W M Leusen F J J Mooij W T M Price S
L Schweizer B Schmidt M U van Eijck B P Verwer P Williams D E
A test of crystal structure prediction of small organic molecules Acta Crystallogr
Sect B 2000 56 697-714
67 Motherwell W D S Ammon H L Dunitz J D Dzyabchenko A Erk P
Gavezzotti A Hofmann D W M Leusen F J J Lommerse J P M Mooij
W T M Price S L Scheraga H Schweizer B Schmidt M U van Eijck
Bibliography
168
B P Verwer P Williams D E Crystal structure prediction of small organic
molecules a second blind test Acta Crystallogr Sect B 2002 58 647-661
68 Ponder J W Case D A Force fields for protein simulations Protein
Simulations 2003 66 27-86
69 Cornell W D Howard A E Kollman P Molecular mechanical potential
functions and their application to study molecular systems Current Opinion in
Structural Biology 1991 201-212 Curr Opin Struc Biol 1991 1 (2) 201-212
70 Comba P Hambley T W Martin B Molecular modeling of inorganic
compounds 2009 3rd completely rev and enlarged ed
71 Kazantsev A V Karamertzanis P G Adjiman C S Pantelides C C
CrystalOptimizer An efficient Algorithm for Lattice Energy Minimisation of
Organic Crystal using Isolated-Molecule Quantum Mechanical Calculations In
Molecular System Engineering Adjiman C S Galindo A Eds WILEY-VCH
Verlag GmbH amp Co Weinheim 2010 Vol 6 pp 1-42
72 Kazantsev A V Karamertzanis P G Adjiman C S Pantelides C C
Efficient Handling of Molecular Flexibility in Lattice Energy Minimization of
Organic Crystals J Chem Theory Comput 2011 7 (6) 1998-2016
73 Jones J E On the Determination of Molecular Fields II From the Equation of
State of a Gas Proceedings of the Royal Society of London Series A 1924 106
(738) 463-477
74 Weiner S J Kollman P A Case D A Singh U C Ghio C Alagona G
Profeta S Weiner P A New Force-Field for Molecular Mechanical Simulation
of Nucleic-Acids and Proteins J Am Chem Soc 1984 106 (3) 765-784
75 Momany F A McGuire R F Burgess A W Scheraga H A Energy
parameters in polypeptides VII Geometric parameters partial atomic charges
nonbonded interactions hydrogen bond interactions and intrinsic torsional
potentials for the naturally occurring amino acids J Phys Chem 1975 79 (22)
2361-2381
76 Nemethy G Pottle M S Scheraga H A Energy parameters in polypeptides
9 Updating of geometrical parameters nonbonded interactions and hydrogen
bond interactions for the naturally occurring amino acids J Phys Chem 1983
87 (11) 1883-1887
77 Hagler A T Lifson S Energy functions for peptides and proteins II Amide
hydrogen bond and calculation of amide crystal properties J Am Chem Soc
1974 96 (17) 5327-5335
78 Hagler A T Huler E Lifson S Energy functions for peptides and proteins I
Derivation of a consistent force field including the hydrogen bond from amide
crystals J Am Chem Soc 1974 96 (17) 5319-5327
Bibliography
169
79 Jorgensen W L Quantum and statistical mechanical studies of liquids 10
Transferable intermolecular potential functions for water alcohols and ethers
Application to liquid water J Am Chem Soc 1981 103 (2) 335-340
80 Wang J M Wolf R M Caldwell J W Kollman P A Case D A
Development and testing of a general amber force field J Comput Chem 2004
25 (9) 1157-1174
81 Brooks B R Bruccoleri R E Olafson B D States D J Swaminathan S
Karplus M CHARMM A Program for Macromolecular Energy Minimization
and Dynamics Calculations J Comput Chem 1983 4 (2) 187-217
82 Becker O M Computational biochemistry and biophysics M Dekker New
York 2001
83 MacKerell A D Bashford D Bellott Dunbrack R L Evanseck J D Field
M J Fischer S Gao J Guo H Ha S Joseph-McCarthy D Kuchnir L
Kuczera K Lau F T K Mattos C Michnick S Ngo T Nguyen D T
Prodhom B Reiher W E Roux B Schlenkrich M Smith J C Stote R
Straub J Watanabe M Wiorkiewicz-Kuczera J Yin D Karplus M All-
Atom Empirical Potential for Molecular Modeling and Dynamics Studies of
Proteins J Phys Chem B 1998 102 (18) 3586-3616
84 Vanommeslaeghe K Hatcher E Acharya C Kundu S Zhong S Shim J
Darian E Guvench O Lopes P Vorobyov I Mackerell A D CHARMM
general force field A force field for drug-like molecules compatible with the
CHARMM all-atom additive biological force fields J Comput Chem 2010 31
(4) 671-690
85 Jorgensen W L Tirado-Rives J Potential energy functions for atomic-level
simulations of water and organic and biomolecular systems P Natl Acad Sci
USA 2005 102 (19) 6665-6670
86 Allinger N L Chen K Lii J H An improved force field (MM4) for saturated
hydrocarbons J Comput Chem 1996 17 (5-6) 642-668
87 Halgren T A Merck molecular force field 1 Basis form scope
parameterization and performance of MMFF94 J Comput Chem 1996 17 (5-
6) 490-519
88 Allinger N L Conformational analysis 130 MM2 A hydrocarbon force field
utilizing V1 and V2 torsional terms J Am Chem Soc 1977 99 (25) 8127-8134
89 Caleman C van Maaren P J Hong M Hub J S Costa L T van der Spoel
D Force Field Benchmark of Organic Liquids Density Enthalpy of
Vaporization Heat Capacities Surface Tension Isothermal Compressibility
Volumetric Expansion Coefficient and Dielectric Constant J Chem Theory
Comput 2011 8 (1) 61-74
90 Stouch T R The errors of our ways taking account of error in computer-aided
drug design to build confidence intervals for our next 25 years J Comput -Aided
Mol Des 2012 26 (1) 125-134
Bibliography
170
91 Ponder J W Wu C J Ren P Y Pande V S Chodera J D Schnieders M
J Haque I Mobley D L Lambrecht D S DiStasio R A Head-Gordon
M Clark G N I Johnson M E Head-Gordon T Current Status of the
AMOEBA Polarizable Force Field J Phys Chem B 2010 114 (8) 2549-2564
92 Day G M Motherwell W D S Jones W Beyond the isotropic atom model in
crystal structure prediction of rigid molecules Atomic multipoles versus point
charges Cryst Growth Des 2005 5 (3) 1023-1033
93 Marshall G R Limiting assumptions in molecular modeling electrostatics J
Comput -Aided Mol Des 2013 27 (2) 107-114
94 Payne R S Rowe R C Roberts R J Charlton M H Docherty R Potential
polymorphs of aspirin J Comput Chem 1999 20 (2) 262-273
95 Gourlay M D Kendrick J Leusen F J J Rationalization of racemate
resolution Predicting spontaneous resolution through crystal structure prediction
Cryst Growth Des 2007 7 (1) 56-63
96 Uzoh O G Analytically Modelling Intramolecular Energies of Fenamic and
Tolfenamic Acids Unpublished Work 2013
97 NAG Fortran Library Routine Document G02DDF Oxford United Kingdom
1989
98 Beran G J Hirata S Fragment and localized orbital methods in electronic
structure theory Physical Chemistry Chemical Physics 2012 14 (21) 7559-7561
99 Orio M Pantazis D A Neese F Density functional theory Photosynthesis
Research 2009 102 (2-3) 443-453
100 Sherrill C D An introduction to Hartree-Fock molecular orbital theory School
of Chemistry and Biochemistry Georgia Institute of Technology 2000
101 Shaik S S Hiberty P C A chemists guide to valence bond theory John Wiley
amp Sons 2007
102 Wu W Su P F Shaik S Hiberty P C Classical Valence Bond Approach by
Modern Methods Chem Rev 2011 111 (11) 7557-7593
103 Gasteiger J Engel T Chemoinformatics a textbook John Wiley amp Sons 2006
104 Fukui K Yonezawa T Shingu H A Molecular Orbital Theory of Reactivity in
Aromatic Hydrocarbons J Chem Phys 1952 20 (4) 722-725
105 Bell S Dines T J Chowdhry B Z Withnall R Computational chemistry
using modern electronic structure methods J Chem Educ 2007 84 (8) 1364-
1370
106 Moller C Plesset M S Note on an approximation treatment for many-electron
systems Phys Rev 1934 46 618-622
Bibliography
171
107 Valdes H Klusak V Pitonak M Exner O Stary I Hobza P Rulisek L
Evaluation of the intramolecular basis set superposition error in the calculations
of larger molecules [n]Helicenes and Phe-Gly-Phe tripeptide J Comput Chem
2008 29 (6) 861-870
108 Simon S Duran M Dannenberg J J How does basis set superposition error
change the potential surfaces for hydrogen bonded dimers Journal of Chemical
Physics 1996 105 (24) 11024-11031
109 Szczesniak M M Scheiner S Correction of the Basis Set Superposition Error
in SCF and MP2 Interaction Energies - the Water Dimer J Chem Phys 1986 84
(11) 6328-6335
110 Stephens P J Devlin F J Chabalowski C F Frisch M J Ab-Initio
Calculation of Vibrational Absorption and Circular-Dichroism Spectra Using
Density-Functional Force-Fields J Phys Chem 1994 98 (45) 11623-11627
111 Car R Introduction to density-functional theory and ab-initio molecular
dynamics Quant Struct -Act Rel 2002 21 (2) 97-104
112 Grimme S Antony J Schwabe T Muck-Lichtenfeld C Density functional
theory with dispersion corrections for supramolecular structures aggregates and
complexes of (bio)organic molecules Organic amp Biomolecular Chemistry 2007
5 (5) 741-758
113 Kohn W Becke A D Parr R G Density functional theory of electronic
structure J Phys Chem 1996 100 (31) 12974-12980
114 Hohenberg P Kohn W Inhomogeneous Electron Gas Physical Review B 1964
136 (3B) B864-B871
115 Kohn W Sham L J Self-consistent equations including exchange and
correlation effects Phys Rev 1965 140 (4A) A1133
116 Becke A D Density-Functional Thermochemistry 3 the Role of Exact
Exchange J Chem Phys 1993 98 (7) 5648-5652
117 Lee C T Yang W T Parr R G Development of the Colle-Salvetti
Correlation-Energy Formula Into A Functional of the Electron-Density Phys
Rev B 1988 37 (2) 785-789
118 Adamo C Barone V Toward reliable density functional methods without
adjustable parameters The PBE0 model J Chem Phys 1999 110 (13) 6158-
6170
119 Sherrill C D Introduction to Electron Correlation School of Chemistry and
Biochemistry Georgia Institute of Technology 2008
120 Grafenstein J Cremer D An efficient algorithm for the density-functional
theory treatment of dispersion interactions J Chem Phys 2009 130 (12)
Bibliography
172
121 Grimme S Density functional theory with London dispersion corrections Wiley
Interdisciplinary Reviews-Computational Molecular Science 2011 1 (2) 211-
228
122 Grimme S Antony J Ehrlich S Krieg H A consistent and accurate ab initio
parametrization of density functional dispersion correction (DFT-D) for the 94
elements H-Pu J Chem Phys 2010 132 (15) 154104
123 Brown T L Chemistry The Central Science Pearson Education 2009
124 Gavezzotti A Filippini G Polymorphic Forms of Organic-Crystals at Room
Conditions - Thermodynamic and Structural Implications J Am Chem Soc
1995 117 (49) 12299-12305
125 Karamertzanis P G Prediction of crystal structure of molecular solids PhD
Imperial College London 2004
126 Karamertzanis P G Pantelides C C Ab initio crystal structure prediction II
Flexible molecules Mol Phys 2007 105 (2-3) 273-291
127 Vasileiadis M Kazantsev A V Karamertzanis P G Adjiman C S
Pantelides C C The polymorphs of ROY application of a systematic crystal
structure prediction technique Acta Crystallogr Sect B 2012 68 (6) 677-685
128 Sobol I M On the distribution of points in a cube and the approximate evaluation
of integrals USSR Comp Math Math Phys 1967 7 86-112
129 The NAG Fortran Library Oxford United Kingdom 2013
130 Karamertzanis P G Price S L Energy Minimization of Crystal Structures
Containing Flexible Molecules J Chem Theory Comput 2006 2 (4) 1184-1199
131 Cooper T G Hejczyk K E Jones W Day G M Molecular Polarization
Effects on the Relative Energies of the Real and Putative Crystal Structures of
Valine J Chem Theory Comput 2008 4 (10) 1795-1805
132 Mennucci B Tomasi J Continuum solvation models A new approach to the
problem of solutes charge distribution and cavity boundaries J Chem Phys
1997 106 (12) 5151-5158
133 Habgood M Price S L Portalone G Irrera S Testing a Variety of Electronic-
Structure-Based Methods for the Relative Energies of 5-Formyluracil Crystals J
Chem Theory Comput 2011 7 (9) 2685-2688
134 Karamertzanis P G Pantelides C C Ab initio crystal structure prediction - I
Rigid molecules Journal of Computational Chemistry 2005 26 (3) 304-324
135 Williams D E Improved intermolecular force field for molecules containing H
C N and O atoms with application to nucleoside and peptide crystals J Comput
Chem 2001 22 (11) 1154-1166
Bibliography
173
136 Day G M Motherwell W D S Jones W A strategy for predicting the crystal
structures of flexible molecules the polymorphism of phenobarbital Physical
Chemistry Chemical Physics 2007 9 (14) 1693-1704
137 Kendrick J Leusen F J Neumann M A van de Streek J Progress in Crystal
Structure Prediction Chemistry - A European Journal 2011 17 (38) 10735-
10743
138 Braun D E Karamertzanis P G Price S L Which if any hydrates will
crystallise Predicting hydrate formation of two dihydroxybenzoic acids Chem
Commun 2011 47 (19) 5443-5445
139 Cruz-Cabeza A J Karki S Fabian L Friscic T Day G M Jones W
Predicting stoichiometry and structure of solvates Chem Commun 2010 46 (13)
2224-2226
140 Karamertzanis P G Kazantsev A V Issa N Welch G W A Adjiman C
S Pantelides C C Price S L Can the Formation of Pharmaceutical Co-
Crystals Be Computationally Predicted II Crystal Structure Prediction J Chem
Theory Comput 2009 5 (5) 1432-1448
141 Issa N Barnett S A Mohamed S Braun D E Copley R C B Tocher D
A Price S L Screening for cocrystals of succinic acid and 4-aminobenzoic acid
CrystEngComm 2012 14 (7) 2454-2464
142 Cruz-Cabeza A J Day G M Jones W Structure prediction disorder and
dynamics in a DMSO solvate of carbamazepine Phys Chem Chem Phys 2011
13 (28) 12808-12816
143 Habgood M Form II Caffeine A Case Study for Confirming and Predicting
Disorder in Organic Crystals Cryst Growth Des 2011 11 (8) 3600-3608
144 Torrisi A Leech C K Shankland K David W I F Ibberson R M Benet-
Buchholz J Boese R Leslie M Catlow C R A Price S L The solid phases
of cyclopentane a combined experimental and simulation study J Phys Chem
B 2008 112 (12) 3746-3758
145 Braun D E Karamertzanis P G Arlin J B Florence A J Kahlenberg V
Tocher D A Griesser U J Price S L Solid-State Forms of beta-Resorcylic
Acid How Exhaustive Should a Polymorph Screen Be Cryst Growth Des 2011
11 (1) 210-220
146 Llinas A Goodman J M Polymorph Control past present and future Drug
Discover Today 2008 13 (56) 198-210
147 Arlin J B Price L S Price S L Florence A J A strategy for producing
predicted polymorphs catemeric carbamazepine form V Chem Commun 2011
47 (25) 7074-7076
148 Maddox J Crystals from first Principles Nature 1988 335 (6187) 201
Bibliography
174
149 Day G M Motherwell W D S Ammon H L Boerrigter S X M Della
Valle R G Venuti E Dzyabchenko A Dunitz J D Schweizer B van Eijck
B P Erk P Facelli J C Bazterra V E Ferraro M B Hofmann D W M
Leusen F J J Liang C Pantelides C C Karamertzanis P G Price S L
Lewis T C Nowell H Torrisi A Scheraga H A Arnautova Y A Schmidt
M U Verwer P A third blind test of crystal structure prediction Acta
Crystallogr Sect B 2005 61 (5) 511-527
150 Collins A Wilson C C Gilmore C J Comparing entire crystal structures
using cluster analysis and fingerprint plots CrystEngComm 2010 12 (3) 801-
809
151 Chisholm J A Motherwell S COMPACK a program for identifying crystal
structure similarity using distances J Appl Crystallogr 2005 38 228-231
152 Asmadi A Kendrick J Leusen F J J Crystal Structure Prediction and
Isostructurality of Three Small Molecules Chem Eur J 2010 16 (42) 12701-
12709
153 Macrae C F Bruno I J Chisholm J A Edgington P R McCabe P
Pidcock E Rodriguez-Monge L Taylor R van de Streek J Wood P A
Mercury CSD 20 - new features for the visualization and investigation of crystal
structures J Appl Crystallogr 2008 41 466-470
154 Chisholm J A Motherwell S A new algorithm for performing three-
dimensional searches of the Cambridge Structural Database J Appl Crystallogr
2004 37 331-334
155 Gelbrich T Hursthouse M B Systematic investigation of the relationships
between 25 crystal structures containing the carbamazepine molecule or a close
analogue a case study of the XPac method CrystEngComm 2006 8 (6) 448-460
156 Gelbrich T Hursthouse M B A versatile procedure for the identification
description and quantification of structural similarity in molecular crystals
CrystEngComm 2005 7 324-336
157 McKinnon J J Spackman M A Mitchell A S Novel tools for visualizing and
exploring intermolecular interactions in molecular crystals Acta Crystallogr
Sect B 2004 60 627-668
158 Spackman M A McKinnon J J Fingerprinting intermolecular interactions in
molecular crystals CrystEngComm 2002 378-392
159 Parkin A Barr G Dong W Gilmore C G Jayatilaka D McKinnon J J
Spackman M A Wilson C C Comparing entire crystal structures structural
genetic fingerprinting CrystEngComm 2007 9 648-652
160 McKinnon J J Mitchell A S Spackman M A Hirshfeld surfaces A new tool
for visualising and exploring molecular crystals Chem Eur J 1998 4 (11) 2136-
2141
Bibliography
175
161 Etter M C MacDonald J C Bernstein J Graph-Set Analysis of Hydrogen-
Bond Patterns in Organic- Crystals Acta Crystallogr Sect B 1990 46 256-262
162 Grell J Bernstein J Tinhofer G Graph-set analysis of hydrogen-bond patterns
some mathematical concepts Acta Crystallogr Sect B 1999 55 1030-1043
163 Press W H Flannery B P Teukolsky S A Vetterling W T Numerical
methods the art of scientific computing (Fortran version) Cambridge University
Press Cambridge 1989
164 Galek P T A Novel comparison of crystal packing by moments of inertia
CrystEngComm 2011 13 (3) 841-849
165 Bonnet P A Streek J v d Trask A V Motherwell W D S Jones W The
crystal structure of an unstable polymorph of beta-D-allose CrystEngComm
2004 6 (86) 535-539
166 Potter B S Palmer R A Withnall R Chowdhry B Z Price S L Aza
analogues of nucleic acid bases experimental determination and computational
prediction of the crystal structure of anhydrous 5-azauracil J Mol Struct 1999
486 349-361
167 Nowell H Frampton C S Waite J Price S L Blind crystal structure
prediction of a novel second polymorph of 1-hydroxy-7-azabenzotriazole Acta
Crystallogr Sect B 2006 62 (4) 642-650
168 DOria E Karamertzanis P G Price S L Spontaneous Resolution of
Enantiomers by Crystallization Insights from Computed Crystal Energy
Landscapes Cryst Growth Des 2010 10 (4) 1749-1756
169 Thornber C W Isosterism and molecular modification in drug design Chem
Soc Rev 1979 8 (4) 563-580
170 Singh H Singh Chawla A Kapoor V K Paul D Malhotra R K 4
Medicinal Chemistry of Tetrazoles In Progress in Medicinal Chemistry Volume
17 ed Ellis and G P Ed Elsevier 1980 pp 151-183
171 Lipinski C A Chapter 27 Bioisosterism in Drug Design In Annual Reports in
Medicinal Chemistry Volume 21 ed Denis M B Ed Academic Press 1986
pp 283-291
172 SHELXL97 University of Goumlttingen Goumlttingen Germany 1997
173 Sheldrick G M A short history of SHELX Acta Crystallogr Sect A 2008 64
(1) 112-122
174 Farrugia L WinGX suite for small-molecule single-crystal crystallography J
Appl Crystallogr 1999 32 (4) 837-838
175 Ladd M F C Palmer R A Structure Determination by X-Ray Crystallography
Springer 2003
Bibliography
176
176 Khan S A Reshak A H First Principle Study of Electronic Structure Chemical
Bonding and Optical Properties of 5-azido-1H-tetrazole International Journal of
Electrochemical Science 2013 8 (7) 9459-9473
177 Desiraju G R Hydrogen bridges in crystal engineering Interactions without
borders Accounts Chem Res 2002 35 (7) 565-573
178 Herrebout W A Suhm M A Weak hydrogen bonds - strong effects Phys
Chem Chem Phys 2011 13 (31)
179 Schmidt M W Baldridge K K Boatz J A Elbert S T Gordon M S
Jensen J H Koseki S Matsunaga N Nguyen K A Su S Windus T L
Dupuis M Montgomery J A General Atomic and Molecular Electronic
Structure Systems J Comput Chem 1993 14 1347-1363
180 Cossi M Scalmani G Rega N Barone V New developments in the
polarizable continuum model for quantum mechanical and classical calculations
on molecules in solution J Chem Phys 2002 117 (1) 43-45
181 An email message sent Febrary 2012 to Rex Palmer stated the following we
would be delighted if it were 2nd_23res P21 a = 79 or 1st_120res P21c a =
100 as our two lowest energy structures
182 Allen F H The Cambridge Structural Database A quarter of a million crystal
structures and rising Acta Crystallogr Sect B 2002 58 (3) 380-388
183 Thakur T S Desiraju G R Crystal Structure Prediction of a Co-Crystal Using
a Supramolecular Synthon Approach 2-Methylbenzoic Acid-2-Amino-4-
methylpyrimidine Cryst Growth Des 2008 8 (11) 4031-4044
184 Surov A O Perlovich G L Thermodynamics of sublimation thermophysical
and structural aspects of the molecular crystals of fenamates J Struct Chem
2010 51 (2) 308-315
185 Li H Stowell J G Borchardt T B Byrn S R Synthesis Conformational
Polymorphism and Construction of a GT Diagram of 2-[(2-Nitrophenyl)amino]-
3-thiophenecarbonitrile Cryst Growth Des 2006 6 (11) 2469-2474
186 Pagola S Stephens P W He X Byrn S R Crystal structure solution of the
dark red light red and orange pollymorphs of 5-methyl-2-[(2-nitro-4-
methylphenyl)amino]-3-thiophenecarbonitrile by high resolution X-ray powder
diffraction and simulated annealing techniques Delhez R Mittemeijer E J
Eds 2001 pp 789-794
187 Zhou T Li F Fan Y Song W Mu X Zhang H Wang Y Hydrogen-
bonded dimer stacking induced emission of aminobenzoic acid compounds
Chem Commun 2009 (22) 3199-3201
188 Mei X F August A T Wolf C Regioselective copper-catalyzed amination of
chlorobenzoic acids Synthesis and solid-state structures of N-aryl anthranilic acid
derivatives Journal of Organic Chemistry 2006 71 (1) 142-149
Bibliography
177
189 Alvarez A J Singh A Myerson A S Polymorph Screening Comparing a
Semi-Automated Approach with a High Throughput Method Cryst Growth Des
2009 9 (9) 4181-4188
190 SeethaLekshmi S Guru Row T N Conformational polymorphism in a non-
steroidal anti-inflammatory drug mefenamic acid Cryst Growth Des 2012 12
(8) 4283-4289
191 Dokorou V Kovala-Demertzi D Jasinski J P Galani A Demertzis M A
Synthesis Spectroscopic Studies and Crystal Structures of Phenylorganotin
Derivatives with [Bis(26-dimethylphenyl)amino]benzoic Acid Novel
Antituberculosis Agents Helv Chim Acta 2004 87 (8) 1940-1950
192 Bernstein J Polymorphism - A Perspective Cryst Growth Des 2011 11 (3)
632-650
193 Yu L Stephenson G A Mitchell C A Bunnell C A Snorek S V Bowyer
J J Borchardt T B Stowell J G Byrn S R Thermochemistry and
Conformational Polymorphism of a Hexamorphic Crystal System J Am Chem
Soc 2000 122 (4) 585-591
194 Yang S S Guillory J K Polymorphism in sulfonamides J Pharm Sci 1972
61 (1) 26-40
195 Rossi D Gelbrich T Kahlenberg V Griesser U J Supramolecular constructs
and thermodynamic stability of four polymorphs and a co-crystal of pentobarbital
(nembutal) CrystEngComm 2012 14 (7) 2494-2506
196 Lutker K M Matzger A J Crystal polymorphism in a carbamazepine
derivative Oxcarbazepine J Pharm Sci 2010 99 (2) 794-803
197 Costantino L Barlocco D Privileged Structures as Leads in Medicinal
Chemistry Current Medicinal Chemistry 2006 13 (1) 65-85
198 Keinaumlnen S Similauml S Kouvalainen K Oral antipyretic therapy Evaluation of the
N-aryl-anthranilic acid derivatives mefenamic acid tolfenamic acid and
flufenamic acid Eur J Clin Pharmacol 1978 13 (5) 331-334
199 Andersen K V Larsen S Alhede B Gelting N Buchardt O
Characterization of two polymorphic forms of tolfenamic acid N-(2-methyl-3-
chlorophenyl)anthranilic acid their crystal structures and relative stabilities J
Chem Soc Perkin Trans 2 1989 (10) 1443-1447
200 Mattei A Li T Polymorph Formation and Nucleation Mechanism of
Tolfenamic Acid in Solution An Investigation of Pre-nucleation Solute
Association Pharmaceut Res 2012 29 (2) 460-470
201 Surov A O Szterner P Zielenkiewicz W Perlovich G L Thermodynamic
and structural study of tolfenamic acid polymorphs J Pharm Biomed Anal
2009 50 (5) 831-840
Bibliography
178
202 Brittain H G Polymorphism in Pharmaceutical Solids Informa Healthcare New
York London 2009 Vol 192
203 van de Streek J Motherwell S Searching the Cambridge Structural Database
for polymorphs Acta Crystallogr Sect B 2005 61 504-510
204 Desiraju G R Polymorphism The same and not quite the same Cryst Growth
Des 2008 8 (1) 3-5
205 Bhatt P M Desiraju G R Tautomeric polymorphism in omeprazole Chem
Commun 2007 (20) 2057-2059
206 de Gelder R Wehrens R Hageman J A A generalized expression for the
similarity of spectra Application to powder diffraction pattern classification J
Comput Chem 2001 22 (3) 273-289
207 Bruno I J Cole J C Edgington P R Kessler M Macrae C F McCabe
P Pearson J Taylor R New software for searching the Cambridge Structural
Database and visualizing crystal structures Acta Crystallogr Sect B 2002 58
389-397
208 Allen F H Taylor R Research applications of the Cambridge Structural
Database (CSD) Chem Soc Rev 2004 33 (8) 463-475
209 Kazantsev A V Karamertzanis P G Adjiman C S Pantelides C C Price
S L Galek P T A Day G M Cruz-Cabeza A J Successful Prediction of a
Model Pharmaceutical in the Fifth Blind Test of Crystal Structure Prediction Int
J Pharm 2011 418 (2) 168-178
210 Macrae C F Edgington P R McCabe P Pidcock E Shields G P Taylor
R Towler M van de Streek J Mercury visualization and analysis of crystal
structures J Appl Crystallogr 2006 39 453-457
211 Mattei A Li T L Interplay between molecular conformation and
intermolecular interactions in conformational polymorphism A molecular
perspective from electronic calculations of tolfenamic acid Int J Pharm 2011
418 (2) 179-186
212 Habgood M Grau-Crespo R Price S L Substitutional and orientational
disorder in organic crystals a symmetry-adapted ensemble model Phys Chem
Chem Phys 2011 13 (20) 9590-9600
213 Lancaster R W Karamertzanis P G Hulme A T Tocher D A Lewis T
C Price S L The Polymorphism of Progesterone Stabilization of a
Disappearing Polymorph by Co-Crystallization J Pharm Sci 2007 96 (12)
3419-3431
214 Gavezzotti A The Calculation of Molecular Volumes and the Use of Volume
Analysis in the Investigation of Structured Media and of Solid-State Organic-
Reactivity J Am Chem Soc 1983 105 (16) 5220-5225
Bibliography
179
215 The Free Dictionary defines herringbone as a way of assembling in a diagonal
zigzag manner
216 Desiraju G R On the presence of multiple molecules in the crystal asymmetric
unit (Z gt 1) CrystEngComm 2007 9 (1) 91-92
217 Anderson K M Steed J W Comment on On the presence of multiple
molecules in the crystal asymmetric unit (Z gt 1) by Gautam R Desiraju
CrystEngComm 2007 9 91 CrystEngComm 2007 9 (4) 328-330
218 Delaney S P Smith T M Pan D Yin S Korter T M Cryogenic Phase
Transition in Crystalline Aripiprazole Leads to an Eighth Polymorph Cryst
Growth Des 2014
219 From private communication with Rona Watson at University College London
220 Thompson H P G Day G M Which conformations make stable crystal
structures Mapping crystalline molecular geometries to the conformational
energy landscape Chem Sci 2014 5 (8) 3173-3182
221 Mo Y Gao J Theoretical Analysis of the Rotational Barrier of Ethane Accounts
Chem Res 2007 40 (2) 113-119
222 Pophristic V Goodman L Hyperconjugation not steric repulsion leads to the
staggered structure of ethane Nature 2001 411 (6837) 565-568
223 Halpern A M Glendening E D An intrinsic reaction coordinate calculation of
the torsional potential in ethane Comparison of the computationally and
experimentally derived torsional transitions and the rotational barrier Journal of
Chemical Physics 2003 119 (21) 11186-11191
224 Mulliken R S Intensities of Electronic Transitions in Molecular Spectra IV
Cyclic Dienes and Hyperconjugation 2004 7 (5) 339-352
225 Mo Y Song L Lin Y Block-Localized Wavefunction (BLW) Method at the
Density Functional Theory (DFT) Level J Phys Chem A 2007 111 (34) 8291-
8301
226 Brunck T K Weinhold F Quantum-Mechanical Studies on the Origin of
Barriers to Internal-Rotation About Single Bonds J Am Chem Soc 1979 101
(7) 1700-1709
227 Pendas A Blanco M Francisco E Steric Repulsions Rotation Barriers and
Stereoelectronic Effects A Real Space Perspective J Comput Chem 2009 30
(1) 98-109
228 Surov A O Perlovich G L Emelyanenko V N Verevkin S P
Thermochemistry of Drugs Experimental and First-Principles Study of
Fenamates J Chem Eng Data 2011 56 (12) 4325-4332
229 GaussView version 5 2009
Bibliography
180
230 Clark M Cramer R D Van Opdenbosch N Validation of the general purpose
tripos 52 force field J Comput Chem 1989 10 (8) 982-1012
231 Gavezzotti A Filippini G Geometry of the Intermolecular X-HY (X Y=N
O) Hydrogen- Bond and the Calibration of Empirical Hydrogen-Bond Potentials
J Phys Chem 1994 98 (18) 4831-4837
232 Gavezzotti A Are Crystal-Structures Predictable Accounts Chem Res 1994 27
(10) 309-314
233 Mercury version 31 2013
234 Lozano J J Pouplana R Loacutepez M Ruiz J Conformational analysis of the
antiinflammatory fenamates a molecular mechanics and semiempirical molecular
orbital study Journal of Molecular Structure THEOCHEM 1995 335 (13)
215-227
235 Rappe A K Casewit C J Colwell K S Goddard W A Skiff W M Uff a
Full Periodic-Table Force-Field For Molecular Mechanics and Molecular-
Dynamics Simulations J Am Chem Soc 1992 114 (25) 10024-10035
236 Jorgensen W L Tirado-Rives J The OPLS potential functions for proteins
energy minimizations and crystals of cyclic peptides and crambin J Am Chem
Soc 1988 110 (6) 1657-1666
237 Hopkins C W Roitberg A E Fitting of Dihedral Terms in Classical Force
Fields as an Analytic Linear Least-Squares Problem J Chem Inf Model 2014
54 (7) 1978-1986
238 Wheatley R J Price S L An Overlap Model For Estimating the Anisotropy of
Repulsion Mol Phys 1990 69 (3) 507-533
239 Totton T S Misquitta A J Kraft M A First Principles Development of a
General Anisotropic Potential for Polycyclic Aromatic Hydrocarbons J Chem
Theory Comput 2010 6 (3) 683-695
240 Sorescu D C Rice B M Thompson D L Intermolecular potential for the
hexahydro-135-trinitro-135-s- triazine crystal (RDX) A crystal packing
Monte Carlo and molecular dynamics study J Phys Chem B 1997 101 (5) 798-
808
241 Williams D E Houpt D J Fluorine Nonbonded Potential Parameters Derived
From Crystalline Perfluorocarbons Acta Crystallogr Sect B 1986 42 (JUN)
286-295
242 OBoyle N Banck M James C Morley C Vandermeersch T Hutchison
G Open Babel An open chemical toolbox Journal of Cheminformatics 2011 3
(1) 33
243 Combinations - Rosetta Code
Bibliography
181
244 Hastie T Tibshirani R Friedman J The Elements of Statistical Learning Data
Mining Inference and Prediction Second Edition 2nd ed 2009 Corr 7th
printing 2013 edition ed Springer New York 2011pp 745
245 Schmidt M U Dinnebier R E Kalkhof H Crystal engineering on industrial
diaryl pigments using lattice energy minimizations and X-ray powder diffraction
J Phys Chem B 2007 111 (33) 9722-9732
246 Ahmed S Bidstrup S A Kohl P A Ludovice P J Development of a new
force field for polynorbornene J Phys Chem B 1998 102 (49) 9783-9790
247 Braun D E McMahon J A Koztecki L H Price S L Reutzel-Edens S M
Contrasting Polymorphism of Related Small Molecule Drugs Correlated and
Guided by the Computed Crystal Energy Landscape Cryst Growth Des 2014
14 (4) 2056-2072
248 Ismail S Z Anderton C L Copley R C Price L S Price S L Evaluating
a Crystal Energy Landscape in the Context of Industrial Polymorph Screening
Cryst Growth Des 2013 13 (6) 2396-2406
249 Price L S McMahon J A Lingireddy S R Lau S-F Diseroad B A Price
S L Reutzel-Edens S M A molecular picture of the problems in ensuring
structural purity of tazofelone J Mol Struct 2014 ASAP
250 Kendrick J Stephenson G A Neumann M A Leusen F J Crystal Structure
Prediction of a Flexible Molecule of Pharmaceutical Interest with Unusual
Polymorphic Behavior Cryst Growth Des 2013 13 (2) 581-589
251 Price S L Hamad S Torrisi A Karamertzanis P G Leslie M Catlow C
R A Applications of DL_POLY and DL_MULTI to organic molecular crystals
Mol Simulat 2006 32 (12-13) 985-997
252 Abramov Y A QTAIM Application in Drug Development Prediction of
Relative Stability of Drug Polymorphs from Experimental Crystal Structures J
Phys Chem A 2011 115 (45) 12809-12817
253 Campeta A M Chekal B P Abramov Y A Meenan P A Henson M J
Shi B Singer R A Horspool K R Development of a Targeted Polymorph
Screening Approach for a Complex Polymorphic and Highly Solvating API J
Pharm Sci 2010 99 (9) 3874-3886
254 Klimes J Michaelides A Perspective Advances and challenges in treating van
der Waals dispersion forces in density functional theory J Chem Phys 2012
137 (12) 120901
255 Vasileiadis M Pantelides C C Adjiman C S Prediction of the crystal
structures of axitinib a polymorphic pharmaceutical molecule Chem Eng Sci
2015 121 60-76
256 Smith W Todorov I T Leslie M The DL_POLY molecular dynamics
package Z Kristallogr 2005 220 (5-6) 563-566
Bibliography
182
257 Leslie M DL_MULTI - A molecular dynamics program to use distributed
multipole electrostatic models to simulate the dynamics of organic crystals Mol
Phys 2008 106 (12-13) 1567-1578
258 Koch U Popelier P L A Stone A J Conformational Dependence of Atomic
Multipole Moments Chem Phys Lett 1995 238 (4-6) 253-260

Dedication
4
Dedication
I dedicate this thesis to my wife Jodi Uzoh my mother Felicia Uzoh and my father
Emmanuel Uzoh For their endless love support and encouragement
Acknowledgments
5
Acknowledgments
Foremost I would like to thank my supervisor Professor Sally Price for her support
and direction throughout my time at UCL Her encouragement and wise words at the start
of my doctorate program were vital
My sincere gratitude to Louise Price for helping me to understand the practical aspects
of the computational methods of Crystal Structure Prediction (CSP) and for the interesting
and insightful discussions about research and life My colleagues in Room G18 and
friends at UCL made my time there fun inspiring and exciting I would like to thank Rex
Palmer for setting the informal blind test of Chapter 3 and for the subsequent collaborative
paper
Many thanks to the Centre for Doctoral Training in Molecular Modelling and Materials
Science (CDTM3S) at UCL for the rigorous training they gave me during the first year
and the yearly industrial day invitation to present my research The opportunity to work
with sixth form students in the third year sponsored by CDTM3S was one of the most
rewarding experiences I had at UCL
My industrial sponsor Cambridge Crystallographic Data Centre (CCDC) has been
instrumental at every research stage The encouragement received after presenting my
work at the annual CCDC student day was invaluable My industrial supervisors at
CCDCndashndashAurora J Cruz-Cabeza (a year and a half) and Peter Galek (two and a half years)
ndashndashhave been instrumental in collaborative research and publications I appreciate their
insight energy time and encouragement during our many meetings
Finally this work would not be possible without the financial support from the CCDC
and the Engineering and Physical Science Research Council (EPSRC) under the
CDTM3S grant EPG0366751
List of Publications
6
List of Publications
1 Uzoh O G Cruz-Cabeza A J Price S L Is the Fenamate Group a
Polymorphophore Contrasting the Crystal Energy Landscapes of Fenamic and
Tolfenamic Acids Cryst Growth Des 2012 12 (8) 4230-4239
2 Spencer J Patel H Deadman J J Palmer R A Male L Coles S J Uzoh
O G Price S L The Unexpected but Predictable Tetrazole Packing in Flexible
1-Benzyl-1H-Tetrazole CrystEngComm 2012 14 (20) 6441-6446
I carried out all the computational work and prepared the manuscript
3 Uzoh O G Galek P T A Price S L Towards more Accurate Force Fields for
pharmaceutical molecules ndash Analysing the Conformational Energy Profiles of
Fenamates 2014 (Submitted)
Table of Contents
7
Table of Contents
Modelling Molecular Flexibility for Crystal Structure Prediction 1
Declaration 2
Abstract 3
Dedication 4
Acknowledgments 5
List of Publications 6
Table of Contents 7
List of Figures 11
List of Tables 18
List of Abbreviations 20
List of Symbols 21
Chapter 1 Introduction 22
11 Background 22
12 Scope and Outline of Thesis 26
Chapter 2 Theoretical Background 27
21 Overview 27
22 Intermolecular Forces 27
221 Pairwise Additivity 28
222 Physical Origin of Intermolecular Force 29
223 Long-range Interactions 30
224 Short-range Interactions 31
225 Penetration Energy and Charge Transfer 32
23 Modelling the Intermolecular Forces for Organic Molecules 32
231 Repulsion-Dispersion Potentials 33
232 Electrostatics Potential 34
24 Intramolecular Energy 36
25 Force Fields (Atomistic Modelling) 38
251 AMBER 41
252 CHARMM 42
253 Other Force Fields 42
254 The Limits of Current Force Fields 43
Table of Contents
8
26 The Fitting Routine 44
261 Linear Least Square Method 44
262 Subroutine for Solving Least Squares 46
27 Electronic Structure Methods 47
271 Hartree Fock Theory 48
271 Molecular Orbital Theory 48
272 Correlation Effects 49
273 Moslashller-Plesset Perturbation Theory 49
274 Density Functional Theory 50
275 The DFT-D Approach 51
28 Crystal Structure Prediction (CSP) 52
281 CrystalPredictor 54
282 CrystalOptimizer 55
283 Polarizable Continuum Model (PCM) 56
284 Other Approaches to Lattice Energy Minimisation 56
285 The Crystal Energy Landscapes 58
286 The Blind Tests 58
29 Crystal Structure Comparison 59
Chapter 3 An Informal Blind Test A Crystal Structure Prediction of 1-
Benzyl-1H-tetrazole 62
31 Introduction 62
311 Background 62
312 Experimental Determination of 1-Benzyl-1H-Tetrazole 63
313 Molecular Geometry of the Experimental Structure 63
314 Crystal Packing Weak Hydrogen Bonding 64
315 Overview of the Challenge 65
32 Computational Methodology 66
321 Conformational Analysis 66
322 Crystal Structure Prediction 66
33 Results and Discussion 67
331 Conformational Energy Grid 67
332 The CrystalPredictor Energy Landscape 68
333 The CrystalOptimizer and PCM Energy Landscapes 68
334 Did the Predicted Structure Really Match the Experimental 70
335 The Global Minimum Structure on the PCM Energy Landscape 71
336 Post Analysis Comparison of Structure with CSD 73
Table of Contents
9
34 Summary 76
Chapter 4 Is the fenamate group a polymorphophore Contrasting the crystal
energy landscapes of fenamic and tolfenamic acids 77
41 Introduction 77
411 Polymorphism and Polymorphophores 79
412 Conformations in known Crystal Structures 79
413 Experimental Data of FA and TA 80
414 Similarities between the known forms of FA and TA 83
415 Solving the Connectivity Problem of a Disordered Form 84
416 Overview 87
42 Computational Methods 87
421 Ab initio Conformational Profile of TA 87
422 CSD Survey for Fenamates 87
423 Crystal Structure Prediction 88
424 Experimental Crystal Structures with Z´ gt1 90
425 Comparison of Crystal Structures 90
43 Results 91
431 Dependence of Conformational Energy on Method 91
432 Consideration of H-bonded Torsion 92
433 CSD Survey of Fenamates 93
434 Validation of the CrystalOptimizer plus PCM Models 95
435 Energy Landscapes of Intermediate Steps 96
436 Finding and Explaining the Known Structures with CSP 97
437 Other Known Fenamates and their Hypothetical Structures 103
438 Update on a Recently Discovered Polymorph of TA 105
439 The Cost of Lattice Energy Minimisation 106
44 Summary 107
Chapter 5 The Origin of conformational energy barriers in Fenamates 109
51 Introduction 109
511 Background 109
512 Torsional Barrier for Ethane 110
513 Overview 113
52 Method 114
521 Determining Conformation Energy Scan for Isolated Molecule 114
522 Ab initio Conformational Energy Profiles for Fenamates 114
523 Investigation of Electronic Effects 115
Table of Contents
10
524 Investigation of the Steric (Non-Bonded) Effects 116
53 Results 117
531 Effect of Different Definitions of the Same Flexible Bond 117
532 Effect of Step Size on the Conformation Profile of Fenamate Molecule 119
533 Conformational Energy Profile of the Fenamates 122
534 Rigid Versus Relaxed Scans of Fenamates 124
535 Splitting electronic from steric contributions to the barrier to rotation 127
536 Estimating the Steric Contributions with an Atom-Atom Potential 130
537 Investigating the Important Interactions with Atom-Atom Potential 131
54 Discussion The Physical Origins of Torsional Potentials 133
55 Summary 134
Chapter 6 Toward New Force fields for Fenamate Molecules 136
61 Introduction 136
611 Background 136
612 A Case for Modelling Decoupled Intramolecular Energy 137
613 Analytical Models of Intramolecular Energies 138
614 Overview 138
62 Methodology Fitting Analytical Models to Conformational Profiles 139
621 Torsional Potential Model 139
622 AtomndashAtom Model 141
63 Results 144
631 Cosine Series Model 144
632 Rescaled Repulsion Model 146
633 Combined Physical Model 149
634 Transferability 154
64 Summary 157
Chapter 7 Conclusions and Future Work 158
71 Position of CSP in the Context of this Thesis 158
72 Towards more accurate force-fields for pharmaceutical molecules 159
73 Future Work 160
Appendix A 162
Contents of enclosed CD-ROM 162
Bibliography 163
List of Figures
11
List of Figures
Figure 11 Diagrammatic illustration of crystal structure prediction (CSP) methodology
23
Figure 12 A chemical diagram of a target molecule XX from the fifth blind test17 24
Figure 13 The chemical diagram of tolfenamic (TA) and flufenamic (FFA) acids 25
Figure 14 Polymorphs of ROY numbered in the order of discovery The polymorphs
have different colours melting points and molecular conformations (most pronounced in
the torsion angle θ) (Source Ref [20]) 25
Figure 15 Overlay of the experimental conformers of ROY viewed with the overlaid
nitrobenzene fragment horizontal (Source Ref [2]) 26
Figure 21 Typical intermolecular force potential energy functions for spherical atoms
28
Figure 22 Charge distributions corresponding to pure multipoles Blue portions
represent regions where the function is positive and yellow portions represents where it
is negative Qlk is the spherical harmonic multipole where l is angular momentum
quantum number and k = l l-1hellip -l specifies the component of the angular momentum
around the z-axis (Source httpenwikipediaorgwikiSpherical_harmonics [Accessed
11012015]) 35
Figure 23 Schematic representation of conformational change and conformational
adjustment (Source Ref [58]) 37
Figure 24 The schematic view of force field interactions Covalent bonds are solid lines
while the dotted line indicates non-bonded interaction (Source Ref [68]) 39
Figure 25 Schematic view of four key contributions to a molecular mechanics force
field These forces are bond stretching bond stretching angle bending torsional terms
and non-bonded interactions (Source Ref [63]) 39
Figure 26 Schematic view of the torsion angle ξ using the ethane molecule (Source
quantumwisecomdocumentsmanualsvnl-200810_Manualchapmolbuilderhtml
[Accessed 11012015]) 40
Figure 27 Schematic view of some of the common cross terms (Source Ref [63]) 43
Figure 31 The chemical diagram of BT determined from the crystal structure Torsion
angles 1=C7-C6-N1-C5 and 2 = C12-C7-C6-N1 62
Figure 32 The crystal structure of BT (a) Partial view of the crystal packing showing
close CH∙∙∙N contacts between a central tetrazole and six surrounding tetrazoles (b)
Partial view showing CH∙∙∙N CH∙∙∙C and CH∙∙∙ contacts 64
Figure 33 BT crystal structure (a) View of the infinite S-shaped layers held together by
weak CH∙∙∙N and CH∙∙∙C H-bonds (b) Partial view of the layer structure showing
List of Figures
12
alternative B(benzyl) and T(tetrazole) layers and the repeating layer sequence [BTBT |
TBTB] 65
Figure 34 The conformational energy grid used in the search Relative intramolecular
energies ΔEintra (kJ mol-1) for isolated molecule calculations at the MP26-31G(d p)
level of theory 67
Figure 35 The CrystalPredictor energy landscape of BT generated with a crude lattice
energy model The generated structure that matched the experimental structure is
highlighted in the open red symbol 68
Figure 36 (a) The CrystalOptimizer (step 3) and (b) PCM (step 4) energy landscape
of BT GM is the global energy minimum The open red symbol represents a match
between the experimental crystal structure and the generated structure The energy
ranking of the crystal structure that matches the experimental has improved from fourth
most stable 4 to second most stable 2 69
Figure 37 The 15-molecule overlay between the experimental (atomic colours) and the
second most stable computed structure 2BT_23 (green) The direction of the view
obscures some of the molecules 71
Figure 38 Crystal Packing Similarity between experimental (grey) and the most stable
predicted structure (1BT_120 green) with only 2 molecules matching (RMSD2 = 1072
Aring) 72
Figure 39 The structure corresponding to the global minimum in lattice energy
(1BT_120) showing the dominant weak H-bonds (Aring) eight of type CH∙∙∙N and one
CH∙∙∙C and the weak ∙∙∙ interaction (benzylmiddotmiddotmiddotbenzyl) 72
Figure 310 Query used in Conquest to search the CSD for similar fragments 73
Figure 311 Histograms showing the bond length distributions of 32 1-susbtituted 1H-
tetrazole rings in the CSD The red square denotes the experimental bond lengths in BT
while the black square denotes the ab initio bond lengths in the corresponding calculated
structure 2BT_23 74
Figure 312 Histograms showing the distributions of the torsions and angles of the 32-
tetrazole rings found during the CSD survey The experimental bond length in BT is
denoted by the red square while the ab initio bond length in the corresponding calculated
structure 2BT_23 is denoted by the black square 75
Figure 41 The polymorphophore families of ROY and fenamic acid The numbers of
polymorphs in the Cambridge Structural Database (CSD) follow the refcodes for each
specific molecule and (x) denotes the number of additional polymorphs that whose
crystal structures were not available The lowest two rows are fenamates whose structures
are used in Table 46 78
Figure 42 Overlay of the experimental conformers of FA (top) and TA (bottom) viewed
with the overlaid benzoic acid fragment arranged horizontal FA QQQBTY02 (Z´=2
light blue and magenta) TA KAXXAI01 (Form I Z´=1 blue) KAXXAI (Form II Z´=1
red) KAXXAI02 (Form III Z´=2 green and purple) KAXXAI03 (Form IV Z´=3
yellow brown (obscured by yellow) and black) and KAXXAI04 (Form V Z´=1
disordered on both sites (section 415) violet and grey) The arrows point to the main
List of Figures
13
variation (ξ1) between the conformers of FA and TA in the experimental crystal
structures 80
Figure 43 Temperature dependence of the enthalpy (H) and free energy (G) diagrams
for forms I and II of TA showing a monotropic (top) relationship from data from
Surov201 which are qualitatively the same as data from Andersen199 and an enantiotropic
(bottom) relationship from data from Mattei and Li200 82
Figure 44 Features of the experimental crystal structures (a) The hydrogen-bonded
dimer motif found in all structures with variations in the phenyl ring orientations (ξ1)
The specific illustration shows the packing similarity between FA (QQQBTY02) and TA
form II (KAXXAI) (b) The unique packing of TA form II with short contacts between
chlorine and the aromatic ring (c) Crystal Packing Similarity between form III and form
IV of TA showing the 11-molecule overlay which includes only two dimers 84
Figure 45 (a) Crystal structure KAXXAI04 of form V of TA (b) The atom connectivity
of the two new components (colour red and blue) the original C-N connectivity is
labelled green (c) Chemical diagram showing the atomic connectivity of TA 85
Figure 46 Ordered Z=2 crystal structures formed from the disordered components of TA
form V (a) Form V_a (b) Form V_b and (c) Form V_c 86
Figure 47 Query fragment and the torsion angle ξ1 measured in the Conquest207 survey
of the CSD structures There were 131 organic structures where Y=H and 94 where Yne
H 88
Figure 48 The fragment used in the CrystalPredictor search for TA Each fragment was
kept rigid during the search for hypothetical crystal structures 89
Figure 49 The degrees of freedom optimized by CrystalOptimizer for crystal structures
of FA and TA (ξ1equiv C7-N1-C8-C9 ξ2equiv C2-C7-N1-C8 ξ3equiv O1-C1-C2-C7 ξ4equiv H1-O1-C1-C2
and ξ5equiv C8-C13-C14-H10 θ1equiv H6-N1-C8 θ2equiv H1-O1-C1) 89
Figure 410 The relative conformational energy of isolated TA molecules as a function
of the ξ1 The MP2 and PBE0 method at 6-31G(dp) basis set compared with the other
method (top) and the other basis sets (bottom) for the PBE0 method 91
Figure 411 The relative conformational energy as a function of the ξ2 (Figure 49) for
FA and TA calculated at the PBE06-31G(dp) level of theory 92
Figure 412 The relaxed conformational energy scan of FA and TA as a function of ξ1 at
the PBE06-31+G(d) level of theory (a) Includes the experimental values of ξ1 marked
for TA and FA with the symmetry equivalent FA conformations denoted by open black
squares and an insert diagram showing the steric hindrance for TA in the high-energy
region A histogram of (b) 131 crystal structures found in the CSD search (Figure 47)
with Y=H plus symmetry equivalent structures and (c) 94 crystal structures with YneH
94
Figure 413 Crystal energy landscape of TA for the Z´=1 structure after (a)
CrystalPredictor (Step 1) (b) the single conformer calculation of Eintra and the atomic
multipoles at the PBE06-31G(dp) level of theory (Step 2 of section 423) 96
Figure 414 The crystal energy landscapes of FA (top) and TA (bottom) Each symbol
represents a crystal structure of the specified space group which is a minimum in the
List of Figures
14
lattice energy (calculated within the polarizable continuum) The open symbols
correspond to the minima starting from the experimental structures (Table 43) The
packing coefficient is the proportion of the cell volume occupied by the molecule214
calculated using a grid spacing of 01 Aring 98
Figure 415 (a) Overlay of the only known form of FA (grey) and the most stable
structure on the Z´=1 crystal energy landscape (Figure 414a) 1FA_22 (green) with an
RMSD5 value of 175Aring (b) Overlay of the conformers of form I (pink and light blue) and
1FA_22 (black) 100
Figure 416 (a) Overlay of the two most stable hypothetical crystal structures on the
crystal energy landscape global minimum 1FA_22 (grey) and 2FA_2 (green) with
ΔElatt=20 kJ mol-1 The crystal structures overlaid 12 molecules with RMSD12 of 051 Aring
and the conformations had an RMSD1 of 009 Aring (b) Overlay of 2FA_2 (green) and the
experimental crystal structure of FA (grey) with a RMSD15 of 123 Aring obtained with a
distance and angle tolerance of 50 and 50deg (c) Overlay of the two independent
molecules in the experimental structure (grey) with 2FA_2 (green) 101
Figure 417 The overlay of the experimental Z´=1 crystal structures (grey) of TA with
the closest structure found in the search (green) (a) Form I and 1TA_8 overlaid with an
RMSD15 value of 032Aring (b) Form II and 5TA_38 overlaid with an RMSD15 value of
026Aring 102
Figure 418 Classification of the crystal energy landscape of FA in terms of the similarity
of the structures to those of known TA polymorphs (I-IV) without PCM (hence the
different y-axis compared to Figure 414a) Numbers in bold indicate the number of
molecules that overlay with the known structure of FA Hence a label 5 6 on a structure
represented by a blue circle means that the structure overlaid 5 molecules with the
experimental form of FA but 6 with form I of TAEach point is coloured by the TA
polymorph with which it overlaid the greatest number n of molecules in a Crystal Packing
Similarity calculation that ignored the CH3 and Cl 103
Figure 419 Overlay of FA_137 (green) and the major component of experimental
crystal structure of TA form VI (grey) with a RMSD15 of 030 Aring obtained with a distance
and angle tolerance of 50 and 50deg 106
Figure 420 CPU timings of (a) 38_TA (form II) and (b) 137_TA (form VI section
438) after lattice energy minimisation using CrystalOptimizer (step 3) 107
Figure 51 The fenamate family showing the low barrier torsion angle (=C7-N1-C8-C9)
=0 when the aromatic rings are coplanar as drawn The fenamates family mentioned in
this chapter includes fenamic acid (FA) R1= R2= H tolfenamic acid (TA) R1= CH3 R2=
Cl mefenamic acid (MA) R1= R2= CH3 clofenamic acid (ClFA) R1=H R2=Cl and
flufenamic aid (FFA) R1=H R2=CF3 The dotted line represents an intramolecular
hydrogen bond 109
Figure 52 Illustration of the barrier to rotation with the relaxed conformational energy
profile of FA 110
Figure 53 The staggered and eclipsed conformations of the ethane molecule (Sources
Ref [222] and enwikipediaorgwikiAlkane_stereochemistry [Accessed 11012015])
111
List of Figures
15
Figure 54 (a) Hyperconjugation effects on the staggered (b) Pauli exchange repulsion
in the eclipsed conformation (Source enwikipediaorgwikiHyperconjugation
[Accessed 11012015]) 112
Figure 55 Electrostatic steric repulsion (between electrons on the bond black arrow) for
the eclipsed conformation of ethane The red arrow indicates exclusion of van der Waals
repulsion since the van der Waals radii of the hydrogen are too small to make contact
(Source enwikipediaorgwikiConformational_isomerism [Accessed 11012015]) 113
Figure 56 Chemical diagram of model molecules used to investigate the electronic
contributions The bonds around N1 are constrained to be planar (ie R2-N1-H6-C8=180deg)
for phenylamine (PA) R1=R2=H N-methylaniline R1=H R2= CH3 N-vinylaniline R1=H
R2 = CH=CH2 and 3-anilinoprop-2-enoic acid R1=H R2 = CH=CHCO2H for 3-
chloroaniline R1= Cl R2=H and 3-methylaniline R1=CH3 R2=H (=R2-N1-C8-C9) 115
Figure 57 Pyramidalization in unconstrained phenylamine (PA) molecule caused by
lone pair on nitrogen atom 115
Figure 58 Relaxed scan of TA at the PBE06-31+G(d) level of theory with the different
definitions of flexible N1-C8 bond (= C7-N1-C8-C9 2= C7-N1-C8-C13
3=H6-N1-C8-C9
and 4= H6-N1-C8-C13) used as the constrained geometric parameter 118
Figure 59 Molecular conformation of the relaxed gas phase at PBE06-31+G(d) showing
the bond lengths of the phenyl C-C bond (=180) of FA 120
Figure 510 Relaxed scans of FA at PBE06-31+G(d) with step sizes 2 and 1deg around the
maxima and minima respectively The red circles indicate the starting points of the scans
while the arrows indicate the directions of the scans 121
Figure 511 Relaxed conformational scans at the PBE06-31+G(d) level of theory for the
fenamates The minima were at ξ=3894deg and 14471deg for FA 4063deg and 11186deg for
TA 4408deg and 11048deg for MA and 3586deg and 14838deg for ClFA 122
Figure 512 Relaxed conformational scans of fenamates (a) FA (b) TA (c) MA and (d)
ClFA at HF and PBE0 method with 6-31+G(d) basis set These are contrasted with the
single-point energies at the MP26-31+G(d) level and within a polarizable continuum
model (PCM) with =3 for the PBE06-31+G(d) conformations 123
Figure 513 Comparison of relaxed (solid) and rigid (dotted line) scan of FA (top) TA
(middle) and MA (right) For the rigid scans calculations were performed using HF MP2
and PBE0 methods with 6-31+G(d) basis set as a function of torsion angle The relaxed
scans from Figure 511 were performed at the PBE06-31+G(d) level of theory 125
Figure 514 Overlay of relaxed (coloured by element Figure 511) and rigid (red Figure
513) conformations of FA (top) TA (middle) and MA (bottom) overlaying the atoms
defining the ξ torsion angle at the PBE06-31+G(d) level of theory 126
Figure 515 The solid black lines show the relaxed torsional scans of planar-N-
constrained models for the phenyl rotation (Figure 56) where the benzoic acid group of
FA has been replaced by (a) hydrogen atom (PA) (b) methyl (c) vinyl and (d) prop-2-
enoic acid and the hydrogen in the meta position of PA has been replaced by (e) chlorine
and (f) methyl using HF PBE0 and MP2 methods with the 6-31+G(d) basis set Plots of
(h2)(1-cos(2)) where h is the height of the barrier of relaxed PBE06-31+G(d) scans
List of Figures
16
are shown in green For (c)-(f) the PBE06-31+G(d) relaxed scans of PA from (a) are
shown in grey for comparison In (a) and (b) a rigid scan at the PBE06-31+G(d) level of
theory is shown by a dotted line 127
Figure 516 The electron density surface of HOMO frontier orbitals for different
conformations of PA (top) FA (middle) and TA (bottom) obtained from the PBE06-
31+G(d) level of theory Contour map isovalues were drawn at a 002 au level 129
Figure 517 Alternative HOMO isosurface view of (a) FA and (b) PA molecule at =90
from Figure 516 129
Figure 518 HOMO-10 (46 MOs) isosurface view of side (top) and front (bottom) FA
molecule at =0 40 and 90 130
Figure 519 Comparison of the ab initio (black) intramolecular energy scans at the
PBE06-31+G(d) level of theory for FA (top) and TA (bottom) with Gavezzottirsquos exp-6
intramolecular energy models summed over all intramolecular atom-atom distances from
the third nearest neighbour (1-4) and above The net effect (purple) is subdivided into the
repulsive (red) and dispersion (blue) contributions 131
Figure 61 The fenamate family showing the low-barrier torsion angle (=C7-N1-C8-C9)
and atomic numbering =0 when the aromatic rings are coplanar as drawn The
fenamates mentioned in this chapter are fenamic acid (FA) R1= R2= H tolfenamic acid
(TA) R1= CH3 R2= Cl mefenamic acid (MA) R1= R2= CH3 flufenamic acid (FFA) R1=
H R2= CF3 and clorofenamic acid (ClFA) R1=H R2=Cl The dotted line represents an
intramolecular hydrogen bond 137
Figure 62 Relaxed conformational scans at the PBE06-31+G(d) level of theory for the
fenamates from section 533 Fenamic acid (FA) tolfenamic acid (TA) mefenamic acid
(MA) and chlorofenamic acid (ClFA) 137
Figure 63 An algorithm showing the overview of modelling ab initio intramolecular
energy using a cosine series potential The source codes are included in the CD ROM
attached to this thesis (see Appendix A) 140
Figure 64 An algorithm showing the modelling of ab initio intramolecular energy by a
physical potential The source codes are included in the CD ROM attached to this thesis
(see Appendix A) 141
Figure 65 Comparison of the ab initio relaxed scan at the PBE06-31+G(d) level of
theory with linearly fitted least square cosine series model for FA (top) and TA (bottom)
with Nk=5 (red lines) the optimal cos4 terms (blue lines) and Nk=21 (green lines σintra
=017 kJ mol-1 for FA and TA) 145
Figure 66 Plot of the standard error of the intramolecular energies against the number of
cosine terms Nk for FA (top) and TA (bottom) The fit is ill-determined ie there is no
unique solution for TA after Nk=21 146
Figure 67 Comparison of the relative energies from ab initio calculations (solid black
lines) of FA (top) and TA (bottom) with selected best-fit exp-6 rescaled repulsion models
For FA the selected Nk=3 intra=032 kJ mol-1 model had βC-H=-453 βH-H=270 and
Ebase=-506 while the Nk =4 intra=027 kJ mol-1 model had βCH=-446 βH-H=210 βH-
List of Figures
17
HB=257 and Ebase=-875 For TA the selected Nk=6 (intra=034 kJ mol-1) and 10
(intra=022 kJ mol-1) parameter fits are shown bold in Table 63 147
Figure 68 Gavezzotti exp-6 potential for all atomndashatom interactions in fenamates
displayed in two different energy scales The parameters are from Chapter 5 (Table 52)
150
Figure 69 Comparison of the relative energies from ab initio calculations (solid black
lines) of FA (top) and TA (bottom) with selected physical models For FA the selected
Nk=6 intra=026 kJ mol-1 model has βC-HB =801 γC-HB =1654 βH-H =1074 γH-H =58 α=-
339 and Ebase=-12383 whilst the Nk =6 intra=028 kJ mol-1 model has β C-H =028 γ C-
H =783 β H-HB = 1109 γ H-HB =3479 α=-117 and Ebase=-7549 For TA parameters for
the selected Nk=8 (intra=015 kJ mol-1) and 10 (intra=008 kJ mol-1) are in ghTable 66
153
Figure 610 Comparison of the relative energies from ab initio calculations (solid black
lines) with models using transferred βικ and γικ parameters from FA and TA (dotted grey
plots) to ClFA (top) and MA (bottom) respectively The red curve has only had the
baseline adjusted whereas the blue curve had the parameter refitted to ClFA or MA
respectively The transferred FA parameters are those Nk=6 fit=028 kJ mol-1 in Figure
69 while those of TA Nk= 10 fit= =026 kJ mol-1 are shown in iTable 66 155
Figure 611 Comparison of the relative energies from ab initio calculations (solid black
lines) with models using βικ and γικ parameters transferred from TA (dotted grey plots) to
(a) FA and (b) ClFA The red curve has only had the baseline adjusted whereas the blue
curve has the parameter refitted to FA or ClFA respectively The transferred TA
parameters are those of Nk= 10 fit= 026 kJ mol-1 as shown in iTable 66 156
List of Tables
18
List of Tables
Table 31 Angles and bond lengths of the tetrazole ring in BT No information about the
bonds or angles were given to me prior to submission of the candidate structures 64
Table 32 Summary of experimental (highlighted in blue) and computed crystal
structures on the PCM energy landscape (Figure 36) The computed structure that
matched the experimental structure (section 312) is highlighted in bold For label
xBT_y x and y are energy ranked after steps 4 and 1 of CSP respectively (section 322)
70
Table 41 The experimental data of the known forms of FA and TA Crystal structures
and Hfus values were taken from ref [19] unless otherwise specified aThe most widely
varying torsion angle ξ1 is defined in Figure 49 bTemperature of crystal structure
determination cMelting temperature 81
Table 42 Quantification of the similarities of FA and TA crystal structures showing the
packing similarity (RMSDn) and powder X-ray diffraction (PXRD) similarity206 The
bold numbers indicate the number of molecules n that match within distance and angle
tolerances of 20 and 20deg respectively with the RMSDn values in brackets See section
425 83
Table 43 Comparison of the lattice energy minimum with the experimental structure
used as a starting point for the final lattice energy model (PBE06-31+G(d) PCM) for
the ordered structures of FA and TA The three form V Z=2 model structures derived
from the disorder components of TA (section 415) are also compared with the starting
model RMSDn corresponds to n=15 unless (n) is given 95
Table 44 The lattice energy minima of FA shown in Figure 414a The minimum found
starting from the experimental structure is in bold 99
Table 45 The lattice energy minima of TA shown in Figure 414b Minima found starting
from the experimental structures or ordered models are in bold 99
Table 46 Crystal Packing Similarity comparisons of the experimental structures of FA
and TA and their most stable hypothetical crystal structures with the crystal structures of
the other fenamates shown in Figure 13 The similarity is given in the form n(RMSDn)
with n gt 4 molecules highlighted 104
Table 47 An extension of Table 46 showing Crystal Packing Similarity comparisons of
the latest structures of flufenamic acid18 and the experimental structures of FA and TA
and their most stable hypothetical crystal structures 105
Table 48 Crystal Packing Similarity calculations of the known forms of TA and
unobserved thermodynamically competitive crystal structures The similarity between
the structures is given in the form n(RMSDn) where n is the number of molecules overlaid
and the value in brackets is the RMSDn overlay Structures with the highest similarity are
highlighted 105
Table 51 Torsional barrier height of ethane (Source Reproduced from Ref [223]) 111
List of Tables
19
Table 52 Gavezzottirsquos exp-6 atom-atom parameters E=Aexp(-BR)-CR-6 is the well
depth and Rm is the distance at the minimum41231232 Italics represent the hydrogen-
bonded interactions aFrom the UNI intermolecular potential function of Mercury233 116
Table 53 Torsional barrier height of the relaxed conformational energy profiles in Figure
58 for TA 119
Table 54 Comparison of intramolecular energies and hydrogen bond distances of TA for
the near-planar conformer 119
Table 55 Comparison of the intramolecular energies and the N-H7∙∙∙HX-C14 bond
distances of TA for the near-planar conformer where HX-C14 is the methyl group 119
Table 56 Atom-atom interactions of FA that dominate the intramolecular energies as
estimated using Gavezzottirsquos exp-6 potential The interaction is listed as dominant if the
difference between the minimum and maximum total energy (Erepul-dis) is greater than or
equal to 1 kJ mol-1 132
Table 57 Atom-atom interactions of TA that dominate the intramolecular energies as
estimated from Gavezzottirsquos exp-6 potential The interaction is listed as dominant if the
difference between the minimum and maximum total energy (Erepul-dis) is greater than or
equal to 1 kJ mol-1 dInteractions between atoms on the same aromatic ring fInteractions
involving the methyl substituent 132
Table 61 Contrasting the atomndashatom interactions of FA and TA that dominated the
intramolecular energies formed by combining Table 56 and Table 57 from Chapter 5
Interactions unique to FA and TA are coloured blue and red respectively dInteractions
between atoms of the same aromatic ring fInteractions involving the methyl substituent
143
Table 62 Complete set of results after rescaling Nk (repulsion contributions and
baseline energy Ebase) parameters of various interacting atomic types for FA 148
Table 63 Summary table of the best results after rescaling Nk (repulsion contributions
and baseline energy Ebase) parameters of various interacting atomic types for TA
148
Table 64 All fits obtained for FA with the physically correct sign for the repulsion
and dispersion and electronic parameters 149
Table 65 The rescale parameters for the repulsion ικ dispersion ικ and electronic
contributions of the physical exp-6 and cos2 model for all possible combinations of atom
type interactions C∙∙∙C C∙∙∙H C∙∙∙HB H∙∙∙H and H∙∙∙HB for FA Nk are the number of
fitted rescale parameters ικ and ικ and the baseline energy Ebase 151
Table 66 The rescale parameters for the repulsion ικ dispersion ικ and electronic
contributions of the physical exp-6 and cos2 model for all possible combinations of atom
type interactions C∙∙∙C C∙∙∙Cl C∙∙∙H C∙∙∙HB Cl∙∙∙H C∙∙∙N H∙∙∙H and H∙∙∙HB for TA Nk
are the number of fitted rescale parameters and Ebase is the baseline energy ghThe
parameters used in Figure 69b and ifor testing transferability in Figure 610b and Figure
611 152
List of Abbreviations
20
List of Abbreviations
CCDC Cambridge Crystallographic Data Centre
CSP Crystal Structure Prediction
API Active Pharmaceutical Ingredient
DFT Density Functional Theory
HFSCF Hatree ForkSelf Consistent Field
PBE Perdew Burke and Ernzerhof exchange-correlation functional
B3LYP Becke three-parameter Lee-Yang-Parr
MP-n Moslashller-Plessett nth order of pertubabtion
PCM Polarizable Continuum Model
DMA Distributed Multipole Analysis
GDMA Gaussian Distributed Multipole Analysis
BT 1-Benzyl-1H-Tetrazole
FA Fenamic Acid
TA Tolfenamic Acid
PA Phenylamine (Aniline)
n-MA N-Methylaniline
MA Mefenamic Acid
List of Symbols
21
List of Symbols
Flexible torsion angle
Np Number of data points
Nk Number of fitted coefficients
Na Number of atoms
Xij Regressors i = 1hellip Np j = 1hellip Nk
Yi Regressand i = 1hellip Np
Elatt Lattice energy
Eintra Intramolecular energy relative to the most stable conformation
Uinter Intermolecular energy
11 Background
22
Chapter 1 Introduction
ldquoMay the Force be with yourdquo
mdash General Dodonna Star Wars A New Hope
11 Background Polymorphism the ability of a molecule to crystallise or pack in more than one
structural form1 is a phenomenon that though common is not completely understood
The phenomenon which has been the subject of long and extensive research is of crucial
importance in many branches of the chemical industry Most of all in the pharmaceutical
industry because polymorphs can show significant differences in properties such as
solubility and dissolution rate2 which in turn affect the bioavailability of drug
formulations as well as their melting point physicochemical stability and mechanical
properties3
Researchers recognise that the polymorphic differences among molecules can be
exploited to take advantage of better compactibility or powder flow rate In addition a
thermodynamically metastable form may be chosen to improve drug administration as
such a form may have a higher dissolution rate than a more stable polymorph3 A third
reason for the increasing industrial interest in polymorphism is the need to protect
intellectual property as different patents can protect the different polymorphs of an active
pharmaceutical ingredient (API)
Polymorphism is common with about one-third of all APIs confirmed to be
polymorphic4 yet not so long ago the concept of polymorphism was either treated as an
annoyance or completely ignored by academics The dismissive attitude changed after the
sudden emergence of a new polymorph of the drug ritonavir a protease inhibitor for the
HIV virus Production had to stop as Abbott Laboratories (the manufacturer) was forced
to embark upon an expensive reformulation of the drug The more stable polymorph of
the API was discovered after capsules suddenly started failing dissolution tests two years
after the drug had been launched on the market5 The ritonavir incident taught the
pharmaceutical industry that the best insurance against such surprises is to conduct an
exhaustive experimental search before going to market6 a view that has since led to
regulations requiring extensive screening and process control for polymorphs in APIs and
inactive pharmaceutical ingredients 7
11 Background
23
The unexpected emergence of the new ritonavir polymorph despite proactive attempts
to discover polymorphs before the drug was marketed forcibly reminded us that
metastable polymorphs can appear to be kinetically stable1 If Abbot Laboratories had
computed the energies of possible polymorphs for ritonavir before marketing the drug
the company may have been able to prevent a multi-million dollar problem As Graeme
Day6 noted lsquocomputational methods of predicting crystal structures could play a large
part in this research both in identifying all possible polymorphic forms and judging their
relative stabilities ndash an examination and evaluation of all possible crystal structures of a
given compound is a step towards the understanding and perhaps control of
polymorphismrsquo Given the ubiquity and importance of polymorphs it is clear that
researchers need a computer tool that is capable of postulating possible crystal structures
of organic molecules before synthesis especially since a ldquostandardrdquo experiment that
guarantees the finding of all crystalline forms is impossible89
Crystal Structure Prediction (CSP Figure 11) is the ability to predict using
computational methods how a molecule will crystallise (ie unit cell space group and all
atomic positions) given only its chemical diagram10-12 CSP has been a long-standing
goal in computational materials chemistry for its potential to predict possible polymorphs
CSP is vital to the pharmaceutical industry because a successful search method would
smooth the process of manufacturing and patenting crystalline products13
Figure 11 Diagrammatic illustration of crystal structure prediction (CSP) methodology
11 Background
24
The international blind tests14 organised by the Cambridge Crystallographic Data
Centre (CCDC) is a collaborative effort that charts the progress and state of the art in
predicting the crystal structures of small organic molecules Since the first blind test in
1999 there have been five more challenges issued by the CCDC and Figure 12 shows
how complex the target molecule can be The sixth and most recent blind test15 was issued
on September 1 2014 Scientific insight can be gained from successful CSP studies as
these methods reflect the factors that control the crystallisation process16
Figure 12 A chemical diagram of a target molecule XX from the fifth blind test17
Most CSP methodologies as we shall see in section 28 assume that the experimentally
observed crystal structures are the most stable thermodynamic structures on the crystal
energy surface In other words the temperature effects are ignored because of poor
thermal results obtained in the past for organic molecules Therefore a better method is
needed for computing the thermal effects of organic molecules This thesis takes the first
step towards accurate thermal effects calculations and Molecular Dynamics simulations
by deriving new force fields that accurately model the intramolecular energies These
discoveries on thermal effects will advance polymorph prediction
Conformational flexibility is an important property to consider when generating
hypothetical crystal structures for a flexible molecule The modelling of conformation
flexibility is the central theme of this thesis because in many organic molecules the
flexibility leads to polymorphism For example flufenamic acid18 (FFA Figure 13) a
non-steroidal anti-inflammatory drug (NSAID) has nine known polymorphs Another
NSAID tolfenamic acid19 (TA Figure 13) has five polymorphs while ROY (Figure
13) named after its red orange and yellow crystals (Figure 14) has ten known
polymorphs2021
11 Background
25
FFA1822 TA19 ROY20
Figure 13 The chemical diagram of tolfenamic (TA) and flufenamic (FFA) acids
Figure 14 Polymorphs of ROY numbered in the order of discovery The polymorphs
have different colours melting points and molecular conformations (most pronounced in
the torsion angle θ) (Source Ref [20])
Just like FFA and TA the wide range of values for the torsion angle is also present in
ROY (Figure 15) Therefore the origin of polymorphism in these compounds is partly
due to the conformational flexibility of the molecules (see Figure 15 and the red curly
arrows in Figure 13) FFA TA and ROY are also examples of organic compounds that
are considered polymorphophores1923 A polymorphophore is a structural element that
favours the formation of polymorphic crystal forms when incorporated into a molecule
ie molecules with similar fragments are likely to be polymorphic Consequently
conformational flexibility polymorphism and polymorphophore are linked
12 Scope and Outline of Thesis
26
Figure 15 Overlay of the experimental conformers of ROY viewed with the overlaid
nitrobenzene fragment horizontal (Source Ref [2])
12 Scope and Outline of Thesis Chapter 2 examines the theoretical methods relevant to the work presented in this thesis
I will discuss these in several parts intermolecular forces and their models intramolecular
forces electronic structure methods force field methods least square estimation CSP
and crystal structure comparisons Chapters 3 to 6 contain the original work of this thesis
A CSP algorithm CrystalPredictor version 16 is used in Chapters 3 and 4 This
algorithm generates crystal structures while simultaneously varying the low-energy
barrier torsion angles of the flexible molecule Chapter 3 tests the ability of CSP to predict
the crystal structure of the flexible 1-benzyl-1H-tetrazole molecule This chapter is an
informal lsquoblind testrsquo challenge Following this Chapter 4 examines the polymorphophore
concept by investigating two flexible fenamates that are similar but have different
polymorphic behaviours I use CSP and compare the two fenamatesrsquo crystal energy
landscapes Then Chapter 5 investigates the origin of the barrier to rotation of fenamate
molecules Chapter 6 develops new analytical force field models that fit the
intramolecular energy of flexible fenamate molecules as the conformation changes This
chapter investigates three analytical forms the cosine series rescaling repulsion and
combined physical models Finally Chapter 7 offers conclusions and suggests areas for
further research and development
21 Overview
27
Chapter 2 Theoretical Background
ldquoA people without the knowledge of their past history origin and culture is like a tree
without rootsrdquo
mdash Marcus Garvey
21 Overview This chapter discusses the theoretical methods that are relevant to the work completed
in this thesis Central to this research is the evaluation of the lattice energy Elattndashndashthe
sum of the intermolecular energy Uinter and the intramolecular energy ΔEintrandashndashof a
flexible organic molecule Thus section 22 sets out the physical basis for the lattice
energy model by introducing the origin of intermolecular forces Section 23 then
discusses the models of intermolecular contributions of organic molecules Section 24
provides a brief discussion of intramolecular forces because Chapters 5 and 6 investigate
the origin of and derive an analytical model for the intramolecular energies of flexible
molecules Next section 25 discusses some force field methods by way of laying a strong
foundation for the new analytical force fields derived in Chapter 6 After this section 26
discusses the fitting routines coded into the new analytical intramolecular force fields for
flexible organic molecules Section 27 highlights the theoretical background of the
electronic structure methods used to calculate the intramolecular energy of isolated
molecules (Chapters 3 to 5) and the electrostatic contribution to intermolecular energy
(Chapters 3 and 4) Section 28 further discusses Crystal Structure Prediction (CSP)
which was introduced in Chapter 1 Finally section 29 discusses various tools for crystal
structure comparison
22 Intermolecular Forces This section discusses the importance relevance origin and categories of
intermolecular forces The intermolecular force is fundamental in the evaluation of lattice
energy which is central to CSP studies (section 28) in Chapters 3 and 4 Intermolecular
forces are present everywhere in nature and control properties of gases liquids solids
and complexes In science the quantitative study of intermolecular forces can reconcile
diverse phenomena at the atomic and increasingly electronic level24 In pharmaceutical
industries the use of intermolecular forces as a computational tool for predicting new
polymorphs is necessary because of the experimental problems in establishing all
polymorphs that could be manufactured in a controlled way This is essential in
22 Intermolecular Forces
28
preventing another ritonavir disaster (section 11) where a new thermodynamically stable
polymorph started precipitating out of the anti-HIV drug25
Figure 21 Typical intermolecular force potential energy functions for spherical atoms
The intermolecular pair potential U is the interaction energy of a pair of molecules as
a function of their separation R and orientation This definition applies to rigid
molecules Intermolecular forces are repulsive at short-range and attractive at long-range
Liquids and solids exist because molecules attract one another when they are far apart26
The fact that water has a definite density meaning it cannot be easily compressed to a
smaller volume shows that at short-range the forces between the molecules become
repulsive26 The relationship between this energy of interaction U as a function of
distance R takes the form shown in Figure 21 Figure 21 has an attractive region at
long-range where the force is negative and a steep repulsive region at short-range to
account for the low compressibility of condensed materials
221 Pairwise Additivity Due to the difficulty and computational expense of modelling intermolecular
interactions this thesis makes some approximations to the sum of the intermolecular
energies One such approximation is the pairwise additivity which assumes that the
energy of a system is the sum of all two-body interactions26 For instance for three
molecules A B and C the pairwise approximation to the total energy is UAB+UBC+UAC
22 Intermolecular Forces
29
222 Physical Origin of Intermolecular Force The significant forces between molecules have an electromagnetic origin27 Strong and
weak nuclear forces do not contribute to the intermolecular force because they are
significant over a range of the order of 10-4 nm this is extremely small compared to
molecular dimensions which are typically 05 nm The gravitational force which is long-
range does not contribute to the intermolecular force because the gravitational potential
energy of two atoms 04 nm apart is only 7 x 10-52 J some thirty orders of magnitude
smaller than the typical intermolecular force28 Consequently the intermolecular forces
have an electromagnetic origin
The work reported in this thesis will focus on closed-shell ground state molecules
Resonance interactions do not occur between ordinary closed-shell molecules in their
ground state Magnetic interactions are several orders of magnitude smaller and are not
significant to the intermolecular forces Therefore these two contributions will not be
considered any further
Intermolecular forces are of quantum mechanical origin and can in principle be
determined by solving Schroumldingerrsquos equation and using the Born-Oppenheimer
approximation (ie nuclei are in fixed positions) The physical origin of the
intermolecular force from perturbation theory is as follows
4
a b
a A b B o ab
e eH
r
21
where ea is the charge on particle a one of the particles of molecule A and rab is the
distance between it and the particle b in molecule B The Hʹ is the perturbation on HA +
HB and consists of electrostatic interactions between the particles of a (electron and
nuclei) and those of b
The intermolecular force F and intermolecular energy U are related
U
FR
22
where R is the distance between the spherical molecules
When considering the intermolecular potentials it is helpful to separate various
contributions These contributions of intermolecular energy can be separated into two
Perturbation theory finds approximate solution to problem by starting from the exact
solution of a related problem It is can be used for describing intermolecular forces
because they are relatively weak
22 Intermolecular Forces
30
main types short-range and long-range interactions Israelachvili29 argued against
making this distinction due to the danger of counting twice which can happen in
theoretical analysis when forces with the same physical origin are both short-ranged and
long-ranged
223 Long-range Interactions If the interacting molecules are far enough apart ie long-range then the perturbation
theory becomes simpler because the overlap between the wavefunctions of the two
molecules can be neglected This is called the polarization approximation which was
first formulated by London30 in 193631 Three main types of long-range interactions exist
electrostatic induction and dispersion These long-range contributions vary by R-n
Electrostatic
The electrostatic force is a classical Coulombic interaction which arises from the
interaction between the static charge distributions of two molecules This force can be
attractive or repulsive but is strictly pairwise additive and dependent on orientation
Therefore the electrostatic force plays an important role in determining the structure
adopted by the solid state If ρA(r) is the charge density for molecule A then equation 21
becomes
3 3
00
( ) ( )d d 0 0 0 0
4
A BA B A B
o
H W
r r
r rr r
23
The first-order energy described the electrostatic interaction The electrostatic
expression in equation 23 is the exact classical Coulombic interaction energy of two
molecular charge distributions at long-range
Induction
The induction effects a second-order energy arise from the distortion of a particular
molecule in the electric field of all its neighbours and are always attractive These effects
are non-additive because the fields of several neighbouring molecules may reinforce or
nullify each other26 The induction energy of molecules A and B are considered separately
The induction contribution of molecule A in state m and non-degenerate ground state 0
is
The induction energies are always attractive because distortion only occurs when there
is a lowering of energy Because the energies are non-additive they are difficult to
implement computationally32 The inclusion of the explicit induction to the
0 0
0 0 0 0 0 0A B A B A B A B
A
ind A Am m
H m m HU
W W
24
22 Intermolecular Forces
31
intermolecular energy can significantly reorder the relative energies of a molecule33
especially for large molecules like carbamazepine32 The distributed polarizability can be
used to model the induction energy as Gareth Welch34 did However this approach is
computationally demanding because a large basis set and high-quality wavefunctions are
often required32 for convergence criteria to be met In this thesis the induction energy is
not modelled explicitly Instead it uses PCM (Polarizable Continuum Model section
283) to model the polarization effect that arises from the electrostatic interactions in a
solvent medium29
Dispersion
Dispersion is a universal force of quantum mechanical origin We know that because
electrons are in continuous motion their electron density oscillates continuously
producing instantaneous electric dipoles that change as the electron density changes The
instantaneous dipole in one molecule induces another electric dipole in the other
molecule There is an instantaneous correlation of fluctuation of charge density This is
why this contribution is universal and requires a description of electron correlation
Dispersion is an attractive force and is approximately pairwise additive The perturbation
theory expression for dispersion contribution is as follows
0 0 0 0
00 00disp A B A B
m n m m
H mn mn HU
W W W W
25
London30 provided the most widely understood treatment of dispersion forces where
atoms can be visualised as a set of harmonic oscillators In this treatment the coupling of
the oscillators leads to the lowering of the energy The dispersion energy depends on the
square of the coupling constant The leading term in the dispersion energy is proportional
to R-6 because the coupling for a pair of interacting dipoles is proportional to R-3
224 Short-range Interactions
Exchange-Repulsion
When electron clouds of two molecules approach each other and become sufficiently
close they overlap At short-range the most important contributions are exchange and
repulsion these two are often taken together despite having opposite signs and are called
exchange-repulsion31 The exchange contribution is the attractive energy resulting from
electrons of one molecule becoming free to move over both molecules This increases the
uncertainty of the electronrsquos position allowing the momentum and energy to decrease
Repulsion contribution arises from the slight overlap of electrons that are trying to occupy
the same region of space This overlap which is prohibited by the Pauli Exclusion
23 Modelling the Intermolecular Forces for Organic Molecules
32
Principle leads to redistribution of electrons and increase of the repulsion between the
nuclei The exponential repulsion domination leads to an overall repulsive effect and is
approximately pairwise
225 Penetration Energy and Charge Transfer The overlap at short-range leads to modification of the long-range terms When charge
densities overlap at short-range the electron density will no longer shield the nuclei of
one molecule and therefore the molecules will experience a greater attraction of electron
density associated with other species The energy difference from this increased attraction
is the charge penetration it is the modification of the electrostatic energy at short-range
and so is a first-order effect Charge transfer also occurs during redistribution of electrons
at short-range It is a part of the short-range induction energy and so is a second-order
effect The energy contributions from charge transfer and penetration are small and are
often negligible35 Some of these effects may be absorbed in the empirically fitted models
of the dispersion and repulsion terms (section 27)
In summary for the organic molecules studied in this thesis repulsion dominates at
short-range while electrostatic and dispersion contributions dominate the intermolecular
energy at long-range Therefore the total intermolecular energy can be expressed as the
summation of the electrostatic Uelec repulsion Urepul and dispersion Udisp contributions
inter elec repul disp elec repul dispU U U U U U 26
23 Modelling the Intermolecular Forces for Organic Molecules The potential model used in this thesis for evaluating the intermolecular energy Uinter
is an intermediary between conventional force fields and periodic electronic structure
calculations The functional form of conventional force fields have limitations because
the same charges are used for intermolecular and intramolecular interactions2 (section
254) Periodic electronic structure calculations are very expensive and were not
available at the start of my research in 2010 For example the plane-wave DFT-D study
of selected pharmaceutical crystal structures using Quantum Espresso was published in
201336 The Generation Ranking and Characterisation Engine (GRACE37 program
section 284) which when coupled to another periodic DFT-D code (section 275) was
successful in the fourth blind test10 is still not available to researchers as of this writing
The work presented in this thesis models the dispersion repulsion and electrostatic
interactions (equation 26) explicitly The dispersion and repulsion contributions were
modelled using a transferrable empirically fitted model In contrast the electrostatic
23 Modelling the Intermolecular Forces for Organic Molecules
33
contribution was modelled using ab initio wavefunction calculation on an isolated
molecule for each molecular conformation due to limited transferability
231 Repulsion-Dispersion Potentials The dispersion and repulsion terms are modelled with an empirical exp-6 atomndashatom
potential that is assumed to be transferrable3839 The repulsion term is represented by the
exponential-based term and the dispersion is represented by the inverse sixth power term
6
exp( )
repul disp ik ik
i k
U A B R C R 27
where atom i in molecule 1 is of type ι atom k in molecule 2 is of type κ and they are
separated by interatomic distances Rik This potential (equation 27) was derived by fitting
the parameters to known crystal structures and it obeys the following combining rules
1 1
2 21
( ) ( ) ( )2
A A A B B B C C C 28
Parameters for carbon non-polar H and N atoms were derived from fitting to
azahydrocarbon crystal structures39 while the parameters for the oxygen atom were
derived from fitting to oxohydrocarbon crystal structures38 The polar H atom parameters
were derived from azabenzenes nitrobenzenes and other simple molecules40 To account
for the smaller effective van der Waals radius of protons the distinction between polar
and non-polar H atoms is necessary41 In Chapters 3 and 4 the repulsion-dispersion
contributions to the intermolecular energy will be calculated using the potential of
equation 27 and the ldquoFITrdquo34 parameters These FIT parameters were fitted using a model
that had explicit electrostatic interactions Once the repulsion and dispersion terms were
generated they were summed over all intermolecular atomndashatom distances up to a defined
cut-off This is typically 15 Aring for small organic molecules for fast calculations and 30 Aring
for large molecules34 It should be noted that some of the other intermolecular
contributions not modelled explicitly by equation 27 and any electrostatic model might
have been absorbed by the empirically fitted models of dispersion and repulsion terms
because these other contributions will be present to some extent in the sample crystal used
in deriving the parameters A B and C
In contrast to ldquoFITrdquo the empirical intermolecular potential by Gavezzotti42ndashndashanother
exp-6 potential that will be used in Chapters 5 and 6 to investigate the origin of
intramolecular energy and design new analytical force fieldsndashndashdoes not use combining
rules and has no atomic or site charges
23 Modelling the Intermolecular Forces for Organic Molecules
34
232 Electrostatics Potential This section discusses the two methods used in this thesis for modelling the electrostatic
contribution to the intermolecular energy (equation 26) in Chapters 3 and 4
(1) The Atomic Charge Model is a crude but inexpensive approach It uses Coulombrsquos
law through pairwise interaction of isotropic (spherical) point charge q placed on each
atom separated by distance R
0
1(R )
4 R i k
elec ik
ik
q qU 29
where ε0 is the dielectric vacuum constant It assumes that the charge density of the
molecule can be described by superimposing spherical atomic electron densities The
atomic charge model cannot represent non-spherical features such as lone pairs and
electrons or short-distance directional intermolecular interactions like the geometry of
the H-bond41 As a result extensions to the isotropic model have been proposed to define
lone pair sites as dummy atoms having isotropic electrostatic interactions43 or at satellite
positions that are optimised to provide best fit to the electrostatic field44
Although atomic charges can be derived from the experimental X-ray diffraction data
these results are unreliable due to the many approximations and assumptions that must be
made during their calculation45 On the other hand atomic charges can be generated from
an ab initio wavefunction calculation of the isolated molecule to estimate the electrostatic
contribution41 This involves using the CHELPG scheme (an acronym for CHarges from
ELectrostatic Potentials Grid based method) which performs the least-squares fit of the
atomic charges to reproduce the molecular electrostatic potential as evaluated from ab
initio density on a regularly spaced grid46 Unfortunately higher moments such as
octupoles hexadecapoles and so on make a small contribution to the potential when the
CHELPG scheme is used Indeed Francl et al47 showed that the CHELPG procedure is
ill conditioned for higher atomic multipoles so that the charges are not well determined
however they did show that Singular Value Decomposition (section 262) could improve
the condition numberdagger
(2) The Distributed Multipole Moments The electrostatic potential around a molecule
can be represented by an expansion of multipole moments At long range this
daggerThe condition number is the ratio of the largest to smallest singular value in the singular
value decomposition of a matrix A matrix is ill conditioned if the condition number is
too large
23 Modelling the Intermolecular Forces for Organic Molecules
35
electrostatic potential is exact since the charge distribution is approximately spherical as
the distance approaches infinity At shorter range the more apparent anisotropic nature
of charge density is not easily represented by the central multipole expansion48 A better
approach is to use a multiple expansion about several sites in the molecule which can be
achieved with the distributed multipole expansion
The distributed multipole expansion is an explicit method of generating higher-order
atomic multipoles that involves modelling the atomic charge distribution using a series
of distributed multipoles (charge dipole quadrupole octupole hexadecapole etc as
illustrated in Figure 22)26 Consequently the derivation of the distributed moments is
essential There are two ways of achieving this computational analysis of the charge
density and fitting to experimental data Deriving the multipole moments experimentally
is challenging and often the data are insufficient to deduce any particular distribution of
multipoles across specific sites49 For example the Stark effect gives the magnitude but
not the sign of the components of the dipole moment along the inertial axes26
Figure 22 Charge distributions corresponding to pure multipoles Blue portions
represent regions where the function is positive and yellow portions represents where it
is negative Qlk is the spherical harmonic multipole where l is angular momentum
quantum number and k = l l-1hellip -l specifies the component of the angular momentum
around the z-axis (Source httpenwikipediaorgwikiSpherical_harmonics [Accessed
11012015])
Distributed Multipole Analysis (DMA) is a systematic way of determining the
distributed moments50 This computational approach derives charge distribution from an
24 Intramolecular Energy
36
ab initio wavefunction51 and describes it in terms of distributed multipoles (Figure 22)
located at a number of site in the molecule using the Gaussian Distributed Multipole
Analysis (GDMA)52 program The GDMA program carries out a DMA of the density
matrix (Fchk) file produced by GAUSSIAN53 for the isolated molecule in the molecular
axis system34 This thesis uses version 252 of GDMA because it handles diffuse functions
more satisfactorily51 than version 154
In contrast to the atomic charge model the distributed multipole moments have
successfully predicted the directional (anisotropic) lone pair interactions π-π stacking
arrangements in aromatic rings and electrons and H-bond geometries in molecular
organic crystal5556 The long-range interactions which include the chargendashcharge (R-1)
chargendashdipole (R-2) and dipolendashdipole (R-3) terms are evaluated using the Ewald
summation method57 while the remaining long-range interactions are summed by direct
method
In summary the electrostatic contribution is modelled by using either an atomic charge
model or distributed multipole moments obtained from ab initio methods while the
repulsion and dispersion contribution are modelled using an empirical exp-6 potential
24 Intramolecular Energy The lattice energy of a crystal structure is the sum of the intermolecular and
intramolecular energies The focus of this section is the intramolecular part of the lattice
energy In Chapters 5 and 6 I investigate the origin and derive analytical models for the
intramolecular energies of flexible molecules (Chapter 6) Therefore this section
concisely examines the intramolecular energy of flexible molecules
The intramolecular energy of rigid molecules is negligible so the early work of crystal
structure prediction (section 11) focussed on the easier problem of rigid molecules In
this thesis a flexible molecule has one or more internal degrees of freedom that change
between phases for example torsion angles around single bonds The intramolecular
energy for a flexible molecule is the energy difference between the molecule in a specific
conformation (eg in a crystal) and in the lowest energy of the isolated gas phase
conformation As evident from ROY in Chapter 1 polymorphic forms can exhibit very
different torsion angles (Figure 15) ie can display conformational polymorphism
Cruz-Cabeza and Bernstein58 argued that when referring to conformations in crystal
structures a distinction should be made between conformational adjustment and
conformational change Conformational adjustment arises when a flexible molecule
adjusts to the crystal environment by slightly varying the conformation to minimise the
24 Intramolecular Energy
37
lattice energy of the crystal while conformational change involves a change of gas phase
conformer (Figure 23) In the context of the polymorphism of flexible molecules Cruz-
Cabeza and Bernstein58 referred to two polymorphs whose independent conformations
are related by conformational change as conformational polymorphs For example crystal
structures A and B in Figure 23 are conformational polymorphs
Figure 23 Schematic representation of conformational change and conformational
adjustment (Source Ref [58])
The simplest approach to calculate the intramolecular energies is to use force field
methods (section 25) which involve summing the contributions that arise from bond
stretching angle bending and dihedral torsion angles However despite the speed and
successes of force field methods in Molecular Dynamics and in modelling proteins59 the
molecular mechanics descriptions of the intramolecular energies and molecular
geometries are not sufficiently accurate for evaluating the lattice energy of crystal
structures (section 254)
Another method for evaluating intramolecular energy is electronic structure calculation
(section 27) This approach avoids the problem encountered in force field methods but
at the cost of higher computing time The conformations of flexible molecules and their
relative energies can be sensitive to the electron correlation method (because of the
important dispersion contribution) and to the basis set that is used (since large basis sets
are required to avoid intramolecular BSSE60 during electronic structure calculations) The
errors from intramolecular dispersion (section 275) can lead to the failure of quantum
mechanical calculations for molecules that adopt a folded conformation6061
One way of solving this problem is the dispersion-corrected (ndashD section 275) method
Warnings of the intramolecular energy sensitivity toward the electronic structure level of
25 Force Fields (Atomistic Modelling)
38
theory are relevant to the CSP studies of Chapter 3 and 4 where the focus is on other
aspects of the computational model and not on the rigorous test of these errors However
it is a common practise to use one electronic structure method for evaluating the
intramolecular contributions toward the final lattice energies A necessary compromise
then is to conduct prior analysis of the effect that different levels of theory have on the
intramolecular energy for a specific molecule
The frequently used DFT level of theory such as B3LYP6-31G(d) may not give
reliable results for molecular systems where the intramolecular dispersion energy is likely
to be a major factor in determining the conformation60 Due to this limitation I did not
use the 6-31G(d) basis set in Chapters 3 and 4 when computing the final intramolecular
and intermolecular energies of the crystal structures
25 Force Fields (Atomistic Modelling) Force field methods (also known molecular mechanics methods) ignore the moleculersquos
electronic motions and calculate the energy of a system as a function of the nuclear
positions These methods are a cheap alternative to electronic structure methods (section
27) The basis of understanding the force field is the Born-Oppenheimer approximation
which assumes that the motions of the nuclei are independent of the motions of the
electrons In force field calculations the arrangement of the electrons is assumed to be
fixed62 Thus traditional force field methods cannot predict properties based on electronic
motions such as the breaking and formation of chemical bonds polarization effects and
proton transfer
The parameters determined for small molecules can be transferred to larger systems
such as polymers63 and can also be used for billions of atoms on supercomputers Indeed
the ability to transfer force fields from one system to anotherndashndashfor systems that are too
large for quantum mechanical calculationsndashndashis arguably the most valuable property of
many force fields6364
The downside to these classical force fields is that conformation and energy results are
often prone to inaccuracies These inaccuracies were observed when force fields methods
were used in CSP to calculate the final lattice energies65-67 (section 254)
25 Force Fields (Atomistic Modelling)
39
Figure 24 The schematic view of force field interactions Covalent bonds are solid lines
while the dotted line indicates non-bonded interaction (Source Ref [68])
Figure 25 Schematic view of four key contributions to a molecular mechanics force
field These forces are bond stretching bond stretching angle bending torsional terms
and non-bonded interactions (Source Ref [63])
The application of force fields involves choosing an energy functional form followed
by evaluating all unknown parameters A typical force field method arises from four
principal energy terms of intermolecular and intramolecular forces within the system6970
( )MM b nbE E E E E 210
where sumEb sumEθ sumEξ and sumEnb are the total energy of bond deformation valence angle
deformation torsion deformation and non-bonded interactions (van der Waals and
electrostatic) respectively The deviation of bond angle and torsion from equilibrium
describes the penalty of deformation (intramolecular) while non-bonded term describes
the interaction between non-bonded parts of the system (intermolecular)
Hookersquos law models bonds between atoms as a spring
2( )b r eq
bonds
E K b b
211
25 Force Fields (Atomistic Modelling)
40
where Kr is the force constant and beq is the ideal bond length A common mistake is to
assume that the equilibrium value (eg beq) is the global minimum value in actuality beq
is the value that b adopts when all force field terms equal zero This Hookersquos functional
form is an example of applying the harmonic oscillator in which the relationship between
force and displacement is linear A more accurate description of the relationship between
force and displacement is non-linearity ie anharmonic oscillator Hence Hookersquos
functional form is not as accurate as using cubic and higher terms (anharmonic terms)
Valence angles have a similar model to equation 211
angles
eqKE 2)(
212
where K is the strength of the spring holding the angle at ideal valence angle eq
Compared to a bond model less energy is required to distort the valence angle away from
the reference and the force constants are smaller The higher terms such as cubic and
quartic terms improve the valence angle model The 1-2 and 1-3 interactions (defined in
Figure 24) are also known as hard degrees of freedom because large amounts of energy
are required to deform bonds or angles from their equilibrium positions However
CrystalOptimizer71 (section 282)ndashndashan algorithm used in Chapters 3 and 4 to compute
the lattice energy accuratelyndashndashassumes that some 1-3 interactions are soft degrees of
freedom For example hydroxyl (HndashOndashC) and amide (HndashNndashC) bond angles were treated
as flexible in three model systems72
Figure 26 Schematic view of the torsion angle ξ using the ethane molecule (Source
quantumwisecomdocumentsmanualsvnl-200810_Manualchapmolbuilderhtml
[Accessed 11012015])
25 Force Fields (Atomistic Modelling)
41
The major change between crystal structures is their torsion angles The torsion angle
ξ in the ethane molecule shown in Figure 26 is defined as the intersection angle between
the two planes α and β spanned by the respective atom chains 1ndash2ndash3 and 2ndash3ndash4 It is clear
that the value of the torsion angle ξ between atoms 3 and 2 depends on the four atoms
selected Due to the periodic nature of torsion angles the model is expressed as a periodic
function
[1 cos( )]2
n
torsions
VE 213
where is the periodicity and represents the number of minima as the bond rotates about
360deg The phase factor term is the torsion angle as the rotating bond passes the
minimum or minima Vn is the barrier height to rotation about torsion angle ξ The value
of Vn is larger for double bonds than for single bonds The definition of Vn is ambiguous
when more than one term is needed to model the torsional energy64 Even more
misleading is that the 1-4 non-bonded (Figure 24) and higher interactions contribute to
the torsional potential The additional term with the correct qualitative behaviour of the
barrier to rotation63 is a better description of Vn
The last term in equation 210 is the non-bonded interactions
12 6
[ ]nonbond
ij ij i j
nb
i j ij ij ij
q qE
r r r
214
where the adjustable parameter σij is the collision diameter and is defined as the separation
for which the van der Waals energy is zero The qi and qj terms are the partial or net
atomic charges63 Equation 210 is a combination of the repulsion-dispersion (also known
as the van der Waals term and is often fitted to a Lennard-Jones 6-12 potential73 because
of the computational ease) and an electrostatic term It should be noted that intermolecular
and intramolecular contributions have the same set of parameters Many of the more
recent developments in protein force fields include electronic polarizability or a solvation
effect in an approximate way68
251 AMBER The AMBER force fields are widely used for modelling proteins and nucleic acids74
AMBER which is in continual development has relied on the past knowledge of force
fields such as ECEPP potentials75 and Consistent Force Field (CFF76) The exclusion of
H atoms from an earlier version of an AMBER force field was due to limited computer
power However a compromise was adopted in later versions due to the importance of
the H-bond68
25 Force Fields (Atomistic Modelling)
42
The charges were derived by fitting partial charges to ESP (electrostatics potential)
charges obtained via ab initio calculations (HFSTO-3G) An adapted version of van der
Waalsrsquo term from amide data fitting by Lifsonrsquos group7778 and liquid state simulations79
by Jorgensen was used The first two terms (bonds and angles) of equation 230 were
fitted from crystal structure data while the torsional terms were extracted from either
experimental data or ab initio calculations
The fact that AMBER has limited parameters for organic molecules prevented this force
field from being widely used in drug design and other studies of ligandndashprotein or ligandndash
DNA interactions80 Hence a Generalised Amber Force Field (GAFF) was introduced by
Wang et al80 to describe a wider variety of organic molecules including most
pharmaceutical molecules
252 CHARMM CHARMM81 (Chemistry at HARvard using Molecular Mechanics) has some overlaps
with AMBER in part because the first versions of both force fields were developed
around the same time Like AMBER H atoms were excluded in the earlier version but
were later replaced with a compromise solution Although ab initio calculations were
used in fitting this model a different level of theory (HF6-31G) was employed The
interaction energies were scaled to match water dimerization energy predicted via a
TIP3P model to achieve a balanced solutendashwater and waterndashwater interaction A rough
continuum solvation model can be implemented by using the force field with distance-
dependent dielectric constant The second version of CHARMM from 1985 is used
today because of the respectable results obtained from solvated simulation68
Subsequent developments were made in later versions of CHARMM8283 to improve
the balance of interaction energies in solvent simulations More recently a force field for
all atoms often called the CHARMM general force field (CGenFF) was published84
This force field covers a wide range of chemical groups present in biomolecules and drug-
like molecules and focusses on quality of result rather than on transferability
253 Other Force Fields There are more complex force fields than those discussed above For example cubic
and quartic terms can be added to equations 210 and 211 to reflect anharmonicity and
stretch-bend cross terms or the Lennard-Jones function can be replaced with a more
flexible Buckingham (exp-6) or Morse potential85 Examples of such force fields are
MM486 and Merck Molecular Force Field (MMFF)87 The cubic and quartic terms are
also used in MM288
25 Force Fields (Atomistic Modelling)
43
Figure 27 Schematic view of some of the common cross terms (Source Ref [63])
The cross terms in force fields represent coupling between internal coordinates For
example an increase or decrease of valence angle can affect adjacent bonds Stretch-
stretch stretch-bend stretch-torsion bend-torsion and bend-bend (Figure 27) are
examples of cross terms believed to be the most important in force fields these cross
terms in force fields are designed to predict vibrational spectra63
Another very popular force field is OPLS-AA (Optimized Parameters for Liquid
SimulationsndashAll Atoms) which specialises in simple liquids8589 Although huge
advances have been made in the understanding of biomolecular behaviour there is still a
demand for more accurate prediction of energies90 even for proteins and nucleic acid
polymers that have been studied extensively eg AMOEBA91 which uses atomic
multipoles
254 The Limits of Current Force Fields A major limitation of current force fields is the use of atomic charges in the description
of electrostatic contributions9293 Another limitation is that the intermolecular and
intramolecular forces have the same parameters It is therefore not surprising that in the
blind tests of organic CSP there have been no success based on the use of force fields for
final lattice energy (sum of intermolecular and intermolecular energy) evaluations11 In
specific cases like aspirin the intramolecular force field clearly has too strong a
preference for the wrong conformation so that the lowest-energy crystal structures have
that conformation94
Indeed some force fieldsrsquo lattice energy minimizations were shown to change the
conformation of the crystal structure so much that the crystal structure could not be
26 The Fitting Routine
44
reproduced65 In other cases the force fields were able to reproduce the crystal structures
but failed to rank the energy of these crystal structures accurately These failures have
been traced to using the same charges and van der Waals interactions for the
intermolecular and intramolecular forces95
Generally force field potentials that are more accurate tend to have more terms because
they usually yield better fit with experimental or ab initio data However additional
parameters make the fitting procedure more complicated and time consuming with no
scientific basis Therefore an ideal analytical model for the intramolecular energies
should have terms that are few in number (Chapter 6) based on a consistent scientific
origin (Chapter 5) and transferrable
In summary the traditional force field includes explicit periodic torsional potentials
and non-bonded terms including the electrostatic term that are applied to all atom pairs
separated by three or more covalent bonds (1-4 interactions and above) Researchers built
these traditional force fields on the reasonable assumption that in biomolecules the
intramolecular non-bonded interactions are the same as intermolecular non-bonded
interactions This is clearly a limitation2 because intramolecular atom-atom distances are
often much shorter than intermolecular (van der Waals) distances I exploited this
limitation in Chapter 6 by decoupling the intermolecular and intramolecular contributions
and derived new analytical intramolecular force fields
26 The Fitting Routine The Gavezzotti exp-6 and ldquoFITrdquo potentials (section 231) and many force field methods
were fitted to experimental or ab initio data These potentials all depended on an assumed
functional form the ability to extrapolate the quality of data the range of sampling a
method of fitting (the focus of this section) and so on
In Chapter 6 I developed codes (Appendix A) for fitting a new analytical
intramolecular force field to ab initio conformational profiles of fenamates which use
one method of fitting I assumed that the new analytical intramolecular force field was
approximately linear This section explains what a linear problem is solves the problem
and outlines an alternative solution that uses a Numerical Algorithm Group (NAG) library
that was implemented in the design of new analytical force fields (Appendix A)
261 Linear Least Square Method A model is linear if given a random data of (Yi Xi1hellip Xip-1 i =1hellip n) the relationship
between the response variable or observation Yi and the explanatory or independent
variable Xij can be formulated as follows
26 The Fitting Routine
45
Yi=β0+ β1Xi1 + β2Xi2 +hellip+ βp-1X ip-1 + εi i=1hellipn 215
where εi is the error β0 β1 β2 hellip βp-1 are the intercept and regression coefficients for the
explanatory variables
The linear regression model of equation 215 in matrix form is
0 1 11 1 1 11 1
0 1 22 1 2 12 2
0 1 1 1 1
p p
p p
n nn p n p
X XY
X XY
Y X X
216
or
11 1 11 0 1
22 2 12 1 2
11 1
1
1
1
p
p
n p nn n p
X XY
X XY
Y X X
217
or 1 1 1n n p p n Y X ε 218
where Y is ntimes1 X is ntimesp (an ntimesp matrix has n rows and p columns) β is ptimes1 and ε is
ntimes1 matrix
We can solve this linear regression model by using the least squares method The basic
idea behind the least squares is minimising the sum of squares for the errors ie
2n T
ii ε ε where T is the transpose Rearranging equation 218 as a function of errors
and evaluating least square problem gives
( ) ( )
( ( ) ( ) ( ))
( ( ) ( ))
( ( ) ( ) ( ))
( )
( 2 )
T T
T T T T
T T T T T
T T T T T T
T T T T T
T T T T
ε ε Y X Y X
Y Y Y X X Y X X
Y Y Y X X Y X X
Y Y Y X X Y X X
Y Y Y X Y X X X
Y Y Y X X X
219
Then differentiating the least square (equation 219) with respect to the coefficient gives
( ) ( 2 ) 0
2( ) 2 0
2 2 0
T T T T T
T T T
T T
T T
ε ε Y Y Y X X X
Y X X X
X Y X X
X X X Y
220
26 The Fitting Routine
46
Then multiply both sides by 1( )T X X
1
1 1( )T T
p p n p n p n n
X X X Y 221
The expectedmodel value Ŷ is
1 1ˆ
n p p n Y X 222
Equations 221 and 222 can be coded explicitly which I did for cosine fits in my upgrade
report96
262 Subroutine for Solving Least Squares An alternative to coding equations 221 and 222 explicitly is to use the G02DDFE97
NAG routine This NAG routine computes the error of each coefficient and states whether
a solution is unique or not in addition to computing the coefficients Here I discuss some
key concepts that will help in understanding the G02DDFE97 NAG routine used in
Chapter 6
If X is an n times p matrix the rank of X is the number of nonzero rows in the row echelon
derived through the Gaussian elimination method If matrix A has a rank as large as
possible then the matrix is a full rank otherwise the matrix is rank deficient A matrix
that is full rank has one unique solution The G02DDFE97 NAG routine can work out if
any matrix is full ranked or rank deficient
QR decomposition is the first step used for solving the least squares problem in the
G02DDFE97 NAG routine QR decomposition transforms matrix X into a QR matrix that
consists of an orthogonal matrix Q and an upper triangle matrix R
1 2 1
R RX = Q = Q Q = Q R
0 0 223
where Q1 is the first p columns of Q and Q2 is the last n-p columns of Q
G02DDFE97 subroutine calculates the regression parametersndashndash and in Chapter
6ndashndashand Residual Sum of Squares (RSS) for a general linear regression model by
minimising the sum squares residual G02DEFE a routine within G02DDFE carries out
QR decomposition of the matrix data X If R is of a full rank ie the matrix has a rank
as large as possible then R-1 exists and the solution of the regression model is as follows
1ˆ( ) ik
T
ik y R Q 224
where Q and R are the decomposed matrices of data being rescaled and y is the ab initio
data minus any remaining contributions not being fitted If R is not full rank Singular
27 Electronic Structure Methods
47
Value Decomposition (SVD) of X (ie X=U1DVT) helps to extract just one solution of
the linear regression model
1ˆ ( ) ik
T
ik y VD U 225
where V D and U are respectively the orthogonal the non-negative diagonal element
and the orthogonal decomposed matrices RSS and the standard error fit are related
fit
p k
RSS
N N
226
where Np and Nk are the number of observations and regression coefficients for each of
the independent variables plus the intercept
Solving the least squares problem is a key feature of the algorithm in Chapter 6 The
algorithm undertakes the challenge of deriving a new analytical model for intramolecular
energies of flexible fenamate molecules The remaining features of the algorithm are
discussed in Chapter 6
27 Electronic Structure Methods The development of electronic structure methods and rapid advances in computing
technology have transformed the role of quantitative numerical calculations in both
theoretical and experimental studies of chemistry98 The first era from the 1960s to 1980s
established the basic mathematical foundations and computational machinery of todays
standard electronic structure methods They included HartreendashFock (HF) theory Moslashller-
Plesset (MP) perturbation theory Density Functional Theory (DFT) and many others98
This thesis classifies HF MP and DFT as ab initio methods
This thesis uses electronic structure methods to calculate the molecular properties of a
single molecule (and in principle of dimers and crystals) The electronic structure
methods seek to calculate the molecular properties from the first principles ie solving
Schroumldingerrsquos equation without using empirical data26 However approximations are
always necessary DFT is a modern arsenal of quantum chemical methods99 and to get a
better appreciation of this method it will be useful to look at more traditional
wavefunction-based approaches One of the simplest of these approaches is the Hartree
Fock (HF) theory
27 Electronic Structure Methods
48
271 Hartree Fock Theory The HF theory was developed to solve the electronic Schroumldinger equation that results
from the time-independent Schroumldinger equation after invoking the Born-Oppenheimer
approximation100 There are two good reasons for solving the Schroumldinger equation First
the solution gives the potential energy experienced by the nuclei ie the potential energy
surface Second the electronic wavefunction has lots of useful information about
molecular properties such as dipole and multipole moments polarizability etc
The HF method assumes that the exact N-body wavefunction of the system can be
approximated by a single Slater determinant of N spin-orbitals By employing the
variational theorem which states that the energy is always an upper bound to the true
energy one can derive a set of N-coupled equations for the N spin-orbitals The solution
to this equation yields the energy of the system and the wavefunction
The HF method is called the ldquoSelf-Consistent Field (SCF) methodrdquo because the HF
equations are solved using an iterative process The SCF process starts with an initial
guess for the orbitals and successive iterations are performed with new orbitals until the
self-consistent condition is achieved ie until the solution no longer changes
271 Molecular Orbital Theory With the new Quantum Mechanics (QM) of Heisenberg and Schroumldinger came two
general theories the Valence Bond (VB) and the Molecular Orbital (MO) theories These
two theories developed at around the same time quickly became rivals101 See ref102 for
a review of the classical valence bond approach The focus of this section is the MO
theory
The MO theory based on the HF theory theorises that each electronrsquos motion can be
described as a single-particle function (orbital) that does not depend on the instantaneous
motions of the other electrons MOs are calculated using the Linear Combination of
Atomic Orbitals (LCAO) which is a quantum superposition of Atomic Orbitals (AOs)
MO is a theory of bonding that can give insight into the forces involved in making and
breaking chemical bonds which are often the focus of organic chemistry
The early complexities of Quantum Mechanics led to the visualisation of MOs that are
easier to understand than numerical orbital coefficients103 Using SCF calculations we
can represent MOs using isosurfaces that correspond to the electron density The two
isosurfaces of particular importance are usually the Highest Occupied Molecular Orbital
(HOMO) and the Lowest Unoccupied Molecular Orbital (LUMO) These are known as
the frontier-orbitals104 It is not clear why the frontier-orbital theory is so successful26 but
27 Electronic Structure Methods
49
this theory is used extensively in computational chemistry to understand many
phenomena Frontier orbitals will be used in Chapter 5 of this thesis to understand the
origin of barriers to rotation for flexible molecules
HOMO is the isosurface from which it is energetically easiest to remove electrons from
(eg electron density donation to form a bond) as well as the most relevant MO in this
thesis The only requirement of the empty MOs is that they form an orthogonal set with
the filled MOs These unoccupied MOs are not optimised during the SCF process because
the energy of the molecule does not depend on them As a result these unoccupied MOs
including LUMOs are less reliable than occupied MOs such as the HOMOs Thus
Chapter 5 will focus on the HOMO isosurfaces of flexible molecules
272 Correlation Effects The major limitation of the HF method is that it treats each electron as moving under
the influence of the average effect of all other electrons the method does not take into
account the electronsrsquo instantaneous repulsion26 (correlation effect) One of the most
important effects of electron correlation is the dispersion interaction In fact the
dispersion interaction (section 22) is a correlation effect26100 The correlation energy is
the difference between HF energy in a complete basis (HF limit) and the exact energy
excluding the relativistic effects ie the electrons are propagating at speeds much slower
than light
The HF method is now used merely as a starting point for more elaborate lsquopost-HFrsquo ab
initio quantum chemical approaches99 because the poor performance of the HF method
offsets its efficiency and simplicity Correlation effects modify the electrostatic
interaction between the molecules due to changes in electron distribution and they tend
to reduce charge separations Electron correlation can be handled in quantum chemical
theory calculations using Moslashller-Plesset Perturbation Theory (MPPT) Density
Functional Theory (DFT)105 etc
273 Moslashller-Plesset Perturbation Theory In perturbation theory we start from a known solution and add a perturbation
Hamiltonian (equation 21) Moslashller and Plesset106 used perturbation theory to determine
the correlation energy (small perturbation) after solving the HF problem (the known
solution) Correlation corrections appear at the second order and beyond The zeroth-
order energy is the sum of the occupied orbital (eg HOMO) The first-order energy is
the HF energy26 MPn is the nth-order energy (n 2) In this thesis I did not perform
27 Electronic Structure Methods
50
geometry optimisations using MP2 methods for molecule(s) with 20 or more atoms due
to the computational expense
Although MP2 methods are used as the standard they have limitations For example
van Mourik61 noted that the MP2 description of intramolecular interactions with a -
electron system for flexible molecules is affected by a large intramolecular basis set
superposition error (BSSE) This large BSSE of MP2 was responsible for the wrong order
of stability for Phe-Gly-Phe tripetide107
BSSE is relevant in this thesis because many of the MP2 calculations were carried out
on flexible molecules that contained at least one aromatic ring (Chapters 3 to 5) The
origin of this error lies in the possibility that the unused basis functions of the second unit
B in the associated complex A∙∙∙B may augment the basis set of the first unit A thereby
lowering unit Arsquos energy compared to a calculation of this unit alone26108 This lowering
can be attributed to the variation principle that arises from the mutual enlargement of the
basis set of each monomer by the presence of the orbitals of its partner molecule109 Rather
than using an infinite basis set an impossible task the method for correcting this error is
to use a counterpoise (CP)
274 Density Functional Theory Density Functional Theory (DFT) is a cheaper alternative to MPPT Indeed P J
Stephens et al110 suggested in 1994 that in the future DFT might be preferred over the
MP2 method due to the lower computational demands of DFT That future is now for
DFT is currently the method of choice for first-principles electronic structure calculations
in condensed phase and complex molecular environments111112 Over the last 30 years
physicists working on the electronic structure of solids surfaces defects etc have used
DFT More recently DFT has become popular with theoretical and computational
chemists113
DFT is a theory of electronic structure exact in principle that is based on the electron
density distribution instead of the many-electron wave function111 DFT is based on a
theorem proposed by Hohenberg and Kohn114 which states that knowledge of the
electron density of a system in the ground state is enough to determine the energy lsquothe
energy is a functional of the densityrsquo2699105 A generalized DFT expression is
EDFT[ρ] = ENe[ρ] + T[ρ] + Eee[ρ] 227
where T[ρ] is the kinetic energy associated with the given electron density Eee[ρ] is the
electron-electron interaction energy and ENe[ρ] is the energy of interaction between the
electrons and lsquoexternalrsquo fields The ENe normally includes the interaction between the
27 Electronic Structure Methods
51
electrons and the nuclei but it can also include other fields imposed on the molecule
Each term depends on the electron density ρ
The exact form of T[ρ] and Eee[ρ] are not known and no fundamental theory for
determining them exists at present The usual route for solving this problem is to use the
method proposed by Kohn and Sham115 in 1965 that involves non-interacting electrons
For this system the electron density ρ(r) and the kinetic energy TS[ρ] (S denotes that
the kinetic energy is obtained from a Slater determinant) are exact while the Coulomb
(classical) part J[ρ] of the electron repulsion energy can be calculated The energy of the
system now takes the form
EDFT[ρ] = ENe[ρ] + TS[ρ] + J[ρ] + EXC[ρ] 228
where EXC the exchange-correlation functional is
EXC[ρ]=( T[ρ] - TS[ρ])+( Eee[ρ]- J[ρ]) 229
The exchange and correlation energy EXC is the functional that contains everything that
is not known Local-Density Approximation (LDA) and Generalized Gradient
Approximation (GGA) are used to approximate the EXC LDA the simpler
approximation assumes that the density corresponds to that of a homogeneous electron
cloud It proved to be an improvement over HF but is too inaccurate to be useful for
chemistry26 GGA an improvement on LDA incorporates dependency on electron
density and its gradient In practise hybrid (HF-DFT) functionals are used which
incorporate a portion of the lsquoexact exchangersquo from HF theory105 with exchange and
correlation from other sources (ab initio or empirical)
One of the most widely used hybrid functionals used is B3LYP which incorporates
Beckersquos three exchange-functionals116 (B3) with Lee Yang and Parr correlation
functional LYP117 PBE0118 another widely used functional was used in this thesis
(Chapters 3 to 6) These DFT methods are attractive because their results are comparable
to those obtained using MP perturbation methods but come at a much smaller
computational cost105
275 The DFT-D Approach DFT methods have drawbacks For one they are non-convergent in that no one knows
how to improve the results in a systematic way99119 The success of a particular functional
in one setting does not guarantee the performance in a different setting These drawbacks
led Orio99 to stress the importance of enhancing the credibility of DFT either by including
some form of validation or by estimating the error range through careful comparison
between the calculated and measured observable
28 Crystal Structure Prediction (CSP)
52
Another drawback is that the density functional cannot describe long-range electron
correlations responsible for dispersion forces112120 To overcome this defect researchers
have introduced corrections See refs120121 for a review of the impressive ongoing
attempts to improve the description of dispersion forces of DFT methods From a practical
viewpoint empirically damped ndashC6∙R-6 corrections to the standard density functional
approach provide robustness122 and speed We can solve the difficult dispersion
interactions classically This well-tested approach is DFT-D where -D stands for
dispersion correction The total energy is
EDFT-D = EDFT + Edisp 230
where EDFT is the self-consistent Kohn-Sham energy (equation 227) as obtained from the
chosen density functional and Edisp is an empirical dispersion correction Although DFT-
D was not used in this thesis it is nevertheless relevant because this discussion highlights
the importance of the dispersion contribution (ie correlation effect) to the overall energy
of the system
28 Crystal Structure Prediction (CSP) CSP assumes that the experimentally determined polymorphs correspond to local
minima in the crystal energy surface Elatt To put this approximation in context it is
important to note that the prediction of the relative thermodynamic stability of
polymorphs at a given temperature T and pressure p requires the minimisation of the
Gibbs free energy (G) with respect to the unit cell dimensions and the positions of all
atoms in the unit cell
where E is the internal energy V is volume and S is the entropy123 The variation in the
free energy arises from the differences in packing energy crystal density and entropy
Therefore all three terms associated with the Gibbs free energy (equation 233) should
be evaluated when determining the relative stability of polymorphs It is often the case
that only the lattice energy component of the first term (min E) is evaluated for two
reasons
The TΔS term is often neglected because the difference in lattice vibrational
energies between polymorphs is usually very small25124 At present the thermal
entropic and zero-point contributions to the Gibbs free energy cannot be readily
and accurate evaluated56
min G = min[E + pV ndash TS] 231
28 Crystal Structure Prediction (CSP)
53
The pΔV term could be calculated but is often neglected because of its small ΔV
value The compressibility of solids being low they contribute very little to Gibbs
free energy at normal pressure The pΔV term dominates at high pressure ie
10kbar125
Most of the computational approaches to CSP focus on minimising the lattice energy
The lattice energy Elatt is the internal energy at 0 K and 0 Pa ignoring the zero-point
energy The thermodynamic stability is not always the decisive factor in the packing
patterns of the molecules kinetics also plays an important role because it strongly
influences crystallisation conditions and solvent environment Nonetheless the
experimental structure is expected to appear within a narrow energy range of the global
lattice energy minimum56
Elatt can be calculated in several different ways depending upon the relative importance
of accuracy ease of implementation and computational cost in a given situation56
Ideally the lattice energy of a crystal should be calculated quantum mechanically but
such calculations are expensive Thus most approaches use force field methods andor a
cheap method to generate and evaluating the lattice energy in a hierarchal manner The
most successful CSP approaches rely on some form of the computationally demanding
but accurate electronic structure calculations either on an isolated molecule (to evaluate
the intramolecular contribution combined with the intermolecular contribution that has
been empirical fitted) or on a crystal (using periodic calculations)
Thus the key to successful CSP methods is not just the generation of all possible crystal
structures but also the accurate ranking of these generated crystal structures This ranking
requires balancing the intermolecular Uinter and intramolecular ΔEintra energy
contributions
where Uinter is the sum of the dominant electrostatics Uelec and repulsion-dispersion
Urepul-disp contributions and Eintra is the energy required to distort the molecule from its
gas phase conformation71 X denotes degrees of freedom that define the intermolecular
contacts while vector θ denotes the intramolecular degrees of freedom ie bond lengths
bond angles and torsion angles For rigid molecules there is no θ hence the ΔEintra (θ)
term vanishes For flexible molecules θ and hence ΔEintra (θ) must be accounted for from
the beginning
Elatt = Uinter (X θ) + ΔEintra (θ) 232
28 Crystal Structure Prediction (CSP)
54
281 CrystalPredictor
Chapters 3 and 4 use version 16 of CrystalPredictor126 which is different from rigid
or multiple rigid searches in that it incorporates conformation flexibility during the initial
search stage of crystal structures CrystalPredictor is not a black box it requires careful
analysis clear thinking and learning from earlier CSP studies CrystalPredictor performs
global lattice energy minimisation in order to predict the crystal structures of organic
molecules whose conformation is likely to be significantly affected by the packing forces
CrystalPredictor can find many plausible crystal structures in a multi-dimensional
space defined by the conformational degrees of freedom and lattice variables ie the
positions of the centre(s) of mass of the molecule(s) in the unit cell the orientation of the
molecules and the unit-cell dimensions and angles127 Within CrystalPredictor are two
important algorithms the Sobolrsquo128 sequence and the E04UFF NAG routine129 The
Sobolrsquo sequence generates the initial structures a characteristic of this approach is that
each Sobolrsquo corresponds to a distinct combination of every decision variable and thus
ensures a uniform and efficient sampling This prevents the problematic gaps and clusters
that random sampling can exhibit11 For more detail on how Sobolrsquo works see ref [128]
The E04UFF NAG routine129 carries out an extensive search for local minima of the
lattice energy surface using deterministic low-discrepancy sequences to ensure an optimal
coverage of the search space
CrystalPredictor models the lattice energy as the sum of the intramolecular and
intermolecular energy (equation 232) This lattice energy evaluation is crude but its
computational efficiency is necessary because CSP studies often require hundreds of
thousands of minimisations to sample the entire crystal energy surface The algorithm
computes the intramolecular energy as a function of flexible torsion angles using an
interpolation method on a set of quantum mechanically pre-computed intramolecular
energies by modelling the molecule as a set of rigid fragments connected by flexible
torsion angles The electrostatic contribution Uelec is evaluated by interpolating on pre-
computed atomic charges while an empirically fitted potential FIT34 computes the
repulsive-dispersive interactions Urepul-disp The sum of these two contributions is the
intermolecular energy Uinter=Uelec + Urepul-disp
In short CrystalPredictor is a minimisation algorithm
min Elatt = min[Uinter(X θ) + ΔEintra(θ)] 233
28 Crystal Structure Prediction (CSP)
55
that can generate crystal structures in the 59 most common space groups and with more
than 1 molecule in the asymmetric unit126 Z´gt1 However Chapters 3 and 4 limit the
search of hypothetical crystal structures to Z´=1 due to the huge computing time required
to generate Z´gt1 crystal structures
282 CrystalOptimizer CrystalOptimizer71130 refines crystal structures generated by CrystalPredictor126 To
account for the molecular flexibility accurately the CrystalOptimizer71130 algorithm is
required This algorithm solves the lattice energy problem (equation 233) as a two-level
optimization problem
The outer problem varies and ultimately optimizes the flexible conformational degrees
of freedom the remaining degrees of freedom are adjusted to minimize the intramolecular
energy127 A quasi-Newton scheme which ensures rapid convergence with many
optimization variable (X θ) solves the outer minimisation problem71 The inner
minimization problem optimizes the lattice energy for the fixed molecular conformation
determined by the outer problem The DMACRYS34 (section 26) program performs this
rigid body minimization CrystalOptimizer achieved a significant increase in the accuracy
of lattice energy calculations by127
1 allowing additional flexibility during lattice energy minimization (for example
considering more torsion angles andor bond angles as flexible degrees of
freedom)
2 accurately computing the intramolecular energy throughout optimization and
3 modelling the electrostatic interactions using distributed multipoles (up to
hexadecapole) obtained using the GDMA package52
Multiple ab initio calculations a very time-consuming process were often required
For this reason only the most promising structures from CrystalPredictor were used as
initial points for optimization Sometimes an intermediate step such as single-point ab
initio calculations (see Chapters 3 and 4) can improve the ranking of the lattice energy so
that only a handful of crystal structures (energy cut-off or a set number of unique crystal
structures minima) are optimized with CrystalOptimizer
CrystalOptimizer has one of the major featuresndashndashLocal Approximate Models (LAMs)ndash
ndashthat models the conformational energy and the multipole representation of the charge
density these are updated with explicit quantum mechanical calculations only when
necessary and not at every minimisation step The conformational energies their first and
min Elatt = min [ΔEintra(θ) + min Uinter(X θ)] 234
28 Crystal Structure Prediction (CSP)
56
second gradients and the distributed multipoles are also stored in the LAMs database
Re-using expensive electronic structure calculations (if the same conformational ranges
are encountered while minimising different hypothetical or experimentally determined
crystal structures) reduces the computing time without sacrificing accuracy7172130
283 Polarizable Continuum Model (PCM) Accurately modelling the balance between intramolecular and intermolecular energy is
important (eg using CrystalOptimizer) but just as important is modelling the effect of
the environment in distorting the conformer especially in cases where there is a
considerable difference in molecular conformations Cooper et al131 noticed that the total
calculated crystal energies which combine atom-atom model potential calculations of
intermolecular interactions with DFT intramolecular energies do not effectively
distinguish the real (known) crystal structures from the rest of the low-energy computer-
generated alternatives when the molecular electrostatic models are derived from isolated
molecule calculations They found that introducing a simple model for the bulk crystalline
environment when calculating the molecular energy and electron density distribution led
to important changes in relative total crystal energies and made possible the correct
distinction between the observed crystal structures and the set of computer-generated
possibilities This finding highlights the importance in CSP calculations of the
polarization of the molecular charge distribution especially for polar flexible
molecules131
In Chapters 3 and 4 PCM132 is used to account for the effect of organic environment
after generating and accurately computing the lattice energies using CrystalPredictor
that is an intermediate step that improves the electrostatic contribution to the
intermolecular energy and CrystalOptimizer I will model the polarizable continuum
environment with dielectric constants that is typical of molecular organic crystals ie ε =
3133 The PCM calculations only affect the final energy The geometry is not affected
because there is no molecular geometry minimisation of the crystal structure during the
PCM calculation
284 Other Approaches to Lattice Energy Minimisation There are other well-known approaches to lattice energy minimisations for flexible
molecules One computationally efficient approach is the Rigid CrystalPredictor-
Molecular Mechanics Method (RCM)17 by Graeme Day a variant on the method used in
Chapters 3 and 4 The first step performs constrained geometry optimization on a set
number of distinct conformations obtained from conformational analysis (the flexible
28 Crystal Structure Prediction (CSP)
57
torsion angles are fixed at the expected values from conformational analysis and all other
degrees of freedom are optimized) From this first step we can obtain the geometry
intramolecular energy and atomic charges The second step generates crystal structures
in 21 of the most common space groups by using a rigid CrystalPredictor134 search for
each distinct conformation17 Essentially the molecular geometries are treated as rigid
during the process of generating crystal structures The Uinter is calculated from the atomic
charges and an empirical exp-6 repulsionndashdispersion potential W99135 The third step
refines the most stable crystal structures obtained from the rigid-molecule searches For
this a two-stage procedure proposed by Day136 and co-workers is used The first stage
minimises the crystal structures by allowing the molecular geometry to relax using a
molecular mechanics description of energies associated with changes to the flexible
torsion angles This method trusts the molecular mechanics force field to provide the
correct molecular geometries but discards the energy which is not of sufficient accuracy
for the final ranking of crystal structures Then the resulting crystal structures are re-
optimized without further changes to the molecular conformations DMACRYS34 is used
to model the electrostatic interactions Uelec using the atomic multipole model The
remaining intermolecular terms Urepul and Udisp are obtained using the empirical W99
potential135 The intramolecular energy ΔEintra and the atomic multipole moments for
each conformation are derived from a single-point DFT calculation that incorporates the
PCM with a constant dielectric value of three to reflect the polarization effects in the
crystalline environment
Another approach is GRACE one of the most accurate minimisation methods This
approach presented by Neumann and Perrin was the first case wherein DFT-D methods
(sections 275) were applied to the CSP of molecular organic crystals First during the
crystal structure generation procedure a Tailor-Made Force Field (TMFF)13 developed
for fitting an atom-atom force field (non-bonded and bonding terms) specifically for each
molecule is used Then GRACE uses a hybrid method that combines the sum of the DFT
component and an empirical van der Waals correction ndashD (sections 274 and 275) to
re-optimise the lowest-energy crystal structures During this re-optimisation stage all
nuclear positions and electron density are optimised simultaneously which naturally
accounts for the molecular flexibility and other charge density reorganisation effects such
as polarization This approach reproduces experimental structures very accurately and
ranks the structures favourably amongst other hypothetically generated structures in many
(but not all) cases However these periodic DFT-D calculations are very expensive137
28 Crystal Structure Prediction (CSP)
58
285 The Crystal Energy Landscapes The CSP methods611 discussed above and many others sample a wide range of
possible crystal structures and determine the lattice energy in a hierarchal manner thus
generating a crystal energy landscape14 A crystal energy landscape is a plot of the lattice
energy against the density or the packing coefficient and it tells us how well the crystal
packs These landscapes often include the experimental structures as well as other low-
lying energy crystal structures that are worth comparing with the known polymorphs in
order to determine the types of intermolecular interactions and conformations that could
be feasible for a given molecule
In a crystal energy landscape in which only one crystal structure is calculated to be
more stable than any other by over a few kJ mol-1 typical of polymorphic energy
differences the molecule should only be found in that global minimum structure
Experiments or more demanding searches are needed to determine the stability relative
to multicomponent forms such as hydrates138 solvates139 or cocrystals140141 etc
However in most generated crystal energy landscapes there is typically a cluster of
structures within the energy range of plausible polymorphs These structures have to be
qualitatively assessed to see whether the barriers between the different structures are so
low that thermal motion in the crystal or molecular rearrangement during nucleation and
growth will ensure that only the most thermodynamically stable structure is seen Closely
related structures may also give rise to disorder142143 or plastic phases144 at higher
temperatures
The crystal energy landscape may suggest that alternatives to the known structures
could be found either as more stable or as kinetically trapped metastable polymorphs In
this case the calculations can complement experimental screening145 by suggesting
alternative methods146 such as a templating to produce new polymorphs147 The
knowledge of the crystal energy landscape can help avert problems in pharmaceutical
industries during the manufacturing process and guide the experimentalist search for
undiscovered structure In fact the study of the crystal energy landscape in Chapter 4
helped my colleague to discover a new polymorph (section 438) A way of testing
methodologies developed for predicting crystal structures is through lsquoblind testsrsquo
286 The Blind Tests The early lack of progress in CSP was termed a lsquocontinuing scandalrsquo in Nature in 1988
by John Maddox148 In response the Cambridge Crystallographic Data Centre (CCDC)
organised five lsquoblind testsrsquo10116667149 of organic CSP with the first lsquoblind testrsquo held in
29 Crystal Structure Comparison
59
1999 The blind test provided many researchers the opportunity to test their CSP methods
The fourth blind test results showed a dramatic improvement in the rates of success over
previous blind tests with one group (GRACE) correctly predicting four crystal structures
as their first ranked choice albeit at a considerable computational expense10
In the fifth blind test our research group successfully predicted the crystal structure of
molecule XX1117 which has eight flexible degrees of freedom (internal degrees of
freedom) using CrystalPredictor and CrystalOptimizer algorithms I use a similar
approach in Chapters 3 and 4 The fifth blind test showed that methodologies such as
DFT-D could reliably predict the structures of small organic molecules but GRACE was
unsuccessful for molecule XX11 CCDC released the sixth lsquoblind testrsquo molecules in mid-
September 201415 too late for me to take part By chance an informal lsquoblind testrsquo
challenge did arise during the second year of my research which is the focus of Chapter
3
29 Crystal Structure Comparison Collins et al150 argued that one of the problems modern scientists face is the issue of
structural similarity and difference They noted ldquocriteria for deciding when two crystal
structures are the same is an issue that divides many structural analystsrdquo Indeed this
problem of determining how similar or different two or more crystal structures are was
what inspired researchers to create methods for comparing crystal structures that exist
today The visual inspection of similarities and differences between crystal structures
does have its benefits but the method is slow and susceptible to human bias Thus
researchers need a practical computational method that enables them to identify identical
or similar structures
Identifying the similarities among crystal structures is important when deciding
whether a newly discovered structure is the same as an existing structure151 Sometimes
there is also a need to determine similarities when comparing many structures that are
related as in the case of 50 structures of carbamazepine (CBZ)150 Another reason for
identifying similarities lies in the field of CSP67152 where thousands of hypothetical
structures are generated and many structures converge to the same or approximately the
same structure during lattice optimization Therefore the removal of duplicates and the
production of unique lists of crystal structures are essential
The Mercury153 material module which has COMPACK151 embedded in it allows
graphical representation of the similarity among the polymorphs while standalone
COMPACK scripts can compare hundreds of thousands of crystal structures There are
29 Crystal Structure Comparison
60
three main tools in the material module153 motif search crystal packing feature and
crystal packing similarity tools The crystal packing similarity tool calculates the level of
packing similarities between crystal structures that have the same or similar compound
COMPACK computes these calculations by analysing the geometry of the cluster of
molecules There are two basic steps in comparing two crystal structures using
COMPACK The first step renders the chemical search query subject to several geometric
constraints using the reference molecular structure The second step is the structure
similarity search which involves searching the 3-D coordinates of a target for an
arrangement that matches the query to within specified tolerances The search is
performed by 3DSEARCH154 which is an efficient general search algorithm designed to
find chemical queries within 3D crystal structures information Once 3DSEARCH finds
a match the two structures can be superimposed to obtain a visual impression of their
similarity
The default values for a cluster size of 15 molecules a distance tolerance of 20 and
angle tolerance of 20 are usually used The default cluster size is 15 because the same
clustering results of 30 molecules instead of the default 15 molecules for 1000 predicted
structures of 2-amino-3-nitropyridine led Chisholm and Motherwell151 to the conclusion
that a cluster of 15 molecules is a sufficient size for identifying the same crystal structure
Other methods of comparing crystal structures do exist For example XPac155156
identifies similar sub-components of complete crystal structures of 0- 1- or 2-D in
polymorphs or crystal structures of similar molecules as well as of 3-D in isostructural
assemblies Hirshfeld surface (a way of exploring packing modes157) and fingerprint plots
(a visual representation of all intermolecular interactions simultaneously158) are examples
of Hirshfeld-based methods150159160 of analysing similarities The graphndashset analysis for
H-bonds compares and contrasts sets of molecules161-163 and is based on graph theory for
categorising H-bond motifs Moments of inertia tensors is a technique for comparing
crystal packing based on moments of inertia tensors irrespective of chemical connectivity
and hence the comparison of compounds of diverse chemical composition is possible164
Simulated powder X-ray diffraction165 is another example of comparing crystal
structures In short the comparison of compounds of diverse chemical composition is
possible
COMPACKrsquos ability to give just one number (the distance between matched atoms in
a cluster-root-mean-square-deviation) that shows the relationship between two structures
makes this similarity tool one of the simplest and most effective ways of quantitatively
29 Crystal Structure Comparison
61
rationalising similarity This is why COMPACK will be the primary choice for comparing
crystal structures in this thesis
31 Introduction
62
Chapter 3 An Informal Blind Test A Crystal Structure Prediction of
1-Benzyl-1H-tetrazole
ldquoOne of the continuing scandals in the physical sciences is that it remains in general
impossible to predict the structure of even the simplest crystalline solids from a
knowledge of their chemical compositionrdquo
mdash John Maddox Nature (1988)
31 Introduction
311 Background This chapter reports an informal lsquoblind testrsquo of flexible 1-benzyl-1H-tetrazole BT
(Figure 31) using similar CSP methodology that successfully predicted the very flexible
molecule XX in the fifth blind test1117 In essence I will test the viability of the CSP
method (sections 11 and 28) which has evolved over the years from predicting the
crystal structures of rigid molecules166-168 to molecules that are so flexible that their
conformational flexibilities are accounted for at the start of CSP1117
9
10
1
8
7
2
11
123
65
4
2
1
Figure 31 The chemical diagram of BT determined from the crystal structure Torsion
angles 1=C7-C6-N1-C5 and 2 = C12-C7-C6-N1
In the previous chapters I mentioned that the emergence of a new polymorph of
ritonavir two years after market lunch (section 11) as well as John Maddoxrsquos148
ldquocontinuing scandalrdquo remark in 1988 (section 286) were the catalysts of the lsquoblind testrsquo
challenge organised by the Cambridge Crystallographic Data Centre (CCDC) in 1999
These lsquoblind testsrsquo provided researchers all over the world an opportunity to test their
CSP methods But unfortunately the CCDCndashndashmy industrial sponsorndashndashdid not organise
any lsquoblind testsrsquo during the course of the research reported in this thesis15 By chance my
colleague Rex Palmer observed an unusual packing of BT crystal structures and
subsequently issued me a lsquoblind testrsquo challenge This challenge was to predict the crystal
structure of BT given just the chemical diagram (Figure 31) and given that Z´=1
31 Introduction
63
The drug discovery literature frequently mentions the motifs of 5-substituted 1H-
tetrazole as bioisosteres for the carboxylic acid group169-171 due to the motifsrsquo similar pKa
values shapes and steric interactions Bioisosteres are structural moieties with broadly
similar shapes and functions For pharmaceutical industries the ability to model the
interactions of tetrazoles including BT is of great interest due to tetrazolersquos bioisosteres
feature
312 Experimental Determination of 1-Benzyl-1H-Tetrazole My collaborators (John Spencer Hiren Patel John J Deadman Rex Palmer Louise
Male and Simon J Coles) carried out the following experiments (their findings in
sections 313 and 314 were not made available to me until the end of the lsquoblind testrsquo
ie the submission of my candidate structures)
Synthesis and X-Ray Crystallography
John J Deadman synthesized BT on a ca 50 mmol scale from benzylamine sodium
azide and triethyl formate Hiren Patel under the supervision of John Spencer grew the
single crystals of BT from dichloromethanendashhexane
Louise Male and Simon J Coles collected the X-ray data and did the preliminary
analysis A colourless crystal fragment of dimensions 009 003 002 mm3 was
mounted on a glass fibre and flash-frozen to 120 K The X-ray data were collected on a
Bruker diffractometer using Mo K radiation The crystal structure was solved by direct
methods SHELXL-97172-174 was used to refine the crystal structure
313 Molecular Geometry of the Experimental Structure My collaborators discovered that BT crystallised in the monoclinic space group P21
with unit cell dimensions a = 76843(5) b = 55794(4) c = 94459(7) Aring = 100949(4)
deg V = 39761(5) Aring3 Z´= 1 and density = 1338 g cm-3 Overall the benzyl and tetrazole
rings were essentially planar including the H atom on the CH group (see C5 in Figure
31) belonging to the 5-membered tetrazole ring The individual rings were also co-planar
with the inter-ring link C6 atom (Figure 31) The N-N bonds (see bond lengths in Table
31) were of three different types consistent with Figure 31 N1-N2 = 1343(2) Aring N2-N3
= 1301(2) Aring is longer than a typical N = N bond175 but shorter than a typical aromatic
bond N3-N4 = 1368(2) Aring was also largely aromatic in character175 The two C-N bonds
have different characteristics C5-N4 = 1314(2) Aring was a double bond C5-N1 = 1336(2)
Aring was typically aromatic175 The phenyl rings of BT have a normal geometry with
average CndashC bond length of 1386(4) Aring average bond angle of 1200(7) and ring
planarity root mean square (rms) deviation of 00057 Aring The bond angles in the tetrazole
31 Introduction
64
ring have an average of 1080(17) which is consistent with the planarity of the ring
having an rms deviation of 0012 Aring including the link C atom and H5 on C5 These bond
lengths and angle measurements are similar to those of 5-azido-1H-tetrazole176
Table 31 Angles and bond lengths of the tetrazole ring in BT No information about the
bonds or angles were given to me prior to submission of the candidate structures
Angles X-ray
deg Bond lengths X-ray
Aring
N1-N2-N3 1069(2) N1-N2 1343(2)
N2-N3-N4 1102(2) N2-N3 1301(2)
N3-N4-C5 1052(2) N3-N4 1368(2)
N4-C5-N1 1096(2) N4-C5 1314(2)
C5-N1-N2 1080 (2) C5-N1 1336(2)
C5-N1-C6 1305(2) N2-C1 1472(2)
N2-C1-C6 1215(2)
314 Crystal Packing Weak Hydrogen Bonding Rex Palmer noticed that the mode in which the molecules in the experimental crystal
structure BT were packed was unusual He noted that a molecule such as BT based on
linked delocalized rings might be expected to form crystal structures involving ∙∙∙
bonding (ring stacking) However no such interactions occurred in the experimental
structure (Figure 32) Instead the structure was held together by a large number of weak
intermolecular contacts177178 12 of these were of the CH∙∙∙N interaction and 3 were of
the weaker CH∙∙∙C interaction which involve atoms in the phenyl ring This unusual
packing resulted in a structure composed of infinite S-shaped layers and produced a
sequence of benzyl and tetrazole layers (Figure 33) Another unexpected feature of the
packing was the formation of tetrazole clusters (Figure 32a) each having a central
tetrazole ring coordinated by six other tetrazoles
Figure 32 The crystal structure of BT (a) Partial view of the crystal packing showing
close CH∙∙∙N contacts between a central tetrazole and six surrounding tetrazoles (b)
Partial view showing CH∙∙∙N CH∙∙∙C and CH∙∙∙ contacts
(a) (b)
31 Introduction
65
Figure 33 BT crystal structure (a) View of the infinite S-shaped layers held together by
weak CH∙∙∙N and CH∙∙∙C H-bonds (b) Partial view of the layer structure showing
alternative B(benzyl) and T(tetrazole) layers and the repeating layer sequence [BTBT |
TBTB]
315 Overview of the Challenge After my experimental collaborators grew single crystals of BT from a non-polar
solvent mixture and determined the crystal structure at 120 K I was issued a lsquoblind testrsquo
challenge by Rex Palmer to predict the crystal structure of BT because of the unusual
mode of crystal packing (section 314) No experimental information was given prior to
the submission of the candidate structures The subsequent part of this chapter presents
the computational work I carried out independently upon receiving the chemical diagram
of BT (Figure 31)
This chapter uses CSP methodology (section 322) to predict the crystal structure of a
molecule that can adopt a wide range of molecular shapes due to the conformational
flexibility of the molecule Consequently the conformational flexibility must be
accounted for at the start of CSP (CrystalPredictor 16 section 281) In addition this
method relies on the systematic improvement of the evaluation of the lattice energy Elatt
where Uinter and Eintra are the intermolecular and intramolecular contributions X and
vector θ denote intermolecular and intramolecular degrees These systematic
improvements increase the computing time As a result it is essential to reduce the
number of crystal structures that will be examined as the confidence in the lattice energy
ranking improves in each step
This chapter will also test the transferability of the intermolecular energy potential to
BT since this molecule contains a functional group that differs from those used in
determining the parameters of the intermolecular potentials (section 23)3839
Elatt = Uinter(X θ) + ΔEintra(θ)
31
(b) (a)
32 Computational Methodology
66
To determine whether this study is a success the predicted structures of BT will be
compared with the experimental crystal structures using a similarity tool In addition I
will compare and contrast the most stable generated structures of BT with the similar
tetrazole fragment structures to determine whether the packing of the experimental
structure of BT was unusual In this chapter I will show that the crystal structure of BT
can be successfully predicted starting from just the chemical diagram (Figure 31)
32 Computational Methodology
321 Conformational Analysis To restrict the search space of BT to energetically meaningful regions I carried out
quantum mechanical (MP26-31G(dp) single-point calculations on HF6-31G(dp)
optimised geometries) scans of the two flexible torsions 1 and 2 (Figure 31) using the
GAMESS179 program
322 Crystal Structure Prediction Step 1 The search was carried out using the CrystalPredictor126 program which
covered the 59 most commonly occurring space groups The lattice energy was minimised
by varying the cell parameters and torsion angles 1 and 2 within energetically
meaningful regions (section 321) At this stage the lattice energies (equation 31) were
crudely estimated and then using the grid of the ab initio results from section 321 the
ΔEintra contribution were interpolated The intermolecular electrostatic interactions were
modelled using the atomic charges derived from section 321 All other intermolecular
energy terms were derived from an empirical exp-6 potential FIT40 Approximately a
quarter of a million lattice energy minimisations were performed This produced
approximately 170000 distinct structures of which 44000 structures were unique These
generated structures were labelled by their energy ordering The result of step 1 is the
CrystalPredictor energy landscape
Step 2 Next the lattice energy model was improved For each of the lowest 10000
crystal structures the energy of the isolated molecule and its charge distribution were
calculated at the PBE06-31G(dp) level of theory using GAUSSIAN0353 This
calculation provided a better estimate of ΔEintra and a more accurate representation of the
charge density in terms of a distributed multipole model51 These two contributions were
then combined with an atomndashatom exp-6 repulsion-dispersion potential using parameters
that had been fitted to azahydrocarbons39 and polar crystal structures40 which were
assumed to be transferable to this tetrazole At this stage the lattice energy was
minimised with the molecule held rigid using DMACRYS34
33 Results and Discussion
67
Step 3 Approximately 100 of the most stable structures were then further refined at
the PBE06-31+G(d) level of theory by allowing the molecular conformation to adjust
more accurately to the intermolecular forces using the program CrystalOptimizer7172
(section 282) This algorithm allowed the intermolecular and intramolecular energy to
be minimised simultaneously The CrystalOptimizer program uses the Quasi-Newton
algorithm coupled with a line search to solve the minimisation program It also makes use
of GAUSSIAN0353 calculations on the molecular conformations and DMACRYS34
optimisations of the crystal structure
Step 4 The effect of the crystal environment on the conformational energies ΔEintra and
charge densities was estimated by calculating the conformational energy and charge
distribution in a Polarizable Continuum Model (PCM)180 with =3 a value typical of
organic molecules131 This calculation was implemented in GAUSSIAN0353 at the
PBE06-31+G(d) level of theory The result of step 4 is the PCM crystal energy landscape
33 Results and Discussion
331 Conformational Energy Grid
Figure 34 The conformational energy grid used in the search Relative intramolecular
energies ΔEintra (kJ mol-1) for isolated molecule calculations at the MP26-31G(d p)
level of theory
Prior to the generation of hypothetical structures it was necessary to investigate the
possible steric hindrances to rotation about the two flexible torsion angles 1 and 2
(Figure 31) The result shown in Figure 34 indicates a high degree of flexibility in the
molecule The purple colours represent regions with the smallest energy penalty ie the
33 Results and Discussion
68
most stable conformations This high degree of flexibility makes possible a wide range
of crystal structures with different molecular shapes For this reason the generation stage
(step 1 of sections 322 and 332) incorporates conformational flexibility from the start
332 The CrystalPredictor Energy Landscape The analyses presented here are post-process ie after submitting the ten most likely
crystal structures on the PCM (final) energy landscape (step 4 section 333) The energy
landscape after step 1 (CrystalPredictor) is displayed in Figure 35 This step estimated
the lattice energies Elatt very crudely by interpolating the atomic charges and
intramolecular energies (Figure 34) Yet the generated structure that matched the
experimental structure of BT at this stage was only ranked 23rd This structure BT_23
which is highlighted in red on Figure 35 has only a 3 kJ mol-1 energy difference in
comparison with the global minimum structure
Figure 35 The CrystalPredictor energy landscape of BT generated with a crude lattice
energy model The generated structure that matched the experimental structure is
highlighted in the open red symbol
333 The CrystalOptimizer and PCM Energy Landscapes The two most stable crystal structures on the PCM energy landscape (Figure 36b) have
similar lattice energy less than 01 kJ mol-1 The lsquoblind testrsquo was deemed a success
because the experimental structure matched the second most stable crystal structure
2BT_23 on the PCM energy landscape (Figure 36b and Table 32) This PCM energy
landscape was generated after CrystalPredictor (step 1 Figure 35) lattice energy
refinement (step 2) CrystalOptimizer (step 3 Figure 36a) and PCM calculations (step
33 Results and Discussion
69
4 Figure 36b) Compared to the first step (step 1 Figure 35) the lattice energy rank of
the experimental structure improved significantly from 23rd to 2nd
Figure 36 (a) The CrystalOptimizer (step 3) and (b) PCM (step 4) energy landscape of
BT GM is the global energy minimum The open red symbol represents a match between
the experimental crystal structure and the generated structure The energy ranking of the
crystal structure that matches the experimental has improved from fourth most stable 4
to second most stable 2
(a)
(b)
33 Results and Discussion
70
I submitted a list of 10 structures in which the 2BT_23 structure was selected as the
first choice while the global minimum (labelled GM on Figure 36b) was selected as the
second choice181 The main reason for selecting 2BT_23 as the first choice was the
notable improvement of energy rank from fourth (Figure 36a step 3) to second (Figure
36b step 4) In addition the two most stable crystal structures on the PCM energy
landscape (Figure 36b step 4) were only 01 kJ mol-1 apart
Table 32 Summary of experimental (highlighted in blue) and computed crystal
structures on the PCM energy landscape (Figure 36) The computed structure that
matched the experimental structure (section 312) is highlighted in bold For label
xBT_y x and y are energy ranked after steps 4 and 1 of CSP respectively (section 322)
Label Space Group
a b c
Aring
β
deg
ρ
g cm-3
Uinter ΔEintra Elatt
kJ mol-1
1BT_120 P21c 999 817 1104 11750 133 -12176 225 -11952
2BT_23 P21 793 555 944 10132 131 -12152 208 -11944
Experiment P21 768 558 945 10095 134 - - -
3BT_165 P21c 1086 554 1597 12141 130 -12109 270 -11839
4BT_335 P212121 938 1581 556 9000 129 -12032 200 -11833
5BT_767 P21c 941 553 1580 10234 132 -12044 214 -11830
6BT_167 P21 568 839 881 10322 130 -12289 504 -11785
7BT_912 P21 557 869 861 10365 132 -11882 143 -11739
8BT_34 P21c 809 553 1859 10166 131 -11919 219 -11700
9BT_491 Pna21 1666 566 858 9000 131 -12299 626 -11673
10BT_250 P212121 1904 557 778 9000 129 -11916 325 -11591
11BT_55 P21c 1080 556 1582 12232 132 -11979 396 -11583
12BT_490 P21c 653 866 1394 9428 135 -12098 521 -11577
13BT_178 P212121 833 561 1764 9000 129 -11789 232 -11557
334 Did the Predicted Structure Really Match the Experimental Rex Palmer provided the cif file of the experimental structure once ten of the most
stable structures on the PCM landscape were submitted (Figure 36b) Then I compared
the experimental structure with the submitted crystal structures using COMPACK151 The
computed 2BT_23 structure my first choice (section 333) gave an excellent overlay
with 15 molecules of the experimental structure with a root mean square difference
RMSD value of only 0148 Aring (Figure 37) This computed 2BT_23 structure has similar
unit cell dimensions (Table 32) and is in the same space group P21 as the experimental
structure
33 Results and Discussion
71
Figure 37 The 15-molecule overlay between the experimental (atomic colours) and the
second most stable computed structure 2BT_23 (green) The direction of the view
obscures some of the molecules
In addition to excellent RMSD15 overlay the 2BT_23-generated structure provided a
starting model that was easily refined in SHELXL-97 which was further proof that the
structure was a genuine reproduction of the experimental crystal structure (section 312)
Hence it is clear that the CSP method outlined in this chapter which uses only the
chemical diagram as prior information can successfully predict the crystal structure of a
flexible molecule
335 The Global Minimum Structure on the PCM Energy Landscape The global minimum GM structure labelled 1BT_120 on the PCM energy landscape
(Figure 36) was very different from the experimental crystal structure as only two
molecules overlaid (Figure 38) during similarity calculations From the overlay of the
similarity calculations (Figure 38) it is clear that the GM and the experimental structure
have different conformations The GM structure 1BT_120 (Table 32) is in space group
P21c and has a very different spatial arrangement (as shown in Figure 39) when
compared to the experimental structure (Figure 32 and Figure 33) This structure also
has dominant weak H-bonds 8 CH∙∙∙N and 1 CH∙∙∙C interactions There was also one
weak ∙∙∙ benzyl∙∙∙benzyl interaction (Figure 39)
The similar lattice energy values of the two most stable structures generated (Figure
36b) suggest that the GM structure could a polymorph This GM structure could be
33 Results and Discussion
72
synthesised at high pressure because it is the denser of the two most stable structures
Also growing the experimental structure using a non-polar solvent (section 312) may
have prevented H-bonding formation
After the generation step (CrystalPredictor) the initial rank of the most stable crystal
structure after step 4 GM was 120th The eventual rank was first despite the fact that
only about 100 structures were optimised this shows the importance of the novel
intermediate step 2 in the CSP method After the CrystalPredictor step 1 the GM
structure was 9 kJ mol-1 less stable than the experimental 2BT_23 structure and had
distinctly fewer close contacts than the experimental 2BT_23 structure Therefore the
rearrangement of lattice energy depends on the method used
Figure 38 Crystal Packing Similarity between experimental (grey) and the most stable
predicted structure (1BT_120 green) with only 2 molecules matching (RMSD2 = 1072
Aring)
Figure 39 The structure corresponding to the global minimum in lattice energy
(1BT_120) showing the dominant weak H-bonds (Aring) eight of type CH∙∙∙N and one
CH∙∙∙C and the weak ∙∙∙ interaction (benzylmiddotmiddotmiddotbenzyl)
33 Results and Discussion
73
336 Post Analysis Comparison of Structure with CSD The motivation for the lsquoblind testrsquo challenge was the unusual packing of the
experimental structure Thus a database containing over half-million crystal structures
was searched in an effort to investigate the breadth of variation in the packing of the
experimental structures of BT A Cambridge Structural Database (CSD)182 survey was
carried out to compare BT with other 1-substituted 1H-tetrazole crystal structures (Figure
310) The CSD version 533 March 2012 was searched for fragments defined in Figure
310 The bond lengths bond angles and torsion were analysed and compared with the
experimental structure using histogram plots
1
6
23
5
4
Figure 310 Query used in Conquest to search the CSD for similar fragments
The query of the CSD yielded 34 structures including two redeterminations The
refcodes of these 32 structures were ACIROU ACIRUA BEGRIP CAZWIK
DOKQEA DOKQIE EKAJOQ HISYEO IQUJEK ABMIL LUVPIC MEVWOZ
MUKMAG PHTETZ01 PUGLUZ QALNOH QALNUN QALPAV QALPID
QALPOJ QALPUP QALQAW QALQEA01 QALQIE QEBPUI01 REVMOV
REZNUG RIZXEE SOLHAD TIJLIH VUNNUO and OBAREQ
The experimental bond lengths were typical of those in the other crystal structures
containing the 1-substituted 1H-tetrazole group (Figure 311) Some significant
differences ( 002 Aring) were observed between the ab initio computed values and the
experimental bond lengths but both were within the observed ranges The variations in
tetrazole bond angles (Figure 312) were consistent with the bond length variations for
this moiety176 which was always close to planar The external torsions angles ξ1 and ξ2
exhibited a wide range of values (Figure 312) a result that was consistent with the large
range of low-energy conformations (Figure 34) despite the range of functional groups
bonded to C6
No tetrazole clusters were observed for the 32 1-substituted 1H-tetrazole structures
found in the CSD There were however some tetrazole layers in 1BT_120 and the
33 Results and Discussion
74
experimental structures DOKQIE EKAJOQ QALPAV QALPOJ QALPUP and
REVMOV All 32 structures had the tetrazole bonded to a sp3 carbon and were tetrazole
hydrocarbons (except QALPAV which also contained an iodine atom) Hence there was
no strong driving force for the tetrazole cluster Still a layer structure seemed to be quite
favourable in cases where there were no competing strong interactions There were more
similarities between the CSD tetrazole structures and the GM structure than there were
between the experimental structures This finding suggests that the use of informatics of
CSD in CSP such as Desirajursquos supramolecular synthon approach183 would weight the
global minimum structure more than the experimental structure
Figure 311 Histograms showing the bond length distributions of 32 1-susbtituted 1H-
tetrazole rings in the CSD The red square denotes the experimental bond lengths in BT
while the black square denotes the ab initio bond lengths in the corresponding calculated
structure 2BT_23
33 Results and Discussion
75
Figure 312 Histograms showing the distributions of the torsions and angles of the 32-
tetrazole rings found during the CSD survey The experimental bond length in BT is
denoted by the red square while the ab initio bond length in the corresponding calculated
structure 2BT_23 is denoted by the black square
34 Summary
76
34 Summary I successful predicted the unusual crystal packing of BT given just the chemical
diagram and the Z´ number The packing was predicted by using a model that accurately
determines the electrostatic forces arising from molecular charge density including the
anisotropic forces from the lone pair and electrons but otherwise was not tailored to
the tetrazole∙∙∙tetrazole interactions Thus the intermolecular energy potential is
transferable to BT crystal structure even though the functional group used in determining
the parameters of the intermolecular potentials did not include a single tetrazole molecule
The successful prediction of the experimental structure as one of the two distinct most
stable structures shows that the unusual layers do present an optimal compromise between
the many different weak hydrogen bonds and other intermolecular interactions The most
stable crystal structure GM could well have been an undiscovered polymorph In fact
informatics weighting may have selected this structure Thus this study shows the
potential value of CSP for generating unexpected structures
This study also showed that the level of computational chemistry modelling that was
used is suitable for modelling the molecular recognition of this functional group This
level of modelling could become increasingly useful in pharmaceutical design due to
tetrazolesrsquo bioisosteres properties In the next chapter more will demanded of CSP Will
this method deliver
41 Introduction
77
Chapter 4 Is the fenamate group a polymorphophore Contrasting the
crystal energy landscapes of fenamic and tolfenamic acids
ldquoIts the little details that are vital Little things make big things happenrdquo
mdash John Wooden
41 Introduction This chapter builds on Chapter 3rsquos description of a procedure that successfully
predicted the experimental crystal structure of a flexible molecule in order to address two
specific questions First in a given molecular structure is the presence of a
polymorphophore (section 11) substructure sufficient to ensure polymorphism Second
what role do substituents play in determining the range of polymorphs that are present in
a molecule
In this investigation of the concept of polymorphophore I will use CSP to contrast the
crystal energy landscapes of two fenamates (Figure 13) monomorphic fenamic acid (2-
(phenylamino)-benzoic acid FA) and one of its highly polymorphic derivatives
tolfenamic acid (2-[(3-chloro-2-methylphenyl)amino]-benzoic acid TA) TA is a good
test case for this investigation into whether the fenamate group is a polymorphophore
because at the start of this study TA had five known polymorphs19
The term ldquofenamaterdquo can refer to a range of molecules that vary widely in molecular
structure including niflumic acid which contains an aromatic nitrogen Although some
researchers who have conducted thermodynamic and structural investigations of
fenamate molecular crystals have included an extraordinarily wide range of molecules
even dichlofenac184 the present study is restricted to the fenamates shown in Figure 13
Essentially I will focus on cases where the dominant interactions that determine the
crystal or drug binding are inherent in the proposed polymorphophore families of fenamic
acid (Figure 13)
41 Introduction
78
ROY fragment
WIFHUP 2185
R=H
ROY
QAXMEH 7(3)20
R2=CH3
OGIDEN 3186
R2=R5=CH3
Fenamate fragment
Fenamic acid (FA)
QQQBTY 1187
R=H
Tolfenamic acid (TA)
KAXXAI 519
R1=CH3 R2=Cl
Flufenamic acid (FFA)
FPAMCA
2(1)22
8(1)18 in 2012
R2=CF3
PEFMET 1188
R1=CH3
PEFNAQ 1188
R2=CH3
SURMEY 1187
R3=CH3
Mefenamic acid
XYANAC 2(1)189190
R1=R2=CH3
SURMOI 1187
R2=R4=CH3
LAHLOW 1191
R1=R5=CH3
Figure 41 The polymorphophore families of ROY and fenamic acid The numbers of
polymorphs in the Cambridge Structural Database (CSD) follow the refcodes for each
specific molecule and (x) denotes the number of additional polymorphs that whose
crystal structures were not available The lowest two rows are fenamates whose structures
are used in Table 46
41 Introduction
79
411 Polymorphism and Polymorphophores Polymorphism (section 11) the occurrence of multiple crystal structures with the same
chemical content is now known to be a widespread phenomenon among organic
molecules192 and is of great importance in the industrial manufacture of specialty
chemicals and pharmaceutical products Relatively few systems have several polymorphs
whose crystal structures and relative stabilities have been determined the most
thoroughly investigated20 being the polymorphs of 2-[(2-nitrophenyl)amino]-3-
thiophenecarbonitrile commonly known as ROY (Figure 13) after the red orange and
yellow colour spectrum of the first six polymorphs to be reported193 Some families of
related molecules23194 such as the sulphonamides194 ROY derivatives23 barbiturates195
carbamazepine derivatives147196 and fenamates19 appear to have a strong tendency
toward polymorphism This fact has given rise to the study of a polymorphophore1923196
a term coined by Matzger23 that refers to a structural element that when incorporated into
a molecule favours the formation of polymorphic crystal forms Hence
polymorphophore is a descriptive term and not a quantifiable hypothesis
The focus of this chapter is the polymorphophore concept Some families of molecules
contain a common substructure (the polymorphophore) wherein many members but not
necessarily all exhibit polymorphism For example removing or adding a methyl group
to ROY creates molecules (Figure 13) that are also polymorphic indicating that ROY is
a polymorphophore (Figure 13) However the number of related molecules is limited
probably because ROY is only a precursor in the synthesis of the blockbuster drug
olanzapine Studying polymorphophores is like studying pharmacophores a particularly
promising way of finding new leads in drug discovery especially in cases when a
receptorrsquos 3D structure is unknown197
This chapter considers the fenamates that conserve the H-bonding groups and dominant
molecular shapes by having small non-polar substituent groups for the aromatic protons
as exemplified in Figure 13 These types of substituent(s) might be expected to have
minimal effects on the strongest intermolecular interactions and hence on either crystal
packing or drug receptor binding The fenamates contain a proposed
polymorphophore1819 that is related to that of ROY (Figure 13) in having a phenyl group
attached via an N-H group to a further aromatic ring
412 Conformations in known Crystal Structures The overlay of the conformers of FA and TA in the experimental crystal structures
(Figure 42) confirms that the main variation in conformation is the ξ1 torsion angle The
41 Introduction
80
two most stable polymorphs of TA forms I and II (blue and red in Figure 42) have the
greatest difference in ξ1 The benzoic acid ring and the N-H groups are coplanar with the
ξ2 torsion angle being approximately zero concordant with the intramolecular H-bond
Figure 42 Overlay of the experimental conformers of FA (top) and TA (bottom) viewed
with the overlaid benzoic acid fragment arranged horizontal FA QQQBTY02 (Z´=2
light blue and magenta) TA KAXXAI01 (Form I Z´=1 blue) KAXXAI (Form II Z´=1
red) KAXXAI02 (Form III Z´=2 green and purple) KAXXAI03 (Form IV Z´=3
yellow brown (obscured by yellow) and black) and KAXXAI04 (Form V Z´=1
disordered on both sites (section 415) violet and grey) The arrows point to the main
variation (ξ1) between the conformers of FA and TA in the experimental crystal
structures
413 Experimental Data of FA and TA FA has just one known form187 which has two molecules in its asymmetric unit Z FA
serves as a parent structure for several fenamates including TA TA is a non-steroidal
anti-inflammatory drug used for the treatment of rheumatic conditions198 At the start of
this study TA had at least five polymorphs forms I-V19199 It currently has six
polymorphs (see section 438) Unlike ROY the polymorphs of TA vary in the number
ξ1
ξ1
41 Introduction
81
of molecules in the asymmetric unit Z´ (Table 41) The variation in colour that is
observed between form I (colourless) and II (yellow) is due to the conformational
difference as observed for ROY2023 There were three undisputedly metastable
polymorphs including form V whose disorder is analysed further in section 415
Here it is necessary to discuss further the relative stability of forms I and II (Table 41)
The enthalpy and temperature of fusionHfus and Tfus measurements provide a way of
classifying polymorphs as either being monotropic or enantiotropic Four different
papers19199-201 have presented evidence for the thermodynamic relationship between
forms I and II but each paper gives slightly different conclusions Surov et al showed
that the yellow form (form II) is more stable than the white form (form I)201 and that these
polymorphs have a monotropic relationship because the form with the higher melting
temperature form II has a higher enthalpy of fusion Hfus (by the enthalpy of fusion
rule)202 as illustrated in Figure 43(a) However Mattei and Li200 measured an
endothermic transformation going from II to I with temperature increasing to 1418 degC
with a Differential Scanning Calorimetry (DSC) implying that forms I and II have an
enantiotropic relationship as shown in Figure 43(b) The observed transformation from
form II to I in a slurry experiment indicated that the thermodynamic transition point was
below room temperature All three sets of measurements199-201 that were extrapolated to
0 K had form II more stable than form I
Table 41 The experimental data of the known forms of FA and TA Crystal structures
and Hfus values were taken from ref [19] unless otherwise specified aThe most widely
varying torsion angle ξ1 is defined in Figure 49 bTemperature of crystal structure
determination cMelting temperature
REFCODE (form)
Space Group
Z´ ξ1a
deg Tb
K
Hfus
kJ mol-1
Tmc
K
FA QQQBTY02 P-1 2 4721 7045 283-303187 - - TA KAXXAI01(I) P21c 1 10774 3937 48625-4886
110 4250 48405199
410plusmn05 48418plusmn02201
4127 48585200
KAXXAI(II) P21n 1 4223 387 48667
110 4840 48765199 490plusmn05 48578plusmn02201
4240 41495200
KAXXAI02 (III) P21c 2 4419 5764 85 - KAXXAI03 (IV) P-1 3 673457584784 85 3188 KAXXAI04 (V) P-1 1 5562 85 -
41 Introduction
82
Figure 43 Temperature dependence of the enthalpy (H) and free energy (G) diagrams
for forms I and II of TA showing a monotropic (top) relationship from data from
Surov201 which are qualitatively the same as data from Andersen199 and an enantiotropic
(bottom) relationship from data from Mattei and Li200
Lopez-Mejias et al19 provided the only thermodynamic data available for forms IIIndashV
The researchers noted that heating forms III and V at 80degC caused a transformation to
form I within a period of minutes to hours In solution forms III IV and V transformed
to form I or a mixture of form I and II Hence forms III IV and V were shown to be
metastable polymorphs The heats of fusion given in Lopez-Mejiasrsquo supplementary
information19 were listed by the initial form and forms III and V may well have
transformed to form I rather than form II Therefore these sets of data were inconclusive
as to the relationship between forms I and II
(a)
(b)
41 Introduction
83
414 Similarities between the known forms of FA and TA The known polymorphs of TA and FA showed some similarities (Table 42) as all were
based on the H-bonded dimer (Figure 44a) The graph-set analysis161162 for the (two)
types of H-bonds are identical for all the crystal structures of TA and FA intermolecular
dimers with 2 donors 2 acceptors and 8 atoms in total (11987722(8)) and intramolecular with 1
donor 1 acceptor and 6 atoms in total (S(6))201
Form II had the most distinctive packing (Figure 44b) as well as conformation (Figure
42b) and was the only structure with a short contact involving the chlorine atom and the
aromatic ring The most striking result from Table 42 was the similarity between the
metastable forms III and IV where 11 molecules could be overlaid (Figure 44c) The
two independent molecules in form III had similar conformations to two of the three
independent molecules in form IV (compare the open circle and closed triangle symbols
in Figure 412a) The polymorphs had sufficiently similar simulated powder patterns to
have a PXRD similarity measure in the grey area between polymorphism and
redeterminations203 and for this reason they exemplify the challenges in defining
polymorphism204205
Table 42 Quantification of the similarities of FA and TA crystal structures showing the
packing similarity (RMSDn) and powder X-ray diffraction (PXRD) similarity206 The
bold numbers indicate the number of molecules n that match within distance and angle
tolerances of 20 and 20deg respectively with the RMSDn values in brackets See section
425
n(RMSDnAring)
FA TA(I) TA(II) TA(III) TA(IV)
FA - 6(066) 2(048) 3(074) 5(108)
TA(I) 078 - 1(087) 3(078) 3(107)
TA(II) 085 086 - 2(077) 2(074)
TA(III) 078 083 090 - 11(045)
TA(IV) 078 084 092 098 -
TA(V) 086 089 093 091 093
PXRD Similarity
41 Introduction
84
Figure 44 Features of the experimental crystal structures (a) The hydrogen-bonded
dimer motif found in all structures with variations in the phenyl ring orientations (ξ1)
The specific illustration shows the packing similarity between FA (QQQBTY02) and TA
form II (KAXXAI) (b) The unique packing of TA form II with short contacts between
chlorine and the aromatic ring (c) Crystal Packing Similarity between form III and form
IV of TA showing the 11-molecule overlay which includes only two dimers
415 Solving the Connectivity Problem of a Disordered Form The crystal structure of Form V of TA was solved with an R-factor of 658 the whole
molecule was equally disordered over two sites19 I found that separating the two
components of disorder gave the wrong connectivity between the C8 and N1 atoms (green
in Figure 45b) The C8-N1 bond length of 170 Aring was unusually long and this caused the
breakdown of the trigonal planar relationship of nitrogen C7-N1(H6)-C8 connectivity
(c)
(b) (a)
41 Introduction
85
(Figure 45c) A model with the two components both corresponding to the expected
molecular geometry can be made by redefining the connectivity (Figure 45b) to link half
of one disordered molecule (the bonded molecule in Figure 45a) with half of the other
disordered molecule (the atoms-only component in Figure 45a) The second component
was formed by combining the remaining halves The resulting molecules (red and blue in
Figure 45b) have the expected C-N bond length of 143 Aring and a trigonal planar geometry
around the nitrogen atom
The above procedure results in three ordered Z=2 crystal structures with the unit cell of
form V by using the two resulting molecules (Figure 46a b for Z´=1 and Figure 46c for
Z´=2)
Figure 45 (a) Crystal structure KAXXAI04 of form V of TA (b) The atom connectivity
of the two new components (colour red and blue) the original C-N connectivity is
labelled green (c) Chemical diagram showing the atomic connectivity of TA
9
1
1
2
10
1
813
14
7
164
21
1 53
2
(a)
(b)
(c)
41 Introduction
86
Figure 46 Ordered Z=2 crystal structures formed from the disordered components of TA
form V (a) Form V_a (b) Form V_b and (c) Form V_c
(a)
(b)
(c)
42 Computational Methods
87
416 Overview The focus of this chapter is the polymorphophore concept which I will investigate by
generating crystal energy landscapes (section 285) of FA and TA These crystal energy
landscapes are a valuable tool for examining the known forms of different molecules
because the same level of polymorph screening is rarely applied to entire families of
molecules This is likely the case for FA and TA since TA is a drug molecule while FA
is not In addition there were far more publications for TA than FA (see section 413)
For these reasons FA and TA provide a good test for the concept of polymorphophore
In this chapter the energy landscapes of FA and TA will be generated by first selecting
a suitable ab initio level of theory for the conformational energy of the isolated molecule
I will achieve this by performing ab initio scans at various levels of theory Then these
ab initio scans will be compared with histogram plots of crystal structures whose
fragments are similar to FA and TA The analysis of these scans and plots will guide the
methodology I will use to generate the hypothetical structures The final energy
landscapes of FA and TA will be generated by systematically increasing the accuracy of
evaluating the lattice energies while reducing the number of generated structures Finally
I will compare the crystal structures on the energy landscapes for FA and TA using a
similarity tool
I will show the conformational flexibility of fenamate fragments allows the potential
for a large number of structures and that it is the substituents that determine if a molecule
is polymorphic or not In other words polymorphophore promotes but does not guarantee
polymorphism Concisely CSP goes beyond the lsquoblind testrsquo described in Chapter 3
42 Computational Methods
421 Ab initio Conformational Profile of TA To test the effects of ab initio methods on the conformation profile of TA I compared
relaxed scans at various levels of theory of the main torsion ξ1 (Figure 49) with single-
point energy calculations at the MP26-31G(dp) level of theory The effect of rotating
the H-bonded torsion ξ2 (see Figure 49) was investigated by performing a relaxed scan
at the PBE06-31+G(dp) level of theory The results from these scans helped in selecting
the appropriate level of theory as well as the torsion that would be allowed to rotate during
the generation of hypothetical structures (step 1 section 423)
422 CSD Survey for Fenamates The relaxed conformational scans of the main torsion angle ξ1 (section 421) at the
PBE06-31+G(d) level of theory were complemented by a Conquest207 search of the
Cambridge Structural Database (CSD 208) for the crystal structures containing the
42 Computational Methods
88
molecular fragment shown in Figure 47 This comparison allowed us to see the variation
in ξ1 when there was an internal H-bond (ZmiddotmiddotmiddotH lt 26 Aring) that constrained part of the
molecule to planarity
dlt26Aring
Figure 47 Query fragment and the torsion angle ξ1 measured in the Conquest207 survey
of the CSD structures There were 131 organic structures where Y=H and 94 where Yne
H
423 Crystal Structure Prediction I calculated the crystal energy landscapes14 of FA and TA using a method209 that was
adapted from that used for the highly flexible molecule XX in the fifth blind test of CSP11
a method that called for an approximate conformational energy surface in the initial
search stage (see section 281) The final energy landscapes of FA and TA were generated
in four steps with the quality of the methods increasing and estimated the conformational
energy penalty Eintra and the intermolecular contribution Uinter to the lattice energy Elatt
Step 1 (Generation of hypothetical crystal structure) Crystal structures with Z´=1 were
generated in 15 common space groups P1 P-1 P21 P21c P21212 P212121 Pna21
Pca21 Pbca Pbcn C2c Cc C2 Pc and P2c using CrystalPredictor126 The grid was
used to extrapolate the atomic charges and intramolecular energy Eintra This grid was
pre-computed as a function of just ξ1 (Figure 48) using GAMESS179 at the MP26-
31G(dp) level of theory (single-point calculation) after the molecular geometries were
optimized at the HF6-31G(dp) level The intermolecular contributions to the lattice
energy were calculated crudely from the atomic charges and the Williams135 exp-6
repulsion-dispersion potential The CrystalPredictor program carried out 250000 lattice
energy minimizations This resulted in 162288 and 182615 distinct structures for TA
and FA respectively of which 16543 and 22884 were unique for TA and FA
respectively
Elatt = Uinter + Eintra = Uinter + Uelec + Eintra 41
42 Computational Methods
89
Figure 48 The fragment used in the CrystalPredictor search for TA Each fragment was
kept rigid during the search for hypothetical crystal structures
Step 2 (Accurate evaluation of the electrostatic contribution (Uelec)) Single-point ab
initio calculations were carried out on the conformation for each of the unique structures
from step 1 using GAUSSIAN0353 at the PBE06-31G(dp) level of theory to improve
the estimate of Eintra and provide the atomic multipoles by distributed multipole
analysis51 using GDMA The crystal structures were re-optimized using DMACRYS34
keeping the molecule rigid with the intermolecular energy Uinter calculated from the
distributed multipoles and the FIT parameterization38-40 of the exp-6 atomndashatom
repulsionndashdispersion potential
9
1
1
2
10
1
813
14
7
164
21
1 53
2
TA
Figure 49 The degrees of freedom optimized by CrystalOptimizer for crystal structures
of FA and TA (ξ1equiv C7-N1-C8-C9 ξ2equiv C2-C7-N1-C8 ξ3equiv O1-C1-C2-C7 ξ4equiv H1-O1-C1-C2
and ξ5equiv C8-C13-C14-H10 θ1equiv H6-N1-C8 θ2equiv H1-O1-C1)
Step 3 (Accurate evaluation of lattice energy (Elatt=Uinter and Eintra)) Approximately
100 of the most stable crystal structures from step 2 were re-minimized due to the limited
time constraints of submitting this study as my first year report Six and seven
conformational degrees of freedom for FA and TA respectively (Figure 49) were
allowed to change as was the crystal structure using CrystalOptimizer7172 and
calculating Eintra and the distributed multipoles at the PBE06-31+G(d) level of theory
for the isolated molecule
Step 4 (Modelling the effect of the crystalline environment) Finally I estimated the
effect of the crystal environment using a Polarizable Continuum Model (PCM)180 that I
42 Computational Methods
90
obtained by calculating the wavefunction of the molecular structure in a dielectric of ε=3
(typical of molecular organic crystals)131 as implemented in GAUSSIAN03 The crystal
structures were then re-minimized using the distributed multipoles calculated in the PCM
environment while keeping the molecule rigid the resulting Uinter was combined with the
Eintra to evaluate the lattice energies The CSP-generated crystal structures for FA were
labelled xFA_y where x was the final energy ordering and y the ordering after the
CrystalPredictor stage A comparison of x and y shows the extent of re-ranking by
increasing the accuracy of the lattice energy model
424 Experimental Crystal Structures with Z´ gt1 The complexity of the task of generating Z´gt1 crystal energy landscapes (steps 1-4) for
flexible molecules limited the search (section 423) to Z´=1 Analogous CrystalOptimizer
(step 3) and PCM calculations (step 4) were performed starting from all the experimental
crystal structures of TA and FA which included Z´gt1 structures FA form I and TA
forms III IV and V (section 415) This allowed comparison between Z´=1 generated
crystal structures and the experimental crystal structures of FA and TA
425 Comparison of Crystal Structures The experimental crystal structures the corresponding lattice energy minima and the
structures on the crystal energy landscapes were compared using the Crystal Packing
Similarity151 module (section 29) implemented in Mercury210 This crystal structure
similarity tool returns the highest number of molecules n (where n 15) that can be
overlaid between two different structures when all non-hydrogen atomndashatom distances
are within a 20 distance tolerance and angles are within 20 The calculated RMSDn is
the root mean square deviation of all non-hydrogen atom positions in the clusters of n
molecules The program allows for comparisons of crystal structures of different
molecules with the RMSDn being calculated from only the common non-hydrogen
atoms This Crystal Packing Similarity calculation determines the similarity in the
coordination environment of the two crystal structures rather than of the crystallographic
cell
43 Results
91
43 Results
431 Dependence of Conformational Energy on Method An appropriate grid of intramolecular energies was essential in order to search all the
likely conformations of TA and FA and thereby generate all likely Z´=1 crystal structures
To observe the effects that changing the level of theory had on the relative intramolecular
energy the torsion angle was scanned at HF PBE0 MP2 and B3LYP levels of theory
using GAUSSIAN0353 with the rest of the molecule allowed to relax
Figure 410 The relative conformational energy of isolated TA molecules as a function
of the ξ1 The MP2 and PBE0 method at 6-31G(dp) basis set compared with the other
method (top) and the other basis sets (bottom) for the PBE0 method
43 Results
92
The HF6-31G(dp) level of theory produced one minimum for the torsion angle
(Figure 410a) This result was qualitatively incorrect so the PBE0 level was selected as
the best compromise because it reproduced the correlation effect present in TA its
minima coincided in the same torsion angle region as that of MP2 and was
computationally cheaper than MP2 Since the conformational profile of TA converged at
the 6-31+G(d) basis set (Figure 410b) I selected PBE06-31+G(d) as the appropriate
level of theory for the final lattice energy calculation (steps 3 and 4 of section 423) of
the crystal structures This level of theory produced the standard plots of Chapters 4 to 6
432 Consideration of H-bonded Torsion
Figure 411 The relative conformational energy as a function of the ξ2 (Figure 49) for
FA and TA calculated at the PBE06-31G(dp) level of theory
The conformational energy scans of ξ2 (Figure 411) of TA and FA are very similar
The decrease in the torsion angle from 180deg strainedmdashand eventually brokemdashthe
intramolecular H-bond between the carbonyl group and N-H This H-bond strain accounts
for the huge energy penalty observed when this torsion angle changed Therefore
torsion was kept rigid during the search for hypothetical crystal structures even as the
torsion was optimized within the crystal structures to enable an accurate evaluation of the
balance between intermolecular and intramolecular energy in step 3 (section 423)
Chapters 5 and 6 present a more thorough investigation of the conformational energy
scans of fenamates
43 Results
93
433 CSD Survey of Fenamates The conformational potential energy surfaces of isolated TA and FA molecules (Figure
412a) were similar for a wide range of conformations around those found in experimental
structures (Figure 42) but were different as the bulky methyl substituent of TA
approached the benzoic acid ring (Figure 412a) For FA the energy penalty for
conformational changeEintra was less than 6 kJ mol-1 for a complete rotation of the
phenyl ring whereas for TA there was a conformational region that was far too high in
energy to occur in crystal structures The observed conformations of FA and TA in their
crystal structures corresponded to low-energy isolated molecule conformations (Figure
412a) with a relative intramolecular energyEintra of less than 3 kJ mol-1 The
conformational profile for TA was in qualitative agreement with that calculated by other
high-quality ab initio methods (see MP2 and B3LYP in Figure 410) but the profile was
quantitatively affected by the subtle balance between intramolecular dispersion and
intramolecular basis set superposition error60 Other studies have also suggested that the
barriers to conformational change would be lower in solvents from calculations in a
dielectric continuum simulating CCl4 and methanol211
The crystal structures in the CSD that contain the search criterion of Figure 47 also
show the same preference for the lower energy conformations That is the distribution
maxima coincide with the conformational minima (Figure 412b c) with very few
structures having the two rings near coplanar or perpendicular (ξ1=0 90) around the local
maxima in the conformational energy scans For the Y=H search because both ortho
substituents were hydrogen atoms two torsion angle values arose per conformation in a
crystal structure (one value between 0 and 90 and the second value between 90 and
180) giving a symmetric plot (Figure 412b) For YH on the other hand each structure
had only one torsion angle value and an asymmetric distribution (Figure 412c) reflecting
the steric hindrance of the ortho substituent
43 Results
94
Figure 412 The relaxed conformational energy scan of FA and TA as a function of ξ1 at
the PBE06-31+G(d) level of theory (a) Includes the experimental values of ξ1 marked
for TA and FA with the symmetry equivalent FA conformations denoted by open black
squares and an insert diagram showing the steric hindrance for TA in the high-energy
region A histogram of (b) 131 crystal structures found in the CSD search (Figure 47)
with Y=H plus symmetry equivalent structures and (c) 94 crystal structures with YneH
(b)
(c)
(a)
43 Results
95
434 Validation of the CrystalOptimizer plus PCM Models The computational model (steps 3 and 4 of section 423) is able to reproduce all ordered
crystal structures satisfactorily as minima in the lattice energy (Table 43) with these
static 0 K structures overlaying the finite temperature crystal structures with similar
accuracy The range of lattice energies is less than 2 kJ mol-1 consistent with both the
small energy range expected for polymorphs and with the thermodynamic data (Table
41) Form I is the most stable at 0 K in disagreement with the monotropic relationship
between forms I and II as determined by DSC measurements199201 and other data (section
412) Forms III and IV are metastable and very close in energy to form II Of the three
form V Z=2 ordered model crystal structures two have a nearby lattice energy minimum
Because all are quite high in energy the disordered structure is likely to be more complex
than a combination of these structures However a full symmetry adapted ensemble study
of a large supercell143212 would not be appropriate without more detailed experimental
studies
Table 43 Comparison of the lattice energy minimum with the experimental structure
used as a starting point for the final lattice energy model (PBE06-31+G(d) PCM) for
the ordered structures of FA and TA The three form V Z=2 model structures derived
from the disorder components of TA (section 415) are also compared with the starting
model RMSDn corresponds to n=15 unless (n) is given
Space
Group
ρ
gcm-
3
Elatt
kJ mol-1
a b c
Aring
α β γ
deg
RMSDn
Aring
FA
Expt P-1 133 808 9811404 8596 8864 7345
Opt P-1 134 -13663 848 9911333 9094 8816 7130 046
TA
Expt I P21c 144 4833213 804 900010488 9000
Opt I P21c 139 -14724 4863154 832 900010200 9000 033
Expt II P21n 145 38422001421 9000 9411 9000
Opt II P21n 141 -14521 38622061460 9000 9621 9000 026
Expt III P21c 144 76411312807 9000 9303 9000
Opt III P21c 139 -14555 78311642748 9000 9332 9000 030
Expt IV P-1 144 75214331759 10368 9825 9304
Opt IV P-1 138 -14514 76514001828 10256 9932 9152 037(14)Dagger
Expt V P-1 144 765 902 942 10740 920610166
Opt V_a P-1 138 -13954 767 919 961 10756 939910087 021
Opt V_b P-1 137 -14177 6781077 897 9275 850310348 089(6)
Opt V_c P-1 139 -14437 768 928 949 10695 925110249 019
DaggerThe Expt and Opt IV crystal structures overlaid 14 out of 15 molecules
43 Results
96
It is clear from Table 43 that the lattice energy minimization of the ordered structures
V_a and V_c produces a fairly small change in the cell constants but the nearest
minimum to V_b is rather different probably because the initial structure contained a
close ClmiddotmiddotmiddotCl contact These ordered structures correspond to the most stable of three
models of form V All three structures have a lattice energy that is 6-8 kJ mol-1 above
form I and so these ordered models of form V are not competitive in energy with the
other known polymorphs of TA
435 Energy Landscapes of Intermediate Steps
Figure 413 Crystal energy landscape of TA for the Z´=1 structure after (a)
CrystalPredictor (Step 1) (b) the single conformer calculation of Eintra and the atomic
multipoles at the PBE06-31G(dp) level of theory (Step 2 of section 423)
(a)
(b)
43 Results
97
I refined the lattice energy calculation in stages and systematically reduced the number
of crystal structures as my confidence in the energy ranking increased After conducting
single-point calculations to get accurate Eintra and distributed multipoles (which
improved the Uelec and thus the Uinter see equation 41) on all of the unique crystal
structures (step 2 of section 423) the gap between the known forms (I and II of TA) and
the global minima reduced from 40 kJ mol-1 to 6 kJ mol-1 (Figure 413) This intermediate
step was vital in reducing the computing time of the subsequent step 3 (section 423
only about 100 crystal structures were refined) due to the increased confidence in ranking
of the known forms (Figure 413)
436 Finding and Explaining the Known Structures with CSP The known forms of FA and TA were at or close to the global minimum on the final
crystal energy landscapes (Figure 414) which generated all the known Z´=1 ordered
polymorphs The crystal energy landscapes of FA and TA were similar in that they each
had an energy gap of approximately 2 kJ mol-1 between the global minimum cluster and
the other structures although the cluster of low-energy structures was far larger for TA
Although this difference suggested that TA would be more polymorphic than FA I
compared the structures to see whether it was plausible that TA and FA could crystallize
as distinct polymorphs allowing for thermal motion at crystallization temperatures
All the crystal structures of FA and TA whose energies were plotted in Figure 414 (and
tabulated in Table 44 and Table 45) contain the carboxylic acid dimer (Figure 44a)
However the orientation of the phenyl substituents could differ so markedly that this
dimer did not always satisfy the distance criterion to be overlaid by the default Crystal
Packing Similarity comparison This observation suggests that these structures on the
final energy landscape for FA and TA differ by the packing of the aromatic rings It was
necessary to perform a qualitative assessment of the barriers that prevented the
rearrangement of the molecules into a more stable form
The lowest-energy hypothetical structure on the crystal energy landscape for FA was a
Z´=1 structure (1FA_22) that was very similar in density and lattice energy to the only
known experimental Z´=2 form (Figure 414a) with a PXRD similarity of 085 This
1FA_22 hypothetical crystal structure overlaid 5 molecules (Figure 415a) with the
experimental form and it matched the conformation of one of the independent molecules
(Figure 415b) The difference between these two structures lay in the packing of the
layers a difference that is seen in many polymorphs such as progesterone213
43 Results
98
Figure 414 The crystal energy landscapes of FA (top) and TA (bottom) Each symbol
represents a crystal structure of the specified space group which is a minimum in the
lattice energy (calculated within the polarizable continuum) The open symbols
correspond to the minima starting from the experimental structures (Table 43) The
packing coefficient is the proportion of the cell volume occupied by the molecule214
calculated using a grid spacing of 01 Aring
43 Results
99
Table 44 The lattice energy minima of FA shown in Figure 414a The minimum found
starting from the experimental structure is in bold
Label Space
Group a b c
Aring
α β γ
deg
ρ
g cm-3
Uinter ΔEintra Elatt
kJ mol-1
1FA_22 P21c 868 4682709 9000 7404 9000 134 -13765 137-13628
QQQBTY02 P-1 848 9911333 9094 8816 7130 134 -13920 316-13599
2FA_2 P-1 454 9271493 6910 9201 6858 132 -13483 152-13331
3FA_59 P21c 457 8802695 9000 9956 9000 132 -13381 113-13269
4FA_1 P21c 451 8992682 9000 7877 9000 133 -13435 175-13260
5FA_10 P21c 4582686 880 9000 8526 9000 131 -13350 144-13206
6FA_151 P-1 1285 744 666 66291027411127 131 -13418 221-13197
7FA_4 P21c 1788 5341283 9000 6136 9000 132 -145121363-13149
8FA_16 P21n 1395 5201508 9000 7809 9000 132 -145051361-13144
9FA_287 P21n 1429 4591770 9000 7060 9000 129 -13279 240-13039
10FA_192 P21c 46019181231 9000 9792 9000 132 -13641 636-13005
11FA_19 P21c 50121791004 9000 7377 9000 135 -143771419-12958
12FA_23 P21c 6443425 653 900013152 9000 131 -13855 917-12938
13FA_2880 P21n 1490 4931456 9000 8825 9000 133 -13666 791-12875
14FA_33 P21c 4302600 997 900010250 9000 130 -13039 166-12873
15FA_18 P-1 870 799 935 105831022011301 132 -13040 187-12853
16FA_5226 P-1 10211325 990 1410911696 4347 127 -13013 186-12827
17FA_484 C2c 3864 897 750 9000 5874 9000 128 -12962 155-12807
18FA_7 P-1 4991113 995 844610467 9266 133 -141671409-12758
Table 45 The lattice energy minima of TA shown in Figure 414b Minima found starting
from the experimental structures or ordered models are in bold
Label Space
Group a b c
Aring
α β γ
deg
ρ
g cm-3
Uinter ΔEintra Elatt
kJ mol-1
FORM I P21c 4863154 832 900010200 9000 139 -14874150-14724
1TA_8 P21c 4853160 833 9000 7787 9000 139 -14865148-14717
2TA_15 P-1 1772 847 484 79491123711171 140 -14832163-14669
3TA_876 P-1 1698 744 734 9440 9376 4181 141 -14952357-14595
4TA_6243 P-1 12061015 871 7176 617011737 142 -14774196-14579
FORM III P21c 78311642748 9000 9332 9000 139 -14853298-14555
FORM II P21n 38622061460 9000 9621 9000 141 -14784263-14521
5TA_38 P21n 38622051460 9000 8376 9000 141 -14781263-14518
FORM IV P-1 76514001828 10256 9932 9152 138 -14773259-14514
6TA_82 P21c 39014332374 9000 6805 9000 141 -14611234-14377
FORM V_b P-1 6781077 897 9275 850310348 137 -14505328-14177
FORM V_c P-1 768 928 949 10695 925110249 139 -14437313-14124
FORM V_a P-1 767 919 961 10756 939910087 138 -14219265-13954
7TA_45 P-1 14441231 385 10950 8330 7631 142 -14171263-13908
8TA_88 C2c 2697 4792067 900010567 9000 135 -14113218-13895
9TA_64 P-1 756 900 986 753110145 8029 141 -14744889-13855
10TA_153 P21c 49212392217 9000 7574 9000 133 -13951196-13755
11TA_80 P2n 1492 3982150 9000 7536 9000 141 -13910180-13730
12TA_3630 P21c 1655 3842338 9000 5714 9000 139 -13930222-13708
43 Results
100
Figure 415 (a) Overlay of the only known form of FA (grey) and the most stable
structure on the Z´=1 crystal energy landscape (Figure 414a) 1FA_22 (green) with an
RMSD5 value of 175Aring (b) Overlay of the conformers of form I (pink and light blue) and
1FA_22 (black)
A significant energy gap was observed between the experimental and lowest energy
Z´=1 structure and the other structures generated for FA (Figure 414a) Remarkably this
gap was between two hypothetical structures that had a 12-molecule overlay and only
differed in the packing of the layers (Figure 414a) The lower-energy structure
(1FA_22) had more close contacts and a higher packing coefficient than the higher-
energy structure The second most stable hypothetical structure (2FA_2) was also
closely related to the experimental structure in it half of the molecules had changed the
phenyl torsion angle to a less stable conformation changing the stacking with the
phenyl ring in the neighbouring molecule to a herringbone215 (C-Hmiddotmiddotmiddot) interaction
(Figure 416bc) Thus there were two ways that the 2FA_2 structure could gain 2 kJ
mol-1 of stabilisation energy (Figure 416) The relationship between the two most stable
structures (1FA_22 and the experimental structure) means that it may be very difficult
to produce the Z´=1 structure as a polymorph Clearly Z´=1 and Z´=2 structures are very
close in energy and are related (via 2FA_2) It is therefore difficult to establish whether
the observed form is in fact a ldquocrystal on the wayrdquo216 that is trapped by a barrier from
rearranging into the Z´=1 form or whether the observed form is the more stable
structure217
(a) (b)
43 Results
101
Figure 416 (a) Overlay of the two most stable hypothetical crystal structures on the
crystal energy landscape global minimum 1FA_22 (grey) and 2FA_2 (green) with
ΔElatt=20 kJ mol-1 The crystal structures overlaid 12 molecules with RMSD12 of 051 Aring
and the conformations had an RMSD1 of 009 Aring (b) Overlay of 2FA_2 (green) and the
experimental crystal structure of FA (grey) with a RMSD15 of 123 Aring obtained with a
distance and angle tolerance of 50 and 50deg (c) Overlay of the two independent
molecules in the experimental structure (grey) with 2FA_2 (green)
For TA the crystal energy landscape successfully found the Z´=1 polymorphs forms
II and I to be the first and fifth most stable crystal structures within 2 kJ mol-1 of the
global minimum (Figure 414b) the landscape also provided a good reproduction of the
experimental crystal structures (Figure 417 and Table 43) Four other structures were
observed all of which were competitive in lattice energy with the known metastable
forms These crystal structures had somewhat similar packing to the known forms of TA
(Table 48) some being more similar to the form V Z=2 model structures constructed
from the disorder components of TA than to the other polymorphs (contrast Table 42 and
Table 48) Some of the similarities (Table 46) between the hypothetical structure and
the other fenamates in Table 41 were even more striking One of the computed structures
(a) (b)
(c)
43 Results
102
6TA_82 (highlighted in Table 45) matched 15 molecules of SURMOI (Table 41)
suggesting that crystals of this dimethyl-substituted molecule might template the
nucleation of a novel polymorph of TA This observation led to the joint experimental
and computational project discussed in section 438
Figure 417 The overlay of the experimental Z´=1 crystal structures (grey) of TA with
the closest structure found in the search (green) (a) Form I and 1TA_8 overlaid with an
RMSD15 value of 032Aring (b) Form II and 5TA_38 overlaid with an RMSD15 value of
026Aring
(b)
(a)
43 Results
103
437 Other Known Fenamates and their Hypothetical Structures Further marked similarities were observed between the structures on the crystal energy
landscapes of FA and TA (Figure 418) The hypothetical crystal structures on the crystal
energy landscape of FA in Figure 418 were similar to some of the known forms of TA
(forms I-IV) with some of these hypothetical crystal structures overlaying up to 13
molecules (forms I and III of TA Figure 418) Many of the low-energy structures of FA
had more in common with a polymorph of TA than with the only known form of FA that
is with a few exceptions the second numbers are greater than the first bold numbers
(Figure 418) There exist distinct crystal structures of FA with the planar molecules
(highlighted in Figure 418)
Figure 418 Classification of the crystal energy landscape of FA in terms of the similarity
of the structures to those of known TA polymorphs (I-IV) without PCM (hence the
different y-axis compared to Figure 414a) Numbers in bold indicate the number of
molecules that overlay with the known structure of FA Hence a label 5 6 on a structure
represented by a blue circle means that the structure overlaid 5 molecules with the
experimental form of FA but 6 with form I of TA Each point is coloured by the TA
polymorph with which it overlaid the greatest number n of molecules in a Crystal Packing
Similarity calculation that ignored the CH3 and Cl
The similarities between the known forms of TA and the hypothetically generated
structures of FA confirmed that because of the effect of TArsquos substituents (CH3 and Cl)
on the moleculesrsquo relative energies the energy landscape of TA was more polymorphic
than that of FA (Figure 414) The common clusters produced by the similarity overlays
between different fenamates usually had the differing substituents in the exterior region
43 Results
104
where there was no overlay of the coordinating molecule consistent with the substituents
causing the differences in the packing This in marked contrast to the large common
cluster between forms III and IV of TA (Figure 44c) where the packing of the aromatic
rings is similar
Table 46 Crystal Packing Similarity comparisons of the experimental structures of FA
and TA and their most stable hypothetical crystal structures with the crystal structures of
the other fenamates shown in Figure 13 The similarity is given in the form n(RMSDn)
with n gt 4 molecules highlighted
n(RMSDnAring)
FPAM- CA
FPAM- CA11
LAH- LOW
PEF- MET
PEF- NAQ
SUR- MEY
SUR- MOI
XYA- NAC
FA
QQQBTY02 2(071) 4(133) 7(084) 3(128) 6(062) 3(05) 3(12) 4(049)
1FA_22 2(041) 5(191) 6(131) 2(013) 11(096) 4(098) 4(108) 3(18)
2FA_2 2(043) 3(056) 7(101) 2(01) 11(051) 3(107) 7(098) 3(086)
TA
II 1(089) 2(015) 2(059) 2(011) 1(061) 2(012) 12(187) 2(029)
I 2(059) 2(048) 3(061) 1(07) 13(038) 6(178) 4(12) 2(062)
III 1(081) 7(075) 2(048) 13(033) 2(055) 13(061) 3(041) 13(045)
IV 2(087) 6(071) 3(109) 11(049) 2(046) 13(084) 3(056) 15(03)
V_a 2(057) 2(046) 5(042) 1(068) 3(039) 2(022) 2(018) 2(057)
V_b 2(075) 3(032) 7(064) 2(047) 4(110) 5(041) 4(119) 5(072)
V_c 2(095) 2(084) 5(041) 1(042) 4(110) 4(051) 2(029) 3(046)
2TA_15 2(052) 2(053) 3(091) 1(077) 14(04) 4(082) 4(122) 2(07)
3TA_876 1(093) 4(156) 7(142) 3(043) 1(066) 3(071) 4(047) 2(037)
4TA_6243 2(054) 3(115) 3(176) 1(069) 4(016) 4(149) 2(017) 3(091)
6TA_82 1(092) 2(017) 2(061) 2(012) 2(064) 2(008) 15(028) 2(028)
Some fenamate crystal structures are specific to the molecule One observed example
(Table 46) is the FPAMCA polymorph of flufenamic acid In 2012 through the use of
polymer-induced heteronucleation and solidndashsolid transformations flufenamic acid set a
new record18 for a polymorphic compound with eight solved structures which was
recently equalled by aripiprazole218 These fenamate structures are all based on the
carboxylic acid dimer with some having more similarity to the TA and FA low-energy
structures (Table 47) The specific substituents affect the range of packing of the aromatic
rings For example the low-energy unobserved structures of FA which are based on a
planar conformation of the entire molecule (Figure 414) are probably also specific to
FA because the lowest-energy crystal structure of TA with a planar molecule is 14 kJ
mol-1 above the global minimum structure The energy difference between crystal
structures of TA is caused by substituent intermolecular interactions that destabilize the
43 Results
105
structures containing planar molecules the intramolecular energy penalty Eintra for this
planar conformation is similar for FA and TA (6 kJ mol-1 Figure 412)
Table 47 An extension of Table 46 showing Crystal Packing Similarity comparisons of
the latest structures of flufenamic acid18 and the experimental structures of FA and TA
and their most stable hypothetical crystal structures
n(RMSDnAring)
FPAMCA_z
z=2 z=4 z=5 z=6 z=7 z=8
FA
QQQBTY02 5(149) 3(079) 2(073) 4(160) 2(043) 3(082)
1FA_22 4(162) 5(142) 2(105) 5(202) 2(022) 2(026)
2FA_2 4(151) 4(034) 3(119) 5(080) 2(021) 3(130)
TA
II 2(010) 2(016) 2(04) 2(017) 1(071) 2(081)
I 3(158) 2(054) 2(069) 4(210) 2(034) 2(041)
III 2(022) 2(024) 4(052) 2(025) 1(064) 2(077)
IV 2(020) 2(023) 4(168) 3(084) 2(064) 2(070)
V_a 3(124) 2(048) 2(064) 2(050) 3(068) 3(080)
V_b 5(054) 3(067) 2(045) 3(063) 1(059) 2(078)
V_c 2(085) 2(041) 2(079) 2(042) 2(077) 3(127)
2TA_15 4(304) 2(080) 2(017) 2(062) 3(042) 4(280)
3TA_876 4(134) 2(018) 4(210) 2(019) 1(076) 2(082)
4TA_6243 4(110) 2(058) 2(040) 2(060) 2(031) 2(038)
6TA_82 2(018) 2(019) 2(025) 2(020) 1(073) 2(081)
Table 48 Crystal Packing Similarity calculations of the known forms of TA and
unobserved thermodynamically competitive crystal structures The similarity between
the structures is given in the form n(RMSDn) where n is the number of molecules overlaid
and the value in brackets is the RMSDn overlay Structures with the highest similarity are
highlighted
n(RMSDnAring)
2TA_15 3TA_876 4TA_6243 6TA_82
KAXXAI 1(095) 4(033) 1(088) 9(043)
KAXXAI01 1(049) 1(096) 5(132) 1(090)
KAXXAI02 2(087) 3(108) 2(095) 3(059)
KAXXAI03 2(083) 3(081) 3(255) 3(081)
KAXXAI04_a 4(125) 1(092) 3(016) 1(086)
KAXXAI04_b 4(128) 3(092) 6(107) 2(069)
KAXXAI04_c 1(013) 2(120) 4(105) 1(059)
438 Update on a Recently Discovered Polymorph of TA Section 436 theorized that experimentalists could nucleate a novel polymorph of TA
by using the SURMOI molecule as a template However my colleague at UCL used
mefenamic acid (Figure 13) because SURMOI is very expensive A novel polymorph of
TA was nucleated by solution evaporation after dissolving TA (form I) in ethanol and
43 Results
106
seeding it with mefenamic acid (form I)219 This procedure resulted in the nucleation of
form VI of TA which was disordered (65 and 35) with same unit cells as form I of
mefenamic acid
Although the major component of this novel form VI was generated in step 1
137_TA the form was not among the structures on the final energy landscape of Figure
414b The major component of form VI and 137_TA overlaid 15 molecules with a
RMSD15 value of 030 Aring (Figure 419) This structure 137_TA had a final lattice energy
of -14497 kJ mol-1 which was competitive with form IV of TA (Table 45 -14514 kJ
mol-1) It should be noted that steps 3 and 4 of CSP (section 423) involved just over 100
crystal structures Clearly lattice energy refinements (steps 3 and 4 section 423) of
more hypothetical crystal structures are vital
Figure 419 Overlay of FA_137 (green) and the major component of experimental
crystal structure of TA form VI (grey) with a RMSD15 of 030 Aring obtained with a distance
and angle tolerance of 50 and 50deg
439 The Cost of Lattice Energy Minimisation The lattice energy minimization (CrystalOptimizer step 3) of one crystal structure
accounted for as much as 75 of the computing time and took as long as 4 days (Figure
420a) because multiple ab initio calculations were required to balance Uinter and Eintra
The computing time was approximately half as long for the optimisation of the last
structure (form VI of TA Figure 420b) This last optimisation (Figure 420b) was faster
44 Summary
107
because there were about hundred structures stored in the Local Approximation Models
(LAMs)71 database (LAMs71 database stores and reuses conformational energy and
multipole representations of the charge density) This final calculation was performed
after the discovery of a novel polymorph of TA as discussed in section 438 Even with
the help of LAMs71 database the computational cost was still very high
Figure 420 CPU timings of (a) 38_TA (form II) and (b) 137_TA (form VI section
438) after lattice energy minimisation using CrystalOptimizer (step 3)
44 Summary This chapter described the successful use of the CSP method (see Chapter 3) to examine
the computer-generated low-energy crystal structures of the unsubstituted structural
fragment FA and a derivative TA This chapter showed that all structures were based
on the same 11987722(8) H-bonded dimer and that the structures differed only in the packing
of the phenyl rings The crystal energy landscape of TA had several crystal structures
including the observed polymorphs which were tightly clustered around the global
minimum whereas the corresponding cluster for FA contained only the observed and a
closely related structure This observation is supported by past experiments
Many of the crystal structures on the energy landscape for FA overlaid a significant
portion of the coordination environment with other observed or calculated structures
Therefore the phenyl ring substituents determined the relative energies of the crystal
structures and hence whether a specific fenamate would be very polymorphic or not The
FA fragment can be described as a polymorphophore despite only two structures
clustered around the global minimum since the molecular fragment packed in a wide
range of distinct crystal structures with different conformations that were energetically
favourable This finding indicates that being a polymorphophore correlates with but does
(a)
(b)
44 Summary
108
not guarantee polymorphism It is perhaps not surprising that this term has not been more
widely accepted
The similarities between the structures on the final energy landscapes of TA and other
fenamates led my colleague to conduct a templating experiment on TA (section 438)
The subsequent discovery of a new polymorph of TA (form VI section 438) exemplified
one problem with the CSP discussed earlier Restricting the number of crystal structures
that were accurately optimised (step 3 CrystalOptimizer) to just over 100 structures
meant excluding the recently discovered crystal structure of TA (section 438) from the
final crystal energy landscape (Figure 414b) As a result current intermediate steps like
the single-point calculations used in this chapter (step 2) although successful (section
435) had their limitations
The findings of Chapters 3 and 4 indicate the need for a cheaper and more accurate
approach to modelling lattice energy If the evaluation of Eintra (the bulk of computer
time section 439) can be realized through a less expensive method (Chapter 6) then
molecular dynamics calculations and the temperature effects (eg free energies) can be
better accounted for However we must first understand the origin of intramolecular
forces and energies (Chapter 5)
51 Introduction
109
Chapter 5 The Origin of conformational energy barriers in Fenamates
ldquohelliplsquoBegin at the beginningrsquo the King said gravely lsquoand go on till you come to the
end then stoprsquohelliprdquo
mdash Lewis Carroll Alice in Wonderland
51 Introduction
511 Background Chapters 3 and 4 established that lattice energy Elatt could be partitioned into
intermolecular Uinter and intramolecular components Eintra
where Uinter is the sum of the dominant electrostatics Uelec plus the contributions of
repulsion-dispersion Urepul-disp and Eintra is the energy required to distort the molecule
from its gas phase conformation71 The conformation determines the overall molecular
shape so different conformers may lead the crystal to arrange itself in different ways
ultimately influencing the properties of the crystal220 (Chapter 1)
1
6
2
1
9
1
1
813
7
16
Figure 51 The fenamate family showing the low barrier torsion angle (=C7-N1-C8-C9)
=0 when the aromatic rings are coplanar as drawn The fenamates family mentioned in
this chapter includes fenamic acid (FA) R1= R2= H tolfenamic acid (TA) R1= CH3 R2=
Cl mefenamic acid (MA) R1= R2= CH3 clofenamic acid (ClFA) R1=H R2=Cl and
flufenamic aid (FFA) R1=H R2=CF3 The dotted line represents an intramolecular
hydrogen bond
This chapter will investigate the conformational flexibility of fenamate molecules in
isolation Through this investigation we will come to a better understanding of the origin
of torsional barriers which will enable the derivation of an analytical model for the
intramolecular energies of the fenamate molecules FA and TA (Chapter 6) To put this
problem in context there is still an ongoing debate about the origin of the torsional barrier
of the ethane molecule which has only 8 atoms as compared to the 27 and 30 atoms of
FA and TA respectively
Elatt = Uinter + Eintra 51
51 Introduction
110
512 Torsional Barrier for Ethane The torsional barrier is defined as the difference in energy between the least stable and
the most stable conformations in rotation around a bond In order for one full rotation
around a bond to occur this energy barrier must be overcome (Figure 52) The energy
barrier for fenamic acid FA is smaller (Chapter 4) than ethane (Figure 53)
Figure 52 Illustration of the barrier to rotation with the relaxed conformational energy
profile of FA
Previous studies of torsional barriers have focussed on small molecules such as ethane
The torsional barrier for the ethane molecule is one of the most fundamental puzzles in
conformational analysis and researchers have great interest in understanding its origin221
The experimental (1203 to 1225 kJ mol-1) and quantum mechanical (1124 to 1303 kJ
mol-1) calculations of ethanersquos torsional barrier are in good agreement (Table 51)
However researchers disagree upon the origin of the torsional barrier in ethane The
root of the controversy is whether the origin of the torsional barrier in ethane results from
stronger hyperconjugation stabilization222 in the staggered conformation (Figure 53) than
the eclipsed form or whether the barrier originates from greater steric repulsion221 in the
eclipsed conformation (Figure 53) due to electrostatic interaction and Pauli exchange
repulsion Three physical factors may play a role in ethanersquos structural preference
hyperconjugation electrostatic interactions and exchange interactions
51 Introduction
111
Figure 53 The staggered and eclipsed conformations of the ethane molecule (Sources
Ref [222] and enwikipediaorgwikiAlkane_stereochemistry [Accessed 11012015])
Table 51 Torsional barrier height of ethane (Source Reproduced from Ref [223])
Hyperconjugation and exchange repulsion are quantum mechanical effects arising from
orbital overlap The hyperconjugation effect for the ethane molecule is constituted of the
vicinal interactions between the occupied CH bond orbitals of one of the methyl group
and the virtual antibonding CH orbitals of the other methyl group221 The staggered
51 Introduction
112
conformation (Figure 54a) is stabilised through the delocalization of electron charge
density involving these orbitals an attractive contribution
Pophristic and Goodman222 used natural bond orbitals (NBOs) to argue that
hyperconjugation or stabilization of the staggered ethane conformation is the origin of
the barrier to rotation in ethane By showing that if the CH-CH hyperconjugative
interactions were removed and by adding electrons to the unoccupied CH virtual
orbital the steric repulsion favoured the less stable eclipsed conformation (Figure 53)
This model of hyperconjugation interactions relies on NBOs and is not so obvious if
molecular orbitals (MOs) are used let alone if correlated wave functions are used
(a) (b)
Figure 54 (a) Hyperconjugation effects on the staggered (b) Pauli exchange repulsion
in the eclipsed conformation (Source enwikipediaorgwikiHyperconjugation
[Accessed 11012015])
Pauli exchange repulsion which requires that pairs of electrons do not occupy the same
spatial region occurs in the eclipsed conformation (Figure 54b) Electrostatic (Figure
55 also see section 223) repulsion involves the classical R-1 repulsion between charges
At short distances the 1-4 (third nearest neighbour) interactions still have an electrostatic
effect but there are also considerable penetration-effects (section 225) The Pauli
exchange and electrostatic repulsion frequently regarded as the steric factor destabilise
the eclipsed conformation of ethane These interactions are the same as intermolecular
interactions but at shorter distances
51 Introduction
113
Figure 55 Electrostatic steric repulsion (between electrons on the bond black arrow) for
the eclipsed conformation of ethane The red arrow indicates exclusion of van der Waals
repulsion since the van der Waals radii of the hydrogen are too small to make contact
(Source enwikipediaorgwikiConformational_isomerism [Accessed 11012015])
Mo and Gao221 made three arguments in favour of steric repulsion being the origin of
the barrier to rotation One argument was that hyperconjugation is a second-order effect
and hence should have little or no direct role in restricting free rotation224 Second these
researchers argued that overestimation of the hyperconjugative effects led others to
misidentify hyperconjugation as the origin of the rotation barrier Third Mo and Gao
argued that the experimental work on heats of hydrogenation for propene supported a
specific energy decomposition scheme225 In short the researchers argued that their three
points supported the claim that steric repulsion is the origin of the torsional barrier
The origin of the torsional barrier remains controversial226 even for a small molecule
such as ethane The question remains Is the torsion defined by the origin
hyperconjugation221222 or by a similar electronic effect from changes in MOs on the
atoms Or is the barrier equivalent to intermolecular non-bonded repulsion and
electrostatic effects227 at short distances ie as though there were no single covalent
bond The quantitative distinction can be highly dependent upon the precise definitions
and upon the type of charge density calculation that is used
513 Overview The conformational energy barrier of FA (622 kJ mol-1) is smaller than that of the
ethane molecule (123 kJ mol-1) The goal of this chapter is to investigate the qualitative
origin of the conformational barrier to rotation for fenamate molecules in isolation First
I will investigate the effects that different definitions of the same flexible bond have on
the calculated conformational profile of TA The step size of torsion angles various ab
initio methods and relaxation effects will be investigated for various fenamates (Figure
51) Following this I will investigate the electronic contributions using constrained
model molecules that avoid pyramidization (Figure 57) with minimal or no steric effects
Finally an exp-6 atom-atom model which contains both a repulsive and a dispersive part
will be used to investigate the steric effect of FA and TA
52 Method
114
This chapter will show that the barrier to rotation for FA and TA (Figure 51) depends
significantly upon small correlated changes in the entire molecule rather than on the
atomic position of the atoms that define the rotating torsion It will also show that there
is an intrinsic dispersion and electronic energy barrier when the aromatic rings are
perpendicular to one another the barrier to rotation for small model molecules can be
represented by a simple cos2 term
52 Method In section 431 it was established that the PBE06-31+G(d) level of theory is the best
compromise between the cheap but inaccurate HF method and the expensive but accurate
MP2 method for calculating the packing (intermolecular) and conformational
(intermolecular) energies (equation 51) of FA and TA This chapter examines the ab
initio conformational profiles of fenamate molecules in more detail All the ab initio
calculations reported in this chapter were performed using GAUSSIAN0353
521 Determining Conformation Energy Scan for Isolated Molecule
For TA there are 4 definitions of the N1-C8 rotatable bond (Figure 51) (1) = C7-N1-
C8-C9 (2) 2= C7-N1-C8-C13 (3) 3= H6-N1-C8-C9 and (4) 4= H6-N1-C8-C13 The effects
of these different definitions upon the conformational profile of TA were investigated
using the PBE06-31+G(d) level of theory Preliminary relaxed conformation energy
scans were also performed on FA using 2 and 1 step sizes around the maxima and
minima (section 431) respectively at the same level of theory in order to investigate the
origin of the slight asymmetry in FA
522 Ab initio Conformational Energy Profiles for Fenamates To test the sensitivity to method of the different fenamate moleculesrsquo conformational
profiles (Figure 51) I carried out a relaxed scan at the HF6-31+G(d) level of theory as
well as single-point energy calculations at the MP26-31+G(d) level of theory on the
optimized PBE06-31+G(d) conformations The PBE06-31+G(d) energies were then
revaluated within a polarizable continuum model (PCM)180 with dielectric continuum
value of 3 a typical dielectric environment of organic crystals PCM has been shown to
help the relative energy ranking of some conformational polymorphs (Chapter 4)131
The primary aim of this research was not to seek a definitive ab initio conformational
profile for all molecules as this would have been beyond the capability of the available
computational resources Indeed many studies have emphasized the difficulty in
evaluating the relative energies of fenamate polymorphs184211228 Instead the objective
52 Method
115
of this chapter is to present qualitatively correct scans that can be compared among the
fenamate molecules
523 Investigation of Electronic Effects In an attempt to distinguish the steric effects from the electronic effects I studied a
series of model molecules where the steric effects had been minimized (Figure 56)
12
9
1 813
6
Figure 56 Chemical diagram of model molecules used to investigate the electronic
contributions The bonds around N1 are constrained to be planar (ie R2-N1-H6-C8=180deg)
for phenylamine (PA) R1=R2=H N-methylaniline R1=H R2= CH3 N-vinylaniline R1=H
R2 = CH=CH2 and 3-anilinoprop-2-enoic acid R1=H R2 = CH=CHCO2H for 3-
chloroaniline R1= Cl R2=H and 3-methylaniline R1=CH3 R2=H (=R2-N1-C8-C9)
The benzoic acid group was replaced by a series of smaller molecular fragments (Figure
56) for example a hydrogen atom The three bonds to the nitrogen atoms were
constrained to be planar by fixing the torsion involving these atoms (eg H7-N1-H6-
C8=180deg for PA) This constraint prevents the normal pyramidalization at the nitrogen in
the torsional potential of phenylamine227 (Figure 57) or the major rearrangement of the
second hydrogen that occurs in a relaxed scan of H7-N1-C8-C9
Figure 57 Pyramidalization in unconstrained phenylamine (PA) molecule caused by
lone pair on nitrogen atom
The difference in electronic structure with torsion angle was estimated by using the
lowest occupied molecular orbital (ie the highest occupied molecular orbital (HOMO)-
n where n is an integer) and HOMO electron density for the PA model FA and TA For
52 Method
116
selected constrained (fixed ) conformations in the PBE06-31+G(d) scan a single-point
calculation with GAUSSIAN03 was used to generate a density file which was then used
to produce the molecular orbitals (MOs) isovalue surfaces of 002 au The graphical
interface used was GaussView 5229
524 Investigation of the Steric (Non-Bonded) Effects Within organic molecules that are typically used in pharmaceuticals many of the atom-
atom distances are similar to intermolecular distances although some are considerably
shorter The intramolecular steric interactions can be represented as the exp-6 atom-atom
intermolecular parameters which were derived by fitting to crystal structures and heats
of sublimation of hydrocarbons oxahydrocarbons azahydrocarbons chlorohydrocarbons
and nitro compounds42 This provides the parameters for all intramolecular interactions
involving C N O Cl and H but the same parameters are used for all C and H atoms
whether aromatic or in the methyl or carboxylic acid groups which is an approximation
to the most force field eg Sybyl typing230 This approximation is better justified for FA
than for TA (Figure 51) because of the importance of distinguishing C in different
chemical environments That is the chemical environment of aromatic C is different from
that of methyl C There is a polar hydrogen type HB which was used for both polar
hydrogens (H1 and H6 in Figure 51) because the intramolecular energy is expected to be
insensitive to the interactions of the carboxylic acid group
Table 52 Gavezzottirsquos exp-6 atom-atom parameters E=Aexp(-BR)-CR-6 is the well
depth and Rm is the distance at the minimum41231232 Italics represent the hydrogen-
bonded interactions aFrom the UNI intermolecular potential function of Mercury233
Interactions AkJ mol-1 BAring-1 CkJ mol-1Aring-6 kJ mol-1 RmAring
H∙∙∙H 241584 401 1092 004 336
H∙∙∙C 1207921 410 4728 021 329
H∙∙∙N 2282790 452 5021 039 299
H∙∙∙O 2954322 482 4393 051 280
H∙∙∙Cl 2929637 409 11673 050 330
C∙∙∙C 2261452 347 24184 039 389
C∙∙∙N 4914945 386 27907 084 350
C∙∙∙O 3930868 374 26819 067 361
C∙∙∙Cl 3906601 352 38618 067 383
N∙∙∙O 2685710 386 15230 046 350
O∙∙∙O 1953091 374 13347 033 361
O∙∙∙Cl 3382973 363 27824 058 372
HB∙∙∙O (acids) 264163953 875 8577 2929 160
HB∙∙∙N (-NH∙∙∙OH) 238673400a 778a 15774a 2661 180
53 Results
117
The Gavezzotti parameters used for FA and TA are given in Table 52 Although exp-
6 does not model the electrostatic contributions explicitly some of the parameters have
absorbed some electrostatic contributions during the fitting process The energies were
partitioned into repulsion (Aexp(-BR)) and dispersion (-CR6) contributions
The extension of the exp-6 parameterization to hydrogen bonding interactions required
potentials with a particularly deep well at the short hydrogen bonding distances to absorb
the electrostatic interactions in hydrogen bonding231 The polar hydrogens were assumed
not to have significant intermolecular interactions with any atoms other than the hydrogen
bond acceptor interactions which is a reasonable assumption for intermolecular
interactions The parameters for the H∙∙∙HB and C∙∙∙HB that were not determined by
Gavezzotti may be important
Interactions that are three atoms or more apart from each other (ie 1-4 and above) were
then investigated The longest bond path for FA and TA is 1-11 The atom∙∙∙atom
interactions that dominated the intramolecular contributions were analysed with the exp-
6 potential For each fenamate molecule interactions were classed as dominant if the
difference between the minimum and maximum total energy (Erepul-dis) of the conformers
was greater than or equal to 1 kJ mol-1 It is expected that some interactions in FA and
TA will vary with conformations however a few interactions will have constant
contribution (eg HB∙∙∙O (acid) an important intramolecular H-bond) The interactions
with constant contributions are not classed as dominant interactions
53 Results
531 Effect of Different Definitions of the Same Flexible Bond The N1-C8 rotatable bond can be defined in four ways C7-N1-C8-C9 C7-N1-C8-C13 H6-
N1-C8-C9 and H6-N1-C8-C13 (Figure 51) The conformational energy profile of TA
(Figure 58) is sensitive to the atoms used in defining the N1-C8 rotatable bond For
example the intramolecular energy penalty at ξ= 0deg for the C7 torsions (=C7-N1-C8-C9
and 2=C7-N1-C8-C13) are approximately half that of the H6 torsions (3=H6-N1-C8-C9 and
4=H6-N1-C8-C13) (Figure 58) The relaxation of the hydrogen atom (H6) was clearly
playing a vital role in stabilizing the molecular conformation at ξ= 0deg There were some
differences in intramolecular energy penalties as approached 180deg for the C7 torsions (
and 2 in Figure 58)
53 Results
118
Figure 58 Relaxed scan of TA at the PBE06-31+G(d) level of theory with the different
definitions of flexible N1-C8 bond (= C7-N1-C8-C9 2= C7-N1-C8-C13
3=H6-N1-C8-C9
and 4= H6-N1-C8-C13) used as the constrained geometric parameter
The torsional barriers for TA are sensitive to the atoms used in defining the N1-C8
rotatable bond (Table 53) The C7 torsional barriers (Group 2 of Table 53) are larger
than the H6 torsional barriers (Group 2 of Table 53) For the C7 torsions the H6 proton
relaxes to maintain the intramolecular H-bond while for the H6 torsions the benzoic acid
(including the C7 atom) deviates minimally to prevent deformation of aromatic ring and
form better pyramidalization (Figure 57) at N1 for TA These results show that the
torsional barrier and conformational energy profile of TA (Figure 58 and Table 53)
depend upon the selected 4 atoms that define the flexible torsion
Table 54 shows no correlation between shorter (stronger) intramolecular H-bond
distances and smaller energy penalties However a closer inspection of the atom-atom
distances between the H atom of the secondary amine and the H atom of the methyl group
(Group 1 of Table 55) suggest that steric hindrance also contributes to the intramolecular
energy because conformations with higher energy penalties correlate with shorter atom-
atom distances
53 Results
119
Table 53 Torsional barrier height of the relaxed conformational energy profiles in Figure
58 for TA
Torsion Barrier Barrier relative to
kJ mol-1
Group 1 3585 0 2 3572 -013
Group 2 3 2453 -1132
4 3148 -437
Table 54 Comparison of intramolecular energies and hydrogen bond distances of TA for
the near-planar conformer
Torsion N-H∙∙∙O=CAring ∆EintrakJ mol-1
Group 1
= 0deg 1850 706
2= 180deg 1847 648
Δ -0003 -058
Group 2 3= 180deg 1880 1574
4= 0deg 1881 1257
Δ 0001 -317
3(180)-(0) 0030 868
Table 55 Comparison of the intramolecular energies and the N-H7∙∙∙HX-C14 bond
distances of TA for the near-planar conformer where HX-C14 is the methyl group
Group 1 N-H7∙∙∙H10-C14 N-H7∙∙∙H11-C14 N-H7∙∙∙H12-C14
(Aring)
∆Eintra
kJ mol-1
= 0deg 3491 2284 2194 706 2= 180deg 3486 2272 2199 648
Δ -0005 -0012 0005 -058
Group 2
3= 180deg 3358 2135 2090 1574
4= 0deg 3386 2157 2117 1257
∆ 0028 0022 0027 -317
3(180)-(0) -0133 -0149 -0104 868
532 Effect of Step Size on the Conformation Profile of Fenamate Molecule Given that conformational profiles depend on small correlated changes in atomic
positions I investigated the effect of step size on the conformational profiles For FA the
conformation profile is unaffected by the small step size of 1 and 2 for the minima and
maximum respectively (compare Figure 510 with Figure 511) Over all possible
conformations of FA the barrier to rotation is approximately 6 kJ mol-1 (see Figure 510
and Figure 511)
Although the phenyl ring of FA is symmetric the rotation of this ring produces
asymmetry conformational profiles around the maximum and minima points (Figure
510) The slight asymmetry observed for the conformational profile of FA (Chapter 4) is
53 Results
120
therefore not due to the small step size These changes can be substantial for example
the two minima for FA scan at =3894deg and 14471deg (Figure 510) correspond to
conformations that differ by 061 Aring in the 1-4 distance between the amide proton and C13
(or C9) even though the minima only differ in energy by 188 x 10-3 kJ mol-1 (716 x 10-
7 au) Even the C8-C9 and C8-C13 aromatic bond lengths differ by 00037 Aring for =0 or
180deg but only by 00004 Aring for =80deg or 100deg with larger changes in the bonded
hydrogen positions for FA It is therefore clear that the molecular structure of the phenyl
ring is not perfectly symmetric (Figure 59) and that it changes with torsion
Figure 59 Molecular conformation of the relaxed gas phase at PBE06-31+G(d) showing
the bond lengths of the phenyl C-C bond (=180) of FA
For the definitive scans full optimization was performed near each symmetry-
independent potential minimum with a step size of Δ=5deg The highly repulsive points
for the substituted fenamates (TA and MA) were omitted due to the huge energy penalty
as approached 180deg (section 431 and Figure 58)
53 Results
121
Figure 510 Relaxed scans of FA at PBE06-31+G(d) with step sizes 2 and 1deg around the
maxima and minima respectively The red circles indicate the starting points of the scans
while the arrows indicate the directions of the scans
53 Results
122
533 Conformational Energy Profile of the Fenamates The conformational profile for four fenamate molecules (Figure 511) shows that there
are two distinct minima which are only close in energy for the symmetric FA and R2-
substituted ClFA (Figure 51) The ClFA molecule has one global minimum at 14838deg
in addition to the local minimum at 3586deg while FA has two global minima at 3894deg
and 14471deg (Figure 511) There is one potential maximum that varies slightly between
the molecules for the planar conformation (as drawn in Figure 51) there is a second
maximum when the aromatic rings are approximately perpendicular and there is a third
where there is a significant steric clash for the R1-substituted fenamates TA and MA as
the other planar conformation is approached An analysis of the observed values of this
torsion angle in experimental crystal structures containing the fenamate fragment shows
that the observed angles were clustered around the two minima (Chapter 4 Figure 412)
a finding that is consistent with the expectation that most molecules adopt low-energy
conformations in crystal structures208 Hence the two low-energy barriers although only
~5-9 kJ mol-1 clearly have a major effect on the crystal packing Indeed this
conformational energy is very significant it is large compared with most measured
polymorphic energy differences including those of TA which cover less than 2 kJ mol-1
(Chapter 4)
Figure 511 Relaxed conformational scans at the PBE06-31+G(d) level of theory for the
fenamates The minima were at ξ=3894deg and 14471deg for FA 4063deg and 11186deg for
TA 4408deg and 11048deg for MA and 3586deg and 14838deg for ClFA
53 Results
123
(a) (b)
(c) (d)
Figure 512 Relaxed conformational scans of fenamates (a) FA (b) TA (c) MA and (d)
ClFA at HF and PBE0 method with 6-31+G(d) basis set These are contrasted with the
single-point energies at the MP26-31+G(d) level and within a polarizable continuum
model (PCM) with =3 for the PBE06-31+G(d) conformations
By testing the sensitivity of this conformational profile to the choice of ab initio method
(Figure 512) it becomes clear that even obtaining a conformational profile that is in
qualitative agreement with the profile derived from experimental crystal structures is
sensitive to method The SCF scan has only one minimum as seen in Figure 512 at a
conformation that was not observed in the crystal structures of fenamates (section 433
Figure 412) If the CSP study of Chapter 4 were based on a SCF conformational profile
the crystal structures generated for FA and TA would have been qualitatively incorrect
Therefore it is essential that the ab initio methods include some description of the
electron correlation that produces a maximum at around 90deg Although there is moderate
agreement on the barriers to conformational change for TA and MA it is notable that
single-point MP2 calculations swap the relative energy positions of the two minima
(Figure 512) The PBE0 calculations are in better agreement with the analysis of the
53 Results
124
crystalline conformations of fenamate-like fragments with a substituent at C13 (Chapter
4)
The scans carried out within PCM with =3 showed a reduction in energy penalty
around the energy maxima (ξ~90deg) for all three fenamates (Figure 512) This reduction
is more pronounced for TA and MA around the local minima (ξ~110deg) than it is for FA
This finding suggests that the effect of solution or the crystalline environment the method
used for generating the final energy landscapes of FA and TA in Figure 414 of section
436 does not qualitatively change the conformational profile Hence the clustering of
observed torsion angles in fenamate crystal structures around the minima is not an artefact
of the neglect of the environment (Figure 412 in section 433) The results shown in
Figure 512 confirm that the definitive ab initio conformational profiles cannot be
obtained Nonetheless the scans in Figure 511 are adequate for the purposes of this study
534 Rigid Versus Relaxed Scans of Fenamates To establish the importance of changes in the other torsion angles bond angles and
bond lengths during the relaxed scans in Figure 511 the conformation scans were
repeated for the three fenamates starting with the fully optimized structure at the PBE06-
31+G(d) level of theory Only torsion angle was allowed to vary which meant that each
point had an identical conformation for all three ab initio methods (HF MP2 and PBE0)
The difference between rigid (solid lines in Figure 513) and relaxed (dotted line in Figure
513) scans was very marked for all the fenamates even in the lowest energy regions
where the changes in the benzoic acid ring and the intramolecular hydrogen bond were
small
53 Results
125
Figure 513 Comparison of relaxed (solid) and rigid (dotted line) scan of FA (top) TA
(middle) and MA (right) For the rigid scans calculations were performed using HF MP2
and PBE0 methods with 6-31+G(d) basis set as a function of torsion angle The relaxed
scans from Figure 511 were performed at the PBE06-31+G(d) level of theory
53 Results
126
0deg 80deg 110deg
Figure 514 Overlay of relaxed (coloured by element Figure 511) and rigid (red Figure
513) conformations of FA (top) TA (middle) and MA (bottom) overlaying the atoms
defining the ξ torsion angle at the PBE06-31+G(d) level of theory
Figure 514 shows a comparison of the rigid and relaxed conformations at the repulsive
barrier and the second minimum for FA TA and MA For TA the differences in the
relaxed and rigid scan conformations are very marked around the energy maxima (Figure
514 ξ=80deg) even though these maxima are less than 7 kJ mol-1 in the relaxed scans
(Figure 513) For FA there is a significant change in the relative orientation of the
benzoic acid group changing the internal hydrogen bond around all maxima The methyl
torsion is clearly playing a role in reducing the energy penalty around the 90deg maximum
for TA and MA (Figure 514) Indeed even for FA the changes in the other
conformational variables are vital to produce a low energy maximum at 90deg to the extent
that it is not surprising that even the relaxed scans differed in this region producing the
slight asymmetry between the two minima (Figure 511)
The contrast between the relaxed and rigid (Figure 513) scans and the corresponding
conformations (Figure 514) confirm that the changes in the other conformational
variables played a major role in lowering the conformational barriers providing low
values over a wide range of angles as implied by the crystallographic data (Chapter 4)
53 Results
127
535 Splitting electronic from steric contributions to the barrier to rotation
(a) (b)
(c) (d)
(e) (f)
Figure 515 The solid black lines show the relaxed torsional scans of planar-N-
constrained models for the phenyl rotation (Figure 56) where the benzoic acid group of
FA has been replaced by (a) hydrogen atom (PA) (b) methyl (c) vinyl and (d) prop-2-
enoic acid and the hydrogen in the meta position of PA has been replaced by (e) chlorine
and (f) methyl using HF PBE0 and MP2 methods with the 6-31+G(d) basis set Plots of
(h2)(1-cos(2)) where h is the height of the barrier of relaxed PBE06-31+G(d) scans
are shown in green For (c)-(f) the PBE06-31+G(d) relaxed scans of PA from (a) are
shown in grey for comparison In (a) and (b) a rigid scan at the PBE06-31+G(d) level of
theory is shown by a dotted line
53 Results
128
To establish the importance of the intramolecular steric clashes the rigid and relaxed
scans were repeated with model molecules that replaced the benzoic acid group of FA
with smaller fragments and the bonds around the nitrogen constrained to be planar (Figure
56) in order to avoid the pyramidalization of the amine (Figure 57) The potential energy
scan has a very large maximum at 90deg for planar-N-constrained phenylamine (PA)
approximately 6 times higher than the barrier in the fenamates (reflected in the scale
change between Figure 515a and Figure 511) Replacing one constrained hydrogen with
a methyl (Figure 56) produces a slightly larger barrier but very little asymmetry strongly
suggesting that this is an electronic effect of conjugation between the lone pair on the
nitrogen and the aromatic ring
Adding a double bond to PA reduces the barrier to rotation by 1110 kJ mol-1 (Figure
515c) Adding a carboxylic acid that forms an intramolecular H-bond to the N-H group
further reduces this barrier by almost 7 kJ mol-1 (Figure 515d) These observations imply
that the conjugation of the benzoic acid ring of the fenamates contributed significantly to
reducing the electronic barrier The intramolecular hydrogen bond in this model molecule
(Figure 515d) varies in length from 194 to 192 Aring as changes from 0 to 180deg by
comparison the FA hydrogen bond varies from 187 to 184 Aring Thus it is evident that the
intramolecular H-bonding in the fenamates reduces the electronic barrier In contrast
substituting Cl and CH3 at the meta position of PA (Figure 515e and f) shows little change
to the barrier height with half-height (h2) values of 3-chloroaniline (185 kJ mol-1) and
3-methylaniline (178 kJ mol-1) representing only a small increase over that of PA (176
kJ mol-1)
The scans in Figures 515a b e and f have no maxima at 0 or 180deg confirming that
the steric clash between the aromatic C6-H and C13-R1 (Figure 51) of the phenyl ring is
responsible for this maximum These curves are very well reproduced by ((h2)(1-
cos(2ξ)) where h is the potential maximum As the nitrogen substituents (Figures 515c
and d) get larger there are signs of additional steric effects particularly at the MP2 level
suggesting more changes in intramolecular dispersion The difference between a rigid
scan and a relaxed one is small (Figures 515a and b) and the differences in the curves
according to the type of calculation are relatively minor compared with the qualitative
differences between the HF and correlated methods for the fenamates (Figure 512) From
contrasting the conformational scans of model molecules with minimal steric effects
(Figure 515) with those of the fenamates (Figure 511) the overriding conclusion is that
there is an electronic contribution to the torsional barrier at =90 which can be
53 Results
129
represented by a (h2)(1-cos(2ξ)) term where h is the maximum energy from the
electronic contribution
There is a dramatic change in the HOMO isosurfaces of the phenyl ring with torsion
angle (Figure 516) which is remarkably similar between PA and the fenamates FA and
TA This finding suggests that the electronic contribution observed for PA is fundamental
to the fenamates The destructive interference of the MOs at =90 (Figure 516 and
Figure 517b) is the origin of the huge torsional barrier that is seen in each of the model
molecules in Figure 515 The smaller torsional barriers after adding a double bond
(Figure 515c) and acidic (Figure 515d) substituents to PA (Figure 515a) was a result of
increased electron delocalisation (compare Figure 517a with Figure 517b)
0deg 40deg 90deg
Figure 516 The electron density surface of HOMO frontier orbitals for different
conformations of PA (top) FA (middle) and TA (bottom) obtained from the PBE06-
31+G(d) level of theory Contour map isovalues were drawn at a 002 au level
(a) (b)
Figure 517 Alternative HOMO isosurface view of (a) FA and (b) PA molecule at =90
from Figure 516
My attempt at modelling delocalisation over the entire FA molecule even for the lowest
occupied orbital failed (Figure 518) which suggests that a completely flat model of
53 Results
130
FA ( = 0) is unrealistic This is because of the huge steric barrier (Figure 513) of a planar
conformation and the linear combinations of atomic orbitals in many molecular orbitals
are sensitive to conformation The electronic effects are not well defined for TA ie no
Figure 518 equivalent for TA due to the bulky substituent hence excluded in the analysis
= 0 = 40 = 90
Figure 518 HOMO-10 (46 MOs) isosurface view of side (top) and front (bottom) FA
molecule at =0 40 and 90
The MOsrsquo picture can only give a qualitative guide to the electronic contribution
because it is not possible to have an aromatic substitution at R2 or a methyl group
substitution on C13 (as in MA and TA) without steric interactions At present
independently investigating how the electronic barrier varies among the fenamates is not
possible However it is clear from Figure 515 that whilst the benzoic acid substituents
will have a dramatic effect on lowering the barrier the meta-substitution of chlorine and
methyl on the phenyl ring has a much smaller effect on the barrier
536 Estimating the Steric Contributions with an Atom-Atom Potential The steric effects of FA and TA can be analysed by using Gavezzottirsquos parameters
(Table 52) to produce a conformational profile (see Figure 519) which can then be
subdivided into the repulsion (Aexp(minusBRik)) and dispersion (minusCRik6) contributions
This subdivision (Figure 519) suggests that the repulsion terms dominate producing
maxima at 0 and 180deg and minimum at 90deg a finding that is consistent with the
supposition that these maxima occur because of steric clashes However the repulsions
are severely overestimated The dispersion contribution gives a maximum at ~90deg
which is of the same order of magnitude as the ab initio maxima particularly for FA This
confirms the observation from Figure 512 that electron correlation the origin of
dispersion interactions makes a significant contribution to this maximum supplementing
53 Results
131
the electronic effect (cf Figure 515) The difference between TA and FA in Figure 519
is consistent with the large dispersion interaction of the Cl substituent as well as the
repulsion from the methyl substituent
Figure 519 Comparison of the ab initio (black) intramolecular energy scans at the
PBE06-31+G(d) level of theory for FA (top) and TA (bottom) with Gavezzottirsquos exp-6
intramolecular energy models summed over all intramolecular atom-atom distances from
the third nearest neighbour (1-4) and above The net effect (purple) is subdivided into the
repulsive (red) and dispersion (blue) contributions
537 Investigating the Important Interactions with Atom-Atom Potential For FA and TA the dominant interactions involve C H and HB (Table 56) while the
dominant interactions involving N and Cl (Table 57) were exclusive to TA Although FA
and TA have the N atom only TA has the methyl substituent (N1∙∙∙C14 f and N1∙∙∙H12
f
Table 57) Of all the dominant interacting atoms for FA and TA only Cl of TA interacts
with atoms (methyl substituent) belonging to the same aromatic ring (dfC14∙∙∙Cl1
dfCl1∙∙∙H10 and dfCl1∙∙∙H11 Table 57) These results confirm the observation that the
53 Results
132
methyl substituent plays a role in reducing the energy penalty for TA (section 534
Figure 514)
Table 56 Atom-atom interactions of FA that dominate the intramolecular energies as
estimated using Gavezzottirsquos exp-6 potential The interaction is listed as dominant if the
difference between the minimum and maximum total energy (Erepul-dis) is greater than or
equal to 1 kJ mol-1
ati∙∙∙atk neigh RikkJ mol-1 ErepulkJ mol-1 EdispkJ mol-1 Erepul-dispkJ mol-1
min max(∆) min max(∆) Min max(∆) min max(∆)
C7∙∙∙C9 4 307 371(064) 057 533(476) -289 -092(196) -035 245(280)
C7∙∙∙C13 4 307 371(064) 057 532(475) -288 -092(196) -035 244(279)
C6∙∙∙C9 5 310 443(133) 005 475(470) -270 -032(239) -039 205(243)
C6∙∙∙C13 5 311 444(133) 005 468(463) -268 -032(236) -039 200(238)
C6∙∙∙H7 6 252 488(236) 000 398(398) -186 -003(182) -021 212(233)
C8∙∙∙H5 5 254 288(034) 089 357(268) -175 -083(092) 007 182(176)
C9∙∙∙H5 6 257 416(159) 000 317(316) -163 -009(154) -020 154(174)
H5∙∙∙H7 7 208 476(268) 000 578(578) -135 -001(134) -004 443(447)
C13∙∙∙HB6 4 251 330(078) 016 403(387) -187 -037(151) -021 216(236)
HB6∙∙∙H11 5 230 368(138) 001 240(239) -074 -004(070) -004 166(170)
C6∙∙∙H8 4 289 310(020) 485 985(500) -412 -274 (138) 212 573(362)
C6∙∙∙H11 6 252 488(237) 000 396(396) -185 -003(182) -020 211(231)
C13∙∙∙H5 6 257 417(159) 000 314(314) -162 -009(153) -020 152(172)
H5∙∙∙H11 7 209 476(267) 000 548(548) -130 -001(129) -004 418(422)
C9∙∙∙HB6 4 251 330(079) 016 406(390) -188 -036(152) -021 218(238)
HB6∙∙∙H7 5 230 369(139) 001 238(237) -074 -004(069) -004 164(169)
Table 57 Atom-atom interactions of TA that dominate the intramolecular energies as
estimated from Gavezzottirsquos exp-6 potential The interaction is listed as dominant if the
difference between the minimum and maximum total energy (Erepul-dis) is greater than or
equal to 1 kJ mol-1 dInteractions between atoms on the same aromatic ring fInteractions
involving the methyl substituent
ati∙∙∙atk neigh RikkJ mol-1 ErepulkJ mol-1 EdispkJ mol-1 Erepul-dispkJ mol-1
min max(∆) min max(∆) min max(∆) min max(∆)
C7∙∙∙C9 4 302 361(059) 081 630(549) -317 -109(209) -028 313(340)
C7∙∙∙C13 4 314 372(058) 056 417(361) -252 -091(161) -035 165(201)
C6∙∙∙C9 5 308 412(104) 014 513(499) -282 -050(233) -039 231(269)
C6∙∙∙C13 5 324 444(119) 005 292(287) -207 -032(176) -039 085(123)
C6∙∙∙H7 6 248 445(197) 000 458(458) -202 -006(196) -020 256(276)
C8∙∙∙H5 5 254 289(035) 086 363(277) -176 -081(095) 005 187(182)
C9∙∙∙H5 6 260 369(109) 003 286(283) -154 -019(135) -021 132(153)
H5∙∙∙H7 7 214 418(204) 000 451(450) -113 -002(111) -004 337(342)
C13∙∙∙HB6 4 254 322(068) 022 364(341) -176 -043(134) -020 187(207)
HB6∙∙∙H11f 6 219 450(231) 000 364(364) -098 -001(096) -004 266(271)
HB6∙∙∙H12 f 6 228 315(087) 008 254(246) -077 -011(066) -003 177(180)
C6∙∙∙C8 4 289 310(021) 485 995(511) -414 -273(141) 211 581(370)
C6∙∙∙C14 f 6 310 510(200) 000 482(482) -273 -014(259) -039 210(248)
C7∙∙∙C14 f 5 312 414(102) 013 455(442) -264 -048(216) -039 191(230)
C7∙∙∙H12 f 6 255 385(130) 002 344(342) -171 -014(156) -020 173(194)
N1∙∙∙C14 f 4 278 298(021) 487 1081(594) -607 -395(212) 093 474(382)
N1∙∙∙H12 f 5 243 262(019) 162 385(222) -243 -154(088) 008 142(134)
dfC14∙∙∙Cl1 4 304 311(007) 688 875(187) -488 -427(061) 261 387(126) fC14∙∙∙HB6 5 241 371(130) 003 618(615) -241 -018(223) -021 377(397) dfCl1∙∙∙H10 5 257 324(068) 051 813(762) -410 -100(309) -049 404(453) dfCl1∙∙∙H11 5 269 374(105) 007 489(483) -308 -042(266) -050 181(231)
54 Discussion The Physical Origins of Torsional Potentials
133
Analysis of which particular atom-atom interactions vary most with conformation
(Table 56 and Table 57) reveals that intramolecular interactions involving the N-H
proton type HB as well as certain aromatic and TA methyl protons type H vary strongly
with conformation as expected based on Figure 514 Therefore the poorly determined
parameters for HB and H strongly affect the energy profiles of Figure 519
54 Discussion The Physical Origins of Torsional Potentials The torsional barriers for fenamates apart from gt 140 are smaller than for PA and
ethane For the fenamates the difference in energy penalty arises from the high degree of
conjugation between the two aromatic rings of the fenamates via ∙∙∙ overlap involving
the lone pair of electrons of the N atom (Figure 516)234 This conjugation effect is absent
for ethane and reduced for PA because these have just one aromatic ring It is clear that
compared to PA the barrier to rotation reduces as the model molecules tend toward two
aromatic rings These observations confirm that the delocalisation of electrons plays a
role in the origin of the torsional barrier for fenamate molecules FA and TA
The maximum at = 90 (Figure 515) is due to dispersion effects The investigation
of different methods for producing conformational profiles demonstrates the importance
of accounting for correlation effects For example the HF method is hopeless for
reproducing the correct conformation profiles around the minima for fenamate molecules
FA TA MA and ClFA (Figure 512) because the method excludes the correction effects
Therefore it is vital that methods of examining the conformational profiles include the
correlation effects This is most important in CSP where accurate ranking of generated
crystal structures depends upon accurately evaluating the energy penalty contribution to
the total lattice energy (equation 51)
Although the conformational profiles are dependent on specific atoms that define
flexible torsion (Figure 58) the comparison of the rigid and relaxed scans shows the
important role that the atomic positions of other atoms play (Figure 513 and Figure 514)
during relaxation For example during the relaxation of TA methyl rotation plays a role
in reducing the energy penalty and barrier to rotation (section 534) The enormous
difference between the relaxed and rigid conformational profiles (Figure 513) and their
conformers (Figure 514) suggests that the atomic positions of most atoms in a molecule
during relaxation are important Consequently we can conclude that the origin of the
torsional barrier involves most atoms in a molecule
By analysing the low-energy torsional barriers in fenamates (Figure 511) it has
become clear that larger organic molecules retain the contributions as identified for small-
55 Summary
134
model molecules such as ethane There is both an electronic and a steric component to
these torsional barriers in fenamates However as the model molecules become larger
the effects of small correlated changes in the other bond angles and the dispersion
contributions become very significant (Figure 515c and d) As the size of the molecule
increases in both the number of atoms and the electron density there is an increasing
contribution to the torsional profile from the intra-molecular equivalent of the
intermolecular dispersion
Separating the ldquothrough spacerdquo intramolecular dispersion from the other electron
correlation effectsmdashspecifically those that contribute to the (h2)(1-cos(2)) electronic
barrier from ldquoconjugationrdquo or delocalization between the two aromatic ringsmdashis unlikely
to be meaningful when using an ab initio method that is still approaching the quantitative
accuracy needed
55 Summary I could not use the definitive ab initio torsional potential for each fenamate as the
torsional potentials of organic molecules containing aromatic rings are very demanding
of the electronic structure method used However PBE0 method and 6-31+G(d) basis set
were sufficient to investigate the origin of the barrier to rotation for FA and TA
The analysis of the fenamatesrsquo torsional potential reveals that like the classical small-
molecule torsional potentials of ethane there is both an electronic effect (loosely
described as changes in MOs involving ∙∙∙ between the aromatic rings and the nitrogen
lone pair destabilizing the non-planar conformations) and a steric effect from the variation
in overlap of non-bonded atoms For larger molecules like the fenamate molecules the
intramolecular dispersion and small changes in the other conformational variables also
make significant contributions to the torsional profile
When the aromatic rings are perpendicular to each other the destructive interference of
MOs creates an intrinsic barrier The two rings in fenamate molecules stabilise the
expected high-energy barrier A cos2 term accurately represents the torsional barrier of
model molecules with minimal steric effects that have been constrained to prevent
pyramidalization Finally this chapter showed that the torsional barriers for FA and TA
depend on small correlated changes in degrees of freedom other than the most flexible
torsion We observed this by contrasting the conformations and their corresponding
energies of rigid scans against relaxed scans for FA and TA
The origin of the torsional barrier of fenamates is therefore a combination of intrinsic
intramolecular dispersion electronic contribution and the steric repulsion A new
55 Summary
135
analytical form for intramolecular energies (Chapter 6) of fenamates that is physically
justified must incorporate these origins and account for small correlated changes among
different conformations
61 Introduction
136
Chapter 6 Toward New Force fields for Fenamate Molecules
ldquoAvoid complexities Make everything as simple as possiblerdquo
mdash Henry Maudslay
61 Introduction
611 Background Force field methods (section 25) for calculating a systemrsquos energy ignore electronic
motions and instead calculate the systemrsquos energy as a function of the nuclear positions
alone63 Such force field methods are less computationally demanding than quantum
mechanical calculations but they cannot predict properties that depend upon a moleculersquos
electronic distribution In addition the limitations of electronic structure calculations as
discussed in Chapters 2 (section 27) and 4 (sections 438 and 439) suggest the need
for a new analytical model that can combine the accuracy of electronic methods and the
speed of force field methods This chapter proposes a solution to this problem
In general force field methods are based on two important components (i) the
functional form of the potential energy functions and (ii) the parameterisation of these
functions235236 In Chapter 5 I investigated the first component the origin of the torsional
barrier for fenamate molecules For small molecules that were constrained to have
minimal steric clashes the origin is mainly an electronic effect and can be expressed as a
cos2ξ term However for larger molecules like fenamic (FA) and tolfenamic acids (TA)
there are additional correlated changes namely the repulsion and dispersion effects
Chapter 5 by investigating these contributions with an exp-6 term dealt with the first
component required for building a force field
The present chapter deals with the second component of force fields re-
parameterisation In this chapter I will derive an analytical model for FA and TA (Figure
61) by fitting the conformational profiles (Figure 511) to analytical expressions
discussed in Chapter 5 One of the key conclusions of Chapter 5 was that definitive ab
initio conformational energy scans could not be obtained However the ab initio scans at
the PBE06-31+G(d) level of theory (Figure 511) are adequate for the purposes of
creating a new analytical model
61 Introduction
137
1
6
2
1
9
1
1
813
7
16
Figure 61 The fenamate family showing the low-barrier torsion angle (=C7-N1-C8-C9)
and atomic numbering =0 when the aromatic rings are coplanar as drawn The
fenamates mentioned in this chapter are fenamic acid (FA) R1= R2= H tolfenamic acid
(TA) R1= CH3 R2= Cl mefenamic acid (MA) R1= R2= CH3 flufenamic acid (FFA) R1=
H R2= CF3 and clorofenamic acid (ClFA) R1=H R2=Cl The dotted line represents an
intramolecular hydrogen bond
Figure 62 Relaxed conformational scans at the PBE06-31+G(d) level of theory for the
fenamates from section 533 Fenamic acid (FA) tolfenamic acid (TA) mefenamic acid
(MA) and chlorofenamic acid (ClFA)
612 A Case for Modelling Decoupled Intramolecular Energy For challenging applications involving molecular recognition of pharmaceuticals such
as computer-aided drug design the importance of an accurate balance of intermolecular
and intramolecular forces cannot be overemphasized93 The success of CSP studies17127
(Chapters 3 and 4) and the limitations of current force field (section 254) and electronic
structure methods (sections 27 and 439) suggest decoupling the models for the
intermolecular forces from those for the intramolecular forces (ie conformational
61 Introduction
138
changes) as a means of more accurately modelling force fields for pharmaceutical
molecules should be attempted
613 Analytical Models of Intramolecular Energies Traditional force field modelling includes an explicit torsional term237 of the general
form
where defines the phase shift and n the periodicity For FA as defined in Figure 61
requires that = 0 and the near-symmetry dictates that n is an even integer For
substituted fenamates odd values of n could contribute although the conformational
profile should be symmetric about = 0
Non-bonded atomndashatom interactions should be able to represent the intramolecular
energies well if the origin of the conformational profile is predominantly steric (caused
by the varying repulsion between the overlapping charge distributions of 1-4 atoms with
) An exp-6 atomndashatom model (Chapter 5) would be expected to give a better
representation than a Lennard-Jones (R-12) model of the variation of the repulsion with
distance given the success of the overlap model in parameterizing intermolecular
repulsion potentials238239 Thus a crude starting point for my investigation of the ldquonon-
bondedrdquo contribution to the torsion potential is the exp-6 atomndashatom model potential with
a parameterization that was developed for modelling the intermolecular forces between
organic molecules in crystal structures42231
where atoms i and k of atomic types and are separated by intramolecular distances Rik
calculated from the molecular conformation with torsion angle ξ This functional form
with no assumed relationship between the like (and ) and unlike () interactions
means that the parameters (A B and C) have at least partially absorbed the
electrostatic effects in fitting This chapter seeks to re-parameterize the equations of the
origin of torsional potential (equations 61 and 62) in order to derive analytical models
that accurately represent the conformational profiles of fenamic (FA) and tolfenamic
acids (TA)
614 Overview The goal of this chapter is to develop a generalizable method that uses a FORTRAN
code to derive analytical models for the conformational profiles of FA and TA This
( ) [1 cos( )]2
nVE n 61
6
( ) exp( )ik ik
i k
E A B R C R 62
62 Methodology Fitting Analytical Models to Conformational Profiles
139
chapter will investigate three analytical forms the cosine series rescaling repulsion and
combined physical models Each of these new analytical forms will have different
parameters for intramolecular and intermolecular contributions I will discuss the
methodology of fitting analytical models to conformational profiles and test the
transferability properties of the combined physical models for FA and TA to other
fenamate molecules (Figure 61)
This chapter will show that the cosine series and rescaled repulsion models are
inadequate for modelling the conformational energy profiles of fenamates More
importantly this chapter will show that combining a cos2 term to represent the
electronic barrier with an intramolecular atomndashatom exp-6 repulsion-dispersion term for
all atom pairs separated by three or more bonds (bond-paths ge 1-4) allows a very effective
representation of the ab initio conformational energies
62 Methodology Fitting Analytical Models to Conformational Profiles The only weighting applied to the conformational profiles of all the fenamate molecules
(Figure 511 at the PBE06-31+G(d) level of theory) in this chapter was the restriction of
conformational energies to 10 kJ mol-1 or below This weighting was appropriate because
this chapter does not seek to represent the steric barrier above 145deg for TA (and MA)
accurately Hence this chapter considers Np = 37 points for the FA and Np = 30 points for
TA (and MA) Because the definition of the ab initio energies Eab are relative to the
lowest energy conformation for each molecule the analytical modelrsquos energies Emodel
were adjusted by a constant Ebase such that the lowest energy conformation of both the
ab initio and analytical model were zero The algorithms (Figure 63 and Figure 64) in
this chapter fit a constant c that matched the overall conformational curves rather than
the minima As such c differs from Ebase by a fraction of a kJ mol-1 The standard error
σintra in Emodel was
where Np and Nk are the number of data points and fitted coefficients respectively
However there were only Nk -1 physical parameters as one (c ~ Ebase) served only to
adjust the baseline
621 Torsional Potential Model The explicit torsional term (equation 61) can be simplified as the following cosine
series
2
mod
int
ab el
ra
p k
E E
N N
63
62 Methodology Fitting Analytical Models to Conformational Profiles
140
where Nk and Np are the number of fitted coefficients and data points respectively The
intercept c is 0 Using the linear least squares method (section 26) the cosine series
(equation 64) were fitted to the conformational profiles of FA and TA (Figure 511) to
determine the unknown coefficients k Below is a flowchart of the cosine series
algorithm (Figure 63)
Figure 63 An algorithm showing the overview of modelling ab initio intramolecular
energy using a cosine series potential The source codes are included in the CD ROM
attached to this thesis (see Appendix A)
In the initialization step (step 1) the algorithm required the ab initio intramolecular
energies and the inputs of their equivalent torsion angles (Figure 511) These inputs
(generated from the ab initio scans reported in Chapter 5) were used to construct a
regression model (step 2) The G02DDFE97 NAG subroutine (section 262) solved the
resulting linear regression problem that is the unknown coefficients k were
determined Finally the standard error σintra of the modelled intramolecular energy
Emodel (equation 63) was calculated
0
( ) cos( 1 ) 5 1kN
k k p
k
E k N N
64
62 Methodology Fitting Analytical Models to Conformational Profiles
141
622 AtomndashAtom Model Due to the considerable correlation between the atomndashatom coefficients particularly
the two repulsion parameters (A and B) it is difficult to vary both repulsion parameters
simultaneously240241 This section discusses the derivation of analytical atomndashatom
models for conformational profiles of FA and TA as expressed in the algorithm shown
in Figure 64 In particular this section discusses the rescaling of selected repulsion (and
dispersion) coefficients which gives a linear model that contains (an appropriate cosine
term and) a baseline constant c
Figure 64 An algorithm showing the modelling of ab initio intramolecular energy by a
physical potential The source codes are included in the CD ROM attached to this thesis
(see Appendix A)
This algorithm (Figure 64) which uses NAG129 library routines shows the systematic
comparison of how well various selections of linear parameters ( and c) can
represent the conformational profiles of fenamates The algorithm first extracted the
geometries and the corresponding intramolecular energies of the fenamate molecules
which were generated from ab initio calculations These geometries were converted to an
atomic type-friendly mol2 format (Sybyl typing230) using the Babel242 chemical toolbox
The other inputs are the starting values of Gavezzottirsquos atomndashatom exp-6 potential
parameters41231232 (Table 52 of Chapter 5) The covalent 1-1 connectivity (from the mol2
file) helped to distinguish the polar hydrogen HB from the non-polar hydrogen H
atoms The remaining atomndashatom connectivity (ie nearest neighbour or bond-path) and
6
( ) cos(2 ) exp( )ik ik
i k
E A B R C R c 65
62 Methodology Fitting Analytical Models to Conformational Profiles
142
distances Rik within the molecule were determined using the H03ADF subroutine and
the 1-1 connectivity H03ADF subroutine evaluates the nearest neighbour by finding the
shortest path between two atoms
Next the atom-atom interactions were summed over all 1-4 atom-atom distances and
higher bond-paths in the entire molecule (equation 65) The maximum bond-path was 1-
11 for all three fenamates and most pharmaceutical molecules were sufficiently small
that there was no need to define a summation limit in terms of intramolecular distance or
bond-path length for a single molecule The use of 1-4 distances as the shortest
intramolecular interactions included in the atomndashatom summation was traditional
Although it should be noted that 1-3 interactions were used elsewhere eg in the CSP
code of GRACE where they have sometimes been found to be problematic including the
recent case of a bulky side group attached to an aromatic ring which required specific
scaling down13 The atomndashatom formulation resulted in many virtually constant terms
such as the H∙∙∙H C∙∙∙C and H∙∙∙C contributions from within the aromatic rings These
terms contributed to the baseline energy Ebase defined as the minimum energy found in
the scan with a specific parameterized model
The atomndashatom model involved far too many coefficients for all to be fitted
independently to the ab initio data In addition many atomndashatom distances did not change
significantly with the torsion angle as observed from investigating the atomndashatom
interaction that dominated the intermolecular contribution in Chapter 5 There were only
16 and 21 dominant interactions out of 351 and 435 total atomndashatom interactions for FA
and TA Therefore only interactions that were classed as dominant were rescaled The
algorithm in Figure 64 determined the dominant interaction by using a cut-off value of
one ie Ecutoff = 1 kJ mol-1 The dominant atomndashatom interactions for FA and TA were
reported in Chapter 5 (Table 66 and Table 57) which are summarised in Table 61 If
atomndashatom interaction of a given type (∙∙∙) varied less than the Ecutoff (for example Cl∙∙∙O
and O∙∙∙HB) then these parameters were not rescaled but may vary the contribution to
Ebase One notable observation was the significant interaction between atoms of the same
aromatic ring for TA (Table 61d) which was absent in FA
62 Methodology Fitting Analytical Models to Conformational Profiles
143
Table 61 Contrasting the atomndashatom interactions of FA and TA that dominated the
intramolecular energies formed by combining Table 56 and Table 57 from Chapter 5
Interactions unique to FA and TA are coloured blue and red respectively dInteractions
between atoms of the same aromatic ring fInteractions involving the methyl substituent
FA TA FA TA ati∙∙∙atk neigh RikkJ mol-1 RikkJ mol-1 Erepul-dispkJ mol-1 Erepul-dispkJ mol-1
min max(∆) min max(∆) min max(∆) min max(∆) C∙∙∙C
C7∙∙∙C9 4 307 371(064) 302 361(059) -035 245(280) -028 313(340)
C7∙∙∙C13 4 307 371(064) 314 372(058) -035 244(279) -035 165(201)
C6∙∙∙C9 5 310 443(133) 308 412(104) -039 205(243) -039 231(269)
C6∙∙∙C8 4 289 310(021) 211 581(370)
C6∙∙∙C13 5 311 444(133) 324 444(119) -039 200(238) -039 085(123) fC6∙∙∙C14 6 310 510(200) -039 210(248) fC7∙∙∙C14 5 312 414(102) -039 191(230)
C∙∙∙H fC7∙∙∙H12 6 255 385(130) -020 173(194)
C6∙∙∙H7 6 252 488(236) 248 445(197) -021 212(233) -020 256(276)
C6∙∙∙H8 4 289 310(020) 212 573(362) C6∙∙∙H11 6 252 488(237) -020 211(231) C8∙∙∙H5 5 254 288(034) 254 289(035) 007 182(176) 005 187(182)
C9∙∙∙H5 6 257 416(159) 260 369(109) -020 154(174) -021 132(153)
C13∙∙∙H5 6 257 417(159) -020 152(172) H∙∙∙H
H5∙∙∙H7 7 208 476(268) 214 418(204) -004 443(447) -004 337(342)
H5∙∙∙H11 7 209 476(267) -004 418(422) C∙∙∙HB
C13∙∙∙HB6 4 251 330(078) 254 322(068) -021 216(236) -020 187(207)
C9∙∙∙HB6 4 251 330(079) -021 218(238) C14∙∙∙HB6 5 241 371(130) -021 377(397)
HB∙∙∙H
HB6∙∙∙H11 5 230 368(138) -004 166(170) HB6∙∙∙H7 5 230 369(139) -004 164(169)
fHB6∙∙∙H11 6 219 450(231) -004 266(271) fHB6∙∙∙H12 6 228 315(087) -003 177(180)
N∙∙∙C fN1∙∙∙C14 4 278 298(021) 093 474(382)
N∙∙∙H fN1∙∙∙H12 5 243 262(019) 008 142(134)
C∙∙∙Cl fC14∙∙∙Cl1 4 304 311(007) 261 387(126)
Cl∙∙∙H dfCl1∙∙∙H10 5 257 324(068) -049 404(453) dfCl1∙∙∙H11 5 269 374(105) -050 181(231)
63 Results
144
These atomndashatom interactions were grouped into unique atom-type∙∙∙atom-type sets
(∙∙∙) The algorithm then systematically fit different subsets of the ∙∙∙rescaling
parameters using combination mathematics243 Eg for interactions C∙∙∙H C∙∙∙HB and
H∙∙∙HB the following seven subsets of interactions were rescaled
1 C∙∙∙H or C∙∙∙HB or H∙∙∙HB
2 C∙∙∙H and C∙∙∙HB or C∙∙∙H and H∙∙∙HB or C∙∙∙HB and H∙∙∙HB
3 C∙∙∙H C∙∙∙HB and H∙∙∙HB
For each fit the subroutine G02DDFE97 (section 262) calculated the Nk coefficients
( c) being fitted and minimized the residual sum of squares (RSS) using a
general linear regression model244 Within the routine a matrix decomposition process
established whether a solution was unique or whether the parameters were linearly
dependent and therefore had no unique solution Unless otherwise noted all fits reported
in this chapter had a unique solution Finally the standard error intra in the modelrsquos
intramolecular energy was calculated after adjusting the minimum to 0 kJ mol-1 (equation
63)
This chapter used the method discussed above to investigate two analytical models
(1) Rescaling only the repulsion contribution of the atomndashatom exp-6 potential ie
equation 65 with and set at 0 and 1 respectively
(2) Rescaling all the parameters ie equation 65
63 Results
631 Cosine Series Model The traditional cosine series expansion for a torsional potential (equation 64) must
include cos4 to have the correct number of minima for the fenamates Alone this term
gave a poor position of the minima for FA and it was qualitatively wrong for TA (Figure
65) A least squares fit that included the lower cosine terms (Nk=5 equation 64) gave a
qualitatively reasonable representation (Figure 65) but further improvement is slowly
converging (Figure 66) For FA the fitting steadily improved in quality particularly
upon the addition of cos4n terms where n are integers For TA the fitting became
unstable after 21 terms even though there was no attempt to represent the large steric clash
beyond 10 kJ mol-1
This result demonstrated that the cosine series was a fitting exercise and did not reflect
the physics It was effectively an exercise in modelling the relaxed scans by a functional
6
( ) exp( )ik ik
i k
E A B R C R c 66
63 Results
145
form that assumed the scan was rigid (ie only the torsion angle changed) This
assumption is a crude approximation since rigid scans are different from relaxed scans
(see Figure 513) Poor convergence of the cosine model expansion were also reported
for biphenyl245 a dye which required 7 terms while polynorbornene246 required 6 and 15
terms for the meso and racemic dimer respectively
Figure 65 Comparison of the ab initio relaxed scan at the PBE06-31+G(d) level of
theory with linearly fitted least square cosine series model for FA (top) and TA (bottom)
with Nk=5 (red lines) the optimal cos4 terms (blue lines) and Nk=21 (green lines σintra
=017 kJ mol-1 for FA and TA)
63 Results
146
Figure 66 Plot of the standard error of the intramolecular energies against the number of
cosine terms Nk for FA (top) and TA (bottom) The fit is ill-determined ie there is no
unique solution for TA after Nk=21
632 Rescaled Repulsion Model From Chapter 5 it is clear that the repulsion contributions were severely overestimated
for FA and TA with Gavezzottirsquos exp-6 potential Therefore an alternative model is to
rescale just the repulsion terms (ie fit selected in equation 66) as the intermolecular
atomndashatom model clearly overestimated the intramolecular steric effects (Figure 519)
Rescaling just a few of Gavezzottirsquos repulsion parameters for example those involving
the poorly parameterized H∙∙∙H interactions resulted in a qualitatively good fit (Figure
67) as shown by the results for fitting all combinations of repulsion parameters for FA
(Table 62) and the summary in Table 63 of the 511 such fits for TA Rescaling just two
(C∙∙∙H and H∙∙∙H) repulsion contributions for FA and five (C∙∙∙H C∙∙∙HB C∙∙∙N H∙∙∙H and
H∙∙∙HB) for TA produced a model that reproduced the torsional profile well (Figure 67)
63 Results
147
Figure 67 Comparison of the relative energies from ab initio calculations (solid black
lines) of FA (top) and TA (bottom) with selected best-fit exp-6 rescaled repulsion models
For FA the selected Nk=3 intra=032 kJ mol-1 model had βC-H=-453 βH-H=270 and
Ebase=-506 while the Nk =4 intra=027 kJ mol-1 model had βCH=-446 βH-H=210 βH-
HB=257 and Ebase=-875 For TA the selected Nk=6 (intra=034 kJ mol-1) and 10
(intra=022 kJ mol-1) parameter fits are shown bold in Table 63
The rescaling of the C∙∙∙N interaction seemed particularly critical for TA (Table 63)
which can be attributed to the importance of the C(methyl)∙∙∙N interaction in describing
the steric clash involving the methyl group (Figure 514) However many of the fitted
rescaling parameters were negative (which suggested that the exponential steric
repulsion had become attractive Thus again this appeared to be a fitting exercise so that
exponential terms were reducing the over-estimate of the barrier at 90 by the
intermolecular dispersion parameters (Figure 519)
63 Results
148
Table 62 Complete set of results after rescaling Nk (repulsion contributions and
baseline energy Ebase) parameters of various interacting atomic types for FA
ικ Ebase σintra kJ mol-1
Nk C -C C -H C -HB H -H H -HB 2 - -226 - - - 437 168 2 - - -148 - - 1076 284 2 - - - -088 - 2215 287 2 - - - - -423 3579 299 2 -332 - - - - -39948 451 3 - -453 - 269 - -506 032 3 - -428 - - 539 -1511 032 3 -210 -217 - - - -31011 036 3 - -523 365 - - 278 04 3 -523 - -173 - - -62622 045 3 -621 - - -124 - -71356 065 3 -666 - - - -549 -74317 066 3 - - -991 - 2082 -7537 127 3 - - -909 722 - -2278 174 3 - - - -738 1972 -2577 247 4 - -446 - 210 257 -875 027 4 - -467 144 243 - -388 03 4 079 -438 - 258 - -2557 032 4 041 -390 - - 459 -7101 032 4 - -432 109 - 525 -1456 033 4 -173 -254 133 - - -27252 037 4 -458 - -296 - 394 -57220 04 4 -507 - -218 137 - -61133 045 4 -639 - - -035 -157 -72571 064 4 - - -958 006 2275 -7893 125 5 130 -467 - 218 278 2069 028 5 - -448 104 210 251 -849 028 5 236 -591 218 270 - 13231 029 5 -016 -327 037 - 481 -12963 031 5 -456 - -284 061 479 -57209 039 6 208 -550 170 237 225 10068 028
Table 63 Summary table of the best results after rescaling Nk (repulsion contributions
and baseline energy Ebase) parameters of various interacting atomic types for TA
βικ Ebase σintra kJ mol-1 Nk C-C C-Cl C-H C-HB Cl-H C-N H-H H-HB H-N
2 - 909 - - - - - - - 11281 130 3 -008 - - - - -299 - - - -13547 093 4 - - - - 751 -269 - - 1454 11747 087 5 - - -279 622 - -464 - -549 - -5429 051 6 - - -306 472 - -447 426 -529 - -5279 034 7 - - -392 472 - -487 532 -611 -054 -7690 025 8 - 503 -359 387 265 -340 581 -570 - 300 022 9 - 531 -343 355 318 -327 596 -539 190 1748 021
10 084 541 -319 330 347 -331 611 -527 219 681 022
63 Results
149
633 Combined Physical Model Assuming a model that both describes the electronic effects and allows rescaling of the
atomndashatom interactions
Then there is a huge number of ways for finding a satisfactory fitting of the data The
rescaling of the three contributions in equation 67 is physically justified since
(1) The α term represents the electronic barrier that arises from the conjugation of
benzoic acid rings (section 535)
(2) The rescale term is necessary due to the overestimation of the repulsion
contribution (section 536)
(3) The rescale term accounts for electron correlation ie dispersion Section 275
emphasised the importance of the dispersion term while section 533 showed the
consequence of ignoring the electron correlation eg HF method
Cases where and gt 0 retained the repulsive and attractive (dispersion) nature ie
repulsion did not become attraction and vice versa It was also required that was less
than zero ( lt 0) to give a maximum around =90deg corresponding to conjugation (Figure
515) Table 64 contains all the fits to FA which have the physically correct sign for all
parameters and the full set of results for fitting up to 12 parameters (including the baseline
estimate Ebase as given in Table 65) This shows that fitting and only rescaling a few
atomndashatom interactions gives a qualitatively accurate fit (Figure 69) It is notable that the
parameters involving H and HB usually needed the greatest rescaling a finding that is
consistent with the fact that HB parameters were not fitted in the intermolecular potential
model In addition the intermolecular parameterization of H∙∙∙H is a notable exception in
that its minimum is very shallow (Figure 68) and is not sharply defined being repulsive
for a wide range of intermolecular H∙∙∙H distances42 Furthermore there is a huge
difference between other polar H (HB) interactions and H∙∙∙H interactions therefore it is
not surprising that the interactions that involve HB atoms required the greatest rescaling
Table 64 All fits obtained for FA with the physically correct sign for the repulsion
and dispersion and electronic parameters βικ γικ α Ebase σintra
kJ mol-1 Nk C-C C-H C-HB H-H H-HB C-C C-H C-HB H-H H-HB
6 - - 801 1074 - - - 1654 5800 - -339 -12383 026
6 - 028 - - 1109 - 783 - - 3479 -117 -7549 028
4 - - - 1108 - - - - 5003 - -391 -5926 033
4 - 619 - - - - 2082 - - - -157 -18049 036
4 - - - - 3467 - - - - 13698 -530 -1246 057
4 - - 3630 - - - - 11038 - - -945 -33466 076
6
( ) cos(2 ) exp( )ik ik
i k
E A B R C R 67
63 Results
150
Figure 68 Gavezzotti exp-6 potential for all atomndashatom interactions in fenamates
displayed in two different energy scales The parameters are from Chapter 5 (Table 52)
Although virtually perfect fits can be obtained (Table 65) the variation in the fitted
parameters is significant given the exponential sensitivity of the repulsion to changes in
atomndashatom distances These could be substantial for example the lack of symmetry for
the FA torsional scan where the two minima were found at =3894deg and 14471deg though
only differing in energy by 188 x 10-3 kJ mol-1 (716 x 10-7 au) corresponded to a change
of 061 Aring in the 1-4 interaction between the amide proton and C13 or C9 Even the C8-C9
and C8-C13 aromatic bond lengths differed by 00037 Aring for =0 or 180deg but only by
00004 Aring for =80deg or 100deg with larger changes in the bonded hydrogen positions for
FA Hence the systematic consideration of all combinations of sets of parameters that
could be meaningfully fitted and the resulting coefficients only provided a qualitative
guide to which of the atomndashatom interactions dominated the intramolecular energy
(Chapter 5 Table 66) and were most critical
63 Results
151
Table 65 The rescale parameters for the repulsion ικ dispersion ικ and electronic contributions of
the physical exp-6 and cos2 model for all possible combinations of atom type interactions C∙∙∙C C∙∙∙H
C∙∙∙HB H∙∙∙H and H∙∙∙HB for FA Nk are the number of fitted rescale parameters ικ and ικ and the baseline
energy Ebase ικ ικ α Ebase σintra
kJ mol-1 Nk C-C C-H C-HB H-H H-HB C-C C-H C-HB H-H H-HB
4 - - - 1108 - - - - 5003 - -391 -5926 033
4 - 619 - - - - 2082 - - - -157 -18049 036 4 -797 - - - - -1508 - - - - -272 -10530 045
4 - - - - 3467 - - - - 13698 -530 -1246 057
4 - - 3630 - - - - 11038 - - -945 -33466 076
6 -366 461 - - - -1053 1477 - - - -080 -3768 010 6 -436 - - 610 - -764 - - 2966 - -114 -15833 012
6 -852 - -188 - - -1227 - -229 - - 055 -30621 017
6 -600 - - - 1135 -862 - - - 5415 -143 -23513 018 6 - -103 1476 - - - 574 4073 - - -220 -17385 023
6 - - - 1208 -182 - - - 6537 -2918 -208 -9576 024
6 - -255 - 619 - - 013 - 2048 - -216 -1513 025 6 - - 801 1074 - - - 1654 5800 - -339 -12383 026
6 - 028 - - 1109 - 783 - - 3479 -117 -7549 028
6 - - -1326 - 6519 - - -6960 - 32879 -539 24422 036
8 -275 351 - - 271 -935 1344 - - 412 -075 534 008
8 -236 414 - -157 - -1078 1876 - -1719 - -076 9374 009
8 -373 - - 626 334 -681 - - 3475 222 -066 -15208 009
8 -493 551 -189 - - -1218 1530 -642 - - -047 -6499 010 8 -530 - -737 725 - -1054 - -2417 3267 - -044 -3345 010
8 -698 - -1655 - 3047 -1263 - -6095 - 14774 012 5842 013
8 - -419 520 1195 - - -846 691 6039 - -246 -995 019 8 - - 1843 1185 -1677 - - 5881 7251 -11125 -196 -30353 019
8 - -089 2697 - -3196 - 952 9622 - -18054 -082 -40433 021
8 - -445 - 1541 -1016 - -970 - 7719 -6385 -166 -770 021
10 -445 686 -555 -541 - -1577 2664 -1489 -4179 - 017 13752 005 10 -524 469 -740 - 953 -1247 1257 -2481 - 3880 -022 -075 007
10 -320 465 - -026 593 -977 1532 - -349 1763 -064 -3403 008
10 -598 - -1429 455 1804 -1188 - -5112 1825 8695 -025 6986 009 10 - 166 2717 671 -2944 - 788 9384 4350 -17854 -113 -44769 014
12 -383 709 -155 -570 -447 -1498 2835 -035 -4260 -2903 018 9708 006
152
Table 66 The rescale parameters for the repulsion ικ dispersion ικ and electronic contributions of the physical exp-6 and cos2 model for all possible combinations of atom
type interactions C∙∙∙C C∙∙∙Cl C∙∙∙H C∙∙∙HB Cl∙∙∙H C∙∙∙N H∙∙∙H and H∙∙∙HB for TA Nk are the number of fitted rescale parameters and Ebase is the baseline energy ghThe parameters
used in Figure 69b and ifor testing transferability in Figure 610b and Figure 611 ικ ικ α Ebase σintra
kJ mol-1 Nk C-C C-Cl C-H C-HB Cl-H C-N H-H H-HB H-N C-C C-Cl C-H C-HB Cl-H C-N H-H H-HB H-N
4 - 1019 - - - - - - - - 593 - - - - - - - -135 8690 108
4 - - - - - 930 - - - - - - - - 2901 - - - -530 -24891 111
4 - - - - - - - - 1839 - - - - - - - - 5101 -293 -14115 149 4 - - - - - - - 861 - - - - - - - - 3884 - -254 2058 165
4 - - - 303 - - - - - - - - 1102 - - - - - -167 -1133 168
4 181 - - - - - - - - 095 - - - - - - - - -761 13228 193
6 - - - - - 2237 173 - - - - - - - 6517 1810 - - -135 -63604 049 6 - 484 - - - 1974 - - - - 4173 - - - 7186 - - - -848 -99438 067
6 - - 1560 - - - 1856 - - - - 817 - - - 11967 - - -1311 -8678 077
6 - - - - 967 2171 - - - - - - - 4431 6977 - - - -167 -89172 078 6 659 - - - - 4409 - - - 955 - - - - 12397 - - - -1602 -99338 102
6 - - - - - - 604 - 2288 - - - - - - 2012 - 7506 -674 -27619 120 g8 - 1933 - 567 - 2165 - - - - 7289 - 2207 - 6976 - - - -102 -114180 015
8 - - - - 1957 3068 - 498 - - - - - 8130 9634 - 2647 - -096 -133767 016 8 - 1618 - - - 2874 - 676 - - 6263 - - - 8952 - 3754 - -361 -119616 023
8 - 038 - - - 2451 133 - - - 1139 - - - 7574 1528 - - -320 -83684 028
8 - - 1015 801 - - 505 - - - - 083 437 - - 11123 - - -962 -4165 037 8 - - - - 634 2650 027 - - - - - - 2075 7927 1106 - - -313 -86212 041
8 - - - - - 2211 127 367 - - - - - - 6326 1898 1248 - -009 -62350 047
8 - - 156 - - 2356 105 - - - - 189 - - 6873 1561 - - -178 -67559 051 8 - - 1422 - - - 1194 1225 - - - 1118 - - - 8625 5331 - -621 -14314 063
8 - - 768 - - - 1497 - 1353 - - 221 - - - 8154 - 2730 -436 -9301 071 h10 - 1049 - - 2600 2731 - 679 - - 366 - - 9102 8140 - 3889 - -426 -112247 008
10 - - 135 - 853 2173 - 426 - - - 404 - 2724 6867 - 2476 - -193 -83710 009 10 - 853 - - - 2386 227 583 - - 3742 - - - 7431 1238 2941 - -222 -94694 010
10 - - - - 1465 2785 089 542 - - - - - 5788 8569 720 2568 - -107 -112106 011
10 - 1143 194 457 - 2086 - - - - 4833 341 1829 - 6762 - - - -096 -102646 016 10 050 - - - 1763 2692 - 496 - 085 - - - 7084 8615 - 2744 - -032 -123424 018 i10 - - 180 - - 2079 - 604 089 - - 627 - - 6176 - 3544 883 -051 -71971 026
10 - - 413 506 - 1334 018 - - - - 473 1146 - 4010 2532 - - -067 -48308 031 10 314 - 945 1122 - - 535 - - 531 - 110 1833 - - 10029 - - -966 -9528 032
10 - 1160 743 925 - - 365 - - - 2757 057 1532 - - 8017 - - -487 -17128 036
12 - - - 093 1321 2831 314 - 1519 - - - 569 4186 8238 941 - 3812 -414 -110966 007
12 - 709 - 253 1721 2653 - - 903 - 1198 - 1091 5530 7956 - - 1792 -350 -111102 008 12 - - 237 137 1032 2350 - - 700 - - 432 702 2719 7255 - - 1037 -351 -88568 008
12 - - 425 - 843 2274 065 656 - - - 588 - 2415 6938 1356 3101 - -440 -84012 008
12 - - 046 - - 2081 536 274 1391 - - 344 - - 5722 1360 2319 5007 -245 -78093 027
14 - - 384 214 886 2010 190 - 805 - - 456 690 2056 6136 1635 - 1462 -532 -76472 008 14 - - 249 012 954 2442 - 316 410 - - 457 214 2439 7563 - 1279 209 -360 -86183 009
63 Results
153
Figure 69 Comparison of the relative energies from ab initio calculations (solid black
lines) of FA (top) and TA (bottom) with selected physical models For FA the selected
Nk=6 intra=026 kJ mol-1 model has βC-HB =801 γC-HB =1654 βH-H =1074 γH-H =58 α=-
339 and Ebase=-12383 whilst the Nk =6 intra=028 kJ mol-1 model has β C-H =028 γ C-
H =783 β H-HB = 1109 γ H-HB =3479 α=-117 and Ebase=-7549 For TA parameters for
the selected Nk=8 (intra=015 kJ mol-1) and 10 (intra=008 kJ mol-1) are in ghTable 66
In contrast to FA TA (Table 66) gave a qualitatively accurate fit only when at least
three types of atomndashatom parameters were rescaled (Nk=8) including C∙∙∙N as shown in
Figure 69 The relaxed scans were sensitive to a large number of atomndashatom distances
so that the 5 change in did not necessarily give a smooth curve between the analytical
values This was because of the differences in the molecular relaxation and resulting
atomndashatom distances not the step size because Figure 510 of Chapter 5 showed that
smaller step size for FA produced a smooth but asymmetric ab initio energy-curve All
the fits with the physically correct parameters were unique solutions (section 262)
63 Results
154
Depending on which atomic types were being fitted there were some variations in the
parameters for a given atomndashatom interaction I noticed that for TA (Table 66) the C∙∙∙N
parameters consistently needed to be drastically rescaled reflecting the importance of the
methyl carbon (R1=CH3 Figure 61) in the conformational profile of TA Indeed TA
differed from FA in having many more intramolecular atomndashatom distances that changed
significantly within the range = 0 to 145 including some within the same aromatic ring
such as the methylndashchloro interactions (Table 61 or compare Table 56 with Table 57 in
Chapter 5) Day6 also observed that pyramidalizations of atoms (eg the nitrogen atom in
an amine group) significantly affect the intramolecular parameters
By following the procedure described in the methodology (section 622) I obtained a
variety of analytical models of the form of equation 67 that could reproduce the torsional
profiles of FA and TA with a high degree of accuracy despite the significant variation in
many atomndashatom distances during the relaxed torsional scans However the analytical
model had a maximum number of parameters for FA and TA (12 and 22 respectively)
with 5 (plus 1) atomic types C H N O HB (plus Cl) when considering atomic-
type∙∙∙atomic-type interaction that contributed significantly to energy changes with
conformation Fitting too many parameters led to models where some of the fitted
parameters had the wrong sign for their physical interpretation and some of these fits for
TA showed a linear dependence between the parameters (ie the fitted parameters were
not unique section 262) Nonetheless the ease with which this physically justified model
(equation 67) could reproduce the conformational dependence of FA and TA shows that
this approach to modelling the intramolecular energies of fenamates is promising
634 Transferability A further investigation of the physical reasonableness of the atomndashatom plus electronic
functional form (equation 67) is to test whether the models transfer to related molecules
The difference between the energy scans when the substituents are far from the varying
torsion angle for example the change of H to Cl atom ie from FA to ClFA or between
TA and MA (Figure 511) should not change the main steric interactions and should only
have a small effect on the electronic term (Figure 515e and f)
Transferring a set of parameters fitted to FA and adding Gavezzottirsquos Cl parameters
did indeed (Figure 610) give some of the asymmetry in the well depths seen for ClFA
and the higher central barrier as compared to FA (Figure 511) when the electronic term
was fitted Similarly a set of parameters fitted to TA could reproduce the lower barrier
at = 90 and higher barrier at = 0 in MA (Figure 610b) despite the fact that the
63 Results
155
conformational relaxation of the methylndashmethyl interaction was somewhat different from
that of the methyl-chloro geometry (Figure 513)
Figure 610 Comparison of the relative energies from ab initio calculations (solid black
lines) with models using transferred βικ and γικ parameters from FA and TA (dotted grey
plots) to ClFA (top) and MA (bottom) respectively The red curve has only had the
baseline adjusted whereas the blue curve had the parameter refitted to ClFA or MA
respectively The transferred FA parameters are those Nk=6 fit=028 kJ mol-1 in Figure
69 while those of TA Nk= 10 fit= =026 kJ mol-1 are shown in iTable 66
A more stringent test would be to apply the same TA parameters to FA and ClFA
which gave qualitatively correct results around the minima (Figure 611) and the steric
barriers at 0 and 180 However the barrier height around 90 would remain similar to
that in TA and this underestimation would be only partially corrected by refitting the
cos(2) term Given the limitations in the parameter optimization the qualitative
63 Results
156
accuracy is promising In particular the poorer transferability may be attributable to the
fact that the fitting of parameters for C and H interactions in TA was modelling both the
aromatic and methyl atoms and the methyl∙∙∙N interaction was critical in fitting the
parameters to the TA profile
Figure 611 Comparison of the relative energies from ab initio calculations (solid black
lines) with models using βικ and γικ parameters transferred from TA (dotted grey plots) to
(a) FA and (b) ClFA The red curve has only had the baseline adjusted whereas the blue
curve has the parameter refitted to FA or ClFA respectively The transferred TA
parameters are those of Nk= 10 fit= 026 kJ mol-1 as shown in iTable 66
64 Summary
157
64 Summary Neither the cosine terms nor the analytical models that rescaled overestimated repulsion
contributions were adequate for modelling the conformational profile of fenamates
However a physically justified modelmdashone that combined a cos2 term with an
intramolecular exp-6 atomndashatom term for all atom pairs separated by three or more bonds
(1-4 and above)mdashallowed for a very effective representation of the ab initio
conformational energies In this chapter I successfully fitted conformational profiles of
FA and TA to the cos2 plus exp-6 model This success suggests that the separation of
intramolecular and intermolecular forces is a promising new method for discovering force
fields that are more accurate which could in turn pave the way for modelling the
condensed phases of pharmaceutical-like organic molecules Considering a wide range of
molecules and bigger dataset could improve the transferability of this physical model
71 Position of CSP in the Context of this Thesis
158
Chapter 7 Conclusions and Future Work
ldquoIt is good to have an end to journey toward but it is the journey that matters in the
endrdquo
mdash Ernest Hemingway
71 Position of CSP in the Context of this Thesis The CSP results of Chapters 3 and 4 successfully validated the ability of
CrystalPredictor to generate crystal structures of flexible molecules In Chapter 3 I
successfully predicted the crystal structure of BT which has an unusual and unexpected
packing The success required the use of distributed multipoles and ab initio calculations
of intramolecular energy This success inspires hope that the use of multipolar
electrostatic models (as being implemented in the second-generation force fields such as
AMOEBA91) with careful evaluation of the accuracy of the intramolecular forces will
provide a route to greater reliability for computer-aided drug design with uncommon
ligands However the failure of a conventional point charge electrostatic model used in
the intermediate step has considerable implications for other studies that rely on
modelling the intermolecular interactions of 1-substituted 1H-tetrazoles
Chapter 4 successfully investigated the concept of polymorphophore via CSP studies
of FA and TA in an attempt to understand why polymorphism occurs I discovered that
the fenamate fragment did qualify as a polymorphophore in that the dimeric unit could
pack in a variety of ways with different torsion angles of the phenyl groups due to the
torsional flexibility of FA and TA Once the aromatic rings had interdigitated with their
nearest neighbours there was a large barrier to rearrangement to a very different packing
and the polymorphs were long-lived with the torsion angles varying slightly to optimize
the packing for a given structure as we saw for TA It was however the comparison
between the FA and TA crystal energy landscapes that showed that it was the substituents
that played the major role in determining the possible packing and relative energies and
hence the polymorphic behaviours of FA and TA These observations clearly
demonstrate the links among conformational flexibility polymorphism and
polymorphophore
The considerable similarity in large clusters of the known and hypothetical structures
of TA and the closeness of their energies suggested that crystal growth errors were very
likely More importantly though this finding guided my colleague in the discovery of a
new polymorph of TA (form VI) which was nucleated by solution evaporation after
72 Towards more accurate force-fields for pharmaceutical molecules
159
dissolving TA (form I) in ethanol and seeding it with mefenamic acid (form I) The major
component of this new form (form VI is disordered 65 and 35) was not among the
crystal structures on the final energy landscape despite generating the corresponding
hypothetical structure during an intermediate step (CrystalPredictor) Although this
observation emphasised the success of the CrystalPredictor algorithm it also showed the
need for larger numbers of crystal structures to go through CrystalOptimizer This need
for a larger dataset in the subsequent CrystalOptimizer step raises the question ldquoIs there
a clear cut-off in energy for flexible moleculesrdquo This question is even more relevant
when you consider that desolvated solvates can have much higher energy than organic
crystal structures247 In fact it might even be desirable to go even higher in energy due to
likely high conformation energy of the desolvated solvates The CrystalOptimizer
algorithm does allow the build-up of a database known as Local Approximate Models
(LAMs) but it would be preferable to be able to check many more structures If we could
better fit intramolecular energy which requires the bulk of the computing time to a force
field we would be able to compute the energies of many more structures of a target
molecule In addition computing the energies of the higher-energy structures would be
much cheaper
Chapters 3 and 4 used methods suitable for studying flexible molecules17 as the ab
initio charge density for the specific conformation was used in modelling the
intermolecular interactions thus representing the interplay between molecular
conformation and intermolecular interactions which have been shown to be important for
TA211 Conformational changes can optimise the directionality of strong interactions
such as H-bonding and increase the packing density and hence the stabilization of the
structure by dispersion forces Although CSP methodologies have advanced to aid solid
form screening in pharmaceutical development247-250 it is nevertheless desirable to
calculate the relative free energies of organic polymorphs via molecular dynamics
methods251-253 Although there has been a great push to include the kinetics and their
ability to control the polymorphs formed1 a vital first step is to develop a sound
understanding of thermodynamics
72 Towards more accurate force-fields for pharmaceutical molecules The challenge of extending the reliability and accuracy of quantum mechanical
methods to larger molecules which are more typical of pharmaceuticals and realistic
biological molecules in isolation or condensed phases is the subject of active research
This research ranges from empirical corrections to DFT methods to the use of better
73 Future Work
160
functionals254 as well as implementing explicitly correlated wavefunction methods more
effectively
Chapter 5 emphasized the challenges with using a sufficiently realistic method for the
ab initio determination of conformational energies for larger molecules For example the
HF method provides a qualitatively wrong and misleading conformational profile of FA
and TA due to the absence of the dispersion (correlation effect) contribution Dispersion
also plays an important role in the barrier to rotation for the fenamates especially when
the aromatic rings are perpendicular to one another The analysis of the fenamatesrsquo
torsional potential revealed that the origin of the torsional barrier of the fenamates is a
combination of intrinsic intramolecular dispersion electronic contribution and the steric
repulsion In addition small changes to other conformational angles made significant
contributions to the torsional profile of the fenamate molecules
In Chapter 6 a physically motivated analytical modelndashndashcos2 term combined with an
intramolecular exp-6 atomndashatom term for all atom pairs separated by three or more
bondsndashndashwas derived using knowledge gained from Chapter 5 This model accurately fits
the intramolecular energy profiles of FA and TA This approach of modelling the
conformational energies of the fenamates could be extended to pharmaceutical-like
flexible organics
73 Future Work One can envisage a general scheme for determining the physically motivated potentials
(Chapter 6) for a given molecule following a CSP study by an approach that is being
developed127 and applied to pharmaceutical molecules247-249255 The refinement of the
molecular conformations simultaneously with the crystallographic cell using
CrystalOptimizer72 involves the calculation and storage of a large database (LAMs) of ab
initio conformational energies and forces for the molecule For example the CSP studies
for FA and TA contain the results of hundreds of molecular wavefunction calculations
with varying torsion and bond angles
The database generated in a CSP study will cover most of the range of conformations
that are likely to be sampled in a Molecular Dynamics study of the molecules in
condensed phases with a strong bias towards the conformations that occur in low-energy
crystal structures both observed and potential polymorphs1 The LAMs database could
be used to improve the parameterization of the analytical conformational energy model
adapting the potential fitting routines (Appendix A) used in Chapter 6 An advantage of
using an analytical functional form rather than the LAMs to interpolate between the ab
73 Future Work
161
initio points in the CSP study is that the extrapolation to other conformations will be more
realistic The great benefit of this scheme of building up from a CSP study for a specific
molecule is that the model intramolecular force field could be validated by ensuring that
the model reproduces the crystal energy landscape ie the energies of different packing
H-bonding and stacking modes are correctly balanced with the accompanying
conformational changes
The application of separate analytical potentials for both intra- and intermolecular terms
will require adaptation of molecular modelling codes However the coding for the
energies forces and second derivatives of the proposed intramolecular force field
(equation 67) is already present in most codes After inserting the new parameters the
major adaptation that will be required for an existing codendashndashone that uses traditional force
fields such as DL_POLY251256 for Molecular Dynamics simulationsndashndashis separating out
the calculation of inter- and intramolecular terms Accurate intramolecular forces are
most needed in combination with the accurate anisotropic atom-atom intermolecular
potentials for organic molecules where the electrostatic term is represented by atomic
multipoles for example the static organic crystal structure modelling code
DMACRYS34 or the rigid molecule molecular dynamics code DL_MULTI257
Furthermore the adaptation of molecular modelling code would require an adequate
representation for the conformation dependence of the distributed multipoles for specific
molecules but the dependency could be represented by an analytical model258
Although this change in approach to pharmaceutical force fields involves envisaging a
specific model fitted for each molecule the physical basis of the current model and the
results from Chapter 6 suggest that a reasonably transferable set of atom-atom
intramolecular exp-6 potentials could be fitted for families of molecules Deriving a
transferable model would require a very large dataset of ab initio conformational profiles
of many molecules calculated at an appropriate accuracy The transferability of the
electronic term ( coefficients) would need investigating However the use of separate
atom-atom models for the forces within and between molecules appears to provide a
significant improvement in the realism of current force fields In conclusion this
approach could potentially provide an affordable route for Molecular Dynamics
simulations of flexible pharmaceuticals that have the accuracy of CSP
Appendix A
162
Appendix A Contents of enclosed CD-ROM
The CD-ROM attached to this thesis contains FORTRAN source codes of the analytical
models presented in Chapter 6 as well as some of the input files The input data for FA
TA MFA and ClFA that were used in conjunction with the source codes are in directory
A1 The inputs files included for each molecule are as follows
a) The summaryr contains a summary of the flexible degree of freedom ξ and
the intramolecular energy relative to the most stable conformation ΔEintra
b) The geometries of all the optimised conformation in mol2 file format
The source codes and example input files are in directories A2 (cosine model) A3
(rescaled repulsion model) and A4 (physical model) The A2 directory contains
a) an executable file (cos_modelexe)
b) FORTRAN source code (cos_modelf90)
c) input (summaryr) file
d) output (dominantr) file
The A3 and A4 directories contain
a) an executable file (exe)
b) FORTRAN source code (f90)
c) output (dominantr) file
d) an input subdirectory that contains
i Gavezzottirsquos exp-6 atom-atom parameters from Table 52
ii h03adfe subroutine computes the nearest neighbour of two atoms and
iii summaryr file
The A5 directory contains a utility file (extract_mol2sh) that extracts the input data
(summaryr and all the optimised conformations in mol2) from the GAUSSIAN0353
(log) file
Bibliography
163
Bibliography
1 Price S L Why dont we find more polymorphs Acta Crystallogr Sect B
2013 69 313-328
2 Price S L Predicting crystal structures of organic compounds Chem Soc Rev
2014 43 (7) 2098-2111
3 Svaumlrd M Structural Kinetic and Thermodynamic Aspects of the Crystal
Polymorphism of Substituted Monocyclic Aromatic Compounds 2011
4 Svaumlrd M Nordstroumlm F L Jasnobulka T Rasmuson Aring C Thermodynamics
and Nucleation Kinetics of m-Aminobenzoic Acid Polymorphs Cryst Growth
Des 2009 10 (1) 195-204
5 Chemburkar S R Bauer J Deming K Spiwek H Patel K Morris J
Henry R Spanton S Dziki W Porter W Quick J Bauer P Donaubauer
J Narayanan B A Soldani M Riley D McFarland K Dealing with the
impact of ritonavir polymorphs on the late stages of bulk drug process
development Org Process Res Dev 2000 4 (5) 413-417
6 Day G M Current approaches to predicting molecular organic crystal structures
Crystallography Reviews 2011 17 (1) 3-52
7 Byrn S R Pfeiffer R Ganey M Hoiberg C Poochikian G Pharmaceutical
Solids - A Strategic Approach to Regulatory Considerations Pharmaceut Res
1995 12 (7) 945-954
8 Price S L Lattice energy nailed Science 2014 345 (6197) 619-620
9 Newman A Specialized Solid Form Screening Techniques Org Process Res
Dev 2013 17 (3) 457-471
10 Day G M Cooper T G Cruz-Cabeza A J Hejczyk K E Ammon H L
Boerrigter S X M Tan J Della Valle R G Venuti E Jose J Gadre S R
Desiraju G R Thakur T S van Eijck B P Facelli J C Bazterra V E
Ferraro M B Hofmann D W M Neumann M Leusen F J J Kendrick J
Price S L Misquitta A J Karamertzanis P G Welch G W A Scheraga
H A Arnautova Y A Schmidt M U van de Streek J Wolf A Schweizer
B Significant progress in predicting the crystal structures of small organic
molecules - a report on the fourth blind test Acta Crystallogr Sect B 2009 65
(2) 107-125
11 Bardwell D A Adjiman C S Arnautova Y A Bartashevich E Boerrigter
S X Braun D E Cruz-Cabeza A J Day G M la Valle R G Desiraju G
R van Eijck B P Facelli J C Ferraro M B Grillo D Habgood M
Hofmann D W Hofmann F Jose K V Karamertzanis P G Kazantsev A
V Kendrick J Kuleshova L N Leusen F J Maleev A V Misquitta A J
Mohamed S Needs R J Neumann M A Nikylov D Orendt A M Pal R
Pantelides C C Pickard C J Price L S Price S L Scheraga H A van de
Bibliography
164
Streek J Thakur T S Tiwari S Venuti E Zhitkov I K Towards crystal
structure prediction of complex organic compounds - a report on the fifth blind
test Acta Crystallogr Sect B 2011 67 (6) 535-551
12 Price S L Developing Methods of Crystal Structure and Polymorph Prediction
Implications of Molecular and Materials Structures for New Technologies 1999
315-320
13 Neumann M A Tailor-made force fields for crystal-structure prediction J Phys
Chem B 2008 112 (32) 9810-9829
14 Price S L Computed crystal energy landscapes for understanding and predicting
organic crystal structures and polymorphism Accounts Chem Res 2009 42 (1)
117-126
15 Groom C R Reilly A M Sixth blind test of organic crystal-structure prediction
methods Acta Crystallogr Sect B 2014 70 (4) 776-777
16 Beyer T Lewis T Price S L Which organic crystal structures are predictable
by lattice energy minimisation CrystEngComm 2001 3 (44) 178-212
17 Kazantsev A V Karamertzanis P G Adjiman C S Pantelides C C Price
S L Galek P T Day G M Cruz-Cabeza A J Successful prediction of a
model pharmaceutical in the fifth blind test of crystal structure prediction Int J
Pharm 2011 418 (2) 168-178
18 Lopez-Mejias V Kampf J W Matzger A J Nonamorphism in Flufenamic
Acid and a New Record for a Polymorphic Compound with Solved Structures J
Am Chem Soc 2012 134 (24) 9872-9875
19 Lopez-Mejias V Kampf J W Matzger A J Polymer-Induced
Heteronucleation of Tolfenamic Acid Structural Investigation of a Pentamorph
J Am Chem Soc 2009 131 (13) 4554-4555
20 Yu L Polymorphism in Molecular Solids An Extraordinary System of Red
Orange and Yellow Crystals Accounts Chem Res 2010 43 (9) 1257-1266
21 Chen S A Xi H M Yu L Cross-nucleation between ROY polymorphs J
Am Chem Soc 2005 127 (49) 17439-17444
22 Murthy H K Bhat T N Vijayan M Structural studies of analgesics and their
interactions 9 Structure of a new crystal form of 2-([3-(trifluoromethyl) phenyl]
amino) benzoic acid (flufenamic acid) Acta Crystallogr Sect B 1982 38 (JAN)
315-317
23 Lutker K M Tolstyka Z P Matzger A J Investigation of a privileged
polymorphic motif A dimeric ROY derivative Cryst Growth Des 2008 8 (1)
136-139
24 Price S L Price L S Modelling Intermolecular Forces for Organic Crystal
Structure Prediction In Intermolecular Forces and Clusters I Wales D J Ed
Springer-Verlag Berlin Heidelberg Germany 2005 pp 81-123
Bibliography
165
25 Bernstein J Polymorphism in Molecular Crystals Clarendon Press Oxford
2002
26 Stone A J The Theory of Intermolecular Forces 2 ed Oxford University Press
Oxford 2013
27 Buckingham A D Utting B D Intermolecular Forces Annu Rev Phys Chem
1970 21 (1) 287-316
28 Maitland G C Rigby M Smith E B Wakeham W A Intermolecular
Forces Their Origin and Determination Clarendon Press Oxford 1981
29 Israelachvili J Intermolecular and Surface Forces Third Edition Academic
Press 2010
30 London F The general theory of molecular forces Trans Faraday Soc 1937
33 8b-26
31 Spencer N D Moore J H Encyclopedia of Chemical Physics and Physical
Chemistry Fundamentals 1 ed Taylor amp Francis 2001pp 1004
32 Welch G W A Karamertzanis P G Misquitta A J Stone A J Price S L
Is the induction energy important for modeling organic crystals J Chem Theory
Comput 2008 4 (3) 522-532
33 Price S L From crystal structure prediction to polymorph prediction interpreting
the crystal energy landscape Phys Chem Chem Phys 2008 10 (15) 1996-2009
34 Price S L Leslie M Welch G W A Habgood M Price L S
Karamertzanis P G Day G M Modelling Organic Crystal Structures using
Distributed Multipole and Polarizability-Based Model Intermolecular Potentials
Phys Chem Chem Phys 2010 12 (30) 8478-8490
35 Freitag M A Gordon M S Jensen J H Stevens W J Evaluation of charge
penetration between distributed multipolar expansions J Chem Phys 2000 112
(17) 7300-7306
36 Lund A M Orendt A M Pagola G I Ferraro M B Facelli J C
Optimization of Crystal Structures of Archetypical Pharmaceutical Compounds
A Plane-Wave DFT-D Study Using Quantum Espresso Crystal Growth amp Design
2013 13 (5) 2181-2189
37 Neumann M A Perrin M A Energy ranking of molecular crystals using
density functional theory calculations and an empirical van der Waals correction
J Phys Chem B 2005 109 (32) 15531-15541
38 Cox S R Hsu L Y Williams D E Nonbonded Potential Function Models for
Crystalline Oxohydrocarbons Acta Crystallogr Sect A 1981 37 (MAY) 293-
301
Bibliography
166
39 Williams D E Cox S R Nonbonded Potentials For Azahydrocarbons the
Importance of the Coulombic Interaction Acta Crystallogr Sect B 1984 40 (8)
404-417
40 Coombes D S Price S L Willock D J Leslie M Role of Electrostatic
Interactions in Determining the Crystal Structures of Polar Organic Molecules A
Distributed Multipole Study J Phys Chem 1996 100 (18) 7352-7360
41 Gavezzotti A Theoretical Aspects and Computer Modeling of the Molecular
Solid State John Wiley Chichester 1997 Vol 1
42 Filippini G Gavezzotti A Empirical Intermolecular Potentials For Organic-
Crystals the 6-Exp Approximation Revisited Acta Crystallogr Sect B 1993
B49 868-880
43 Williams D E Weller R R Lone-Pair Electronic Effects On the Calculated
Abinitio Scf-Mo Electric-Potential and the Crystal-Structures of Azabenzenes J
Am Chem Soc 1983 105 (13) 4143-4148
44 Karamertzanis P G Pantelides C C Optimal site charge models for molecular
electrostatic potentials Mol Simulat 2004 30 (7) 413-436
45 Spackman M A Molecular Electric Moments from X-ray Diffraction Data
Chem Rev 1992 92 1769-1797
46 Breneman C M Wiberg K B Determining Atom-Centered Monopoles From
Molecular Electrostatic Potentials - the Need For High Sampling Density in
Formamide Conformational-Analysis J Comput Chem 1990 11 (3) 361-373
47 Francl M M Carey C Chirlian L E Gange D M Charges fit to electrostatic
potentials II Can atomic charges be unambiguously fit to electrostatic potentials
J Comput Chem 1996 17 (3) 367-383
48 Stone A J Alderton M Distributed Multipole Analysis - Methods and
Applications Molecular Physics 1985 56 (5) 1047-1064
49 Welch G W A The induction contribution to the lattice energy of organic
crystals PhD 2010
50 Stone A J Distributed Multipole Analysis or How to Describe a Molecular
Charge Distribution Chemical Physics Letters 1981 83 (2) 233-239
51 Stone A J Distributed multipole analysis Stability for large basis sets J Chem
Theory Comput 2005 1 (6) 1128-1132
52 GDMA A Program for Performing Distributed Multipole Analysis of Wave
Functions Calculated Using the Gaussian Program System version 22
University of Cambridge Cambridge United Kingdom 2010
53 Gaussian 03 Gaussian Inc Wallingford CT 2004
Bibliography
167
54 GDMA A Program for Performing Distributed Multipole Analysis of Wave
Functions Calculated Using the Gaussian Program System version 10
University of Cambridge Cambridge United Kingdom 1999
55 Price S L Computational prediction of organic crystal structures and
polymorphism Int Rev Phys Chem 2008 27 (3) 541-568
56 Kazantsev A V Molecular Flexibility in Crystal Structure Prediction PhD
Imperial College London 2011
57 Smith W Point multipoles in the Ewald summation CCP5 Quarterly 1982 4
13-25
58 Cruz-Cabeza A J Bernstein J Conformational Polymorphism Chem Rev
2014 114 (4) 2170-2191
59 Cornell W D Cieplak P Bayly C I Gould I R Merz K M Ferguson D
M Spellmeyer D C Fox T Caldwell J W Kollman P A A Second
Generation Force-Field For the Simulation of Proteins Nucleic-Acids and
Organic-Molecules (Vol 117 Pg 5179 1995) J Am Chem Soc 1996 118 (9)
2309
60 van Mourik T Karamertzanis P G Price S L Molecular conformations and
relative stabilities can be as demanding of the electronic structure method as
intermolecular calculations J Phys Chem A 2006 110 (1) 8-12
61 van Mourik T Assessment of Density Functionals for Intramolecular Dispersion-
Rich Interactions J Chem Theory Comput 2008 4 (10) 1610-1619
62 Comba P Hambley T W Martin B Molecular modeling of inorganic
compounds John Wiley amp Sons 2009
63 Leach A R Molecular Modelling Principles and Applications Longman
Harlow 1996
64 Goodman J M Chemical Applications of Molecular Modelling Royal Society
of Chemistry Cambridge UK 1998
65 Brodersen S Wilke S Leusen F J J Engel G A study of different
approaches to the electrostatic interaction in force field methods for organic
crystals Phys Chem Chem Phys 2003 5 (21) 4923-4931
66 Lommerse J P M Motherwell W D S Ammon H L Dunitz J D
Gavezzotti A Hofmann D W M Leusen F J J Mooij W T M Price S
L Schweizer B Schmidt M U van Eijck B P Verwer P Williams D E
A test of crystal structure prediction of small organic molecules Acta Crystallogr
Sect B 2000 56 697-714
67 Motherwell W D S Ammon H L Dunitz J D Dzyabchenko A Erk P
Gavezzotti A Hofmann D W M Leusen F J J Lommerse J P M Mooij
W T M Price S L Scheraga H Schweizer B Schmidt M U van Eijck
Bibliography
168
B P Verwer P Williams D E Crystal structure prediction of small organic
molecules a second blind test Acta Crystallogr Sect B 2002 58 647-661
68 Ponder J W Case D A Force fields for protein simulations Protein
Simulations 2003 66 27-86
69 Cornell W D Howard A E Kollman P Molecular mechanical potential
functions and their application to study molecular systems Current Opinion in
Structural Biology 1991 201-212 Curr Opin Struc Biol 1991 1 (2) 201-212
70 Comba P Hambley T W Martin B Molecular modeling of inorganic
compounds 2009 3rd completely rev and enlarged ed
71 Kazantsev A V Karamertzanis P G Adjiman C S Pantelides C C
CrystalOptimizer An efficient Algorithm for Lattice Energy Minimisation of
Organic Crystal using Isolated-Molecule Quantum Mechanical Calculations In
Molecular System Engineering Adjiman C S Galindo A Eds WILEY-VCH
Verlag GmbH amp Co Weinheim 2010 Vol 6 pp 1-42
72 Kazantsev A V Karamertzanis P G Adjiman C S Pantelides C C
Efficient Handling of Molecular Flexibility in Lattice Energy Minimization of
Organic Crystals J Chem Theory Comput 2011 7 (6) 1998-2016
73 Jones J E On the Determination of Molecular Fields II From the Equation of
State of a Gas Proceedings of the Royal Society of London Series A 1924 106
(738) 463-477
74 Weiner S J Kollman P A Case D A Singh U C Ghio C Alagona G
Profeta S Weiner P A New Force-Field for Molecular Mechanical Simulation
of Nucleic-Acids and Proteins J Am Chem Soc 1984 106 (3) 765-784
75 Momany F A McGuire R F Burgess A W Scheraga H A Energy
parameters in polypeptides VII Geometric parameters partial atomic charges
nonbonded interactions hydrogen bond interactions and intrinsic torsional
potentials for the naturally occurring amino acids J Phys Chem 1975 79 (22)
2361-2381
76 Nemethy G Pottle M S Scheraga H A Energy parameters in polypeptides
9 Updating of geometrical parameters nonbonded interactions and hydrogen
bond interactions for the naturally occurring amino acids J Phys Chem 1983
87 (11) 1883-1887
77 Hagler A T Lifson S Energy functions for peptides and proteins II Amide
hydrogen bond and calculation of amide crystal properties J Am Chem Soc
1974 96 (17) 5327-5335
78 Hagler A T Huler E Lifson S Energy functions for peptides and proteins I
Derivation of a consistent force field including the hydrogen bond from amide
crystals J Am Chem Soc 1974 96 (17) 5319-5327
Bibliography
169
79 Jorgensen W L Quantum and statistical mechanical studies of liquids 10
Transferable intermolecular potential functions for water alcohols and ethers
Application to liquid water J Am Chem Soc 1981 103 (2) 335-340
80 Wang J M Wolf R M Caldwell J W Kollman P A Case D A
Development and testing of a general amber force field J Comput Chem 2004
25 (9) 1157-1174
81 Brooks B R Bruccoleri R E Olafson B D States D J Swaminathan S
Karplus M CHARMM A Program for Macromolecular Energy Minimization
and Dynamics Calculations J Comput Chem 1983 4 (2) 187-217
82 Becker O M Computational biochemistry and biophysics M Dekker New
York 2001
83 MacKerell A D Bashford D Bellott Dunbrack R L Evanseck J D Field
M J Fischer S Gao J Guo H Ha S Joseph-McCarthy D Kuchnir L
Kuczera K Lau F T K Mattos C Michnick S Ngo T Nguyen D T
Prodhom B Reiher W E Roux B Schlenkrich M Smith J C Stote R
Straub J Watanabe M Wiorkiewicz-Kuczera J Yin D Karplus M All-
Atom Empirical Potential for Molecular Modeling and Dynamics Studies of
Proteins J Phys Chem B 1998 102 (18) 3586-3616
84 Vanommeslaeghe K Hatcher E Acharya C Kundu S Zhong S Shim J
Darian E Guvench O Lopes P Vorobyov I Mackerell A D CHARMM
general force field A force field for drug-like molecules compatible with the
CHARMM all-atom additive biological force fields J Comput Chem 2010 31
(4) 671-690
85 Jorgensen W L Tirado-Rives J Potential energy functions for atomic-level
simulations of water and organic and biomolecular systems P Natl Acad Sci
USA 2005 102 (19) 6665-6670
86 Allinger N L Chen K Lii J H An improved force field (MM4) for saturated
hydrocarbons J Comput Chem 1996 17 (5-6) 642-668
87 Halgren T A Merck molecular force field 1 Basis form scope
parameterization and performance of MMFF94 J Comput Chem 1996 17 (5-
6) 490-519
88 Allinger N L Conformational analysis 130 MM2 A hydrocarbon force field
utilizing V1 and V2 torsional terms J Am Chem Soc 1977 99 (25) 8127-8134
89 Caleman C van Maaren P J Hong M Hub J S Costa L T van der Spoel
D Force Field Benchmark of Organic Liquids Density Enthalpy of
Vaporization Heat Capacities Surface Tension Isothermal Compressibility
Volumetric Expansion Coefficient and Dielectric Constant J Chem Theory
Comput 2011 8 (1) 61-74
90 Stouch T R The errors of our ways taking account of error in computer-aided
drug design to build confidence intervals for our next 25 years J Comput -Aided
Mol Des 2012 26 (1) 125-134
Bibliography
170
91 Ponder J W Wu C J Ren P Y Pande V S Chodera J D Schnieders M
J Haque I Mobley D L Lambrecht D S DiStasio R A Head-Gordon
M Clark G N I Johnson M E Head-Gordon T Current Status of the
AMOEBA Polarizable Force Field J Phys Chem B 2010 114 (8) 2549-2564
92 Day G M Motherwell W D S Jones W Beyond the isotropic atom model in
crystal structure prediction of rigid molecules Atomic multipoles versus point
charges Cryst Growth Des 2005 5 (3) 1023-1033
93 Marshall G R Limiting assumptions in molecular modeling electrostatics J
Comput -Aided Mol Des 2013 27 (2) 107-114
94 Payne R S Rowe R C Roberts R J Charlton M H Docherty R Potential
polymorphs of aspirin J Comput Chem 1999 20 (2) 262-273
95 Gourlay M D Kendrick J Leusen F J J Rationalization of racemate
resolution Predicting spontaneous resolution through crystal structure prediction
Cryst Growth Des 2007 7 (1) 56-63
96 Uzoh O G Analytically Modelling Intramolecular Energies of Fenamic and
Tolfenamic Acids Unpublished Work 2013
97 NAG Fortran Library Routine Document G02DDF Oxford United Kingdom
1989
98 Beran G J Hirata S Fragment and localized orbital methods in electronic
structure theory Physical Chemistry Chemical Physics 2012 14 (21) 7559-7561
99 Orio M Pantazis D A Neese F Density functional theory Photosynthesis
Research 2009 102 (2-3) 443-453
100 Sherrill C D An introduction to Hartree-Fock molecular orbital theory School
of Chemistry and Biochemistry Georgia Institute of Technology 2000
101 Shaik S S Hiberty P C A chemists guide to valence bond theory John Wiley
amp Sons 2007
102 Wu W Su P F Shaik S Hiberty P C Classical Valence Bond Approach by
Modern Methods Chem Rev 2011 111 (11) 7557-7593
103 Gasteiger J Engel T Chemoinformatics a textbook John Wiley amp Sons 2006
104 Fukui K Yonezawa T Shingu H A Molecular Orbital Theory of Reactivity in
Aromatic Hydrocarbons J Chem Phys 1952 20 (4) 722-725
105 Bell S Dines T J Chowdhry B Z Withnall R Computational chemistry
using modern electronic structure methods J Chem Educ 2007 84 (8) 1364-
1370
106 Moller C Plesset M S Note on an approximation treatment for many-electron
systems Phys Rev 1934 46 618-622
Bibliography
171
107 Valdes H Klusak V Pitonak M Exner O Stary I Hobza P Rulisek L
Evaluation of the intramolecular basis set superposition error in the calculations
of larger molecules [n]Helicenes and Phe-Gly-Phe tripeptide J Comput Chem
2008 29 (6) 861-870
108 Simon S Duran M Dannenberg J J How does basis set superposition error
change the potential surfaces for hydrogen bonded dimers Journal of Chemical
Physics 1996 105 (24) 11024-11031
109 Szczesniak M M Scheiner S Correction of the Basis Set Superposition Error
in SCF and MP2 Interaction Energies - the Water Dimer J Chem Phys 1986 84
(11) 6328-6335
110 Stephens P J Devlin F J Chabalowski C F Frisch M J Ab-Initio
Calculation of Vibrational Absorption and Circular-Dichroism Spectra Using
Density-Functional Force-Fields J Phys Chem 1994 98 (45) 11623-11627
111 Car R Introduction to density-functional theory and ab-initio molecular
dynamics Quant Struct -Act Rel 2002 21 (2) 97-104
112 Grimme S Antony J Schwabe T Muck-Lichtenfeld C Density functional
theory with dispersion corrections for supramolecular structures aggregates and
complexes of (bio)organic molecules Organic amp Biomolecular Chemistry 2007
5 (5) 741-758
113 Kohn W Becke A D Parr R G Density functional theory of electronic
structure J Phys Chem 1996 100 (31) 12974-12980
114 Hohenberg P Kohn W Inhomogeneous Electron Gas Physical Review B 1964
136 (3B) B864-B871
115 Kohn W Sham L J Self-consistent equations including exchange and
correlation effects Phys Rev 1965 140 (4A) A1133
116 Becke A D Density-Functional Thermochemistry 3 the Role of Exact
Exchange J Chem Phys 1993 98 (7) 5648-5652
117 Lee C T Yang W T Parr R G Development of the Colle-Salvetti
Correlation-Energy Formula Into A Functional of the Electron-Density Phys
Rev B 1988 37 (2) 785-789
118 Adamo C Barone V Toward reliable density functional methods without
adjustable parameters The PBE0 model J Chem Phys 1999 110 (13) 6158-
6170
119 Sherrill C D Introduction to Electron Correlation School of Chemistry and
Biochemistry Georgia Institute of Technology 2008
120 Grafenstein J Cremer D An efficient algorithm for the density-functional
theory treatment of dispersion interactions J Chem Phys 2009 130 (12)
Bibliography
172
121 Grimme S Density functional theory with London dispersion corrections Wiley
Interdisciplinary Reviews-Computational Molecular Science 2011 1 (2) 211-
228
122 Grimme S Antony J Ehrlich S Krieg H A consistent and accurate ab initio
parametrization of density functional dispersion correction (DFT-D) for the 94
elements H-Pu J Chem Phys 2010 132 (15) 154104
123 Brown T L Chemistry The Central Science Pearson Education 2009
124 Gavezzotti A Filippini G Polymorphic Forms of Organic-Crystals at Room
Conditions - Thermodynamic and Structural Implications J Am Chem Soc
1995 117 (49) 12299-12305
125 Karamertzanis P G Prediction of crystal structure of molecular solids PhD
Imperial College London 2004
126 Karamertzanis P G Pantelides C C Ab initio crystal structure prediction II
Flexible molecules Mol Phys 2007 105 (2-3) 273-291
127 Vasileiadis M Kazantsev A V Karamertzanis P G Adjiman C S
Pantelides C C The polymorphs of ROY application of a systematic crystal
structure prediction technique Acta Crystallogr Sect B 2012 68 (6) 677-685
128 Sobol I M On the distribution of points in a cube and the approximate evaluation
of integrals USSR Comp Math Math Phys 1967 7 86-112
129 The NAG Fortran Library Oxford United Kingdom 2013
130 Karamertzanis P G Price S L Energy Minimization of Crystal Structures
Containing Flexible Molecules J Chem Theory Comput 2006 2 (4) 1184-1199
131 Cooper T G Hejczyk K E Jones W Day G M Molecular Polarization
Effects on the Relative Energies of the Real and Putative Crystal Structures of
Valine J Chem Theory Comput 2008 4 (10) 1795-1805
132 Mennucci B Tomasi J Continuum solvation models A new approach to the
problem of solutes charge distribution and cavity boundaries J Chem Phys
1997 106 (12) 5151-5158
133 Habgood M Price S L Portalone G Irrera S Testing a Variety of Electronic-
Structure-Based Methods for the Relative Energies of 5-Formyluracil Crystals J
Chem Theory Comput 2011 7 (9) 2685-2688
134 Karamertzanis P G Pantelides C C Ab initio crystal structure prediction - I
Rigid molecules Journal of Computational Chemistry 2005 26 (3) 304-324
135 Williams D E Improved intermolecular force field for molecules containing H
C N and O atoms with application to nucleoside and peptide crystals J Comput
Chem 2001 22 (11) 1154-1166
Bibliography
173
136 Day G M Motherwell W D S Jones W A strategy for predicting the crystal
structures of flexible molecules the polymorphism of phenobarbital Physical
Chemistry Chemical Physics 2007 9 (14) 1693-1704
137 Kendrick J Leusen F J Neumann M A van de Streek J Progress in Crystal
Structure Prediction Chemistry - A European Journal 2011 17 (38) 10735-
10743
138 Braun D E Karamertzanis P G Price S L Which if any hydrates will
crystallise Predicting hydrate formation of two dihydroxybenzoic acids Chem
Commun 2011 47 (19) 5443-5445
139 Cruz-Cabeza A J Karki S Fabian L Friscic T Day G M Jones W
Predicting stoichiometry and structure of solvates Chem Commun 2010 46 (13)
2224-2226
140 Karamertzanis P G Kazantsev A V Issa N Welch G W A Adjiman C
S Pantelides C C Price S L Can the Formation of Pharmaceutical Co-
Crystals Be Computationally Predicted II Crystal Structure Prediction J Chem
Theory Comput 2009 5 (5) 1432-1448
141 Issa N Barnett S A Mohamed S Braun D E Copley R C B Tocher D
A Price S L Screening for cocrystals of succinic acid and 4-aminobenzoic acid
CrystEngComm 2012 14 (7) 2454-2464
142 Cruz-Cabeza A J Day G M Jones W Structure prediction disorder and
dynamics in a DMSO solvate of carbamazepine Phys Chem Chem Phys 2011
13 (28) 12808-12816
143 Habgood M Form II Caffeine A Case Study for Confirming and Predicting
Disorder in Organic Crystals Cryst Growth Des 2011 11 (8) 3600-3608
144 Torrisi A Leech C K Shankland K David W I F Ibberson R M Benet-
Buchholz J Boese R Leslie M Catlow C R A Price S L The solid phases
of cyclopentane a combined experimental and simulation study J Phys Chem
B 2008 112 (12) 3746-3758
145 Braun D E Karamertzanis P G Arlin J B Florence A J Kahlenberg V
Tocher D A Griesser U J Price S L Solid-State Forms of beta-Resorcylic
Acid How Exhaustive Should a Polymorph Screen Be Cryst Growth Des 2011
11 (1) 210-220
146 Llinas A Goodman J M Polymorph Control past present and future Drug
Discover Today 2008 13 (56) 198-210
147 Arlin J B Price L S Price S L Florence A J A strategy for producing
predicted polymorphs catemeric carbamazepine form V Chem Commun 2011
47 (25) 7074-7076
148 Maddox J Crystals from first Principles Nature 1988 335 (6187) 201
Bibliography
174
149 Day G M Motherwell W D S Ammon H L Boerrigter S X M Della
Valle R G Venuti E Dzyabchenko A Dunitz J D Schweizer B van Eijck
B P Erk P Facelli J C Bazterra V E Ferraro M B Hofmann D W M
Leusen F J J Liang C Pantelides C C Karamertzanis P G Price S L
Lewis T C Nowell H Torrisi A Scheraga H A Arnautova Y A Schmidt
M U Verwer P A third blind test of crystal structure prediction Acta
Crystallogr Sect B 2005 61 (5) 511-527
150 Collins A Wilson C C Gilmore C J Comparing entire crystal structures
using cluster analysis and fingerprint plots CrystEngComm 2010 12 (3) 801-
809
151 Chisholm J A Motherwell S COMPACK a program for identifying crystal
structure similarity using distances J Appl Crystallogr 2005 38 228-231
152 Asmadi A Kendrick J Leusen F J J Crystal Structure Prediction and
Isostructurality of Three Small Molecules Chem Eur J 2010 16 (42) 12701-
12709
153 Macrae C F Bruno I J Chisholm J A Edgington P R McCabe P
Pidcock E Rodriguez-Monge L Taylor R van de Streek J Wood P A
Mercury CSD 20 - new features for the visualization and investigation of crystal
structures J Appl Crystallogr 2008 41 466-470
154 Chisholm J A Motherwell S A new algorithm for performing three-
dimensional searches of the Cambridge Structural Database J Appl Crystallogr
2004 37 331-334
155 Gelbrich T Hursthouse M B Systematic investigation of the relationships
between 25 crystal structures containing the carbamazepine molecule or a close
analogue a case study of the XPac method CrystEngComm 2006 8 (6) 448-460
156 Gelbrich T Hursthouse M B A versatile procedure for the identification
description and quantification of structural similarity in molecular crystals
CrystEngComm 2005 7 324-336
157 McKinnon J J Spackman M A Mitchell A S Novel tools for visualizing and
exploring intermolecular interactions in molecular crystals Acta Crystallogr
Sect B 2004 60 627-668
158 Spackman M A McKinnon J J Fingerprinting intermolecular interactions in
molecular crystals CrystEngComm 2002 378-392
159 Parkin A Barr G Dong W Gilmore C G Jayatilaka D McKinnon J J
Spackman M A Wilson C C Comparing entire crystal structures structural
genetic fingerprinting CrystEngComm 2007 9 648-652
160 McKinnon J J Mitchell A S Spackman M A Hirshfeld surfaces A new tool
for visualising and exploring molecular crystals Chem Eur J 1998 4 (11) 2136-
2141
Bibliography
175
161 Etter M C MacDonald J C Bernstein J Graph-Set Analysis of Hydrogen-
Bond Patterns in Organic- Crystals Acta Crystallogr Sect B 1990 46 256-262
162 Grell J Bernstein J Tinhofer G Graph-set analysis of hydrogen-bond patterns
some mathematical concepts Acta Crystallogr Sect B 1999 55 1030-1043
163 Press W H Flannery B P Teukolsky S A Vetterling W T Numerical
methods the art of scientific computing (Fortran version) Cambridge University
Press Cambridge 1989
164 Galek P T A Novel comparison of crystal packing by moments of inertia
CrystEngComm 2011 13 (3) 841-849
165 Bonnet P A Streek J v d Trask A V Motherwell W D S Jones W The
crystal structure of an unstable polymorph of beta-D-allose CrystEngComm
2004 6 (86) 535-539
166 Potter B S Palmer R A Withnall R Chowdhry B Z Price S L Aza
analogues of nucleic acid bases experimental determination and computational
prediction of the crystal structure of anhydrous 5-azauracil J Mol Struct 1999
486 349-361
167 Nowell H Frampton C S Waite J Price S L Blind crystal structure
prediction of a novel second polymorph of 1-hydroxy-7-azabenzotriazole Acta
Crystallogr Sect B 2006 62 (4) 642-650
168 DOria E Karamertzanis P G Price S L Spontaneous Resolution of
Enantiomers by Crystallization Insights from Computed Crystal Energy
Landscapes Cryst Growth Des 2010 10 (4) 1749-1756
169 Thornber C W Isosterism and molecular modification in drug design Chem
Soc Rev 1979 8 (4) 563-580
170 Singh H Singh Chawla A Kapoor V K Paul D Malhotra R K 4
Medicinal Chemistry of Tetrazoles In Progress in Medicinal Chemistry Volume
17 ed Ellis and G P Ed Elsevier 1980 pp 151-183
171 Lipinski C A Chapter 27 Bioisosterism in Drug Design In Annual Reports in
Medicinal Chemistry Volume 21 ed Denis M B Ed Academic Press 1986
pp 283-291
172 SHELXL97 University of Goumlttingen Goumlttingen Germany 1997
173 Sheldrick G M A short history of SHELX Acta Crystallogr Sect A 2008 64
(1) 112-122
174 Farrugia L WinGX suite for small-molecule single-crystal crystallography J
Appl Crystallogr 1999 32 (4) 837-838
175 Ladd M F C Palmer R A Structure Determination by X-Ray Crystallography
Springer 2003
Bibliography
176
176 Khan S A Reshak A H First Principle Study of Electronic Structure Chemical
Bonding and Optical Properties of 5-azido-1H-tetrazole International Journal of
Electrochemical Science 2013 8 (7) 9459-9473
177 Desiraju G R Hydrogen bridges in crystal engineering Interactions without
borders Accounts Chem Res 2002 35 (7) 565-573
178 Herrebout W A Suhm M A Weak hydrogen bonds - strong effects Phys
Chem Chem Phys 2011 13 (31)
179 Schmidt M W Baldridge K K Boatz J A Elbert S T Gordon M S
Jensen J H Koseki S Matsunaga N Nguyen K A Su S Windus T L
Dupuis M Montgomery J A General Atomic and Molecular Electronic
Structure Systems J Comput Chem 1993 14 1347-1363
180 Cossi M Scalmani G Rega N Barone V New developments in the
polarizable continuum model for quantum mechanical and classical calculations
on molecules in solution J Chem Phys 2002 117 (1) 43-45
181 An email message sent Febrary 2012 to Rex Palmer stated the following we
would be delighted if it were 2nd_23res P21 a = 79 or 1st_120res P21c a =
100 as our two lowest energy structures
182 Allen F H The Cambridge Structural Database A quarter of a million crystal
structures and rising Acta Crystallogr Sect B 2002 58 (3) 380-388
183 Thakur T S Desiraju G R Crystal Structure Prediction of a Co-Crystal Using
a Supramolecular Synthon Approach 2-Methylbenzoic Acid-2-Amino-4-
methylpyrimidine Cryst Growth Des 2008 8 (11) 4031-4044
184 Surov A O Perlovich G L Thermodynamics of sublimation thermophysical
and structural aspects of the molecular crystals of fenamates J Struct Chem
2010 51 (2) 308-315
185 Li H Stowell J G Borchardt T B Byrn S R Synthesis Conformational
Polymorphism and Construction of a GT Diagram of 2-[(2-Nitrophenyl)amino]-
3-thiophenecarbonitrile Cryst Growth Des 2006 6 (11) 2469-2474
186 Pagola S Stephens P W He X Byrn S R Crystal structure solution of the
dark red light red and orange pollymorphs of 5-methyl-2-[(2-nitro-4-
methylphenyl)amino]-3-thiophenecarbonitrile by high resolution X-ray powder
diffraction and simulated annealing techniques Delhez R Mittemeijer E J
Eds 2001 pp 789-794
187 Zhou T Li F Fan Y Song W Mu X Zhang H Wang Y Hydrogen-
bonded dimer stacking induced emission of aminobenzoic acid compounds
Chem Commun 2009 (22) 3199-3201
188 Mei X F August A T Wolf C Regioselective copper-catalyzed amination of
chlorobenzoic acids Synthesis and solid-state structures of N-aryl anthranilic acid
derivatives Journal of Organic Chemistry 2006 71 (1) 142-149
Bibliography
177
189 Alvarez A J Singh A Myerson A S Polymorph Screening Comparing a
Semi-Automated Approach with a High Throughput Method Cryst Growth Des
2009 9 (9) 4181-4188
190 SeethaLekshmi S Guru Row T N Conformational polymorphism in a non-
steroidal anti-inflammatory drug mefenamic acid Cryst Growth Des 2012 12
(8) 4283-4289
191 Dokorou V Kovala-Demertzi D Jasinski J P Galani A Demertzis M A
Synthesis Spectroscopic Studies and Crystal Structures of Phenylorganotin
Derivatives with [Bis(26-dimethylphenyl)amino]benzoic Acid Novel
Antituberculosis Agents Helv Chim Acta 2004 87 (8) 1940-1950
192 Bernstein J Polymorphism - A Perspective Cryst Growth Des 2011 11 (3)
632-650
193 Yu L Stephenson G A Mitchell C A Bunnell C A Snorek S V Bowyer
J J Borchardt T B Stowell J G Byrn S R Thermochemistry and
Conformational Polymorphism of a Hexamorphic Crystal System J Am Chem
Soc 2000 122 (4) 585-591
194 Yang S S Guillory J K Polymorphism in sulfonamides J Pharm Sci 1972
61 (1) 26-40
195 Rossi D Gelbrich T Kahlenberg V Griesser U J Supramolecular constructs
and thermodynamic stability of four polymorphs and a co-crystal of pentobarbital
(nembutal) CrystEngComm 2012 14 (7) 2494-2506
196 Lutker K M Matzger A J Crystal polymorphism in a carbamazepine
derivative Oxcarbazepine J Pharm Sci 2010 99 (2) 794-803
197 Costantino L Barlocco D Privileged Structures as Leads in Medicinal
Chemistry Current Medicinal Chemistry 2006 13 (1) 65-85
198 Keinaumlnen S Similauml S Kouvalainen K Oral antipyretic therapy Evaluation of the
N-aryl-anthranilic acid derivatives mefenamic acid tolfenamic acid and
flufenamic acid Eur J Clin Pharmacol 1978 13 (5) 331-334
199 Andersen K V Larsen S Alhede B Gelting N Buchardt O
Characterization of two polymorphic forms of tolfenamic acid N-(2-methyl-3-
chlorophenyl)anthranilic acid their crystal structures and relative stabilities J
Chem Soc Perkin Trans 2 1989 (10) 1443-1447
200 Mattei A Li T Polymorph Formation and Nucleation Mechanism of
Tolfenamic Acid in Solution An Investigation of Pre-nucleation Solute
Association Pharmaceut Res 2012 29 (2) 460-470
201 Surov A O Szterner P Zielenkiewicz W Perlovich G L Thermodynamic
and structural study of tolfenamic acid polymorphs J Pharm Biomed Anal
2009 50 (5) 831-840
Bibliography
178
202 Brittain H G Polymorphism in Pharmaceutical Solids Informa Healthcare New
York London 2009 Vol 192
203 van de Streek J Motherwell S Searching the Cambridge Structural Database
for polymorphs Acta Crystallogr Sect B 2005 61 504-510
204 Desiraju G R Polymorphism The same and not quite the same Cryst Growth
Des 2008 8 (1) 3-5
205 Bhatt P M Desiraju G R Tautomeric polymorphism in omeprazole Chem
Commun 2007 (20) 2057-2059
206 de Gelder R Wehrens R Hageman J A A generalized expression for the
similarity of spectra Application to powder diffraction pattern classification J
Comput Chem 2001 22 (3) 273-289
207 Bruno I J Cole J C Edgington P R Kessler M Macrae C F McCabe
P Pearson J Taylor R New software for searching the Cambridge Structural
Database and visualizing crystal structures Acta Crystallogr Sect B 2002 58
389-397
208 Allen F H Taylor R Research applications of the Cambridge Structural
Database (CSD) Chem Soc Rev 2004 33 (8) 463-475
209 Kazantsev A V Karamertzanis P G Adjiman C S Pantelides C C Price
S L Galek P T A Day G M Cruz-Cabeza A J Successful Prediction of a
Model Pharmaceutical in the Fifth Blind Test of Crystal Structure Prediction Int
J Pharm 2011 418 (2) 168-178
210 Macrae C F Edgington P R McCabe P Pidcock E Shields G P Taylor
R Towler M van de Streek J Mercury visualization and analysis of crystal
structures J Appl Crystallogr 2006 39 453-457
211 Mattei A Li T L Interplay between molecular conformation and
intermolecular interactions in conformational polymorphism A molecular
perspective from electronic calculations of tolfenamic acid Int J Pharm 2011
418 (2) 179-186
212 Habgood M Grau-Crespo R Price S L Substitutional and orientational
disorder in organic crystals a symmetry-adapted ensemble model Phys Chem
Chem Phys 2011 13 (20) 9590-9600
213 Lancaster R W Karamertzanis P G Hulme A T Tocher D A Lewis T
C Price S L The Polymorphism of Progesterone Stabilization of a
Disappearing Polymorph by Co-Crystallization J Pharm Sci 2007 96 (12)
3419-3431
214 Gavezzotti A The Calculation of Molecular Volumes and the Use of Volume
Analysis in the Investigation of Structured Media and of Solid-State Organic-
Reactivity J Am Chem Soc 1983 105 (16) 5220-5225
Bibliography
179
215 The Free Dictionary defines herringbone as a way of assembling in a diagonal
zigzag manner
216 Desiraju G R On the presence of multiple molecules in the crystal asymmetric
unit (Z gt 1) CrystEngComm 2007 9 (1) 91-92
217 Anderson K M Steed J W Comment on On the presence of multiple
molecules in the crystal asymmetric unit (Z gt 1) by Gautam R Desiraju
CrystEngComm 2007 9 91 CrystEngComm 2007 9 (4) 328-330
218 Delaney S P Smith T M Pan D Yin S Korter T M Cryogenic Phase
Transition in Crystalline Aripiprazole Leads to an Eighth Polymorph Cryst
Growth Des 2014
219 From private communication with Rona Watson at University College London
220 Thompson H P G Day G M Which conformations make stable crystal
structures Mapping crystalline molecular geometries to the conformational
energy landscape Chem Sci 2014 5 (8) 3173-3182
221 Mo Y Gao J Theoretical Analysis of the Rotational Barrier of Ethane Accounts
Chem Res 2007 40 (2) 113-119
222 Pophristic V Goodman L Hyperconjugation not steric repulsion leads to the
staggered structure of ethane Nature 2001 411 (6837) 565-568
223 Halpern A M Glendening E D An intrinsic reaction coordinate calculation of
the torsional potential in ethane Comparison of the computationally and
experimentally derived torsional transitions and the rotational barrier Journal of
Chemical Physics 2003 119 (21) 11186-11191
224 Mulliken R S Intensities of Electronic Transitions in Molecular Spectra IV
Cyclic Dienes and Hyperconjugation 2004 7 (5) 339-352
225 Mo Y Song L Lin Y Block-Localized Wavefunction (BLW) Method at the
Density Functional Theory (DFT) Level J Phys Chem A 2007 111 (34) 8291-
8301
226 Brunck T K Weinhold F Quantum-Mechanical Studies on the Origin of
Barriers to Internal-Rotation About Single Bonds J Am Chem Soc 1979 101
(7) 1700-1709
227 Pendas A Blanco M Francisco E Steric Repulsions Rotation Barriers and
Stereoelectronic Effects A Real Space Perspective J Comput Chem 2009 30
(1) 98-109
228 Surov A O Perlovich G L Emelyanenko V N Verevkin S P
Thermochemistry of Drugs Experimental and First-Principles Study of
Fenamates J Chem Eng Data 2011 56 (12) 4325-4332
229 GaussView version 5 2009
Bibliography
180
230 Clark M Cramer R D Van Opdenbosch N Validation of the general purpose
tripos 52 force field J Comput Chem 1989 10 (8) 982-1012
231 Gavezzotti A Filippini G Geometry of the Intermolecular X-HY (X Y=N
O) Hydrogen- Bond and the Calibration of Empirical Hydrogen-Bond Potentials
J Phys Chem 1994 98 (18) 4831-4837
232 Gavezzotti A Are Crystal-Structures Predictable Accounts Chem Res 1994 27
(10) 309-314
233 Mercury version 31 2013
234 Lozano J J Pouplana R Loacutepez M Ruiz J Conformational analysis of the
antiinflammatory fenamates a molecular mechanics and semiempirical molecular
orbital study Journal of Molecular Structure THEOCHEM 1995 335 (13)
215-227
235 Rappe A K Casewit C J Colwell K S Goddard W A Skiff W M Uff a
Full Periodic-Table Force-Field For Molecular Mechanics and Molecular-
Dynamics Simulations J Am Chem Soc 1992 114 (25) 10024-10035
236 Jorgensen W L Tirado-Rives J The OPLS potential functions for proteins
energy minimizations and crystals of cyclic peptides and crambin J Am Chem
Soc 1988 110 (6) 1657-1666
237 Hopkins C W Roitberg A E Fitting of Dihedral Terms in Classical Force
Fields as an Analytic Linear Least-Squares Problem J Chem Inf Model 2014
54 (7) 1978-1986
238 Wheatley R J Price S L An Overlap Model For Estimating the Anisotropy of
Repulsion Mol Phys 1990 69 (3) 507-533
239 Totton T S Misquitta A J Kraft M A First Principles Development of a
General Anisotropic Potential for Polycyclic Aromatic Hydrocarbons J Chem
Theory Comput 2010 6 (3) 683-695
240 Sorescu D C Rice B M Thompson D L Intermolecular potential for the
hexahydro-135-trinitro-135-s- triazine crystal (RDX) A crystal packing
Monte Carlo and molecular dynamics study J Phys Chem B 1997 101 (5) 798-
808
241 Williams D E Houpt D J Fluorine Nonbonded Potential Parameters Derived
From Crystalline Perfluorocarbons Acta Crystallogr Sect B 1986 42 (JUN)
286-295
242 OBoyle N Banck M James C Morley C Vandermeersch T Hutchison
G Open Babel An open chemical toolbox Journal of Cheminformatics 2011 3
(1) 33
243 Combinations - Rosetta Code
Bibliography
181
244 Hastie T Tibshirani R Friedman J The Elements of Statistical Learning Data
Mining Inference and Prediction Second Edition 2nd ed 2009 Corr 7th
printing 2013 edition ed Springer New York 2011pp 745
245 Schmidt M U Dinnebier R E Kalkhof H Crystal engineering on industrial
diaryl pigments using lattice energy minimizations and X-ray powder diffraction
J Phys Chem B 2007 111 (33) 9722-9732
246 Ahmed S Bidstrup S A Kohl P A Ludovice P J Development of a new
force field for polynorbornene J Phys Chem B 1998 102 (49) 9783-9790
247 Braun D E McMahon J A Koztecki L H Price S L Reutzel-Edens S M
Contrasting Polymorphism of Related Small Molecule Drugs Correlated and
Guided by the Computed Crystal Energy Landscape Cryst Growth Des 2014
14 (4) 2056-2072
248 Ismail S Z Anderton C L Copley R C Price L S Price S L Evaluating
a Crystal Energy Landscape in the Context of Industrial Polymorph Screening
Cryst Growth Des 2013 13 (6) 2396-2406
249 Price L S McMahon J A Lingireddy S R Lau S-F Diseroad B A Price
S L Reutzel-Edens S M A molecular picture of the problems in ensuring
structural purity of tazofelone J Mol Struct 2014 ASAP
250 Kendrick J Stephenson G A Neumann M A Leusen F J Crystal Structure
Prediction of a Flexible Molecule of Pharmaceutical Interest with Unusual
Polymorphic Behavior Cryst Growth Des 2013 13 (2) 581-589
251 Price S L Hamad S Torrisi A Karamertzanis P G Leslie M Catlow C
R A Applications of DL_POLY and DL_MULTI to organic molecular crystals
Mol Simulat 2006 32 (12-13) 985-997
252 Abramov Y A QTAIM Application in Drug Development Prediction of
Relative Stability of Drug Polymorphs from Experimental Crystal Structures J
Phys Chem A 2011 115 (45) 12809-12817
253 Campeta A M Chekal B P Abramov Y A Meenan P A Henson M J
Shi B Singer R A Horspool K R Development of a Targeted Polymorph
Screening Approach for a Complex Polymorphic and Highly Solvating API J
Pharm Sci 2010 99 (9) 3874-3886
254 Klimes J Michaelides A Perspective Advances and challenges in treating van
der Waals dispersion forces in density functional theory J Chem Phys 2012
137 (12) 120901
255 Vasileiadis M Pantelides C C Adjiman C S Prediction of the crystal
structures of axitinib a polymorphic pharmaceutical molecule Chem Eng Sci
2015 121 60-76
256 Smith W Todorov I T Leslie M The DL_POLY molecular dynamics
package Z Kristallogr 2005 220 (5-6) 563-566
Bibliography
182
257 Leslie M DL_MULTI - A molecular dynamics program to use distributed
multipole electrostatic models to simulate the dynamics of organic crystals Mol
Phys 2008 106 (12-13) 1567-1578
258 Koch U Popelier P L A Stone A J Conformational Dependence of Atomic
Multipole Moments Chem Phys Lett 1995 238 (4-6) 253-260
Acknowledgments
5
Acknowledgments
Foremost I would like to thank my supervisor Professor Sally Price for her support
and direction throughout my time at UCL Her encouragement and wise words at the start
of my doctorate program were vital
My sincere gratitude to Louise Price for helping me to understand the practical aspects
of the computational methods of Crystal Structure Prediction (CSP) and for the interesting
and insightful discussions about research and life My colleagues in Room G18 and
friends at UCL made my time there fun inspiring and exciting I would like to thank Rex
Palmer for setting the informal blind test of Chapter 3 and for the subsequent collaborative
paper
Many thanks to the Centre for Doctoral Training in Molecular Modelling and Materials
Science (CDTM3S) at UCL for the rigorous training they gave me during the first year
and the yearly industrial day invitation to present my research The opportunity to work
with sixth form students in the third year sponsored by CDTM3S was one of the most
rewarding experiences I had at UCL
My industrial sponsor Cambridge Crystallographic Data Centre (CCDC) has been
instrumental at every research stage The encouragement received after presenting my
work at the annual CCDC student day was invaluable My industrial supervisors at
CCDCndashndashAurora J Cruz-Cabeza (a year and a half) and Peter Galek (two and a half years)
ndashndashhave been instrumental in collaborative research and publications I appreciate their
insight energy time and encouragement during our many meetings
Finally this work would not be possible without the financial support from the CCDC
and the Engineering and Physical Science Research Council (EPSRC) under the
CDTM3S grant EPG0366751
List of Publications
6
List of Publications
1 Uzoh O G Cruz-Cabeza A J Price S L Is the Fenamate Group a
Polymorphophore Contrasting the Crystal Energy Landscapes of Fenamic and
Tolfenamic Acids Cryst Growth Des 2012 12 (8) 4230-4239
2 Spencer J Patel H Deadman J J Palmer R A Male L Coles S J Uzoh
O G Price S L The Unexpected but Predictable Tetrazole Packing in Flexible
1-Benzyl-1H-Tetrazole CrystEngComm 2012 14 (20) 6441-6446
I carried out all the computational work and prepared the manuscript
3 Uzoh O G Galek P T A Price S L Towards more Accurate Force Fields for
pharmaceutical molecules ndash Analysing the Conformational Energy Profiles of
Fenamates 2014 (Submitted)
Table of Contents
7
Table of Contents
Modelling Molecular Flexibility for Crystal Structure Prediction 1
Declaration 2
Abstract 3
Dedication 4
Acknowledgments 5
List of Publications 6
Table of Contents 7
List of Figures 11
List of Tables 18
List of Abbreviations 20
List of Symbols 21
Chapter 1 Introduction 22
11 Background 22
12 Scope and Outline of Thesis 26
Chapter 2 Theoretical Background 27
21 Overview 27
22 Intermolecular Forces 27
221 Pairwise Additivity 28
222 Physical Origin of Intermolecular Force 29
223 Long-range Interactions 30
224 Short-range Interactions 31
225 Penetration Energy and Charge Transfer 32
23 Modelling the Intermolecular Forces for Organic Molecules 32
231 Repulsion-Dispersion Potentials 33
232 Electrostatics Potential 34
24 Intramolecular Energy 36
25 Force Fields (Atomistic Modelling) 38
251 AMBER 41
252 CHARMM 42
253 Other Force Fields 42
254 The Limits of Current Force Fields 43
Table of Contents
8
26 The Fitting Routine 44
261 Linear Least Square Method 44
262 Subroutine for Solving Least Squares 46
27 Electronic Structure Methods 47
271 Hartree Fock Theory 48
271 Molecular Orbital Theory 48
272 Correlation Effects 49
273 Moslashller-Plesset Perturbation Theory 49
274 Density Functional Theory 50
275 The DFT-D Approach 51
28 Crystal Structure Prediction (CSP) 52
281 CrystalPredictor 54
282 CrystalOptimizer 55
283 Polarizable Continuum Model (PCM) 56
284 Other Approaches to Lattice Energy Minimisation 56
285 The Crystal Energy Landscapes 58
286 The Blind Tests 58
29 Crystal Structure Comparison 59
Chapter 3 An Informal Blind Test A Crystal Structure Prediction of 1-
Benzyl-1H-tetrazole 62
31 Introduction 62
311 Background 62
312 Experimental Determination of 1-Benzyl-1H-Tetrazole 63
313 Molecular Geometry of the Experimental Structure 63
314 Crystal Packing Weak Hydrogen Bonding 64
315 Overview of the Challenge 65
32 Computational Methodology 66
321 Conformational Analysis 66
322 Crystal Structure Prediction 66
33 Results and Discussion 67
331 Conformational Energy Grid 67
332 The CrystalPredictor Energy Landscape 68
333 The CrystalOptimizer and PCM Energy Landscapes 68
334 Did the Predicted Structure Really Match the Experimental 70
335 The Global Minimum Structure on the PCM Energy Landscape 71
336 Post Analysis Comparison of Structure with CSD 73
Table of Contents
9
34 Summary 76
Chapter 4 Is the fenamate group a polymorphophore Contrasting the crystal
energy landscapes of fenamic and tolfenamic acids 77
41 Introduction 77
411 Polymorphism and Polymorphophores 79
412 Conformations in known Crystal Structures 79
413 Experimental Data of FA and TA 80
414 Similarities between the known forms of FA and TA 83
415 Solving the Connectivity Problem of a Disordered Form 84
416 Overview 87
42 Computational Methods 87
421 Ab initio Conformational Profile of TA 87
422 CSD Survey for Fenamates 87
423 Crystal Structure Prediction 88
424 Experimental Crystal Structures with Z´ gt1 90
425 Comparison of Crystal Structures 90
43 Results 91
431 Dependence of Conformational Energy on Method 91
432 Consideration of H-bonded Torsion 92
433 CSD Survey of Fenamates 93
434 Validation of the CrystalOptimizer plus PCM Models 95
435 Energy Landscapes of Intermediate Steps 96
436 Finding and Explaining the Known Structures with CSP 97
437 Other Known Fenamates and their Hypothetical Structures 103
438 Update on a Recently Discovered Polymorph of TA 105
439 The Cost of Lattice Energy Minimisation 106
44 Summary 107
Chapter 5 The Origin of conformational energy barriers in Fenamates 109
51 Introduction 109
511 Background 109
512 Torsional Barrier for Ethane 110
513 Overview 113
52 Method 114
521 Determining Conformation Energy Scan for Isolated Molecule 114
522 Ab initio Conformational Energy Profiles for Fenamates 114
523 Investigation of Electronic Effects 115
Table of Contents
10
524 Investigation of the Steric (Non-Bonded) Effects 116
53 Results 117
531 Effect of Different Definitions of the Same Flexible Bond 117
532 Effect of Step Size on the Conformation Profile of Fenamate Molecule 119
533 Conformational Energy Profile of the Fenamates 122
534 Rigid Versus Relaxed Scans of Fenamates 124
535 Splitting electronic from steric contributions to the barrier to rotation 127
536 Estimating the Steric Contributions with an Atom-Atom Potential 130
537 Investigating the Important Interactions with Atom-Atom Potential 131
54 Discussion The Physical Origins of Torsional Potentials 133
55 Summary 134
Chapter 6 Toward New Force fields for Fenamate Molecules 136
61 Introduction 136
611 Background 136
612 A Case for Modelling Decoupled Intramolecular Energy 137
613 Analytical Models of Intramolecular Energies 138
614 Overview 138
62 Methodology Fitting Analytical Models to Conformational Profiles 139
621 Torsional Potential Model 139
622 AtomndashAtom Model 141
63 Results 144
631 Cosine Series Model 144
632 Rescaled Repulsion Model 146
633 Combined Physical Model 149
634 Transferability 154
64 Summary 157
Chapter 7 Conclusions and Future Work 158
71 Position of CSP in the Context of this Thesis 158
72 Towards more accurate force-fields for pharmaceutical molecules 159
73 Future Work 160
Appendix A 162
Contents of enclosed CD-ROM 162
Bibliography 163
List of Figures
11
List of Figures
Figure 11 Diagrammatic illustration of crystal structure prediction (CSP) methodology
23
Figure 12 A chemical diagram of a target molecule XX from the fifth blind test17 24
Figure 13 The chemical diagram of tolfenamic (TA) and flufenamic (FFA) acids 25
Figure 14 Polymorphs of ROY numbered in the order of discovery The polymorphs
have different colours melting points and molecular conformations (most pronounced in
the torsion angle θ) (Source Ref [20]) 25
Figure 15 Overlay of the experimental conformers of ROY viewed with the overlaid
nitrobenzene fragment horizontal (Source Ref [2]) 26
Figure 21 Typical intermolecular force potential energy functions for spherical atoms
28
Figure 22 Charge distributions corresponding to pure multipoles Blue portions
represent regions where the function is positive and yellow portions represents where it
is negative Qlk is the spherical harmonic multipole where l is angular momentum
quantum number and k = l l-1hellip -l specifies the component of the angular momentum
around the z-axis (Source httpenwikipediaorgwikiSpherical_harmonics [Accessed
11012015]) 35
Figure 23 Schematic representation of conformational change and conformational
adjustment (Source Ref [58]) 37
Figure 24 The schematic view of force field interactions Covalent bonds are solid lines
while the dotted line indicates non-bonded interaction (Source Ref [68]) 39
Figure 25 Schematic view of four key contributions to a molecular mechanics force
field These forces are bond stretching bond stretching angle bending torsional terms
and non-bonded interactions (Source Ref [63]) 39
Figure 26 Schematic view of the torsion angle ξ using the ethane molecule (Source
quantumwisecomdocumentsmanualsvnl-200810_Manualchapmolbuilderhtml
[Accessed 11012015]) 40
Figure 27 Schematic view of some of the common cross terms (Source Ref [63]) 43
Figure 31 The chemical diagram of BT determined from the crystal structure Torsion
angles 1=C7-C6-N1-C5 and 2 = C12-C7-C6-N1 62
Figure 32 The crystal structure of BT (a) Partial view of the crystal packing showing
close CH∙∙∙N contacts between a central tetrazole and six surrounding tetrazoles (b)
Partial view showing CH∙∙∙N CH∙∙∙C and CH∙∙∙ contacts 64
Figure 33 BT crystal structure (a) View of the infinite S-shaped layers held together by
weak CH∙∙∙N and CH∙∙∙C H-bonds (b) Partial view of the layer structure showing
List of Figures
12
alternative B(benzyl) and T(tetrazole) layers and the repeating layer sequence [BTBT |
TBTB] 65
Figure 34 The conformational energy grid used in the search Relative intramolecular
energies ΔEintra (kJ mol-1) for isolated molecule calculations at the MP26-31G(d p)
level of theory 67
Figure 35 The CrystalPredictor energy landscape of BT generated with a crude lattice
energy model The generated structure that matched the experimental structure is
highlighted in the open red symbol 68
Figure 36 (a) The CrystalOptimizer (step 3) and (b) PCM (step 4) energy landscape
of BT GM is the global energy minimum The open red symbol represents a match
between the experimental crystal structure and the generated structure The energy
ranking of the crystal structure that matches the experimental has improved from fourth
most stable 4 to second most stable 2 69
Figure 37 The 15-molecule overlay between the experimental (atomic colours) and the
second most stable computed structure 2BT_23 (green) The direction of the view
obscures some of the molecules 71
Figure 38 Crystal Packing Similarity between experimental (grey) and the most stable
predicted structure (1BT_120 green) with only 2 molecules matching (RMSD2 = 1072
Aring) 72
Figure 39 The structure corresponding to the global minimum in lattice energy
(1BT_120) showing the dominant weak H-bonds (Aring) eight of type CH∙∙∙N and one
CH∙∙∙C and the weak ∙∙∙ interaction (benzylmiddotmiddotmiddotbenzyl) 72
Figure 310 Query used in Conquest to search the CSD for similar fragments 73
Figure 311 Histograms showing the bond length distributions of 32 1-susbtituted 1H-
tetrazole rings in the CSD The red square denotes the experimental bond lengths in BT
while the black square denotes the ab initio bond lengths in the corresponding calculated
structure 2BT_23 74
Figure 312 Histograms showing the distributions of the torsions and angles of the 32-
tetrazole rings found during the CSD survey The experimental bond length in BT is
denoted by the red square while the ab initio bond length in the corresponding calculated
structure 2BT_23 is denoted by the black square 75
Figure 41 The polymorphophore families of ROY and fenamic acid The numbers of
polymorphs in the Cambridge Structural Database (CSD) follow the refcodes for each
specific molecule and (x) denotes the number of additional polymorphs that whose
crystal structures were not available The lowest two rows are fenamates whose structures
are used in Table 46 78
Figure 42 Overlay of the experimental conformers of FA (top) and TA (bottom) viewed
with the overlaid benzoic acid fragment arranged horizontal FA QQQBTY02 (Z´=2
light blue and magenta) TA KAXXAI01 (Form I Z´=1 blue) KAXXAI (Form II Z´=1
red) KAXXAI02 (Form III Z´=2 green and purple) KAXXAI03 (Form IV Z´=3
yellow brown (obscured by yellow) and black) and KAXXAI04 (Form V Z´=1
disordered on both sites (section 415) violet and grey) The arrows point to the main
List of Figures
13
variation (ξ1) between the conformers of FA and TA in the experimental crystal
structures 80
Figure 43 Temperature dependence of the enthalpy (H) and free energy (G) diagrams
for forms I and II of TA showing a monotropic (top) relationship from data from
Surov201 which are qualitatively the same as data from Andersen199 and an enantiotropic
(bottom) relationship from data from Mattei and Li200 82
Figure 44 Features of the experimental crystal structures (a) The hydrogen-bonded
dimer motif found in all structures with variations in the phenyl ring orientations (ξ1)
The specific illustration shows the packing similarity between FA (QQQBTY02) and TA
form II (KAXXAI) (b) The unique packing of TA form II with short contacts between
chlorine and the aromatic ring (c) Crystal Packing Similarity between form III and form
IV of TA showing the 11-molecule overlay which includes only two dimers 84
Figure 45 (a) Crystal structure KAXXAI04 of form V of TA (b) The atom connectivity
of the two new components (colour red and blue) the original C-N connectivity is
labelled green (c) Chemical diagram showing the atomic connectivity of TA 85
Figure 46 Ordered Z=2 crystal structures formed from the disordered components of TA
form V (a) Form V_a (b) Form V_b and (c) Form V_c 86
Figure 47 Query fragment and the torsion angle ξ1 measured in the Conquest207 survey
of the CSD structures There were 131 organic structures where Y=H and 94 where Yne
H 88
Figure 48 The fragment used in the CrystalPredictor search for TA Each fragment was
kept rigid during the search for hypothetical crystal structures 89
Figure 49 The degrees of freedom optimized by CrystalOptimizer for crystal structures
of FA and TA (ξ1equiv C7-N1-C8-C9 ξ2equiv C2-C7-N1-C8 ξ3equiv O1-C1-C2-C7 ξ4equiv H1-O1-C1-C2
and ξ5equiv C8-C13-C14-H10 θ1equiv H6-N1-C8 θ2equiv H1-O1-C1) 89
Figure 410 The relative conformational energy of isolated TA molecules as a function
of the ξ1 The MP2 and PBE0 method at 6-31G(dp) basis set compared with the other
method (top) and the other basis sets (bottom) for the PBE0 method 91
Figure 411 The relative conformational energy as a function of the ξ2 (Figure 49) for
FA and TA calculated at the PBE06-31G(dp) level of theory 92
Figure 412 The relaxed conformational energy scan of FA and TA as a function of ξ1 at
the PBE06-31+G(d) level of theory (a) Includes the experimental values of ξ1 marked
for TA and FA with the symmetry equivalent FA conformations denoted by open black
squares and an insert diagram showing the steric hindrance for TA in the high-energy
region A histogram of (b) 131 crystal structures found in the CSD search (Figure 47)
with Y=H plus symmetry equivalent structures and (c) 94 crystal structures with YneH
94
Figure 413 Crystal energy landscape of TA for the Z´=1 structure after (a)
CrystalPredictor (Step 1) (b) the single conformer calculation of Eintra and the atomic
multipoles at the PBE06-31G(dp) level of theory (Step 2 of section 423) 96
Figure 414 The crystal energy landscapes of FA (top) and TA (bottom) Each symbol
represents a crystal structure of the specified space group which is a minimum in the
List of Figures
14
lattice energy (calculated within the polarizable continuum) The open symbols
correspond to the minima starting from the experimental structures (Table 43) The
packing coefficient is the proportion of the cell volume occupied by the molecule214
calculated using a grid spacing of 01 Aring 98
Figure 415 (a) Overlay of the only known form of FA (grey) and the most stable
structure on the Z´=1 crystal energy landscape (Figure 414a) 1FA_22 (green) with an
RMSD5 value of 175Aring (b) Overlay of the conformers of form I (pink and light blue) and
1FA_22 (black) 100
Figure 416 (a) Overlay of the two most stable hypothetical crystal structures on the
crystal energy landscape global minimum 1FA_22 (grey) and 2FA_2 (green) with
ΔElatt=20 kJ mol-1 The crystal structures overlaid 12 molecules with RMSD12 of 051 Aring
and the conformations had an RMSD1 of 009 Aring (b) Overlay of 2FA_2 (green) and the
experimental crystal structure of FA (grey) with a RMSD15 of 123 Aring obtained with a
distance and angle tolerance of 50 and 50deg (c) Overlay of the two independent
molecules in the experimental structure (grey) with 2FA_2 (green) 101
Figure 417 The overlay of the experimental Z´=1 crystal structures (grey) of TA with
the closest structure found in the search (green) (a) Form I and 1TA_8 overlaid with an
RMSD15 value of 032Aring (b) Form II and 5TA_38 overlaid with an RMSD15 value of
026Aring 102
Figure 418 Classification of the crystal energy landscape of FA in terms of the similarity
of the structures to those of known TA polymorphs (I-IV) without PCM (hence the
different y-axis compared to Figure 414a) Numbers in bold indicate the number of
molecules that overlay with the known structure of FA Hence a label 5 6 on a structure
represented by a blue circle means that the structure overlaid 5 molecules with the
experimental form of FA but 6 with form I of TAEach point is coloured by the TA
polymorph with which it overlaid the greatest number n of molecules in a Crystal Packing
Similarity calculation that ignored the CH3 and Cl 103
Figure 419 Overlay of FA_137 (green) and the major component of experimental
crystal structure of TA form VI (grey) with a RMSD15 of 030 Aring obtained with a distance
and angle tolerance of 50 and 50deg 106
Figure 420 CPU timings of (a) 38_TA (form II) and (b) 137_TA (form VI section
438) after lattice energy minimisation using CrystalOptimizer (step 3) 107
Figure 51 The fenamate family showing the low barrier torsion angle (=C7-N1-C8-C9)
=0 when the aromatic rings are coplanar as drawn The fenamates family mentioned in
this chapter includes fenamic acid (FA) R1= R2= H tolfenamic acid (TA) R1= CH3 R2=
Cl mefenamic acid (MA) R1= R2= CH3 clofenamic acid (ClFA) R1=H R2=Cl and
flufenamic aid (FFA) R1=H R2=CF3 The dotted line represents an intramolecular
hydrogen bond 109
Figure 52 Illustration of the barrier to rotation with the relaxed conformational energy
profile of FA 110
Figure 53 The staggered and eclipsed conformations of the ethane molecule (Sources
Ref [222] and enwikipediaorgwikiAlkane_stereochemistry [Accessed 11012015])
111
List of Figures
15
Figure 54 (a) Hyperconjugation effects on the staggered (b) Pauli exchange repulsion
in the eclipsed conformation (Source enwikipediaorgwikiHyperconjugation
[Accessed 11012015]) 112
Figure 55 Electrostatic steric repulsion (between electrons on the bond black arrow) for
the eclipsed conformation of ethane The red arrow indicates exclusion of van der Waals
repulsion since the van der Waals radii of the hydrogen are too small to make contact
(Source enwikipediaorgwikiConformational_isomerism [Accessed 11012015]) 113
Figure 56 Chemical diagram of model molecules used to investigate the electronic
contributions The bonds around N1 are constrained to be planar (ie R2-N1-H6-C8=180deg)
for phenylamine (PA) R1=R2=H N-methylaniline R1=H R2= CH3 N-vinylaniline R1=H
R2 = CH=CH2 and 3-anilinoprop-2-enoic acid R1=H R2 = CH=CHCO2H for 3-
chloroaniline R1= Cl R2=H and 3-methylaniline R1=CH3 R2=H (=R2-N1-C8-C9) 115
Figure 57 Pyramidalization in unconstrained phenylamine (PA) molecule caused by
lone pair on nitrogen atom 115
Figure 58 Relaxed scan of TA at the PBE06-31+G(d) level of theory with the different
definitions of flexible N1-C8 bond (= C7-N1-C8-C9 2= C7-N1-C8-C13
3=H6-N1-C8-C9
and 4= H6-N1-C8-C13) used as the constrained geometric parameter 118
Figure 59 Molecular conformation of the relaxed gas phase at PBE06-31+G(d) showing
the bond lengths of the phenyl C-C bond (=180) of FA 120
Figure 510 Relaxed scans of FA at PBE06-31+G(d) with step sizes 2 and 1deg around the
maxima and minima respectively The red circles indicate the starting points of the scans
while the arrows indicate the directions of the scans 121
Figure 511 Relaxed conformational scans at the PBE06-31+G(d) level of theory for the
fenamates The minima were at ξ=3894deg and 14471deg for FA 4063deg and 11186deg for
TA 4408deg and 11048deg for MA and 3586deg and 14838deg for ClFA 122
Figure 512 Relaxed conformational scans of fenamates (a) FA (b) TA (c) MA and (d)
ClFA at HF and PBE0 method with 6-31+G(d) basis set These are contrasted with the
single-point energies at the MP26-31+G(d) level and within a polarizable continuum
model (PCM) with =3 for the PBE06-31+G(d) conformations 123
Figure 513 Comparison of relaxed (solid) and rigid (dotted line) scan of FA (top) TA
(middle) and MA (right) For the rigid scans calculations were performed using HF MP2
and PBE0 methods with 6-31+G(d) basis set as a function of torsion angle The relaxed
scans from Figure 511 were performed at the PBE06-31+G(d) level of theory 125
Figure 514 Overlay of relaxed (coloured by element Figure 511) and rigid (red Figure
513) conformations of FA (top) TA (middle) and MA (bottom) overlaying the atoms
defining the ξ torsion angle at the PBE06-31+G(d) level of theory 126
Figure 515 The solid black lines show the relaxed torsional scans of planar-N-
constrained models for the phenyl rotation (Figure 56) where the benzoic acid group of
FA has been replaced by (a) hydrogen atom (PA) (b) methyl (c) vinyl and (d) prop-2-
enoic acid and the hydrogen in the meta position of PA has been replaced by (e) chlorine
and (f) methyl using HF PBE0 and MP2 methods with the 6-31+G(d) basis set Plots of
(h2)(1-cos(2)) where h is the height of the barrier of relaxed PBE06-31+G(d) scans
List of Figures
16
are shown in green For (c)-(f) the PBE06-31+G(d) relaxed scans of PA from (a) are
shown in grey for comparison In (a) and (b) a rigid scan at the PBE06-31+G(d) level of
theory is shown by a dotted line 127
Figure 516 The electron density surface of HOMO frontier orbitals for different
conformations of PA (top) FA (middle) and TA (bottom) obtained from the PBE06-
31+G(d) level of theory Contour map isovalues were drawn at a 002 au level 129
Figure 517 Alternative HOMO isosurface view of (a) FA and (b) PA molecule at =90
from Figure 516 129
Figure 518 HOMO-10 (46 MOs) isosurface view of side (top) and front (bottom) FA
molecule at =0 40 and 90 130
Figure 519 Comparison of the ab initio (black) intramolecular energy scans at the
PBE06-31+G(d) level of theory for FA (top) and TA (bottom) with Gavezzottirsquos exp-6
intramolecular energy models summed over all intramolecular atom-atom distances from
the third nearest neighbour (1-4) and above The net effect (purple) is subdivided into the
repulsive (red) and dispersion (blue) contributions 131
Figure 61 The fenamate family showing the low-barrier torsion angle (=C7-N1-C8-C9)
and atomic numbering =0 when the aromatic rings are coplanar as drawn The
fenamates mentioned in this chapter are fenamic acid (FA) R1= R2= H tolfenamic acid
(TA) R1= CH3 R2= Cl mefenamic acid (MA) R1= R2= CH3 flufenamic acid (FFA) R1=
H R2= CF3 and clorofenamic acid (ClFA) R1=H R2=Cl The dotted line represents an
intramolecular hydrogen bond 137
Figure 62 Relaxed conformational scans at the PBE06-31+G(d) level of theory for the
fenamates from section 533 Fenamic acid (FA) tolfenamic acid (TA) mefenamic acid
(MA) and chlorofenamic acid (ClFA) 137
Figure 63 An algorithm showing the overview of modelling ab initio intramolecular
energy using a cosine series potential The source codes are included in the CD ROM
attached to this thesis (see Appendix A) 140
Figure 64 An algorithm showing the modelling of ab initio intramolecular energy by a
physical potential The source codes are included in the CD ROM attached to this thesis
(see Appendix A) 141
Figure 65 Comparison of the ab initio relaxed scan at the PBE06-31+G(d) level of
theory with linearly fitted least square cosine series model for FA (top) and TA (bottom)
with Nk=5 (red lines) the optimal cos4 terms (blue lines) and Nk=21 (green lines σintra
=017 kJ mol-1 for FA and TA) 145
Figure 66 Plot of the standard error of the intramolecular energies against the number of
cosine terms Nk for FA (top) and TA (bottom) The fit is ill-determined ie there is no
unique solution for TA after Nk=21 146
Figure 67 Comparison of the relative energies from ab initio calculations (solid black
lines) of FA (top) and TA (bottom) with selected best-fit exp-6 rescaled repulsion models
For FA the selected Nk=3 intra=032 kJ mol-1 model had βC-H=-453 βH-H=270 and
Ebase=-506 while the Nk =4 intra=027 kJ mol-1 model had βCH=-446 βH-H=210 βH-
List of Figures
17
HB=257 and Ebase=-875 For TA the selected Nk=6 (intra=034 kJ mol-1) and 10
(intra=022 kJ mol-1) parameter fits are shown bold in Table 63 147
Figure 68 Gavezzotti exp-6 potential for all atomndashatom interactions in fenamates
displayed in two different energy scales The parameters are from Chapter 5 (Table 52)
150
Figure 69 Comparison of the relative energies from ab initio calculations (solid black
lines) of FA (top) and TA (bottom) with selected physical models For FA the selected
Nk=6 intra=026 kJ mol-1 model has βC-HB =801 γC-HB =1654 βH-H =1074 γH-H =58 α=-
339 and Ebase=-12383 whilst the Nk =6 intra=028 kJ mol-1 model has β C-H =028 γ C-
H =783 β H-HB = 1109 γ H-HB =3479 α=-117 and Ebase=-7549 For TA parameters for
the selected Nk=8 (intra=015 kJ mol-1) and 10 (intra=008 kJ mol-1) are in ghTable 66
153
Figure 610 Comparison of the relative energies from ab initio calculations (solid black
lines) with models using transferred βικ and γικ parameters from FA and TA (dotted grey
plots) to ClFA (top) and MA (bottom) respectively The red curve has only had the
baseline adjusted whereas the blue curve had the parameter refitted to ClFA or MA
respectively The transferred FA parameters are those Nk=6 fit=028 kJ mol-1 in Figure
69 while those of TA Nk= 10 fit= =026 kJ mol-1 are shown in iTable 66 155
Figure 611 Comparison of the relative energies from ab initio calculations (solid black
lines) with models using βικ and γικ parameters transferred from TA (dotted grey plots) to
(a) FA and (b) ClFA The red curve has only had the baseline adjusted whereas the blue
curve has the parameter refitted to FA or ClFA respectively The transferred TA
parameters are those of Nk= 10 fit= 026 kJ mol-1 as shown in iTable 66 156
List of Tables
18
List of Tables
Table 31 Angles and bond lengths of the tetrazole ring in BT No information about the
bonds or angles were given to me prior to submission of the candidate structures 64
Table 32 Summary of experimental (highlighted in blue) and computed crystal
structures on the PCM energy landscape (Figure 36) The computed structure that
matched the experimental structure (section 312) is highlighted in bold For label
xBT_y x and y are energy ranked after steps 4 and 1 of CSP respectively (section 322)
70
Table 41 The experimental data of the known forms of FA and TA Crystal structures
and Hfus values were taken from ref [19] unless otherwise specified aThe most widely
varying torsion angle ξ1 is defined in Figure 49 bTemperature of crystal structure
determination cMelting temperature 81
Table 42 Quantification of the similarities of FA and TA crystal structures showing the
packing similarity (RMSDn) and powder X-ray diffraction (PXRD) similarity206 The
bold numbers indicate the number of molecules n that match within distance and angle
tolerances of 20 and 20deg respectively with the RMSDn values in brackets See section
425 83
Table 43 Comparison of the lattice energy minimum with the experimental structure
used as a starting point for the final lattice energy model (PBE06-31+G(d) PCM) for
the ordered structures of FA and TA The three form V Z=2 model structures derived
from the disorder components of TA (section 415) are also compared with the starting
model RMSDn corresponds to n=15 unless (n) is given 95
Table 44 The lattice energy minima of FA shown in Figure 414a The minimum found
starting from the experimental structure is in bold 99
Table 45 The lattice energy minima of TA shown in Figure 414b Minima found starting
from the experimental structures or ordered models are in bold 99
Table 46 Crystal Packing Similarity comparisons of the experimental structures of FA
and TA and their most stable hypothetical crystal structures with the crystal structures of
the other fenamates shown in Figure 13 The similarity is given in the form n(RMSDn)
with n gt 4 molecules highlighted 104
Table 47 An extension of Table 46 showing Crystal Packing Similarity comparisons of
the latest structures of flufenamic acid18 and the experimental structures of FA and TA
and their most stable hypothetical crystal structures 105
Table 48 Crystal Packing Similarity calculations of the known forms of TA and
unobserved thermodynamically competitive crystal structures The similarity between
the structures is given in the form n(RMSDn) where n is the number of molecules overlaid
and the value in brackets is the RMSDn overlay Structures with the highest similarity are
highlighted 105
Table 51 Torsional barrier height of ethane (Source Reproduced from Ref [223]) 111
List of Tables
19
Table 52 Gavezzottirsquos exp-6 atom-atom parameters E=Aexp(-BR)-CR-6 is the well
depth and Rm is the distance at the minimum41231232 Italics represent the hydrogen-
bonded interactions aFrom the UNI intermolecular potential function of Mercury233 116
Table 53 Torsional barrier height of the relaxed conformational energy profiles in Figure
58 for TA 119
Table 54 Comparison of intramolecular energies and hydrogen bond distances of TA for
the near-planar conformer 119
Table 55 Comparison of the intramolecular energies and the N-H7∙∙∙HX-C14 bond
distances of TA for the near-planar conformer where HX-C14 is the methyl group 119
Table 56 Atom-atom interactions of FA that dominate the intramolecular energies as
estimated using Gavezzottirsquos exp-6 potential The interaction is listed as dominant if the
difference between the minimum and maximum total energy (Erepul-dis) is greater than or
equal to 1 kJ mol-1 132
Table 57 Atom-atom interactions of TA that dominate the intramolecular energies as
estimated from Gavezzottirsquos exp-6 potential The interaction is listed as dominant if the
difference between the minimum and maximum total energy (Erepul-dis) is greater than or
equal to 1 kJ mol-1 dInteractions between atoms on the same aromatic ring fInteractions
involving the methyl substituent 132
Table 61 Contrasting the atomndashatom interactions of FA and TA that dominated the
intramolecular energies formed by combining Table 56 and Table 57 from Chapter 5
Interactions unique to FA and TA are coloured blue and red respectively dInteractions
between atoms of the same aromatic ring fInteractions involving the methyl substituent
143
Table 62 Complete set of results after rescaling Nk (repulsion contributions and
baseline energy Ebase) parameters of various interacting atomic types for FA 148
Table 63 Summary table of the best results after rescaling Nk (repulsion contributions
and baseline energy Ebase) parameters of various interacting atomic types for TA
148
Table 64 All fits obtained for FA with the physically correct sign for the repulsion
and dispersion and electronic parameters 149
Table 65 The rescale parameters for the repulsion ικ dispersion ικ and electronic
contributions of the physical exp-6 and cos2 model for all possible combinations of atom
type interactions C∙∙∙C C∙∙∙H C∙∙∙HB H∙∙∙H and H∙∙∙HB for FA Nk are the number of
fitted rescale parameters ικ and ικ and the baseline energy Ebase 151
Table 66 The rescale parameters for the repulsion ικ dispersion ικ and electronic
contributions of the physical exp-6 and cos2 model for all possible combinations of atom
type interactions C∙∙∙C C∙∙∙Cl C∙∙∙H C∙∙∙HB Cl∙∙∙H C∙∙∙N H∙∙∙H and H∙∙∙HB for TA Nk
are the number of fitted rescale parameters and Ebase is the baseline energy ghThe
parameters used in Figure 69b and ifor testing transferability in Figure 610b and Figure
611 152
List of Abbreviations
20
List of Abbreviations
CCDC Cambridge Crystallographic Data Centre
CSP Crystal Structure Prediction
API Active Pharmaceutical Ingredient
DFT Density Functional Theory
HFSCF Hatree ForkSelf Consistent Field
PBE Perdew Burke and Ernzerhof exchange-correlation functional
B3LYP Becke three-parameter Lee-Yang-Parr
MP-n Moslashller-Plessett nth order of pertubabtion
PCM Polarizable Continuum Model
DMA Distributed Multipole Analysis
GDMA Gaussian Distributed Multipole Analysis
BT 1-Benzyl-1H-Tetrazole
FA Fenamic Acid
TA Tolfenamic Acid
PA Phenylamine (Aniline)
n-MA N-Methylaniline
MA Mefenamic Acid
List of Symbols
21
List of Symbols
Flexible torsion angle
Np Number of data points
Nk Number of fitted coefficients
Na Number of atoms
Xij Regressors i = 1hellip Np j = 1hellip Nk
Yi Regressand i = 1hellip Np
Elatt Lattice energy
Eintra Intramolecular energy relative to the most stable conformation
Uinter Intermolecular energy
11 Background
22
Chapter 1 Introduction
ldquoMay the Force be with yourdquo
mdash General Dodonna Star Wars A New Hope
11 Background Polymorphism the ability of a molecule to crystallise or pack in more than one
structural form1 is a phenomenon that though common is not completely understood
The phenomenon which has been the subject of long and extensive research is of crucial
importance in many branches of the chemical industry Most of all in the pharmaceutical
industry because polymorphs can show significant differences in properties such as
solubility and dissolution rate2 which in turn affect the bioavailability of drug
formulations as well as their melting point physicochemical stability and mechanical
properties3
Researchers recognise that the polymorphic differences among molecules can be
exploited to take advantage of better compactibility or powder flow rate In addition a
thermodynamically metastable form may be chosen to improve drug administration as
such a form may have a higher dissolution rate than a more stable polymorph3 A third
reason for the increasing industrial interest in polymorphism is the need to protect
intellectual property as different patents can protect the different polymorphs of an active
pharmaceutical ingredient (API)
Polymorphism is common with about one-third of all APIs confirmed to be
polymorphic4 yet not so long ago the concept of polymorphism was either treated as an
annoyance or completely ignored by academics The dismissive attitude changed after the
sudden emergence of a new polymorph of the drug ritonavir a protease inhibitor for the
HIV virus Production had to stop as Abbott Laboratories (the manufacturer) was forced
to embark upon an expensive reformulation of the drug The more stable polymorph of
the API was discovered after capsules suddenly started failing dissolution tests two years
after the drug had been launched on the market5 The ritonavir incident taught the
pharmaceutical industry that the best insurance against such surprises is to conduct an
exhaustive experimental search before going to market6 a view that has since led to
regulations requiring extensive screening and process control for polymorphs in APIs and
inactive pharmaceutical ingredients 7
11 Background
23
The unexpected emergence of the new ritonavir polymorph despite proactive attempts
to discover polymorphs before the drug was marketed forcibly reminded us that
metastable polymorphs can appear to be kinetically stable1 If Abbot Laboratories had
computed the energies of possible polymorphs for ritonavir before marketing the drug
the company may have been able to prevent a multi-million dollar problem As Graeme
Day6 noted lsquocomputational methods of predicting crystal structures could play a large
part in this research both in identifying all possible polymorphic forms and judging their
relative stabilities ndash an examination and evaluation of all possible crystal structures of a
given compound is a step towards the understanding and perhaps control of
polymorphismrsquo Given the ubiquity and importance of polymorphs it is clear that
researchers need a computer tool that is capable of postulating possible crystal structures
of organic molecules before synthesis especially since a ldquostandardrdquo experiment that
guarantees the finding of all crystalline forms is impossible89
Crystal Structure Prediction (CSP Figure 11) is the ability to predict using
computational methods how a molecule will crystallise (ie unit cell space group and all
atomic positions) given only its chemical diagram10-12 CSP has been a long-standing
goal in computational materials chemistry for its potential to predict possible polymorphs
CSP is vital to the pharmaceutical industry because a successful search method would
smooth the process of manufacturing and patenting crystalline products13
Figure 11 Diagrammatic illustration of crystal structure prediction (CSP) methodology
11 Background
24
The international blind tests14 organised by the Cambridge Crystallographic Data
Centre (CCDC) is a collaborative effort that charts the progress and state of the art in
predicting the crystal structures of small organic molecules Since the first blind test in
1999 there have been five more challenges issued by the CCDC and Figure 12 shows
how complex the target molecule can be The sixth and most recent blind test15 was issued
on September 1 2014 Scientific insight can be gained from successful CSP studies as
these methods reflect the factors that control the crystallisation process16
Figure 12 A chemical diagram of a target molecule XX from the fifth blind test17
Most CSP methodologies as we shall see in section 28 assume that the experimentally
observed crystal structures are the most stable thermodynamic structures on the crystal
energy surface In other words the temperature effects are ignored because of poor
thermal results obtained in the past for organic molecules Therefore a better method is
needed for computing the thermal effects of organic molecules This thesis takes the first
step towards accurate thermal effects calculations and Molecular Dynamics simulations
by deriving new force fields that accurately model the intramolecular energies These
discoveries on thermal effects will advance polymorph prediction
Conformational flexibility is an important property to consider when generating
hypothetical crystal structures for a flexible molecule The modelling of conformation
flexibility is the central theme of this thesis because in many organic molecules the
flexibility leads to polymorphism For example flufenamic acid18 (FFA Figure 13) a
non-steroidal anti-inflammatory drug (NSAID) has nine known polymorphs Another
NSAID tolfenamic acid19 (TA Figure 13) has five polymorphs while ROY (Figure
13) named after its red orange and yellow crystals (Figure 14) has ten known
polymorphs2021
11 Background
25
FFA1822 TA19 ROY20
Figure 13 The chemical diagram of tolfenamic (TA) and flufenamic (FFA) acids
Figure 14 Polymorphs of ROY numbered in the order of discovery The polymorphs
have different colours melting points and molecular conformations (most pronounced in
the torsion angle θ) (Source Ref [20])
Just like FFA and TA the wide range of values for the torsion angle is also present in
ROY (Figure 15) Therefore the origin of polymorphism in these compounds is partly
due to the conformational flexibility of the molecules (see Figure 15 and the red curly
arrows in Figure 13) FFA TA and ROY are also examples of organic compounds that
are considered polymorphophores1923 A polymorphophore is a structural element that
favours the formation of polymorphic crystal forms when incorporated into a molecule
ie molecules with similar fragments are likely to be polymorphic Consequently
conformational flexibility polymorphism and polymorphophore are linked
12 Scope and Outline of Thesis
26
Figure 15 Overlay of the experimental conformers of ROY viewed with the overlaid
nitrobenzene fragment horizontal (Source Ref [2])
12 Scope and Outline of Thesis Chapter 2 examines the theoretical methods relevant to the work presented in this thesis
I will discuss these in several parts intermolecular forces and their models intramolecular
forces electronic structure methods force field methods least square estimation CSP
and crystal structure comparisons Chapters 3 to 6 contain the original work of this thesis
A CSP algorithm CrystalPredictor version 16 is used in Chapters 3 and 4 This
algorithm generates crystal structures while simultaneously varying the low-energy
barrier torsion angles of the flexible molecule Chapter 3 tests the ability of CSP to predict
the crystal structure of the flexible 1-benzyl-1H-tetrazole molecule This chapter is an
informal lsquoblind testrsquo challenge Following this Chapter 4 examines the polymorphophore
concept by investigating two flexible fenamates that are similar but have different
polymorphic behaviours I use CSP and compare the two fenamatesrsquo crystal energy
landscapes Then Chapter 5 investigates the origin of the barrier to rotation of fenamate
molecules Chapter 6 develops new analytical force field models that fit the
intramolecular energy of flexible fenamate molecules as the conformation changes This
chapter investigates three analytical forms the cosine series rescaling repulsion and
combined physical models Finally Chapter 7 offers conclusions and suggests areas for
further research and development
21 Overview
27
Chapter 2 Theoretical Background
ldquoA people without the knowledge of their past history origin and culture is like a tree
without rootsrdquo
mdash Marcus Garvey
21 Overview This chapter discusses the theoretical methods that are relevant to the work completed
in this thesis Central to this research is the evaluation of the lattice energy Elattndashndashthe
sum of the intermolecular energy Uinter and the intramolecular energy ΔEintrandashndashof a
flexible organic molecule Thus section 22 sets out the physical basis for the lattice
energy model by introducing the origin of intermolecular forces Section 23 then
discusses the models of intermolecular contributions of organic molecules Section 24
provides a brief discussion of intramolecular forces because Chapters 5 and 6 investigate
the origin of and derive an analytical model for the intramolecular energies of flexible
molecules Next section 25 discusses some force field methods by way of laying a strong
foundation for the new analytical force fields derived in Chapter 6 After this section 26
discusses the fitting routines coded into the new analytical intramolecular force fields for
flexible organic molecules Section 27 highlights the theoretical background of the
electronic structure methods used to calculate the intramolecular energy of isolated
molecules (Chapters 3 to 5) and the electrostatic contribution to intermolecular energy
(Chapters 3 and 4) Section 28 further discusses Crystal Structure Prediction (CSP)
which was introduced in Chapter 1 Finally section 29 discusses various tools for crystal
structure comparison
22 Intermolecular Forces This section discusses the importance relevance origin and categories of
intermolecular forces The intermolecular force is fundamental in the evaluation of lattice
energy which is central to CSP studies (section 28) in Chapters 3 and 4 Intermolecular
forces are present everywhere in nature and control properties of gases liquids solids
and complexes In science the quantitative study of intermolecular forces can reconcile
diverse phenomena at the atomic and increasingly electronic level24 In pharmaceutical
industries the use of intermolecular forces as a computational tool for predicting new
polymorphs is necessary because of the experimental problems in establishing all
polymorphs that could be manufactured in a controlled way This is essential in
22 Intermolecular Forces
28
preventing another ritonavir disaster (section 11) where a new thermodynamically stable
polymorph started precipitating out of the anti-HIV drug25
Figure 21 Typical intermolecular force potential energy functions for spherical atoms
The intermolecular pair potential U is the interaction energy of a pair of molecules as
a function of their separation R and orientation This definition applies to rigid
molecules Intermolecular forces are repulsive at short-range and attractive at long-range
Liquids and solids exist because molecules attract one another when they are far apart26
The fact that water has a definite density meaning it cannot be easily compressed to a
smaller volume shows that at short-range the forces between the molecules become
repulsive26 The relationship between this energy of interaction U as a function of
distance R takes the form shown in Figure 21 Figure 21 has an attractive region at
long-range where the force is negative and a steep repulsive region at short-range to
account for the low compressibility of condensed materials
221 Pairwise Additivity Due to the difficulty and computational expense of modelling intermolecular
interactions this thesis makes some approximations to the sum of the intermolecular
energies One such approximation is the pairwise additivity which assumes that the
energy of a system is the sum of all two-body interactions26 For instance for three
molecules A B and C the pairwise approximation to the total energy is UAB+UBC+UAC
22 Intermolecular Forces
29
222 Physical Origin of Intermolecular Force The significant forces between molecules have an electromagnetic origin27 Strong and
weak nuclear forces do not contribute to the intermolecular force because they are
significant over a range of the order of 10-4 nm this is extremely small compared to
molecular dimensions which are typically 05 nm The gravitational force which is long-
range does not contribute to the intermolecular force because the gravitational potential
energy of two atoms 04 nm apart is only 7 x 10-52 J some thirty orders of magnitude
smaller than the typical intermolecular force28 Consequently the intermolecular forces
have an electromagnetic origin
The work reported in this thesis will focus on closed-shell ground state molecules
Resonance interactions do not occur between ordinary closed-shell molecules in their
ground state Magnetic interactions are several orders of magnitude smaller and are not
significant to the intermolecular forces Therefore these two contributions will not be
considered any further
Intermolecular forces are of quantum mechanical origin and can in principle be
determined by solving Schroumldingerrsquos equation and using the Born-Oppenheimer
approximation (ie nuclei are in fixed positions) The physical origin of the
intermolecular force from perturbation theory is as follows
4
a b
a A b B o ab
e eH
r
21
where ea is the charge on particle a one of the particles of molecule A and rab is the
distance between it and the particle b in molecule B The Hʹ is the perturbation on HA +
HB and consists of electrostatic interactions between the particles of a (electron and
nuclei) and those of b
The intermolecular force F and intermolecular energy U are related
U
FR
22
where R is the distance between the spherical molecules
When considering the intermolecular potentials it is helpful to separate various
contributions These contributions of intermolecular energy can be separated into two
Perturbation theory finds approximate solution to problem by starting from the exact
solution of a related problem It is can be used for describing intermolecular forces
because they are relatively weak
22 Intermolecular Forces
30
main types short-range and long-range interactions Israelachvili29 argued against
making this distinction due to the danger of counting twice which can happen in
theoretical analysis when forces with the same physical origin are both short-ranged and
long-ranged
223 Long-range Interactions If the interacting molecules are far enough apart ie long-range then the perturbation
theory becomes simpler because the overlap between the wavefunctions of the two
molecules can be neglected This is called the polarization approximation which was
first formulated by London30 in 193631 Three main types of long-range interactions exist
electrostatic induction and dispersion These long-range contributions vary by R-n
Electrostatic
The electrostatic force is a classical Coulombic interaction which arises from the
interaction between the static charge distributions of two molecules This force can be
attractive or repulsive but is strictly pairwise additive and dependent on orientation
Therefore the electrostatic force plays an important role in determining the structure
adopted by the solid state If ρA(r) is the charge density for molecule A then equation 21
becomes
3 3
00
( ) ( )d d 0 0 0 0
4
A BA B A B
o
H W
r r
r rr r
23
The first-order energy described the electrostatic interaction The electrostatic
expression in equation 23 is the exact classical Coulombic interaction energy of two
molecular charge distributions at long-range
Induction
The induction effects a second-order energy arise from the distortion of a particular
molecule in the electric field of all its neighbours and are always attractive These effects
are non-additive because the fields of several neighbouring molecules may reinforce or
nullify each other26 The induction energy of molecules A and B are considered separately
The induction contribution of molecule A in state m and non-degenerate ground state 0
is
The induction energies are always attractive because distortion only occurs when there
is a lowering of energy Because the energies are non-additive they are difficult to
implement computationally32 The inclusion of the explicit induction to the
0 0
0 0 0 0 0 0A B A B A B A B
A
ind A Am m
H m m HU
W W
24
22 Intermolecular Forces
31
intermolecular energy can significantly reorder the relative energies of a molecule33
especially for large molecules like carbamazepine32 The distributed polarizability can be
used to model the induction energy as Gareth Welch34 did However this approach is
computationally demanding because a large basis set and high-quality wavefunctions are
often required32 for convergence criteria to be met In this thesis the induction energy is
not modelled explicitly Instead it uses PCM (Polarizable Continuum Model section
283) to model the polarization effect that arises from the electrostatic interactions in a
solvent medium29
Dispersion
Dispersion is a universal force of quantum mechanical origin We know that because
electrons are in continuous motion their electron density oscillates continuously
producing instantaneous electric dipoles that change as the electron density changes The
instantaneous dipole in one molecule induces another electric dipole in the other
molecule There is an instantaneous correlation of fluctuation of charge density This is
why this contribution is universal and requires a description of electron correlation
Dispersion is an attractive force and is approximately pairwise additive The perturbation
theory expression for dispersion contribution is as follows
0 0 0 0
00 00disp A B A B
m n m m
H mn mn HU
W W W W
25
London30 provided the most widely understood treatment of dispersion forces where
atoms can be visualised as a set of harmonic oscillators In this treatment the coupling of
the oscillators leads to the lowering of the energy The dispersion energy depends on the
square of the coupling constant The leading term in the dispersion energy is proportional
to R-6 because the coupling for a pair of interacting dipoles is proportional to R-3
224 Short-range Interactions
Exchange-Repulsion
When electron clouds of two molecules approach each other and become sufficiently
close they overlap At short-range the most important contributions are exchange and
repulsion these two are often taken together despite having opposite signs and are called
exchange-repulsion31 The exchange contribution is the attractive energy resulting from
electrons of one molecule becoming free to move over both molecules This increases the
uncertainty of the electronrsquos position allowing the momentum and energy to decrease
Repulsion contribution arises from the slight overlap of electrons that are trying to occupy
the same region of space This overlap which is prohibited by the Pauli Exclusion
23 Modelling the Intermolecular Forces for Organic Molecules
32
Principle leads to redistribution of electrons and increase of the repulsion between the
nuclei The exponential repulsion domination leads to an overall repulsive effect and is
approximately pairwise
225 Penetration Energy and Charge Transfer The overlap at short-range leads to modification of the long-range terms When charge
densities overlap at short-range the electron density will no longer shield the nuclei of
one molecule and therefore the molecules will experience a greater attraction of electron
density associated with other species The energy difference from this increased attraction
is the charge penetration it is the modification of the electrostatic energy at short-range
and so is a first-order effect Charge transfer also occurs during redistribution of electrons
at short-range It is a part of the short-range induction energy and so is a second-order
effect The energy contributions from charge transfer and penetration are small and are
often negligible35 Some of these effects may be absorbed in the empirically fitted models
of the dispersion and repulsion terms (section 27)
In summary for the organic molecules studied in this thesis repulsion dominates at
short-range while electrostatic and dispersion contributions dominate the intermolecular
energy at long-range Therefore the total intermolecular energy can be expressed as the
summation of the electrostatic Uelec repulsion Urepul and dispersion Udisp contributions
inter elec repul disp elec repul dispU U U U U U 26
23 Modelling the Intermolecular Forces for Organic Molecules The potential model used in this thesis for evaluating the intermolecular energy Uinter
is an intermediary between conventional force fields and periodic electronic structure
calculations The functional form of conventional force fields have limitations because
the same charges are used for intermolecular and intramolecular interactions2 (section
254) Periodic electronic structure calculations are very expensive and were not
available at the start of my research in 2010 For example the plane-wave DFT-D study
of selected pharmaceutical crystal structures using Quantum Espresso was published in
201336 The Generation Ranking and Characterisation Engine (GRACE37 program
section 284) which when coupled to another periodic DFT-D code (section 275) was
successful in the fourth blind test10 is still not available to researchers as of this writing
The work presented in this thesis models the dispersion repulsion and electrostatic
interactions (equation 26) explicitly The dispersion and repulsion contributions were
modelled using a transferrable empirically fitted model In contrast the electrostatic
23 Modelling the Intermolecular Forces for Organic Molecules
33
contribution was modelled using ab initio wavefunction calculation on an isolated
molecule for each molecular conformation due to limited transferability
231 Repulsion-Dispersion Potentials The dispersion and repulsion terms are modelled with an empirical exp-6 atomndashatom
potential that is assumed to be transferrable3839 The repulsion term is represented by the
exponential-based term and the dispersion is represented by the inverse sixth power term
6
exp( )
repul disp ik ik
i k
U A B R C R 27
where atom i in molecule 1 is of type ι atom k in molecule 2 is of type κ and they are
separated by interatomic distances Rik This potential (equation 27) was derived by fitting
the parameters to known crystal structures and it obeys the following combining rules
1 1
2 21
( ) ( ) ( )2
A A A B B B C C C 28
Parameters for carbon non-polar H and N atoms were derived from fitting to
azahydrocarbon crystal structures39 while the parameters for the oxygen atom were
derived from fitting to oxohydrocarbon crystal structures38 The polar H atom parameters
were derived from azabenzenes nitrobenzenes and other simple molecules40 To account
for the smaller effective van der Waals radius of protons the distinction between polar
and non-polar H atoms is necessary41 In Chapters 3 and 4 the repulsion-dispersion
contributions to the intermolecular energy will be calculated using the potential of
equation 27 and the ldquoFITrdquo34 parameters These FIT parameters were fitted using a model
that had explicit electrostatic interactions Once the repulsion and dispersion terms were
generated they were summed over all intermolecular atomndashatom distances up to a defined
cut-off This is typically 15 Aring for small organic molecules for fast calculations and 30 Aring
for large molecules34 It should be noted that some of the other intermolecular
contributions not modelled explicitly by equation 27 and any electrostatic model might
have been absorbed by the empirically fitted models of dispersion and repulsion terms
because these other contributions will be present to some extent in the sample crystal used
in deriving the parameters A B and C
In contrast to ldquoFITrdquo the empirical intermolecular potential by Gavezzotti42ndashndashanother
exp-6 potential that will be used in Chapters 5 and 6 to investigate the origin of
intramolecular energy and design new analytical force fieldsndashndashdoes not use combining
rules and has no atomic or site charges
23 Modelling the Intermolecular Forces for Organic Molecules
34
232 Electrostatics Potential This section discusses the two methods used in this thesis for modelling the electrostatic
contribution to the intermolecular energy (equation 26) in Chapters 3 and 4
(1) The Atomic Charge Model is a crude but inexpensive approach It uses Coulombrsquos
law through pairwise interaction of isotropic (spherical) point charge q placed on each
atom separated by distance R
0
1(R )
4 R i k
elec ik
ik
q qU 29
where ε0 is the dielectric vacuum constant It assumes that the charge density of the
molecule can be described by superimposing spherical atomic electron densities The
atomic charge model cannot represent non-spherical features such as lone pairs and
electrons or short-distance directional intermolecular interactions like the geometry of
the H-bond41 As a result extensions to the isotropic model have been proposed to define
lone pair sites as dummy atoms having isotropic electrostatic interactions43 or at satellite
positions that are optimised to provide best fit to the electrostatic field44
Although atomic charges can be derived from the experimental X-ray diffraction data
these results are unreliable due to the many approximations and assumptions that must be
made during their calculation45 On the other hand atomic charges can be generated from
an ab initio wavefunction calculation of the isolated molecule to estimate the electrostatic
contribution41 This involves using the CHELPG scheme (an acronym for CHarges from
ELectrostatic Potentials Grid based method) which performs the least-squares fit of the
atomic charges to reproduce the molecular electrostatic potential as evaluated from ab
initio density on a regularly spaced grid46 Unfortunately higher moments such as
octupoles hexadecapoles and so on make a small contribution to the potential when the
CHELPG scheme is used Indeed Francl et al47 showed that the CHELPG procedure is
ill conditioned for higher atomic multipoles so that the charges are not well determined
however they did show that Singular Value Decomposition (section 262) could improve
the condition numberdagger
(2) The Distributed Multipole Moments The electrostatic potential around a molecule
can be represented by an expansion of multipole moments At long range this
daggerThe condition number is the ratio of the largest to smallest singular value in the singular
value decomposition of a matrix A matrix is ill conditioned if the condition number is
too large
23 Modelling the Intermolecular Forces for Organic Molecules
35
electrostatic potential is exact since the charge distribution is approximately spherical as
the distance approaches infinity At shorter range the more apparent anisotropic nature
of charge density is not easily represented by the central multipole expansion48 A better
approach is to use a multiple expansion about several sites in the molecule which can be
achieved with the distributed multipole expansion
The distributed multipole expansion is an explicit method of generating higher-order
atomic multipoles that involves modelling the atomic charge distribution using a series
of distributed multipoles (charge dipole quadrupole octupole hexadecapole etc as
illustrated in Figure 22)26 Consequently the derivation of the distributed moments is
essential There are two ways of achieving this computational analysis of the charge
density and fitting to experimental data Deriving the multipole moments experimentally
is challenging and often the data are insufficient to deduce any particular distribution of
multipoles across specific sites49 For example the Stark effect gives the magnitude but
not the sign of the components of the dipole moment along the inertial axes26
Figure 22 Charge distributions corresponding to pure multipoles Blue portions
represent regions where the function is positive and yellow portions represents where it
is negative Qlk is the spherical harmonic multipole where l is angular momentum
quantum number and k = l l-1hellip -l specifies the component of the angular momentum
around the z-axis (Source httpenwikipediaorgwikiSpherical_harmonics [Accessed
11012015])
Distributed Multipole Analysis (DMA) is a systematic way of determining the
distributed moments50 This computational approach derives charge distribution from an
24 Intramolecular Energy
36
ab initio wavefunction51 and describes it in terms of distributed multipoles (Figure 22)
located at a number of site in the molecule using the Gaussian Distributed Multipole
Analysis (GDMA)52 program The GDMA program carries out a DMA of the density
matrix (Fchk) file produced by GAUSSIAN53 for the isolated molecule in the molecular
axis system34 This thesis uses version 252 of GDMA because it handles diffuse functions
more satisfactorily51 than version 154
In contrast to the atomic charge model the distributed multipole moments have
successfully predicted the directional (anisotropic) lone pair interactions π-π stacking
arrangements in aromatic rings and electrons and H-bond geometries in molecular
organic crystal5556 The long-range interactions which include the chargendashcharge (R-1)
chargendashdipole (R-2) and dipolendashdipole (R-3) terms are evaluated using the Ewald
summation method57 while the remaining long-range interactions are summed by direct
method
In summary the electrostatic contribution is modelled by using either an atomic charge
model or distributed multipole moments obtained from ab initio methods while the
repulsion and dispersion contribution are modelled using an empirical exp-6 potential
24 Intramolecular Energy The lattice energy of a crystal structure is the sum of the intermolecular and
intramolecular energies The focus of this section is the intramolecular part of the lattice
energy In Chapters 5 and 6 I investigate the origin and derive analytical models for the
intramolecular energies of flexible molecules (Chapter 6) Therefore this section
concisely examines the intramolecular energy of flexible molecules
The intramolecular energy of rigid molecules is negligible so the early work of crystal
structure prediction (section 11) focussed on the easier problem of rigid molecules In
this thesis a flexible molecule has one or more internal degrees of freedom that change
between phases for example torsion angles around single bonds The intramolecular
energy for a flexible molecule is the energy difference between the molecule in a specific
conformation (eg in a crystal) and in the lowest energy of the isolated gas phase
conformation As evident from ROY in Chapter 1 polymorphic forms can exhibit very
different torsion angles (Figure 15) ie can display conformational polymorphism
Cruz-Cabeza and Bernstein58 argued that when referring to conformations in crystal
structures a distinction should be made between conformational adjustment and
conformational change Conformational adjustment arises when a flexible molecule
adjusts to the crystal environment by slightly varying the conformation to minimise the
24 Intramolecular Energy
37
lattice energy of the crystal while conformational change involves a change of gas phase
conformer (Figure 23) In the context of the polymorphism of flexible molecules Cruz-
Cabeza and Bernstein58 referred to two polymorphs whose independent conformations
are related by conformational change as conformational polymorphs For example crystal
structures A and B in Figure 23 are conformational polymorphs
Figure 23 Schematic representation of conformational change and conformational
adjustment (Source Ref [58])
The simplest approach to calculate the intramolecular energies is to use force field
methods (section 25) which involve summing the contributions that arise from bond
stretching angle bending and dihedral torsion angles However despite the speed and
successes of force field methods in Molecular Dynamics and in modelling proteins59 the
molecular mechanics descriptions of the intramolecular energies and molecular
geometries are not sufficiently accurate for evaluating the lattice energy of crystal
structures (section 254)
Another method for evaluating intramolecular energy is electronic structure calculation
(section 27) This approach avoids the problem encountered in force field methods but
at the cost of higher computing time The conformations of flexible molecules and their
relative energies can be sensitive to the electron correlation method (because of the
important dispersion contribution) and to the basis set that is used (since large basis sets
are required to avoid intramolecular BSSE60 during electronic structure calculations) The
errors from intramolecular dispersion (section 275) can lead to the failure of quantum
mechanical calculations for molecules that adopt a folded conformation6061
One way of solving this problem is the dispersion-corrected (ndashD section 275) method
Warnings of the intramolecular energy sensitivity toward the electronic structure level of
25 Force Fields (Atomistic Modelling)
38
theory are relevant to the CSP studies of Chapter 3 and 4 where the focus is on other
aspects of the computational model and not on the rigorous test of these errors However
it is a common practise to use one electronic structure method for evaluating the
intramolecular contributions toward the final lattice energies A necessary compromise
then is to conduct prior analysis of the effect that different levels of theory have on the
intramolecular energy for a specific molecule
The frequently used DFT level of theory such as B3LYP6-31G(d) may not give
reliable results for molecular systems where the intramolecular dispersion energy is likely
to be a major factor in determining the conformation60 Due to this limitation I did not
use the 6-31G(d) basis set in Chapters 3 and 4 when computing the final intramolecular
and intermolecular energies of the crystal structures
25 Force Fields (Atomistic Modelling) Force field methods (also known molecular mechanics methods) ignore the moleculersquos
electronic motions and calculate the energy of a system as a function of the nuclear
positions These methods are a cheap alternative to electronic structure methods (section
27) The basis of understanding the force field is the Born-Oppenheimer approximation
which assumes that the motions of the nuclei are independent of the motions of the
electrons In force field calculations the arrangement of the electrons is assumed to be
fixed62 Thus traditional force field methods cannot predict properties based on electronic
motions such as the breaking and formation of chemical bonds polarization effects and
proton transfer
The parameters determined for small molecules can be transferred to larger systems
such as polymers63 and can also be used for billions of atoms on supercomputers Indeed
the ability to transfer force fields from one system to anotherndashndashfor systems that are too
large for quantum mechanical calculationsndashndashis arguably the most valuable property of
many force fields6364
The downside to these classical force fields is that conformation and energy results are
often prone to inaccuracies These inaccuracies were observed when force fields methods
were used in CSP to calculate the final lattice energies65-67 (section 254)
25 Force Fields (Atomistic Modelling)
39
Figure 24 The schematic view of force field interactions Covalent bonds are solid lines
while the dotted line indicates non-bonded interaction (Source Ref [68])
Figure 25 Schematic view of four key contributions to a molecular mechanics force
field These forces are bond stretching bond stretching angle bending torsional terms
and non-bonded interactions (Source Ref [63])
The application of force fields involves choosing an energy functional form followed
by evaluating all unknown parameters A typical force field method arises from four
principal energy terms of intermolecular and intramolecular forces within the system6970
( )MM b nbE E E E E 210
where sumEb sumEθ sumEξ and sumEnb are the total energy of bond deformation valence angle
deformation torsion deformation and non-bonded interactions (van der Waals and
electrostatic) respectively The deviation of bond angle and torsion from equilibrium
describes the penalty of deformation (intramolecular) while non-bonded term describes
the interaction between non-bonded parts of the system (intermolecular)
Hookersquos law models bonds between atoms as a spring
2( )b r eq
bonds
E K b b
211
25 Force Fields (Atomistic Modelling)
40
where Kr is the force constant and beq is the ideal bond length A common mistake is to
assume that the equilibrium value (eg beq) is the global minimum value in actuality beq
is the value that b adopts when all force field terms equal zero This Hookersquos functional
form is an example of applying the harmonic oscillator in which the relationship between
force and displacement is linear A more accurate description of the relationship between
force and displacement is non-linearity ie anharmonic oscillator Hence Hookersquos
functional form is not as accurate as using cubic and higher terms (anharmonic terms)
Valence angles have a similar model to equation 211
angles
eqKE 2)(
212
where K is the strength of the spring holding the angle at ideal valence angle eq
Compared to a bond model less energy is required to distort the valence angle away from
the reference and the force constants are smaller The higher terms such as cubic and
quartic terms improve the valence angle model The 1-2 and 1-3 interactions (defined in
Figure 24) are also known as hard degrees of freedom because large amounts of energy
are required to deform bonds or angles from their equilibrium positions However
CrystalOptimizer71 (section 282)ndashndashan algorithm used in Chapters 3 and 4 to compute
the lattice energy accuratelyndashndashassumes that some 1-3 interactions are soft degrees of
freedom For example hydroxyl (HndashOndashC) and amide (HndashNndashC) bond angles were treated
as flexible in three model systems72
Figure 26 Schematic view of the torsion angle ξ using the ethane molecule (Source
quantumwisecomdocumentsmanualsvnl-200810_Manualchapmolbuilderhtml
[Accessed 11012015])
25 Force Fields (Atomistic Modelling)
41
The major change between crystal structures is their torsion angles The torsion angle
ξ in the ethane molecule shown in Figure 26 is defined as the intersection angle between
the two planes α and β spanned by the respective atom chains 1ndash2ndash3 and 2ndash3ndash4 It is clear
that the value of the torsion angle ξ between atoms 3 and 2 depends on the four atoms
selected Due to the periodic nature of torsion angles the model is expressed as a periodic
function
[1 cos( )]2
n
torsions
VE 213
where is the periodicity and represents the number of minima as the bond rotates about
360deg The phase factor term is the torsion angle as the rotating bond passes the
minimum or minima Vn is the barrier height to rotation about torsion angle ξ The value
of Vn is larger for double bonds than for single bonds The definition of Vn is ambiguous
when more than one term is needed to model the torsional energy64 Even more
misleading is that the 1-4 non-bonded (Figure 24) and higher interactions contribute to
the torsional potential The additional term with the correct qualitative behaviour of the
barrier to rotation63 is a better description of Vn
The last term in equation 210 is the non-bonded interactions
12 6
[ ]nonbond
ij ij i j
nb
i j ij ij ij
q qE
r r r
214
where the adjustable parameter σij is the collision diameter and is defined as the separation
for which the van der Waals energy is zero The qi and qj terms are the partial or net
atomic charges63 Equation 210 is a combination of the repulsion-dispersion (also known
as the van der Waals term and is often fitted to a Lennard-Jones 6-12 potential73 because
of the computational ease) and an electrostatic term It should be noted that intermolecular
and intramolecular contributions have the same set of parameters Many of the more
recent developments in protein force fields include electronic polarizability or a solvation
effect in an approximate way68
251 AMBER The AMBER force fields are widely used for modelling proteins and nucleic acids74
AMBER which is in continual development has relied on the past knowledge of force
fields such as ECEPP potentials75 and Consistent Force Field (CFF76) The exclusion of
H atoms from an earlier version of an AMBER force field was due to limited computer
power However a compromise was adopted in later versions due to the importance of
the H-bond68
25 Force Fields (Atomistic Modelling)
42
The charges were derived by fitting partial charges to ESP (electrostatics potential)
charges obtained via ab initio calculations (HFSTO-3G) An adapted version of van der
Waalsrsquo term from amide data fitting by Lifsonrsquos group7778 and liquid state simulations79
by Jorgensen was used The first two terms (bonds and angles) of equation 230 were
fitted from crystal structure data while the torsional terms were extracted from either
experimental data or ab initio calculations
The fact that AMBER has limited parameters for organic molecules prevented this force
field from being widely used in drug design and other studies of ligandndashprotein or ligandndash
DNA interactions80 Hence a Generalised Amber Force Field (GAFF) was introduced by
Wang et al80 to describe a wider variety of organic molecules including most
pharmaceutical molecules
252 CHARMM CHARMM81 (Chemistry at HARvard using Molecular Mechanics) has some overlaps
with AMBER in part because the first versions of both force fields were developed
around the same time Like AMBER H atoms were excluded in the earlier version but
were later replaced with a compromise solution Although ab initio calculations were
used in fitting this model a different level of theory (HF6-31G) was employed The
interaction energies were scaled to match water dimerization energy predicted via a
TIP3P model to achieve a balanced solutendashwater and waterndashwater interaction A rough
continuum solvation model can be implemented by using the force field with distance-
dependent dielectric constant The second version of CHARMM from 1985 is used
today because of the respectable results obtained from solvated simulation68
Subsequent developments were made in later versions of CHARMM8283 to improve
the balance of interaction energies in solvent simulations More recently a force field for
all atoms often called the CHARMM general force field (CGenFF) was published84
This force field covers a wide range of chemical groups present in biomolecules and drug-
like molecules and focusses on quality of result rather than on transferability
253 Other Force Fields There are more complex force fields than those discussed above For example cubic
and quartic terms can be added to equations 210 and 211 to reflect anharmonicity and
stretch-bend cross terms or the Lennard-Jones function can be replaced with a more
flexible Buckingham (exp-6) or Morse potential85 Examples of such force fields are
MM486 and Merck Molecular Force Field (MMFF)87 The cubic and quartic terms are
also used in MM288
25 Force Fields (Atomistic Modelling)
43
Figure 27 Schematic view of some of the common cross terms (Source Ref [63])
The cross terms in force fields represent coupling between internal coordinates For
example an increase or decrease of valence angle can affect adjacent bonds Stretch-
stretch stretch-bend stretch-torsion bend-torsion and bend-bend (Figure 27) are
examples of cross terms believed to be the most important in force fields these cross
terms in force fields are designed to predict vibrational spectra63
Another very popular force field is OPLS-AA (Optimized Parameters for Liquid
SimulationsndashAll Atoms) which specialises in simple liquids8589 Although huge
advances have been made in the understanding of biomolecular behaviour there is still a
demand for more accurate prediction of energies90 even for proteins and nucleic acid
polymers that have been studied extensively eg AMOEBA91 which uses atomic
multipoles
254 The Limits of Current Force Fields A major limitation of current force fields is the use of atomic charges in the description
of electrostatic contributions9293 Another limitation is that the intermolecular and
intramolecular forces have the same parameters It is therefore not surprising that in the
blind tests of organic CSP there have been no success based on the use of force fields for
final lattice energy (sum of intermolecular and intermolecular energy) evaluations11 In
specific cases like aspirin the intramolecular force field clearly has too strong a
preference for the wrong conformation so that the lowest-energy crystal structures have
that conformation94
Indeed some force fieldsrsquo lattice energy minimizations were shown to change the
conformation of the crystal structure so much that the crystal structure could not be
26 The Fitting Routine
44
reproduced65 In other cases the force fields were able to reproduce the crystal structures
but failed to rank the energy of these crystal structures accurately These failures have
been traced to using the same charges and van der Waals interactions for the
intermolecular and intramolecular forces95
Generally force field potentials that are more accurate tend to have more terms because
they usually yield better fit with experimental or ab initio data However additional
parameters make the fitting procedure more complicated and time consuming with no
scientific basis Therefore an ideal analytical model for the intramolecular energies
should have terms that are few in number (Chapter 6) based on a consistent scientific
origin (Chapter 5) and transferrable
In summary the traditional force field includes explicit periodic torsional potentials
and non-bonded terms including the electrostatic term that are applied to all atom pairs
separated by three or more covalent bonds (1-4 interactions and above) Researchers built
these traditional force fields on the reasonable assumption that in biomolecules the
intramolecular non-bonded interactions are the same as intermolecular non-bonded
interactions This is clearly a limitation2 because intramolecular atom-atom distances are
often much shorter than intermolecular (van der Waals) distances I exploited this
limitation in Chapter 6 by decoupling the intermolecular and intramolecular contributions
and derived new analytical intramolecular force fields
26 The Fitting Routine The Gavezzotti exp-6 and ldquoFITrdquo potentials (section 231) and many force field methods
were fitted to experimental or ab initio data These potentials all depended on an assumed
functional form the ability to extrapolate the quality of data the range of sampling a
method of fitting (the focus of this section) and so on
In Chapter 6 I developed codes (Appendix A) for fitting a new analytical
intramolecular force field to ab initio conformational profiles of fenamates which use
one method of fitting I assumed that the new analytical intramolecular force field was
approximately linear This section explains what a linear problem is solves the problem
and outlines an alternative solution that uses a Numerical Algorithm Group (NAG) library
that was implemented in the design of new analytical force fields (Appendix A)
261 Linear Least Square Method A model is linear if given a random data of (Yi Xi1hellip Xip-1 i =1hellip n) the relationship
between the response variable or observation Yi and the explanatory or independent
variable Xij can be formulated as follows
26 The Fitting Routine
45
Yi=β0+ β1Xi1 + β2Xi2 +hellip+ βp-1X ip-1 + εi i=1hellipn 215
where εi is the error β0 β1 β2 hellip βp-1 are the intercept and regression coefficients for the
explanatory variables
The linear regression model of equation 215 in matrix form is
0 1 11 1 1 11 1
0 1 22 1 2 12 2
0 1 1 1 1
p p
p p
n nn p n p
X XY
X XY
Y X X
216
or
11 1 11 0 1
22 2 12 1 2
11 1
1
1
1
p
p
n p nn n p
X XY
X XY
Y X X
217
or 1 1 1n n p p n Y X ε 218
where Y is ntimes1 X is ntimesp (an ntimesp matrix has n rows and p columns) β is ptimes1 and ε is
ntimes1 matrix
We can solve this linear regression model by using the least squares method The basic
idea behind the least squares is minimising the sum of squares for the errors ie
2n T
ii ε ε where T is the transpose Rearranging equation 218 as a function of errors
and evaluating least square problem gives
( ) ( )
( ( ) ( ) ( ))
( ( ) ( ))
( ( ) ( ) ( ))
( )
( 2 )
T T
T T T T
T T T T T
T T T T T T
T T T T T
T T T T
ε ε Y X Y X
Y Y Y X X Y X X
Y Y Y X X Y X X
Y Y Y X X Y X X
Y Y Y X Y X X X
Y Y Y X X X
219
Then differentiating the least square (equation 219) with respect to the coefficient gives
( ) ( 2 ) 0
2( ) 2 0
2 2 0
T T T T T
T T T
T T
T T
ε ε Y Y Y X X X
Y X X X
X Y X X
X X X Y
220
26 The Fitting Routine
46
Then multiply both sides by 1( )T X X
1
1 1( )T T
p p n p n p n n
X X X Y 221
The expectedmodel value Ŷ is
1 1ˆ
n p p n Y X 222
Equations 221 and 222 can be coded explicitly which I did for cosine fits in my upgrade
report96
262 Subroutine for Solving Least Squares An alternative to coding equations 221 and 222 explicitly is to use the G02DDFE97
NAG routine This NAG routine computes the error of each coefficient and states whether
a solution is unique or not in addition to computing the coefficients Here I discuss some
key concepts that will help in understanding the G02DDFE97 NAG routine used in
Chapter 6
If X is an n times p matrix the rank of X is the number of nonzero rows in the row echelon
derived through the Gaussian elimination method If matrix A has a rank as large as
possible then the matrix is a full rank otherwise the matrix is rank deficient A matrix
that is full rank has one unique solution The G02DDFE97 NAG routine can work out if
any matrix is full ranked or rank deficient
QR decomposition is the first step used for solving the least squares problem in the
G02DDFE97 NAG routine QR decomposition transforms matrix X into a QR matrix that
consists of an orthogonal matrix Q and an upper triangle matrix R
1 2 1
R RX = Q = Q Q = Q R
0 0 223
where Q1 is the first p columns of Q and Q2 is the last n-p columns of Q
G02DDFE97 subroutine calculates the regression parametersndashndash and in Chapter
6ndashndashand Residual Sum of Squares (RSS) for a general linear regression model by
minimising the sum squares residual G02DEFE a routine within G02DDFE carries out
QR decomposition of the matrix data X If R is of a full rank ie the matrix has a rank
as large as possible then R-1 exists and the solution of the regression model is as follows
1ˆ( ) ik
T
ik y R Q 224
where Q and R are the decomposed matrices of data being rescaled and y is the ab initio
data minus any remaining contributions not being fitted If R is not full rank Singular
27 Electronic Structure Methods
47
Value Decomposition (SVD) of X (ie X=U1DVT) helps to extract just one solution of
the linear regression model
1ˆ ( ) ik
T
ik y VD U 225
where V D and U are respectively the orthogonal the non-negative diagonal element
and the orthogonal decomposed matrices RSS and the standard error fit are related
fit
p k
RSS
N N
226
where Np and Nk are the number of observations and regression coefficients for each of
the independent variables plus the intercept
Solving the least squares problem is a key feature of the algorithm in Chapter 6 The
algorithm undertakes the challenge of deriving a new analytical model for intramolecular
energies of flexible fenamate molecules The remaining features of the algorithm are
discussed in Chapter 6
27 Electronic Structure Methods The development of electronic structure methods and rapid advances in computing
technology have transformed the role of quantitative numerical calculations in both
theoretical and experimental studies of chemistry98 The first era from the 1960s to 1980s
established the basic mathematical foundations and computational machinery of todays
standard electronic structure methods They included HartreendashFock (HF) theory Moslashller-
Plesset (MP) perturbation theory Density Functional Theory (DFT) and many others98
This thesis classifies HF MP and DFT as ab initio methods
This thesis uses electronic structure methods to calculate the molecular properties of a
single molecule (and in principle of dimers and crystals) The electronic structure
methods seek to calculate the molecular properties from the first principles ie solving
Schroumldingerrsquos equation without using empirical data26 However approximations are
always necessary DFT is a modern arsenal of quantum chemical methods99 and to get a
better appreciation of this method it will be useful to look at more traditional
wavefunction-based approaches One of the simplest of these approaches is the Hartree
Fock (HF) theory
27 Electronic Structure Methods
48
271 Hartree Fock Theory The HF theory was developed to solve the electronic Schroumldinger equation that results
from the time-independent Schroumldinger equation after invoking the Born-Oppenheimer
approximation100 There are two good reasons for solving the Schroumldinger equation First
the solution gives the potential energy experienced by the nuclei ie the potential energy
surface Second the electronic wavefunction has lots of useful information about
molecular properties such as dipole and multipole moments polarizability etc
The HF method assumes that the exact N-body wavefunction of the system can be
approximated by a single Slater determinant of N spin-orbitals By employing the
variational theorem which states that the energy is always an upper bound to the true
energy one can derive a set of N-coupled equations for the N spin-orbitals The solution
to this equation yields the energy of the system and the wavefunction
The HF method is called the ldquoSelf-Consistent Field (SCF) methodrdquo because the HF
equations are solved using an iterative process The SCF process starts with an initial
guess for the orbitals and successive iterations are performed with new orbitals until the
self-consistent condition is achieved ie until the solution no longer changes
271 Molecular Orbital Theory With the new Quantum Mechanics (QM) of Heisenberg and Schroumldinger came two
general theories the Valence Bond (VB) and the Molecular Orbital (MO) theories These
two theories developed at around the same time quickly became rivals101 See ref102 for
a review of the classical valence bond approach The focus of this section is the MO
theory
The MO theory based on the HF theory theorises that each electronrsquos motion can be
described as a single-particle function (orbital) that does not depend on the instantaneous
motions of the other electrons MOs are calculated using the Linear Combination of
Atomic Orbitals (LCAO) which is a quantum superposition of Atomic Orbitals (AOs)
MO is a theory of bonding that can give insight into the forces involved in making and
breaking chemical bonds which are often the focus of organic chemistry
The early complexities of Quantum Mechanics led to the visualisation of MOs that are
easier to understand than numerical orbital coefficients103 Using SCF calculations we
can represent MOs using isosurfaces that correspond to the electron density The two
isosurfaces of particular importance are usually the Highest Occupied Molecular Orbital
(HOMO) and the Lowest Unoccupied Molecular Orbital (LUMO) These are known as
the frontier-orbitals104 It is not clear why the frontier-orbital theory is so successful26 but
27 Electronic Structure Methods
49
this theory is used extensively in computational chemistry to understand many
phenomena Frontier orbitals will be used in Chapter 5 of this thesis to understand the
origin of barriers to rotation for flexible molecules
HOMO is the isosurface from which it is energetically easiest to remove electrons from
(eg electron density donation to form a bond) as well as the most relevant MO in this
thesis The only requirement of the empty MOs is that they form an orthogonal set with
the filled MOs These unoccupied MOs are not optimised during the SCF process because
the energy of the molecule does not depend on them As a result these unoccupied MOs
including LUMOs are less reliable than occupied MOs such as the HOMOs Thus
Chapter 5 will focus on the HOMO isosurfaces of flexible molecules
272 Correlation Effects The major limitation of the HF method is that it treats each electron as moving under
the influence of the average effect of all other electrons the method does not take into
account the electronsrsquo instantaneous repulsion26 (correlation effect) One of the most
important effects of electron correlation is the dispersion interaction In fact the
dispersion interaction (section 22) is a correlation effect26100 The correlation energy is
the difference between HF energy in a complete basis (HF limit) and the exact energy
excluding the relativistic effects ie the electrons are propagating at speeds much slower
than light
The HF method is now used merely as a starting point for more elaborate lsquopost-HFrsquo ab
initio quantum chemical approaches99 because the poor performance of the HF method
offsets its efficiency and simplicity Correlation effects modify the electrostatic
interaction between the molecules due to changes in electron distribution and they tend
to reduce charge separations Electron correlation can be handled in quantum chemical
theory calculations using Moslashller-Plesset Perturbation Theory (MPPT) Density
Functional Theory (DFT)105 etc
273 Moslashller-Plesset Perturbation Theory In perturbation theory we start from a known solution and add a perturbation
Hamiltonian (equation 21) Moslashller and Plesset106 used perturbation theory to determine
the correlation energy (small perturbation) after solving the HF problem (the known
solution) Correlation corrections appear at the second order and beyond The zeroth-
order energy is the sum of the occupied orbital (eg HOMO) The first-order energy is
the HF energy26 MPn is the nth-order energy (n 2) In this thesis I did not perform
27 Electronic Structure Methods
50
geometry optimisations using MP2 methods for molecule(s) with 20 or more atoms due
to the computational expense
Although MP2 methods are used as the standard they have limitations For example
van Mourik61 noted that the MP2 description of intramolecular interactions with a -
electron system for flexible molecules is affected by a large intramolecular basis set
superposition error (BSSE) This large BSSE of MP2 was responsible for the wrong order
of stability for Phe-Gly-Phe tripetide107
BSSE is relevant in this thesis because many of the MP2 calculations were carried out
on flexible molecules that contained at least one aromatic ring (Chapters 3 to 5) The
origin of this error lies in the possibility that the unused basis functions of the second unit
B in the associated complex A∙∙∙B may augment the basis set of the first unit A thereby
lowering unit Arsquos energy compared to a calculation of this unit alone26108 This lowering
can be attributed to the variation principle that arises from the mutual enlargement of the
basis set of each monomer by the presence of the orbitals of its partner molecule109 Rather
than using an infinite basis set an impossible task the method for correcting this error is
to use a counterpoise (CP)
274 Density Functional Theory Density Functional Theory (DFT) is a cheaper alternative to MPPT Indeed P J
Stephens et al110 suggested in 1994 that in the future DFT might be preferred over the
MP2 method due to the lower computational demands of DFT That future is now for
DFT is currently the method of choice for first-principles electronic structure calculations
in condensed phase and complex molecular environments111112 Over the last 30 years
physicists working on the electronic structure of solids surfaces defects etc have used
DFT More recently DFT has become popular with theoretical and computational
chemists113
DFT is a theory of electronic structure exact in principle that is based on the electron
density distribution instead of the many-electron wave function111 DFT is based on a
theorem proposed by Hohenberg and Kohn114 which states that knowledge of the
electron density of a system in the ground state is enough to determine the energy lsquothe
energy is a functional of the densityrsquo2699105 A generalized DFT expression is
EDFT[ρ] = ENe[ρ] + T[ρ] + Eee[ρ] 227
where T[ρ] is the kinetic energy associated with the given electron density Eee[ρ] is the
electron-electron interaction energy and ENe[ρ] is the energy of interaction between the
electrons and lsquoexternalrsquo fields The ENe normally includes the interaction between the
27 Electronic Structure Methods
51
electrons and the nuclei but it can also include other fields imposed on the molecule
Each term depends on the electron density ρ
The exact form of T[ρ] and Eee[ρ] are not known and no fundamental theory for
determining them exists at present The usual route for solving this problem is to use the
method proposed by Kohn and Sham115 in 1965 that involves non-interacting electrons
For this system the electron density ρ(r) and the kinetic energy TS[ρ] (S denotes that
the kinetic energy is obtained from a Slater determinant) are exact while the Coulomb
(classical) part J[ρ] of the electron repulsion energy can be calculated The energy of the
system now takes the form
EDFT[ρ] = ENe[ρ] + TS[ρ] + J[ρ] + EXC[ρ] 228
where EXC the exchange-correlation functional is
EXC[ρ]=( T[ρ] - TS[ρ])+( Eee[ρ]- J[ρ]) 229
The exchange and correlation energy EXC is the functional that contains everything that
is not known Local-Density Approximation (LDA) and Generalized Gradient
Approximation (GGA) are used to approximate the EXC LDA the simpler
approximation assumes that the density corresponds to that of a homogeneous electron
cloud It proved to be an improvement over HF but is too inaccurate to be useful for
chemistry26 GGA an improvement on LDA incorporates dependency on electron
density and its gradient In practise hybrid (HF-DFT) functionals are used which
incorporate a portion of the lsquoexact exchangersquo from HF theory105 with exchange and
correlation from other sources (ab initio or empirical)
One of the most widely used hybrid functionals used is B3LYP which incorporates
Beckersquos three exchange-functionals116 (B3) with Lee Yang and Parr correlation
functional LYP117 PBE0118 another widely used functional was used in this thesis
(Chapters 3 to 6) These DFT methods are attractive because their results are comparable
to those obtained using MP perturbation methods but come at a much smaller
computational cost105
275 The DFT-D Approach DFT methods have drawbacks For one they are non-convergent in that no one knows
how to improve the results in a systematic way99119 The success of a particular functional
in one setting does not guarantee the performance in a different setting These drawbacks
led Orio99 to stress the importance of enhancing the credibility of DFT either by including
some form of validation or by estimating the error range through careful comparison
between the calculated and measured observable
28 Crystal Structure Prediction (CSP)
52
Another drawback is that the density functional cannot describe long-range electron
correlations responsible for dispersion forces112120 To overcome this defect researchers
have introduced corrections See refs120121 for a review of the impressive ongoing
attempts to improve the description of dispersion forces of DFT methods From a practical
viewpoint empirically damped ndashC6∙R-6 corrections to the standard density functional
approach provide robustness122 and speed We can solve the difficult dispersion
interactions classically This well-tested approach is DFT-D where -D stands for
dispersion correction The total energy is
EDFT-D = EDFT + Edisp 230
where EDFT is the self-consistent Kohn-Sham energy (equation 227) as obtained from the
chosen density functional and Edisp is an empirical dispersion correction Although DFT-
D was not used in this thesis it is nevertheless relevant because this discussion highlights
the importance of the dispersion contribution (ie correlation effect) to the overall energy
of the system
28 Crystal Structure Prediction (CSP) CSP assumes that the experimentally determined polymorphs correspond to local
minima in the crystal energy surface Elatt To put this approximation in context it is
important to note that the prediction of the relative thermodynamic stability of
polymorphs at a given temperature T and pressure p requires the minimisation of the
Gibbs free energy (G) with respect to the unit cell dimensions and the positions of all
atoms in the unit cell
where E is the internal energy V is volume and S is the entropy123 The variation in the
free energy arises from the differences in packing energy crystal density and entropy
Therefore all three terms associated with the Gibbs free energy (equation 233) should
be evaluated when determining the relative stability of polymorphs It is often the case
that only the lattice energy component of the first term (min E) is evaluated for two
reasons
The TΔS term is often neglected because the difference in lattice vibrational
energies between polymorphs is usually very small25124 At present the thermal
entropic and zero-point contributions to the Gibbs free energy cannot be readily
and accurate evaluated56
min G = min[E + pV ndash TS] 231
28 Crystal Structure Prediction (CSP)
53
The pΔV term could be calculated but is often neglected because of its small ΔV
value The compressibility of solids being low they contribute very little to Gibbs
free energy at normal pressure The pΔV term dominates at high pressure ie
10kbar125
Most of the computational approaches to CSP focus on minimising the lattice energy
The lattice energy Elatt is the internal energy at 0 K and 0 Pa ignoring the zero-point
energy The thermodynamic stability is not always the decisive factor in the packing
patterns of the molecules kinetics also plays an important role because it strongly
influences crystallisation conditions and solvent environment Nonetheless the
experimental structure is expected to appear within a narrow energy range of the global
lattice energy minimum56
Elatt can be calculated in several different ways depending upon the relative importance
of accuracy ease of implementation and computational cost in a given situation56
Ideally the lattice energy of a crystal should be calculated quantum mechanically but
such calculations are expensive Thus most approaches use force field methods andor a
cheap method to generate and evaluating the lattice energy in a hierarchal manner The
most successful CSP approaches rely on some form of the computationally demanding
but accurate electronic structure calculations either on an isolated molecule (to evaluate
the intramolecular contribution combined with the intermolecular contribution that has
been empirical fitted) or on a crystal (using periodic calculations)
Thus the key to successful CSP methods is not just the generation of all possible crystal
structures but also the accurate ranking of these generated crystal structures This ranking
requires balancing the intermolecular Uinter and intramolecular ΔEintra energy
contributions
where Uinter is the sum of the dominant electrostatics Uelec and repulsion-dispersion
Urepul-disp contributions and Eintra is the energy required to distort the molecule from its
gas phase conformation71 X denotes degrees of freedom that define the intermolecular
contacts while vector θ denotes the intramolecular degrees of freedom ie bond lengths
bond angles and torsion angles For rigid molecules there is no θ hence the ΔEintra (θ)
term vanishes For flexible molecules θ and hence ΔEintra (θ) must be accounted for from
the beginning
Elatt = Uinter (X θ) + ΔEintra (θ) 232
28 Crystal Structure Prediction (CSP)
54
281 CrystalPredictor
Chapters 3 and 4 use version 16 of CrystalPredictor126 which is different from rigid
or multiple rigid searches in that it incorporates conformation flexibility during the initial
search stage of crystal structures CrystalPredictor is not a black box it requires careful
analysis clear thinking and learning from earlier CSP studies CrystalPredictor performs
global lattice energy minimisation in order to predict the crystal structures of organic
molecules whose conformation is likely to be significantly affected by the packing forces
CrystalPredictor can find many plausible crystal structures in a multi-dimensional
space defined by the conformational degrees of freedom and lattice variables ie the
positions of the centre(s) of mass of the molecule(s) in the unit cell the orientation of the
molecules and the unit-cell dimensions and angles127 Within CrystalPredictor are two
important algorithms the Sobolrsquo128 sequence and the E04UFF NAG routine129 The
Sobolrsquo sequence generates the initial structures a characteristic of this approach is that
each Sobolrsquo corresponds to a distinct combination of every decision variable and thus
ensures a uniform and efficient sampling This prevents the problematic gaps and clusters
that random sampling can exhibit11 For more detail on how Sobolrsquo works see ref [128]
The E04UFF NAG routine129 carries out an extensive search for local minima of the
lattice energy surface using deterministic low-discrepancy sequences to ensure an optimal
coverage of the search space
CrystalPredictor models the lattice energy as the sum of the intramolecular and
intermolecular energy (equation 232) This lattice energy evaluation is crude but its
computational efficiency is necessary because CSP studies often require hundreds of
thousands of minimisations to sample the entire crystal energy surface The algorithm
computes the intramolecular energy as a function of flexible torsion angles using an
interpolation method on a set of quantum mechanically pre-computed intramolecular
energies by modelling the molecule as a set of rigid fragments connected by flexible
torsion angles The electrostatic contribution Uelec is evaluated by interpolating on pre-
computed atomic charges while an empirically fitted potential FIT34 computes the
repulsive-dispersive interactions Urepul-disp The sum of these two contributions is the
intermolecular energy Uinter=Uelec + Urepul-disp
In short CrystalPredictor is a minimisation algorithm
min Elatt = min[Uinter(X θ) + ΔEintra(θ)] 233
28 Crystal Structure Prediction (CSP)
55
that can generate crystal structures in the 59 most common space groups and with more
than 1 molecule in the asymmetric unit126 Z´gt1 However Chapters 3 and 4 limit the
search of hypothetical crystal structures to Z´=1 due to the huge computing time required
to generate Z´gt1 crystal structures
282 CrystalOptimizer CrystalOptimizer71130 refines crystal structures generated by CrystalPredictor126 To
account for the molecular flexibility accurately the CrystalOptimizer71130 algorithm is
required This algorithm solves the lattice energy problem (equation 233) as a two-level
optimization problem
The outer problem varies and ultimately optimizes the flexible conformational degrees
of freedom the remaining degrees of freedom are adjusted to minimize the intramolecular
energy127 A quasi-Newton scheme which ensures rapid convergence with many
optimization variable (X θ) solves the outer minimisation problem71 The inner
minimization problem optimizes the lattice energy for the fixed molecular conformation
determined by the outer problem The DMACRYS34 (section 26) program performs this
rigid body minimization CrystalOptimizer achieved a significant increase in the accuracy
of lattice energy calculations by127
1 allowing additional flexibility during lattice energy minimization (for example
considering more torsion angles andor bond angles as flexible degrees of
freedom)
2 accurately computing the intramolecular energy throughout optimization and
3 modelling the electrostatic interactions using distributed multipoles (up to
hexadecapole) obtained using the GDMA package52
Multiple ab initio calculations a very time-consuming process were often required
For this reason only the most promising structures from CrystalPredictor were used as
initial points for optimization Sometimes an intermediate step such as single-point ab
initio calculations (see Chapters 3 and 4) can improve the ranking of the lattice energy so
that only a handful of crystal structures (energy cut-off or a set number of unique crystal
structures minima) are optimized with CrystalOptimizer
CrystalOptimizer has one of the major featuresndashndashLocal Approximate Models (LAMs)ndash
ndashthat models the conformational energy and the multipole representation of the charge
density these are updated with explicit quantum mechanical calculations only when
necessary and not at every minimisation step The conformational energies their first and
min Elatt = min [ΔEintra(θ) + min Uinter(X θ)] 234
28 Crystal Structure Prediction (CSP)
56
second gradients and the distributed multipoles are also stored in the LAMs database
Re-using expensive electronic structure calculations (if the same conformational ranges
are encountered while minimising different hypothetical or experimentally determined
crystal structures) reduces the computing time without sacrificing accuracy7172130
283 Polarizable Continuum Model (PCM) Accurately modelling the balance between intramolecular and intermolecular energy is
important (eg using CrystalOptimizer) but just as important is modelling the effect of
the environment in distorting the conformer especially in cases where there is a
considerable difference in molecular conformations Cooper et al131 noticed that the total
calculated crystal energies which combine atom-atom model potential calculations of
intermolecular interactions with DFT intramolecular energies do not effectively
distinguish the real (known) crystal structures from the rest of the low-energy computer-
generated alternatives when the molecular electrostatic models are derived from isolated
molecule calculations They found that introducing a simple model for the bulk crystalline
environment when calculating the molecular energy and electron density distribution led
to important changes in relative total crystal energies and made possible the correct
distinction between the observed crystal structures and the set of computer-generated
possibilities This finding highlights the importance in CSP calculations of the
polarization of the molecular charge distribution especially for polar flexible
molecules131
In Chapters 3 and 4 PCM132 is used to account for the effect of organic environment
after generating and accurately computing the lattice energies using CrystalPredictor
that is an intermediate step that improves the electrostatic contribution to the
intermolecular energy and CrystalOptimizer I will model the polarizable continuum
environment with dielectric constants that is typical of molecular organic crystals ie ε =
3133 The PCM calculations only affect the final energy The geometry is not affected
because there is no molecular geometry minimisation of the crystal structure during the
PCM calculation
284 Other Approaches to Lattice Energy Minimisation There are other well-known approaches to lattice energy minimisations for flexible
molecules One computationally efficient approach is the Rigid CrystalPredictor-
Molecular Mechanics Method (RCM)17 by Graeme Day a variant on the method used in
Chapters 3 and 4 The first step performs constrained geometry optimization on a set
number of distinct conformations obtained from conformational analysis (the flexible
28 Crystal Structure Prediction (CSP)
57
torsion angles are fixed at the expected values from conformational analysis and all other
degrees of freedom are optimized) From this first step we can obtain the geometry
intramolecular energy and atomic charges The second step generates crystal structures
in 21 of the most common space groups by using a rigid CrystalPredictor134 search for
each distinct conformation17 Essentially the molecular geometries are treated as rigid
during the process of generating crystal structures The Uinter is calculated from the atomic
charges and an empirical exp-6 repulsionndashdispersion potential W99135 The third step
refines the most stable crystal structures obtained from the rigid-molecule searches For
this a two-stage procedure proposed by Day136 and co-workers is used The first stage
minimises the crystal structures by allowing the molecular geometry to relax using a
molecular mechanics description of energies associated with changes to the flexible
torsion angles This method trusts the molecular mechanics force field to provide the
correct molecular geometries but discards the energy which is not of sufficient accuracy
for the final ranking of crystal structures Then the resulting crystal structures are re-
optimized without further changes to the molecular conformations DMACRYS34 is used
to model the electrostatic interactions Uelec using the atomic multipole model The
remaining intermolecular terms Urepul and Udisp are obtained using the empirical W99
potential135 The intramolecular energy ΔEintra and the atomic multipole moments for
each conformation are derived from a single-point DFT calculation that incorporates the
PCM with a constant dielectric value of three to reflect the polarization effects in the
crystalline environment
Another approach is GRACE one of the most accurate minimisation methods This
approach presented by Neumann and Perrin was the first case wherein DFT-D methods
(sections 275) were applied to the CSP of molecular organic crystals First during the
crystal structure generation procedure a Tailor-Made Force Field (TMFF)13 developed
for fitting an atom-atom force field (non-bonded and bonding terms) specifically for each
molecule is used Then GRACE uses a hybrid method that combines the sum of the DFT
component and an empirical van der Waals correction ndashD (sections 274 and 275) to
re-optimise the lowest-energy crystal structures During this re-optimisation stage all
nuclear positions and electron density are optimised simultaneously which naturally
accounts for the molecular flexibility and other charge density reorganisation effects such
as polarization This approach reproduces experimental structures very accurately and
ranks the structures favourably amongst other hypothetically generated structures in many
(but not all) cases However these periodic DFT-D calculations are very expensive137
28 Crystal Structure Prediction (CSP)
58
285 The Crystal Energy Landscapes The CSP methods611 discussed above and many others sample a wide range of
possible crystal structures and determine the lattice energy in a hierarchal manner thus
generating a crystal energy landscape14 A crystal energy landscape is a plot of the lattice
energy against the density or the packing coefficient and it tells us how well the crystal
packs These landscapes often include the experimental structures as well as other low-
lying energy crystal structures that are worth comparing with the known polymorphs in
order to determine the types of intermolecular interactions and conformations that could
be feasible for a given molecule
In a crystal energy landscape in which only one crystal structure is calculated to be
more stable than any other by over a few kJ mol-1 typical of polymorphic energy
differences the molecule should only be found in that global minimum structure
Experiments or more demanding searches are needed to determine the stability relative
to multicomponent forms such as hydrates138 solvates139 or cocrystals140141 etc
However in most generated crystal energy landscapes there is typically a cluster of
structures within the energy range of plausible polymorphs These structures have to be
qualitatively assessed to see whether the barriers between the different structures are so
low that thermal motion in the crystal or molecular rearrangement during nucleation and
growth will ensure that only the most thermodynamically stable structure is seen Closely
related structures may also give rise to disorder142143 or plastic phases144 at higher
temperatures
The crystal energy landscape may suggest that alternatives to the known structures
could be found either as more stable or as kinetically trapped metastable polymorphs In
this case the calculations can complement experimental screening145 by suggesting
alternative methods146 such as a templating to produce new polymorphs147 The
knowledge of the crystal energy landscape can help avert problems in pharmaceutical
industries during the manufacturing process and guide the experimentalist search for
undiscovered structure In fact the study of the crystal energy landscape in Chapter 4
helped my colleague to discover a new polymorph (section 438) A way of testing
methodologies developed for predicting crystal structures is through lsquoblind testsrsquo
286 The Blind Tests The early lack of progress in CSP was termed a lsquocontinuing scandalrsquo in Nature in 1988
by John Maddox148 In response the Cambridge Crystallographic Data Centre (CCDC)
organised five lsquoblind testsrsquo10116667149 of organic CSP with the first lsquoblind testrsquo held in
29 Crystal Structure Comparison
59
1999 The blind test provided many researchers the opportunity to test their CSP methods
The fourth blind test results showed a dramatic improvement in the rates of success over
previous blind tests with one group (GRACE) correctly predicting four crystal structures
as their first ranked choice albeit at a considerable computational expense10
In the fifth blind test our research group successfully predicted the crystal structure of
molecule XX1117 which has eight flexible degrees of freedom (internal degrees of
freedom) using CrystalPredictor and CrystalOptimizer algorithms I use a similar
approach in Chapters 3 and 4 The fifth blind test showed that methodologies such as
DFT-D could reliably predict the structures of small organic molecules but GRACE was
unsuccessful for molecule XX11 CCDC released the sixth lsquoblind testrsquo molecules in mid-
September 201415 too late for me to take part By chance an informal lsquoblind testrsquo
challenge did arise during the second year of my research which is the focus of Chapter
3
29 Crystal Structure Comparison Collins et al150 argued that one of the problems modern scientists face is the issue of
structural similarity and difference They noted ldquocriteria for deciding when two crystal
structures are the same is an issue that divides many structural analystsrdquo Indeed this
problem of determining how similar or different two or more crystal structures are was
what inspired researchers to create methods for comparing crystal structures that exist
today The visual inspection of similarities and differences between crystal structures
does have its benefits but the method is slow and susceptible to human bias Thus
researchers need a practical computational method that enables them to identify identical
or similar structures
Identifying the similarities among crystal structures is important when deciding
whether a newly discovered structure is the same as an existing structure151 Sometimes
there is also a need to determine similarities when comparing many structures that are
related as in the case of 50 structures of carbamazepine (CBZ)150 Another reason for
identifying similarities lies in the field of CSP67152 where thousands of hypothetical
structures are generated and many structures converge to the same or approximately the
same structure during lattice optimization Therefore the removal of duplicates and the
production of unique lists of crystal structures are essential
The Mercury153 material module which has COMPACK151 embedded in it allows
graphical representation of the similarity among the polymorphs while standalone
COMPACK scripts can compare hundreds of thousands of crystal structures There are
29 Crystal Structure Comparison
60
three main tools in the material module153 motif search crystal packing feature and
crystal packing similarity tools The crystal packing similarity tool calculates the level of
packing similarities between crystal structures that have the same or similar compound
COMPACK computes these calculations by analysing the geometry of the cluster of
molecules There are two basic steps in comparing two crystal structures using
COMPACK The first step renders the chemical search query subject to several geometric
constraints using the reference molecular structure The second step is the structure
similarity search which involves searching the 3-D coordinates of a target for an
arrangement that matches the query to within specified tolerances The search is
performed by 3DSEARCH154 which is an efficient general search algorithm designed to
find chemical queries within 3D crystal structures information Once 3DSEARCH finds
a match the two structures can be superimposed to obtain a visual impression of their
similarity
The default values for a cluster size of 15 molecules a distance tolerance of 20 and
angle tolerance of 20 are usually used The default cluster size is 15 because the same
clustering results of 30 molecules instead of the default 15 molecules for 1000 predicted
structures of 2-amino-3-nitropyridine led Chisholm and Motherwell151 to the conclusion
that a cluster of 15 molecules is a sufficient size for identifying the same crystal structure
Other methods of comparing crystal structures do exist For example XPac155156
identifies similar sub-components of complete crystal structures of 0- 1- or 2-D in
polymorphs or crystal structures of similar molecules as well as of 3-D in isostructural
assemblies Hirshfeld surface (a way of exploring packing modes157) and fingerprint plots
(a visual representation of all intermolecular interactions simultaneously158) are examples
of Hirshfeld-based methods150159160 of analysing similarities The graphndashset analysis for
H-bonds compares and contrasts sets of molecules161-163 and is based on graph theory for
categorising H-bond motifs Moments of inertia tensors is a technique for comparing
crystal packing based on moments of inertia tensors irrespective of chemical connectivity
and hence the comparison of compounds of diverse chemical composition is possible164
Simulated powder X-ray diffraction165 is another example of comparing crystal
structures In short the comparison of compounds of diverse chemical composition is
possible
COMPACKrsquos ability to give just one number (the distance between matched atoms in
a cluster-root-mean-square-deviation) that shows the relationship between two structures
makes this similarity tool one of the simplest and most effective ways of quantitatively
29 Crystal Structure Comparison
61
rationalising similarity This is why COMPACK will be the primary choice for comparing
crystal structures in this thesis
31 Introduction
62
Chapter 3 An Informal Blind Test A Crystal Structure Prediction of
1-Benzyl-1H-tetrazole
ldquoOne of the continuing scandals in the physical sciences is that it remains in general
impossible to predict the structure of even the simplest crystalline solids from a
knowledge of their chemical compositionrdquo
mdash John Maddox Nature (1988)
31 Introduction
311 Background This chapter reports an informal lsquoblind testrsquo of flexible 1-benzyl-1H-tetrazole BT
(Figure 31) using similar CSP methodology that successfully predicted the very flexible
molecule XX in the fifth blind test1117 In essence I will test the viability of the CSP
method (sections 11 and 28) which has evolved over the years from predicting the
crystal structures of rigid molecules166-168 to molecules that are so flexible that their
conformational flexibilities are accounted for at the start of CSP1117
9
10
1
8
7
2
11
123
65
4
2
1
Figure 31 The chemical diagram of BT determined from the crystal structure Torsion
angles 1=C7-C6-N1-C5 and 2 = C12-C7-C6-N1
In the previous chapters I mentioned that the emergence of a new polymorph of
ritonavir two years after market lunch (section 11) as well as John Maddoxrsquos148
ldquocontinuing scandalrdquo remark in 1988 (section 286) were the catalysts of the lsquoblind testrsquo
challenge organised by the Cambridge Crystallographic Data Centre (CCDC) in 1999
These lsquoblind testsrsquo provided researchers all over the world an opportunity to test their
CSP methods But unfortunately the CCDCndashndashmy industrial sponsorndashndashdid not organise
any lsquoblind testsrsquo during the course of the research reported in this thesis15 By chance my
colleague Rex Palmer observed an unusual packing of BT crystal structures and
subsequently issued me a lsquoblind testrsquo challenge This challenge was to predict the crystal
structure of BT given just the chemical diagram (Figure 31) and given that Z´=1
31 Introduction
63
The drug discovery literature frequently mentions the motifs of 5-substituted 1H-
tetrazole as bioisosteres for the carboxylic acid group169-171 due to the motifsrsquo similar pKa
values shapes and steric interactions Bioisosteres are structural moieties with broadly
similar shapes and functions For pharmaceutical industries the ability to model the
interactions of tetrazoles including BT is of great interest due to tetrazolersquos bioisosteres
feature
312 Experimental Determination of 1-Benzyl-1H-Tetrazole My collaborators (John Spencer Hiren Patel John J Deadman Rex Palmer Louise
Male and Simon J Coles) carried out the following experiments (their findings in
sections 313 and 314 were not made available to me until the end of the lsquoblind testrsquo
ie the submission of my candidate structures)
Synthesis and X-Ray Crystallography
John J Deadman synthesized BT on a ca 50 mmol scale from benzylamine sodium
azide and triethyl formate Hiren Patel under the supervision of John Spencer grew the
single crystals of BT from dichloromethanendashhexane
Louise Male and Simon J Coles collected the X-ray data and did the preliminary
analysis A colourless crystal fragment of dimensions 009 003 002 mm3 was
mounted on a glass fibre and flash-frozen to 120 K The X-ray data were collected on a
Bruker diffractometer using Mo K radiation The crystal structure was solved by direct
methods SHELXL-97172-174 was used to refine the crystal structure
313 Molecular Geometry of the Experimental Structure My collaborators discovered that BT crystallised in the monoclinic space group P21
with unit cell dimensions a = 76843(5) b = 55794(4) c = 94459(7) Aring = 100949(4)
deg V = 39761(5) Aring3 Z´= 1 and density = 1338 g cm-3 Overall the benzyl and tetrazole
rings were essentially planar including the H atom on the CH group (see C5 in Figure
31) belonging to the 5-membered tetrazole ring The individual rings were also co-planar
with the inter-ring link C6 atom (Figure 31) The N-N bonds (see bond lengths in Table
31) were of three different types consistent with Figure 31 N1-N2 = 1343(2) Aring N2-N3
= 1301(2) Aring is longer than a typical N = N bond175 but shorter than a typical aromatic
bond N3-N4 = 1368(2) Aring was also largely aromatic in character175 The two C-N bonds
have different characteristics C5-N4 = 1314(2) Aring was a double bond C5-N1 = 1336(2)
Aring was typically aromatic175 The phenyl rings of BT have a normal geometry with
average CndashC bond length of 1386(4) Aring average bond angle of 1200(7) and ring
planarity root mean square (rms) deviation of 00057 Aring The bond angles in the tetrazole
31 Introduction
64
ring have an average of 1080(17) which is consistent with the planarity of the ring
having an rms deviation of 0012 Aring including the link C atom and H5 on C5 These bond
lengths and angle measurements are similar to those of 5-azido-1H-tetrazole176
Table 31 Angles and bond lengths of the tetrazole ring in BT No information about the
bonds or angles were given to me prior to submission of the candidate structures
Angles X-ray
deg Bond lengths X-ray
Aring
N1-N2-N3 1069(2) N1-N2 1343(2)
N2-N3-N4 1102(2) N2-N3 1301(2)
N3-N4-C5 1052(2) N3-N4 1368(2)
N4-C5-N1 1096(2) N4-C5 1314(2)
C5-N1-N2 1080 (2) C5-N1 1336(2)
C5-N1-C6 1305(2) N2-C1 1472(2)
N2-C1-C6 1215(2)
314 Crystal Packing Weak Hydrogen Bonding Rex Palmer noticed that the mode in which the molecules in the experimental crystal
structure BT were packed was unusual He noted that a molecule such as BT based on
linked delocalized rings might be expected to form crystal structures involving ∙∙∙
bonding (ring stacking) However no such interactions occurred in the experimental
structure (Figure 32) Instead the structure was held together by a large number of weak
intermolecular contacts177178 12 of these were of the CH∙∙∙N interaction and 3 were of
the weaker CH∙∙∙C interaction which involve atoms in the phenyl ring This unusual
packing resulted in a structure composed of infinite S-shaped layers and produced a
sequence of benzyl and tetrazole layers (Figure 33) Another unexpected feature of the
packing was the formation of tetrazole clusters (Figure 32a) each having a central
tetrazole ring coordinated by six other tetrazoles
Figure 32 The crystal structure of BT (a) Partial view of the crystal packing showing
close CH∙∙∙N contacts between a central tetrazole and six surrounding tetrazoles (b)
Partial view showing CH∙∙∙N CH∙∙∙C and CH∙∙∙ contacts
(a) (b)
31 Introduction
65
Figure 33 BT crystal structure (a) View of the infinite S-shaped layers held together by
weak CH∙∙∙N and CH∙∙∙C H-bonds (b) Partial view of the layer structure showing
alternative B(benzyl) and T(tetrazole) layers and the repeating layer sequence [BTBT |
TBTB]
315 Overview of the Challenge After my experimental collaborators grew single crystals of BT from a non-polar
solvent mixture and determined the crystal structure at 120 K I was issued a lsquoblind testrsquo
challenge by Rex Palmer to predict the crystal structure of BT because of the unusual
mode of crystal packing (section 314) No experimental information was given prior to
the submission of the candidate structures The subsequent part of this chapter presents
the computational work I carried out independently upon receiving the chemical diagram
of BT (Figure 31)
This chapter uses CSP methodology (section 322) to predict the crystal structure of a
molecule that can adopt a wide range of molecular shapes due to the conformational
flexibility of the molecule Consequently the conformational flexibility must be
accounted for at the start of CSP (CrystalPredictor 16 section 281) In addition this
method relies on the systematic improvement of the evaluation of the lattice energy Elatt
where Uinter and Eintra are the intermolecular and intramolecular contributions X and
vector θ denote intermolecular and intramolecular degrees These systematic
improvements increase the computing time As a result it is essential to reduce the
number of crystal structures that will be examined as the confidence in the lattice energy
ranking improves in each step
This chapter will also test the transferability of the intermolecular energy potential to
BT since this molecule contains a functional group that differs from those used in
determining the parameters of the intermolecular potentials (section 23)3839
Elatt = Uinter(X θ) + ΔEintra(θ)
31
(b) (a)
32 Computational Methodology
66
To determine whether this study is a success the predicted structures of BT will be
compared with the experimental crystal structures using a similarity tool In addition I
will compare and contrast the most stable generated structures of BT with the similar
tetrazole fragment structures to determine whether the packing of the experimental
structure of BT was unusual In this chapter I will show that the crystal structure of BT
can be successfully predicted starting from just the chemical diagram (Figure 31)
32 Computational Methodology
321 Conformational Analysis To restrict the search space of BT to energetically meaningful regions I carried out
quantum mechanical (MP26-31G(dp) single-point calculations on HF6-31G(dp)
optimised geometries) scans of the two flexible torsions 1 and 2 (Figure 31) using the
GAMESS179 program
322 Crystal Structure Prediction Step 1 The search was carried out using the CrystalPredictor126 program which
covered the 59 most commonly occurring space groups The lattice energy was minimised
by varying the cell parameters and torsion angles 1 and 2 within energetically
meaningful regions (section 321) At this stage the lattice energies (equation 31) were
crudely estimated and then using the grid of the ab initio results from section 321 the
ΔEintra contribution were interpolated The intermolecular electrostatic interactions were
modelled using the atomic charges derived from section 321 All other intermolecular
energy terms were derived from an empirical exp-6 potential FIT40 Approximately a
quarter of a million lattice energy minimisations were performed This produced
approximately 170000 distinct structures of which 44000 structures were unique These
generated structures were labelled by their energy ordering The result of step 1 is the
CrystalPredictor energy landscape
Step 2 Next the lattice energy model was improved For each of the lowest 10000
crystal structures the energy of the isolated molecule and its charge distribution were
calculated at the PBE06-31G(dp) level of theory using GAUSSIAN0353 This
calculation provided a better estimate of ΔEintra and a more accurate representation of the
charge density in terms of a distributed multipole model51 These two contributions were
then combined with an atomndashatom exp-6 repulsion-dispersion potential using parameters
that had been fitted to azahydrocarbons39 and polar crystal structures40 which were
assumed to be transferable to this tetrazole At this stage the lattice energy was
minimised with the molecule held rigid using DMACRYS34
33 Results and Discussion
67
Step 3 Approximately 100 of the most stable structures were then further refined at
the PBE06-31+G(d) level of theory by allowing the molecular conformation to adjust
more accurately to the intermolecular forces using the program CrystalOptimizer7172
(section 282) This algorithm allowed the intermolecular and intramolecular energy to
be minimised simultaneously The CrystalOptimizer program uses the Quasi-Newton
algorithm coupled with a line search to solve the minimisation program It also makes use
of GAUSSIAN0353 calculations on the molecular conformations and DMACRYS34
optimisations of the crystal structure
Step 4 The effect of the crystal environment on the conformational energies ΔEintra and
charge densities was estimated by calculating the conformational energy and charge
distribution in a Polarizable Continuum Model (PCM)180 with =3 a value typical of
organic molecules131 This calculation was implemented in GAUSSIAN0353 at the
PBE06-31+G(d) level of theory The result of step 4 is the PCM crystal energy landscape
33 Results and Discussion
331 Conformational Energy Grid
Figure 34 The conformational energy grid used in the search Relative intramolecular
energies ΔEintra (kJ mol-1) for isolated molecule calculations at the MP26-31G(d p)
level of theory
Prior to the generation of hypothetical structures it was necessary to investigate the
possible steric hindrances to rotation about the two flexible torsion angles 1 and 2
(Figure 31) The result shown in Figure 34 indicates a high degree of flexibility in the
molecule The purple colours represent regions with the smallest energy penalty ie the
33 Results and Discussion
68
most stable conformations This high degree of flexibility makes possible a wide range
of crystal structures with different molecular shapes For this reason the generation stage
(step 1 of sections 322 and 332) incorporates conformational flexibility from the start
332 The CrystalPredictor Energy Landscape The analyses presented here are post-process ie after submitting the ten most likely
crystal structures on the PCM (final) energy landscape (step 4 section 333) The energy
landscape after step 1 (CrystalPredictor) is displayed in Figure 35 This step estimated
the lattice energies Elatt very crudely by interpolating the atomic charges and
intramolecular energies (Figure 34) Yet the generated structure that matched the
experimental structure of BT at this stage was only ranked 23rd This structure BT_23
which is highlighted in red on Figure 35 has only a 3 kJ mol-1 energy difference in
comparison with the global minimum structure
Figure 35 The CrystalPredictor energy landscape of BT generated with a crude lattice
energy model The generated structure that matched the experimental structure is
highlighted in the open red symbol
333 The CrystalOptimizer and PCM Energy Landscapes The two most stable crystal structures on the PCM energy landscape (Figure 36b) have
similar lattice energy less than 01 kJ mol-1 The lsquoblind testrsquo was deemed a success
because the experimental structure matched the second most stable crystal structure
2BT_23 on the PCM energy landscape (Figure 36b and Table 32) This PCM energy
landscape was generated after CrystalPredictor (step 1 Figure 35) lattice energy
refinement (step 2) CrystalOptimizer (step 3 Figure 36a) and PCM calculations (step
33 Results and Discussion
69
4 Figure 36b) Compared to the first step (step 1 Figure 35) the lattice energy rank of
the experimental structure improved significantly from 23rd to 2nd
Figure 36 (a) The CrystalOptimizer (step 3) and (b) PCM (step 4) energy landscape of
BT GM is the global energy minimum The open red symbol represents a match between
the experimental crystal structure and the generated structure The energy ranking of the
crystal structure that matches the experimental has improved from fourth most stable 4
to second most stable 2
(a)
(b)
33 Results and Discussion
70
I submitted a list of 10 structures in which the 2BT_23 structure was selected as the
first choice while the global minimum (labelled GM on Figure 36b) was selected as the
second choice181 The main reason for selecting 2BT_23 as the first choice was the
notable improvement of energy rank from fourth (Figure 36a step 3) to second (Figure
36b step 4) In addition the two most stable crystal structures on the PCM energy
landscape (Figure 36b step 4) were only 01 kJ mol-1 apart
Table 32 Summary of experimental (highlighted in blue) and computed crystal
structures on the PCM energy landscape (Figure 36) The computed structure that
matched the experimental structure (section 312) is highlighted in bold For label
xBT_y x and y are energy ranked after steps 4 and 1 of CSP respectively (section 322)
Label Space Group
a b c
Aring
β
deg
ρ
g cm-3
Uinter ΔEintra Elatt
kJ mol-1
1BT_120 P21c 999 817 1104 11750 133 -12176 225 -11952
2BT_23 P21 793 555 944 10132 131 -12152 208 -11944
Experiment P21 768 558 945 10095 134 - - -
3BT_165 P21c 1086 554 1597 12141 130 -12109 270 -11839
4BT_335 P212121 938 1581 556 9000 129 -12032 200 -11833
5BT_767 P21c 941 553 1580 10234 132 -12044 214 -11830
6BT_167 P21 568 839 881 10322 130 -12289 504 -11785
7BT_912 P21 557 869 861 10365 132 -11882 143 -11739
8BT_34 P21c 809 553 1859 10166 131 -11919 219 -11700
9BT_491 Pna21 1666 566 858 9000 131 -12299 626 -11673
10BT_250 P212121 1904 557 778 9000 129 -11916 325 -11591
11BT_55 P21c 1080 556 1582 12232 132 -11979 396 -11583
12BT_490 P21c 653 866 1394 9428 135 -12098 521 -11577
13BT_178 P212121 833 561 1764 9000 129 -11789 232 -11557
334 Did the Predicted Structure Really Match the Experimental Rex Palmer provided the cif file of the experimental structure once ten of the most
stable structures on the PCM landscape were submitted (Figure 36b) Then I compared
the experimental structure with the submitted crystal structures using COMPACK151 The
computed 2BT_23 structure my first choice (section 333) gave an excellent overlay
with 15 molecules of the experimental structure with a root mean square difference
RMSD value of only 0148 Aring (Figure 37) This computed 2BT_23 structure has similar
unit cell dimensions (Table 32) and is in the same space group P21 as the experimental
structure
33 Results and Discussion
71
Figure 37 The 15-molecule overlay between the experimental (atomic colours) and the
second most stable computed structure 2BT_23 (green) The direction of the view
obscures some of the molecules
In addition to excellent RMSD15 overlay the 2BT_23-generated structure provided a
starting model that was easily refined in SHELXL-97 which was further proof that the
structure was a genuine reproduction of the experimental crystal structure (section 312)
Hence it is clear that the CSP method outlined in this chapter which uses only the
chemical diagram as prior information can successfully predict the crystal structure of a
flexible molecule
335 The Global Minimum Structure on the PCM Energy Landscape The global minimum GM structure labelled 1BT_120 on the PCM energy landscape
(Figure 36) was very different from the experimental crystal structure as only two
molecules overlaid (Figure 38) during similarity calculations From the overlay of the
similarity calculations (Figure 38) it is clear that the GM and the experimental structure
have different conformations The GM structure 1BT_120 (Table 32) is in space group
P21c and has a very different spatial arrangement (as shown in Figure 39) when
compared to the experimental structure (Figure 32 and Figure 33) This structure also
has dominant weak H-bonds 8 CH∙∙∙N and 1 CH∙∙∙C interactions There was also one
weak ∙∙∙ benzyl∙∙∙benzyl interaction (Figure 39)
The similar lattice energy values of the two most stable structures generated (Figure
36b) suggest that the GM structure could a polymorph This GM structure could be
33 Results and Discussion
72
synthesised at high pressure because it is the denser of the two most stable structures
Also growing the experimental structure using a non-polar solvent (section 312) may
have prevented H-bonding formation
After the generation step (CrystalPredictor) the initial rank of the most stable crystal
structure after step 4 GM was 120th The eventual rank was first despite the fact that
only about 100 structures were optimised this shows the importance of the novel
intermediate step 2 in the CSP method After the CrystalPredictor step 1 the GM
structure was 9 kJ mol-1 less stable than the experimental 2BT_23 structure and had
distinctly fewer close contacts than the experimental 2BT_23 structure Therefore the
rearrangement of lattice energy depends on the method used
Figure 38 Crystal Packing Similarity between experimental (grey) and the most stable
predicted structure (1BT_120 green) with only 2 molecules matching (RMSD2 = 1072
Aring)
Figure 39 The structure corresponding to the global minimum in lattice energy
(1BT_120) showing the dominant weak H-bonds (Aring) eight of type CH∙∙∙N and one
CH∙∙∙C and the weak ∙∙∙ interaction (benzylmiddotmiddotmiddotbenzyl)
33 Results and Discussion
73
336 Post Analysis Comparison of Structure with CSD The motivation for the lsquoblind testrsquo challenge was the unusual packing of the
experimental structure Thus a database containing over half-million crystal structures
was searched in an effort to investigate the breadth of variation in the packing of the
experimental structures of BT A Cambridge Structural Database (CSD)182 survey was
carried out to compare BT with other 1-substituted 1H-tetrazole crystal structures (Figure
310) The CSD version 533 March 2012 was searched for fragments defined in Figure
310 The bond lengths bond angles and torsion were analysed and compared with the
experimental structure using histogram plots
1
6
23
5
4
Figure 310 Query used in Conquest to search the CSD for similar fragments
The query of the CSD yielded 34 structures including two redeterminations The
refcodes of these 32 structures were ACIROU ACIRUA BEGRIP CAZWIK
DOKQEA DOKQIE EKAJOQ HISYEO IQUJEK ABMIL LUVPIC MEVWOZ
MUKMAG PHTETZ01 PUGLUZ QALNOH QALNUN QALPAV QALPID
QALPOJ QALPUP QALQAW QALQEA01 QALQIE QEBPUI01 REVMOV
REZNUG RIZXEE SOLHAD TIJLIH VUNNUO and OBAREQ
The experimental bond lengths were typical of those in the other crystal structures
containing the 1-substituted 1H-tetrazole group (Figure 311) Some significant
differences ( 002 Aring) were observed between the ab initio computed values and the
experimental bond lengths but both were within the observed ranges The variations in
tetrazole bond angles (Figure 312) were consistent with the bond length variations for
this moiety176 which was always close to planar The external torsions angles ξ1 and ξ2
exhibited a wide range of values (Figure 312) a result that was consistent with the large
range of low-energy conformations (Figure 34) despite the range of functional groups
bonded to C6
No tetrazole clusters were observed for the 32 1-substituted 1H-tetrazole structures
found in the CSD There were however some tetrazole layers in 1BT_120 and the
33 Results and Discussion
74
experimental structures DOKQIE EKAJOQ QALPAV QALPOJ QALPUP and
REVMOV All 32 structures had the tetrazole bonded to a sp3 carbon and were tetrazole
hydrocarbons (except QALPAV which also contained an iodine atom) Hence there was
no strong driving force for the tetrazole cluster Still a layer structure seemed to be quite
favourable in cases where there were no competing strong interactions There were more
similarities between the CSD tetrazole structures and the GM structure than there were
between the experimental structures This finding suggests that the use of informatics of
CSD in CSP such as Desirajursquos supramolecular synthon approach183 would weight the
global minimum structure more than the experimental structure
Figure 311 Histograms showing the bond length distributions of 32 1-susbtituted 1H-
tetrazole rings in the CSD The red square denotes the experimental bond lengths in BT
while the black square denotes the ab initio bond lengths in the corresponding calculated
structure 2BT_23
33 Results and Discussion
75
Figure 312 Histograms showing the distributions of the torsions and angles of the 32-
tetrazole rings found during the CSD survey The experimental bond length in BT is
denoted by the red square while the ab initio bond length in the corresponding calculated
structure 2BT_23 is denoted by the black square
34 Summary
76
34 Summary I successful predicted the unusual crystal packing of BT given just the chemical
diagram and the Z´ number The packing was predicted by using a model that accurately
determines the electrostatic forces arising from molecular charge density including the
anisotropic forces from the lone pair and electrons but otherwise was not tailored to
the tetrazole∙∙∙tetrazole interactions Thus the intermolecular energy potential is
transferable to BT crystal structure even though the functional group used in determining
the parameters of the intermolecular potentials did not include a single tetrazole molecule
The successful prediction of the experimental structure as one of the two distinct most
stable structures shows that the unusual layers do present an optimal compromise between
the many different weak hydrogen bonds and other intermolecular interactions The most
stable crystal structure GM could well have been an undiscovered polymorph In fact
informatics weighting may have selected this structure Thus this study shows the
potential value of CSP for generating unexpected structures
This study also showed that the level of computational chemistry modelling that was
used is suitable for modelling the molecular recognition of this functional group This
level of modelling could become increasingly useful in pharmaceutical design due to
tetrazolesrsquo bioisosteres properties In the next chapter more will demanded of CSP Will
this method deliver
41 Introduction
77
Chapter 4 Is the fenamate group a polymorphophore Contrasting the
crystal energy landscapes of fenamic and tolfenamic acids
ldquoIts the little details that are vital Little things make big things happenrdquo
mdash John Wooden
41 Introduction This chapter builds on Chapter 3rsquos description of a procedure that successfully
predicted the experimental crystal structure of a flexible molecule in order to address two
specific questions First in a given molecular structure is the presence of a
polymorphophore (section 11) substructure sufficient to ensure polymorphism Second
what role do substituents play in determining the range of polymorphs that are present in
a molecule
In this investigation of the concept of polymorphophore I will use CSP to contrast the
crystal energy landscapes of two fenamates (Figure 13) monomorphic fenamic acid (2-
(phenylamino)-benzoic acid FA) and one of its highly polymorphic derivatives
tolfenamic acid (2-[(3-chloro-2-methylphenyl)amino]-benzoic acid TA) TA is a good
test case for this investigation into whether the fenamate group is a polymorphophore
because at the start of this study TA had five known polymorphs19
The term ldquofenamaterdquo can refer to a range of molecules that vary widely in molecular
structure including niflumic acid which contains an aromatic nitrogen Although some
researchers who have conducted thermodynamic and structural investigations of
fenamate molecular crystals have included an extraordinarily wide range of molecules
even dichlofenac184 the present study is restricted to the fenamates shown in Figure 13
Essentially I will focus on cases where the dominant interactions that determine the
crystal or drug binding are inherent in the proposed polymorphophore families of fenamic
acid (Figure 13)
41 Introduction
78
ROY fragment
WIFHUP 2185
R=H
ROY
QAXMEH 7(3)20
R2=CH3
OGIDEN 3186
R2=R5=CH3
Fenamate fragment
Fenamic acid (FA)
QQQBTY 1187
R=H
Tolfenamic acid (TA)
KAXXAI 519
R1=CH3 R2=Cl
Flufenamic acid (FFA)
FPAMCA
2(1)22
8(1)18 in 2012
R2=CF3
PEFMET 1188
R1=CH3
PEFNAQ 1188
R2=CH3
SURMEY 1187
R3=CH3
Mefenamic acid
XYANAC 2(1)189190
R1=R2=CH3
SURMOI 1187
R2=R4=CH3
LAHLOW 1191
R1=R5=CH3
Figure 41 The polymorphophore families of ROY and fenamic acid The numbers of
polymorphs in the Cambridge Structural Database (CSD) follow the refcodes for each
specific molecule and (x) denotes the number of additional polymorphs that whose
crystal structures were not available The lowest two rows are fenamates whose structures
are used in Table 46
41 Introduction
79
411 Polymorphism and Polymorphophores Polymorphism (section 11) the occurrence of multiple crystal structures with the same
chemical content is now known to be a widespread phenomenon among organic
molecules192 and is of great importance in the industrial manufacture of specialty
chemicals and pharmaceutical products Relatively few systems have several polymorphs
whose crystal structures and relative stabilities have been determined the most
thoroughly investigated20 being the polymorphs of 2-[(2-nitrophenyl)amino]-3-
thiophenecarbonitrile commonly known as ROY (Figure 13) after the red orange and
yellow colour spectrum of the first six polymorphs to be reported193 Some families of
related molecules23194 such as the sulphonamides194 ROY derivatives23 barbiturates195
carbamazepine derivatives147196 and fenamates19 appear to have a strong tendency
toward polymorphism This fact has given rise to the study of a polymorphophore1923196
a term coined by Matzger23 that refers to a structural element that when incorporated into
a molecule favours the formation of polymorphic crystal forms Hence
polymorphophore is a descriptive term and not a quantifiable hypothesis
The focus of this chapter is the polymorphophore concept Some families of molecules
contain a common substructure (the polymorphophore) wherein many members but not
necessarily all exhibit polymorphism For example removing or adding a methyl group
to ROY creates molecules (Figure 13) that are also polymorphic indicating that ROY is
a polymorphophore (Figure 13) However the number of related molecules is limited
probably because ROY is only a precursor in the synthesis of the blockbuster drug
olanzapine Studying polymorphophores is like studying pharmacophores a particularly
promising way of finding new leads in drug discovery especially in cases when a
receptorrsquos 3D structure is unknown197
This chapter considers the fenamates that conserve the H-bonding groups and dominant
molecular shapes by having small non-polar substituent groups for the aromatic protons
as exemplified in Figure 13 These types of substituent(s) might be expected to have
minimal effects on the strongest intermolecular interactions and hence on either crystal
packing or drug receptor binding The fenamates contain a proposed
polymorphophore1819 that is related to that of ROY (Figure 13) in having a phenyl group
attached via an N-H group to a further aromatic ring
412 Conformations in known Crystal Structures The overlay of the conformers of FA and TA in the experimental crystal structures
(Figure 42) confirms that the main variation in conformation is the ξ1 torsion angle The
41 Introduction
80
two most stable polymorphs of TA forms I and II (blue and red in Figure 42) have the
greatest difference in ξ1 The benzoic acid ring and the N-H groups are coplanar with the
ξ2 torsion angle being approximately zero concordant with the intramolecular H-bond
Figure 42 Overlay of the experimental conformers of FA (top) and TA (bottom) viewed
with the overlaid benzoic acid fragment arranged horizontal FA QQQBTY02 (Z´=2
light blue and magenta) TA KAXXAI01 (Form I Z´=1 blue) KAXXAI (Form II Z´=1
red) KAXXAI02 (Form III Z´=2 green and purple) KAXXAI03 (Form IV Z´=3
yellow brown (obscured by yellow) and black) and KAXXAI04 (Form V Z´=1
disordered on both sites (section 415) violet and grey) The arrows point to the main
variation (ξ1) between the conformers of FA and TA in the experimental crystal
structures
413 Experimental Data of FA and TA FA has just one known form187 which has two molecules in its asymmetric unit Z FA
serves as a parent structure for several fenamates including TA TA is a non-steroidal
anti-inflammatory drug used for the treatment of rheumatic conditions198 At the start of
this study TA had at least five polymorphs forms I-V19199 It currently has six
polymorphs (see section 438) Unlike ROY the polymorphs of TA vary in the number
ξ1
ξ1
41 Introduction
81
of molecules in the asymmetric unit Z´ (Table 41) The variation in colour that is
observed between form I (colourless) and II (yellow) is due to the conformational
difference as observed for ROY2023 There were three undisputedly metastable
polymorphs including form V whose disorder is analysed further in section 415
Here it is necessary to discuss further the relative stability of forms I and II (Table 41)
The enthalpy and temperature of fusionHfus and Tfus measurements provide a way of
classifying polymorphs as either being monotropic or enantiotropic Four different
papers19199-201 have presented evidence for the thermodynamic relationship between
forms I and II but each paper gives slightly different conclusions Surov et al showed
that the yellow form (form II) is more stable than the white form (form I)201 and that these
polymorphs have a monotropic relationship because the form with the higher melting
temperature form II has a higher enthalpy of fusion Hfus (by the enthalpy of fusion
rule)202 as illustrated in Figure 43(a) However Mattei and Li200 measured an
endothermic transformation going from II to I with temperature increasing to 1418 degC
with a Differential Scanning Calorimetry (DSC) implying that forms I and II have an
enantiotropic relationship as shown in Figure 43(b) The observed transformation from
form II to I in a slurry experiment indicated that the thermodynamic transition point was
below room temperature All three sets of measurements199-201 that were extrapolated to
0 K had form II more stable than form I
Table 41 The experimental data of the known forms of FA and TA Crystal structures
and Hfus values were taken from ref [19] unless otherwise specified aThe most widely
varying torsion angle ξ1 is defined in Figure 49 bTemperature of crystal structure
determination cMelting temperature
REFCODE (form)
Space Group
Z´ ξ1a
deg Tb
K
Hfus
kJ mol-1
Tmc
K
FA QQQBTY02 P-1 2 4721 7045 283-303187 - - TA KAXXAI01(I) P21c 1 10774 3937 48625-4886
110 4250 48405199
410plusmn05 48418plusmn02201
4127 48585200
KAXXAI(II) P21n 1 4223 387 48667
110 4840 48765199 490plusmn05 48578plusmn02201
4240 41495200
KAXXAI02 (III) P21c 2 4419 5764 85 - KAXXAI03 (IV) P-1 3 673457584784 85 3188 KAXXAI04 (V) P-1 1 5562 85 -
41 Introduction
82
Figure 43 Temperature dependence of the enthalpy (H) and free energy (G) diagrams
for forms I and II of TA showing a monotropic (top) relationship from data from
Surov201 which are qualitatively the same as data from Andersen199 and an enantiotropic
(bottom) relationship from data from Mattei and Li200
Lopez-Mejias et al19 provided the only thermodynamic data available for forms IIIndashV
The researchers noted that heating forms III and V at 80degC caused a transformation to
form I within a period of minutes to hours In solution forms III IV and V transformed
to form I or a mixture of form I and II Hence forms III IV and V were shown to be
metastable polymorphs The heats of fusion given in Lopez-Mejiasrsquo supplementary
information19 were listed by the initial form and forms III and V may well have
transformed to form I rather than form II Therefore these sets of data were inconclusive
as to the relationship between forms I and II
(a)
(b)
41 Introduction
83
414 Similarities between the known forms of FA and TA The known polymorphs of TA and FA showed some similarities (Table 42) as all were
based on the H-bonded dimer (Figure 44a) The graph-set analysis161162 for the (two)
types of H-bonds are identical for all the crystal structures of TA and FA intermolecular
dimers with 2 donors 2 acceptors and 8 atoms in total (11987722(8)) and intramolecular with 1
donor 1 acceptor and 6 atoms in total (S(6))201
Form II had the most distinctive packing (Figure 44b) as well as conformation (Figure
42b) and was the only structure with a short contact involving the chlorine atom and the
aromatic ring The most striking result from Table 42 was the similarity between the
metastable forms III and IV where 11 molecules could be overlaid (Figure 44c) The
two independent molecules in form III had similar conformations to two of the three
independent molecules in form IV (compare the open circle and closed triangle symbols
in Figure 412a) The polymorphs had sufficiently similar simulated powder patterns to
have a PXRD similarity measure in the grey area between polymorphism and
redeterminations203 and for this reason they exemplify the challenges in defining
polymorphism204205
Table 42 Quantification of the similarities of FA and TA crystal structures showing the
packing similarity (RMSDn) and powder X-ray diffraction (PXRD) similarity206 The
bold numbers indicate the number of molecules n that match within distance and angle
tolerances of 20 and 20deg respectively with the RMSDn values in brackets See section
425
n(RMSDnAring)
FA TA(I) TA(II) TA(III) TA(IV)
FA - 6(066) 2(048) 3(074) 5(108)
TA(I) 078 - 1(087) 3(078) 3(107)
TA(II) 085 086 - 2(077) 2(074)
TA(III) 078 083 090 - 11(045)
TA(IV) 078 084 092 098 -
TA(V) 086 089 093 091 093
PXRD Similarity
41 Introduction
84
Figure 44 Features of the experimental crystal structures (a) The hydrogen-bonded
dimer motif found in all structures with variations in the phenyl ring orientations (ξ1)
The specific illustration shows the packing similarity between FA (QQQBTY02) and TA
form II (KAXXAI) (b) The unique packing of TA form II with short contacts between
chlorine and the aromatic ring (c) Crystal Packing Similarity between form III and form
IV of TA showing the 11-molecule overlay which includes only two dimers
415 Solving the Connectivity Problem of a Disordered Form The crystal structure of Form V of TA was solved with an R-factor of 658 the whole
molecule was equally disordered over two sites19 I found that separating the two
components of disorder gave the wrong connectivity between the C8 and N1 atoms (green
in Figure 45b) The C8-N1 bond length of 170 Aring was unusually long and this caused the
breakdown of the trigonal planar relationship of nitrogen C7-N1(H6)-C8 connectivity
(c)
(b) (a)
41 Introduction
85
(Figure 45c) A model with the two components both corresponding to the expected
molecular geometry can be made by redefining the connectivity (Figure 45b) to link half
of one disordered molecule (the bonded molecule in Figure 45a) with half of the other
disordered molecule (the atoms-only component in Figure 45a) The second component
was formed by combining the remaining halves The resulting molecules (red and blue in
Figure 45b) have the expected C-N bond length of 143 Aring and a trigonal planar geometry
around the nitrogen atom
The above procedure results in three ordered Z=2 crystal structures with the unit cell of
form V by using the two resulting molecules (Figure 46a b for Z´=1 and Figure 46c for
Z´=2)
Figure 45 (a) Crystal structure KAXXAI04 of form V of TA (b) The atom connectivity
of the two new components (colour red and blue) the original C-N connectivity is
labelled green (c) Chemical diagram showing the atomic connectivity of TA
9
1
1
2
10
1
813
14
7
164
21
1 53
2
(a)
(b)
(c)
41 Introduction
86
Figure 46 Ordered Z=2 crystal structures formed from the disordered components of TA
form V (a) Form V_a (b) Form V_b and (c) Form V_c
(a)
(b)
(c)
42 Computational Methods
87
416 Overview The focus of this chapter is the polymorphophore concept which I will investigate by
generating crystal energy landscapes (section 285) of FA and TA These crystal energy
landscapes are a valuable tool for examining the known forms of different molecules
because the same level of polymorph screening is rarely applied to entire families of
molecules This is likely the case for FA and TA since TA is a drug molecule while FA
is not In addition there were far more publications for TA than FA (see section 413)
For these reasons FA and TA provide a good test for the concept of polymorphophore
In this chapter the energy landscapes of FA and TA will be generated by first selecting
a suitable ab initio level of theory for the conformational energy of the isolated molecule
I will achieve this by performing ab initio scans at various levels of theory Then these
ab initio scans will be compared with histogram plots of crystal structures whose
fragments are similar to FA and TA The analysis of these scans and plots will guide the
methodology I will use to generate the hypothetical structures The final energy
landscapes of FA and TA will be generated by systematically increasing the accuracy of
evaluating the lattice energies while reducing the number of generated structures Finally
I will compare the crystal structures on the energy landscapes for FA and TA using a
similarity tool
I will show the conformational flexibility of fenamate fragments allows the potential
for a large number of structures and that it is the substituents that determine if a molecule
is polymorphic or not In other words polymorphophore promotes but does not guarantee
polymorphism Concisely CSP goes beyond the lsquoblind testrsquo described in Chapter 3
42 Computational Methods
421 Ab initio Conformational Profile of TA To test the effects of ab initio methods on the conformation profile of TA I compared
relaxed scans at various levels of theory of the main torsion ξ1 (Figure 49) with single-
point energy calculations at the MP26-31G(dp) level of theory The effect of rotating
the H-bonded torsion ξ2 (see Figure 49) was investigated by performing a relaxed scan
at the PBE06-31+G(dp) level of theory The results from these scans helped in selecting
the appropriate level of theory as well as the torsion that would be allowed to rotate during
the generation of hypothetical structures (step 1 section 423)
422 CSD Survey for Fenamates The relaxed conformational scans of the main torsion angle ξ1 (section 421) at the
PBE06-31+G(d) level of theory were complemented by a Conquest207 search of the
Cambridge Structural Database (CSD 208) for the crystal structures containing the
42 Computational Methods
88
molecular fragment shown in Figure 47 This comparison allowed us to see the variation
in ξ1 when there was an internal H-bond (ZmiddotmiddotmiddotH lt 26 Aring) that constrained part of the
molecule to planarity
dlt26Aring
Figure 47 Query fragment and the torsion angle ξ1 measured in the Conquest207 survey
of the CSD structures There were 131 organic structures where Y=H and 94 where Yne
H
423 Crystal Structure Prediction I calculated the crystal energy landscapes14 of FA and TA using a method209 that was
adapted from that used for the highly flexible molecule XX in the fifth blind test of CSP11
a method that called for an approximate conformational energy surface in the initial
search stage (see section 281) The final energy landscapes of FA and TA were generated
in four steps with the quality of the methods increasing and estimated the conformational
energy penalty Eintra and the intermolecular contribution Uinter to the lattice energy Elatt
Step 1 (Generation of hypothetical crystal structure) Crystal structures with Z´=1 were
generated in 15 common space groups P1 P-1 P21 P21c P21212 P212121 Pna21
Pca21 Pbca Pbcn C2c Cc C2 Pc and P2c using CrystalPredictor126 The grid was
used to extrapolate the atomic charges and intramolecular energy Eintra This grid was
pre-computed as a function of just ξ1 (Figure 48) using GAMESS179 at the MP26-
31G(dp) level of theory (single-point calculation) after the molecular geometries were
optimized at the HF6-31G(dp) level The intermolecular contributions to the lattice
energy were calculated crudely from the atomic charges and the Williams135 exp-6
repulsion-dispersion potential The CrystalPredictor program carried out 250000 lattice
energy minimizations This resulted in 162288 and 182615 distinct structures for TA
and FA respectively of which 16543 and 22884 were unique for TA and FA
respectively
Elatt = Uinter + Eintra = Uinter + Uelec + Eintra 41
42 Computational Methods
89
Figure 48 The fragment used in the CrystalPredictor search for TA Each fragment was
kept rigid during the search for hypothetical crystal structures
Step 2 (Accurate evaluation of the electrostatic contribution (Uelec)) Single-point ab
initio calculations were carried out on the conformation for each of the unique structures
from step 1 using GAUSSIAN0353 at the PBE06-31G(dp) level of theory to improve
the estimate of Eintra and provide the atomic multipoles by distributed multipole
analysis51 using GDMA The crystal structures were re-optimized using DMACRYS34
keeping the molecule rigid with the intermolecular energy Uinter calculated from the
distributed multipoles and the FIT parameterization38-40 of the exp-6 atomndashatom
repulsionndashdispersion potential
9
1
1
2
10
1
813
14
7
164
21
1 53
2
TA
Figure 49 The degrees of freedom optimized by CrystalOptimizer for crystal structures
of FA and TA (ξ1equiv C7-N1-C8-C9 ξ2equiv C2-C7-N1-C8 ξ3equiv O1-C1-C2-C7 ξ4equiv H1-O1-C1-C2
and ξ5equiv C8-C13-C14-H10 θ1equiv H6-N1-C8 θ2equiv H1-O1-C1)
Step 3 (Accurate evaluation of lattice energy (Elatt=Uinter and Eintra)) Approximately
100 of the most stable crystal structures from step 2 were re-minimized due to the limited
time constraints of submitting this study as my first year report Six and seven
conformational degrees of freedom for FA and TA respectively (Figure 49) were
allowed to change as was the crystal structure using CrystalOptimizer7172 and
calculating Eintra and the distributed multipoles at the PBE06-31+G(d) level of theory
for the isolated molecule
Step 4 (Modelling the effect of the crystalline environment) Finally I estimated the
effect of the crystal environment using a Polarizable Continuum Model (PCM)180 that I
42 Computational Methods
90
obtained by calculating the wavefunction of the molecular structure in a dielectric of ε=3
(typical of molecular organic crystals)131 as implemented in GAUSSIAN03 The crystal
structures were then re-minimized using the distributed multipoles calculated in the PCM
environment while keeping the molecule rigid the resulting Uinter was combined with the
Eintra to evaluate the lattice energies The CSP-generated crystal structures for FA were
labelled xFA_y where x was the final energy ordering and y the ordering after the
CrystalPredictor stage A comparison of x and y shows the extent of re-ranking by
increasing the accuracy of the lattice energy model
424 Experimental Crystal Structures with Z´ gt1 The complexity of the task of generating Z´gt1 crystal energy landscapes (steps 1-4) for
flexible molecules limited the search (section 423) to Z´=1 Analogous CrystalOptimizer
(step 3) and PCM calculations (step 4) were performed starting from all the experimental
crystal structures of TA and FA which included Z´gt1 structures FA form I and TA
forms III IV and V (section 415) This allowed comparison between Z´=1 generated
crystal structures and the experimental crystal structures of FA and TA
425 Comparison of Crystal Structures The experimental crystal structures the corresponding lattice energy minima and the
structures on the crystal energy landscapes were compared using the Crystal Packing
Similarity151 module (section 29) implemented in Mercury210 This crystal structure
similarity tool returns the highest number of molecules n (where n 15) that can be
overlaid between two different structures when all non-hydrogen atomndashatom distances
are within a 20 distance tolerance and angles are within 20 The calculated RMSDn is
the root mean square deviation of all non-hydrogen atom positions in the clusters of n
molecules The program allows for comparisons of crystal structures of different
molecules with the RMSDn being calculated from only the common non-hydrogen
atoms This Crystal Packing Similarity calculation determines the similarity in the
coordination environment of the two crystal structures rather than of the crystallographic
cell
43 Results
91
43 Results
431 Dependence of Conformational Energy on Method An appropriate grid of intramolecular energies was essential in order to search all the
likely conformations of TA and FA and thereby generate all likely Z´=1 crystal structures
To observe the effects that changing the level of theory had on the relative intramolecular
energy the torsion angle was scanned at HF PBE0 MP2 and B3LYP levels of theory
using GAUSSIAN0353 with the rest of the molecule allowed to relax
Figure 410 The relative conformational energy of isolated TA molecules as a function
of the ξ1 The MP2 and PBE0 method at 6-31G(dp) basis set compared with the other
method (top) and the other basis sets (bottom) for the PBE0 method
43 Results
92
The HF6-31G(dp) level of theory produced one minimum for the torsion angle
(Figure 410a) This result was qualitatively incorrect so the PBE0 level was selected as
the best compromise because it reproduced the correlation effect present in TA its
minima coincided in the same torsion angle region as that of MP2 and was
computationally cheaper than MP2 Since the conformational profile of TA converged at
the 6-31+G(d) basis set (Figure 410b) I selected PBE06-31+G(d) as the appropriate
level of theory for the final lattice energy calculation (steps 3 and 4 of section 423) of
the crystal structures This level of theory produced the standard plots of Chapters 4 to 6
432 Consideration of H-bonded Torsion
Figure 411 The relative conformational energy as a function of the ξ2 (Figure 49) for
FA and TA calculated at the PBE06-31G(dp) level of theory
The conformational energy scans of ξ2 (Figure 411) of TA and FA are very similar
The decrease in the torsion angle from 180deg strainedmdashand eventually brokemdashthe
intramolecular H-bond between the carbonyl group and N-H This H-bond strain accounts
for the huge energy penalty observed when this torsion angle changed Therefore
torsion was kept rigid during the search for hypothetical crystal structures even as the
torsion was optimized within the crystal structures to enable an accurate evaluation of the
balance between intermolecular and intramolecular energy in step 3 (section 423)
Chapters 5 and 6 present a more thorough investigation of the conformational energy
scans of fenamates
43 Results
93
433 CSD Survey of Fenamates The conformational potential energy surfaces of isolated TA and FA molecules (Figure
412a) were similar for a wide range of conformations around those found in experimental
structures (Figure 42) but were different as the bulky methyl substituent of TA
approached the benzoic acid ring (Figure 412a) For FA the energy penalty for
conformational changeEintra was less than 6 kJ mol-1 for a complete rotation of the
phenyl ring whereas for TA there was a conformational region that was far too high in
energy to occur in crystal structures The observed conformations of FA and TA in their
crystal structures corresponded to low-energy isolated molecule conformations (Figure
412a) with a relative intramolecular energyEintra of less than 3 kJ mol-1 The
conformational profile for TA was in qualitative agreement with that calculated by other
high-quality ab initio methods (see MP2 and B3LYP in Figure 410) but the profile was
quantitatively affected by the subtle balance between intramolecular dispersion and
intramolecular basis set superposition error60 Other studies have also suggested that the
barriers to conformational change would be lower in solvents from calculations in a
dielectric continuum simulating CCl4 and methanol211
The crystal structures in the CSD that contain the search criterion of Figure 47 also
show the same preference for the lower energy conformations That is the distribution
maxima coincide with the conformational minima (Figure 412b c) with very few
structures having the two rings near coplanar or perpendicular (ξ1=0 90) around the local
maxima in the conformational energy scans For the Y=H search because both ortho
substituents were hydrogen atoms two torsion angle values arose per conformation in a
crystal structure (one value between 0 and 90 and the second value between 90 and
180) giving a symmetric plot (Figure 412b) For YH on the other hand each structure
had only one torsion angle value and an asymmetric distribution (Figure 412c) reflecting
the steric hindrance of the ortho substituent
43 Results
94
Figure 412 The relaxed conformational energy scan of FA and TA as a function of ξ1 at
the PBE06-31+G(d) level of theory (a) Includes the experimental values of ξ1 marked
for TA and FA with the symmetry equivalent FA conformations denoted by open black
squares and an insert diagram showing the steric hindrance for TA in the high-energy
region A histogram of (b) 131 crystal structures found in the CSD search (Figure 47)
with Y=H plus symmetry equivalent structures and (c) 94 crystal structures with YneH
(b)
(c)
(a)
43 Results
95
434 Validation of the CrystalOptimizer plus PCM Models The computational model (steps 3 and 4 of section 423) is able to reproduce all ordered
crystal structures satisfactorily as minima in the lattice energy (Table 43) with these
static 0 K structures overlaying the finite temperature crystal structures with similar
accuracy The range of lattice energies is less than 2 kJ mol-1 consistent with both the
small energy range expected for polymorphs and with the thermodynamic data (Table
41) Form I is the most stable at 0 K in disagreement with the monotropic relationship
between forms I and II as determined by DSC measurements199201 and other data (section
412) Forms III and IV are metastable and very close in energy to form II Of the three
form V Z=2 ordered model crystal structures two have a nearby lattice energy minimum
Because all are quite high in energy the disordered structure is likely to be more complex
than a combination of these structures However a full symmetry adapted ensemble study
of a large supercell143212 would not be appropriate without more detailed experimental
studies
Table 43 Comparison of the lattice energy minimum with the experimental structure
used as a starting point for the final lattice energy model (PBE06-31+G(d) PCM) for
the ordered structures of FA and TA The three form V Z=2 model structures derived
from the disorder components of TA (section 415) are also compared with the starting
model RMSDn corresponds to n=15 unless (n) is given
Space
Group
ρ
gcm-
3
Elatt
kJ mol-1
a b c
Aring
α β γ
deg
RMSDn
Aring
FA
Expt P-1 133 808 9811404 8596 8864 7345
Opt P-1 134 -13663 848 9911333 9094 8816 7130 046
TA
Expt I P21c 144 4833213 804 900010488 9000
Opt I P21c 139 -14724 4863154 832 900010200 9000 033
Expt II P21n 145 38422001421 9000 9411 9000
Opt II P21n 141 -14521 38622061460 9000 9621 9000 026
Expt III P21c 144 76411312807 9000 9303 9000
Opt III P21c 139 -14555 78311642748 9000 9332 9000 030
Expt IV P-1 144 75214331759 10368 9825 9304
Opt IV P-1 138 -14514 76514001828 10256 9932 9152 037(14)Dagger
Expt V P-1 144 765 902 942 10740 920610166
Opt V_a P-1 138 -13954 767 919 961 10756 939910087 021
Opt V_b P-1 137 -14177 6781077 897 9275 850310348 089(6)
Opt V_c P-1 139 -14437 768 928 949 10695 925110249 019
DaggerThe Expt and Opt IV crystal structures overlaid 14 out of 15 molecules
43 Results
96
It is clear from Table 43 that the lattice energy minimization of the ordered structures
V_a and V_c produces a fairly small change in the cell constants but the nearest
minimum to V_b is rather different probably because the initial structure contained a
close ClmiddotmiddotmiddotCl contact These ordered structures correspond to the most stable of three
models of form V All three structures have a lattice energy that is 6-8 kJ mol-1 above
form I and so these ordered models of form V are not competitive in energy with the
other known polymorphs of TA
435 Energy Landscapes of Intermediate Steps
Figure 413 Crystal energy landscape of TA for the Z´=1 structure after (a)
CrystalPredictor (Step 1) (b) the single conformer calculation of Eintra and the atomic
multipoles at the PBE06-31G(dp) level of theory (Step 2 of section 423)
(a)
(b)
43 Results
97
I refined the lattice energy calculation in stages and systematically reduced the number
of crystal structures as my confidence in the energy ranking increased After conducting
single-point calculations to get accurate Eintra and distributed multipoles (which
improved the Uelec and thus the Uinter see equation 41) on all of the unique crystal
structures (step 2 of section 423) the gap between the known forms (I and II of TA) and
the global minima reduced from 40 kJ mol-1 to 6 kJ mol-1 (Figure 413) This intermediate
step was vital in reducing the computing time of the subsequent step 3 (section 423
only about 100 crystal structures were refined) due to the increased confidence in ranking
of the known forms (Figure 413)
436 Finding and Explaining the Known Structures with CSP The known forms of FA and TA were at or close to the global minimum on the final
crystal energy landscapes (Figure 414) which generated all the known Z´=1 ordered
polymorphs The crystal energy landscapes of FA and TA were similar in that they each
had an energy gap of approximately 2 kJ mol-1 between the global minimum cluster and
the other structures although the cluster of low-energy structures was far larger for TA
Although this difference suggested that TA would be more polymorphic than FA I
compared the structures to see whether it was plausible that TA and FA could crystallize
as distinct polymorphs allowing for thermal motion at crystallization temperatures
All the crystal structures of FA and TA whose energies were plotted in Figure 414 (and
tabulated in Table 44 and Table 45) contain the carboxylic acid dimer (Figure 44a)
However the orientation of the phenyl substituents could differ so markedly that this
dimer did not always satisfy the distance criterion to be overlaid by the default Crystal
Packing Similarity comparison This observation suggests that these structures on the
final energy landscape for FA and TA differ by the packing of the aromatic rings It was
necessary to perform a qualitative assessment of the barriers that prevented the
rearrangement of the molecules into a more stable form
The lowest-energy hypothetical structure on the crystal energy landscape for FA was a
Z´=1 structure (1FA_22) that was very similar in density and lattice energy to the only
known experimental Z´=2 form (Figure 414a) with a PXRD similarity of 085 This
1FA_22 hypothetical crystal structure overlaid 5 molecules (Figure 415a) with the
experimental form and it matched the conformation of one of the independent molecules
(Figure 415b) The difference between these two structures lay in the packing of the
layers a difference that is seen in many polymorphs such as progesterone213
43 Results
98
Figure 414 The crystal energy landscapes of FA (top) and TA (bottom) Each symbol
represents a crystal structure of the specified space group which is a minimum in the
lattice energy (calculated within the polarizable continuum) The open symbols
correspond to the minima starting from the experimental structures (Table 43) The
packing coefficient is the proportion of the cell volume occupied by the molecule214
calculated using a grid spacing of 01 Aring
43 Results
99
Table 44 The lattice energy minima of FA shown in Figure 414a The minimum found
starting from the experimental structure is in bold
Label Space
Group a b c
Aring
α β γ
deg
ρ
g cm-3
Uinter ΔEintra Elatt
kJ mol-1
1FA_22 P21c 868 4682709 9000 7404 9000 134 -13765 137-13628
QQQBTY02 P-1 848 9911333 9094 8816 7130 134 -13920 316-13599
2FA_2 P-1 454 9271493 6910 9201 6858 132 -13483 152-13331
3FA_59 P21c 457 8802695 9000 9956 9000 132 -13381 113-13269
4FA_1 P21c 451 8992682 9000 7877 9000 133 -13435 175-13260
5FA_10 P21c 4582686 880 9000 8526 9000 131 -13350 144-13206
6FA_151 P-1 1285 744 666 66291027411127 131 -13418 221-13197
7FA_4 P21c 1788 5341283 9000 6136 9000 132 -145121363-13149
8FA_16 P21n 1395 5201508 9000 7809 9000 132 -145051361-13144
9FA_287 P21n 1429 4591770 9000 7060 9000 129 -13279 240-13039
10FA_192 P21c 46019181231 9000 9792 9000 132 -13641 636-13005
11FA_19 P21c 50121791004 9000 7377 9000 135 -143771419-12958
12FA_23 P21c 6443425 653 900013152 9000 131 -13855 917-12938
13FA_2880 P21n 1490 4931456 9000 8825 9000 133 -13666 791-12875
14FA_33 P21c 4302600 997 900010250 9000 130 -13039 166-12873
15FA_18 P-1 870 799 935 105831022011301 132 -13040 187-12853
16FA_5226 P-1 10211325 990 1410911696 4347 127 -13013 186-12827
17FA_484 C2c 3864 897 750 9000 5874 9000 128 -12962 155-12807
18FA_7 P-1 4991113 995 844610467 9266 133 -141671409-12758
Table 45 The lattice energy minima of TA shown in Figure 414b Minima found starting
from the experimental structures or ordered models are in bold
Label Space
Group a b c
Aring
α β γ
deg
ρ
g cm-3
Uinter ΔEintra Elatt
kJ mol-1
FORM I P21c 4863154 832 900010200 9000 139 -14874150-14724
1TA_8 P21c 4853160 833 9000 7787 9000 139 -14865148-14717
2TA_15 P-1 1772 847 484 79491123711171 140 -14832163-14669
3TA_876 P-1 1698 744 734 9440 9376 4181 141 -14952357-14595
4TA_6243 P-1 12061015 871 7176 617011737 142 -14774196-14579
FORM III P21c 78311642748 9000 9332 9000 139 -14853298-14555
FORM II P21n 38622061460 9000 9621 9000 141 -14784263-14521
5TA_38 P21n 38622051460 9000 8376 9000 141 -14781263-14518
FORM IV P-1 76514001828 10256 9932 9152 138 -14773259-14514
6TA_82 P21c 39014332374 9000 6805 9000 141 -14611234-14377
FORM V_b P-1 6781077 897 9275 850310348 137 -14505328-14177
FORM V_c P-1 768 928 949 10695 925110249 139 -14437313-14124
FORM V_a P-1 767 919 961 10756 939910087 138 -14219265-13954
7TA_45 P-1 14441231 385 10950 8330 7631 142 -14171263-13908
8TA_88 C2c 2697 4792067 900010567 9000 135 -14113218-13895
9TA_64 P-1 756 900 986 753110145 8029 141 -14744889-13855
10TA_153 P21c 49212392217 9000 7574 9000 133 -13951196-13755
11TA_80 P2n 1492 3982150 9000 7536 9000 141 -13910180-13730
12TA_3630 P21c 1655 3842338 9000 5714 9000 139 -13930222-13708
43 Results
100
Figure 415 (a) Overlay of the only known form of FA (grey) and the most stable
structure on the Z´=1 crystal energy landscape (Figure 414a) 1FA_22 (green) with an
RMSD5 value of 175Aring (b) Overlay of the conformers of form I (pink and light blue) and
1FA_22 (black)
A significant energy gap was observed between the experimental and lowest energy
Z´=1 structure and the other structures generated for FA (Figure 414a) Remarkably this
gap was between two hypothetical structures that had a 12-molecule overlay and only
differed in the packing of the layers (Figure 414a) The lower-energy structure
(1FA_22) had more close contacts and a higher packing coefficient than the higher-
energy structure The second most stable hypothetical structure (2FA_2) was also
closely related to the experimental structure in it half of the molecules had changed the
phenyl torsion angle to a less stable conformation changing the stacking with the
phenyl ring in the neighbouring molecule to a herringbone215 (C-Hmiddotmiddotmiddot) interaction
(Figure 416bc) Thus there were two ways that the 2FA_2 structure could gain 2 kJ
mol-1 of stabilisation energy (Figure 416) The relationship between the two most stable
structures (1FA_22 and the experimental structure) means that it may be very difficult
to produce the Z´=1 structure as a polymorph Clearly Z´=1 and Z´=2 structures are very
close in energy and are related (via 2FA_2) It is therefore difficult to establish whether
the observed form is in fact a ldquocrystal on the wayrdquo216 that is trapped by a barrier from
rearranging into the Z´=1 form or whether the observed form is the more stable
structure217
(a) (b)
43 Results
101
Figure 416 (a) Overlay of the two most stable hypothetical crystal structures on the
crystal energy landscape global minimum 1FA_22 (grey) and 2FA_2 (green) with
ΔElatt=20 kJ mol-1 The crystal structures overlaid 12 molecules with RMSD12 of 051 Aring
and the conformations had an RMSD1 of 009 Aring (b) Overlay of 2FA_2 (green) and the
experimental crystal structure of FA (grey) with a RMSD15 of 123 Aring obtained with a
distance and angle tolerance of 50 and 50deg (c) Overlay of the two independent
molecules in the experimental structure (grey) with 2FA_2 (green)
For TA the crystal energy landscape successfully found the Z´=1 polymorphs forms
II and I to be the first and fifth most stable crystal structures within 2 kJ mol-1 of the
global minimum (Figure 414b) the landscape also provided a good reproduction of the
experimental crystal structures (Figure 417 and Table 43) Four other structures were
observed all of which were competitive in lattice energy with the known metastable
forms These crystal structures had somewhat similar packing to the known forms of TA
(Table 48) some being more similar to the form V Z=2 model structures constructed
from the disorder components of TA than to the other polymorphs (contrast Table 42 and
Table 48) Some of the similarities (Table 46) between the hypothetical structure and
the other fenamates in Table 41 were even more striking One of the computed structures
(a) (b)
(c)
43 Results
102
6TA_82 (highlighted in Table 45) matched 15 molecules of SURMOI (Table 41)
suggesting that crystals of this dimethyl-substituted molecule might template the
nucleation of a novel polymorph of TA This observation led to the joint experimental
and computational project discussed in section 438
Figure 417 The overlay of the experimental Z´=1 crystal structures (grey) of TA with
the closest structure found in the search (green) (a) Form I and 1TA_8 overlaid with an
RMSD15 value of 032Aring (b) Form II and 5TA_38 overlaid with an RMSD15 value of
026Aring
(b)
(a)
43 Results
103
437 Other Known Fenamates and their Hypothetical Structures Further marked similarities were observed between the structures on the crystal energy
landscapes of FA and TA (Figure 418) The hypothetical crystal structures on the crystal
energy landscape of FA in Figure 418 were similar to some of the known forms of TA
(forms I-IV) with some of these hypothetical crystal structures overlaying up to 13
molecules (forms I and III of TA Figure 418) Many of the low-energy structures of FA
had more in common with a polymorph of TA than with the only known form of FA that
is with a few exceptions the second numbers are greater than the first bold numbers
(Figure 418) There exist distinct crystal structures of FA with the planar molecules
(highlighted in Figure 418)
Figure 418 Classification of the crystal energy landscape of FA in terms of the similarity
of the structures to those of known TA polymorphs (I-IV) without PCM (hence the
different y-axis compared to Figure 414a) Numbers in bold indicate the number of
molecules that overlay with the known structure of FA Hence a label 5 6 on a structure
represented by a blue circle means that the structure overlaid 5 molecules with the
experimental form of FA but 6 with form I of TA Each point is coloured by the TA
polymorph with which it overlaid the greatest number n of molecules in a Crystal Packing
Similarity calculation that ignored the CH3 and Cl
The similarities between the known forms of TA and the hypothetically generated
structures of FA confirmed that because of the effect of TArsquos substituents (CH3 and Cl)
on the moleculesrsquo relative energies the energy landscape of TA was more polymorphic
than that of FA (Figure 414) The common clusters produced by the similarity overlays
between different fenamates usually had the differing substituents in the exterior region
43 Results
104
where there was no overlay of the coordinating molecule consistent with the substituents
causing the differences in the packing This in marked contrast to the large common
cluster between forms III and IV of TA (Figure 44c) where the packing of the aromatic
rings is similar
Table 46 Crystal Packing Similarity comparisons of the experimental structures of FA
and TA and their most stable hypothetical crystal structures with the crystal structures of
the other fenamates shown in Figure 13 The similarity is given in the form n(RMSDn)
with n gt 4 molecules highlighted
n(RMSDnAring)
FPAM- CA
FPAM- CA11
LAH- LOW
PEF- MET
PEF- NAQ
SUR- MEY
SUR- MOI
XYA- NAC
FA
QQQBTY02 2(071) 4(133) 7(084) 3(128) 6(062) 3(05) 3(12) 4(049)
1FA_22 2(041) 5(191) 6(131) 2(013) 11(096) 4(098) 4(108) 3(18)
2FA_2 2(043) 3(056) 7(101) 2(01) 11(051) 3(107) 7(098) 3(086)
TA
II 1(089) 2(015) 2(059) 2(011) 1(061) 2(012) 12(187) 2(029)
I 2(059) 2(048) 3(061) 1(07) 13(038) 6(178) 4(12) 2(062)
III 1(081) 7(075) 2(048) 13(033) 2(055) 13(061) 3(041) 13(045)
IV 2(087) 6(071) 3(109) 11(049) 2(046) 13(084) 3(056) 15(03)
V_a 2(057) 2(046) 5(042) 1(068) 3(039) 2(022) 2(018) 2(057)
V_b 2(075) 3(032) 7(064) 2(047) 4(110) 5(041) 4(119) 5(072)
V_c 2(095) 2(084) 5(041) 1(042) 4(110) 4(051) 2(029) 3(046)
2TA_15 2(052) 2(053) 3(091) 1(077) 14(04) 4(082) 4(122) 2(07)
3TA_876 1(093) 4(156) 7(142) 3(043) 1(066) 3(071) 4(047) 2(037)
4TA_6243 2(054) 3(115) 3(176) 1(069) 4(016) 4(149) 2(017) 3(091)
6TA_82 1(092) 2(017) 2(061) 2(012) 2(064) 2(008) 15(028) 2(028)
Some fenamate crystal structures are specific to the molecule One observed example
(Table 46) is the FPAMCA polymorph of flufenamic acid In 2012 through the use of
polymer-induced heteronucleation and solidndashsolid transformations flufenamic acid set a
new record18 for a polymorphic compound with eight solved structures which was
recently equalled by aripiprazole218 These fenamate structures are all based on the
carboxylic acid dimer with some having more similarity to the TA and FA low-energy
structures (Table 47) The specific substituents affect the range of packing of the aromatic
rings For example the low-energy unobserved structures of FA which are based on a
planar conformation of the entire molecule (Figure 414) are probably also specific to
FA because the lowest-energy crystal structure of TA with a planar molecule is 14 kJ
mol-1 above the global minimum structure The energy difference between crystal
structures of TA is caused by substituent intermolecular interactions that destabilize the
43 Results
105
structures containing planar molecules the intramolecular energy penalty Eintra for this
planar conformation is similar for FA and TA (6 kJ mol-1 Figure 412)
Table 47 An extension of Table 46 showing Crystal Packing Similarity comparisons of
the latest structures of flufenamic acid18 and the experimental structures of FA and TA
and their most stable hypothetical crystal structures
n(RMSDnAring)
FPAMCA_z
z=2 z=4 z=5 z=6 z=7 z=8
FA
QQQBTY02 5(149) 3(079) 2(073) 4(160) 2(043) 3(082)
1FA_22 4(162) 5(142) 2(105) 5(202) 2(022) 2(026)
2FA_2 4(151) 4(034) 3(119) 5(080) 2(021) 3(130)
TA
II 2(010) 2(016) 2(04) 2(017) 1(071) 2(081)
I 3(158) 2(054) 2(069) 4(210) 2(034) 2(041)
III 2(022) 2(024) 4(052) 2(025) 1(064) 2(077)
IV 2(020) 2(023) 4(168) 3(084) 2(064) 2(070)
V_a 3(124) 2(048) 2(064) 2(050) 3(068) 3(080)
V_b 5(054) 3(067) 2(045) 3(063) 1(059) 2(078)
V_c 2(085) 2(041) 2(079) 2(042) 2(077) 3(127)
2TA_15 4(304) 2(080) 2(017) 2(062) 3(042) 4(280)
3TA_876 4(134) 2(018) 4(210) 2(019) 1(076) 2(082)
4TA_6243 4(110) 2(058) 2(040) 2(060) 2(031) 2(038)
6TA_82 2(018) 2(019) 2(025) 2(020) 1(073) 2(081)
Table 48 Crystal Packing Similarity calculations of the known forms of TA and
unobserved thermodynamically competitive crystal structures The similarity between
the structures is given in the form n(RMSDn) where n is the number of molecules overlaid
and the value in brackets is the RMSDn overlay Structures with the highest similarity are
highlighted
n(RMSDnAring)
2TA_15 3TA_876 4TA_6243 6TA_82
KAXXAI 1(095) 4(033) 1(088) 9(043)
KAXXAI01 1(049) 1(096) 5(132) 1(090)
KAXXAI02 2(087) 3(108) 2(095) 3(059)
KAXXAI03 2(083) 3(081) 3(255) 3(081)
KAXXAI04_a 4(125) 1(092) 3(016) 1(086)
KAXXAI04_b 4(128) 3(092) 6(107) 2(069)
KAXXAI04_c 1(013) 2(120) 4(105) 1(059)
438 Update on a Recently Discovered Polymorph of TA Section 436 theorized that experimentalists could nucleate a novel polymorph of TA
by using the SURMOI molecule as a template However my colleague at UCL used
mefenamic acid (Figure 13) because SURMOI is very expensive A novel polymorph of
TA was nucleated by solution evaporation after dissolving TA (form I) in ethanol and
43 Results
106
seeding it with mefenamic acid (form I)219 This procedure resulted in the nucleation of
form VI of TA which was disordered (65 and 35) with same unit cells as form I of
mefenamic acid
Although the major component of this novel form VI was generated in step 1
137_TA the form was not among the structures on the final energy landscape of Figure
414b The major component of form VI and 137_TA overlaid 15 molecules with a
RMSD15 value of 030 Aring (Figure 419) This structure 137_TA had a final lattice energy
of -14497 kJ mol-1 which was competitive with form IV of TA (Table 45 -14514 kJ
mol-1) It should be noted that steps 3 and 4 of CSP (section 423) involved just over 100
crystal structures Clearly lattice energy refinements (steps 3 and 4 section 423) of
more hypothetical crystal structures are vital
Figure 419 Overlay of FA_137 (green) and the major component of experimental
crystal structure of TA form VI (grey) with a RMSD15 of 030 Aring obtained with a distance
and angle tolerance of 50 and 50deg
439 The Cost of Lattice Energy Minimisation The lattice energy minimization (CrystalOptimizer step 3) of one crystal structure
accounted for as much as 75 of the computing time and took as long as 4 days (Figure
420a) because multiple ab initio calculations were required to balance Uinter and Eintra
The computing time was approximately half as long for the optimisation of the last
structure (form VI of TA Figure 420b) This last optimisation (Figure 420b) was faster
44 Summary
107
because there were about hundred structures stored in the Local Approximation Models
(LAMs)71 database (LAMs71 database stores and reuses conformational energy and
multipole representations of the charge density) This final calculation was performed
after the discovery of a novel polymorph of TA as discussed in section 438 Even with
the help of LAMs71 database the computational cost was still very high
Figure 420 CPU timings of (a) 38_TA (form II) and (b) 137_TA (form VI section
438) after lattice energy minimisation using CrystalOptimizer (step 3)
44 Summary This chapter described the successful use of the CSP method (see Chapter 3) to examine
the computer-generated low-energy crystal structures of the unsubstituted structural
fragment FA and a derivative TA This chapter showed that all structures were based
on the same 11987722(8) H-bonded dimer and that the structures differed only in the packing
of the phenyl rings The crystal energy landscape of TA had several crystal structures
including the observed polymorphs which were tightly clustered around the global
minimum whereas the corresponding cluster for FA contained only the observed and a
closely related structure This observation is supported by past experiments
Many of the crystal structures on the energy landscape for FA overlaid a significant
portion of the coordination environment with other observed or calculated structures
Therefore the phenyl ring substituents determined the relative energies of the crystal
structures and hence whether a specific fenamate would be very polymorphic or not The
FA fragment can be described as a polymorphophore despite only two structures
clustered around the global minimum since the molecular fragment packed in a wide
range of distinct crystal structures with different conformations that were energetically
favourable This finding indicates that being a polymorphophore correlates with but does
(a)
(b)
44 Summary
108
not guarantee polymorphism It is perhaps not surprising that this term has not been more
widely accepted
The similarities between the structures on the final energy landscapes of TA and other
fenamates led my colleague to conduct a templating experiment on TA (section 438)
The subsequent discovery of a new polymorph of TA (form VI section 438) exemplified
one problem with the CSP discussed earlier Restricting the number of crystal structures
that were accurately optimised (step 3 CrystalOptimizer) to just over 100 structures
meant excluding the recently discovered crystal structure of TA (section 438) from the
final crystal energy landscape (Figure 414b) As a result current intermediate steps like
the single-point calculations used in this chapter (step 2) although successful (section
435) had their limitations
The findings of Chapters 3 and 4 indicate the need for a cheaper and more accurate
approach to modelling lattice energy If the evaluation of Eintra (the bulk of computer
time section 439) can be realized through a less expensive method (Chapter 6) then
molecular dynamics calculations and the temperature effects (eg free energies) can be
better accounted for However we must first understand the origin of intramolecular
forces and energies (Chapter 5)
51 Introduction
109
Chapter 5 The Origin of conformational energy barriers in Fenamates
ldquohelliplsquoBegin at the beginningrsquo the King said gravely lsquoand go on till you come to the
end then stoprsquohelliprdquo
mdash Lewis Carroll Alice in Wonderland
51 Introduction
511 Background Chapters 3 and 4 established that lattice energy Elatt could be partitioned into
intermolecular Uinter and intramolecular components Eintra
where Uinter is the sum of the dominant electrostatics Uelec plus the contributions of
repulsion-dispersion Urepul-disp and Eintra is the energy required to distort the molecule
from its gas phase conformation71 The conformation determines the overall molecular
shape so different conformers may lead the crystal to arrange itself in different ways
ultimately influencing the properties of the crystal220 (Chapter 1)
1
6
2
1
9
1
1
813
7
16
Figure 51 The fenamate family showing the low barrier torsion angle (=C7-N1-C8-C9)
=0 when the aromatic rings are coplanar as drawn The fenamates family mentioned in
this chapter includes fenamic acid (FA) R1= R2= H tolfenamic acid (TA) R1= CH3 R2=
Cl mefenamic acid (MA) R1= R2= CH3 clofenamic acid (ClFA) R1=H R2=Cl and
flufenamic aid (FFA) R1=H R2=CF3 The dotted line represents an intramolecular
hydrogen bond
This chapter will investigate the conformational flexibility of fenamate molecules in
isolation Through this investigation we will come to a better understanding of the origin
of torsional barriers which will enable the derivation of an analytical model for the
intramolecular energies of the fenamate molecules FA and TA (Chapter 6) To put this
problem in context there is still an ongoing debate about the origin of the torsional barrier
of the ethane molecule which has only 8 atoms as compared to the 27 and 30 atoms of
FA and TA respectively
Elatt = Uinter + Eintra 51
51 Introduction
110
512 Torsional Barrier for Ethane The torsional barrier is defined as the difference in energy between the least stable and
the most stable conformations in rotation around a bond In order for one full rotation
around a bond to occur this energy barrier must be overcome (Figure 52) The energy
barrier for fenamic acid FA is smaller (Chapter 4) than ethane (Figure 53)
Figure 52 Illustration of the barrier to rotation with the relaxed conformational energy
profile of FA
Previous studies of torsional barriers have focussed on small molecules such as ethane
The torsional barrier for the ethane molecule is one of the most fundamental puzzles in
conformational analysis and researchers have great interest in understanding its origin221
The experimental (1203 to 1225 kJ mol-1) and quantum mechanical (1124 to 1303 kJ
mol-1) calculations of ethanersquos torsional barrier are in good agreement (Table 51)
However researchers disagree upon the origin of the torsional barrier in ethane The
root of the controversy is whether the origin of the torsional barrier in ethane results from
stronger hyperconjugation stabilization222 in the staggered conformation (Figure 53) than
the eclipsed form or whether the barrier originates from greater steric repulsion221 in the
eclipsed conformation (Figure 53) due to electrostatic interaction and Pauli exchange
repulsion Three physical factors may play a role in ethanersquos structural preference
hyperconjugation electrostatic interactions and exchange interactions
51 Introduction
111
Figure 53 The staggered and eclipsed conformations of the ethane molecule (Sources
Ref [222] and enwikipediaorgwikiAlkane_stereochemistry [Accessed 11012015])
Table 51 Torsional barrier height of ethane (Source Reproduced from Ref [223])
Hyperconjugation and exchange repulsion are quantum mechanical effects arising from
orbital overlap The hyperconjugation effect for the ethane molecule is constituted of the
vicinal interactions between the occupied CH bond orbitals of one of the methyl group
and the virtual antibonding CH orbitals of the other methyl group221 The staggered
51 Introduction
112
conformation (Figure 54a) is stabilised through the delocalization of electron charge
density involving these orbitals an attractive contribution
Pophristic and Goodman222 used natural bond orbitals (NBOs) to argue that
hyperconjugation or stabilization of the staggered ethane conformation is the origin of
the barrier to rotation in ethane By showing that if the CH-CH hyperconjugative
interactions were removed and by adding electrons to the unoccupied CH virtual
orbital the steric repulsion favoured the less stable eclipsed conformation (Figure 53)
This model of hyperconjugation interactions relies on NBOs and is not so obvious if
molecular orbitals (MOs) are used let alone if correlated wave functions are used
(a) (b)
Figure 54 (a) Hyperconjugation effects on the staggered (b) Pauli exchange repulsion
in the eclipsed conformation (Source enwikipediaorgwikiHyperconjugation
[Accessed 11012015])
Pauli exchange repulsion which requires that pairs of electrons do not occupy the same
spatial region occurs in the eclipsed conformation (Figure 54b) Electrostatic (Figure
55 also see section 223) repulsion involves the classical R-1 repulsion between charges
At short distances the 1-4 (third nearest neighbour) interactions still have an electrostatic
effect but there are also considerable penetration-effects (section 225) The Pauli
exchange and electrostatic repulsion frequently regarded as the steric factor destabilise
the eclipsed conformation of ethane These interactions are the same as intermolecular
interactions but at shorter distances
51 Introduction
113
Figure 55 Electrostatic steric repulsion (between electrons on the bond black arrow) for
the eclipsed conformation of ethane The red arrow indicates exclusion of van der Waals
repulsion since the van der Waals radii of the hydrogen are too small to make contact
(Source enwikipediaorgwikiConformational_isomerism [Accessed 11012015])
Mo and Gao221 made three arguments in favour of steric repulsion being the origin of
the barrier to rotation One argument was that hyperconjugation is a second-order effect
and hence should have little or no direct role in restricting free rotation224 Second these
researchers argued that overestimation of the hyperconjugative effects led others to
misidentify hyperconjugation as the origin of the rotation barrier Third Mo and Gao
argued that the experimental work on heats of hydrogenation for propene supported a
specific energy decomposition scheme225 In short the researchers argued that their three
points supported the claim that steric repulsion is the origin of the torsional barrier
The origin of the torsional barrier remains controversial226 even for a small molecule
such as ethane The question remains Is the torsion defined by the origin
hyperconjugation221222 or by a similar electronic effect from changes in MOs on the
atoms Or is the barrier equivalent to intermolecular non-bonded repulsion and
electrostatic effects227 at short distances ie as though there were no single covalent
bond The quantitative distinction can be highly dependent upon the precise definitions
and upon the type of charge density calculation that is used
513 Overview The conformational energy barrier of FA (622 kJ mol-1) is smaller than that of the
ethane molecule (123 kJ mol-1) The goal of this chapter is to investigate the qualitative
origin of the conformational barrier to rotation for fenamate molecules in isolation First
I will investigate the effects that different definitions of the same flexible bond have on
the calculated conformational profile of TA The step size of torsion angles various ab
initio methods and relaxation effects will be investigated for various fenamates (Figure
51) Following this I will investigate the electronic contributions using constrained
model molecules that avoid pyramidization (Figure 57) with minimal or no steric effects
Finally an exp-6 atom-atom model which contains both a repulsive and a dispersive part
will be used to investigate the steric effect of FA and TA
52 Method
114
This chapter will show that the barrier to rotation for FA and TA (Figure 51) depends
significantly upon small correlated changes in the entire molecule rather than on the
atomic position of the atoms that define the rotating torsion It will also show that there
is an intrinsic dispersion and electronic energy barrier when the aromatic rings are
perpendicular to one another the barrier to rotation for small model molecules can be
represented by a simple cos2 term
52 Method In section 431 it was established that the PBE06-31+G(d) level of theory is the best
compromise between the cheap but inaccurate HF method and the expensive but accurate
MP2 method for calculating the packing (intermolecular) and conformational
(intermolecular) energies (equation 51) of FA and TA This chapter examines the ab
initio conformational profiles of fenamate molecules in more detail All the ab initio
calculations reported in this chapter were performed using GAUSSIAN0353
521 Determining Conformation Energy Scan for Isolated Molecule
For TA there are 4 definitions of the N1-C8 rotatable bond (Figure 51) (1) = C7-N1-
C8-C9 (2) 2= C7-N1-C8-C13 (3) 3= H6-N1-C8-C9 and (4) 4= H6-N1-C8-C13 The effects
of these different definitions upon the conformational profile of TA were investigated
using the PBE06-31+G(d) level of theory Preliminary relaxed conformation energy
scans were also performed on FA using 2 and 1 step sizes around the maxima and
minima (section 431) respectively at the same level of theory in order to investigate the
origin of the slight asymmetry in FA
522 Ab initio Conformational Energy Profiles for Fenamates To test the sensitivity to method of the different fenamate moleculesrsquo conformational
profiles (Figure 51) I carried out a relaxed scan at the HF6-31+G(d) level of theory as
well as single-point energy calculations at the MP26-31+G(d) level of theory on the
optimized PBE06-31+G(d) conformations The PBE06-31+G(d) energies were then
revaluated within a polarizable continuum model (PCM)180 with dielectric continuum
value of 3 a typical dielectric environment of organic crystals PCM has been shown to
help the relative energy ranking of some conformational polymorphs (Chapter 4)131
The primary aim of this research was not to seek a definitive ab initio conformational
profile for all molecules as this would have been beyond the capability of the available
computational resources Indeed many studies have emphasized the difficulty in
evaluating the relative energies of fenamate polymorphs184211228 Instead the objective
52 Method
115
of this chapter is to present qualitatively correct scans that can be compared among the
fenamate molecules
523 Investigation of Electronic Effects In an attempt to distinguish the steric effects from the electronic effects I studied a
series of model molecules where the steric effects had been minimized (Figure 56)
12
9
1 813
6
Figure 56 Chemical diagram of model molecules used to investigate the electronic
contributions The bonds around N1 are constrained to be planar (ie R2-N1-H6-C8=180deg)
for phenylamine (PA) R1=R2=H N-methylaniline R1=H R2= CH3 N-vinylaniline R1=H
R2 = CH=CH2 and 3-anilinoprop-2-enoic acid R1=H R2 = CH=CHCO2H for 3-
chloroaniline R1= Cl R2=H and 3-methylaniline R1=CH3 R2=H (=R2-N1-C8-C9)
The benzoic acid group was replaced by a series of smaller molecular fragments (Figure
56) for example a hydrogen atom The three bonds to the nitrogen atoms were
constrained to be planar by fixing the torsion involving these atoms (eg H7-N1-H6-
C8=180deg for PA) This constraint prevents the normal pyramidalization at the nitrogen in
the torsional potential of phenylamine227 (Figure 57) or the major rearrangement of the
second hydrogen that occurs in a relaxed scan of H7-N1-C8-C9
Figure 57 Pyramidalization in unconstrained phenylamine (PA) molecule caused by
lone pair on nitrogen atom
The difference in electronic structure with torsion angle was estimated by using the
lowest occupied molecular orbital (ie the highest occupied molecular orbital (HOMO)-
n where n is an integer) and HOMO electron density for the PA model FA and TA For
52 Method
116
selected constrained (fixed ) conformations in the PBE06-31+G(d) scan a single-point
calculation with GAUSSIAN03 was used to generate a density file which was then used
to produce the molecular orbitals (MOs) isovalue surfaces of 002 au The graphical
interface used was GaussView 5229
524 Investigation of the Steric (Non-Bonded) Effects Within organic molecules that are typically used in pharmaceuticals many of the atom-
atom distances are similar to intermolecular distances although some are considerably
shorter The intramolecular steric interactions can be represented as the exp-6 atom-atom
intermolecular parameters which were derived by fitting to crystal structures and heats
of sublimation of hydrocarbons oxahydrocarbons azahydrocarbons chlorohydrocarbons
and nitro compounds42 This provides the parameters for all intramolecular interactions
involving C N O Cl and H but the same parameters are used for all C and H atoms
whether aromatic or in the methyl or carboxylic acid groups which is an approximation
to the most force field eg Sybyl typing230 This approximation is better justified for FA
than for TA (Figure 51) because of the importance of distinguishing C in different
chemical environments That is the chemical environment of aromatic C is different from
that of methyl C There is a polar hydrogen type HB which was used for both polar
hydrogens (H1 and H6 in Figure 51) because the intramolecular energy is expected to be
insensitive to the interactions of the carboxylic acid group
Table 52 Gavezzottirsquos exp-6 atom-atom parameters E=Aexp(-BR)-CR-6 is the well
depth and Rm is the distance at the minimum41231232 Italics represent the hydrogen-
bonded interactions aFrom the UNI intermolecular potential function of Mercury233
Interactions AkJ mol-1 BAring-1 CkJ mol-1Aring-6 kJ mol-1 RmAring
H∙∙∙H 241584 401 1092 004 336
H∙∙∙C 1207921 410 4728 021 329
H∙∙∙N 2282790 452 5021 039 299
H∙∙∙O 2954322 482 4393 051 280
H∙∙∙Cl 2929637 409 11673 050 330
C∙∙∙C 2261452 347 24184 039 389
C∙∙∙N 4914945 386 27907 084 350
C∙∙∙O 3930868 374 26819 067 361
C∙∙∙Cl 3906601 352 38618 067 383
N∙∙∙O 2685710 386 15230 046 350
O∙∙∙O 1953091 374 13347 033 361
O∙∙∙Cl 3382973 363 27824 058 372
HB∙∙∙O (acids) 264163953 875 8577 2929 160
HB∙∙∙N (-NH∙∙∙OH) 238673400a 778a 15774a 2661 180
53 Results
117
The Gavezzotti parameters used for FA and TA are given in Table 52 Although exp-
6 does not model the electrostatic contributions explicitly some of the parameters have
absorbed some electrostatic contributions during the fitting process The energies were
partitioned into repulsion (Aexp(-BR)) and dispersion (-CR6) contributions
The extension of the exp-6 parameterization to hydrogen bonding interactions required
potentials with a particularly deep well at the short hydrogen bonding distances to absorb
the electrostatic interactions in hydrogen bonding231 The polar hydrogens were assumed
not to have significant intermolecular interactions with any atoms other than the hydrogen
bond acceptor interactions which is a reasonable assumption for intermolecular
interactions The parameters for the H∙∙∙HB and C∙∙∙HB that were not determined by
Gavezzotti may be important
Interactions that are three atoms or more apart from each other (ie 1-4 and above) were
then investigated The longest bond path for FA and TA is 1-11 The atom∙∙∙atom
interactions that dominated the intramolecular contributions were analysed with the exp-
6 potential For each fenamate molecule interactions were classed as dominant if the
difference between the minimum and maximum total energy (Erepul-dis) of the conformers
was greater than or equal to 1 kJ mol-1 It is expected that some interactions in FA and
TA will vary with conformations however a few interactions will have constant
contribution (eg HB∙∙∙O (acid) an important intramolecular H-bond) The interactions
with constant contributions are not classed as dominant interactions
53 Results
531 Effect of Different Definitions of the Same Flexible Bond The N1-C8 rotatable bond can be defined in four ways C7-N1-C8-C9 C7-N1-C8-C13 H6-
N1-C8-C9 and H6-N1-C8-C13 (Figure 51) The conformational energy profile of TA
(Figure 58) is sensitive to the atoms used in defining the N1-C8 rotatable bond For
example the intramolecular energy penalty at ξ= 0deg for the C7 torsions (=C7-N1-C8-C9
and 2=C7-N1-C8-C13) are approximately half that of the H6 torsions (3=H6-N1-C8-C9 and
4=H6-N1-C8-C13) (Figure 58) The relaxation of the hydrogen atom (H6) was clearly
playing a vital role in stabilizing the molecular conformation at ξ= 0deg There were some
differences in intramolecular energy penalties as approached 180deg for the C7 torsions (
and 2 in Figure 58)
53 Results
118
Figure 58 Relaxed scan of TA at the PBE06-31+G(d) level of theory with the different
definitions of flexible N1-C8 bond (= C7-N1-C8-C9 2= C7-N1-C8-C13
3=H6-N1-C8-C9
and 4= H6-N1-C8-C13) used as the constrained geometric parameter
The torsional barriers for TA are sensitive to the atoms used in defining the N1-C8
rotatable bond (Table 53) The C7 torsional barriers (Group 2 of Table 53) are larger
than the H6 torsional barriers (Group 2 of Table 53) For the C7 torsions the H6 proton
relaxes to maintain the intramolecular H-bond while for the H6 torsions the benzoic acid
(including the C7 atom) deviates minimally to prevent deformation of aromatic ring and
form better pyramidalization (Figure 57) at N1 for TA These results show that the
torsional barrier and conformational energy profile of TA (Figure 58 and Table 53)
depend upon the selected 4 atoms that define the flexible torsion
Table 54 shows no correlation between shorter (stronger) intramolecular H-bond
distances and smaller energy penalties However a closer inspection of the atom-atom
distances between the H atom of the secondary amine and the H atom of the methyl group
(Group 1 of Table 55) suggest that steric hindrance also contributes to the intramolecular
energy because conformations with higher energy penalties correlate with shorter atom-
atom distances
53 Results
119
Table 53 Torsional barrier height of the relaxed conformational energy profiles in Figure
58 for TA
Torsion Barrier Barrier relative to
kJ mol-1
Group 1 3585 0 2 3572 -013
Group 2 3 2453 -1132
4 3148 -437
Table 54 Comparison of intramolecular energies and hydrogen bond distances of TA for
the near-planar conformer
Torsion N-H∙∙∙O=CAring ∆EintrakJ mol-1
Group 1
= 0deg 1850 706
2= 180deg 1847 648
Δ -0003 -058
Group 2 3= 180deg 1880 1574
4= 0deg 1881 1257
Δ 0001 -317
3(180)-(0) 0030 868
Table 55 Comparison of the intramolecular energies and the N-H7∙∙∙HX-C14 bond
distances of TA for the near-planar conformer where HX-C14 is the methyl group
Group 1 N-H7∙∙∙H10-C14 N-H7∙∙∙H11-C14 N-H7∙∙∙H12-C14
(Aring)
∆Eintra
kJ mol-1
= 0deg 3491 2284 2194 706 2= 180deg 3486 2272 2199 648
Δ -0005 -0012 0005 -058
Group 2
3= 180deg 3358 2135 2090 1574
4= 0deg 3386 2157 2117 1257
∆ 0028 0022 0027 -317
3(180)-(0) -0133 -0149 -0104 868
532 Effect of Step Size on the Conformation Profile of Fenamate Molecule Given that conformational profiles depend on small correlated changes in atomic
positions I investigated the effect of step size on the conformational profiles For FA the
conformation profile is unaffected by the small step size of 1 and 2 for the minima and
maximum respectively (compare Figure 510 with Figure 511) Over all possible
conformations of FA the barrier to rotation is approximately 6 kJ mol-1 (see Figure 510
and Figure 511)
Although the phenyl ring of FA is symmetric the rotation of this ring produces
asymmetry conformational profiles around the maximum and minima points (Figure
510) The slight asymmetry observed for the conformational profile of FA (Chapter 4) is
53 Results
120
therefore not due to the small step size These changes can be substantial for example
the two minima for FA scan at =3894deg and 14471deg (Figure 510) correspond to
conformations that differ by 061 Aring in the 1-4 distance between the amide proton and C13
(or C9) even though the minima only differ in energy by 188 x 10-3 kJ mol-1 (716 x 10-
7 au) Even the C8-C9 and C8-C13 aromatic bond lengths differ by 00037 Aring for =0 or
180deg but only by 00004 Aring for =80deg or 100deg with larger changes in the bonded
hydrogen positions for FA It is therefore clear that the molecular structure of the phenyl
ring is not perfectly symmetric (Figure 59) and that it changes with torsion
Figure 59 Molecular conformation of the relaxed gas phase at PBE06-31+G(d) showing
the bond lengths of the phenyl C-C bond (=180) of FA
For the definitive scans full optimization was performed near each symmetry-
independent potential minimum with a step size of Δ=5deg The highly repulsive points
for the substituted fenamates (TA and MA) were omitted due to the huge energy penalty
as approached 180deg (section 431 and Figure 58)
53 Results
121
Figure 510 Relaxed scans of FA at PBE06-31+G(d) with step sizes 2 and 1deg around the
maxima and minima respectively The red circles indicate the starting points of the scans
while the arrows indicate the directions of the scans
53 Results
122
533 Conformational Energy Profile of the Fenamates The conformational profile for four fenamate molecules (Figure 511) shows that there
are two distinct minima which are only close in energy for the symmetric FA and R2-
substituted ClFA (Figure 51) The ClFA molecule has one global minimum at 14838deg
in addition to the local minimum at 3586deg while FA has two global minima at 3894deg
and 14471deg (Figure 511) There is one potential maximum that varies slightly between
the molecules for the planar conformation (as drawn in Figure 51) there is a second
maximum when the aromatic rings are approximately perpendicular and there is a third
where there is a significant steric clash for the R1-substituted fenamates TA and MA as
the other planar conformation is approached An analysis of the observed values of this
torsion angle in experimental crystal structures containing the fenamate fragment shows
that the observed angles were clustered around the two minima (Chapter 4 Figure 412)
a finding that is consistent with the expectation that most molecules adopt low-energy
conformations in crystal structures208 Hence the two low-energy barriers although only
~5-9 kJ mol-1 clearly have a major effect on the crystal packing Indeed this
conformational energy is very significant it is large compared with most measured
polymorphic energy differences including those of TA which cover less than 2 kJ mol-1
(Chapter 4)
Figure 511 Relaxed conformational scans at the PBE06-31+G(d) level of theory for the
fenamates The minima were at ξ=3894deg and 14471deg for FA 4063deg and 11186deg for
TA 4408deg and 11048deg for MA and 3586deg and 14838deg for ClFA
53 Results
123
(a) (b)
(c) (d)
Figure 512 Relaxed conformational scans of fenamates (a) FA (b) TA (c) MA and (d)
ClFA at HF and PBE0 method with 6-31+G(d) basis set These are contrasted with the
single-point energies at the MP26-31+G(d) level and within a polarizable continuum
model (PCM) with =3 for the PBE06-31+G(d) conformations
By testing the sensitivity of this conformational profile to the choice of ab initio method
(Figure 512) it becomes clear that even obtaining a conformational profile that is in
qualitative agreement with the profile derived from experimental crystal structures is
sensitive to method The SCF scan has only one minimum as seen in Figure 512 at a
conformation that was not observed in the crystal structures of fenamates (section 433
Figure 412) If the CSP study of Chapter 4 were based on a SCF conformational profile
the crystal structures generated for FA and TA would have been qualitatively incorrect
Therefore it is essential that the ab initio methods include some description of the
electron correlation that produces a maximum at around 90deg Although there is moderate
agreement on the barriers to conformational change for TA and MA it is notable that
single-point MP2 calculations swap the relative energy positions of the two minima
(Figure 512) The PBE0 calculations are in better agreement with the analysis of the
53 Results
124
crystalline conformations of fenamate-like fragments with a substituent at C13 (Chapter
4)
The scans carried out within PCM with =3 showed a reduction in energy penalty
around the energy maxima (ξ~90deg) for all three fenamates (Figure 512) This reduction
is more pronounced for TA and MA around the local minima (ξ~110deg) than it is for FA
This finding suggests that the effect of solution or the crystalline environment the method
used for generating the final energy landscapes of FA and TA in Figure 414 of section
436 does not qualitatively change the conformational profile Hence the clustering of
observed torsion angles in fenamate crystal structures around the minima is not an artefact
of the neglect of the environment (Figure 412 in section 433) The results shown in
Figure 512 confirm that the definitive ab initio conformational profiles cannot be
obtained Nonetheless the scans in Figure 511 are adequate for the purposes of this study
534 Rigid Versus Relaxed Scans of Fenamates To establish the importance of changes in the other torsion angles bond angles and
bond lengths during the relaxed scans in Figure 511 the conformation scans were
repeated for the three fenamates starting with the fully optimized structure at the PBE06-
31+G(d) level of theory Only torsion angle was allowed to vary which meant that each
point had an identical conformation for all three ab initio methods (HF MP2 and PBE0)
The difference between rigid (solid lines in Figure 513) and relaxed (dotted line in Figure
513) scans was very marked for all the fenamates even in the lowest energy regions
where the changes in the benzoic acid ring and the intramolecular hydrogen bond were
small
53 Results
125
Figure 513 Comparison of relaxed (solid) and rigid (dotted line) scan of FA (top) TA
(middle) and MA (right) For the rigid scans calculations were performed using HF MP2
and PBE0 methods with 6-31+G(d) basis set as a function of torsion angle The relaxed
scans from Figure 511 were performed at the PBE06-31+G(d) level of theory
53 Results
126
0deg 80deg 110deg
Figure 514 Overlay of relaxed (coloured by element Figure 511) and rigid (red Figure
513) conformations of FA (top) TA (middle) and MA (bottom) overlaying the atoms
defining the ξ torsion angle at the PBE06-31+G(d) level of theory
Figure 514 shows a comparison of the rigid and relaxed conformations at the repulsive
barrier and the second minimum for FA TA and MA For TA the differences in the
relaxed and rigid scan conformations are very marked around the energy maxima (Figure
514 ξ=80deg) even though these maxima are less than 7 kJ mol-1 in the relaxed scans
(Figure 513) For FA there is a significant change in the relative orientation of the
benzoic acid group changing the internal hydrogen bond around all maxima The methyl
torsion is clearly playing a role in reducing the energy penalty around the 90deg maximum
for TA and MA (Figure 514) Indeed even for FA the changes in the other
conformational variables are vital to produce a low energy maximum at 90deg to the extent
that it is not surprising that even the relaxed scans differed in this region producing the
slight asymmetry between the two minima (Figure 511)
The contrast between the relaxed and rigid (Figure 513) scans and the corresponding
conformations (Figure 514) confirm that the changes in the other conformational
variables played a major role in lowering the conformational barriers providing low
values over a wide range of angles as implied by the crystallographic data (Chapter 4)
53 Results
127
535 Splitting electronic from steric contributions to the barrier to rotation
(a) (b)
(c) (d)
(e) (f)
Figure 515 The solid black lines show the relaxed torsional scans of planar-N-
constrained models for the phenyl rotation (Figure 56) where the benzoic acid group of
FA has been replaced by (a) hydrogen atom (PA) (b) methyl (c) vinyl and (d) prop-2-
enoic acid and the hydrogen in the meta position of PA has been replaced by (e) chlorine
and (f) methyl using HF PBE0 and MP2 methods with the 6-31+G(d) basis set Plots of
(h2)(1-cos(2)) where h is the height of the barrier of relaxed PBE06-31+G(d) scans
are shown in green For (c)-(f) the PBE06-31+G(d) relaxed scans of PA from (a) are
shown in grey for comparison In (a) and (b) a rigid scan at the PBE06-31+G(d) level of
theory is shown by a dotted line
53 Results
128
To establish the importance of the intramolecular steric clashes the rigid and relaxed
scans were repeated with model molecules that replaced the benzoic acid group of FA
with smaller fragments and the bonds around the nitrogen constrained to be planar (Figure
56) in order to avoid the pyramidalization of the amine (Figure 57) The potential energy
scan has a very large maximum at 90deg for planar-N-constrained phenylamine (PA)
approximately 6 times higher than the barrier in the fenamates (reflected in the scale
change between Figure 515a and Figure 511) Replacing one constrained hydrogen with
a methyl (Figure 56) produces a slightly larger barrier but very little asymmetry strongly
suggesting that this is an electronic effect of conjugation between the lone pair on the
nitrogen and the aromatic ring
Adding a double bond to PA reduces the barrier to rotation by 1110 kJ mol-1 (Figure
515c) Adding a carboxylic acid that forms an intramolecular H-bond to the N-H group
further reduces this barrier by almost 7 kJ mol-1 (Figure 515d) These observations imply
that the conjugation of the benzoic acid ring of the fenamates contributed significantly to
reducing the electronic barrier The intramolecular hydrogen bond in this model molecule
(Figure 515d) varies in length from 194 to 192 Aring as changes from 0 to 180deg by
comparison the FA hydrogen bond varies from 187 to 184 Aring Thus it is evident that the
intramolecular H-bonding in the fenamates reduces the electronic barrier In contrast
substituting Cl and CH3 at the meta position of PA (Figure 515e and f) shows little change
to the barrier height with half-height (h2) values of 3-chloroaniline (185 kJ mol-1) and
3-methylaniline (178 kJ mol-1) representing only a small increase over that of PA (176
kJ mol-1)
The scans in Figures 515a b e and f have no maxima at 0 or 180deg confirming that
the steric clash between the aromatic C6-H and C13-R1 (Figure 51) of the phenyl ring is
responsible for this maximum These curves are very well reproduced by ((h2)(1-
cos(2ξ)) where h is the potential maximum As the nitrogen substituents (Figures 515c
and d) get larger there are signs of additional steric effects particularly at the MP2 level
suggesting more changes in intramolecular dispersion The difference between a rigid
scan and a relaxed one is small (Figures 515a and b) and the differences in the curves
according to the type of calculation are relatively minor compared with the qualitative
differences between the HF and correlated methods for the fenamates (Figure 512) From
contrasting the conformational scans of model molecules with minimal steric effects
(Figure 515) with those of the fenamates (Figure 511) the overriding conclusion is that
there is an electronic contribution to the torsional barrier at =90 which can be
53 Results
129
represented by a (h2)(1-cos(2ξ)) term where h is the maximum energy from the
electronic contribution
There is a dramatic change in the HOMO isosurfaces of the phenyl ring with torsion
angle (Figure 516) which is remarkably similar between PA and the fenamates FA and
TA This finding suggests that the electronic contribution observed for PA is fundamental
to the fenamates The destructive interference of the MOs at =90 (Figure 516 and
Figure 517b) is the origin of the huge torsional barrier that is seen in each of the model
molecules in Figure 515 The smaller torsional barriers after adding a double bond
(Figure 515c) and acidic (Figure 515d) substituents to PA (Figure 515a) was a result of
increased electron delocalisation (compare Figure 517a with Figure 517b)
0deg 40deg 90deg
Figure 516 The electron density surface of HOMO frontier orbitals for different
conformations of PA (top) FA (middle) and TA (bottom) obtained from the PBE06-
31+G(d) level of theory Contour map isovalues were drawn at a 002 au level
(a) (b)
Figure 517 Alternative HOMO isosurface view of (a) FA and (b) PA molecule at =90
from Figure 516
My attempt at modelling delocalisation over the entire FA molecule even for the lowest
occupied orbital failed (Figure 518) which suggests that a completely flat model of
53 Results
130
FA ( = 0) is unrealistic This is because of the huge steric barrier (Figure 513) of a planar
conformation and the linear combinations of atomic orbitals in many molecular orbitals
are sensitive to conformation The electronic effects are not well defined for TA ie no
Figure 518 equivalent for TA due to the bulky substituent hence excluded in the analysis
= 0 = 40 = 90
Figure 518 HOMO-10 (46 MOs) isosurface view of side (top) and front (bottom) FA
molecule at =0 40 and 90
The MOsrsquo picture can only give a qualitative guide to the electronic contribution
because it is not possible to have an aromatic substitution at R2 or a methyl group
substitution on C13 (as in MA and TA) without steric interactions At present
independently investigating how the electronic barrier varies among the fenamates is not
possible However it is clear from Figure 515 that whilst the benzoic acid substituents
will have a dramatic effect on lowering the barrier the meta-substitution of chlorine and
methyl on the phenyl ring has a much smaller effect on the barrier
536 Estimating the Steric Contributions with an Atom-Atom Potential The steric effects of FA and TA can be analysed by using Gavezzottirsquos parameters
(Table 52) to produce a conformational profile (see Figure 519) which can then be
subdivided into the repulsion (Aexp(minusBRik)) and dispersion (minusCRik6) contributions
This subdivision (Figure 519) suggests that the repulsion terms dominate producing
maxima at 0 and 180deg and minimum at 90deg a finding that is consistent with the
supposition that these maxima occur because of steric clashes However the repulsions
are severely overestimated The dispersion contribution gives a maximum at ~90deg
which is of the same order of magnitude as the ab initio maxima particularly for FA This
confirms the observation from Figure 512 that electron correlation the origin of
dispersion interactions makes a significant contribution to this maximum supplementing
53 Results
131
the electronic effect (cf Figure 515) The difference between TA and FA in Figure 519
is consistent with the large dispersion interaction of the Cl substituent as well as the
repulsion from the methyl substituent
Figure 519 Comparison of the ab initio (black) intramolecular energy scans at the
PBE06-31+G(d) level of theory for FA (top) and TA (bottom) with Gavezzottirsquos exp-6
intramolecular energy models summed over all intramolecular atom-atom distances from
the third nearest neighbour (1-4) and above The net effect (purple) is subdivided into the
repulsive (red) and dispersion (blue) contributions
537 Investigating the Important Interactions with Atom-Atom Potential For FA and TA the dominant interactions involve C H and HB (Table 56) while the
dominant interactions involving N and Cl (Table 57) were exclusive to TA Although FA
and TA have the N atom only TA has the methyl substituent (N1∙∙∙C14 f and N1∙∙∙H12
f
Table 57) Of all the dominant interacting atoms for FA and TA only Cl of TA interacts
with atoms (methyl substituent) belonging to the same aromatic ring (dfC14∙∙∙Cl1
dfCl1∙∙∙H10 and dfCl1∙∙∙H11 Table 57) These results confirm the observation that the
53 Results
132
methyl substituent plays a role in reducing the energy penalty for TA (section 534
Figure 514)
Table 56 Atom-atom interactions of FA that dominate the intramolecular energies as
estimated using Gavezzottirsquos exp-6 potential The interaction is listed as dominant if the
difference between the minimum and maximum total energy (Erepul-dis) is greater than or
equal to 1 kJ mol-1
ati∙∙∙atk neigh RikkJ mol-1 ErepulkJ mol-1 EdispkJ mol-1 Erepul-dispkJ mol-1
min max(∆) min max(∆) Min max(∆) min max(∆)
C7∙∙∙C9 4 307 371(064) 057 533(476) -289 -092(196) -035 245(280)
C7∙∙∙C13 4 307 371(064) 057 532(475) -288 -092(196) -035 244(279)
C6∙∙∙C9 5 310 443(133) 005 475(470) -270 -032(239) -039 205(243)
C6∙∙∙C13 5 311 444(133) 005 468(463) -268 -032(236) -039 200(238)
C6∙∙∙H7 6 252 488(236) 000 398(398) -186 -003(182) -021 212(233)
C8∙∙∙H5 5 254 288(034) 089 357(268) -175 -083(092) 007 182(176)
C9∙∙∙H5 6 257 416(159) 000 317(316) -163 -009(154) -020 154(174)
H5∙∙∙H7 7 208 476(268) 000 578(578) -135 -001(134) -004 443(447)
C13∙∙∙HB6 4 251 330(078) 016 403(387) -187 -037(151) -021 216(236)
HB6∙∙∙H11 5 230 368(138) 001 240(239) -074 -004(070) -004 166(170)
C6∙∙∙H8 4 289 310(020) 485 985(500) -412 -274 (138) 212 573(362)
C6∙∙∙H11 6 252 488(237) 000 396(396) -185 -003(182) -020 211(231)
C13∙∙∙H5 6 257 417(159) 000 314(314) -162 -009(153) -020 152(172)
H5∙∙∙H11 7 209 476(267) 000 548(548) -130 -001(129) -004 418(422)
C9∙∙∙HB6 4 251 330(079) 016 406(390) -188 -036(152) -021 218(238)
HB6∙∙∙H7 5 230 369(139) 001 238(237) -074 -004(069) -004 164(169)
Table 57 Atom-atom interactions of TA that dominate the intramolecular energies as
estimated from Gavezzottirsquos exp-6 potential The interaction is listed as dominant if the
difference between the minimum and maximum total energy (Erepul-dis) is greater than or
equal to 1 kJ mol-1 dInteractions between atoms on the same aromatic ring fInteractions
involving the methyl substituent
ati∙∙∙atk neigh RikkJ mol-1 ErepulkJ mol-1 EdispkJ mol-1 Erepul-dispkJ mol-1
min max(∆) min max(∆) min max(∆) min max(∆)
C7∙∙∙C9 4 302 361(059) 081 630(549) -317 -109(209) -028 313(340)
C7∙∙∙C13 4 314 372(058) 056 417(361) -252 -091(161) -035 165(201)
C6∙∙∙C9 5 308 412(104) 014 513(499) -282 -050(233) -039 231(269)
C6∙∙∙C13 5 324 444(119) 005 292(287) -207 -032(176) -039 085(123)
C6∙∙∙H7 6 248 445(197) 000 458(458) -202 -006(196) -020 256(276)
C8∙∙∙H5 5 254 289(035) 086 363(277) -176 -081(095) 005 187(182)
C9∙∙∙H5 6 260 369(109) 003 286(283) -154 -019(135) -021 132(153)
H5∙∙∙H7 7 214 418(204) 000 451(450) -113 -002(111) -004 337(342)
C13∙∙∙HB6 4 254 322(068) 022 364(341) -176 -043(134) -020 187(207)
HB6∙∙∙H11f 6 219 450(231) 000 364(364) -098 -001(096) -004 266(271)
HB6∙∙∙H12 f 6 228 315(087) 008 254(246) -077 -011(066) -003 177(180)
C6∙∙∙C8 4 289 310(021) 485 995(511) -414 -273(141) 211 581(370)
C6∙∙∙C14 f 6 310 510(200) 000 482(482) -273 -014(259) -039 210(248)
C7∙∙∙C14 f 5 312 414(102) 013 455(442) -264 -048(216) -039 191(230)
C7∙∙∙H12 f 6 255 385(130) 002 344(342) -171 -014(156) -020 173(194)
N1∙∙∙C14 f 4 278 298(021) 487 1081(594) -607 -395(212) 093 474(382)
N1∙∙∙H12 f 5 243 262(019) 162 385(222) -243 -154(088) 008 142(134)
dfC14∙∙∙Cl1 4 304 311(007) 688 875(187) -488 -427(061) 261 387(126) fC14∙∙∙HB6 5 241 371(130) 003 618(615) -241 -018(223) -021 377(397) dfCl1∙∙∙H10 5 257 324(068) 051 813(762) -410 -100(309) -049 404(453) dfCl1∙∙∙H11 5 269 374(105) 007 489(483) -308 -042(266) -050 181(231)
54 Discussion The Physical Origins of Torsional Potentials
133
Analysis of which particular atom-atom interactions vary most with conformation
(Table 56 and Table 57) reveals that intramolecular interactions involving the N-H
proton type HB as well as certain aromatic and TA methyl protons type H vary strongly
with conformation as expected based on Figure 514 Therefore the poorly determined
parameters for HB and H strongly affect the energy profiles of Figure 519
54 Discussion The Physical Origins of Torsional Potentials The torsional barriers for fenamates apart from gt 140 are smaller than for PA and
ethane For the fenamates the difference in energy penalty arises from the high degree of
conjugation between the two aromatic rings of the fenamates via ∙∙∙ overlap involving
the lone pair of electrons of the N atom (Figure 516)234 This conjugation effect is absent
for ethane and reduced for PA because these have just one aromatic ring It is clear that
compared to PA the barrier to rotation reduces as the model molecules tend toward two
aromatic rings These observations confirm that the delocalisation of electrons plays a
role in the origin of the torsional barrier for fenamate molecules FA and TA
The maximum at = 90 (Figure 515) is due to dispersion effects The investigation
of different methods for producing conformational profiles demonstrates the importance
of accounting for correlation effects For example the HF method is hopeless for
reproducing the correct conformation profiles around the minima for fenamate molecules
FA TA MA and ClFA (Figure 512) because the method excludes the correction effects
Therefore it is vital that methods of examining the conformational profiles include the
correlation effects This is most important in CSP where accurate ranking of generated
crystal structures depends upon accurately evaluating the energy penalty contribution to
the total lattice energy (equation 51)
Although the conformational profiles are dependent on specific atoms that define
flexible torsion (Figure 58) the comparison of the rigid and relaxed scans shows the
important role that the atomic positions of other atoms play (Figure 513 and Figure 514)
during relaxation For example during the relaxation of TA methyl rotation plays a role
in reducing the energy penalty and barrier to rotation (section 534) The enormous
difference between the relaxed and rigid conformational profiles (Figure 513) and their
conformers (Figure 514) suggests that the atomic positions of most atoms in a molecule
during relaxation are important Consequently we can conclude that the origin of the
torsional barrier involves most atoms in a molecule
By analysing the low-energy torsional barriers in fenamates (Figure 511) it has
become clear that larger organic molecules retain the contributions as identified for small-
55 Summary
134
model molecules such as ethane There is both an electronic and a steric component to
these torsional barriers in fenamates However as the model molecules become larger
the effects of small correlated changes in the other bond angles and the dispersion
contributions become very significant (Figure 515c and d) As the size of the molecule
increases in both the number of atoms and the electron density there is an increasing
contribution to the torsional profile from the intra-molecular equivalent of the
intermolecular dispersion
Separating the ldquothrough spacerdquo intramolecular dispersion from the other electron
correlation effectsmdashspecifically those that contribute to the (h2)(1-cos(2)) electronic
barrier from ldquoconjugationrdquo or delocalization between the two aromatic ringsmdashis unlikely
to be meaningful when using an ab initio method that is still approaching the quantitative
accuracy needed
55 Summary I could not use the definitive ab initio torsional potential for each fenamate as the
torsional potentials of organic molecules containing aromatic rings are very demanding
of the electronic structure method used However PBE0 method and 6-31+G(d) basis set
were sufficient to investigate the origin of the barrier to rotation for FA and TA
The analysis of the fenamatesrsquo torsional potential reveals that like the classical small-
molecule torsional potentials of ethane there is both an electronic effect (loosely
described as changes in MOs involving ∙∙∙ between the aromatic rings and the nitrogen
lone pair destabilizing the non-planar conformations) and a steric effect from the variation
in overlap of non-bonded atoms For larger molecules like the fenamate molecules the
intramolecular dispersion and small changes in the other conformational variables also
make significant contributions to the torsional profile
When the aromatic rings are perpendicular to each other the destructive interference of
MOs creates an intrinsic barrier The two rings in fenamate molecules stabilise the
expected high-energy barrier A cos2 term accurately represents the torsional barrier of
model molecules with minimal steric effects that have been constrained to prevent
pyramidalization Finally this chapter showed that the torsional barriers for FA and TA
depend on small correlated changes in degrees of freedom other than the most flexible
torsion We observed this by contrasting the conformations and their corresponding
energies of rigid scans against relaxed scans for FA and TA
The origin of the torsional barrier of fenamates is therefore a combination of intrinsic
intramolecular dispersion electronic contribution and the steric repulsion A new
55 Summary
135
analytical form for intramolecular energies (Chapter 6) of fenamates that is physically
justified must incorporate these origins and account for small correlated changes among
different conformations
61 Introduction
136
Chapter 6 Toward New Force fields for Fenamate Molecules
ldquoAvoid complexities Make everything as simple as possiblerdquo
mdash Henry Maudslay
61 Introduction
611 Background Force field methods (section 25) for calculating a systemrsquos energy ignore electronic
motions and instead calculate the systemrsquos energy as a function of the nuclear positions
alone63 Such force field methods are less computationally demanding than quantum
mechanical calculations but they cannot predict properties that depend upon a moleculersquos
electronic distribution In addition the limitations of electronic structure calculations as
discussed in Chapters 2 (section 27) and 4 (sections 438 and 439) suggest the need
for a new analytical model that can combine the accuracy of electronic methods and the
speed of force field methods This chapter proposes a solution to this problem
In general force field methods are based on two important components (i) the
functional form of the potential energy functions and (ii) the parameterisation of these
functions235236 In Chapter 5 I investigated the first component the origin of the torsional
barrier for fenamate molecules For small molecules that were constrained to have
minimal steric clashes the origin is mainly an electronic effect and can be expressed as a
cos2ξ term However for larger molecules like fenamic (FA) and tolfenamic acids (TA)
there are additional correlated changes namely the repulsion and dispersion effects
Chapter 5 by investigating these contributions with an exp-6 term dealt with the first
component required for building a force field
The present chapter deals with the second component of force fields re-
parameterisation In this chapter I will derive an analytical model for FA and TA (Figure
61) by fitting the conformational profiles (Figure 511) to analytical expressions
discussed in Chapter 5 One of the key conclusions of Chapter 5 was that definitive ab
initio conformational energy scans could not be obtained However the ab initio scans at
the PBE06-31+G(d) level of theory (Figure 511) are adequate for the purposes of
creating a new analytical model
61 Introduction
137
1
6
2
1
9
1
1
813
7
16
Figure 61 The fenamate family showing the low-barrier torsion angle (=C7-N1-C8-C9)
and atomic numbering =0 when the aromatic rings are coplanar as drawn The
fenamates mentioned in this chapter are fenamic acid (FA) R1= R2= H tolfenamic acid
(TA) R1= CH3 R2= Cl mefenamic acid (MA) R1= R2= CH3 flufenamic acid (FFA) R1=
H R2= CF3 and clorofenamic acid (ClFA) R1=H R2=Cl The dotted line represents an
intramolecular hydrogen bond
Figure 62 Relaxed conformational scans at the PBE06-31+G(d) level of theory for the
fenamates from section 533 Fenamic acid (FA) tolfenamic acid (TA) mefenamic acid
(MA) and chlorofenamic acid (ClFA)
612 A Case for Modelling Decoupled Intramolecular Energy For challenging applications involving molecular recognition of pharmaceuticals such
as computer-aided drug design the importance of an accurate balance of intermolecular
and intramolecular forces cannot be overemphasized93 The success of CSP studies17127
(Chapters 3 and 4) and the limitations of current force field (section 254) and electronic
structure methods (sections 27 and 439) suggest decoupling the models for the
intermolecular forces from those for the intramolecular forces (ie conformational
61 Introduction
138
changes) as a means of more accurately modelling force fields for pharmaceutical
molecules should be attempted
613 Analytical Models of Intramolecular Energies Traditional force field modelling includes an explicit torsional term237 of the general
form
where defines the phase shift and n the periodicity For FA as defined in Figure 61
requires that = 0 and the near-symmetry dictates that n is an even integer For
substituted fenamates odd values of n could contribute although the conformational
profile should be symmetric about = 0
Non-bonded atomndashatom interactions should be able to represent the intramolecular
energies well if the origin of the conformational profile is predominantly steric (caused
by the varying repulsion between the overlapping charge distributions of 1-4 atoms with
) An exp-6 atomndashatom model (Chapter 5) would be expected to give a better
representation than a Lennard-Jones (R-12) model of the variation of the repulsion with
distance given the success of the overlap model in parameterizing intermolecular
repulsion potentials238239 Thus a crude starting point for my investigation of the ldquonon-
bondedrdquo contribution to the torsion potential is the exp-6 atomndashatom model potential with
a parameterization that was developed for modelling the intermolecular forces between
organic molecules in crystal structures42231
where atoms i and k of atomic types and are separated by intramolecular distances Rik
calculated from the molecular conformation with torsion angle ξ This functional form
with no assumed relationship between the like (and ) and unlike () interactions
means that the parameters (A B and C) have at least partially absorbed the
electrostatic effects in fitting This chapter seeks to re-parameterize the equations of the
origin of torsional potential (equations 61 and 62) in order to derive analytical models
that accurately represent the conformational profiles of fenamic (FA) and tolfenamic
acids (TA)
614 Overview The goal of this chapter is to develop a generalizable method that uses a FORTRAN
code to derive analytical models for the conformational profiles of FA and TA This
( ) [1 cos( )]2
nVE n 61
6
( ) exp( )ik ik
i k
E A B R C R 62
62 Methodology Fitting Analytical Models to Conformational Profiles
139
chapter will investigate three analytical forms the cosine series rescaling repulsion and
combined physical models Each of these new analytical forms will have different
parameters for intramolecular and intermolecular contributions I will discuss the
methodology of fitting analytical models to conformational profiles and test the
transferability properties of the combined physical models for FA and TA to other
fenamate molecules (Figure 61)
This chapter will show that the cosine series and rescaled repulsion models are
inadequate for modelling the conformational energy profiles of fenamates More
importantly this chapter will show that combining a cos2 term to represent the
electronic barrier with an intramolecular atomndashatom exp-6 repulsion-dispersion term for
all atom pairs separated by three or more bonds (bond-paths ge 1-4) allows a very effective
representation of the ab initio conformational energies
62 Methodology Fitting Analytical Models to Conformational Profiles The only weighting applied to the conformational profiles of all the fenamate molecules
(Figure 511 at the PBE06-31+G(d) level of theory) in this chapter was the restriction of
conformational energies to 10 kJ mol-1 or below This weighting was appropriate because
this chapter does not seek to represent the steric barrier above 145deg for TA (and MA)
accurately Hence this chapter considers Np = 37 points for the FA and Np = 30 points for
TA (and MA) Because the definition of the ab initio energies Eab are relative to the
lowest energy conformation for each molecule the analytical modelrsquos energies Emodel
were adjusted by a constant Ebase such that the lowest energy conformation of both the
ab initio and analytical model were zero The algorithms (Figure 63 and Figure 64) in
this chapter fit a constant c that matched the overall conformational curves rather than
the minima As such c differs from Ebase by a fraction of a kJ mol-1 The standard error
σintra in Emodel was
where Np and Nk are the number of data points and fitted coefficients respectively
However there were only Nk -1 physical parameters as one (c ~ Ebase) served only to
adjust the baseline
621 Torsional Potential Model The explicit torsional term (equation 61) can be simplified as the following cosine
series
2
mod
int
ab el
ra
p k
E E
N N
63
62 Methodology Fitting Analytical Models to Conformational Profiles
140
where Nk and Np are the number of fitted coefficients and data points respectively The
intercept c is 0 Using the linear least squares method (section 26) the cosine series
(equation 64) were fitted to the conformational profiles of FA and TA (Figure 511) to
determine the unknown coefficients k Below is a flowchart of the cosine series
algorithm (Figure 63)
Figure 63 An algorithm showing the overview of modelling ab initio intramolecular
energy using a cosine series potential The source codes are included in the CD ROM
attached to this thesis (see Appendix A)
In the initialization step (step 1) the algorithm required the ab initio intramolecular
energies and the inputs of their equivalent torsion angles (Figure 511) These inputs
(generated from the ab initio scans reported in Chapter 5) were used to construct a
regression model (step 2) The G02DDFE97 NAG subroutine (section 262) solved the
resulting linear regression problem that is the unknown coefficients k were
determined Finally the standard error σintra of the modelled intramolecular energy
Emodel (equation 63) was calculated
0
( ) cos( 1 ) 5 1kN
k k p
k
E k N N
64
62 Methodology Fitting Analytical Models to Conformational Profiles
141
622 AtomndashAtom Model Due to the considerable correlation between the atomndashatom coefficients particularly
the two repulsion parameters (A and B) it is difficult to vary both repulsion parameters
simultaneously240241 This section discusses the derivation of analytical atomndashatom
models for conformational profiles of FA and TA as expressed in the algorithm shown
in Figure 64 In particular this section discusses the rescaling of selected repulsion (and
dispersion) coefficients which gives a linear model that contains (an appropriate cosine
term and) a baseline constant c
Figure 64 An algorithm showing the modelling of ab initio intramolecular energy by a
physical potential The source codes are included in the CD ROM attached to this thesis
(see Appendix A)
This algorithm (Figure 64) which uses NAG129 library routines shows the systematic
comparison of how well various selections of linear parameters ( and c) can
represent the conformational profiles of fenamates The algorithm first extracted the
geometries and the corresponding intramolecular energies of the fenamate molecules
which were generated from ab initio calculations These geometries were converted to an
atomic type-friendly mol2 format (Sybyl typing230) using the Babel242 chemical toolbox
The other inputs are the starting values of Gavezzottirsquos atomndashatom exp-6 potential
parameters41231232 (Table 52 of Chapter 5) The covalent 1-1 connectivity (from the mol2
file) helped to distinguish the polar hydrogen HB from the non-polar hydrogen H
atoms The remaining atomndashatom connectivity (ie nearest neighbour or bond-path) and
6
( ) cos(2 ) exp( )ik ik
i k
E A B R C R c 65
62 Methodology Fitting Analytical Models to Conformational Profiles
142
distances Rik within the molecule were determined using the H03ADF subroutine and
the 1-1 connectivity H03ADF subroutine evaluates the nearest neighbour by finding the
shortest path between two atoms
Next the atom-atom interactions were summed over all 1-4 atom-atom distances and
higher bond-paths in the entire molecule (equation 65) The maximum bond-path was 1-
11 for all three fenamates and most pharmaceutical molecules were sufficiently small
that there was no need to define a summation limit in terms of intramolecular distance or
bond-path length for a single molecule The use of 1-4 distances as the shortest
intramolecular interactions included in the atomndashatom summation was traditional
Although it should be noted that 1-3 interactions were used elsewhere eg in the CSP
code of GRACE where they have sometimes been found to be problematic including the
recent case of a bulky side group attached to an aromatic ring which required specific
scaling down13 The atomndashatom formulation resulted in many virtually constant terms
such as the H∙∙∙H C∙∙∙C and H∙∙∙C contributions from within the aromatic rings These
terms contributed to the baseline energy Ebase defined as the minimum energy found in
the scan with a specific parameterized model
The atomndashatom model involved far too many coefficients for all to be fitted
independently to the ab initio data In addition many atomndashatom distances did not change
significantly with the torsion angle as observed from investigating the atomndashatom
interaction that dominated the intermolecular contribution in Chapter 5 There were only
16 and 21 dominant interactions out of 351 and 435 total atomndashatom interactions for FA
and TA Therefore only interactions that were classed as dominant were rescaled The
algorithm in Figure 64 determined the dominant interaction by using a cut-off value of
one ie Ecutoff = 1 kJ mol-1 The dominant atomndashatom interactions for FA and TA were
reported in Chapter 5 (Table 66 and Table 57) which are summarised in Table 61 If
atomndashatom interaction of a given type (∙∙∙) varied less than the Ecutoff (for example Cl∙∙∙O
and O∙∙∙HB) then these parameters were not rescaled but may vary the contribution to
Ebase One notable observation was the significant interaction between atoms of the same
aromatic ring for TA (Table 61d) which was absent in FA
62 Methodology Fitting Analytical Models to Conformational Profiles
143
Table 61 Contrasting the atomndashatom interactions of FA and TA that dominated the
intramolecular energies formed by combining Table 56 and Table 57 from Chapter 5
Interactions unique to FA and TA are coloured blue and red respectively dInteractions
between atoms of the same aromatic ring fInteractions involving the methyl substituent
FA TA FA TA ati∙∙∙atk neigh RikkJ mol-1 RikkJ mol-1 Erepul-dispkJ mol-1 Erepul-dispkJ mol-1
min max(∆) min max(∆) min max(∆) min max(∆) C∙∙∙C
C7∙∙∙C9 4 307 371(064) 302 361(059) -035 245(280) -028 313(340)
C7∙∙∙C13 4 307 371(064) 314 372(058) -035 244(279) -035 165(201)
C6∙∙∙C9 5 310 443(133) 308 412(104) -039 205(243) -039 231(269)
C6∙∙∙C8 4 289 310(021) 211 581(370)
C6∙∙∙C13 5 311 444(133) 324 444(119) -039 200(238) -039 085(123) fC6∙∙∙C14 6 310 510(200) -039 210(248) fC7∙∙∙C14 5 312 414(102) -039 191(230)
C∙∙∙H fC7∙∙∙H12 6 255 385(130) -020 173(194)
C6∙∙∙H7 6 252 488(236) 248 445(197) -021 212(233) -020 256(276)
C6∙∙∙H8 4 289 310(020) 212 573(362) C6∙∙∙H11 6 252 488(237) -020 211(231) C8∙∙∙H5 5 254 288(034) 254 289(035) 007 182(176) 005 187(182)
C9∙∙∙H5 6 257 416(159) 260 369(109) -020 154(174) -021 132(153)
C13∙∙∙H5 6 257 417(159) -020 152(172) H∙∙∙H
H5∙∙∙H7 7 208 476(268) 214 418(204) -004 443(447) -004 337(342)
H5∙∙∙H11 7 209 476(267) -004 418(422) C∙∙∙HB
C13∙∙∙HB6 4 251 330(078) 254 322(068) -021 216(236) -020 187(207)
C9∙∙∙HB6 4 251 330(079) -021 218(238) C14∙∙∙HB6 5 241 371(130) -021 377(397)
HB∙∙∙H
HB6∙∙∙H11 5 230 368(138) -004 166(170) HB6∙∙∙H7 5 230 369(139) -004 164(169)
fHB6∙∙∙H11 6 219 450(231) -004 266(271) fHB6∙∙∙H12 6 228 315(087) -003 177(180)
N∙∙∙C fN1∙∙∙C14 4 278 298(021) 093 474(382)
N∙∙∙H fN1∙∙∙H12 5 243 262(019) 008 142(134)
C∙∙∙Cl fC14∙∙∙Cl1 4 304 311(007) 261 387(126)
Cl∙∙∙H dfCl1∙∙∙H10 5 257 324(068) -049 404(453) dfCl1∙∙∙H11 5 269 374(105) -050 181(231)
63 Results
144
These atomndashatom interactions were grouped into unique atom-type∙∙∙atom-type sets
(∙∙∙) The algorithm then systematically fit different subsets of the ∙∙∙rescaling
parameters using combination mathematics243 Eg for interactions C∙∙∙H C∙∙∙HB and
H∙∙∙HB the following seven subsets of interactions were rescaled
1 C∙∙∙H or C∙∙∙HB or H∙∙∙HB
2 C∙∙∙H and C∙∙∙HB or C∙∙∙H and H∙∙∙HB or C∙∙∙HB and H∙∙∙HB
3 C∙∙∙H C∙∙∙HB and H∙∙∙HB
For each fit the subroutine G02DDFE97 (section 262) calculated the Nk coefficients
( c) being fitted and minimized the residual sum of squares (RSS) using a
general linear regression model244 Within the routine a matrix decomposition process
established whether a solution was unique or whether the parameters were linearly
dependent and therefore had no unique solution Unless otherwise noted all fits reported
in this chapter had a unique solution Finally the standard error intra in the modelrsquos
intramolecular energy was calculated after adjusting the minimum to 0 kJ mol-1 (equation
63)
This chapter used the method discussed above to investigate two analytical models
(1) Rescaling only the repulsion contribution of the atomndashatom exp-6 potential ie
equation 65 with and set at 0 and 1 respectively
(2) Rescaling all the parameters ie equation 65
63 Results
631 Cosine Series Model The traditional cosine series expansion for a torsional potential (equation 64) must
include cos4 to have the correct number of minima for the fenamates Alone this term
gave a poor position of the minima for FA and it was qualitatively wrong for TA (Figure
65) A least squares fit that included the lower cosine terms (Nk=5 equation 64) gave a
qualitatively reasonable representation (Figure 65) but further improvement is slowly
converging (Figure 66) For FA the fitting steadily improved in quality particularly
upon the addition of cos4n terms where n are integers For TA the fitting became
unstable after 21 terms even though there was no attempt to represent the large steric clash
beyond 10 kJ mol-1
This result demonstrated that the cosine series was a fitting exercise and did not reflect
the physics It was effectively an exercise in modelling the relaxed scans by a functional
6
( ) exp( )ik ik
i k
E A B R C R c 66
63 Results
145
form that assumed the scan was rigid (ie only the torsion angle changed) This
assumption is a crude approximation since rigid scans are different from relaxed scans
(see Figure 513) Poor convergence of the cosine model expansion were also reported
for biphenyl245 a dye which required 7 terms while polynorbornene246 required 6 and 15
terms for the meso and racemic dimer respectively
Figure 65 Comparison of the ab initio relaxed scan at the PBE06-31+G(d) level of
theory with linearly fitted least square cosine series model for FA (top) and TA (bottom)
with Nk=5 (red lines) the optimal cos4 terms (blue lines) and Nk=21 (green lines σintra
=017 kJ mol-1 for FA and TA)
63 Results
146
Figure 66 Plot of the standard error of the intramolecular energies against the number of
cosine terms Nk for FA (top) and TA (bottom) The fit is ill-determined ie there is no
unique solution for TA after Nk=21
632 Rescaled Repulsion Model From Chapter 5 it is clear that the repulsion contributions were severely overestimated
for FA and TA with Gavezzottirsquos exp-6 potential Therefore an alternative model is to
rescale just the repulsion terms (ie fit selected in equation 66) as the intermolecular
atomndashatom model clearly overestimated the intramolecular steric effects (Figure 519)
Rescaling just a few of Gavezzottirsquos repulsion parameters for example those involving
the poorly parameterized H∙∙∙H interactions resulted in a qualitatively good fit (Figure
67) as shown by the results for fitting all combinations of repulsion parameters for FA
(Table 62) and the summary in Table 63 of the 511 such fits for TA Rescaling just two
(C∙∙∙H and H∙∙∙H) repulsion contributions for FA and five (C∙∙∙H C∙∙∙HB C∙∙∙N H∙∙∙H and
H∙∙∙HB) for TA produced a model that reproduced the torsional profile well (Figure 67)
63 Results
147
Figure 67 Comparison of the relative energies from ab initio calculations (solid black
lines) of FA (top) and TA (bottom) with selected best-fit exp-6 rescaled repulsion models
For FA the selected Nk=3 intra=032 kJ mol-1 model had βC-H=-453 βH-H=270 and
Ebase=-506 while the Nk =4 intra=027 kJ mol-1 model had βCH=-446 βH-H=210 βH-
HB=257 and Ebase=-875 For TA the selected Nk=6 (intra=034 kJ mol-1) and 10
(intra=022 kJ mol-1) parameter fits are shown bold in Table 63
The rescaling of the C∙∙∙N interaction seemed particularly critical for TA (Table 63)
which can be attributed to the importance of the C(methyl)∙∙∙N interaction in describing
the steric clash involving the methyl group (Figure 514) However many of the fitted
rescaling parameters were negative (which suggested that the exponential steric
repulsion had become attractive Thus again this appeared to be a fitting exercise so that
exponential terms were reducing the over-estimate of the barrier at 90 by the
intermolecular dispersion parameters (Figure 519)
63 Results
148
Table 62 Complete set of results after rescaling Nk (repulsion contributions and
baseline energy Ebase) parameters of various interacting atomic types for FA
ικ Ebase σintra kJ mol-1
Nk C -C C -H C -HB H -H H -HB 2 - -226 - - - 437 168 2 - - -148 - - 1076 284 2 - - - -088 - 2215 287 2 - - - - -423 3579 299 2 -332 - - - - -39948 451 3 - -453 - 269 - -506 032 3 - -428 - - 539 -1511 032 3 -210 -217 - - - -31011 036 3 - -523 365 - - 278 04 3 -523 - -173 - - -62622 045 3 -621 - - -124 - -71356 065 3 -666 - - - -549 -74317 066 3 - - -991 - 2082 -7537 127 3 - - -909 722 - -2278 174 3 - - - -738 1972 -2577 247 4 - -446 - 210 257 -875 027 4 - -467 144 243 - -388 03 4 079 -438 - 258 - -2557 032 4 041 -390 - - 459 -7101 032 4 - -432 109 - 525 -1456 033 4 -173 -254 133 - - -27252 037 4 -458 - -296 - 394 -57220 04 4 -507 - -218 137 - -61133 045 4 -639 - - -035 -157 -72571 064 4 - - -958 006 2275 -7893 125 5 130 -467 - 218 278 2069 028 5 - -448 104 210 251 -849 028 5 236 -591 218 270 - 13231 029 5 -016 -327 037 - 481 -12963 031 5 -456 - -284 061 479 -57209 039 6 208 -550 170 237 225 10068 028
Table 63 Summary table of the best results after rescaling Nk (repulsion contributions
and baseline energy Ebase) parameters of various interacting atomic types for TA
βικ Ebase σintra kJ mol-1 Nk C-C C-Cl C-H C-HB Cl-H C-N H-H H-HB H-N
2 - 909 - - - - - - - 11281 130 3 -008 - - - - -299 - - - -13547 093 4 - - - - 751 -269 - - 1454 11747 087 5 - - -279 622 - -464 - -549 - -5429 051 6 - - -306 472 - -447 426 -529 - -5279 034 7 - - -392 472 - -487 532 -611 -054 -7690 025 8 - 503 -359 387 265 -340 581 -570 - 300 022 9 - 531 -343 355 318 -327 596 -539 190 1748 021
10 084 541 -319 330 347 -331 611 -527 219 681 022
63 Results
149
633 Combined Physical Model Assuming a model that both describes the electronic effects and allows rescaling of the
atomndashatom interactions
Then there is a huge number of ways for finding a satisfactory fitting of the data The
rescaling of the three contributions in equation 67 is physically justified since
(1) The α term represents the electronic barrier that arises from the conjugation of
benzoic acid rings (section 535)
(2) The rescale term is necessary due to the overestimation of the repulsion
contribution (section 536)
(3) The rescale term accounts for electron correlation ie dispersion Section 275
emphasised the importance of the dispersion term while section 533 showed the
consequence of ignoring the electron correlation eg HF method
Cases where and gt 0 retained the repulsive and attractive (dispersion) nature ie
repulsion did not become attraction and vice versa It was also required that was less
than zero ( lt 0) to give a maximum around =90deg corresponding to conjugation (Figure
515) Table 64 contains all the fits to FA which have the physically correct sign for all
parameters and the full set of results for fitting up to 12 parameters (including the baseline
estimate Ebase as given in Table 65) This shows that fitting and only rescaling a few
atomndashatom interactions gives a qualitatively accurate fit (Figure 69) It is notable that the
parameters involving H and HB usually needed the greatest rescaling a finding that is
consistent with the fact that HB parameters were not fitted in the intermolecular potential
model In addition the intermolecular parameterization of H∙∙∙H is a notable exception in
that its minimum is very shallow (Figure 68) and is not sharply defined being repulsive
for a wide range of intermolecular H∙∙∙H distances42 Furthermore there is a huge
difference between other polar H (HB) interactions and H∙∙∙H interactions therefore it is
not surprising that the interactions that involve HB atoms required the greatest rescaling
Table 64 All fits obtained for FA with the physically correct sign for the repulsion
and dispersion and electronic parameters βικ γικ α Ebase σintra
kJ mol-1 Nk C-C C-H C-HB H-H H-HB C-C C-H C-HB H-H H-HB
6 - - 801 1074 - - - 1654 5800 - -339 -12383 026
6 - 028 - - 1109 - 783 - - 3479 -117 -7549 028
4 - - - 1108 - - - - 5003 - -391 -5926 033
4 - 619 - - - - 2082 - - - -157 -18049 036
4 - - - - 3467 - - - - 13698 -530 -1246 057
4 - - 3630 - - - - 11038 - - -945 -33466 076
6
( ) cos(2 ) exp( )ik ik
i k
E A B R C R 67
63 Results
150
Figure 68 Gavezzotti exp-6 potential for all atomndashatom interactions in fenamates
displayed in two different energy scales The parameters are from Chapter 5 (Table 52)
Although virtually perfect fits can be obtained (Table 65) the variation in the fitted
parameters is significant given the exponential sensitivity of the repulsion to changes in
atomndashatom distances These could be substantial for example the lack of symmetry for
the FA torsional scan where the two minima were found at =3894deg and 14471deg though
only differing in energy by 188 x 10-3 kJ mol-1 (716 x 10-7 au) corresponded to a change
of 061 Aring in the 1-4 interaction between the amide proton and C13 or C9 Even the C8-C9
and C8-C13 aromatic bond lengths differed by 00037 Aring for =0 or 180deg but only by
00004 Aring for =80deg or 100deg with larger changes in the bonded hydrogen positions for
FA Hence the systematic consideration of all combinations of sets of parameters that
could be meaningfully fitted and the resulting coefficients only provided a qualitative
guide to which of the atomndashatom interactions dominated the intramolecular energy
(Chapter 5 Table 66) and were most critical
63 Results
151
Table 65 The rescale parameters for the repulsion ικ dispersion ικ and electronic contributions of
the physical exp-6 and cos2 model for all possible combinations of atom type interactions C∙∙∙C C∙∙∙H
C∙∙∙HB H∙∙∙H and H∙∙∙HB for FA Nk are the number of fitted rescale parameters ικ and ικ and the baseline
energy Ebase ικ ικ α Ebase σintra
kJ mol-1 Nk C-C C-H C-HB H-H H-HB C-C C-H C-HB H-H H-HB
4 - - - 1108 - - - - 5003 - -391 -5926 033
4 - 619 - - - - 2082 - - - -157 -18049 036 4 -797 - - - - -1508 - - - - -272 -10530 045
4 - - - - 3467 - - - - 13698 -530 -1246 057
4 - - 3630 - - - - 11038 - - -945 -33466 076
6 -366 461 - - - -1053 1477 - - - -080 -3768 010 6 -436 - - 610 - -764 - - 2966 - -114 -15833 012
6 -852 - -188 - - -1227 - -229 - - 055 -30621 017
6 -600 - - - 1135 -862 - - - 5415 -143 -23513 018 6 - -103 1476 - - - 574 4073 - - -220 -17385 023
6 - - - 1208 -182 - - - 6537 -2918 -208 -9576 024
6 - -255 - 619 - - 013 - 2048 - -216 -1513 025 6 - - 801 1074 - - - 1654 5800 - -339 -12383 026
6 - 028 - - 1109 - 783 - - 3479 -117 -7549 028
6 - - -1326 - 6519 - - -6960 - 32879 -539 24422 036
8 -275 351 - - 271 -935 1344 - - 412 -075 534 008
8 -236 414 - -157 - -1078 1876 - -1719 - -076 9374 009
8 -373 - - 626 334 -681 - - 3475 222 -066 -15208 009
8 -493 551 -189 - - -1218 1530 -642 - - -047 -6499 010 8 -530 - -737 725 - -1054 - -2417 3267 - -044 -3345 010
8 -698 - -1655 - 3047 -1263 - -6095 - 14774 012 5842 013
8 - -419 520 1195 - - -846 691 6039 - -246 -995 019 8 - - 1843 1185 -1677 - - 5881 7251 -11125 -196 -30353 019
8 - -089 2697 - -3196 - 952 9622 - -18054 -082 -40433 021
8 - -445 - 1541 -1016 - -970 - 7719 -6385 -166 -770 021
10 -445 686 -555 -541 - -1577 2664 -1489 -4179 - 017 13752 005 10 -524 469 -740 - 953 -1247 1257 -2481 - 3880 -022 -075 007
10 -320 465 - -026 593 -977 1532 - -349 1763 -064 -3403 008
10 -598 - -1429 455 1804 -1188 - -5112 1825 8695 -025 6986 009 10 - 166 2717 671 -2944 - 788 9384 4350 -17854 -113 -44769 014
12 -383 709 -155 -570 -447 -1498 2835 -035 -4260 -2903 018 9708 006
152
Table 66 The rescale parameters for the repulsion ικ dispersion ικ and electronic contributions of the physical exp-6 and cos2 model for all possible combinations of atom
type interactions C∙∙∙C C∙∙∙Cl C∙∙∙H C∙∙∙HB Cl∙∙∙H C∙∙∙N H∙∙∙H and H∙∙∙HB for TA Nk are the number of fitted rescale parameters and Ebase is the baseline energy ghThe parameters
used in Figure 69b and ifor testing transferability in Figure 610b and Figure 611 ικ ικ α Ebase σintra
kJ mol-1 Nk C-C C-Cl C-H C-HB Cl-H C-N H-H H-HB H-N C-C C-Cl C-H C-HB Cl-H C-N H-H H-HB H-N
4 - 1019 - - - - - - - - 593 - - - - - - - -135 8690 108
4 - - - - - 930 - - - - - - - - 2901 - - - -530 -24891 111
4 - - - - - - - - 1839 - - - - - - - - 5101 -293 -14115 149 4 - - - - - - - 861 - - - - - - - - 3884 - -254 2058 165
4 - - - 303 - - - - - - - - 1102 - - - - - -167 -1133 168
4 181 - - - - - - - - 095 - - - - - - - - -761 13228 193
6 - - - - - 2237 173 - - - - - - - 6517 1810 - - -135 -63604 049 6 - 484 - - - 1974 - - - - 4173 - - - 7186 - - - -848 -99438 067
6 - - 1560 - - - 1856 - - - - 817 - - - 11967 - - -1311 -8678 077
6 - - - - 967 2171 - - - - - - - 4431 6977 - - - -167 -89172 078 6 659 - - - - 4409 - - - 955 - - - - 12397 - - - -1602 -99338 102
6 - - - - - - 604 - 2288 - - - - - - 2012 - 7506 -674 -27619 120 g8 - 1933 - 567 - 2165 - - - - 7289 - 2207 - 6976 - - - -102 -114180 015
8 - - - - 1957 3068 - 498 - - - - - 8130 9634 - 2647 - -096 -133767 016 8 - 1618 - - - 2874 - 676 - - 6263 - - - 8952 - 3754 - -361 -119616 023
8 - 038 - - - 2451 133 - - - 1139 - - - 7574 1528 - - -320 -83684 028
8 - - 1015 801 - - 505 - - - - 083 437 - - 11123 - - -962 -4165 037 8 - - - - 634 2650 027 - - - - - - 2075 7927 1106 - - -313 -86212 041
8 - - - - - 2211 127 367 - - - - - - 6326 1898 1248 - -009 -62350 047
8 - - 156 - - 2356 105 - - - - 189 - - 6873 1561 - - -178 -67559 051 8 - - 1422 - - - 1194 1225 - - - 1118 - - - 8625 5331 - -621 -14314 063
8 - - 768 - - - 1497 - 1353 - - 221 - - - 8154 - 2730 -436 -9301 071 h10 - 1049 - - 2600 2731 - 679 - - 366 - - 9102 8140 - 3889 - -426 -112247 008
10 - - 135 - 853 2173 - 426 - - - 404 - 2724 6867 - 2476 - -193 -83710 009 10 - 853 - - - 2386 227 583 - - 3742 - - - 7431 1238 2941 - -222 -94694 010
10 - - - - 1465 2785 089 542 - - - - - 5788 8569 720 2568 - -107 -112106 011
10 - 1143 194 457 - 2086 - - - - 4833 341 1829 - 6762 - - - -096 -102646 016 10 050 - - - 1763 2692 - 496 - 085 - - - 7084 8615 - 2744 - -032 -123424 018 i10 - - 180 - - 2079 - 604 089 - - 627 - - 6176 - 3544 883 -051 -71971 026
10 - - 413 506 - 1334 018 - - - - 473 1146 - 4010 2532 - - -067 -48308 031 10 314 - 945 1122 - - 535 - - 531 - 110 1833 - - 10029 - - -966 -9528 032
10 - 1160 743 925 - - 365 - - - 2757 057 1532 - - 8017 - - -487 -17128 036
12 - - - 093 1321 2831 314 - 1519 - - - 569 4186 8238 941 - 3812 -414 -110966 007
12 - 709 - 253 1721 2653 - - 903 - 1198 - 1091 5530 7956 - - 1792 -350 -111102 008 12 - - 237 137 1032 2350 - - 700 - - 432 702 2719 7255 - - 1037 -351 -88568 008
12 - - 425 - 843 2274 065 656 - - - 588 - 2415 6938 1356 3101 - -440 -84012 008
12 - - 046 - - 2081 536 274 1391 - - 344 - - 5722 1360 2319 5007 -245 -78093 027
14 - - 384 214 886 2010 190 - 805 - - 456 690 2056 6136 1635 - 1462 -532 -76472 008 14 - - 249 012 954 2442 - 316 410 - - 457 214 2439 7563 - 1279 209 -360 -86183 009
63 Results
153
Figure 69 Comparison of the relative energies from ab initio calculations (solid black
lines) of FA (top) and TA (bottom) with selected physical models For FA the selected
Nk=6 intra=026 kJ mol-1 model has βC-HB =801 γC-HB =1654 βH-H =1074 γH-H =58 α=-
339 and Ebase=-12383 whilst the Nk =6 intra=028 kJ mol-1 model has β C-H =028 γ C-
H =783 β H-HB = 1109 γ H-HB =3479 α=-117 and Ebase=-7549 For TA parameters for
the selected Nk=8 (intra=015 kJ mol-1) and 10 (intra=008 kJ mol-1) are in ghTable 66
In contrast to FA TA (Table 66) gave a qualitatively accurate fit only when at least
three types of atomndashatom parameters were rescaled (Nk=8) including C∙∙∙N as shown in
Figure 69 The relaxed scans were sensitive to a large number of atomndashatom distances
so that the 5 change in did not necessarily give a smooth curve between the analytical
values This was because of the differences in the molecular relaxation and resulting
atomndashatom distances not the step size because Figure 510 of Chapter 5 showed that
smaller step size for FA produced a smooth but asymmetric ab initio energy-curve All
the fits with the physically correct parameters were unique solutions (section 262)
63 Results
154
Depending on which atomic types were being fitted there were some variations in the
parameters for a given atomndashatom interaction I noticed that for TA (Table 66) the C∙∙∙N
parameters consistently needed to be drastically rescaled reflecting the importance of the
methyl carbon (R1=CH3 Figure 61) in the conformational profile of TA Indeed TA
differed from FA in having many more intramolecular atomndashatom distances that changed
significantly within the range = 0 to 145 including some within the same aromatic ring
such as the methylndashchloro interactions (Table 61 or compare Table 56 with Table 57 in
Chapter 5) Day6 also observed that pyramidalizations of atoms (eg the nitrogen atom in
an amine group) significantly affect the intramolecular parameters
By following the procedure described in the methodology (section 622) I obtained a
variety of analytical models of the form of equation 67 that could reproduce the torsional
profiles of FA and TA with a high degree of accuracy despite the significant variation in
many atomndashatom distances during the relaxed torsional scans However the analytical
model had a maximum number of parameters for FA and TA (12 and 22 respectively)
with 5 (plus 1) atomic types C H N O HB (plus Cl) when considering atomic-
type∙∙∙atomic-type interaction that contributed significantly to energy changes with
conformation Fitting too many parameters led to models where some of the fitted
parameters had the wrong sign for their physical interpretation and some of these fits for
TA showed a linear dependence between the parameters (ie the fitted parameters were
not unique section 262) Nonetheless the ease with which this physically justified model
(equation 67) could reproduce the conformational dependence of FA and TA shows that
this approach to modelling the intramolecular energies of fenamates is promising
634 Transferability A further investigation of the physical reasonableness of the atomndashatom plus electronic
functional form (equation 67) is to test whether the models transfer to related molecules
The difference between the energy scans when the substituents are far from the varying
torsion angle for example the change of H to Cl atom ie from FA to ClFA or between
TA and MA (Figure 511) should not change the main steric interactions and should only
have a small effect on the electronic term (Figure 515e and f)
Transferring a set of parameters fitted to FA and adding Gavezzottirsquos Cl parameters
did indeed (Figure 610) give some of the asymmetry in the well depths seen for ClFA
and the higher central barrier as compared to FA (Figure 511) when the electronic term
was fitted Similarly a set of parameters fitted to TA could reproduce the lower barrier
at = 90 and higher barrier at = 0 in MA (Figure 610b) despite the fact that the
63 Results
155
conformational relaxation of the methylndashmethyl interaction was somewhat different from
that of the methyl-chloro geometry (Figure 513)
Figure 610 Comparison of the relative energies from ab initio calculations (solid black
lines) with models using transferred βικ and γικ parameters from FA and TA (dotted grey
plots) to ClFA (top) and MA (bottom) respectively The red curve has only had the
baseline adjusted whereas the blue curve had the parameter refitted to ClFA or MA
respectively The transferred FA parameters are those Nk=6 fit=028 kJ mol-1 in Figure
69 while those of TA Nk= 10 fit= =026 kJ mol-1 are shown in iTable 66
A more stringent test would be to apply the same TA parameters to FA and ClFA
which gave qualitatively correct results around the minima (Figure 611) and the steric
barriers at 0 and 180 However the barrier height around 90 would remain similar to
that in TA and this underestimation would be only partially corrected by refitting the
cos(2) term Given the limitations in the parameter optimization the qualitative
63 Results
156
accuracy is promising In particular the poorer transferability may be attributable to the
fact that the fitting of parameters for C and H interactions in TA was modelling both the
aromatic and methyl atoms and the methyl∙∙∙N interaction was critical in fitting the
parameters to the TA profile
Figure 611 Comparison of the relative energies from ab initio calculations (solid black
lines) with models using βικ and γικ parameters transferred from TA (dotted grey plots) to
(a) FA and (b) ClFA The red curve has only had the baseline adjusted whereas the blue
curve has the parameter refitted to FA or ClFA respectively The transferred TA
parameters are those of Nk= 10 fit= 026 kJ mol-1 as shown in iTable 66
64 Summary
157
64 Summary Neither the cosine terms nor the analytical models that rescaled overestimated repulsion
contributions were adequate for modelling the conformational profile of fenamates
However a physically justified modelmdashone that combined a cos2 term with an
intramolecular exp-6 atomndashatom term for all atom pairs separated by three or more bonds
(1-4 and above)mdashallowed for a very effective representation of the ab initio
conformational energies In this chapter I successfully fitted conformational profiles of
FA and TA to the cos2 plus exp-6 model This success suggests that the separation of
intramolecular and intermolecular forces is a promising new method for discovering force
fields that are more accurate which could in turn pave the way for modelling the
condensed phases of pharmaceutical-like organic molecules Considering a wide range of
molecules and bigger dataset could improve the transferability of this physical model
71 Position of CSP in the Context of this Thesis
158
Chapter 7 Conclusions and Future Work
ldquoIt is good to have an end to journey toward but it is the journey that matters in the
endrdquo
mdash Ernest Hemingway
71 Position of CSP in the Context of this Thesis The CSP results of Chapters 3 and 4 successfully validated the ability of
CrystalPredictor to generate crystal structures of flexible molecules In Chapter 3 I
successfully predicted the crystal structure of BT which has an unusual and unexpected
packing The success required the use of distributed multipoles and ab initio calculations
of intramolecular energy This success inspires hope that the use of multipolar
electrostatic models (as being implemented in the second-generation force fields such as
AMOEBA91) with careful evaluation of the accuracy of the intramolecular forces will
provide a route to greater reliability for computer-aided drug design with uncommon
ligands However the failure of a conventional point charge electrostatic model used in
the intermediate step has considerable implications for other studies that rely on
modelling the intermolecular interactions of 1-substituted 1H-tetrazoles
Chapter 4 successfully investigated the concept of polymorphophore via CSP studies
of FA and TA in an attempt to understand why polymorphism occurs I discovered that
the fenamate fragment did qualify as a polymorphophore in that the dimeric unit could
pack in a variety of ways with different torsion angles of the phenyl groups due to the
torsional flexibility of FA and TA Once the aromatic rings had interdigitated with their
nearest neighbours there was a large barrier to rearrangement to a very different packing
and the polymorphs were long-lived with the torsion angles varying slightly to optimize
the packing for a given structure as we saw for TA It was however the comparison
between the FA and TA crystal energy landscapes that showed that it was the substituents
that played the major role in determining the possible packing and relative energies and
hence the polymorphic behaviours of FA and TA These observations clearly
demonstrate the links among conformational flexibility polymorphism and
polymorphophore
The considerable similarity in large clusters of the known and hypothetical structures
of TA and the closeness of their energies suggested that crystal growth errors were very
likely More importantly though this finding guided my colleague in the discovery of a
new polymorph of TA (form VI) which was nucleated by solution evaporation after
72 Towards more accurate force-fields for pharmaceutical molecules
159
dissolving TA (form I) in ethanol and seeding it with mefenamic acid (form I) The major
component of this new form (form VI is disordered 65 and 35) was not among the
crystal structures on the final energy landscape despite generating the corresponding
hypothetical structure during an intermediate step (CrystalPredictor) Although this
observation emphasised the success of the CrystalPredictor algorithm it also showed the
need for larger numbers of crystal structures to go through CrystalOptimizer This need
for a larger dataset in the subsequent CrystalOptimizer step raises the question ldquoIs there
a clear cut-off in energy for flexible moleculesrdquo This question is even more relevant
when you consider that desolvated solvates can have much higher energy than organic
crystal structures247 In fact it might even be desirable to go even higher in energy due to
likely high conformation energy of the desolvated solvates The CrystalOptimizer
algorithm does allow the build-up of a database known as Local Approximate Models
(LAMs) but it would be preferable to be able to check many more structures If we could
better fit intramolecular energy which requires the bulk of the computing time to a force
field we would be able to compute the energies of many more structures of a target
molecule In addition computing the energies of the higher-energy structures would be
much cheaper
Chapters 3 and 4 used methods suitable for studying flexible molecules17 as the ab
initio charge density for the specific conformation was used in modelling the
intermolecular interactions thus representing the interplay between molecular
conformation and intermolecular interactions which have been shown to be important for
TA211 Conformational changes can optimise the directionality of strong interactions
such as H-bonding and increase the packing density and hence the stabilization of the
structure by dispersion forces Although CSP methodologies have advanced to aid solid
form screening in pharmaceutical development247-250 it is nevertheless desirable to
calculate the relative free energies of organic polymorphs via molecular dynamics
methods251-253 Although there has been a great push to include the kinetics and their
ability to control the polymorphs formed1 a vital first step is to develop a sound
understanding of thermodynamics
72 Towards more accurate force-fields for pharmaceutical molecules The challenge of extending the reliability and accuracy of quantum mechanical
methods to larger molecules which are more typical of pharmaceuticals and realistic
biological molecules in isolation or condensed phases is the subject of active research
This research ranges from empirical corrections to DFT methods to the use of better
73 Future Work
160
functionals254 as well as implementing explicitly correlated wavefunction methods more
effectively
Chapter 5 emphasized the challenges with using a sufficiently realistic method for the
ab initio determination of conformational energies for larger molecules For example the
HF method provides a qualitatively wrong and misleading conformational profile of FA
and TA due to the absence of the dispersion (correlation effect) contribution Dispersion
also plays an important role in the barrier to rotation for the fenamates especially when
the aromatic rings are perpendicular to one another The analysis of the fenamatesrsquo
torsional potential revealed that the origin of the torsional barrier of the fenamates is a
combination of intrinsic intramolecular dispersion electronic contribution and the steric
repulsion In addition small changes to other conformational angles made significant
contributions to the torsional profile of the fenamate molecules
In Chapter 6 a physically motivated analytical modelndashndashcos2 term combined with an
intramolecular exp-6 atomndashatom term for all atom pairs separated by three or more
bondsndashndashwas derived using knowledge gained from Chapter 5 This model accurately fits
the intramolecular energy profiles of FA and TA This approach of modelling the
conformational energies of the fenamates could be extended to pharmaceutical-like
flexible organics
73 Future Work One can envisage a general scheme for determining the physically motivated potentials
(Chapter 6) for a given molecule following a CSP study by an approach that is being
developed127 and applied to pharmaceutical molecules247-249255 The refinement of the
molecular conformations simultaneously with the crystallographic cell using
CrystalOptimizer72 involves the calculation and storage of a large database (LAMs) of ab
initio conformational energies and forces for the molecule For example the CSP studies
for FA and TA contain the results of hundreds of molecular wavefunction calculations
with varying torsion and bond angles
The database generated in a CSP study will cover most of the range of conformations
that are likely to be sampled in a Molecular Dynamics study of the molecules in
condensed phases with a strong bias towards the conformations that occur in low-energy
crystal structures both observed and potential polymorphs1 The LAMs database could
be used to improve the parameterization of the analytical conformational energy model
adapting the potential fitting routines (Appendix A) used in Chapter 6 An advantage of
using an analytical functional form rather than the LAMs to interpolate between the ab
73 Future Work
161
initio points in the CSP study is that the extrapolation to other conformations will be more
realistic The great benefit of this scheme of building up from a CSP study for a specific
molecule is that the model intramolecular force field could be validated by ensuring that
the model reproduces the crystal energy landscape ie the energies of different packing
H-bonding and stacking modes are correctly balanced with the accompanying
conformational changes
The application of separate analytical potentials for both intra- and intermolecular terms
will require adaptation of molecular modelling codes However the coding for the
energies forces and second derivatives of the proposed intramolecular force field
(equation 67) is already present in most codes After inserting the new parameters the
major adaptation that will be required for an existing codendashndashone that uses traditional force
fields such as DL_POLY251256 for Molecular Dynamics simulationsndashndashis separating out
the calculation of inter- and intramolecular terms Accurate intramolecular forces are
most needed in combination with the accurate anisotropic atom-atom intermolecular
potentials for organic molecules where the electrostatic term is represented by atomic
multipoles for example the static organic crystal structure modelling code
DMACRYS34 or the rigid molecule molecular dynamics code DL_MULTI257
Furthermore the adaptation of molecular modelling code would require an adequate
representation for the conformation dependence of the distributed multipoles for specific
molecules but the dependency could be represented by an analytical model258
Although this change in approach to pharmaceutical force fields involves envisaging a
specific model fitted for each molecule the physical basis of the current model and the
results from Chapter 6 suggest that a reasonably transferable set of atom-atom
intramolecular exp-6 potentials could be fitted for families of molecules Deriving a
transferable model would require a very large dataset of ab initio conformational profiles
of many molecules calculated at an appropriate accuracy The transferability of the
electronic term ( coefficients) would need investigating However the use of separate
atom-atom models for the forces within and between molecules appears to provide a
significant improvement in the realism of current force fields In conclusion this
approach could potentially provide an affordable route for Molecular Dynamics
simulations of flexible pharmaceuticals that have the accuracy of CSP
Appendix A
162
Appendix A Contents of enclosed CD-ROM
The CD-ROM attached to this thesis contains FORTRAN source codes of the analytical
models presented in Chapter 6 as well as some of the input files The input data for FA
TA MFA and ClFA that were used in conjunction with the source codes are in directory
A1 The inputs files included for each molecule are as follows
a) The summaryr contains a summary of the flexible degree of freedom ξ and
the intramolecular energy relative to the most stable conformation ΔEintra
b) The geometries of all the optimised conformation in mol2 file format
The source codes and example input files are in directories A2 (cosine model) A3
(rescaled repulsion model) and A4 (physical model) The A2 directory contains
a) an executable file (cos_modelexe)
b) FORTRAN source code (cos_modelf90)
c) input (summaryr) file
d) output (dominantr) file
The A3 and A4 directories contain
a) an executable file (exe)
b) FORTRAN source code (f90)
c) output (dominantr) file
d) an input subdirectory that contains
i Gavezzottirsquos exp-6 atom-atom parameters from Table 52
ii h03adfe subroutine computes the nearest neighbour of two atoms and
iii summaryr file
The A5 directory contains a utility file (extract_mol2sh) that extracts the input data
(summaryr and all the optimised conformations in mol2) from the GAUSSIAN0353
(log) file
Bibliography
163
Bibliography
1 Price S L Why dont we find more polymorphs Acta Crystallogr Sect B
2013 69 313-328
2 Price S L Predicting crystal structures of organic compounds Chem Soc Rev
2014 43 (7) 2098-2111
3 Svaumlrd M Structural Kinetic and Thermodynamic Aspects of the Crystal
Polymorphism of Substituted Monocyclic Aromatic Compounds 2011
4 Svaumlrd M Nordstroumlm F L Jasnobulka T Rasmuson Aring C Thermodynamics
and Nucleation Kinetics of m-Aminobenzoic Acid Polymorphs Cryst Growth
Des 2009 10 (1) 195-204
5 Chemburkar S R Bauer J Deming K Spiwek H Patel K Morris J
Henry R Spanton S Dziki W Porter W Quick J Bauer P Donaubauer
J Narayanan B A Soldani M Riley D McFarland K Dealing with the
impact of ritonavir polymorphs on the late stages of bulk drug process
development Org Process Res Dev 2000 4 (5) 413-417
6 Day G M Current approaches to predicting molecular organic crystal structures
Crystallography Reviews 2011 17 (1) 3-52
7 Byrn S R Pfeiffer R Ganey M Hoiberg C Poochikian G Pharmaceutical
Solids - A Strategic Approach to Regulatory Considerations Pharmaceut Res
1995 12 (7) 945-954
8 Price S L Lattice energy nailed Science 2014 345 (6197) 619-620
9 Newman A Specialized Solid Form Screening Techniques Org Process Res
Dev 2013 17 (3) 457-471
10 Day G M Cooper T G Cruz-Cabeza A J Hejczyk K E Ammon H L
Boerrigter S X M Tan J Della Valle R G Venuti E Jose J Gadre S R
Desiraju G R Thakur T S van Eijck B P Facelli J C Bazterra V E
Ferraro M B Hofmann D W M Neumann M Leusen F J J Kendrick J
Price S L Misquitta A J Karamertzanis P G Welch G W A Scheraga
H A Arnautova Y A Schmidt M U van de Streek J Wolf A Schweizer
B Significant progress in predicting the crystal structures of small organic
molecules - a report on the fourth blind test Acta Crystallogr Sect B 2009 65
(2) 107-125
11 Bardwell D A Adjiman C S Arnautova Y A Bartashevich E Boerrigter
S X Braun D E Cruz-Cabeza A J Day G M la Valle R G Desiraju G
R van Eijck B P Facelli J C Ferraro M B Grillo D Habgood M
Hofmann D W Hofmann F Jose K V Karamertzanis P G Kazantsev A
V Kendrick J Kuleshova L N Leusen F J Maleev A V Misquitta A J
Mohamed S Needs R J Neumann M A Nikylov D Orendt A M Pal R
Pantelides C C Pickard C J Price L S Price S L Scheraga H A van de
Bibliography
164
Streek J Thakur T S Tiwari S Venuti E Zhitkov I K Towards crystal
structure prediction of complex organic compounds - a report on the fifth blind
test Acta Crystallogr Sect B 2011 67 (6) 535-551
12 Price S L Developing Methods of Crystal Structure and Polymorph Prediction
Implications of Molecular and Materials Structures for New Technologies 1999
315-320
13 Neumann M A Tailor-made force fields for crystal-structure prediction J Phys
Chem B 2008 112 (32) 9810-9829
14 Price S L Computed crystal energy landscapes for understanding and predicting
organic crystal structures and polymorphism Accounts Chem Res 2009 42 (1)
117-126
15 Groom C R Reilly A M Sixth blind test of organic crystal-structure prediction
methods Acta Crystallogr Sect B 2014 70 (4) 776-777
16 Beyer T Lewis T Price S L Which organic crystal structures are predictable
by lattice energy minimisation CrystEngComm 2001 3 (44) 178-212
17 Kazantsev A V Karamertzanis P G Adjiman C S Pantelides C C Price
S L Galek P T Day G M Cruz-Cabeza A J Successful prediction of a
model pharmaceutical in the fifth blind test of crystal structure prediction Int J
Pharm 2011 418 (2) 168-178
18 Lopez-Mejias V Kampf J W Matzger A J Nonamorphism in Flufenamic
Acid and a New Record for a Polymorphic Compound with Solved Structures J
Am Chem Soc 2012 134 (24) 9872-9875
19 Lopez-Mejias V Kampf J W Matzger A J Polymer-Induced
Heteronucleation of Tolfenamic Acid Structural Investigation of a Pentamorph
J Am Chem Soc 2009 131 (13) 4554-4555
20 Yu L Polymorphism in Molecular Solids An Extraordinary System of Red
Orange and Yellow Crystals Accounts Chem Res 2010 43 (9) 1257-1266
21 Chen S A Xi H M Yu L Cross-nucleation between ROY polymorphs J
Am Chem Soc 2005 127 (49) 17439-17444
22 Murthy H K Bhat T N Vijayan M Structural studies of analgesics and their
interactions 9 Structure of a new crystal form of 2-([3-(trifluoromethyl) phenyl]
amino) benzoic acid (flufenamic acid) Acta Crystallogr Sect B 1982 38 (JAN)
315-317
23 Lutker K M Tolstyka Z P Matzger A J Investigation of a privileged
polymorphic motif A dimeric ROY derivative Cryst Growth Des 2008 8 (1)
136-139
24 Price S L Price L S Modelling Intermolecular Forces for Organic Crystal
Structure Prediction In Intermolecular Forces and Clusters I Wales D J Ed
Springer-Verlag Berlin Heidelberg Germany 2005 pp 81-123
Bibliography
165
25 Bernstein J Polymorphism in Molecular Crystals Clarendon Press Oxford
2002
26 Stone A J The Theory of Intermolecular Forces 2 ed Oxford University Press
Oxford 2013
27 Buckingham A D Utting B D Intermolecular Forces Annu Rev Phys Chem
1970 21 (1) 287-316
28 Maitland G C Rigby M Smith E B Wakeham W A Intermolecular
Forces Their Origin and Determination Clarendon Press Oxford 1981
29 Israelachvili J Intermolecular and Surface Forces Third Edition Academic
Press 2010
30 London F The general theory of molecular forces Trans Faraday Soc 1937
33 8b-26
31 Spencer N D Moore J H Encyclopedia of Chemical Physics and Physical
Chemistry Fundamentals 1 ed Taylor amp Francis 2001pp 1004
32 Welch G W A Karamertzanis P G Misquitta A J Stone A J Price S L
Is the induction energy important for modeling organic crystals J Chem Theory
Comput 2008 4 (3) 522-532
33 Price S L From crystal structure prediction to polymorph prediction interpreting
the crystal energy landscape Phys Chem Chem Phys 2008 10 (15) 1996-2009
34 Price S L Leslie M Welch G W A Habgood M Price L S
Karamertzanis P G Day G M Modelling Organic Crystal Structures using
Distributed Multipole and Polarizability-Based Model Intermolecular Potentials
Phys Chem Chem Phys 2010 12 (30) 8478-8490
35 Freitag M A Gordon M S Jensen J H Stevens W J Evaluation of charge
penetration between distributed multipolar expansions J Chem Phys 2000 112
(17) 7300-7306
36 Lund A M Orendt A M Pagola G I Ferraro M B Facelli J C
Optimization of Crystal Structures of Archetypical Pharmaceutical Compounds
A Plane-Wave DFT-D Study Using Quantum Espresso Crystal Growth amp Design
2013 13 (5) 2181-2189
37 Neumann M A Perrin M A Energy ranking of molecular crystals using
density functional theory calculations and an empirical van der Waals correction
J Phys Chem B 2005 109 (32) 15531-15541
38 Cox S R Hsu L Y Williams D E Nonbonded Potential Function Models for
Crystalline Oxohydrocarbons Acta Crystallogr Sect A 1981 37 (MAY) 293-
301
Bibliography
166
39 Williams D E Cox S R Nonbonded Potentials For Azahydrocarbons the
Importance of the Coulombic Interaction Acta Crystallogr Sect B 1984 40 (8)
404-417
40 Coombes D S Price S L Willock D J Leslie M Role of Electrostatic
Interactions in Determining the Crystal Structures of Polar Organic Molecules A
Distributed Multipole Study J Phys Chem 1996 100 (18) 7352-7360
41 Gavezzotti A Theoretical Aspects and Computer Modeling of the Molecular
Solid State John Wiley Chichester 1997 Vol 1
42 Filippini G Gavezzotti A Empirical Intermolecular Potentials For Organic-
Crystals the 6-Exp Approximation Revisited Acta Crystallogr Sect B 1993
B49 868-880
43 Williams D E Weller R R Lone-Pair Electronic Effects On the Calculated
Abinitio Scf-Mo Electric-Potential and the Crystal-Structures of Azabenzenes J
Am Chem Soc 1983 105 (13) 4143-4148
44 Karamertzanis P G Pantelides C C Optimal site charge models for molecular
electrostatic potentials Mol Simulat 2004 30 (7) 413-436
45 Spackman M A Molecular Electric Moments from X-ray Diffraction Data
Chem Rev 1992 92 1769-1797
46 Breneman C M Wiberg K B Determining Atom-Centered Monopoles From
Molecular Electrostatic Potentials - the Need For High Sampling Density in
Formamide Conformational-Analysis J Comput Chem 1990 11 (3) 361-373
47 Francl M M Carey C Chirlian L E Gange D M Charges fit to electrostatic
potentials II Can atomic charges be unambiguously fit to electrostatic potentials
J Comput Chem 1996 17 (3) 367-383
48 Stone A J Alderton M Distributed Multipole Analysis - Methods and
Applications Molecular Physics 1985 56 (5) 1047-1064
49 Welch G W A The induction contribution to the lattice energy of organic
crystals PhD 2010
50 Stone A J Distributed Multipole Analysis or How to Describe a Molecular
Charge Distribution Chemical Physics Letters 1981 83 (2) 233-239
51 Stone A J Distributed multipole analysis Stability for large basis sets J Chem
Theory Comput 2005 1 (6) 1128-1132
52 GDMA A Program for Performing Distributed Multipole Analysis of Wave
Functions Calculated Using the Gaussian Program System version 22
University of Cambridge Cambridge United Kingdom 2010
53 Gaussian 03 Gaussian Inc Wallingford CT 2004
Bibliography
167
54 GDMA A Program for Performing Distributed Multipole Analysis of Wave
Functions Calculated Using the Gaussian Program System version 10
University of Cambridge Cambridge United Kingdom 1999
55 Price S L Computational prediction of organic crystal structures and
polymorphism Int Rev Phys Chem 2008 27 (3) 541-568
56 Kazantsev A V Molecular Flexibility in Crystal Structure Prediction PhD
Imperial College London 2011
57 Smith W Point multipoles in the Ewald summation CCP5 Quarterly 1982 4
13-25
58 Cruz-Cabeza A J Bernstein J Conformational Polymorphism Chem Rev
2014 114 (4) 2170-2191
59 Cornell W D Cieplak P Bayly C I Gould I R Merz K M Ferguson D
M Spellmeyer D C Fox T Caldwell J W Kollman P A A Second
Generation Force-Field For the Simulation of Proteins Nucleic-Acids and
Organic-Molecules (Vol 117 Pg 5179 1995) J Am Chem Soc 1996 118 (9)
2309
60 van Mourik T Karamertzanis P G Price S L Molecular conformations and
relative stabilities can be as demanding of the electronic structure method as
intermolecular calculations J Phys Chem A 2006 110 (1) 8-12
61 van Mourik T Assessment of Density Functionals for Intramolecular Dispersion-
Rich Interactions J Chem Theory Comput 2008 4 (10) 1610-1619
62 Comba P Hambley T W Martin B Molecular modeling of inorganic
compounds John Wiley amp Sons 2009
63 Leach A R Molecular Modelling Principles and Applications Longman
Harlow 1996
64 Goodman J M Chemical Applications of Molecular Modelling Royal Society
of Chemistry Cambridge UK 1998
65 Brodersen S Wilke S Leusen F J J Engel G A study of different
approaches to the electrostatic interaction in force field methods for organic
crystals Phys Chem Chem Phys 2003 5 (21) 4923-4931
66 Lommerse J P M Motherwell W D S Ammon H L Dunitz J D
Gavezzotti A Hofmann D W M Leusen F J J Mooij W T M Price S
L Schweizer B Schmidt M U van Eijck B P Verwer P Williams D E
A test of crystal structure prediction of small organic molecules Acta Crystallogr
Sect B 2000 56 697-714
67 Motherwell W D S Ammon H L Dunitz J D Dzyabchenko A Erk P
Gavezzotti A Hofmann D W M Leusen F J J Lommerse J P M Mooij
W T M Price S L Scheraga H Schweizer B Schmidt M U van Eijck
Bibliography
168
B P Verwer P Williams D E Crystal structure prediction of small organic
molecules a second blind test Acta Crystallogr Sect B 2002 58 647-661
68 Ponder J W Case D A Force fields for protein simulations Protein
Simulations 2003 66 27-86
69 Cornell W D Howard A E Kollman P Molecular mechanical potential
functions and their application to study molecular systems Current Opinion in
Structural Biology 1991 201-212 Curr Opin Struc Biol 1991 1 (2) 201-212
70 Comba P Hambley T W Martin B Molecular modeling of inorganic
compounds 2009 3rd completely rev and enlarged ed
71 Kazantsev A V Karamertzanis P G Adjiman C S Pantelides C C
CrystalOptimizer An efficient Algorithm for Lattice Energy Minimisation of
Organic Crystal using Isolated-Molecule Quantum Mechanical Calculations In
Molecular System Engineering Adjiman C S Galindo A Eds WILEY-VCH
Verlag GmbH amp Co Weinheim 2010 Vol 6 pp 1-42
72 Kazantsev A V Karamertzanis P G Adjiman C S Pantelides C C
Efficient Handling of Molecular Flexibility in Lattice Energy Minimization of
Organic Crystals J Chem Theory Comput 2011 7 (6) 1998-2016
73 Jones J E On the Determination of Molecular Fields II From the Equation of
State of a Gas Proceedings of the Royal Society of London Series A 1924 106
(738) 463-477
74 Weiner S J Kollman P A Case D A Singh U C Ghio C Alagona G
Profeta S Weiner P A New Force-Field for Molecular Mechanical Simulation
of Nucleic-Acids and Proteins J Am Chem Soc 1984 106 (3) 765-784
75 Momany F A McGuire R F Burgess A W Scheraga H A Energy
parameters in polypeptides VII Geometric parameters partial atomic charges
nonbonded interactions hydrogen bond interactions and intrinsic torsional
potentials for the naturally occurring amino acids J Phys Chem 1975 79 (22)
2361-2381
76 Nemethy G Pottle M S Scheraga H A Energy parameters in polypeptides
9 Updating of geometrical parameters nonbonded interactions and hydrogen
bond interactions for the naturally occurring amino acids J Phys Chem 1983
87 (11) 1883-1887
77 Hagler A T Lifson S Energy functions for peptides and proteins II Amide
hydrogen bond and calculation of amide crystal properties J Am Chem Soc
1974 96 (17) 5327-5335
78 Hagler A T Huler E Lifson S Energy functions for peptides and proteins I
Derivation of a consistent force field including the hydrogen bond from amide
crystals J Am Chem Soc 1974 96 (17) 5319-5327
Bibliography
169
79 Jorgensen W L Quantum and statistical mechanical studies of liquids 10
Transferable intermolecular potential functions for water alcohols and ethers
Application to liquid water J Am Chem Soc 1981 103 (2) 335-340
80 Wang J M Wolf R M Caldwell J W Kollman P A Case D A
Development and testing of a general amber force field J Comput Chem 2004
25 (9) 1157-1174
81 Brooks B R Bruccoleri R E Olafson B D States D J Swaminathan S
Karplus M CHARMM A Program for Macromolecular Energy Minimization
and Dynamics Calculations J Comput Chem 1983 4 (2) 187-217
82 Becker O M Computational biochemistry and biophysics M Dekker New
York 2001
83 MacKerell A D Bashford D Bellott Dunbrack R L Evanseck J D Field
M J Fischer S Gao J Guo H Ha S Joseph-McCarthy D Kuchnir L
Kuczera K Lau F T K Mattos C Michnick S Ngo T Nguyen D T
Prodhom B Reiher W E Roux B Schlenkrich M Smith J C Stote R
Straub J Watanabe M Wiorkiewicz-Kuczera J Yin D Karplus M All-
Atom Empirical Potential for Molecular Modeling and Dynamics Studies of
Proteins J Phys Chem B 1998 102 (18) 3586-3616
84 Vanommeslaeghe K Hatcher E Acharya C Kundu S Zhong S Shim J
Darian E Guvench O Lopes P Vorobyov I Mackerell A D CHARMM
general force field A force field for drug-like molecules compatible with the
CHARMM all-atom additive biological force fields J Comput Chem 2010 31
(4) 671-690
85 Jorgensen W L Tirado-Rives J Potential energy functions for atomic-level
simulations of water and organic and biomolecular systems P Natl Acad Sci
USA 2005 102 (19) 6665-6670
86 Allinger N L Chen K Lii J H An improved force field (MM4) for saturated
hydrocarbons J Comput Chem 1996 17 (5-6) 642-668
87 Halgren T A Merck molecular force field 1 Basis form scope
parameterization and performance of MMFF94 J Comput Chem 1996 17 (5-
6) 490-519
88 Allinger N L Conformational analysis 130 MM2 A hydrocarbon force field
utilizing V1 and V2 torsional terms J Am Chem Soc 1977 99 (25) 8127-8134
89 Caleman C van Maaren P J Hong M Hub J S Costa L T van der Spoel
D Force Field Benchmark of Organic Liquids Density Enthalpy of
Vaporization Heat Capacities Surface Tension Isothermal Compressibility
Volumetric Expansion Coefficient and Dielectric Constant J Chem Theory
Comput 2011 8 (1) 61-74
90 Stouch T R The errors of our ways taking account of error in computer-aided
drug design to build confidence intervals for our next 25 years J Comput -Aided
Mol Des 2012 26 (1) 125-134
Bibliography
170
91 Ponder J W Wu C J Ren P Y Pande V S Chodera J D Schnieders M
J Haque I Mobley D L Lambrecht D S DiStasio R A Head-Gordon
M Clark G N I Johnson M E Head-Gordon T Current Status of the
AMOEBA Polarizable Force Field J Phys Chem B 2010 114 (8) 2549-2564
92 Day G M Motherwell W D S Jones W Beyond the isotropic atom model in
crystal structure prediction of rigid molecules Atomic multipoles versus point
charges Cryst Growth Des 2005 5 (3) 1023-1033
93 Marshall G R Limiting assumptions in molecular modeling electrostatics J
Comput -Aided Mol Des 2013 27 (2) 107-114
94 Payne R S Rowe R C Roberts R J Charlton M H Docherty R Potential
polymorphs of aspirin J Comput Chem 1999 20 (2) 262-273
95 Gourlay M D Kendrick J Leusen F J J Rationalization of racemate
resolution Predicting spontaneous resolution through crystal structure prediction
Cryst Growth Des 2007 7 (1) 56-63
96 Uzoh O G Analytically Modelling Intramolecular Energies of Fenamic and
Tolfenamic Acids Unpublished Work 2013
97 NAG Fortran Library Routine Document G02DDF Oxford United Kingdom
1989
98 Beran G J Hirata S Fragment and localized orbital methods in electronic
structure theory Physical Chemistry Chemical Physics 2012 14 (21) 7559-7561
99 Orio M Pantazis D A Neese F Density functional theory Photosynthesis
Research 2009 102 (2-3) 443-453
100 Sherrill C D An introduction to Hartree-Fock molecular orbital theory School
of Chemistry and Biochemistry Georgia Institute of Technology 2000
101 Shaik S S Hiberty P C A chemists guide to valence bond theory John Wiley
amp Sons 2007
102 Wu W Su P F Shaik S Hiberty P C Classical Valence Bond Approach by
Modern Methods Chem Rev 2011 111 (11) 7557-7593
103 Gasteiger J Engel T Chemoinformatics a textbook John Wiley amp Sons 2006
104 Fukui K Yonezawa T Shingu H A Molecular Orbital Theory of Reactivity in
Aromatic Hydrocarbons J Chem Phys 1952 20 (4) 722-725
105 Bell S Dines T J Chowdhry B Z Withnall R Computational chemistry
using modern electronic structure methods J Chem Educ 2007 84 (8) 1364-
1370
106 Moller C Plesset M S Note on an approximation treatment for many-electron
systems Phys Rev 1934 46 618-622
Bibliography
171
107 Valdes H Klusak V Pitonak M Exner O Stary I Hobza P Rulisek L
Evaluation of the intramolecular basis set superposition error in the calculations
of larger molecules [n]Helicenes and Phe-Gly-Phe tripeptide J Comput Chem
2008 29 (6) 861-870
108 Simon S Duran M Dannenberg J J How does basis set superposition error
change the potential surfaces for hydrogen bonded dimers Journal of Chemical
Physics 1996 105 (24) 11024-11031
109 Szczesniak M M Scheiner S Correction of the Basis Set Superposition Error
in SCF and MP2 Interaction Energies - the Water Dimer J Chem Phys 1986 84
(11) 6328-6335
110 Stephens P J Devlin F J Chabalowski C F Frisch M J Ab-Initio
Calculation of Vibrational Absorption and Circular-Dichroism Spectra Using
Density-Functional Force-Fields J Phys Chem 1994 98 (45) 11623-11627
111 Car R Introduction to density-functional theory and ab-initio molecular
dynamics Quant Struct -Act Rel 2002 21 (2) 97-104
112 Grimme S Antony J Schwabe T Muck-Lichtenfeld C Density functional
theory with dispersion corrections for supramolecular structures aggregates and
complexes of (bio)organic molecules Organic amp Biomolecular Chemistry 2007
5 (5) 741-758
113 Kohn W Becke A D Parr R G Density functional theory of electronic
structure J Phys Chem 1996 100 (31) 12974-12980
114 Hohenberg P Kohn W Inhomogeneous Electron Gas Physical Review B 1964
136 (3B) B864-B871
115 Kohn W Sham L J Self-consistent equations including exchange and
correlation effects Phys Rev 1965 140 (4A) A1133
116 Becke A D Density-Functional Thermochemistry 3 the Role of Exact
Exchange J Chem Phys 1993 98 (7) 5648-5652
117 Lee C T Yang W T Parr R G Development of the Colle-Salvetti
Correlation-Energy Formula Into A Functional of the Electron-Density Phys
Rev B 1988 37 (2) 785-789
118 Adamo C Barone V Toward reliable density functional methods without
adjustable parameters The PBE0 model J Chem Phys 1999 110 (13) 6158-
6170
119 Sherrill C D Introduction to Electron Correlation School of Chemistry and
Biochemistry Georgia Institute of Technology 2008
120 Grafenstein J Cremer D An efficient algorithm for the density-functional
theory treatment of dispersion interactions J Chem Phys 2009 130 (12)
Bibliography
172
121 Grimme S Density functional theory with London dispersion corrections Wiley
Interdisciplinary Reviews-Computational Molecular Science 2011 1 (2) 211-
228
122 Grimme S Antony J Ehrlich S Krieg H A consistent and accurate ab initio
parametrization of density functional dispersion correction (DFT-D) for the 94
elements H-Pu J Chem Phys 2010 132 (15) 154104
123 Brown T L Chemistry The Central Science Pearson Education 2009
124 Gavezzotti A Filippini G Polymorphic Forms of Organic-Crystals at Room
Conditions - Thermodynamic and Structural Implications J Am Chem Soc
1995 117 (49) 12299-12305
125 Karamertzanis P G Prediction of crystal structure of molecular solids PhD
Imperial College London 2004
126 Karamertzanis P G Pantelides C C Ab initio crystal structure prediction II
Flexible molecules Mol Phys 2007 105 (2-3) 273-291
127 Vasileiadis M Kazantsev A V Karamertzanis P G Adjiman C S
Pantelides C C The polymorphs of ROY application of a systematic crystal
structure prediction technique Acta Crystallogr Sect B 2012 68 (6) 677-685
128 Sobol I M On the distribution of points in a cube and the approximate evaluation
of integrals USSR Comp Math Math Phys 1967 7 86-112
129 The NAG Fortran Library Oxford United Kingdom 2013
130 Karamertzanis P G Price S L Energy Minimization of Crystal Structures
Containing Flexible Molecules J Chem Theory Comput 2006 2 (4) 1184-1199
131 Cooper T G Hejczyk K E Jones W Day G M Molecular Polarization
Effects on the Relative Energies of the Real and Putative Crystal Structures of
Valine J Chem Theory Comput 2008 4 (10) 1795-1805
132 Mennucci B Tomasi J Continuum solvation models A new approach to the
problem of solutes charge distribution and cavity boundaries J Chem Phys
1997 106 (12) 5151-5158
133 Habgood M Price S L Portalone G Irrera S Testing a Variety of Electronic-
Structure-Based Methods for the Relative Energies of 5-Formyluracil Crystals J
Chem Theory Comput 2011 7 (9) 2685-2688
134 Karamertzanis P G Pantelides C C Ab initio crystal structure prediction - I
Rigid molecules Journal of Computational Chemistry 2005 26 (3) 304-324
135 Williams D E Improved intermolecular force field for molecules containing H
C N and O atoms with application to nucleoside and peptide crystals J Comput
Chem 2001 22 (11) 1154-1166
Bibliography
173
136 Day G M Motherwell W D S Jones W A strategy for predicting the crystal
structures of flexible molecules the polymorphism of phenobarbital Physical
Chemistry Chemical Physics 2007 9 (14) 1693-1704
137 Kendrick J Leusen F J Neumann M A van de Streek J Progress in Crystal
Structure Prediction Chemistry - A European Journal 2011 17 (38) 10735-
10743
138 Braun D E Karamertzanis P G Price S L Which if any hydrates will
crystallise Predicting hydrate formation of two dihydroxybenzoic acids Chem
Commun 2011 47 (19) 5443-5445
139 Cruz-Cabeza A J Karki S Fabian L Friscic T Day G M Jones W
Predicting stoichiometry and structure of solvates Chem Commun 2010 46 (13)
2224-2226
140 Karamertzanis P G Kazantsev A V Issa N Welch G W A Adjiman C
S Pantelides C C Price S L Can the Formation of Pharmaceutical Co-
Crystals Be Computationally Predicted II Crystal Structure Prediction J Chem
Theory Comput 2009 5 (5) 1432-1448
141 Issa N Barnett S A Mohamed S Braun D E Copley R C B Tocher D
A Price S L Screening for cocrystals of succinic acid and 4-aminobenzoic acid
CrystEngComm 2012 14 (7) 2454-2464
142 Cruz-Cabeza A J Day G M Jones W Structure prediction disorder and
dynamics in a DMSO solvate of carbamazepine Phys Chem Chem Phys 2011
13 (28) 12808-12816
143 Habgood M Form II Caffeine A Case Study for Confirming and Predicting
Disorder in Organic Crystals Cryst Growth Des 2011 11 (8) 3600-3608
144 Torrisi A Leech C K Shankland K David W I F Ibberson R M Benet-
Buchholz J Boese R Leslie M Catlow C R A Price S L The solid phases
of cyclopentane a combined experimental and simulation study J Phys Chem
B 2008 112 (12) 3746-3758
145 Braun D E Karamertzanis P G Arlin J B Florence A J Kahlenberg V
Tocher D A Griesser U J Price S L Solid-State Forms of beta-Resorcylic
Acid How Exhaustive Should a Polymorph Screen Be Cryst Growth Des 2011
11 (1) 210-220
146 Llinas A Goodman J M Polymorph Control past present and future Drug
Discover Today 2008 13 (56) 198-210
147 Arlin J B Price L S Price S L Florence A J A strategy for producing
predicted polymorphs catemeric carbamazepine form V Chem Commun 2011
47 (25) 7074-7076
148 Maddox J Crystals from first Principles Nature 1988 335 (6187) 201
Bibliography
174
149 Day G M Motherwell W D S Ammon H L Boerrigter S X M Della
Valle R G Venuti E Dzyabchenko A Dunitz J D Schweizer B van Eijck
B P Erk P Facelli J C Bazterra V E Ferraro M B Hofmann D W M
Leusen F J J Liang C Pantelides C C Karamertzanis P G Price S L
Lewis T C Nowell H Torrisi A Scheraga H A Arnautova Y A Schmidt
M U Verwer P A third blind test of crystal structure prediction Acta
Crystallogr Sect B 2005 61 (5) 511-527
150 Collins A Wilson C C Gilmore C J Comparing entire crystal structures
using cluster analysis and fingerprint plots CrystEngComm 2010 12 (3) 801-
809
151 Chisholm J A Motherwell S COMPACK a program for identifying crystal
structure similarity using distances J Appl Crystallogr 2005 38 228-231
152 Asmadi A Kendrick J Leusen F J J Crystal Structure Prediction and
Isostructurality of Three Small Molecules Chem Eur J 2010 16 (42) 12701-
12709
153 Macrae C F Bruno I J Chisholm J A Edgington P R McCabe P
Pidcock E Rodriguez-Monge L Taylor R van de Streek J Wood P A
Mercury CSD 20 - new features for the visualization and investigation of crystal
structures J Appl Crystallogr 2008 41 466-470
154 Chisholm J A Motherwell S A new algorithm for performing three-
dimensional searches of the Cambridge Structural Database J Appl Crystallogr
2004 37 331-334
155 Gelbrich T Hursthouse M B Systematic investigation of the relationships
between 25 crystal structures containing the carbamazepine molecule or a close
analogue a case study of the XPac method CrystEngComm 2006 8 (6) 448-460
156 Gelbrich T Hursthouse M B A versatile procedure for the identification
description and quantification of structural similarity in molecular crystals
CrystEngComm 2005 7 324-336
157 McKinnon J J Spackman M A Mitchell A S Novel tools for visualizing and
exploring intermolecular interactions in molecular crystals Acta Crystallogr
Sect B 2004 60 627-668
158 Spackman M A McKinnon J J Fingerprinting intermolecular interactions in
molecular crystals CrystEngComm 2002 378-392
159 Parkin A Barr G Dong W Gilmore C G Jayatilaka D McKinnon J J
Spackman M A Wilson C C Comparing entire crystal structures structural
genetic fingerprinting CrystEngComm 2007 9 648-652
160 McKinnon J J Mitchell A S Spackman M A Hirshfeld surfaces A new tool
for visualising and exploring molecular crystals Chem Eur J 1998 4 (11) 2136-
2141
Bibliography
175
161 Etter M C MacDonald J C Bernstein J Graph-Set Analysis of Hydrogen-
Bond Patterns in Organic- Crystals Acta Crystallogr Sect B 1990 46 256-262
162 Grell J Bernstein J Tinhofer G Graph-set analysis of hydrogen-bond patterns
some mathematical concepts Acta Crystallogr Sect B 1999 55 1030-1043
163 Press W H Flannery B P Teukolsky S A Vetterling W T Numerical
methods the art of scientific computing (Fortran version) Cambridge University
Press Cambridge 1989
164 Galek P T A Novel comparison of crystal packing by moments of inertia
CrystEngComm 2011 13 (3) 841-849
165 Bonnet P A Streek J v d Trask A V Motherwell W D S Jones W The
crystal structure of an unstable polymorph of beta-D-allose CrystEngComm
2004 6 (86) 535-539
166 Potter B S Palmer R A Withnall R Chowdhry B Z Price S L Aza
analogues of nucleic acid bases experimental determination and computational
prediction of the crystal structure of anhydrous 5-azauracil J Mol Struct 1999
486 349-361
167 Nowell H Frampton C S Waite J Price S L Blind crystal structure
prediction of a novel second polymorph of 1-hydroxy-7-azabenzotriazole Acta
Crystallogr Sect B 2006 62 (4) 642-650
168 DOria E Karamertzanis P G Price S L Spontaneous Resolution of
Enantiomers by Crystallization Insights from Computed Crystal Energy
Landscapes Cryst Growth Des 2010 10 (4) 1749-1756
169 Thornber C W Isosterism and molecular modification in drug design Chem
Soc Rev 1979 8 (4) 563-580
170 Singh H Singh Chawla A Kapoor V K Paul D Malhotra R K 4
Medicinal Chemistry of Tetrazoles In Progress in Medicinal Chemistry Volume
17 ed Ellis and G P Ed Elsevier 1980 pp 151-183
171 Lipinski C A Chapter 27 Bioisosterism in Drug Design In Annual Reports in
Medicinal Chemistry Volume 21 ed Denis M B Ed Academic Press 1986
pp 283-291
172 SHELXL97 University of Goumlttingen Goumlttingen Germany 1997
173 Sheldrick G M A short history of SHELX Acta Crystallogr Sect A 2008 64
(1) 112-122
174 Farrugia L WinGX suite for small-molecule single-crystal crystallography J
Appl Crystallogr 1999 32 (4) 837-838
175 Ladd M F C Palmer R A Structure Determination by X-Ray Crystallography
Springer 2003
Bibliography
176
176 Khan S A Reshak A H First Principle Study of Electronic Structure Chemical
Bonding and Optical Properties of 5-azido-1H-tetrazole International Journal of
Electrochemical Science 2013 8 (7) 9459-9473
177 Desiraju G R Hydrogen bridges in crystal engineering Interactions without
borders Accounts Chem Res 2002 35 (7) 565-573
178 Herrebout W A Suhm M A Weak hydrogen bonds - strong effects Phys
Chem Chem Phys 2011 13 (31)
179 Schmidt M W Baldridge K K Boatz J A Elbert S T Gordon M S
Jensen J H Koseki S Matsunaga N Nguyen K A Su S Windus T L
Dupuis M Montgomery J A General Atomic and Molecular Electronic
Structure Systems J Comput Chem 1993 14 1347-1363
180 Cossi M Scalmani G Rega N Barone V New developments in the
polarizable continuum model for quantum mechanical and classical calculations
on molecules in solution J Chem Phys 2002 117 (1) 43-45
181 An email message sent Febrary 2012 to Rex Palmer stated the following we
would be delighted if it were 2nd_23res P21 a = 79 or 1st_120res P21c a =
100 as our two lowest energy structures
182 Allen F H The Cambridge Structural Database A quarter of a million crystal
structures and rising Acta Crystallogr Sect B 2002 58 (3) 380-388
183 Thakur T S Desiraju G R Crystal Structure Prediction of a Co-Crystal Using
a Supramolecular Synthon Approach 2-Methylbenzoic Acid-2-Amino-4-
methylpyrimidine Cryst Growth Des 2008 8 (11) 4031-4044
184 Surov A O Perlovich G L Thermodynamics of sublimation thermophysical
and structural aspects of the molecular crystals of fenamates J Struct Chem
2010 51 (2) 308-315
185 Li H Stowell J G Borchardt T B Byrn S R Synthesis Conformational
Polymorphism and Construction of a GT Diagram of 2-[(2-Nitrophenyl)amino]-
3-thiophenecarbonitrile Cryst Growth Des 2006 6 (11) 2469-2474
186 Pagola S Stephens P W He X Byrn S R Crystal structure solution of the
dark red light red and orange pollymorphs of 5-methyl-2-[(2-nitro-4-
methylphenyl)amino]-3-thiophenecarbonitrile by high resolution X-ray powder
diffraction and simulated annealing techniques Delhez R Mittemeijer E J
Eds 2001 pp 789-794
187 Zhou T Li F Fan Y Song W Mu X Zhang H Wang Y Hydrogen-
bonded dimer stacking induced emission of aminobenzoic acid compounds
Chem Commun 2009 (22) 3199-3201
188 Mei X F August A T Wolf C Regioselective copper-catalyzed amination of
chlorobenzoic acids Synthesis and solid-state structures of N-aryl anthranilic acid
derivatives Journal of Organic Chemistry 2006 71 (1) 142-149
Bibliography
177
189 Alvarez A J Singh A Myerson A S Polymorph Screening Comparing a
Semi-Automated Approach with a High Throughput Method Cryst Growth Des
2009 9 (9) 4181-4188
190 SeethaLekshmi S Guru Row T N Conformational polymorphism in a non-
steroidal anti-inflammatory drug mefenamic acid Cryst Growth Des 2012 12
(8) 4283-4289
191 Dokorou V Kovala-Demertzi D Jasinski J P Galani A Demertzis M A
Synthesis Spectroscopic Studies and Crystal Structures of Phenylorganotin
Derivatives with [Bis(26-dimethylphenyl)amino]benzoic Acid Novel
Antituberculosis Agents Helv Chim Acta 2004 87 (8) 1940-1950
192 Bernstein J Polymorphism - A Perspective Cryst Growth Des 2011 11 (3)
632-650
193 Yu L Stephenson G A Mitchell C A Bunnell C A Snorek S V Bowyer
J J Borchardt T B Stowell J G Byrn S R Thermochemistry and
Conformational Polymorphism of a Hexamorphic Crystal System J Am Chem
Soc 2000 122 (4) 585-591
194 Yang S S Guillory J K Polymorphism in sulfonamides J Pharm Sci 1972
61 (1) 26-40
195 Rossi D Gelbrich T Kahlenberg V Griesser U J Supramolecular constructs
and thermodynamic stability of four polymorphs and a co-crystal of pentobarbital
(nembutal) CrystEngComm 2012 14 (7) 2494-2506
196 Lutker K M Matzger A J Crystal polymorphism in a carbamazepine
derivative Oxcarbazepine J Pharm Sci 2010 99 (2) 794-803
197 Costantino L Barlocco D Privileged Structures as Leads in Medicinal
Chemistry Current Medicinal Chemistry 2006 13 (1) 65-85
198 Keinaumlnen S Similauml S Kouvalainen K Oral antipyretic therapy Evaluation of the
N-aryl-anthranilic acid derivatives mefenamic acid tolfenamic acid and
flufenamic acid Eur J Clin Pharmacol 1978 13 (5) 331-334
199 Andersen K V Larsen S Alhede B Gelting N Buchardt O
Characterization of two polymorphic forms of tolfenamic acid N-(2-methyl-3-
chlorophenyl)anthranilic acid their crystal structures and relative stabilities J
Chem Soc Perkin Trans 2 1989 (10) 1443-1447
200 Mattei A Li T Polymorph Formation and Nucleation Mechanism of
Tolfenamic Acid in Solution An Investigation of Pre-nucleation Solute
Association Pharmaceut Res 2012 29 (2) 460-470
201 Surov A O Szterner P Zielenkiewicz W Perlovich G L Thermodynamic
and structural study of tolfenamic acid polymorphs J Pharm Biomed Anal
2009 50 (5) 831-840
Bibliography
178
202 Brittain H G Polymorphism in Pharmaceutical Solids Informa Healthcare New
York London 2009 Vol 192
203 van de Streek J Motherwell S Searching the Cambridge Structural Database
for polymorphs Acta Crystallogr Sect B 2005 61 504-510
204 Desiraju G R Polymorphism The same and not quite the same Cryst Growth
Des 2008 8 (1) 3-5
205 Bhatt P M Desiraju G R Tautomeric polymorphism in omeprazole Chem
Commun 2007 (20) 2057-2059
206 de Gelder R Wehrens R Hageman J A A generalized expression for the
similarity of spectra Application to powder diffraction pattern classification J
Comput Chem 2001 22 (3) 273-289
207 Bruno I J Cole J C Edgington P R Kessler M Macrae C F McCabe
P Pearson J Taylor R New software for searching the Cambridge Structural
Database and visualizing crystal structures Acta Crystallogr Sect B 2002 58
389-397
208 Allen F H Taylor R Research applications of the Cambridge Structural
Database (CSD) Chem Soc Rev 2004 33 (8) 463-475
209 Kazantsev A V Karamertzanis P G Adjiman C S Pantelides C C Price
S L Galek P T A Day G M Cruz-Cabeza A J Successful Prediction of a
Model Pharmaceutical in the Fifth Blind Test of Crystal Structure Prediction Int
J Pharm 2011 418 (2) 168-178
210 Macrae C F Edgington P R McCabe P Pidcock E Shields G P Taylor
R Towler M van de Streek J Mercury visualization and analysis of crystal
structures J Appl Crystallogr 2006 39 453-457
211 Mattei A Li T L Interplay between molecular conformation and
intermolecular interactions in conformational polymorphism A molecular
perspective from electronic calculations of tolfenamic acid Int J Pharm 2011
418 (2) 179-186
212 Habgood M Grau-Crespo R Price S L Substitutional and orientational
disorder in organic crystals a symmetry-adapted ensemble model Phys Chem
Chem Phys 2011 13 (20) 9590-9600
213 Lancaster R W Karamertzanis P G Hulme A T Tocher D A Lewis T
C Price S L The Polymorphism of Progesterone Stabilization of a
Disappearing Polymorph by Co-Crystallization J Pharm Sci 2007 96 (12)
3419-3431
214 Gavezzotti A The Calculation of Molecular Volumes and the Use of Volume
Analysis in the Investigation of Structured Media and of Solid-State Organic-
Reactivity J Am Chem Soc 1983 105 (16) 5220-5225
Bibliography
179
215 The Free Dictionary defines herringbone as a way of assembling in a diagonal
zigzag manner
216 Desiraju G R On the presence of multiple molecules in the crystal asymmetric
unit (Z gt 1) CrystEngComm 2007 9 (1) 91-92
217 Anderson K M Steed J W Comment on On the presence of multiple
molecules in the crystal asymmetric unit (Z gt 1) by Gautam R Desiraju
CrystEngComm 2007 9 91 CrystEngComm 2007 9 (4) 328-330
218 Delaney S P Smith T M Pan D Yin S Korter T M Cryogenic Phase
Transition in Crystalline Aripiprazole Leads to an Eighth Polymorph Cryst
Growth Des 2014
219 From private communication with Rona Watson at University College London
220 Thompson H P G Day G M Which conformations make stable crystal
structures Mapping crystalline molecular geometries to the conformational
energy landscape Chem Sci 2014 5 (8) 3173-3182
221 Mo Y Gao J Theoretical Analysis of the Rotational Barrier of Ethane Accounts
Chem Res 2007 40 (2) 113-119
222 Pophristic V Goodman L Hyperconjugation not steric repulsion leads to the
staggered structure of ethane Nature 2001 411 (6837) 565-568
223 Halpern A M Glendening E D An intrinsic reaction coordinate calculation of
the torsional potential in ethane Comparison of the computationally and
experimentally derived torsional transitions and the rotational barrier Journal of
Chemical Physics 2003 119 (21) 11186-11191
224 Mulliken R S Intensities of Electronic Transitions in Molecular Spectra IV
Cyclic Dienes and Hyperconjugation 2004 7 (5) 339-352
225 Mo Y Song L Lin Y Block-Localized Wavefunction (BLW) Method at the
Density Functional Theory (DFT) Level J Phys Chem A 2007 111 (34) 8291-
8301
226 Brunck T K Weinhold F Quantum-Mechanical Studies on the Origin of
Barriers to Internal-Rotation About Single Bonds J Am Chem Soc 1979 101
(7) 1700-1709
227 Pendas A Blanco M Francisco E Steric Repulsions Rotation Barriers and
Stereoelectronic Effects A Real Space Perspective J Comput Chem 2009 30
(1) 98-109
228 Surov A O Perlovich G L Emelyanenko V N Verevkin S P
Thermochemistry of Drugs Experimental and First-Principles Study of
Fenamates J Chem Eng Data 2011 56 (12) 4325-4332
229 GaussView version 5 2009
Bibliography
180
230 Clark M Cramer R D Van Opdenbosch N Validation of the general purpose
tripos 52 force field J Comput Chem 1989 10 (8) 982-1012
231 Gavezzotti A Filippini G Geometry of the Intermolecular X-HY (X Y=N
O) Hydrogen- Bond and the Calibration of Empirical Hydrogen-Bond Potentials
J Phys Chem 1994 98 (18) 4831-4837
232 Gavezzotti A Are Crystal-Structures Predictable Accounts Chem Res 1994 27
(10) 309-314
233 Mercury version 31 2013
234 Lozano J J Pouplana R Loacutepez M Ruiz J Conformational analysis of the
antiinflammatory fenamates a molecular mechanics and semiempirical molecular
orbital study Journal of Molecular Structure THEOCHEM 1995 335 (13)
215-227
235 Rappe A K Casewit C J Colwell K S Goddard W A Skiff W M Uff a
Full Periodic-Table Force-Field For Molecular Mechanics and Molecular-
Dynamics Simulations J Am Chem Soc 1992 114 (25) 10024-10035
236 Jorgensen W L Tirado-Rives J The OPLS potential functions for proteins
energy minimizations and crystals of cyclic peptides and crambin J Am Chem
Soc 1988 110 (6) 1657-1666
237 Hopkins C W Roitberg A E Fitting of Dihedral Terms in Classical Force
Fields as an Analytic Linear Least-Squares Problem J Chem Inf Model 2014
54 (7) 1978-1986
238 Wheatley R J Price S L An Overlap Model For Estimating the Anisotropy of
Repulsion Mol Phys 1990 69 (3) 507-533
239 Totton T S Misquitta A J Kraft M A First Principles Development of a
General Anisotropic Potential for Polycyclic Aromatic Hydrocarbons J Chem
Theory Comput 2010 6 (3) 683-695
240 Sorescu D C Rice B M Thompson D L Intermolecular potential for the
hexahydro-135-trinitro-135-s- triazine crystal (RDX) A crystal packing
Monte Carlo and molecular dynamics study J Phys Chem B 1997 101 (5) 798-
808
241 Williams D E Houpt D J Fluorine Nonbonded Potential Parameters Derived
From Crystalline Perfluorocarbons Acta Crystallogr Sect B 1986 42 (JUN)
286-295
242 OBoyle N Banck M James C Morley C Vandermeersch T Hutchison
G Open Babel An open chemical toolbox Journal of Cheminformatics 2011 3
(1) 33
243 Combinations - Rosetta Code
Bibliography
181
244 Hastie T Tibshirani R Friedman J The Elements of Statistical Learning Data
Mining Inference and Prediction Second Edition 2nd ed 2009 Corr 7th
printing 2013 edition ed Springer New York 2011pp 745
245 Schmidt M U Dinnebier R E Kalkhof H Crystal engineering on industrial
diaryl pigments using lattice energy minimizations and X-ray powder diffraction
J Phys Chem B 2007 111 (33) 9722-9732
246 Ahmed S Bidstrup S A Kohl P A Ludovice P J Development of a new
force field for polynorbornene J Phys Chem B 1998 102 (49) 9783-9790
247 Braun D E McMahon J A Koztecki L H Price S L Reutzel-Edens S M
Contrasting Polymorphism of Related Small Molecule Drugs Correlated and
Guided by the Computed Crystal Energy Landscape Cryst Growth Des 2014
14 (4) 2056-2072
248 Ismail S Z Anderton C L Copley R C Price L S Price S L Evaluating
a Crystal Energy Landscape in the Context of Industrial Polymorph Screening
Cryst Growth Des 2013 13 (6) 2396-2406
249 Price L S McMahon J A Lingireddy S R Lau S-F Diseroad B A Price
S L Reutzel-Edens S M A molecular picture of the problems in ensuring
structural purity of tazofelone J Mol Struct 2014 ASAP
250 Kendrick J Stephenson G A Neumann M A Leusen F J Crystal Structure
Prediction of a Flexible Molecule of Pharmaceutical Interest with Unusual
Polymorphic Behavior Cryst Growth Des 2013 13 (2) 581-589
251 Price S L Hamad S Torrisi A Karamertzanis P G Leslie M Catlow C
R A Applications of DL_POLY and DL_MULTI to organic molecular crystals
Mol Simulat 2006 32 (12-13) 985-997
252 Abramov Y A QTAIM Application in Drug Development Prediction of
Relative Stability of Drug Polymorphs from Experimental Crystal Structures J
Phys Chem A 2011 115 (45) 12809-12817
253 Campeta A M Chekal B P Abramov Y A Meenan P A Henson M J
Shi B Singer R A Horspool K R Development of a Targeted Polymorph
Screening Approach for a Complex Polymorphic and Highly Solvating API J
Pharm Sci 2010 99 (9) 3874-3886
254 Klimes J Michaelides A Perspective Advances and challenges in treating van
der Waals dispersion forces in density functional theory J Chem Phys 2012
137 (12) 120901
255 Vasileiadis M Pantelides C C Adjiman C S Prediction of the crystal
structures of axitinib a polymorphic pharmaceutical molecule Chem Eng Sci
2015 121 60-76
256 Smith W Todorov I T Leslie M The DL_POLY molecular dynamics
package Z Kristallogr 2005 220 (5-6) 563-566
Bibliography
182
257 Leslie M DL_MULTI - A molecular dynamics program to use distributed
multipole electrostatic models to simulate the dynamics of organic crystals Mol
Phys 2008 106 (12-13) 1567-1578
258 Koch U Popelier P L A Stone A J Conformational Dependence of Atomic
Multipole Moments Chem Phys Lett 1995 238 (4-6) 253-260
List of Publications
6
List of Publications
1 Uzoh O G Cruz-Cabeza A J Price S L Is the Fenamate Group a
Polymorphophore Contrasting the Crystal Energy Landscapes of Fenamic and
Tolfenamic Acids Cryst Growth Des 2012 12 (8) 4230-4239
2 Spencer J Patel H Deadman J J Palmer R A Male L Coles S J Uzoh
O G Price S L The Unexpected but Predictable Tetrazole Packing in Flexible
1-Benzyl-1H-Tetrazole CrystEngComm 2012 14 (20) 6441-6446
I carried out all the computational work and prepared the manuscript
3 Uzoh O G Galek P T A Price S L Towards more Accurate Force Fields for
pharmaceutical molecules ndash Analysing the Conformational Energy Profiles of
Fenamates 2014 (Submitted)
Table of Contents
7
Table of Contents
Modelling Molecular Flexibility for Crystal Structure Prediction 1
Declaration 2
Abstract 3
Dedication 4
Acknowledgments 5
List of Publications 6
Table of Contents 7
List of Figures 11
List of Tables 18
List of Abbreviations 20
List of Symbols 21
Chapter 1 Introduction 22
11 Background 22
12 Scope and Outline of Thesis 26
Chapter 2 Theoretical Background 27
21 Overview 27
22 Intermolecular Forces 27
221 Pairwise Additivity 28
222 Physical Origin of Intermolecular Force 29
223 Long-range Interactions 30
224 Short-range Interactions 31
225 Penetration Energy and Charge Transfer 32
23 Modelling the Intermolecular Forces for Organic Molecules 32
231 Repulsion-Dispersion Potentials 33
232 Electrostatics Potential 34
24 Intramolecular Energy 36
25 Force Fields (Atomistic Modelling) 38
251 AMBER 41
252 CHARMM 42
253 Other Force Fields 42
254 The Limits of Current Force Fields 43
Table of Contents
8
26 The Fitting Routine 44
261 Linear Least Square Method 44
262 Subroutine for Solving Least Squares 46
27 Electronic Structure Methods 47
271 Hartree Fock Theory 48
271 Molecular Orbital Theory 48
272 Correlation Effects 49
273 Moslashller-Plesset Perturbation Theory 49
274 Density Functional Theory 50
275 The DFT-D Approach 51
28 Crystal Structure Prediction (CSP) 52
281 CrystalPredictor 54
282 CrystalOptimizer 55
283 Polarizable Continuum Model (PCM) 56
284 Other Approaches to Lattice Energy Minimisation 56
285 The Crystal Energy Landscapes 58
286 The Blind Tests 58
29 Crystal Structure Comparison 59
Chapter 3 An Informal Blind Test A Crystal Structure Prediction of 1-
Benzyl-1H-tetrazole 62
31 Introduction 62
311 Background 62
312 Experimental Determination of 1-Benzyl-1H-Tetrazole 63
313 Molecular Geometry of the Experimental Structure 63
314 Crystal Packing Weak Hydrogen Bonding 64
315 Overview of the Challenge 65
32 Computational Methodology 66
321 Conformational Analysis 66
322 Crystal Structure Prediction 66
33 Results and Discussion 67
331 Conformational Energy Grid 67
332 The CrystalPredictor Energy Landscape 68
333 The CrystalOptimizer and PCM Energy Landscapes 68
334 Did the Predicted Structure Really Match the Experimental 70
335 The Global Minimum Structure on the PCM Energy Landscape 71
336 Post Analysis Comparison of Structure with CSD 73
Table of Contents
9
34 Summary 76
Chapter 4 Is the fenamate group a polymorphophore Contrasting the crystal
energy landscapes of fenamic and tolfenamic acids 77
41 Introduction 77
411 Polymorphism and Polymorphophores 79
412 Conformations in known Crystal Structures 79
413 Experimental Data of FA and TA 80
414 Similarities between the known forms of FA and TA 83
415 Solving the Connectivity Problem of a Disordered Form 84
416 Overview 87
42 Computational Methods 87
421 Ab initio Conformational Profile of TA 87
422 CSD Survey for Fenamates 87
423 Crystal Structure Prediction 88
424 Experimental Crystal Structures with Z´ gt1 90
425 Comparison of Crystal Structures 90
43 Results 91
431 Dependence of Conformational Energy on Method 91
432 Consideration of H-bonded Torsion 92
433 CSD Survey of Fenamates 93
434 Validation of the CrystalOptimizer plus PCM Models 95
435 Energy Landscapes of Intermediate Steps 96
436 Finding and Explaining the Known Structures with CSP 97
437 Other Known Fenamates and their Hypothetical Structures 103
438 Update on a Recently Discovered Polymorph of TA 105
439 The Cost of Lattice Energy Minimisation 106
44 Summary 107
Chapter 5 The Origin of conformational energy barriers in Fenamates 109
51 Introduction 109
511 Background 109
512 Torsional Barrier for Ethane 110
513 Overview 113
52 Method 114
521 Determining Conformation Energy Scan for Isolated Molecule 114
522 Ab initio Conformational Energy Profiles for Fenamates 114
523 Investigation of Electronic Effects 115
Table of Contents
10
524 Investigation of the Steric (Non-Bonded) Effects 116
53 Results 117
531 Effect of Different Definitions of the Same Flexible Bond 117
532 Effect of Step Size on the Conformation Profile of Fenamate Molecule 119
533 Conformational Energy Profile of the Fenamates 122
534 Rigid Versus Relaxed Scans of Fenamates 124
535 Splitting electronic from steric contributions to the barrier to rotation 127
536 Estimating the Steric Contributions with an Atom-Atom Potential 130
537 Investigating the Important Interactions with Atom-Atom Potential 131
54 Discussion The Physical Origins of Torsional Potentials 133
55 Summary 134
Chapter 6 Toward New Force fields for Fenamate Molecules 136
61 Introduction 136
611 Background 136
612 A Case for Modelling Decoupled Intramolecular Energy 137
613 Analytical Models of Intramolecular Energies 138
614 Overview 138
62 Methodology Fitting Analytical Models to Conformational Profiles 139
621 Torsional Potential Model 139
622 AtomndashAtom Model 141
63 Results 144
631 Cosine Series Model 144
632 Rescaled Repulsion Model 146
633 Combined Physical Model 149
634 Transferability 154
64 Summary 157
Chapter 7 Conclusions and Future Work 158
71 Position of CSP in the Context of this Thesis 158
72 Towards more accurate force-fields for pharmaceutical molecules 159
73 Future Work 160
Appendix A 162
Contents of enclosed CD-ROM 162
Bibliography 163
List of Figures
11
List of Figures
Figure 11 Diagrammatic illustration of crystal structure prediction (CSP) methodology
23
Figure 12 A chemical diagram of a target molecule XX from the fifth blind test17 24
Figure 13 The chemical diagram of tolfenamic (TA) and flufenamic (FFA) acids 25
Figure 14 Polymorphs of ROY numbered in the order of discovery The polymorphs
have different colours melting points and molecular conformations (most pronounced in
the torsion angle θ) (Source Ref [20]) 25
Figure 15 Overlay of the experimental conformers of ROY viewed with the overlaid
nitrobenzene fragment horizontal (Source Ref [2]) 26
Figure 21 Typical intermolecular force potential energy functions for spherical atoms
28
Figure 22 Charge distributions corresponding to pure multipoles Blue portions
represent regions where the function is positive and yellow portions represents where it
is negative Qlk is the spherical harmonic multipole where l is angular momentum
quantum number and k = l l-1hellip -l specifies the component of the angular momentum
around the z-axis (Source httpenwikipediaorgwikiSpherical_harmonics [Accessed
11012015]) 35
Figure 23 Schematic representation of conformational change and conformational
adjustment (Source Ref [58]) 37
Figure 24 The schematic view of force field interactions Covalent bonds are solid lines
while the dotted line indicates non-bonded interaction (Source Ref [68]) 39
Figure 25 Schematic view of four key contributions to a molecular mechanics force
field These forces are bond stretching bond stretching angle bending torsional terms
and non-bonded interactions (Source Ref [63]) 39
Figure 26 Schematic view of the torsion angle ξ using the ethane molecule (Source
quantumwisecomdocumentsmanualsvnl-200810_Manualchapmolbuilderhtml
[Accessed 11012015]) 40
Figure 27 Schematic view of some of the common cross terms (Source Ref [63]) 43
Figure 31 The chemical diagram of BT determined from the crystal structure Torsion
angles 1=C7-C6-N1-C5 and 2 = C12-C7-C6-N1 62
Figure 32 The crystal structure of BT (a) Partial view of the crystal packing showing
close CH∙∙∙N contacts between a central tetrazole and six surrounding tetrazoles (b)
Partial view showing CH∙∙∙N CH∙∙∙C and CH∙∙∙ contacts 64
Figure 33 BT crystal structure (a) View of the infinite S-shaped layers held together by
weak CH∙∙∙N and CH∙∙∙C H-bonds (b) Partial view of the layer structure showing
List of Figures
12
alternative B(benzyl) and T(tetrazole) layers and the repeating layer sequence [BTBT |
TBTB] 65
Figure 34 The conformational energy grid used in the search Relative intramolecular
energies ΔEintra (kJ mol-1) for isolated molecule calculations at the MP26-31G(d p)
level of theory 67
Figure 35 The CrystalPredictor energy landscape of BT generated with a crude lattice
energy model The generated structure that matched the experimental structure is
highlighted in the open red symbol 68
Figure 36 (a) The CrystalOptimizer (step 3) and (b) PCM (step 4) energy landscape
of BT GM is the global energy minimum The open red symbol represents a match
between the experimental crystal structure and the generated structure The energy
ranking of the crystal structure that matches the experimental has improved from fourth
most stable 4 to second most stable 2 69
Figure 37 The 15-molecule overlay between the experimental (atomic colours) and the
second most stable computed structure 2BT_23 (green) The direction of the view
obscures some of the molecules 71
Figure 38 Crystal Packing Similarity between experimental (grey) and the most stable
predicted structure (1BT_120 green) with only 2 molecules matching (RMSD2 = 1072
Aring) 72
Figure 39 The structure corresponding to the global minimum in lattice energy
(1BT_120) showing the dominant weak H-bonds (Aring) eight of type CH∙∙∙N and one
CH∙∙∙C and the weak ∙∙∙ interaction (benzylmiddotmiddotmiddotbenzyl) 72
Figure 310 Query used in Conquest to search the CSD for similar fragments 73
Figure 311 Histograms showing the bond length distributions of 32 1-susbtituted 1H-
tetrazole rings in the CSD The red square denotes the experimental bond lengths in BT
while the black square denotes the ab initio bond lengths in the corresponding calculated
structure 2BT_23 74
Figure 312 Histograms showing the distributions of the torsions and angles of the 32-
tetrazole rings found during the CSD survey The experimental bond length in BT is
denoted by the red square while the ab initio bond length in the corresponding calculated
structure 2BT_23 is denoted by the black square 75
Figure 41 The polymorphophore families of ROY and fenamic acid The numbers of
polymorphs in the Cambridge Structural Database (CSD) follow the refcodes for each
specific molecule and (x) denotes the number of additional polymorphs that whose
crystal structures were not available The lowest two rows are fenamates whose structures
are used in Table 46 78
Figure 42 Overlay of the experimental conformers of FA (top) and TA (bottom) viewed
with the overlaid benzoic acid fragment arranged horizontal FA QQQBTY02 (Z´=2
light blue and magenta) TA KAXXAI01 (Form I Z´=1 blue) KAXXAI (Form II Z´=1
red) KAXXAI02 (Form III Z´=2 green and purple) KAXXAI03 (Form IV Z´=3
yellow brown (obscured by yellow) and black) and KAXXAI04 (Form V Z´=1
disordered on both sites (section 415) violet and grey) The arrows point to the main
List of Figures
13
variation (ξ1) between the conformers of FA and TA in the experimental crystal
structures 80
Figure 43 Temperature dependence of the enthalpy (H) and free energy (G) diagrams
for forms I and II of TA showing a monotropic (top) relationship from data from
Surov201 which are qualitatively the same as data from Andersen199 and an enantiotropic
(bottom) relationship from data from Mattei and Li200 82
Figure 44 Features of the experimental crystal structures (a) The hydrogen-bonded
dimer motif found in all structures with variations in the phenyl ring orientations (ξ1)
The specific illustration shows the packing similarity between FA (QQQBTY02) and TA
form II (KAXXAI) (b) The unique packing of TA form II with short contacts between
chlorine and the aromatic ring (c) Crystal Packing Similarity between form III and form
IV of TA showing the 11-molecule overlay which includes only two dimers 84
Figure 45 (a) Crystal structure KAXXAI04 of form V of TA (b) The atom connectivity
of the two new components (colour red and blue) the original C-N connectivity is
labelled green (c) Chemical diagram showing the atomic connectivity of TA 85
Figure 46 Ordered Z=2 crystal structures formed from the disordered components of TA
form V (a) Form V_a (b) Form V_b and (c) Form V_c 86
Figure 47 Query fragment and the torsion angle ξ1 measured in the Conquest207 survey
of the CSD structures There were 131 organic structures where Y=H and 94 where Yne
H 88
Figure 48 The fragment used in the CrystalPredictor search for TA Each fragment was
kept rigid during the search for hypothetical crystal structures 89
Figure 49 The degrees of freedom optimized by CrystalOptimizer for crystal structures
of FA and TA (ξ1equiv C7-N1-C8-C9 ξ2equiv C2-C7-N1-C8 ξ3equiv O1-C1-C2-C7 ξ4equiv H1-O1-C1-C2
and ξ5equiv C8-C13-C14-H10 θ1equiv H6-N1-C8 θ2equiv H1-O1-C1) 89
Figure 410 The relative conformational energy of isolated TA molecules as a function
of the ξ1 The MP2 and PBE0 method at 6-31G(dp) basis set compared with the other
method (top) and the other basis sets (bottom) for the PBE0 method 91
Figure 411 The relative conformational energy as a function of the ξ2 (Figure 49) for
FA and TA calculated at the PBE06-31G(dp) level of theory 92
Figure 412 The relaxed conformational energy scan of FA and TA as a function of ξ1 at
the PBE06-31+G(d) level of theory (a) Includes the experimental values of ξ1 marked
for TA and FA with the symmetry equivalent FA conformations denoted by open black
squares and an insert diagram showing the steric hindrance for TA in the high-energy
region A histogram of (b) 131 crystal structures found in the CSD search (Figure 47)
with Y=H plus symmetry equivalent structures and (c) 94 crystal structures with YneH
94
Figure 413 Crystal energy landscape of TA for the Z´=1 structure after (a)
CrystalPredictor (Step 1) (b) the single conformer calculation of Eintra and the atomic
multipoles at the PBE06-31G(dp) level of theory (Step 2 of section 423) 96
Figure 414 The crystal energy landscapes of FA (top) and TA (bottom) Each symbol
represents a crystal structure of the specified space group which is a minimum in the
List of Figures
14
lattice energy (calculated within the polarizable continuum) The open symbols
correspond to the minima starting from the experimental structures (Table 43) The
packing coefficient is the proportion of the cell volume occupied by the molecule214
calculated using a grid spacing of 01 Aring 98
Figure 415 (a) Overlay of the only known form of FA (grey) and the most stable
structure on the Z´=1 crystal energy landscape (Figure 414a) 1FA_22 (green) with an
RMSD5 value of 175Aring (b) Overlay of the conformers of form I (pink and light blue) and
1FA_22 (black) 100
Figure 416 (a) Overlay of the two most stable hypothetical crystal structures on the
crystal energy landscape global minimum 1FA_22 (grey) and 2FA_2 (green) with
ΔElatt=20 kJ mol-1 The crystal structures overlaid 12 molecules with RMSD12 of 051 Aring
and the conformations had an RMSD1 of 009 Aring (b) Overlay of 2FA_2 (green) and the
experimental crystal structure of FA (grey) with a RMSD15 of 123 Aring obtained with a
distance and angle tolerance of 50 and 50deg (c) Overlay of the two independent
molecules in the experimental structure (grey) with 2FA_2 (green) 101
Figure 417 The overlay of the experimental Z´=1 crystal structures (grey) of TA with
the closest structure found in the search (green) (a) Form I and 1TA_8 overlaid with an
RMSD15 value of 032Aring (b) Form II and 5TA_38 overlaid with an RMSD15 value of
026Aring 102
Figure 418 Classification of the crystal energy landscape of FA in terms of the similarity
of the structures to those of known TA polymorphs (I-IV) without PCM (hence the
different y-axis compared to Figure 414a) Numbers in bold indicate the number of
molecules that overlay with the known structure of FA Hence a label 5 6 on a structure
represented by a blue circle means that the structure overlaid 5 molecules with the
experimental form of FA but 6 with form I of TAEach point is coloured by the TA
polymorph with which it overlaid the greatest number n of molecules in a Crystal Packing
Similarity calculation that ignored the CH3 and Cl 103
Figure 419 Overlay of FA_137 (green) and the major component of experimental
crystal structure of TA form VI (grey) with a RMSD15 of 030 Aring obtained with a distance
and angle tolerance of 50 and 50deg 106
Figure 420 CPU timings of (a) 38_TA (form II) and (b) 137_TA (form VI section
438) after lattice energy minimisation using CrystalOptimizer (step 3) 107
Figure 51 The fenamate family showing the low barrier torsion angle (=C7-N1-C8-C9)
=0 when the aromatic rings are coplanar as drawn The fenamates family mentioned in
this chapter includes fenamic acid (FA) R1= R2= H tolfenamic acid (TA) R1= CH3 R2=
Cl mefenamic acid (MA) R1= R2= CH3 clofenamic acid (ClFA) R1=H R2=Cl and
flufenamic aid (FFA) R1=H R2=CF3 The dotted line represents an intramolecular
hydrogen bond 109
Figure 52 Illustration of the barrier to rotation with the relaxed conformational energy
profile of FA 110
Figure 53 The staggered and eclipsed conformations of the ethane molecule (Sources
Ref [222] and enwikipediaorgwikiAlkane_stereochemistry [Accessed 11012015])
111
List of Figures
15
Figure 54 (a) Hyperconjugation effects on the staggered (b) Pauli exchange repulsion
in the eclipsed conformation (Source enwikipediaorgwikiHyperconjugation
[Accessed 11012015]) 112
Figure 55 Electrostatic steric repulsion (between electrons on the bond black arrow) for
the eclipsed conformation of ethane The red arrow indicates exclusion of van der Waals
repulsion since the van der Waals radii of the hydrogen are too small to make contact
(Source enwikipediaorgwikiConformational_isomerism [Accessed 11012015]) 113
Figure 56 Chemical diagram of model molecules used to investigate the electronic
contributions The bonds around N1 are constrained to be planar (ie R2-N1-H6-C8=180deg)
for phenylamine (PA) R1=R2=H N-methylaniline R1=H R2= CH3 N-vinylaniline R1=H
R2 = CH=CH2 and 3-anilinoprop-2-enoic acid R1=H R2 = CH=CHCO2H for 3-
chloroaniline R1= Cl R2=H and 3-methylaniline R1=CH3 R2=H (=R2-N1-C8-C9) 115
Figure 57 Pyramidalization in unconstrained phenylamine (PA) molecule caused by
lone pair on nitrogen atom 115
Figure 58 Relaxed scan of TA at the PBE06-31+G(d) level of theory with the different
definitions of flexible N1-C8 bond (= C7-N1-C8-C9 2= C7-N1-C8-C13
3=H6-N1-C8-C9
and 4= H6-N1-C8-C13) used as the constrained geometric parameter 118
Figure 59 Molecular conformation of the relaxed gas phase at PBE06-31+G(d) showing
the bond lengths of the phenyl C-C bond (=180) of FA 120
Figure 510 Relaxed scans of FA at PBE06-31+G(d) with step sizes 2 and 1deg around the
maxima and minima respectively The red circles indicate the starting points of the scans
while the arrows indicate the directions of the scans 121
Figure 511 Relaxed conformational scans at the PBE06-31+G(d) level of theory for the
fenamates The minima were at ξ=3894deg and 14471deg for FA 4063deg and 11186deg for
TA 4408deg and 11048deg for MA and 3586deg and 14838deg for ClFA 122
Figure 512 Relaxed conformational scans of fenamates (a) FA (b) TA (c) MA and (d)
ClFA at HF and PBE0 method with 6-31+G(d) basis set These are contrasted with the
single-point energies at the MP26-31+G(d) level and within a polarizable continuum
model (PCM) with =3 for the PBE06-31+G(d) conformations 123
Figure 513 Comparison of relaxed (solid) and rigid (dotted line) scan of FA (top) TA
(middle) and MA (right) For the rigid scans calculations were performed using HF MP2
and PBE0 methods with 6-31+G(d) basis set as a function of torsion angle The relaxed
scans from Figure 511 were performed at the PBE06-31+G(d) level of theory 125
Figure 514 Overlay of relaxed (coloured by element Figure 511) and rigid (red Figure
513) conformations of FA (top) TA (middle) and MA (bottom) overlaying the atoms
defining the ξ torsion angle at the PBE06-31+G(d) level of theory 126
Figure 515 The solid black lines show the relaxed torsional scans of planar-N-
constrained models for the phenyl rotation (Figure 56) where the benzoic acid group of
FA has been replaced by (a) hydrogen atom (PA) (b) methyl (c) vinyl and (d) prop-2-
enoic acid and the hydrogen in the meta position of PA has been replaced by (e) chlorine
and (f) methyl using HF PBE0 and MP2 methods with the 6-31+G(d) basis set Plots of
(h2)(1-cos(2)) where h is the height of the barrier of relaxed PBE06-31+G(d) scans
List of Figures
16
are shown in green For (c)-(f) the PBE06-31+G(d) relaxed scans of PA from (a) are
shown in grey for comparison In (a) and (b) a rigid scan at the PBE06-31+G(d) level of
theory is shown by a dotted line 127
Figure 516 The electron density surface of HOMO frontier orbitals for different
conformations of PA (top) FA (middle) and TA (bottom) obtained from the PBE06-
31+G(d) level of theory Contour map isovalues were drawn at a 002 au level 129
Figure 517 Alternative HOMO isosurface view of (a) FA and (b) PA molecule at =90
from Figure 516 129
Figure 518 HOMO-10 (46 MOs) isosurface view of side (top) and front (bottom) FA
molecule at =0 40 and 90 130
Figure 519 Comparison of the ab initio (black) intramolecular energy scans at the
PBE06-31+G(d) level of theory for FA (top) and TA (bottom) with Gavezzottirsquos exp-6
intramolecular energy models summed over all intramolecular atom-atom distances from
the third nearest neighbour (1-4) and above The net effect (purple) is subdivided into the
repulsive (red) and dispersion (blue) contributions 131
Figure 61 The fenamate family showing the low-barrier torsion angle (=C7-N1-C8-C9)
and atomic numbering =0 when the aromatic rings are coplanar as drawn The
fenamates mentioned in this chapter are fenamic acid (FA) R1= R2= H tolfenamic acid
(TA) R1= CH3 R2= Cl mefenamic acid (MA) R1= R2= CH3 flufenamic acid (FFA) R1=
H R2= CF3 and clorofenamic acid (ClFA) R1=H R2=Cl The dotted line represents an
intramolecular hydrogen bond 137
Figure 62 Relaxed conformational scans at the PBE06-31+G(d) level of theory for the
fenamates from section 533 Fenamic acid (FA) tolfenamic acid (TA) mefenamic acid
(MA) and chlorofenamic acid (ClFA) 137
Figure 63 An algorithm showing the overview of modelling ab initio intramolecular
energy using a cosine series potential The source codes are included in the CD ROM
attached to this thesis (see Appendix A) 140
Figure 64 An algorithm showing the modelling of ab initio intramolecular energy by a
physical potential The source codes are included in the CD ROM attached to this thesis
(see Appendix A) 141
Figure 65 Comparison of the ab initio relaxed scan at the PBE06-31+G(d) level of
theory with linearly fitted least square cosine series model for FA (top) and TA (bottom)
with Nk=5 (red lines) the optimal cos4 terms (blue lines) and Nk=21 (green lines σintra
=017 kJ mol-1 for FA and TA) 145
Figure 66 Plot of the standard error of the intramolecular energies against the number of
cosine terms Nk for FA (top) and TA (bottom) The fit is ill-determined ie there is no
unique solution for TA after Nk=21 146
Figure 67 Comparison of the relative energies from ab initio calculations (solid black
lines) of FA (top) and TA (bottom) with selected best-fit exp-6 rescaled repulsion models
For FA the selected Nk=3 intra=032 kJ mol-1 model had βC-H=-453 βH-H=270 and
Ebase=-506 while the Nk =4 intra=027 kJ mol-1 model had βCH=-446 βH-H=210 βH-
List of Figures
17
HB=257 and Ebase=-875 For TA the selected Nk=6 (intra=034 kJ mol-1) and 10
(intra=022 kJ mol-1) parameter fits are shown bold in Table 63 147
Figure 68 Gavezzotti exp-6 potential for all atomndashatom interactions in fenamates
displayed in two different energy scales The parameters are from Chapter 5 (Table 52)
150
Figure 69 Comparison of the relative energies from ab initio calculations (solid black
lines) of FA (top) and TA (bottom) with selected physical models For FA the selected
Nk=6 intra=026 kJ mol-1 model has βC-HB =801 γC-HB =1654 βH-H =1074 γH-H =58 α=-
339 and Ebase=-12383 whilst the Nk =6 intra=028 kJ mol-1 model has β C-H =028 γ C-
H =783 β H-HB = 1109 γ H-HB =3479 α=-117 and Ebase=-7549 For TA parameters for
the selected Nk=8 (intra=015 kJ mol-1) and 10 (intra=008 kJ mol-1) are in ghTable 66
153
Figure 610 Comparison of the relative energies from ab initio calculations (solid black
lines) with models using transferred βικ and γικ parameters from FA and TA (dotted grey
plots) to ClFA (top) and MA (bottom) respectively The red curve has only had the
baseline adjusted whereas the blue curve had the parameter refitted to ClFA or MA
respectively The transferred FA parameters are those Nk=6 fit=028 kJ mol-1 in Figure
69 while those of TA Nk= 10 fit= =026 kJ mol-1 are shown in iTable 66 155
Figure 611 Comparison of the relative energies from ab initio calculations (solid black
lines) with models using βικ and γικ parameters transferred from TA (dotted grey plots) to
(a) FA and (b) ClFA The red curve has only had the baseline adjusted whereas the blue
curve has the parameter refitted to FA or ClFA respectively The transferred TA
parameters are those of Nk= 10 fit= 026 kJ mol-1 as shown in iTable 66 156
List of Tables
18
List of Tables
Table 31 Angles and bond lengths of the tetrazole ring in BT No information about the
bonds or angles were given to me prior to submission of the candidate structures 64
Table 32 Summary of experimental (highlighted in blue) and computed crystal
structures on the PCM energy landscape (Figure 36) The computed structure that
matched the experimental structure (section 312) is highlighted in bold For label
xBT_y x and y are energy ranked after steps 4 and 1 of CSP respectively (section 322)
70
Table 41 The experimental data of the known forms of FA and TA Crystal structures
and Hfus values were taken from ref [19] unless otherwise specified aThe most widely
varying torsion angle ξ1 is defined in Figure 49 bTemperature of crystal structure
determination cMelting temperature 81
Table 42 Quantification of the similarities of FA and TA crystal structures showing the
packing similarity (RMSDn) and powder X-ray diffraction (PXRD) similarity206 The
bold numbers indicate the number of molecules n that match within distance and angle
tolerances of 20 and 20deg respectively with the RMSDn values in brackets See section
425 83
Table 43 Comparison of the lattice energy minimum with the experimental structure
used as a starting point for the final lattice energy model (PBE06-31+G(d) PCM) for
the ordered structures of FA and TA The three form V Z=2 model structures derived
from the disorder components of TA (section 415) are also compared with the starting
model RMSDn corresponds to n=15 unless (n) is given 95
Table 44 The lattice energy minima of FA shown in Figure 414a The minimum found
starting from the experimental structure is in bold 99
Table 45 The lattice energy minima of TA shown in Figure 414b Minima found starting
from the experimental structures or ordered models are in bold 99
Table 46 Crystal Packing Similarity comparisons of the experimental structures of FA
and TA and their most stable hypothetical crystal structures with the crystal structures of
the other fenamates shown in Figure 13 The similarity is given in the form n(RMSDn)
with n gt 4 molecules highlighted 104
Table 47 An extension of Table 46 showing Crystal Packing Similarity comparisons of
the latest structures of flufenamic acid18 and the experimental structures of FA and TA
and their most stable hypothetical crystal structures 105
Table 48 Crystal Packing Similarity calculations of the known forms of TA and
unobserved thermodynamically competitive crystal structures The similarity between
the structures is given in the form n(RMSDn) where n is the number of molecules overlaid
and the value in brackets is the RMSDn overlay Structures with the highest similarity are
highlighted 105
Table 51 Torsional barrier height of ethane (Source Reproduced from Ref [223]) 111
List of Tables
19
Table 52 Gavezzottirsquos exp-6 atom-atom parameters E=Aexp(-BR)-CR-6 is the well
depth and Rm is the distance at the minimum41231232 Italics represent the hydrogen-
bonded interactions aFrom the UNI intermolecular potential function of Mercury233 116
Table 53 Torsional barrier height of the relaxed conformational energy profiles in Figure
58 for TA 119
Table 54 Comparison of intramolecular energies and hydrogen bond distances of TA for
the near-planar conformer 119
Table 55 Comparison of the intramolecular energies and the N-H7∙∙∙HX-C14 bond
distances of TA for the near-planar conformer where HX-C14 is the methyl group 119
Table 56 Atom-atom interactions of FA that dominate the intramolecular energies as
estimated using Gavezzottirsquos exp-6 potential The interaction is listed as dominant if the
difference between the minimum and maximum total energy (Erepul-dis) is greater than or
equal to 1 kJ mol-1 132
Table 57 Atom-atom interactions of TA that dominate the intramolecular energies as
estimated from Gavezzottirsquos exp-6 potential The interaction is listed as dominant if the
difference between the minimum and maximum total energy (Erepul-dis) is greater than or
equal to 1 kJ mol-1 dInteractions between atoms on the same aromatic ring fInteractions
involving the methyl substituent 132
Table 61 Contrasting the atomndashatom interactions of FA and TA that dominated the
intramolecular energies formed by combining Table 56 and Table 57 from Chapter 5
Interactions unique to FA and TA are coloured blue and red respectively dInteractions
between atoms of the same aromatic ring fInteractions involving the methyl substituent
143
Table 62 Complete set of results after rescaling Nk (repulsion contributions and
baseline energy Ebase) parameters of various interacting atomic types for FA 148
Table 63 Summary table of the best results after rescaling Nk (repulsion contributions
and baseline energy Ebase) parameters of various interacting atomic types for TA
148
Table 64 All fits obtained for FA with the physically correct sign for the repulsion
and dispersion and electronic parameters 149
Table 65 The rescale parameters for the repulsion ικ dispersion ικ and electronic
contributions of the physical exp-6 and cos2 model for all possible combinations of atom
type interactions C∙∙∙C C∙∙∙H C∙∙∙HB H∙∙∙H and H∙∙∙HB for FA Nk are the number of
fitted rescale parameters ικ and ικ and the baseline energy Ebase 151
Table 66 The rescale parameters for the repulsion ικ dispersion ικ and electronic
contributions of the physical exp-6 and cos2 model for all possible combinations of atom
type interactions C∙∙∙C C∙∙∙Cl C∙∙∙H C∙∙∙HB Cl∙∙∙H C∙∙∙N H∙∙∙H and H∙∙∙HB for TA Nk
are the number of fitted rescale parameters and Ebase is the baseline energy ghThe
parameters used in Figure 69b and ifor testing transferability in Figure 610b and Figure
611 152
List of Abbreviations
20
List of Abbreviations
CCDC Cambridge Crystallographic Data Centre
CSP Crystal Structure Prediction
API Active Pharmaceutical Ingredient
DFT Density Functional Theory
HFSCF Hatree ForkSelf Consistent Field
PBE Perdew Burke and Ernzerhof exchange-correlation functional
B3LYP Becke three-parameter Lee-Yang-Parr
MP-n Moslashller-Plessett nth order of pertubabtion
PCM Polarizable Continuum Model
DMA Distributed Multipole Analysis
GDMA Gaussian Distributed Multipole Analysis
BT 1-Benzyl-1H-Tetrazole
FA Fenamic Acid
TA Tolfenamic Acid
PA Phenylamine (Aniline)
n-MA N-Methylaniline
MA Mefenamic Acid
List of Symbols
21
List of Symbols
Flexible torsion angle
Np Number of data points
Nk Number of fitted coefficients
Na Number of atoms
Xij Regressors i = 1hellip Np j = 1hellip Nk
Yi Regressand i = 1hellip Np
Elatt Lattice energy
Eintra Intramolecular energy relative to the most stable conformation
Uinter Intermolecular energy
11 Background
22
Chapter 1 Introduction
ldquoMay the Force be with yourdquo
mdash General Dodonna Star Wars A New Hope
11 Background Polymorphism the ability of a molecule to crystallise or pack in more than one
structural form1 is a phenomenon that though common is not completely understood
The phenomenon which has been the subject of long and extensive research is of crucial
importance in many branches of the chemical industry Most of all in the pharmaceutical
industry because polymorphs can show significant differences in properties such as
solubility and dissolution rate2 which in turn affect the bioavailability of drug
formulations as well as their melting point physicochemical stability and mechanical
properties3
Researchers recognise that the polymorphic differences among molecules can be
exploited to take advantage of better compactibility or powder flow rate In addition a
thermodynamically metastable form may be chosen to improve drug administration as
such a form may have a higher dissolution rate than a more stable polymorph3 A third
reason for the increasing industrial interest in polymorphism is the need to protect
intellectual property as different patents can protect the different polymorphs of an active
pharmaceutical ingredient (API)
Polymorphism is common with about one-third of all APIs confirmed to be
polymorphic4 yet not so long ago the concept of polymorphism was either treated as an
annoyance or completely ignored by academics The dismissive attitude changed after the
sudden emergence of a new polymorph of the drug ritonavir a protease inhibitor for the
HIV virus Production had to stop as Abbott Laboratories (the manufacturer) was forced
to embark upon an expensive reformulation of the drug The more stable polymorph of
the API was discovered after capsules suddenly started failing dissolution tests two years
after the drug had been launched on the market5 The ritonavir incident taught the
pharmaceutical industry that the best insurance against such surprises is to conduct an
exhaustive experimental search before going to market6 a view that has since led to
regulations requiring extensive screening and process control for polymorphs in APIs and
inactive pharmaceutical ingredients 7
11 Background
23
The unexpected emergence of the new ritonavir polymorph despite proactive attempts
to discover polymorphs before the drug was marketed forcibly reminded us that
metastable polymorphs can appear to be kinetically stable1 If Abbot Laboratories had
computed the energies of possible polymorphs for ritonavir before marketing the drug
the company may have been able to prevent a multi-million dollar problem As Graeme
Day6 noted lsquocomputational methods of predicting crystal structures could play a large
part in this research both in identifying all possible polymorphic forms and judging their
relative stabilities ndash an examination and evaluation of all possible crystal structures of a
given compound is a step towards the understanding and perhaps control of
polymorphismrsquo Given the ubiquity and importance of polymorphs it is clear that
researchers need a computer tool that is capable of postulating possible crystal structures
of organic molecules before synthesis especially since a ldquostandardrdquo experiment that
guarantees the finding of all crystalline forms is impossible89
Crystal Structure Prediction (CSP Figure 11) is the ability to predict using
computational methods how a molecule will crystallise (ie unit cell space group and all
atomic positions) given only its chemical diagram10-12 CSP has been a long-standing
goal in computational materials chemistry for its potential to predict possible polymorphs
CSP is vital to the pharmaceutical industry because a successful search method would
smooth the process of manufacturing and patenting crystalline products13
Figure 11 Diagrammatic illustration of crystal structure prediction (CSP) methodology
11 Background
24
The international blind tests14 organised by the Cambridge Crystallographic Data
Centre (CCDC) is a collaborative effort that charts the progress and state of the art in
predicting the crystal structures of small organic molecules Since the first blind test in
1999 there have been five more challenges issued by the CCDC and Figure 12 shows
how complex the target molecule can be The sixth and most recent blind test15 was issued
on September 1 2014 Scientific insight can be gained from successful CSP studies as
these methods reflect the factors that control the crystallisation process16
Figure 12 A chemical diagram of a target molecule XX from the fifth blind test17
Most CSP methodologies as we shall see in section 28 assume that the experimentally
observed crystal structures are the most stable thermodynamic structures on the crystal
energy surface In other words the temperature effects are ignored because of poor
thermal results obtained in the past for organic molecules Therefore a better method is
needed for computing the thermal effects of organic molecules This thesis takes the first
step towards accurate thermal effects calculations and Molecular Dynamics simulations
by deriving new force fields that accurately model the intramolecular energies These
discoveries on thermal effects will advance polymorph prediction
Conformational flexibility is an important property to consider when generating
hypothetical crystal structures for a flexible molecule The modelling of conformation
flexibility is the central theme of this thesis because in many organic molecules the
flexibility leads to polymorphism For example flufenamic acid18 (FFA Figure 13) a
non-steroidal anti-inflammatory drug (NSAID) has nine known polymorphs Another
NSAID tolfenamic acid19 (TA Figure 13) has five polymorphs while ROY (Figure
13) named after its red orange and yellow crystals (Figure 14) has ten known
polymorphs2021
11 Background
25
FFA1822 TA19 ROY20
Figure 13 The chemical diagram of tolfenamic (TA) and flufenamic (FFA) acids
Figure 14 Polymorphs of ROY numbered in the order of discovery The polymorphs
have different colours melting points and molecular conformations (most pronounced in
the torsion angle θ) (Source Ref [20])
Just like FFA and TA the wide range of values for the torsion angle is also present in
ROY (Figure 15) Therefore the origin of polymorphism in these compounds is partly
due to the conformational flexibility of the molecules (see Figure 15 and the red curly
arrows in Figure 13) FFA TA and ROY are also examples of organic compounds that
are considered polymorphophores1923 A polymorphophore is a structural element that
favours the formation of polymorphic crystal forms when incorporated into a molecule
ie molecules with similar fragments are likely to be polymorphic Consequently
conformational flexibility polymorphism and polymorphophore are linked
12 Scope and Outline of Thesis
26
Figure 15 Overlay of the experimental conformers of ROY viewed with the overlaid
nitrobenzene fragment horizontal (Source Ref [2])
12 Scope and Outline of Thesis Chapter 2 examines the theoretical methods relevant to the work presented in this thesis
I will discuss these in several parts intermolecular forces and their models intramolecular
forces electronic structure methods force field methods least square estimation CSP
and crystal structure comparisons Chapters 3 to 6 contain the original work of this thesis
A CSP algorithm CrystalPredictor version 16 is used in Chapters 3 and 4 This
algorithm generates crystal structures while simultaneously varying the low-energy
barrier torsion angles of the flexible molecule Chapter 3 tests the ability of CSP to predict
the crystal structure of the flexible 1-benzyl-1H-tetrazole molecule This chapter is an
informal lsquoblind testrsquo challenge Following this Chapter 4 examines the polymorphophore
concept by investigating two flexible fenamates that are similar but have different
polymorphic behaviours I use CSP and compare the two fenamatesrsquo crystal energy
landscapes Then Chapter 5 investigates the origin of the barrier to rotation of fenamate
molecules Chapter 6 develops new analytical force field models that fit the
intramolecular energy of flexible fenamate molecules as the conformation changes This
chapter investigates three analytical forms the cosine series rescaling repulsion and
combined physical models Finally Chapter 7 offers conclusions and suggests areas for
further research and development
21 Overview
27
Chapter 2 Theoretical Background
ldquoA people without the knowledge of their past history origin and culture is like a tree
without rootsrdquo
mdash Marcus Garvey
21 Overview This chapter discusses the theoretical methods that are relevant to the work completed
in this thesis Central to this research is the evaluation of the lattice energy Elattndashndashthe
sum of the intermolecular energy Uinter and the intramolecular energy ΔEintrandashndashof a
flexible organic molecule Thus section 22 sets out the physical basis for the lattice
energy model by introducing the origin of intermolecular forces Section 23 then
discusses the models of intermolecular contributions of organic molecules Section 24
provides a brief discussion of intramolecular forces because Chapters 5 and 6 investigate
the origin of and derive an analytical model for the intramolecular energies of flexible
molecules Next section 25 discusses some force field methods by way of laying a strong
foundation for the new analytical force fields derived in Chapter 6 After this section 26
discusses the fitting routines coded into the new analytical intramolecular force fields for
flexible organic molecules Section 27 highlights the theoretical background of the
electronic structure methods used to calculate the intramolecular energy of isolated
molecules (Chapters 3 to 5) and the electrostatic contribution to intermolecular energy
(Chapters 3 and 4) Section 28 further discusses Crystal Structure Prediction (CSP)
which was introduced in Chapter 1 Finally section 29 discusses various tools for crystal
structure comparison
22 Intermolecular Forces This section discusses the importance relevance origin and categories of
intermolecular forces The intermolecular force is fundamental in the evaluation of lattice
energy which is central to CSP studies (section 28) in Chapters 3 and 4 Intermolecular
forces are present everywhere in nature and control properties of gases liquids solids
and complexes In science the quantitative study of intermolecular forces can reconcile
diverse phenomena at the atomic and increasingly electronic level24 In pharmaceutical
industries the use of intermolecular forces as a computational tool for predicting new
polymorphs is necessary because of the experimental problems in establishing all
polymorphs that could be manufactured in a controlled way This is essential in
22 Intermolecular Forces
28
preventing another ritonavir disaster (section 11) where a new thermodynamically stable
polymorph started precipitating out of the anti-HIV drug25
Figure 21 Typical intermolecular force potential energy functions for spherical atoms
The intermolecular pair potential U is the interaction energy of a pair of molecules as
a function of their separation R and orientation This definition applies to rigid
molecules Intermolecular forces are repulsive at short-range and attractive at long-range
Liquids and solids exist because molecules attract one another when they are far apart26
The fact that water has a definite density meaning it cannot be easily compressed to a
smaller volume shows that at short-range the forces between the molecules become
repulsive26 The relationship between this energy of interaction U as a function of
distance R takes the form shown in Figure 21 Figure 21 has an attractive region at
long-range where the force is negative and a steep repulsive region at short-range to
account for the low compressibility of condensed materials
221 Pairwise Additivity Due to the difficulty and computational expense of modelling intermolecular
interactions this thesis makes some approximations to the sum of the intermolecular
energies One such approximation is the pairwise additivity which assumes that the
energy of a system is the sum of all two-body interactions26 For instance for three
molecules A B and C the pairwise approximation to the total energy is UAB+UBC+UAC
22 Intermolecular Forces
29
222 Physical Origin of Intermolecular Force The significant forces between molecules have an electromagnetic origin27 Strong and
weak nuclear forces do not contribute to the intermolecular force because they are
significant over a range of the order of 10-4 nm this is extremely small compared to
molecular dimensions which are typically 05 nm The gravitational force which is long-
range does not contribute to the intermolecular force because the gravitational potential
energy of two atoms 04 nm apart is only 7 x 10-52 J some thirty orders of magnitude
smaller than the typical intermolecular force28 Consequently the intermolecular forces
have an electromagnetic origin
The work reported in this thesis will focus on closed-shell ground state molecules
Resonance interactions do not occur between ordinary closed-shell molecules in their
ground state Magnetic interactions are several orders of magnitude smaller and are not
significant to the intermolecular forces Therefore these two contributions will not be
considered any further
Intermolecular forces are of quantum mechanical origin and can in principle be
determined by solving Schroumldingerrsquos equation and using the Born-Oppenheimer
approximation (ie nuclei are in fixed positions) The physical origin of the
intermolecular force from perturbation theory is as follows
4
a b
a A b B o ab
e eH
r
21
where ea is the charge on particle a one of the particles of molecule A and rab is the
distance between it and the particle b in molecule B The Hʹ is the perturbation on HA +
HB and consists of electrostatic interactions between the particles of a (electron and
nuclei) and those of b
The intermolecular force F and intermolecular energy U are related
U
FR
22
where R is the distance between the spherical molecules
When considering the intermolecular potentials it is helpful to separate various
contributions These contributions of intermolecular energy can be separated into two
Perturbation theory finds approximate solution to problem by starting from the exact
solution of a related problem It is can be used for describing intermolecular forces
because they are relatively weak
22 Intermolecular Forces
30
main types short-range and long-range interactions Israelachvili29 argued against
making this distinction due to the danger of counting twice which can happen in
theoretical analysis when forces with the same physical origin are both short-ranged and
long-ranged
223 Long-range Interactions If the interacting molecules are far enough apart ie long-range then the perturbation
theory becomes simpler because the overlap between the wavefunctions of the two
molecules can be neglected This is called the polarization approximation which was
first formulated by London30 in 193631 Three main types of long-range interactions exist
electrostatic induction and dispersion These long-range contributions vary by R-n
Electrostatic
The electrostatic force is a classical Coulombic interaction which arises from the
interaction between the static charge distributions of two molecules This force can be
attractive or repulsive but is strictly pairwise additive and dependent on orientation
Therefore the electrostatic force plays an important role in determining the structure
adopted by the solid state If ρA(r) is the charge density for molecule A then equation 21
becomes
3 3
00
( ) ( )d d 0 0 0 0
4
A BA B A B
o
H W
r r
r rr r
23
The first-order energy described the electrostatic interaction The electrostatic
expression in equation 23 is the exact classical Coulombic interaction energy of two
molecular charge distributions at long-range
Induction
The induction effects a second-order energy arise from the distortion of a particular
molecule in the electric field of all its neighbours and are always attractive These effects
are non-additive because the fields of several neighbouring molecules may reinforce or
nullify each other26 The induction energy of molecules A and B are considered separately
The induction contribution of molecule A in state m and non-degenerate ground state 0
is
The induction energies are always attractive because distortion only occurs when there
is a lowering of energy Because the energies are non-additive they are difficult to
implement computationally32 The inclusion of the explicit induction to the
0 0
0 0 0 0 0 0A B A B A B A B
A
ind A Am m
H m m HU
W W
24
22 Intermolecular Forces
31
intermolecular energy can significantly reorder the relative energies of a molecule33
especially for large molecules like carbamazepine32 The distributed polarizability can be
used to model the induction energy as Gareth Welch34 did However this approach is
computationally demanding because a large basis set and high-quality wavefunctions are
often required32 for convergence criteria to be met In this thesis the induction energy is
not modelled explicitly Instead it uses PCM (Polarizable Continuum Model section
283) to model the polarization effect that arises from the electrostatic interactions in a
solvent medium29
Dispersion
Dispersion is a universal force of quantum mechanical origin We know that because
electrons are in continuous motion their electron density oscillates continuously
producing instantaneous electric dipoles that change as the electron density changes The
instantaneous dipole in one molecule induces another electric dipole in the other
molecule There is an instantaneous correlation of fluctuation of charge density This is
why this contribution is universal and requires a description of electron correlation
Dispersion is an attractive force and is approximately pairwise additive The perturbation
theory expression for dispersion contribution is as follows
0 0 0 0
00 00disp A B A B
m n m m
H mn mn HU
W W W W
25
London30 provided the most widely understood treatment of dispersion forces where
atoms can be visualised as a set of harmonic oscillators In this treatment the coupling of
the oscillators leads to the lowering of the energy The dispersion energy depends on the
square of the coupling constant The leading term in the dispersion energy is proportional
to R-6 because the coupling for a pair of interacting dipoles is proportional to R-3
224 Short-range Interactions
Exchange-Repulsion
When electron clouds of two molecules approach each other and become sufficiently
close they overlap At short-range the most important contributions are exchange and
repulsion these two are often taken together despite having opposite signs and are called
exchange-repulsion31 The exchange contribution is the attractive energy resulting from
electrons of one molecule becoming free to move over both molecules This increases the
uncertainty of the electronrsquos position allowing the momentum and energy to decrease
Repulsion contribution arises from the slight overlap of electrons that are trying to occupy
the same region of space This overlap which is prohibited by the Pauli Exclusion
23 Modelling the Intermolecular Forces for Organic Molecules
32
Principle leads to redistribution of electrons and increase of the repulsion between the
nuclei The exponential repulsion domination leads to an overall repulsive effect and is
approximately pairwise
225 Penetration Energy and Charge Transfer The overlap at short-range leads to modification of the long-range terms When charge
densities overlap at short-range the electron density will no longer shield the nuclei of
one molecule and therefore the molecules will experience a greater attraction of electron
density associated with other species The energy difference from this increased attraction
is the charge penetration it is the modification of the electrostatic energy at short-range
and so is a first-order effect Charge transfer also occurs during redistribution of electrons
at short-range It is a part of the short-range induction energy and so is a second-order
effect The energy contributions from charge transfer and penetration are small and are
often negligible35 Some of these effects may be absorbed in the empirically fitted models
of the dispersion and repulsion terms (section 27)
In summary for the organic molecules studied in this thesis repulsion dominates at
short-range while electrostatic and dispersion contributions dominate the intermolecular
energy at long-range Therefore the total intermolecular energy can be expressed as the
summation of the electrostatic Uelec repulsion Urepul and dispersion Udisp contributions
inter elec repul disp elec repul dispU U U U U U 26
23 Modelling the Intermolecular Forces for Organic Molecules The potential model used in this thesis for evaluating the intermolecular energy Uinter
is an intermediary between conventional force fields and periodic electronic structure
calculations The functional form of conventional force fields have limitations because
the same charges are used for intermolecular and intramolecular interactions2 (section
254) Periodic electronic structure calculations are very expensive and were not
available at the start of my research in 2010 For example the plane-wave DFT-D study
of selected pharmaceutical crystal structures using Quantum Espresso was published in
201336 The Generation Ranking and Characterisation Engine (GRACE37 program
section 284) which when coupled to another periodic DFT-D code (section 275) was
successful in the fourth blind test10 is still not available to researchers as of this writing
The work presented in this thesis models the dispersion repulsion and electrostatic
interactions (equation 26) explicitly The dispersion and repulsion contributions were
modelled using a transferrable empirically fitted model In contrast the electrostatic
23 Modelling the Intermolecular Forces for Organic Molecules
33
contribution was modelled using ab initio wavefunction calculation on an isolated
molecule for each molecular conformation due to limited transferability
231 Repulsion-Dispersion Potentials The dispersion and repulsion terms are modelled with an empirical exp-6 atomndashatom
potential that is assumed to be transferrable3839 The repulsion term is represented by the
exponential-based term and the dispersion is represented by the inverse sixth power term
6
exp( )
repul disp ik ik
i k
U A B R C R 27
where atom i in molecule 1 is of type ι atom k in molecule 2 is of type κ and they are
separated by interatomic distances Rik This potential (equation 27) was derived by fitting
the parameters to known crystal structures and it obeys the following combining rules
1 1
2 21
( ) ( ) ( )2
A A A B B B C C C 28
Parameters for carbon non-polar H and N atoms were derived from fitting to
azahydrocarbon crystal structures39 while the parameters for the oxygen atom were
derived from fitting to oxohydrocarbon crystal structures38 The polar H atom parameters
were derived from azabenzenes nitrobenzenes and other simple molecules40 To account
for the smaller effective van der Waals radius of protons the distinction between polar
and non-polar H atoms is necessary41 In Chapters 3 and 4 the repulsion-dispersion
contributions to the intermolecular energy will be calculated using the potential of
equation 27 and the ldquoFITrdquo34 parameters These FIT parameters were fitted using a model
that had explicit electrostatic interactions Once the repulsion and dispersion terms were
generated they were summed over all intermolecular atomndashatom distances up to a defined
cut-off This is typically 15 Aring for small organic molecules for fast calculations and 30 Aring
for large molecules34 It should be noted that some of the other intermolecular
contributions not modelled explicitly by equation 27 and any electrostatic model might
have been absorbed by the empirically fitted models of dispersion and repulsion terms
because these other contributions will be present to some extent in the sample crystal used
in deriving the parameters A B and C
In contrast to ldquoFITrdquo the empirical intermolecular potential by Gavezzotti42ndashndashanother
exp-6 potential that will be used in Chapters 5 and 6 to investigate the origin of
intramolecular energy and design new analytical force fieldsndashndashdoes not use combining
rules and has no atomic or site charges
23 Modelling the Intermolecular Forces for Organic Molecules
34
232 Electrostatics Potential This section discusses the two methods used in this thesis for modelling the electrostatic
contribution to the intermolecular energy (equation 26) in Chapters 3 and 4
(1) The Atomic Charge Model is a crude but inexpensive approach It uses Coulombrsquos
law through pairwise interaction of isotropic (spherical) point charge q placed on each
atom separated by distance R
0
1(R )
4 R i k
elec ik
ik
q qU 29
where ε0 is the dielectric vacuum constant It assumes that the charge density of the
molecule can be described by superimposing spherical atomic electron densities The
atomic charge model cannot represent non-spherical features such as lone pairs and
electrons or short-distance directional intermolecular interactions like the geometry of
the H-bond41 As a result extensions to the isotropic model have been proposed to define
lone pair sites as dummy atoms having isotropic electrostatic interactions43 or at satellite
positions that are optimised to provide best fit to the electrostatic field44
Although atomic charges can be derived from the experimental X-ray diffraction data
these results are unreliable due to the many approximations and assumptions that must be
made during their calculation45 On the other hand atomic charges can be generated from
an ab initio wavefunction calculation of the isolated molecule to estimate the electrostatic
contribution41 This involves using the CHELPG scheme (an acronym for CHarges from
ELectrostatic Potentials Grid based method) which performs the least-squares fit of the
atomic charges to reproduce the molecular electrostatic potential as evaluated from ab
initio density on a regularly spaced grid46 Unfortunately higher moments such as
octupoles hexadecapoles and so on make a small contribution to the potential when the
CHELPG scheme is used Indeed Francl et al47 showed that the CHELPG procedure is
ill conditioned for higher atomic multipoles so that the charges are not well determined
however they did show that Singular Value Decomposition (section 262) could improve
the condition numberdagger
(2) The Distributed Multipole Moments The electrostatic potential around a molecule
can be represented by an expansion of multipole moments At long range this
daggerThe condition number is the ratio of the largest to smallest singular value in the singular
value decomposition of a matrix A matrix is ill conditioned if the condition number is
too large
23 Modelling the Intermolecular Forces for Organic Molecules
35
electrostatic potential is exact since the charge distribution is approximately spherical as
the distance approaches infinity At shorter range the more apparent anisotropic nature
of charge density is not easily represented by the central multipole expansion48 A better
approach is to use a multiple expansion about several sites in the molecule which can be
achieved with the distributed multipole expansion
The distributed multipole expansion is an explicit method of generating higher-order
atomic multipoles that involves modelling the atomic charge distribution using a series
of distributed multipoles (charge dipole quadrupole octupole hexadecapole etc as
illustrated in Figure 22)26 Consequently the derivation of the distributed moments is
essential There are two ways of achieving this computational analysis of the charge
density and fitting to experimental data Deriving the multipole moments experimentally
is challenging and often the data are insufficient to deduce any particular distribution of
multipoles across specific sites49 For example the Stark effect gives the magnitude but
not the sign of the components of the dipole moment along the inertial axes26
Figure 22 Charge distributions corresponding to pure multipoles Blue portions
represent regions where the function is positive and yellow portions represents where it
is negative Qlk is the spherical harmonic multipole where l is angular momentum
quantum number and k = l l-1hellip -l specifies the component of the angular momentum
around the z-axis (Source httpenwikipediaorgwikiSpherical_harmonics [Accessed
11012015])
Distributed Multipole Analysis (DMA) is a systematic way of determining the
distributed moments50 This computational approach derives charge distribution from an
24 Intramolecular Energy
36
ab initio wavefunction51 and describes it in terms of distributed multipoles (Figure 22)
located at a number of site in the molecule using the Gaussian Distributed Multipole
Analysis (GDMA)52 program The GDMA program carries out a DMA of the density
matrix (Fchk) file produced by GAUSSIAN53 for the isolated molecule in the molecular
axis system34 This thesis uses version 252 of GDMA because it handles diffuse functions
more satisfactorily51 than version 154
In contrast to the atomic charge model the distributed multipole moments have
successfully predicted the directional (anisotropic) lone pair interactions π-π stacking
arrangements in aromatic rings and electrons and H-bond geometries in molecular
organic crystal5556 The long-range interactions which include the chargendashcharge (R-1)
chargendashdipole (R-2) and dipolendashdipole (R-3) terms are evaluated using the Ewald
summation method57 while the remaining long-range interactions are summed by direct
method
In summary the electrostatic contribution is modelled by using either an atomic charge
model or distributed multipole moments obtained from ab initio methods while the
repulsion and dispersion contribution are modelled using an empirical exp-6 potential
24 Intramolecular Energy The lattice energy of a crystal structure is the sum of the intermolecular and
intramolecular energies The focus of this section is the intramolecular part of the lattice
energy In Chapters 5 and 6 I investigate the origin and derive analytical models for the
intramolecular energies of flexible molecules (Chapter 6) Therefore this section
concisely examines the intramolecular energy of flexible molecules
The intramolecular energy of rigid molecules is negligible so the early work of crystal
structure prediction (section 11) focussed on the easier problem of rigid molecules In
this thesis a flexible molecule has one or more internal degrees of freedom that change
between phases for example torsion angles around single bonds The intramolecular
energy for a flexible molecule is the energy difference between the molecule in a specific
conformation (eg in a crystal) and in the lowest energy of the isolated gas phase
conformation As evident from ROY in Chapter 1 polymorphic forms can exhibit very
different torsion angles (Figure 15) ie can display conformational polymorphism
Cruz-Cabeza and Bernstein58 argued that when referring to conformations in crystal
structures a distinction should be made between conformational adjustment and
conformational change Conformational adjustment arises when a flexible molecule
adjusts to the crystal environment by slightly varying the conformation to minimise the
24 Intramolecular Energy
37
lattice energy of the crystal while conformational change involves a change of gas phase
conformer (Figure 23) In the context of the polymorphism of flexible molecules Cruz-
Cabeza and Bernstein58 referred to two polymorphs whose independent conformations
are related by conformational change as conformational polymorphs For example crystal
structures A and B in Figure 23 are conformational polymorphs
Figure 23 Schematic representation of conformational change and conformational
adjustment (Source Ref [58])
The simplest approach to calculate the intramolecular energies is to use force field
methods (section 25) which involve summing the contributions that arise from bond
stretching angle bending and dihedral torsion angles However despite the speed and
successes of force field methods in Molecular Dynamics and in modelling proteins59 the
molecular mechanics descriptions of the intramolecular energies and molecular
geometries are not sufficiently accurate for evaluating the lattice energy of crystal
structures (section 254)
Another method for evaluating intramolecular energy is electronic structure calculation
(section 27) This approach avoids the problem encountered in force field methods but
at the cost of higher computing time The conformations of flexible molecules and their
relative energies can be sensitive to the electron correlation method (because of the
important dispersion contribution) and to the basis set that is used (since large basis sets
are required to avoid intramolecular BSSE60 during electronic structure calculations) The
errors from intramolecular dispersion (section 275) can lead to the failure of quantum
mechanical calculations for molecules that adopt a folded conformation6061
One way of solving this problem is the dispersion-corrected (ndashD section 275) method
Warnings of the intramolecular energy sensitivity toward the electronic structure level of
25 Force Fields (Atomistic Modelling)
38
theory are relevant to the CSP studies of Chapter 3 and 4 where the focus is on other
aspects of the computational model and not on the rigorous test of these errors However
it is a common practise to use one electronic structure method for evaluating the
intramolecular contributions toward the final lattice energies A necessary compromise
then is to conduct prior analysis of the effect that different levels of theory have on the
intramolecular energy for a specific molecule
The frequently used DFT level of theory such as B3LYP6-31G(d) may not give
reliable results for molecular systems where the intramolecular dispersion energy is likely
to be a major factor in determining the conformation60 Due to this limitation I did not
use the 6-31G(d) basis set in Chapters 3 and 4 when computing the final intramolecular
and intermolecular energies of the crystal structures
25 Force Fields (Atomistic Modelling) Force field methods (also known molecular mechanics methods) ignore the moleculersquos
electronic motions and calculate the energy of a system as a function of the nuclear
positions These methods are a cheap alternative to electronic structure methods (section
27) The basis of understanding the force field is the Born-Oppenheimer approximation
which assumes that the motions of the nuclei are independent of the motions of the
electrons In force field calculations the arrangement of the electrons is assumed to be
fixed62 Thus traditional force field methods cannot predict properties based on electronic
motions such as the breaking and formation of chemical bonds polarization effects and
proton transfer
The parameters determined for small molecules can be transferred to larger systems
such as polymers63 and can also be used for billions of atoms on supercomputers Indeed
the ability to transfer force fields from one system to anotherndashndashfor systems that are too
large for quantum mechanical calculationsndashndashis arguably the most valuable property of
many force fields6364
The downside to these classical force fields is that conformation and energy results are
often prone to inaccuracies These inaccuracies were observed when force fields methods
were used in CSP to calculate the final lattice energies65-67 (section 254)
25 Force Fields (Atomistic Modelling)
39
Figure 24 The schematic view of force field interactions Covalent bonds are solid lines
while the dotted line indicates non-bonded interaction (Source Ref [68])
Figure 25 Schematic view of four key contributions to a molecular mechanics force
field These forces are bond stretching bond stretching angle bending torsional terms
and non-bonded interactions (Source Ref [63])
The application of force fields involves choosing an energy functional form followed
by evaluating all unknown parameters A typical force field method arises from four
principal energy terms of intermolecular and intramolecular forces within the system6970
( )MM b nbE E E E E 210
where sumEb sumEθ sumEξ and sumEnb are the total energy of bond deformation valence angle
deformation torsion deformation and non-bonded interactions (van der Waals and
electrostatic) respectively The deviation of bond angle and torsion from equilibrium
describes the penalty of deformation (intramolecular) while non-bonded term describes
the interaction between non-bonded parts of the system (intermolecular)
Hookersquos law models bonds between atoms as a spring
2( )b r eq
bonds
E K b b
211
25 Force Fields (Atomistic Modelling)
40
where Kr is the force constant and beq is the ideal bond length A common mistake is to
assume that the equilibrium value (eg beq) is the global minimum value in actuality beq
is the value that b adopts when all force field terms equal zero This Hookersquos functional
form is an example of applying the harmonic oscillator in which the relationship between
force and displacement is linear A more accurate description of the relationship between
force and displacement is non-linearity ie anharmonic oscillator Hence Hookersquos
functional form is not as accurate as using cubic and higher terms (anharmonic terms)
Valence angles have a similar model to equation 211
angles
eqKE 2)(
212
where K is the strength of the spring holding the angle at ideal valence angle eq
Compared to a bond model less energy is required to distort the valence angle away from
the reference and the force constants are smaller The higher terms such as cubic and
quartic terms improve the valence angle model The 1-2 and 1-3 interactions (defined in
Figure 24) are also known as hard degrees of freedom because large amounts of energy
are required to deform bonds or angles from their equilibrium positions However
CrystalOptimizer71 (section 282)ndashndashan algorithm used in Chapters 3 and 4 to compute
the lattice energy accuratelyndashndashassumes that some 1-3 interactions are soft degrees of
freedom For example hydroxyl (HndashOndashC) and amide (HndashNndashC) bond angles were treated
as flexible in three model systems72
Figure 26 Schematic view of the torsion angle ξ using the ethane molecule (Source
quantumwisecomdocumentsmanualsvnl-200810_Manualchapmolbuilderhtml
[Accessed 11012015])
25 Force Fields (Atomistic Modelling)
41
The major change between crystal structures is their torsion angles The torsion angle
ξ in the ethane molecule shown in Figure 26 is defined as the intersection angle between
the two planes α and β spanned by the respective atom chains 1ndash2ndash3 and 2ndash3ndash4 It is clear
that the value of the torsion angle ξ between atoms 3 and 2 depends on the four atoms
selected Due to the periodic nature of torsion angles the model is expressed as a periodic
function
[1 cos( )]2
n
torsions
VE 213
where is the periodicity and represents the number of minima as the bond rotates about
360deg The phase factor term is the torsion angle as the rotating bond passes the
minimum or minima Vn is the barrier height to rotation about torsion angle ξ The value
of Vn is larger for double bonds than for single bonds The definition of Vn is ambiguous
when more than one term is needed to model the torsional energy64 Even more
misleading is that the 1-4 non-bonded (Figure 24) and higher interactions contribute to
the torsional potential The additional term with the correct qualitative behaviour of the
barrier to rotation63 is a better description of Vn
The last term in equation 210 is the non-bonded interactions
12 6
[ ]nonbond
ij ij i j
nb
i j ij ij ij
q qE
r r r
214
where the adjustable parameter σij is the collision diameter and is defined as the separation
for which the van der Waals energy is zero The qi and qj terms are the partial or net
atomic charges63 Equation 210 is a combination of the repulsion-dispersion (also known
as the van der Waals term and is often fitted to a Lennard-Jones 6-12 potential73 because
of the computational ease) and an electrostatic term It should be noted that intermolecular
and intramolecular contributions have the same set of parameters Many of the more
recent developments in protein force fields include electronic polarizability or a solvation
effect in an approximate way68
251 AMBER The AMBER force fields are widely used for modelling proteins and nucleic acids74
AMBER which is in continual development has relied on the past knowledge of force
fields such as ECEPP potentials75 and Consistent Force Field (CFF76) The exclusion of
H atoms from an earlier version of an AMBER force field was due to limited computer
power However a compromise was adopted in later versions due to the importance of
the H-bond68
25 Force Fields (Atomistic Modelling)
42
The charges were derived by fitting partial charges to ESP (electrostatics potential)
charges obtained via ab initio calculations (HFSTO-3G) An adapted version of van der
Waalsrsquo term from amide data fitting by Lifsonrsquos group7778 and liquid state simulations79
by Jorgensen was used The first two terms (bonds and angles) of equation 230 were
fitted from crystal structure data while the torsional terms were extracted from either
experimental data or ab initio calculations
The fact that AMBER has limited parameters for organic molecules prevented this force
field from being widely used in drug design and other studies of ligandndashprotein or ligandndash
DNA interactions80 Hence a Generalised Amber Force Field (GAFF) was introduced by
Wang et al80 to describe a wider variety of organic molecules including most
pharmaceutical molecules
252 CHARMM CHARMM81 (Chemistry at HARvard using Molecular Mechanics) has some overlaps
with AMBER in part because the first versions of both force fields were developed
around the same time Like AMBER H atoms were excluded in the earlier version but
were later replaced with a compromise solution Although ab initio calculations were
used in fitting this model a different level of theory (HF6-31G) was employed The
interaction energies were scaled to match water dimerization energy predicted via a
TIP3P model to achieve a balanced solutendashwater and waterndashwater interaction A rough
continuum solvation model can be implemented by using the force field with distance-
dependent dielectric constant The second version of CHARMM from 1985 is used
today because of the respectable results obtained from solvated simulation68
Subsequent developments were made in later versions of CHARMM8283 to improve
the balance of interaction energies in solvent simulations More recently a force field for
all atoms often called the CHARMM general force field (CGenFF) was published84
This force field covers a wide range of chemical groups present in biomolecules and drug-
like molecules and focusses on quality of result rather than on transferability
253 Other Force Fields There are more complex force fields than those discussed above For example cubic
and quartic terms can be added to equations 210 and 211 to reflect anharmonicity and
stretch-bend cross terms or the Lennard-Jones function can be replaced with a more
flexible Buckingham (exp-6) or Morse potential85 Examples of such force fields are
MM486 and Merck Molecular Force Field (MMFF)87 The cubic and quartic terms are
also used in MM288
25 Force Fields (Atomistic Modelling)
43
Figure 27 Schematic view of some of the common cross terms (Source Ref [63])
The cross terms in force fields represent coupling between internal coordinates For
example an increase or decrease of valence angle can affect adjacent bonds Stretch-
stretch stretch-bend stretch-torsion bend-torsion and bend-bend (Figure 27) are
examples of cross terms believed to be the most important in force fields these cross
terms in force fields are designed to predict vibrational spectra63
Another very popular force field is OPLS-AA (Optimized Parameters for Liquid
SimulationsndashAll Atoms) which specialises in simple liquids8589 Although huge
advances have been made in the understanding of biomolecular behaviour there is still a
demand for more accurate prediction of energies90 even for proteins and nucleic acid
polymers that have been studied extensively eg AMOEBA91 which uses atomic
multipoles
254 The Limits of Current Force Fields A major limitation of current force fields is the use of atomic charges in the description
of electrostatic contributions9293 Another limitation is that the intermolecular and
intramolecular forces have the same parameters It is therefore not surprising that in the
blind tests of organic CSP there have been no success based on the use of force fields for
final lattice energy (sum of intermolecular and intermolecular energy) evaluations11 In
specific cases like aspirin the intramolecular force field clearly has too strong a
preference for the wrong conformation so that the lowest-energy crystal structures have
that conformation94
Indeed some force fieldsrsquo lattice energy minimizations were shown to change the
conformation of the crystal structure so much that the crystal structure could not be
26 The Fitting Routine
44
reproduced65 In other cases the force fields were able to reproduce the crystal structures
but failed to rank the energy of these crystal structures accurately These failures have
been traced to using the same charges and van der Waals interactions for the
intermolecular and intramolecular forces95
Generally force field potentials that are more accurate tend to have more terms because
they usually yield better fit with experimental or ab initio data However additional
parameters make the fitting procedure more complicated and time consuming with no
scientific basis Therefore an ideal analytical model for the intramolecular energies
should have terms that are few in number (Chapter 6) based on a consistent scientific
origin (Chapter 5) and transferrable
In summary the traditional force field includes explicit periodic torsional potentials
and non-bonded terms including the electrostatic term that are applied to all atom pairs
separated by three or more covalent bonds (1-4 interactions and above) Researchers built
these traditional force fields on the reasonable assumption that in biomolecules the
intramolecular non-bonded interactions are the same as intermolecular non-bonded
interactions This is clearly a limitation2 because intramolecular atom-atom distances are
often much shorter than intermolecular (van der Waals) distances I exploited this
limitation in Chapter 6 by decoupling the intermolecular and intramolecular contributions
and derived new analytical intramolecular force fields
26 The Fitting Routine The Gavezzotti exp-6 and ldquoFITrdquo potentials (section 231) and many force field methods
were fitted to experimental or ab initio data These potentials all depended on an assumed
functional form the ability to extrapolate the quality of data the range of sampling a
method of fitting (the focus of this section) and so on
In Chapter 6 I developed codes (Appendix A) for fitting a new analytical
intramolecular force field to ab initio conformational profiles of fenamates which use
one method of fitting I assumed that the new analytical intramolecular force field was
approximately linear This section explains what a linear problem is solves the problem
and outlines an alternative solution that uses a Numerical Algorithm Group (NAG) library
that was implemented in the design of new analytical force fields (Appendix A)
261 Linear Least Square Method A model is linear if given a random data of (Yi Xi1hellip Xip-1 i =1hellip n) the relationship
between the response variable or observation Yi and the explanatory or independent
variable Xij can be formulated as follows
26 The Fitting Routine
45
Yi=β0+ β1Xi1 + β2Xi2 +hellip+ βp-1X ip-1 + εi i=1hellipn 215
where εi is the error β0 β1 β2 hellip βp-1 are the intercept and regression coefficients for the
explanatory variables
The linear regression model of equation 215 in matrix form is
0 1 11 1 1 11 1
0 1 22 1 2 12 2
0 1 1 1 1
p p
p p
n nn p n p
X XY
X XY
Y X X
216
or
11 1 11 0 1
22 2 12 1 2
11 1
1
1
1
p
p
n p nn n p
X XY
X XY
Y X X
217
or 1 1 1n n p p n Y X ε 218
where Y is ntimes1 X is ntimesp (an ntimesp matrix has n rows and p columns) β is ptimes1 and ε is
ntimes1 matrix
We can solve this linear regression model by using the least squares method The basic
idea behind the least squares is minimising the sum of squares for the errors ie
2n T
ii ε ε where T is the transpose Rearranging equation 218 as a function of errors
and evaluating least square problem gives
( ) ( )
( ( ) ( ) ( ))
( ( ) ( ))
( ( ) ( ) ( ))
( )
( 2 )
T T
T T T T
T T T T T
T T T T T T
T T T T T
T T T T
ε ε Y X Y X
Y Y Y X X Y X X
Y Y Y X X Y X X
Y Y Y X X Y X X
Y Y Y X Y X X X
Y Y Y X X X
219
Then differentiating the least square (equation 219) with respect to the coefficient gives
( ) ( 2 ) 0
2( ) 2 0
2 2 0
T T T T T
T T T
T T
T T
ε ε Y Y Y X X X
Y X X X
X Y X X
X X X Y
220
26 The Fitting Routine
46
Then multiply both sides by 1( )T X X
1
1 1( )T T
p p n p n p n n
X X X Y 221
The expectedmodel value Ŷ is
1 1ˆ
n p p n Y X 222
Equations 221 and 222 can be coded explicitly which I did for cosine fits in my upgrade
report96
262 Subroutine for Solving Least Squares An alternative to coding equations 221 and 222 explicitly is to use the G02DDFE97
NAG routine This NAG routine computes the error of each coefficient and states whether
a solution is unique or not in addition to computing the coefficients Here I discuss some
key concepts that will help in understanding the G02DDFE97 NAG routine used in
Chapter 6
If X is an n times p matrix the rank of X is the number of nonzero rows in the row echelon
derived through the Gaussian elimination method If matrix A has a rank as large as
possible then the matrix is a full rank otherwise the matrix is rank deficient A matrix
that is full rank has one unique solution The G02DDFE97 NAG routine can work out if
any matrix is full ranked or rank deficient
QR decomposition is the first step used for solving the least squares problem in the
G02DDFE97 NAG routine QR decomposition transforms matrix X into a QR matrix that
consists of an orthogonal matrix Q and an upper triangle matrix R
1 2 1
R RX = Q = Q Q = Q R
0 0 223
where Q1 is the first p columns of Q and Q2 is the last n-p columns of Q
G02DDFE97 subroutine calculates the regression parametersndashndash and in Chapter
6ndashndashand Residual Sum of Squares (RSS) for a general linear regression model by
minimising the sum squares residual G02DEFE a routine within G02DDFE carries out
QR decomposition of the matrix data X If R is of a full rank ie the matrix has a rank
as large as possible then R-1 exists and the solution of the regression model is as follows
1ˆ( ) ik
T
ik y R Q 224
where Q and R are the decomposed matrices of data being rescaled and y is the ab initio
data minus any remaining contributions not being fitted If R is not full rank Singular
27 Electronic Structure Methods
47
Value Decomposition (SVD) of X (ie X=U1DVT) helps to extract just one solution of
the linear regression model
1ˆ ( ) ik
T
ik y VD U 225
where V D and U are respectively the orthogonal the non-negative diagonal element
and the orthogonal decomposed matrices RSS and the standard error fit are related
fit
p k
RSS
N N
226
where Np and Nk are the number of observations and regression coefficients for each of
the independent variables plus the intercept
Solving the least squares problem is a key feature of the algorithm in Chapter 6 The
algorithm undertakes the challenge of deriving a new analytical model for intramolecular
energies of flexible fenamate molecules The remaining features of the algorithm are
discussed in Chapter 6
27 Electronic Structure Methods The development of electronic structure methods and rapid advances in computing
technology have transformed the role of quantitative numerical calculations in both
theoretical and experimental studies of chemistry98 The first era from the 1960s to 1980s
established the basic mathematical foundations and computational machinery of todays
standard electronic structure methods They included HartreendashFock (HF) theory Moslashller-
Plesset (MP) perturbation theory Density Functional Theory (DFT) and many others98
This thesis classifies HF MP and DFT as ab initio methods
This thesis uses electronic structure methods to calculate the molecular properties of a
single molecule (and in principle of dimers and crystals) The electronic structure
methods seek to calculate the molecular properties from the first principles ie solving
Schroumldingerrsquos equation without using empirical data26 However approximations are
always necessary DFT is a modern arsenal of quantum chemical methods99 and to get a
better appreciation of this method it will be useful to look at more traditional
wavefunction-based approaches One of the simplest of these approaches is the Hartree
Fock (HF) theory
27 Electronic Structure Methods
48
271 Hartree Fock Theory The HF theory was developed to solve the electronic Schroumldinger equation that results
from the time-independent Schroumldinger equation after invoking the Born-Oppenheimer
approximation100 There are two good reasons for solving the Schroumldinger equation First
the solution gives the potential energy experienced by the nuclei ie the potential energy
surface Second the electronic wavefunction has lots of useful information about
molecular properties such as dipole and multipole moments polarizability etc
The HF method assumes that the exact N-body wavefunction of the system can be
approximated by a single Slater determinant of N spin-orbitals By employing the
variational theorem which states that the energy is always an upper bound to the true
energy one can derive a set of N-coupled equations for the N spin-orbitals The solution
to this equation yields the energy of the system and the wavefunction
The HF method is called the ldquoSelf-Consistent Field (SCF) methodrdquo because the HF
equations are solved using an iterative process The SCF process starts with an initial
guess for the orbitals and successive iterations are performed with new orbitals until the
self-consistent condition is achieved ie until the solution no longer changes
271 Molecular Orbital Theory With the new Quantum Mechanics (QM) of Heisenberg and Schroumldinger came two
general theories the Valence Bond (VB) and the Molecular Orbital (MO) theories These
two theories developed at around the same time quickly became rivals101 See ref102 for
a review of the classical valence bond approach The focus of this section is the MO
theory
The MO theory based on the HF theory theorises that each electronrsquos motion can be
described as a single-particle function (orbital) that does not depend on the instantaneous
motions of the other electrons MOs are calculated using the Linear Combination of
Atomic Orbitals (LCAO) which is a quantum superposition of Atomic Orbitals (AOs)
MO is a theory of bonding that can give insight into the forces involved in making and
breaking chemical bonds which are often the focus of organic chemistry
The early complexities of Quantum Mechanics led to the visualisation of MOs that are
easier to understand than numerical orbital coefficients103 Using SCF calculations we
can represent MOs using isosurfaces that correspond to the electron density The two
isosurfaces of particular importance are usually the Highest Occupied Molecular Orbital
(HOMO) and the Lowest Unoccupied Molecular Orbital (LUMO) These are known as
the frontier-orbitals104 It is not clear why the frontier-orbital theory is so successful26 but
27 Electronic Structure Methods
49
this theory is used extensively in computational chemistry to understand many
phenomena Frontier orbitals will be used in Chapter 5 of this thesis to understand the
origin of barriers to rotation for flexible molecules
HOMO is the isosurface from which it is energetically easiest to remove electrons from
(eg electron density donation to form a bond) as well as the most relevant MO in this
thesis The only requirement of the empty MOs is that they form an orthogonal set with
the filled MOs These unoccupied MOs are not optimised during the SCF process because
the energy of the molecule does not depend on them As a result these unoccupied MOs
including LUMOs are less reliable than occupied MOs such as the HOMOs Thus
Chapter 5 will focus on the HOMO isosurfaces of flexible molecules
272 Correlation Effects The major limitation of the HF method is that it treats each electron as moving under
the influence of the average effect of all other electrons the method does not take into
account the electronsrsquo instantaneous repulsion26 (correlation effect) One of the most
important effects of electron correlation is the dispersion interaction In fact the
dispersion interaction (section 22) is a correlation effect26100 The correlation energy is
the difference between HF energy in a complete basis (HF limit) and the exact energy
excluding the relativistic effects ie the electrons are propagating at speeds much slower
than light
The HF method is now used merely as a starting point for more elaborate lsquopost-HFrsquo ab
initio quantum chemical approaches99 because the poor performance of the HF method
offsets its efficiency and simplicity Correlation effects modify the electrostatic
interaction between the molecules due to changes in electron distribution and they tend
to reduce charge separations Electron correlation can be handled in quantum chemical
theory calculations using Moslashller-Plesset Perturbation Theory (MPPT) Density
Functional Theory (DFT)105 etc
273 Moslashller-Plesset Perturbation Theory In perturbation theory we start from a known solution and add a perturbation
Hamiltonian (equation 21) Moslashller and Plesset106 used perturbation theory to determine
the correlation energy (small perturbation) after solving the HF problem (the known
solution) Correlation corrections appear at the second order and beyond The zeroth-
order energy is the sum of the occupied orbital (eg HOMO) The first-order energy is
the HF energy26 MPn is the nth-order energy (n 2) In this thesis I did not perform
27 Electronic Structure Methods
50
geometry optimisations using MP2 methods for molecule(s) with 20 or more atoms due
to the computational expense
Although MP2 methods are used as the standard they have limitations For example
van Mourik61 noted that the MP2 description of intramolecular interactions with a -
electron system for flexible molecules is affected by a large intramolecular basis set
superposition error (BSSE) This large BSSE of MP2 was responsible for the wrong order
of stability for Phe-Gly-Phe tripetide107
BSSE is relevant in this thesis because many of the MP2 calculations were carried out
on flexible molecules that contained at least one aromatic ring (Chapters 3 to 5) The
origin of this error lies in the possibility that the unused basis functions of the second unit
B in the associated complex A∙∙∙B may augment the basis set of the first unit A thereby
lowering unit Arsquos energy compared to a calculation of this unit alone26108 This lowering
can be attributed to the variation principle that arises from the mutual enlargement of the
basis set of each monomer by the presence of the orbitals of its partner molecule109 Rather
than using an infinite basis set an impossible task the method for correcting this error is
to use a counterpoise (CP)
274 Density Functional Theory Density Functional Theory (DFT) is a cheaper alternative to MPPT Indeed P J
Stephens et al110 suggested in 1994 that in the future DFT might be preferred over the
MP2 method due to the lower computational demands of DFT That future is now for
DFT is currently the method of choice for first-principles electronic structure calculations
in condensed phase and complex molecular environments111112 Over the last 30 years
physicists working on the electronic structure of solids surfaces defects etc have used
DFT More recently DFT has become popular with theoretical and computational
chemists113
DFT is a theory of electronic structure exact in principle that is based on the electron
density distribution instead of the many-electron wave function111 DFT is based on a
theorem proposed by Hohenberg and Kohn114 which states that knowledge of the
electron density of a system in the ground state is enough to determine the energy lsquothe
energy is a functional of the densityrsquo2699105 A generalized DFT expression is
EDFT[ρ] = ENe[ρ] + T[ρ] + Eee[ρ] 227
where T[ρ] is the kinetic energy associated with the given electron density Eee[ρ] is the
electron-electron interaction energy and ENe[ρ] is the energy of interaction between the
electrons and lsquoexternalrsquo fields The ENe normally includes the interaction between the
27 Electronic Structure Methods
51
electrons and the nuclei but it can also include other fields imposed on the molecule
Each term depends on the electron density ρ
The exact form of T[ρ] and Eee[ρ] are not known and no fundamental theory for
determining them exists at present The usual route for solving this problem is to use the
method proposed by Kohn and Sham115 in 1965 that involves non-interacting electrons
For this system the electron density ρ(r) and the kinetic energy TS[ρ] (S denotes that
the kinetic energy is obtained from a Slater determinant) are exact while the Coulomb
(classical) part J[ρ] of the electron repulsion energy can be calculated The energy of the
system now takes the form
EDFT[ρ] = ENe[ρ] + TS[ρ] + J[ρ] + EXC[ρ] 228
where EXC the exchange-correlation functional is
EXC[ρ]=( T[ρ] - TS[ρ])+( Eee[ρ]- J[ρ]) 229
The exchange and correlation energy EXC is the functional that contains everything that
is not known Local-Density Approximation (LDA) and Generalized Gradient
Approximation (GGA) are used to approximate the EXC LDA the simpler
approximation assumes that the density corresponds to that of a homogeneous electron
cloud It proved to be an improvement over HF but is too inaccurate to be useful for
chemistry26 GGA an improvement on LDA incorporates dependency on electron
density and its gradient In practise hybrid (HF-DFT) functionals are used which
incorporate a portion of the lsquoexact exchangersquo from HF theory105 with exchange and
correlation from other sources (ab initio or empirical)
One of the most widely used hybrid functionals used is B3LYP which incorporates
Beckersquos three exchange-functionals116 (B3) with Lee Yang and Parr correlation
functional LYP117 PBE0118 another widely used functional was used in this thesis
(Chapters 3 to 6) These DFT methods are attractive because their results are comparable
to those obtained using MP perturbation methods but come at a much smaller
computational cost105
275 The DFT-D Approach DFT methods have drawbacks For one they are non-convergent in that no one knows
how to improve the results in a systematic way99119 The success of a particular functional
in one setting does not guarantee the performance in a different setting These drawbacks
led Orio99 to stress the importance of enhancing the credibility of DFT either by including
some form of validation or by estimating the error range through careful comparison
between the calculated and measured observable
28 Crystal Structure Prediction (CSP)
52
Another drawback is that the density functional cannot describe long-range electron
correlations responsible for dispersion forces112120 To overcome this defect researchers
have introduced corrections See refs120121 for a review of the impressive ongoing
attempts to improve the description of dispersion forces of DFT methods From a practical
viewpoint empirically damped ndashC6∙R-6 corrections to the standard density functional
approach provide robustness122 and speed We can solve the difficult dispersion
interactions classically This well-tested approach is DFT-D where -D stands for
dispersion correction The total energy is
EDFT-D = EDFT + Edisp 230
where EDFT is the self-consistent Kohn-Sham energy (equation 227) as obtained from the
chosen density functional and Edisp is an empirical dispersion correction Although DFT-
D was not used in this thesis it is nevertheless relevant because this discussion highlights
the importance of the dispersion contribution (ie correlation effect) to the overall energy
of the system
28 Crystal Structure Prediction (CSP) CSP assumes that the experimentally determined polymorphs correspond to local
minima in the crystal energy surface Elatt To put this approximation in context it is
important to note that the prediction of the relative thermodynamic stability of
polymorphs at a given temperature T and pressure p requires the minimisation of the
Gibbs free energy (G) with respect to the unit cell dimensions and the positions of all
atoms in the unit cell
where E is the internal energy V is volume and S is the entropy123 The variation in the
free energy arises from the differences in packing energy crystal density and entropy
Therefore all three terms associated with the Gibbs free energy (equation 233) should
be evaluated when determining the relative stability of polymorphs It is often the case
that only the lattice energy component of the first term (min E) is evaluated for two
reasons
The TΔS term is often neglected because the difference in lattice vibrational
energies between polymorphs is usually very small25124 At present the thermal
entropic and zero-point contributions to the Gibbs free energy cannot be readily
and accurate evaluated56
min G = min[E + pV ndash TS] 231
28 Crystal Structure Prediction (CSP)
53
The pΔV term could be calculated but is often neglected because of its small ΔV
value The compressibility of solids being low they contribute very little to Gibbs
free energy at normal pressure The pΔV term dominates at high pressure ie
10kbar125
Most of the computational approaches to CSP focus on minimising the lattice energy
The lattice energy Elatt is the internal energy at 0 K and 0 Pa ignoring the zero-point
energy The thermodynamic stability is not always the decisive factor in the packing
patterns of the molecules kinetics also plays an important role because it strongly
influences crystallisation conditions and solvent environment Nonetheless the
experimental structure is expected to appear within a narrow energy range of the global
lattice energy minimum56
Elatt can be calculated in several different ways depending upon the relative importance
of accuracy ease of implementation and computational cost in a given situation56
Ideally the lattice energy of a crystal should be calculated quantum mechanically but
such calculations are expensive Thus most approaches use force field methods andor a
cheap method to generate and evaluating the lattice energy in a hierarchal manner The
most successful CSP approaches rely on some form of the computationally demanding
but accurate electronic structure calculations either on an isolated molecule (to evaluate
the intramolecular contribution combined with the intermolecular contribution that has
been empirical fitted) or on a crystal (using periodic calculations)
Thus the key to successful CSP methods is not just the generation of all possible crystal
structures but also the accurate ranking of these generated crystal structures This ranking
requires balancing the intermolecular Uinter and intramolecular ΔEintra energy
contributions
where Uinter is the sum of the dominant electrostatics Uelec and repulsion-dispersion
Urepul-disp contributions and Eintra is the energy required to distort the molecule from its
gas phase conformation71 X denotes degrees of freedom that define the intermolecular
contacts while vector θ denotes the intramolecular degrees of freedom ie bond lengths
bond angles and torsion angles For rigid molecules there is no θ hence the ΔEintra (θ)
term vanishes For flexible molecules θ and hence ΔEintra (θ) must be accounted for from
the beginning
Elatt = Uinter (X θ) + ΔEintra (θ) 232
28 Crystal Structure Prediction (CSP)
54
281 CrystalPredictor
Chapters 3 and 4 use version 16 of CrystalPredictor126 which is different from rigid
or multiple rigid searches in that it incorporates conformation flexibility during the initial
search stage of crystal structures CrystalPredictor is not a black box it requires careful
analysis clear thinking and learning from earlier CSP studies CrystalPredictor performs
global lattice energy minimisation in order to predict the crystal structures of organic
molecules whose conformation is likely to be significantly affected by the packing forces
CrystalPredictor can find many plausible crystal structures in a multi-dimensional
space defined by the conformational degrees of freedom and lattice variables ie the
positions of the centre(s) of mass of the molecule(s) in the unit cell the orientation of the
molecules and the unit-cell dimensions and angles127 Within CrystalPredictor are two
important algorithms the Sobolrsquo128 sequence and the E04UFF NAG routine129 The
Sobolrsquo sequence generates the initial structures a characteristic of this approach is that
each Sobolrsquo corresponds to a distinct combination of every decision variable and thus
ensures a uniform and efficient sampling This prevents the problematic gaps and clusters
that random sampling can exhibit11 For more detail on how Sobolrsquo works see ref [128]
The E04UFF NAG routine129 carries out an extensive search for local minima of the
lattice energy surface using deterministic low-discrepancy sequences to ensure an optimal
coverage of the search space
CrystalPredictor models the lattice energy as the sum of the intramolecular and
intermolecular energy (equation 232) This lattice energy evaluation is crude but its
computational efficiency is necessary because CSP studies often require hundreds of
thousands of minimisations to sample the entire crystal energy surface The algorithm
computes the intramolecular energy as a function of flexible torsion angles using an
interpolation method on a set of quantum mechanically pre-computed intramolecular
energies by modelling the molecule as a set of rigid fragments connected by flexible
torsion angles The electrostatic contribution Uelec is evaluated by interpolating on pre-
computed atomic charges while an empirically fitted potential FIT34 computes the
repulsive-dispersive interactions Urepul-disp The sum of these two contributions is the
intermolecular energy Uinter=Uelec + Urepul-disp
In short CrystalPredictor is a minimisation algorithm
min Elatt = min[Uinter(X θ) + ΔEintra(θ)] 233
28 Crystal Structure Prediction (CSP)
55
that can generate crystal structures in the 59 most common space groups and with more
than 1 molecule in the asymmetric unit126 Z´gt1 However Chapters 3 and 4 limit the
search of hypothetical crystal structures to Z´=1 due to the huge computing time required
to generate Z´gt1 crystal structures
282 CrystalOptimizer CrystalOptimizer71130 refines crystal structures generated by CrystalPredictor126 To
account for the molecular flexibility accurately the CrystalOptimizer71130 algorithm is
required This algorithm solves the lattice energy problem (equation 233) as a two-level
optimization problem
The outer problem varies and ultimately optimizes the flexible conformational degrees
of freedom the remaining degrees of freedom are adjusted to minimize the intramolecular
energy127 A quasi-Newton scheme which ensures rapid convergence with many
optimization variable (X θ) solves the outer minimisation problem71 The inner
minimization problem optimizes the lattice energy for the fixed molecular conformation
determined by the outer problem The DMACRYS34 (section 26) program performs this
rigid body minimization CrystalOptimizer achieved a significant increase in the accuracy
of lattice energy calculations by127
1 allowing additional flexibility during lattice energy minimization (for example
considering more torsion angles andor bond angles as flexible degrees of
freedom)
2 accurately computing the intramolecular energy throughout optimization and
3 modelling the electrostatic interactions using distributed multipoles (up to
hexadecapole) obtained using the GDMA package52
Multiple ab initio calculations a very time-consuming process were often required
For this reason only the most promising structures from CrystalPredictor were used as
initial points for optimization Sometimes an intermediate step such as single-point ab
initio calculations (see Chapters 3 and 4) can improve the ranking of the lattice energy so
that only a handful of crystal structures (energy cut-off or a set number of unique crystal
structures minima) are optimized with CrystalOptimizer
CrystalOptimizer has one of the major featuresndashndashLocal Approximate Models (LAMs)ndash
ndashthat models the conformational energy and the multipole representation of the charge
density these are updated with explicit quantum mechanical calculations only when
necessary and not at every minimisation step The conformational energies their first and
min Elatt = min [ΔEintra(θ) + min Uinter(X θ)] 234
28 Crystal Structure Prediction (CSP)
56
second gradients and the distributed multipoles are also stored in the LAMs database
Re-using expensive electronic structure calculations (if the same conformational ranges
are encountered while minimising different hypothetical or experimentally determined
crystal structures) reduces the computing time without sacrificing accuracy7172130
283 Polarizable Continuum Model (PCM) Accurately modelling the balance between intramolecular and intermolecular energy is
important (eg using CrystalOptimizer) but just as important is modelling the effect of
the environment in distorting the conformer especially in cases where there is a
considerable difference in molecular conformations Cooper et al131 noticed that the total
calculated crystal energies which combine atom-atom model potential calculations of
intermolecular interactions with DFT intramolecular energies do not effectively
distinguish the real (known) crystal structures from the rest of the low-energy computer-
generated alternatives when the molecular electrostatic models are derived from isolated
molecule calculations They found that introducing a simple model for the bulk crystalline
environment when calculating the molecular energy and electron density distribution led
to important changes in relative total crystal energies and made possible the correct
distinction between the observed crystal structures and the set of computer-generated
possibilities This finding highlights the importance in CSP calculations of the
polarization of the molecular charge distribution especially for polar flexible
molecules131
In Chapters 3 and 4 PCM132 is used to account for the effect of organic environment
after generating and accurately computing the lattice energies using CrystalPredictor
that is an intermediate step that improves the electrostatic contribution to the
intermolecular energy and CrystalOptimizer I will model the polarizable continuum
environment with dielectric constants that is typical of molecular organic crystals ie ε =
3133 The PCM calculations only affect the final energy The geometry is not affected
because there is no molecular geometry minimisation of the crystal structure during the
PCM calculation
284 Other Approaches to Lattice Energy Minimisation There are other well-known approaches to lattice energy minimisations for flexible
molecules One computationally efficient approach is the Rigid CrystalPredictor-
Molecular Mechanics Method (RCM)17 by Graeme Day a variant on the method used in
Chapters 3 and 4 The first step performs constrained geometry optimization on a set
number of distinct conformations obtained from conformational analysis (the flexible
28 Crystal Structure Prediction (CSP)
57
torsion angles are fixed at the expected values from conformational analysis and all other
degrees of freedom are optimized) From this first step we can obtain the geometry
intramolecular energy and atomic charges The second step generates crystal structures
in 21 of the most common space groups by using a rigid CrystalPredictor134 search for
each distinct conformation17 Essentially the molecular geometries are treated as rigid
during the process of generating crystal structures The Uinter is calculated from the atomic
charges and an empirical exp-6 repulsionndashdispersion potential W99135 The third step
refines the most stable crystal structures obtained from the rigid-molecule searches For
this a two-stage procedure proposed by Day136 and co-workers is used The first stage
minimises the crystal structures by allowing the molecular geometry to relax using a
molecular mechanics description of energies associated with changes to the flexible
torsion angles This method trusts the molecular mechanics force field to provide the
correct molecular geometries but discards the energy which is not of sufficient accuracy
for the final ranking of crystal structures Then the resulting crystal structures are re-
optimized without further changes to the molecular conformations DMACRYS34 is used
to model the electrostatic interactions Uelec using the atomic multipole model The
remaining intermolecular terms Urepul and Udisp are obtained using the empirical W99
potential135 The intramolecular energy ΔEintra and the atomic multipole moments for
each conformation are derived from a single-point DFT calculation that incorporates the
PCM with a constant dielectric value of three to reflect the polarization effects in the
crystalline environment
Another approach is GRACE one of the most accurate minimisation methods This
approach presented by Neumann and Perrin was the first case wherein DFT-D methods
(sections 275) were applied to the CSP of molecular organic crystals First during the
crystal structure generation procedure a Tailor-Made Force Field (TMFF)13 developed
for fitting an atom-atom force field (non-bonded and bonding terms) specifically for each
molecule is used Then GRACE uses a hybrid method that combines the sum of the DFT
component and an empirical van der Waals correction ndashD (sections 274 and 275) to
re-optimise the lowest-energy crystal structures During this re-optimisation stage all
nuclear positions and electron density are optimised simultaneously which naturally
accounts for the molecular flexibility and other charge density reorganisation effects such
as polarization This approach reproduces experimental structures very accurately and
ranks the structures favourably amongst other hypothetically generated structures in many
(but not all) cases However these periodic DFT-D calculations are very expensive137
28 Crystal Structure Prediction (CSP)
58
285 The Crystal Energy Landscapes The CSP methods611 discussed above and many others sample a wide range of
possible crystal structures and determine the lattice energy in a hierarchal manner thus
generating a crystal energy landscape14 A crystal energy landscape is a plot of the lattice
energy against the density or the packing coefficient and it tells us how well the crystal
packs These landscapes often include the experimental structures as well as other low-
lying energy crystal structures that are worth comparing with the known polymorphs in
order to determine the types of intermolecular interactions and conformations that could
be feasible for a given molecule
In a crystal energy landscape in which only one crystal structure is calculated to be
more stable than any other by over a few kJ mol-1 typical of polymorphic energy
differences the molecule should only be found in that global minimum structure
Experiments or more demanding searches are needed to determine the stability relative
to multicomponent forms such as hydrates138 solvates139 or cocrystals140141 etc
However in most generated crystal energy landscapes there is typically a cluster of
structures within the energy range of plausible polymorphs These structures have to be
qualitatively assessed to see whether the barriers between the different structures are so
low that thermal motion in the crystal or molecular rearrangement during nucleation and
growth will ensure that only the most thermodynamically stable structure is seen Closely
related structures may also give rise to disorder142143 or plastic phases144 at higher
temperatures
The crystal energy landscape may suggest that alternatives to the known structures
could be found either as more stable or as kinetically trapped metastable polymorphs In
this case the calculations can complement experimental screening145 by suggesting
alternative methods146 such as a templating to produce new polymorphs147 The
knowledge of the crystal energy landscape can help avert problems in pharmaceutical
industries during the manufacturing process and guide the experimentalist search for
undiscovered structure In fact the study of the crystal energy landscape in Chapter 4
helped my colleague to discover a new polymorph (section 438) A way of testing
methodologies developed for predicting crystal structures is through lsquoblind testsrsquo
286 The Blind Tests The early lack of progress in CSP was termed a lsquocontinuing scandalrsquo in Nature in 1988
by John Maddox148 In response the Cambridge Crystallographic Data Centre (CCDC)
organised five lsquoblind testsrsquo10116667149 of organic CSP with the first lsquoblind testrsquo held in
29 Crystal Structure Comparison
59
1999 The blind test provided many researchers the opportunity to test their CSP methods
The fourth blind test results showed a dramatic improvement in the rates of success over
previous blind tests with one group (GRACE) correctly predicting four crystal structures
as their first ranked choice albeit at a considerable computational expense10
In the fifth blind test our research group successfully predicted the crystal structure of
molecule XX1117 which has eight flexible degrees of freedom (internal degrees of
freedom) using CrystalPredictor and CrystalOptimizer algorithms I use a similar
approach in Chapters 3 and 4 The fifth blind test showed that methodologies such as
DFT-D could reliably predict the structures of small organic molecules but GRACE was
unsuccessful for molecule XX11 CCDC released the sixth lsquoblind testrsquo molecules in mid-
September 201415 too late for me to take part By chance an informal lsquoblind testrsquo
challenge did arise during the second year of my research which is the focus of Chapter
3
29 Crystal Structure Comparison Collins et al150 argued that one of the problems modern scientists face is the issue of
structural similarity and difference They noted ldquocriteria for deciding when two crystal
structures are the same is an issue that divides many structural analystsrdquo Indeed this
problem of determining how similar or different two or more crystal structures are was
what inspired researchers to create methods for comparing crystal structures that exist
today The visual inspection of similarities and differences between crystal structures
does have its benefits but the method is slow and susceptible to human bias Thus
researchers need a practical computational method that enables them to identify identical
or similar structures
Identifying the similarities among crystal structures is important when deciding
whether a newly discovered structure is the same as an existing structure151 Sometimes
there is also a need to determine similarities when comparing many structures that are
related as in the case of 50 structures of carbamazepine (CBZ)150 Another reason for
identifying similarities lies in the field of CSP67152 where thousands of hypothetical
structures are generated and many structures converge to the same or approximately the
same structure during lattice optimization Therefore the removal of duplicates and the
production of unique lists of crystal structures are essential
The Mercury153 material module which has COMPACK151 embedded in it allows
graphical representation of the similarity among the polymorphs while standalone
COMPACK scripts can compare hundreds of thousands of crystal structures There are
29 Crystal Structure Comparison
60
three main tools in the material module153 motif search crystal packing feature and
crystal packing similarity tools The crystal packing similarity tool calculates the level of
packing similarities between crystal structures that have the same or similar compound
COMPACK computes these calculations by analysing the geometry of the cluster of
molecules There are two basic steps in comparing two crystal structures using
COMPACK The first step renders the chemical search query subject to several geometric
constraints using the reference molecular structure The second step is the structure
similarity search which involves searching the 3-D coordinates of a target for an
arrangement that matches the query to within specified tolerances The search is
performed by 3DSEARCH154 which is an efficient general search algorithm designed to
find chemical queries within 3D crystal structures information Once 3DSEARCH finds
a match the two structures can be superimposed to obtain a visual impression of their
similarity
The default values for a cluster size of 15 molecules a distance tolerance of 20 and
angle tolerance of 20 are usually used The default cluster size is 15 because the same
clustering results of 30 molecules instead of the default 15 molecules for 1000 predicted
structures of 2-amino-3-nitropyridine led Chisholm and Motherwell151 to the conclusion
that a cluster of 15 molecules is a sufficient size for identifying the same crystal structure
Other methods of comparing crystal structures do exist For example XPac155156
identifies similar sub-components of complete crystal structures of 0- 1- or 2-D in
polymorphs or crystal structures of similar molecules as well as of 3-D in isostructural
assemblies Hirshfeld surface (a way of exploring packing modes157) and fingerprint plots
(a visual representation of all intermolecular interactions simultaneously158) are examples
of Hirshfeld-based methods150159160 of analysing similarities The graphndashset analysis for
H-bonds compares and contrasts sets of molecules161-163 and is based on graph theory for
categorising H-bond motifs Moments of inertia tensors is a technique for comparing
crystal packing based on moments of inertia tensors irrespective of chemical connectivity
and hence the comparison of compounds of diverse chemical composition is possible164
Simulated powder X-ray diffraction165 is another example of comparing crystal
structures In short the comparison of compounds of diverse chemical composition is
possible
COMPACKrsquos ability to give just one number (the distance between matched atoms in
a cluster-root-mean-square-deviation) that shows the relationship between two structures
makes this similarity tool one of the simplest and most effective ways of quantitatively
29 Crystal Structure Comparison
61
rationalising similarity This is why COMPACK will be the primary choice for comparing
crystal structures in this thesis
31 Introduction
62
Chapter 3 An Informal Blind Test A Crystal Structure Prediction of
1-Benzyl-1H-tetrazole
ldquoOne of the continuing scandals in the physical sciences is that it remains in general
impossible to predict the structure of even the simplest crystalline solids from a
knowledge of their chemical compositionrdquo
mdash John Maddox Nature (1988)
31 Introduction
311 Background This chapter reports an informal lsquoblind testrsquo of flexible 1-benzyl-1H-tetrazole BT
(Figure 31) using similar CSP methodology that successfully predicted the very flexible
molecule XX in the fifth blind test1117 In essence I will test the viability of the CSP
method (sections 11 and 28) which has evolved over the years from predicting the
crystal structures of rigid molecules166-168 to molecules that are so flexible that their
conformational flexibilities are accounted for at the start of CSP1117
9
10
1
8
7
2
11
123
65
4
2
1
Figure 31 The chemical diagram of BT determined from the crystal structure Torsion
angles 1=C7-C6-N1-C5 and 2 = C12-C7-C6-N1
In the previous chapters I mentioned that the emergence of a new polymorph of
ritonavir two years after market lunch (section 11) as well as John Maddoxrsquos148
ldquocontinuing scandalrdquo remark in 1988 (section 286) were the catalysts of the lsquoblind testrsquo
challenge organised by the Cambridge Crystallographic Data Centre (CCDC) in 1999
These lsquoblind testsrsquo provided researchers all over the world an opportunity to test their
CSP methods But unfortunately the CCDCndashndashmy industrial sponsorndashndashdid not organise
any lsquoblind testsrsquo during the course of the research reported in this thesis15 By chance my
colleague Rex Palmer observed an unusual packing of BT crystal structures and
subsequently issued me a lsquoblind testrsquo challenge This challenge was to predict the crystal
structure of BT given just the chemical diagram (Figure 31) and given that Z´=1
31 Introduction
63
The drug discovery literature frequently mentions the motifs of 5-substituted 1H-
tetrazole as bioisosteres for the carboxylic acid group169-171 due to the motifsrsquo similar pKa
values shapes and steric interactions Bioisosteres are structural moieties with broadly
similar shapes and functions For pharmaceutical industries the ability to model the
interactions of tetrazoles including BT is of great interest due to tetrazolersquos bioisosteres
feature
312 Experimental Determination of 1-Benzyl-1H-Tetrazole My collaborators (John Spencer Hiren Patel John J Deadman Rex Palmer Louise
Male and Simon J Coles) carried out the following experiments (their findings in
sections 313 and 314 were not made available to me until the end of the lsquoblind testrsquo
ie the submission of my candidate structures)
Synthesis and X-Ray Crystallography
John J Deadman synthesized BT on a ca 50 mmol scale from benzylamine sodium
azide and triethyl formate Hiren Patel under the supervision of John Spencer grew the
single crystals of BT from dichloromethanendashhexane
Louise Male and Simon J Coles collected the X-ray data and did the preliminary
analysis A colourless crystal fragment of dimensions 009 003 002 mm3 was
mounted on a glass fibre and flash-frozen to 120 K The X-ray data were collected on a
Bruker diffractometer using Mo K radiation The crystal structure was solved by direct
methods SHELXL-97172-174 was used to refine the crystal structure
313 Molecular Geometry of the Experimental Structure My collaborators discovered that BT crystallised in the monoclinic space group P21
with unit cell dimensions a = 76843(5) b = 55794(4) c = 94459(7) Aring = 100949(4)
deg V = 39761(5) Aring3 Z´= 1 and density = 1338 g cm-3 Overall the benzyl and tetrazole
rings were essentially planar including the H atom on the CH group (see C5 in Figure
31) belonging to the 5-membered tetrazole ring The individual rings were also co-planar
with the inter-ring link C6 atom (Figure 31) The N-N bonds (see bond lengths in Table
31) were of three different types consistent with Figure 31 N1-N2 = 1343(2) Aring N2-N3
= 1301(2) Aring is longer than a typical N = N bond175 but shorter than a typical aromatic
bond N3-N4 = 1368(2) Aring was also largely aromatic in character175 The two C-N bonds
have different characteristics C5-N4 = 1314(2) Aring was a double bond C5-N1 = 1336(2)
Aring was typically aromatic175 The phenyl rings of BT have a normal geometry with
average CndashC bond length of 1386(4) Aring average bond angle of 1200(7) and ring
planarity root mean square (rms) deviation of 00057 Aring The bond angles in the tetrazole
31 Introduction
64
ring have an average of 1080(17) which is consistent with the planarity of the ring
having an rms deviation of 0012 Aring including the link C atom and H5 on C5 These bond
lengths and angle measurements are similar to those of 5-azido-1H-tetrazole176
Table 31 Angles and bond lengths of the tetrazole ring in BT No information about the
bonds or angles were given to me prior to submission of the candidate structures
Angles X-ray
deg Bond lengths X-ray
Aring
N1-N2-N3 1069(2) N1-N2 1343(2)
N2-N3-N4 1102(2) N2-N3 1301(2)
N3-N4-C5 1052(2) N3-N4 1368(2)
N4-C5-N1 1096(2) N4-C5 1314(2)
C5-N1-N2 1080 (2) C5-N1 1336(2)
C5-N1-C6 1305(2) N2-C1 1472(2)
N2-C1-C6 1215(2)
314 Crystal Packing Weak Hydrogen Bonding Rex Palmer noticed that the mode in which the molecules in the experimental crystal
structure BT were packed was unusual He noted that a molecule such as BT based on
linked delocalized rings might be expected to form crystal structures involving ∙∙∙
bonding (ring stacking) However no such interactions occurred in the experimental
structure (Figure 32) Instead the structure was held together by a large number of weak
intermolecular contacts177178 12 of these were of the CH∙∙∙N interaction and 3 were of
the weaker CH∙∙∙C interaction which involve atoms in the phenyl ring This unusual
packing resulted in a structure composed of infinite S-shaped layers and produced a
sequence of benzyl and tetrazole layers (Figure 33) Another unexpected feature of the
packing was the formation of tetrazole clusters (Figure 32a) each having a central
tetrazole ring coordinated by six other tetrazoles
Figure 32 The crystal structure of BT (a) Partial view of the crystal packing showing
close CH∙∙∙N contacts between a central tetrazole and six surrounding tetrazoles (b)
Partial view showing CH∙∙∙N CH∙∙∙C and CH∙∙∙ contacts
(a) (b)
31 Introduction
65
Figure 33 BT crystal structure (a) View of the infinite S-shaped layers held together by
weak CH∙∙∙N and CH∙∙∙C H-bonds (b) Partial view of the layer structure showing
alternative B(benzyl) and T(tetrazole) layers and the repeating layer sequence [BTBT |
TBTB]
315 Overview of the Challenge After my experimental collaborators grew single crystals of BT from a non-polar
solvent mixture and determined the crystal structure at 120 K I was issued a lsquoblind testrsquo
challenge by Rex Palmer to predict the crystal structure of BT because of the unusual
mode of crystal packing (section 314) No experimental information was given prior to
the submission of the candidate structures The subsequent part of this chapter presents
the computational work I carried out independently upon receiving the chemical diagram
of BT (Figure 31)
This chapter uses CSP methodology (section 322) to predict the crystal structure of a
molecule that can adopt a wide range of molecular shapes due to the conformational
flexibility of the molecule Consequently the conformational flexibility must be
accounted for at the start of CSP (CrystalPredictor 16 section 281) In addition this
method relies on the systematic improvement of the evaluation of the lattice energy Elatt
where Uinter and Eintra are the intermolecular and intramolecular contributions X and
vector θ denote intermolecular and intramolecular degrees These systematic
improvements increase the computing time As a result it is essential to reduce the
number of crystal structures that will be examined as the confidence in the lattice energy
ranking improves in each step
This chapter will also test the transferability of the intermolecular energy potential to
BT since this molecule contains a functional group that differs from those used in
determining the parameters of the intermolecular potentials (section 23)3839
Elatt = Uinter(X θ) + ΔEintra(θ)
31
(b) (a)
32 Computational Methodology
66
To determine whether this study is a success the predicted structures of BT will be
compared with the experimental crystal structures using a similarity tool In addition I
will compare and contrast the most stable generated structures of BT with the similar
tetrazole fragment structures to determine whether the packing of the experimental
structure of BT was unusual In this chapter I will show that the crystal structure of BT
can be successfully predicted starting from just the chemical diagram (Figure 31)
32 Computational Methodology
321 Conformational Analysis To restrict the search space of BT to energetically meaningful regions I carried out
quantum mechanical (MP26-31G(dp) single-point calculations on HF6-31G(dp)
optimised geometries) scans of the two flexible torsions 1 and 2 (Figure 31) using the
GAMESS179 program
322 Crystal Structure Prediction Step 1 The search was carried out using the CrystalPredictor126 program which
covered the 59 most commonly occurring space groups The lattice energy was minimised
by varying the cell parameters and torsion angles 1 and 2 within energetically
meaningful regions (section 321) At this stage the lattice energies (equation 31) were
crudely estimated and then using the grid of the ab initio results from section 321 the
ΔEintra contribution were interpolated The intermolecular electrostatic interactions were
modelled using the atomic charges derived from section 321 All other intermolecular
energy terms were derived from an empirical exp-6 potential FIT40 Approximately a
quarter of a million lattice energy minimisations were performed This produced
approximately 170000 distinct structures of which 44000 structures were unique These
generated structures were labelled by their energy ordering The result of step 1 is the
CrystalPredictor energy landscape
Step 2 Next the lattice energy model was improved For each of the lowest 10000
crystal structures the energy of the isolated molecule and its charge distribution were
calculated at the PBE06-31G(dp) level of theory using GAUSSIAN0353 This
calculation provided a better estimate of ΔEintra and a more accurate representation of the
charge density in terms of a distributed multipole model51 These two contributions were
then combined with an atomndashatom exp-6 repulsion-dispersion potential using parameters
that had been fitted to azahydrocarbons39 and polar crystal structures40 which were
assumed to be transferable to this tetrazole At this stage the lattice energy was
minimised with the molecule held rigid using DMACRYS34
33 Results and Discussion
67
Step 3 Approximately 100 of the most stable structures were then further refined at
the PBE06-31+G(d) level of theory by allowing the molecular conformation to adjust
more accurately to the intermolecular forces using the program CrystalOptimizer7172
(section 282) This algorithm allowed the intermolecular and intramolecular energy to
be minimised simultaneously The CrystalOptimizer program uses the Quasi-Newton
algorithm coupled with a line search to solve the minimisation program It also makes use
of GAUSSIAN0353 calculations on the molecular conformations and DMACRYS34
optimisations of the crystal structure
Step 4 The effect of the crystal environment on the conformational energies ΔEintra and
charge densities was estimated by calculating the conformational energy and charge
distribution in a Polarizable Continuum Model (PCM)180 with =3 a value typical of
organic molecules131 This calculation was implemented in GAUSSIAN0353 at the
PBE06-31+G(d) level of theory The result of step 4 is the PCM crystal energy landscape
33 Results and Discussion
331 Conformational Energy Grid
Figure 34 The conformational energy grid used in the search Relative intramolecular
energies ΔEintra (kJ mol-1) for isolated molecule calculations at the MP26-31G(d p)
level of theory
Prior to the generation of hypothetical structures it was necessary to investigate the
possible steric hindrances to rotation about the two flexible torsion angles 1 and 2
(Figure 31) The result shown in Figure 34 indicates a high degree of flexibility in the
molecule The purple colours represent regions with the smallest energy penalty ie the
33 Results and Discussion
68
most stable conformations This high degree of flexibility makes possible a wide range
of crystal structures with different molecular shapes For this reason the generation stage
(step 1 of sections 322 and 332) incorporates conformational flexibility from the start
332 The CrystalPredictor Energy Landscape The analyses presented here are post-process ie after submitting the ten most likely
crystal structures on the PCM (final) energy landscape (step 4 section 333) The energy
landscape after step 1 (CrystalPredictor) is displayed in Figure 35 This step estimated
the lattice energies Elatt very crudely by interpolating the atomic charges and
intramolecular energies (Figure 34) Yet the generated structure that matched the
experimental structure of BT at this stage was only ranked 23rd This structure BT_23
which is highlighted in red on Figure 35 has only a 3 kJ mol-1 energy difference in
comparison with the global minimum structure
Figure 35 The CrystalPredictor energy landscape of BT generated with a crude lattice
energy model The generated structure that matched the experimental structure is
highlighted in the open red symbol
333 The CrystalOptimizer and PCM Energy Landscapes The two most stable crystal structures on the PCM energy landscape (Figure 36b) have
similar lattice energy less than 01 kJ mol-1 The lsquoblind testrsquo was deemed a success
because the experimental structure matched the second most stable crystal structure
2BT_23 on the PCM energy landscape (Figure 36b and Table 32) This PCM energy
landscape was generated after CrystalPredictor (step 1 Figure 35) lattice energy
refinement (step 2) CrystalOptimizer (step 3 Figure 36a) and PCM calculations (step
33 Results and Discussion
69
4 Figure 36b) Compared to the first step (step 1 Figure 35) the lattice energy rank of
the experimental structure improved significantly from 23rd to 2nd
Figure 36 (a) The CrystalOptimizer (step 3) and (b) PCM (step 4) energy landscape of
BT GM is the global energy minimum The open red symbol represents a match between
the experimental crystal structure and the generated structure The energy ranking of the
crystal structure that matches the experimental has improved from fourth most stable 4
to second most stable 2
(a)
(b)
33 Results and Discussion
70
I submitted a list of 10 structures in which the 2BT_23 structure was selected as the
first choice while the global minimum (labelled GM on Figure 36b) was selected as the
second choice181 The main reason for selecting 2BT_23 as the first choice was the
notable improvement of energy rank from fourth (Figure 36a step 3) to second (Figure
36b step 4) In addition the two most stable crystal structures on the PCM energy
landscape (Figure 36b step 4) were only 01 kJ mol-1 apart
Table 32 Summary of experimental (highlighted in blue) and computed crystal
structures on the PCM energy landscape (Figure 36) The computed structure that
matched the experimental structure (section 312) is highlighted in bold For label
xBT_y x and y are energy ranked after steps 4 and 1 of CSP respectively (section 322)
Label Space Group
a b c
Aring
β
deg
ρ
g cm-3
Uinter ΔEintra Elatt
kJ mol-1
1BT_120 P21c 999 817 1104 11750 133 -12176 225 -11952
2BT_23 P21 793 555 944 10132 131 -12152 208 -11944
Experiment P21 768 558 945 10095 134 - - -
3BT_165 P21c 1086 554 1597 12141 130 -12109 270 -11839
4BT_335 P212121 938 1581 556 9000 129 -12032 200 -11833
5BT_767 P21c 941 553 1580 10234 132 -12044 214 -11830
6BT_167 P21 568 839 881 10322 130 -12289 504 -11785
7BT_912 P21 557 869 861 10365 132 -11882 143 -11739
8BT_34 P21c 809 553 1859 10166 131 -11919 219 -11700
9BT_491 Pna21 1666 566 858 9000 131 -12299 626 -11673
10BT_250 P212121 1904 557 778 9000 129 -11916 325 -11591
11BT_55 P21c 1080 556 1582 12232 132 -11979 396 -11583
12BT_490 P21c 653 866 1394 9428 135 -12098 521 -11577
13BT_178 P212121 833 561 1764 9000 129 -11789 232 -11557
334 Did the Predicted Structure Really Match the Experimental Rex Palmer provided the cif file of the experimental structure once ten of the most
stable structures on the PCM landscape were submitted (Figure 36b) Then I compared
the experimental structure with the submitted crystal structures using COMPACK151 The
computed 2BT_23 structure my first choice (section 333) gave an excellent overlay
with 15 molecules of the experimental structure with a root mean square difference
RMSD value of only 0148 Aring (Figure 37) This computed 2BT_23 structure has similar
unit cell dimensions (Table 32) and is in the same space group P21 as the experimental
structure
33 Results and Discussion
71
Figure 37 The 15-molecule overlay between the experimental (atomic colours) and the
second most stable computed structure 2BT_23 (green) The direction of the view
obscures some of the molecules
In addition to excellent RMSD15 overlay the 2BT_23-generated structure provided a
starting model that was easily refined in SHELXL-97 which was further proof that the
structure was a genuine reproduction of the experimental crystal structure (section 312)
Hence it is clear that the CSP method outlined in this chapter which uses only the
chemical diagram as prior information can successfully predict the crystal structure of a
flexible molecule
335 The Global Minimum Structure on the PCM Energy Landscape The global minimum GM structure labelled 1BT_120 on the PCM energy landscape
(Figure 36) was very different from the experimental crystal structure as only two
molecules overlaid (Figure 38) during similarity calculations From the overlay of the
similarity calculations (Figure 38) it is clear that the GM and the experimental structure
have different conformations The GM structure 1BT_120 (Table 32) is in space group
P21c and has a very different spatial arrangement (as shown in Figure 39) when
compared to the experimental structure (Figure 32 and Figure 33) This structure also
has dominant weak H-bonds 8 CH∙∙∙N and 1 CH∙∙∙C interactions There was also one
weak ∙∙∙ benzyl∙∙∙benzyl interaction (Figure 39)
The similar lattice energy values of the two most stable structures generated (Figure
36b) suggest that the GM structure could a polymorph This GM structure could be
33 Results and Discussion
72
synthesised at high pressure because it is the denser of the two most stable structures
Also growing the experimental structure using a non-polar solvent (section 312) may
have prevented H-bonding formation
After the generation step (CrystalPredictor) the initial rank of the most stable crystal
structure after step 4 GM was 120th The eventual rank was first despite the fact that
only about 100 structures were optimised this shows the importance of the novel
intermediate step 2 in the CSP method After the CrystalPredictor step 1 the GM
structure was 9 kJ mol-1 less stable than the experimental 2BT_23 structure and had
distinctly fewer close contacts than the experimental 2BT_23 structure Therefore the
rearrangement of lattice energy depends on the method used
Figure 38 Crystal Packing Similarity between experimental (grey) and the most stable
predicted structure (1BT_120 green) with only 2 molecules matching (RMSD2 = 1072
Aring)
Figure 39 The structure corresponding to the global minimum in lattice energy
(1BT_120) showing the dominant weak H-bonds (Aring) eight of type CH∙∙∙N and one
CH∙∙∙C and the weak ∙∙∙ interaction (benzylmiddotmiddotmiddotbenzyl)
33 Results and Discussion
73
336 Post Analysis Comparison of Structure with CSD The motivation for the lsquoblind testrsquo challenge was the unusual packing of the
experimental structure Thus a database containing over half-million crystal structures
was searched in an effort to investigate the breadth of variation in the packing of the
experimental structures of BT A Cambridge Structural Database (CSD)182 survey was
carried out to compare BT with other 1-substituted 1H-tetrazole crystal structures (Figure
310) The CSD version 533 March 2012 was searched for fragments defined in Figure
310 The bond lengths bond angles and torsion were analysed and compared with the
experimental structure using histogram plots
1
6
23
5
4
Figure 310 Query used in Conquest to search the CSD for similar fragments
The query of the CSD yielded 34 structures including two redeterminations The
refcodes of these 32 structures were ACIROU ACIRUA BEGRIP CAZWIK
DOKQEA DOKQIE EKAJOQ HISYEO IQUJEK ABMIL LUVPIC MEVWOZ
MUKMAG PHTETZ01 PUGLUZ QALNOH QALNUN QALPAV QALPID
QALPOJ QALPUP QALQAW QALQEA01 QALQIE QEBPUI01 REVMOV
REZNUG RIZXEE SOLHAD TIJLIH VUNNUO and OBAREQ
The experimental bond lengths were typical of those in the other crystal structures
containing the 1-substituted 1H-tetrazole group (Figure 311) Some significant
differences ( 002 Aring) were observed between the ab initio computed values and the
experimental bond lengths but both were within the observed ranges The variations in
tetrazole bond angles (Figure 312) were consistent with the bond length variations for
this moiety176 which was always close to planar The external torsions angles ξ1 and ξ2
exhibited a wide range of values (Figure 312) a result that was consistent with the large
range of low-energy conformations (Figure 34) despite the range of functional groups
bonded to C6
No tetrazole clusters were observed for the 32 1-substituted 1H-tetrazole structures
found in the CSD There were however some tetrazole layers in 1BT_120 and the
33 Results and Discussion
74
experimental structures DOKQIE EKAJOQ QALPAV QALPOJ QALPUP and
REVMOV All 32 structures had the tetrazole bonded to a sp3 carbon and were tetrazole
hydrocarbons (except QALPAV which also contained an iodine atom) Hence there was
no strong driving force for the tetrazole cluster Still a layer structure seemed to be quite
favourable in cases where there were no competing strong interactions There were more
similarities between the CSD tetrazole structures and the GM structure than there were
between the experimental structures This finding suggests that the use of informatics of
CSD in CSP such as Desirajursquos supramolecular synthon approach183 would weight the
global minimum structure more than the experimental structure
Figure 311 Histograms showing the bond length distributions of 32 1-susbtituted 1H-
tetrazole rings in the CSD The red square denotes the experimental bond lengths in BT
while the black square denotes the ab initio bond lengths in the corresponding calculated
structure 2BT_23
33 Results and Discussion
75
Figure 312 Histograms showing the distributions of the torsions and angles of the 32-
tetrazole rings found during the CSD survey The experimental bond length in BT is
denoted by the red square while the ab initio bond length in the corresponding calculated
structure 2BT_23 is denoted by the black square
34 Summary
76
34 Summary I successful predicted the unusual crystal packing of BT given just the chemical
diagram and the Z´ number The packing was predicted by using a model that accurately
determines the electrostatic forces arising from molecular charge density including the
anisotropic forces from the lone pair and electrons but otherwise was not tailored to
the tetrazole∙∙∙tetrazole interactions Thus the intermolecular energy potential is
transferable to BT crystal structure even though the functional group used in determining
the parameters of the intermolecular potentials did not include a single tetrazole molecule
The successful prediction of the experimental structure as one of the two distinct most
stable structures shows that the unusual layers do present an optimal compromise between
the many different weak hydrogen bonds and other intermolecular interactions The most
stable crystal structure GM could well have been an undiscovered polymorph In fact
informatics weighting may have selected this structure Thus this study shows the
potential value of CSP for generating unexpected structures
This study also showed that the level of computational chemistry modelling that was
used is suitable for modelling the molecular recognition of this functional group This
level of modelling could become increasingly useful in pharmaceutical design due to
tetrazolesrsquo bioisosteres properties In the next chapter more will demanded of CSP Will
this method deliver
41 Introduction
77
Chapter 4 Is the fenamate group a polymorphophore Contrasting the
crystal energy landscapes of fenamic and tolfenamic acids
ldquoIts the little details that are vital Little things make big things happenrdquo
mdash John Wooden
41 Introduction This chapter builds on Chapter 3rsquos description of a procedure that successfully
predicted the experimental crystal structure of a flexible molecule in order to address two
specific questions First in a given molecular structure is the presence of a
polymorphophore (section 11) substructure sufficient to ensure polymorphism Second
what role do substituents play in determining the range of polymorphs that are present in
a molecule
In this investigation of the concept of polymorphophore I will use CSP to contrast the
crystal energy landscapes of two fenamates (Figure 13) monomorphic fenamic acid (2-
(phenylamino)-benzoic acid FA) and one of its highly polymorphic derivatives
tolfenamic acid (2-[(3-chloro-2-methylphenyl)amino]-benzoic acid TA) TA is a good
test case for this investigation into whether the fenamate group is a polymorphophore
because at the start of this study TA had five known polymorphs19
The term ldquofenamaterdquo can refer to a range of molecules that vary widely in molecular
structure including niflumic acid which contains an aromatic nitrogen Although some
researchers who have conducted thermodynamic and structural investigations of
fenamate molecular crystals have included an extraordinarily wide range of molecules
even dichlofenac184 the present study is restricted to the fenamates shown in Figure 13
Essentially I will focus on cases where the dominant interactions that determine the
crystal or drug binding are inherent in the proposed polymorphophore families of fenamic
acid (Figure 13)
41 Introduction
78
ROY fragment
WIFHUP 2185
R=H
ROY
QAXMEH 7(3)20
R2=CH3
OGIDEN 3186
R2=R5=CH3
Fenamate fragment
Fenamic acid (FA)
QQQBTY 1187
R=H
Tolfenamic acid (TA)
KAXXAI 519
R1=CH3 R2=Cl
Flufenamic acid (FFA)
FPAMCA
2(1)22
8(1)18 in 2012
R2=CF3
PEFMET 1188
R1=CH3
PEFNAQ 1188
R2=CH3
SURMEY 1187
R3=CH3
Mefenamic acid
XYANAC 2(1)189190
R1=R2=CH3
SURMOI 1187
R2=R4=CH3
LAHLOW 1191
R1=R5=CH3
Figure 41 The polymorphophore families of ROY and fenamic acid The numbers of
polymorphs in the Cambridge Structural Database (CSD) follow the refcodes for each
specific molecule and (x) denotes the number of additional polymorphs that whose
crystal structures were not available The lowest two rows are fenamates whose structures
are used in Table 46
41 Introduction
79
411 Polymorphism and Polymorphophores Polymorphism (section 11) the occurrence of multiple crystal structures with the same
chemical content is now known to be a widespread phenomenon among organic
molecules192 and is of great importance in the industrial manufacture of specialty
chemicals and pharmaceutical products Relatively few systems have several polymorphs
whose crystal structures and relative stabilities have been determined the most
thoroughly investigated20 being the polymorphs of 2-[(2-nitrophenyl)amino]-3-
thiophenecarbonitrile commonly known as ROY (Figure 13) after the red orange and
yellow colour spectrum of the first six polymorphs to be reported193 Some families of
related molecules23194 such as the sulphonamides194 ROY derivatives23 barbiturates195
carbamazepine derivatives147196 and fenamates19 appear to have a strong tendency
toward polymorphism This fact has given rise to the study of a polymorphophore1923196
a term coined by Matzger23 that refers to a structural element that when incorporated into
a molecule favours the formation of polymorphic crystal forms Hence
polymorphophore is a descriptive term and not a quantifiable hypothesis
The focus of this chapter is the polymorphophore concept Some families of molecules
contain a common substructure (the polymorphophore) wherein many members but not
necessarily all exhibit polymorphism For example removing or adding a methyl group
to ROY creates molecules (Figure 13) that are also polymorphic indicating that ROY is
a polymorphophore (Figure 13) However the number of related molecules is limited
probably because ROY is only a precursor in the synthesis of the blockbuster drug
olanzapine Studying polymorphophores is like studying pharmacophores a particularly
promising way of finding new leads in drug discovery especially in cases when a
receptorrsquos 3D structure is unknown197
This chapter considers the fenamates that conserve the H-bonding groups and dominant
molecular shapes by having small non-polar substituent groups for the aromatic protons
as exemplified in Figure 13 These types of substituent(s) might be expected to have
minimal effects on the strongest intermolecular interactions and hence on either crystal
packing or drug receptor binding The fenamates contain a proposed
polymorphophore1819 that is related to that of ROY (Figure 13) in having a phenyl group
attached via an N-H group to a further aromatic ring
412 Conformations in known Crystal Structures The overlay of the conformers of FA and TA in the experimental crystal structures
(Figure 42) confirms that the main variation in conformation is the ξ1 torsion angle The
41 Introduction
80
two most stable polymorphs of TA forms I and II (blue and red in Figure 42) have the
greatest difference in ξ1 The benzoic acid ring and the N-H groups are coplanar with the
ξ2 torsion angle being approximately zero concordant with the intramolecular H-bond
Figure 42 Overlay of the experimental conformers of FA (top) and TA (bottom) viewed
with the overlaid benzoic acid fragment arranged horizontal FA QQQBTY02 (Z´=2
light blue and magenta) TA KAXXAI01 (Form I Z´=1 blue) KAXXAI (Form II Z´=1
red) KAXXAI02 (Form III Z´=2 green and purple) KAXXAI03 (Form IV Z´=3
yellow brown (obscured by yellow) and black) and KAXXAI04 (Form V Z´=1
disordered on both sites (section 415) violet and grey) The arrows point to the main
variation (ξ1) between the conformers of FA and TA in the experimental crystal
structures
413 Experimental Data of FA and TA FA has just one known form187 which has two molecules in its asymmetric unit Z FA
serves as a parent structure for several fenamates including TA TA is a non-steroidal
anti-inflammatory drug used for the treatment of rheumatic conditions198 At the start of
this study TA had at least five polymorphs forms I-V19199 It currently has six
polymorphs (see section 438) Unlike ROY the polymorphs of TA vary in the number
ξ1
ξ1
41 Introduction
81
of molecules in the asymmetric unit Z´ (Table 41) The variation in colour that is
observed between form I (colourless) and II (yellow) is due to the conformational
difference as observed for ROY2023 There were three undisputedly metastable
polymorphs including form V whose disorder is analysed further in section 415
Here it is necessary to discuss further the relative stability of forms I and II (Table 41)
The enthalpy and temperature of fusionHfus and Tfus measurements provide a way of
classifying polymorphs as either being monotropic or enantiotropic Four different
papers19199-201 have presented evidence for the thermodynamic relationship between
forms I and II but each paper gives slightly different conclusions Surov et al showed
that the yellow form (form II) is more stable than the white form (form I)201 and that these
polymorphs have a monotropic relationship because the form with the higher melting
temperature form II has a higher enthalpy of fusion Hfus (by the enthalpy of fusion
rule)202 as illustrated in Figure 43(a) However Mattei and Li200 measured an
endothermic transformation going from II to I with temperature increasing to 1418 degC
with a Differential Scanning Calorimetry (DSC) implying that forms I and II have an
enantiotropic relationship as shown in Figure 43(b) The observed transformation from
form II to I in a slurry experiment indicated that the thermodynamic transition point was
below room temperature All three sets of measurements199-201 that were extrapolated to
0 K had form II more stable than form I
Table 41 The experimental data of the known forms of FA and TA Crystal structures
and Hfus values were taken from ref [19] unless otherwise specified aThe most widely
varying torsion angle ξ1 is defined in Figure 49 bTemperature of crystal structure
determination cMelting temperature
REFCODE (form)
Space Group
Z´ ξ1a
deg Tb
K
Hfus
kJ mol-1
Tmc
K
FA QQQBTY02 P-1 2 4721 7045 283-303187 - - TA KAXXAI01(I) P21c 1 10774 3937 48625-4886
110 4250 48405199
410plusmn05 48418plusmn02201
4127 48585200
KAXXAI(II) P21n 1 4223 387 48667
110 4840 48765199 490plusmn05 48578plusmn02201
4240 41495200
KAXXAI02 (III) P21c 2 4419 5764 85 - KAXXAI03 (IV) P-1 3 673457584784 85 3188 KAXXAI04 (V) P-1 1 5562 85 -
41 Introduction
82
Figure 43 Temperature dependence of the enthalpy (H) and free energy (G) diagrams
for forms I and II of TA showing a monotropic (top) relationship from data from
Surov201 which are qualitatively the same as data from Andersen199 and an enantiotropic
(bottom) relationship from data from Mattei and Li200
Lopez-Mejias et al19 provided the only thermodynamic data available for forms IIIndashV
The researchers noted that heating forms III and V at 80degC caused a transformation to
form I within a period of minutes to hours In solution forms III IV and V transformed
to form I or a mixture of form I and II Hence forms III IV and V were shown to be
metastable polymorphs The heats of fusion given in Lopez-Mejiasrsquo supplementary
information19 were listed by the initial form and forms III and V may well have
transformed to form I rather than form II Therefore these sets of data were inconclusive
as to the relationship between forms I and II
(a)
(b)
41 Introduction
83
414 Similarities between the known forms of FA and TA The known polymorphs of TA and FA showed some similarities (Table 42) as all were
based on the H-bonded dimer (Figure 44a) The graph-set analysis161162 for the (two)
types of H-bonds are identical for all the crystal structures of TA and FA intermolecular
dimers with 2 donors 2 acceptors and 8 atoms in total (11987722(8)) and intramolecular with 1
donor 1 acceptor and 6 atoms in total (S(6))201
Form II had the most distinctive packing (Figure 44b) as well as conformation (Figure
42b) and was the only structure with a short contact involving the chlorine atom and the
aromatic ring The most striking result from Table 42 was the similarity between the
metastable forms III and IV where 11 molecules could be overlaid (Figure 44c) The
two independent molecules in form III had similar conformations to two of the three
independent molecules in form IV (compare the open circle and closed triangle symbols
in Figure 412a) The polymorphs had sufficiently similar simulated powder patterns to
have a PXRD similarity measure in the grey area between polymorphism and
redeterminations203 and for this reason they exemplify the challenges in defining
polymorphism204205
Table 42 Quantification of the similarities of FA and TA crystal structures showing the
packing similarity (RMSDn) and powder X-ray diffraction (PXRD) similarity206 The
bold numbers indicate the number of molecules n that match within distance and angle
tolerances of 20 and 20deg respectively with the RMSDn values in brackets See section
425
n(RMSDnAring)
FA TA(I) TA(II) TA(III) TA(IV)
FA - 6(066) 2(048) 3(074) 5(108)
TA(I) 078 - 1(087) 3(078) 3(107)
TA(II) 085 086 - 2(077) 2(074)
TA(III) 078 083 090 - 11(045)
TA(IV) 078 084 092 098 -
TA(V) 086 089 093 091 093
PXRD Similarity
41 Introduction
84
Figure 44 Features of the experimental crystal structures (a) The hydrogen-bonded
dimer motif found in all structures with variations in the phenyl ring orientations (ξ1)
The specific illustration shows the packing similarity between FA (QQQBTY02) and TA
form II (KAXXAI) (b) The unique packing of TA form II with short contacts between
chlorine and the aromatic ring (c) Crystal Packing Similarity between form III and form
IV of TA showing the 11-molecule overlay which includes only two dimers
415 Solving the Connectivity Problem of a Disordered Form The crystal structure of Form V of TA was solved with an R-factor of 658 the whole
molecule was equally disordered over two sites19 I found that separating the two
components of disorder gave the wrong connectivity between the C8 and N1 atoms (green
in Figure 45b) The C8-N1 bond length of 170 Aring was unusually long and this caused the
breakdown of the trigonal planar relationship of nitrogen C7-N1(H6)-C8 connectivity
(c)
(b) (a)
41 Introduction
85
(Figure 45c) A model with the two components both corresponding to the expected
molecular geometry can be made by redefining the connectivity (Figure 45b) to link half
of one disordered molecule (the bonded molecule in Figure 45a) with half of the other
disordered molecule (the atoms-only component in Figure 45a) The second component
was formed by combining the remaining halves The resulting molecules (red and blue in
Figure 45b) have the expected C-N bond length of 143 Aring and a trigonal planar geometry
around the nitrogen atom
The above procedure results in three ordered Z=2 crystal structures with the unit cell of
form V by using the two resulting molecules (Figure 46a b for Z´=1 and Figure 46c for
Z´=2)
Figure 45 (a) Crystal structure KAXXAI04 of form V of TA (b) The atom connectivity
of the two new components (colour red and blue) the original C-N connectivity is
labelled green (c) Chemical diagram showing the atomic connectivity of TA
9
1
1
2
10
1
813
14
7
164
21
1 53
2
(a)
(b)
(c)
41 Introduction
86
Figure 46 Ordered Z=2 crystal structures formed from the disordered components of TA
form V (a) Form V_a (b) Form V_b and (c) Form V_c
(a)
(b)
(c)
42 Computational Methods
87
416 Overview The focus of this chapter is the polymorphophore concept which I will investigate by
generating crystal energy landscapes (section 285) of FA and TA These crystal energy
landscapes are a valuable tool for examining the known forms of different molecules
because the same level of polymorph screening is rarely applied to entire families of
molecules This is likely the case for FA and TA since TA is a drug molecule while FA
is not In addition there were far more publications for TA than FA (see section 413)
For these reasons FA and TA provide a good test for the concept of polymorphophore
In this chapter the energy landscapes of FA and TA will be generated by first selecting
a suitable ab initio level of theory for the conformational energy of the isolated molecule
I will achieve this by performing ab initio scans at various levels of theory Then these
ab initio scans will be compared with histogram plots of crystal structures whose
fragments are similar to FA and TA The analysis of these scans and plots will guide the
methodology I will use to generate the hypothetical structures The final energy
landscapes of FA and TA will be generated by systematically increasing the accuracy of
evaluating the lattice energies while reducing the number of generated structures Finally
I will compare the crystal structures on the energy landscapes for FA and TA using a
similarity tool
I will show the conformational flexibility of fenamate fragments allows the potential
for a large number of structures and that it is the substituents that determine if a molecule
is polymorphic or not In other words polymorphophore promotes but does not guarantee
polymorphism Concisely CSP goes beyond the lsquoblind testrsquo described in Chapter 3
42 Computational Methods
421 Ab initio Conformational Profile of TA To test the effects of ab initio methods on the conformation profile of TA I compared
relaxed scans at various levels of theory of the main torsion ξ1 (Figure 49) with single-
point energy calculations at the MP26-31G(dp) level of theory The effect of rotating
the H-bonded torsion ξ2 (see Figure 49) was investigated by performing a relaxed scan
at the PBE06-31+G(dp) level of theory The results from these scans helped in selecting
the appropriate level of theory as well as the torsion that would be allowed to rotate during
the generation of hypothetical structures (step 1 section 423)
422 CSD Survey for Fenamates The relaxed conformational scans of the main torsion angle ξ1 (section 421) at the
PBE06-31+G(d) level of theory were complemented by a Conquest207 search of the
Cambridge Structural Database (CSD 208) for the crystal structures containing the
42 Computational Methods
88
molecular fragment shown in Figure 47 This comparison allowed us to see the variation
in ξ1 when there was an internal H-bond (ZmiddotmiddotmiddotH lt 26 Aring) that constrained part of the
molecule to planarity
dlt26Aring
Figure 47 Query fragment and the torsion angle ξ1 measured in the Conquest207 survey
of the CSD structures There were 131 organic structures where Y=H and 94 where Yne
H
423 Crystal Structure Prediction I calculated the crystal energy landscapes14 of FA and TA using a method209 that was
adapted from that used for the highly flexible molecule XX in the fifth blind test of CSP11
a method that called for an approximate conformational energy surface in the initial
search stage (see section 281) The final energy landscapes of FA and TA were generated
in four steps with the quality of the methods increasing and estimated the conformational
energy penalty Eintra and the intermolecular contribution Uinter to the lattice energy Elatt
Step 1 (Generation of hypothetical crystal structure) Crystal structures with Z´=1 were
generated in 15 common space groups P1 P-1 P21 P21c P21212 P212121 Pna21
Pca21 Pbca Pbcn C2c Cc C2 Pc and P2c using CrystalPredictor126 The grid was
used to extrapolate the atomic charges and intramolecular energy Eintra This grid was
pre-computed as a function of just ξ1 (Figure 48) using GAMESS179 at the MP26-
31G(dp) level of theory (single-point calculation) after the molecular geometries were
optimized at the HF6-31G(dp) level The intermolecular contributions to the lattice
energy were calculated crudely from the atomic charges and the Williams135 exp-6
repulsion-dispersion potential The CrystalPredictor program carried out 250000 lattice
energy minimizations This resulted in 162288 and 182615 distinct structures for TA
and FA respectively of which 16543 and 22884 were unique for TA and FA
respectively
Elatt = Uinter + Eintra = Uinter + Uelec + Eintra 41
42 Computational Methods
89
Figure 48 The fragment used in the CrystalPredictor search for TA Each fragment was
kept rigid during the search for hypothetical crystal structures
Step 2 (Accurate evaluation of the electrostatic contribution (Uelec)) Single-point ab
initio calculations were carried out on the conformation for each of the unique structures
from step 1 using GAUSSIAN0353 at the PBE06-31G(dp) level of theory to improve
the estimate of Eintra and provide the atomic multipoles by distributed multipole
analysis51 using GDMA The crystal structures were re-optimized using DMACRYS34
keeping the molecule rigid with the intermolecular energy Uinter calculated from the
distributed multipoles and the FIT parameterization38-40 of the exp-6 atomndashatom
repulsionndashdispersion potential
9
1
1
2
10
1
813
14
7
164
21
1 53
2
TA
Figure 49 The degrees of freedom optimized by CrystalOptimizer for crystal structures
of FA and TA (ξ1equiv C7-N1-C8-C9 ξ2equiv C2-C7-N1-C8 ξ3equiv O1-C1-C2-C7 ξ4equiv H1-O1-C1-C2
and ξ5equiv C8-C13-C14-H10 θ1equiv H6-N1-C8 θ2equiv H1-O1-C1)
Step 3 (Accurate evaluation of lattice energy (Elatt=Uinter and Eintra)) Approximately
100 of the most stable crystal structures from step 2 were re-minimized due to the limited
time constraints of submitting this study as my first year report Six and seven
conformational degrees of freedom for FA and TA respectively (Figure 49) were
allowed to change as was the crystal structure using CrystalOptimizer7172 and
calculating Eintra and the distributed multipoles at the PBE06-31+G(d) level of theory
for the isolated molecule
Step 4 (Modelling the effect of the crystalline environment) Finally I estimated the
effect of the crystal environment using a Polarizable Continuum Model (PCM)180 that I
42 Computational Methods
90
obtained by calculating the wavefunction of the molecular structure in a dielectric of ε=3
(typical of molecular organic crystals)131 as implemented in GAUSSIAN03 The crystal
structures were then re-minimized using the distributed multipoles calculated in the PCM
environment while keeping the molecule rigid the resulting Uinter was combined with the
Eintra to evaluate the lattice energies The CSP-generated crystal structures for FA were
labelled xFA_y where x was the final energy ordering and y the ordering after the
CrystalPredictor stage A comparison of x and y shows the extent of re-ranking by
increasing the accuracy of the lattice energy model
424 Experimental Crystal Structures with Z´ gt1 The complexity of the task of generating Z´gt1 crystal energy landscapes (steps 1-4) for
flexible molecules limited the search (section 423) to Z´=1 Analogous CrystalOptimizer
(step 3) and PCM calculations (step 4) were performed starting from all the experimental
crystal structures of TA and FA which included Z´gt1 structures FA form I and TA
forms III IV and V (section 415) This allowed comparison between Z´=1 generated
crystal structures and the experimental crystal structures of FA and TA
425 Comparison of Crystal Structures The experimental crystal structures the corresponding lattice energy minima and the
structures on the crystal energy landscapes were compared using the Crystal Packing
Similarity151 module (section 29) implemented in Mercury210 This crystal structure
similarity tool returns the highest number of molecules n (where n 15) that can be
overlaid between two different structures when all non-hydrogen atomndashatom distances
are within a 20 distance tolerance and angles are within 20 The calculated RMSDn is
the root mean square deviation of all non-hydrogen atom positions in the clusters of n
molecules The program allows for comparisons of crystal structures of different
molecules with the RMSDn being calculated from only the common non-hydrogen
atoms This Crystal Packing Similarity calculation determines the similarity in the
coordination environment of the two crystal structures rather than of the crystallographic
cell
43 Results
91
43 Results
431 Dependence of Conformational Energy on Method An appropriate grid of intramolecular energies was essential in order to search all the
likely conformations of TA and FA and thereby generate all likely Z´=1 crystal structures
To observe the effects that changing the level of theory had on the relative intramolecular
energy the torsion angle was scanned at HF PBE0 MP2 and B3LYP levels of theory
using GAUSSIAN0353 with the rest of the molecule allowed to relax
Figure 410 The relative conformational energy of isolated TA molecules as a function
of the ξ1 The MP2 and PBE0 method at 6-31G(dp) basis set compared with the other
method (top) and the other basis sets (bottom) for the PBE0 method
43 Results
92
The HF6-31G(dp) level of theory produced one minimum for the torsion angle
(Figure 410a) This result was qualitatively incorrect so the PBE0 level was selected as
the best compromise because it reproduced the correlation effect present in TA its
minima coincided in the same torsion angle region as that of MP2 and was
computationally cheaper than MP2 Since the conformational profile of TA converged at
the 6-31+G(d) basis set (Figure 410b) I selected PBE06-31+G(d) as the appropriate
level of theory for the final lattice energy calculation (steps 3 and 4 of section 423) of
the crystal structures This level of theory produced the standard plots of Chapters 4 to 6
432 Consideration of H-bonded Torsion
Figure 411 The relative conformational energy as a function of the ξ2 (Figure 49) for
FA and TA calculated at the PBE06-31G(dp) level of theory
The conformational energy scans of ξ2 (Figure 411) of TA and FA are very similar
The decrease in the torsion angle from 180deg strainedmdashand eventually brokemdashthe
intramolecular H-bond between the carbonyl group and N-H This H-bond strain accounts
for the huge energy penalty observed when this torsion angle changed Therefore
torsion was kept rigid during the search for hypothetical crystal structures even as the
torsion was optimized within the crystal structures to enable an accurate evaluation of the
balance between intermolecular and intramolecular energy in step 3 (section 423)
Chapters 5 and 6 present a more thorough investigation of the conformational energy
scans of fenamates
43 Results
93
433 CSD Survey of Fenamates The conformational potential energy surfaces of isolated TA and FA molecules (Figure
412a) were similar for a wide range of conformations around those found in experimental
structures (Figure 42) but were different as the bulky methyl substituent of TA
approached the benzoic acid ring (Figure 412a) For FA the energy penalty for
conformational changeEintra was less than 6 kJ mol-1 for a complete rotation of the
phenyl ring whereas for TA there was a conformational region that was far too high in
energy to occur in crystal structures The observed conformations of FA and TA in their
crystal structures corresponded to low-energy isolated molecule conformations (Figure
412a) with a relative intramolecular energyEintra of less than 3 kJ mol-1 The
conformational profile for TA was in qualitative agreement with that calculated by other
high-quality ab initio methods (see MP2 and B3LYP in Figure 410) but the profile was
quantitatively affected by the subtle balance between intramolecular dispersion and
intramolecular basis set superposition error60 Other studies have also suggested that the
barriers to conformational change would be lower in solvents from calculations in a
dielectric continuum simulating CCl4 and methanol211
The crystal structures in the CSD that contain the search criterion of Figure 47 also
show the same preference for the lower energy conformations That is the distribution
maxima coincide with the conformational minima (Figure 412b c) with very few
structures having the two rings near coplanar or perpendicular (ξ1=0 90) around the local
maxima in the conformational energy scans For the Y=H search because both ortho
substituents were hydrogen atoms two torsion angle values arose per conformation in a
crystal structure (one value between 0 and 90 and the second value between 90 and
180) giving a symmetric plot (Figure 412b) For YH on the other hand each structure
had only one torsion angle value and an asymmetric distribution (Figure 412c) reflecting
the steric hindrance of the ortho substituent
43 Results
94
Figure 412 The relaxed conformational energy scan of FA and TA as a function of ξ1 at
the PBE06-31+G(d) level of theory (a) Includes the experimental values of ξ1 marked
for TA and FA with the symmetry equivalent FA conformations denoted by open black
squares and an insert diagram showing the steric hindrance for TA in the high-energy
region A histogram of (b) 131 crystal structures found in the CSD search (Figure 47)
with Y=H plus symmetry equivalent structures and (c) 94 crystal structures with YneH
(b)
(c)
(a)
43 Results
95
434 Validation of the CrystalOptimizer plus PCM Models The computational model (steps 3 and 4 of section 423) is able to reproduce all ordered
crystal structures satisfactorily as minima in the lattice energy (Table 43) with these
static 0 K structures overlaying the finite temperature crystal structures with similar
accuracy The range of lattice energies is less than 2 kJ mol-1 consistent with both the
small energy range expected for polymorphs and with the thermodynamic data (Table
41) Form I is the most stable at 0 K in disagreement with the monotropic relationship
between forms I and II as determined by DSC measurements199201 and other data (section
412) Forms III and IV are metastable and very close in energy to form II Of the three
form V Z=2 ordered model crystal structures two have a nearby lattice energy minimum
Because all are quite high in energy the disordered structure is likely to be more complex
than a combination of these structures However a full symmetry adapted ensemble study
of a large supercell143212 would not be appropriate without more detailed experimental
studies
Table 43 Comparison of the lattice energy minimum with the experimental structure
used as a starting point for the final lattice energy model (PBE06-31+G(d) PCM) for
the ordered structures of FA and TA The three form V Z=2 model structures derived
from the disorder components of TA (section 415) are also compared with the starting
model RMSDn corresponds to n=15 unless (n) is given
Space
Group
ρ
gcm-
3
Elatt
kJ mol-1
a b c
Aring
α β γ
deg
RMSDn
Aring
FA
Expt P-1 133 808 9811404 8596 8864 7345
Opt P-1 134 -13663 848 9911333 9094 8816 7130 046
TA
Expt I P21c 144 4833213 804 900010488 9000
Opt I P21c 139 -14724 4863154 832 900010200 9000 033
Expt II P21n 145 38422001421 9000 9411 9000
Opt II P21n 141 -14521 38622061460 9000 9621 9000 026
Expt III P21c 144 76411312807 9000 9303 9000
Opt III P21c 139 -14555 78311642748 9000 9332 9000 030
Expt IV P-1 144 75214331759 10368 9825 9304
Opt IV P-1 138 -14514 76514001828 10256 9932 9152 037(14)Dagger
Expt V P-1 144 765 902 942 10740 920610166
Opt V_a P-1 138 -13954 767 919 961 10756 939910087 021
Opt V_b P-1 137 -14177 6781077 897 9275 850310348 089(6)
Opt V_c P-1 139 -14437 768 928 949 10695 925110249 019
DaggerThe Expt and Opt IV crystal structures overlaid 14 out of 15 molecules
43 Results
96
It is clear from Table 43 that the lattice energy minimization of the ordered structures
V_a and V_c produces a fairly small change in the cell constants but the nearest
minimum to V_b is rather different probably because the initial structure contained a
close ClmiddotmiddotmiddotCl contact These ordered structures correspond to the most stable of three
models of form V All three structures have a lattice energy that is 6-8 kJ mol-1 above
form I and so these ordered models of form V are not competitive in energy with the
other known polymorphs of TA
435 Energy Landscapes of Intermediate Steps
Figure 413 Crystal energy landscape of TA for the Z´=1 structure after (a)
CrystalPredictor (Step 1) (b) the single conformer calculation of Eintra and the atomic
multipoles at the PBE06-31G(dp) level of theory (Step 2 of section 423)
(a)
(b)
43 Results
97
I refined the lattice energy calculation in stages and systematically reduced the number
of crystal structures as my confidence in the energy ranking increased After conducting
single-point calculations to get accurate Eintra and distributed multipoles (which
improved the Uelec and thus the Uinter see equation 41) on all of the unique crystal
structures (step 2 of section 423) the gap between the known forms (I and II of TA) and
the global minima reduced from 40 kJ mol-1 to 6 kJ mol-1 (Figure 413) This intermediate
step was vital in reducing the computing time of the subsequent step 3 (section 423
only about 100 crystal structures were refined) due to the increased confidence in ranking
of the known forms (Figure 413)
436 Finding and Explaining the Known Structures with CSP The known forms of FA and TA were at or close to the global minimum on the final
crystal energy landscapes (Figure 414) which generated all the known Z´=1 ordered
polymorphs The crystal energy landscapes of FA and TA were similar in that they each
had an energy gap of approximately 2 kJ mol-1 between the global minimum cluster and
the other structures although the cluster of low-energy structures was far larger for TA
Although this difference suggested that TA would be more polymorphic than FA I
compared the structures to see whether it was plausible that TA and FA could crystallize
as distinct polymorphs allowing for thermal motion at crystallization temperatures
All the crystal structures of FA and TA whose energies were plotted in Figure 414 (and
tabulated in Table 44 and Table 45) contain the carboxylic acid dimer (Figure 44a)
However the orientation of the phenyl substituents could differ so markedly that this
dimer did not always satisfy the distance criterion to be overlaid by the default Crystal
Packing Similarity comparison This observation suggests that these structures on the
final energy landscape for FA and TA differ by the packing of the aromatic rings It was
necessary to perform a qualitative assessment of the barriers that prevented the
rearrangement of the molecules into a more stable form
The lowest-energy hypothetical structure on the crystal energy landscape for FA was a
Z´=1 structure (1FA_22) that was very similar in density and lattice energy to the only
known experimental Z´=2 form (Figure 414a) with a PXRD similarity of 085 This
1FA_22 hypothetical crystal structure overlaid 5 molecules (Figure 415a) with the
experimental form and it matched the conformation of one of the independent molecules
(Figure 415b) The difference between these two structures lay in the packing of the
layers a difference that is seen in many polymorphs such as progesterone213
43 Results
98
Figure 414 The crystal energy landscapes of FA (top) and TA (bottom) Each symbol
represents a crystal structure of the specified space group which is a minimum in the
lattice energy (calculated within the polarizable continuum) The open symbols
correspond to the minima starting from the experimental structures (Table 43) The
packing coefficient is the proportion of the cell volume occupied by the molecule214
calculated using a grid spacing of 01 Aring
43 Results
99
Table 44 The lattice energy minima of FA shown in Figure 414a The minimum found
starting from the experimental structure is in bold
Label Space
Group a b c
Aring
α β γ
deg
ρ
g cm-3
Uinter ΔEintra Elatt
kJ mol-1
1FA_22 P21c 868 4682709 9000 7404 9000 134 -13765 137-13628
QQQBTY02 P-1 848 9911333 9094 8816 7130 134 -13920 316-13599
2FA_2 P-1 454 9271493 6910 9201 6858 132 -13483 152-13331
3FA_59 P21c 457 8802695 9000 9956 9000 132 -13381 113-13269
4FA_1 P21c 451 8992682 9000 7877 9000 133 -13435 175-13260
5FA_10 P21c 4582686 880 9000 8526 9000 131 -13350 144-13206
6FA_151 P-1 1285 744 666 66291027411127 131 -13418 221-13197
7FA_4 P21c 1788 5341283 9000 6136 9000 132 -145121363-13149
8FA_16 P21n 1395 5201508 9000 7809 9000 132 -145051361-13144
9FA_287 P21n 1429 4591770 9000 7060 9000 129 -13279 240-13039
10FA_192 P21c 46019181231 9000 9792 9000 132 -13641 636-13005
11FA_19 P21c 50121791004 9000 7377 9000 135 -143771419-12958
12FA_23 P21c 6443425 653 900013152 9000 131 -13855 917-12938
13FA_2880 P21n 1490 4931456 9000 8825 9000 133 -13666 791-12875
14FA_33 P21c 4302600 997 900010250 9000 130 -13039 166-12873
15FA_18 P-1 870 799 935 105831022011301 132 -13040 187-12853
16FA_5226 P-1 10211325 990 1410911696 4347 127 -13013 186-12827
17FA_484 C2c 3864 897 750 9000 5874 9000 128 -12962 155-12807
18FA_7 P-1 4991113 995 844610467 9266 133 -141671409-12758
Table 45 The lattice energy minima of TA shown in Figure 414b Minima found starting
from the experimental structures or ordered models are in bold
Label Space
Group a b c
Aring
α β γ
deg
ρ
g cm-3
Uinter ΔEintra Elatt
kJ mol-1
FORM I P21c 4863154 832 900010200 9000 139 -14874150-14724
1TA_8 P21c 4853160 833 9000 7787 9000 139 -14865148-14717
2TA_15 P-1 1772 847 484 79491123711171 140 -14832163-14669
3TA_876 P-1 1698 744 734 9440 9376 4181 141 -14952357-14595
4TA_6243 P-1 12061015 871 7176 617011737 142 -14774196-14579
FORM III P21c 78311642748 9000 9332 9000 139 -14853298-14555
FORM II P21n 38622061460 9000 9621 9000 141 -14784263-14521
5TA_38 P21n 38622051460 9000 8376 9000 141 -14781263-14518
FORM IV P-1 76514001828 10256 9932 9152 138 -14773259-14514
6TA_82 P21c 39014332374 9000 6805 9000 141 -14611234-14377
FORM V_b P-1 6781077 897 9275 850310348 137 -14505328-14177
FORM V_c P-1 768 928 949 10695 925110249 139 -14437313-14124
FORM V_a P-1 767 919 961 10756 939910087 138 -14219265-13954
7TA_45 P-1 14441231 385 10950 8330 7631 142 -14171263-13908
8TA_88 C2c 2697 4792067 900010567 9000 135 -14113218-13895
9TA_64 P-1 756 900 986 753110145 8029 141 -14744889-13855
10TA_153 P21c 49212392217 9000 7574 9000 133 -13951196-13755
11TA_80 P2n 1492 3982150 9000 7536 9000 141 -13910180-13730
12TA_3630 P21c 1655 3842338 9000 5714 9000 139 -13930222-13708
43 Results
100
Figure 415 (a) Overlay of the only known form of FA (grey) and the most stable
structure on the Z´=1 crystal energy landscape (Figure 414a) 1FA_22 (green) with an
RMSD5 value of 175Aring (b) Overlay of the conformers of form I (pink and light blue) and
1FA_22 (black)
A significant energy gap was observed between the experimental and lowest energy
Z´=1 structure and the other structures generated for FA (Figure 414a) Remarkably this
gap was between two hypothetical structures that had a 12-molecule overlay and only
differed in the packing of the layers (Figure 414a) The lower-energy structure
(1FA_22) had more close contacts and a higher packing coefficient than the higher-
energy structure The second most stable hypothetical structure (2FA_2) was also
closely related to the experimental structure in it half of the molecules had changed the
phenyl torsion angle to a less stable conformation changing the stacking with the
phenyl ring in the neighbouring molecule to a herringbone215 (C-Hmiddotmiddotmiddot) interaction
(Figure 416bc) Thus there were two ways that the 2FA_2 structure could gain 2 kJ
mol-1 of stabilisation energy (Figure 416) The relationship between the two most stable
structures (1FA_22 and the experimental structure) means that it may be very difficult
to produce the Z´=1 structure as a polymorph Clearly Z´=1 and Z´=2 structures are very
close in energy and are related (via 2FA_2) It is therefore difficult to establish whether
the observed form is in fact a ldquocrystal on the wayrdquo216 that is trapped by a barrier from
rearranging into the Z´=1 form or whether the observed form is the more stable
structure217
(a) (b)
43 Results
101
Figure 416 (a) Overlay of the two most stable hypothetical crystal structures on the
crystal energy landscape global minimum 1FA_22 (grey) and 2FA_2 (green) with
ΔElatt=20 kJ mol-1 The crystal structures overlaid 12 molecules with RMSD12 of 051 Aring
and the conformations had an RMSD1 of 009 Aring (b) Overlay of 2FA_2 (green) and the
experimental crystal structure of FA (grey) with a RMSD15 of 123 Aring obtained with a
distance and angle tolerance of 50 and 50deg (c) Overlay of the two independent
molecules in the experimental structure (grey) with 2FA_2 (green)
For TA the crystal energy landscape successfully found the Z´=1 polymorphs forms
II and I to be the first and fifth most stable crystal structures within 2 kJ mol-1 of the
global minimum (Figure 414b) the landscape also provided a good reproduction of the
experimental crystal structures (Figure 417 and Table 43) Four other structures were
observed all of which were competitive in lattice energy with the known metastable
forms These crystal structures had somewhat similar packing to the known forms of TA
(Table 48) some being more similar to the form V Z=2 model structures constructed
from the disorder components of TA than to the other polymorphs (contrast Table 42 and
Table 48) Some of the similarities (Table 46) between the hypothetical structure and
the other fenamates in Table 41 were even more striking One of the computed structures
(a) (b)
(c)
43 Results
102
6TA_82 (highlighted in Table 45) matched 15 molecules of SURMOI (Table 41)
suggesting that crystals of this dimethyl-substituted molecule might template the
nucleation of a novel polymorph of TA This observation led to the joint experimental
and computational project discussed in section 438
Figure 417 The overlay of the experimental Z´=1 crystal structures (grey) of TA with
the closest structure found in the search (green) (a) Form I and 1TA_8 overlaid with an
RMSD15 value of 032Aring (b) Form II and 5TA_38 overlaid with an RMSD15 value of
026Aring
(b)
(a)
43 Results
103
437 Other Known Fenamates and their Hypothetical Structures Further marked similarities were observed between the structures on the crystal energy
landscapes of FA and TA (Figure 418) The hypothetical crystal structures on the crystal
energy landscape of FA in Figure 418 were similar to some of the known forms of TA
(forms I-IV) with some of these hypothetical crystal structures overlaying up to 13
molecules (forms I and III of TA Figure 418) Many of the low-energy structures of FA
had more in common with a polymorph of TA than with the only known form of FA that
is with a few exceptions the second numbers are greater than the first bold numbers
(Figure 418) There exist distinct crystal structures of FA with the planar molecules
(highlighted in Figure 418)
Figure 418 Classification of the crystal energy landscape of FA in terms of the similarity
of the structures to those of known TA polymorphs (I-IV) without PCM (hence the
different y-axis compared to Figure 414a) Numbers in bold indicate the number of
molecules that overlay with the known structure of FA Hence a label 5 6 on a structure
represented by a blue circle means that the structure overlaid 5 molecules with the
experimental form of FA but 6 with form I of TA Each point is coloured by the TA
polymorph with which it overlaid the greatest number n of molecules in a Crystal Packing
Similarity calculation that ignored the CH3 and Cl
The similarities between the known forms of TA and the hypothetically generated
structures of FA confirmed that because of the effect of TArsquos substituents (CH3 and Cl)
on the moleculesrsquo relative energies the energy landscape of TA was more polymorphic
than that of FA (Figure 414) The common clusters produced by the similarity overlays
between different fenamates usually had the differing substituents in the exterior region
43 Results
104
where there was no overlay of the coordinating molecule consistent with the substituents
causing the differences in the packing This in marked contrast to the large common
cluster between forms III and IV of TA (Figure 44c) where the packing of the aromatic
rings is similar
Table 46 Crystal Packing Similarity comparisons of the experimental structures of FA
and TA and their most stable hypothetical crystal structures with the crystal structures of
the other fenamates shown in Figure 13 The similarity is given in the form n(RMSDn)
with n gt 4 molecules highlighted
n(RMSDnAring)
FPAM- CA
FPAM- CA11
LAH- LOW
PEF- MET
PEF- NAQ
SUR- MEY
SUR- MOI
XYA- NAC
FA
QQQBTY02 2(071) 4(133) 7(084) 3(128) 6(062) 3(05) 3(12) 4(049)
1FA_22 2(041) 5(191) 6(131) 2(013) 11(096) 4(098) 4(108) 3(18)
2FA_2 2(043) 3(056) 7(101) 2(01) 11(051) 3(107) 7(098) 3(086)
TA
II 1(089) 2(015) 2(059) 2(011) 1(061) 2(012) 12(187) 2(029)
I 2(059) 2(048) 3(061) 1(07) 13(038) 6(178) 4(12) 2(062)
III 1(081) 7(075) 2(048) 13(033) 2(055) 13(061) 3(041) 13(045)
IV 2(087) 6(071) 3(109) 11(049) 2(046) 13(084) 3(056) 15(03)
V_a 2(057) 2(046) 5(042) 1(068) 3(039) 2(022) 2(018) 2(057)
V_b 2(075) 3(032) 7(064) 2(047) 4(110) 5(041) 4(119) 5(072)
V_c 2(095) 2(084) 5(041) 1(042) 4(110) 4(051) 2(029) 3(046)
2TA_15 2(052) 2(053) 3(091) 1(077) 14(04) 4(082) 4(122) 2(07)
3TA_876 1(093) 4(156) 7(142) 3(043) 1(066) 3(071) 4(047) 2(037)
4TA_6243 2(054) 3(115) 3(176) 1(069) 4(016) 4(149) 2(017) 3(091)
6TA_82 1(092) 2(017) 2(061) 2(012) 2(064) 2(008) 15(028) 2(028)
Some fenamate crystal structures are specific to the molecule One observed example
(Table 46) is the FPAMCA polymorph of flufenamic acid In 2012 through the use of
polymer-induced heteronucleation and solidndashsolid transformations flufenamic acid set a
new record18 for a polymorphic compound with eight solved structures which was
recently equalled by aripiprazole218 These fenamate structures are all based on the
carboxylic acid dimer with some having more similarity to the TA and FA low-energy
structures (Table 47) The specific substituents affect the range of packing of the aromatic
rings For example the low-energy unobserved structures of FA which are based on a
planar conformation of the entire molecule (Figure 414) are probably also specific to
FA because the lowest-energy crystal structure of TA with a planar molecule is 14 kJ
mol-1 above the global minimum structure The energy difference between crystal
structures of TA is caused by substituent intermolecular interactions that destabilize the
43 Results
105
structures containing planar molecules the intramolecular energy penalty Eintra for this
planar conformation is similar for FA and TA (6 kJ mol-1 Figure 412)
Table 47 An extension of Table 46 showing Crystal Packing Similarity comparisons of
the latest structures of flufenamic acid18 and the experimental structures of FA and TA
and their most stable hypothetical crystal structures
n(RMSDnAring)
FPAMCA_z
z=2 z=4 z=5 z=6 z=7 z=8
FA
QQQBTY02 5(149) 3(079) 2(073) 4(160) 2(043) 3(082)
1FA_22 4(162) 5(142) 2(105) 5(202) 2(022) 2(026)
2FA_2 4(151) 4(034) 3(119) 5(080) 2(021) 3(130)
TA
II 2(010) 2(016) 2(04) 2(017) 1(071) 2(081)
I 3(158) 2(054) 2(069) 4(210) 2(034) 2(041)
III 2(022) 2(024) 4(052) 2(025) 1(064) 2(077)
IV 2(020) 2(023) 4(168) 3(084) 2(064) 2(070)
V_a 3(124) 2(048) 2(064) 2(050) 3(068) 3(080)
V_b 5(054) 3(067) 2(045) 3(063) 1(059) 2(078)
V_c 2(085) 2(041) 2(079) 2(042) 2(077) 3(127)
2TA_15 4(304) 2(080) 2(017) 2(062) 3(042) 4(280)
3TA_876 4(134) 2(018) 4(210) 2(019) 1(076) 2(082)
4TA_6243 4(110) 2(058) 2(040) 2(060) 2(031) 2(038)
6TA_82 2(018) 2(019) 2(025) 2(020) 1(073) 2(081)
Table 48 Crystal Packing Similarity calculations of the known forms of TA and
unobserved thermodynamically competitive crystal structures The similarity between
the structures is given in the form n(RMSDn) where n is the number of molecules overlaid
and the value in brackets is the RMSDn overlay Structures with the highest similarity are
highlighted
n(RMSDnAring)
2TA_15 3TA_876 4TA_6243 6TA_82
KAXXAI 1(095) 4(033) 1(088) 9(043)
KAXXAI01 1(049) 1(096) 5(132) 1(090)
KAXXAI02 2(087) 3(108) 2(095) 3(059)
KAXXAI03 2(083) 3(081) 3(255) 3(081)
KAXXAI04_a 4(125) 1(092) 3(016) 1(086)
KAXXAI04_b 4(128) 3(092) 6(107) 2(069)
KAXXAI04_c 1(013) 2(120) 4(105) 1(059)
438 Update on a Recently Discovered Polymorph of TA Section 436 theorized that experimentalists could nucleate a novel polymorph of TA
by using the SURMOI molecule as a template However my colleague at UCL used
mefenamic acid (Figure 13) because SURMOI is very expensive A novel polymorph of
TA was nucleated by solution evaporation after dissolving TA (form I) in ethanol and
43 Results
106
seeding it with mefenamic acid (form I)219 This procedure resulted in the nucleation of
form VI of TA which was disordered (65 and 35) with same unit cells as form I of
mefenamic acid
Although the major component of this novel form VI was generated in step 1
137_TA the form was not among the structures on the final energy landscape of Figure
414b The major component of form VI and 137_TA overlaid 15 molecules with a
RMSD15 value of 030 Aring (Figure 419) This structure 137_TA had a final lattice energy
of -14497 kJ mol-1 which was competitive with form IV of TA (Table 45 -14514 kJ
mol-1) It should be noted that steps 3 and 4 of CSP (section 423) involved just over 100
crystal structures Clearly lattice energy refinements (steps 3 and 4 section 423) of
more hypothetical crystal structures are vital
Figure 419 Overlay of FA_137 (green) and the major component of experimental
crystal structure of TA form VI (grey) with a RMSD15 of 030 Aring obtained with a distance
and angle tolerance of 50 and 50deg
439 The Cost of Lattice Energy Minimisation The lattice energy minimization (CrystalOptimizer step 3) of one crystal structure
accounted for as much as 75 of the computing time and took as long as 4 days (Figure
420a) because multiple ab initio calculations were required to balance Uinter and Eintra
The computing time was approximately half as long for the optimisation of the last
structure (form VI of TA Figure 420b) This last optimisation (Figure 420b) was faster
44 Summary
107
because there were about hundred structures stored in the Local Approximation Models
(LAMs)71 database (LAMs71 database stores and reuses conformational energy and
multipole representations of the charge density) This final calculation was performed
after the discovery of a novel polymorph of TA as discussed in section 438 Even with
the help of LAMs71 database the computational cost was still very high
Figure 420 CPU timings of (a) 38_TA (form II) and (b) 137_TA (form VI section
438) after lattice energy minimisation using CrystalOptimizer (step 3)
44 Summary This chapter described the successful use of the CSP method (see Chapter 3) to examine
the computer-generated low-energy crystal structures of the unsubstituted structural
fragment FA and a derivative TA This chapter showed that all structures were based
on the same 11987722(8) H-bonded dimer and that the structures differed only in the packing
of the phenyl rings The crystal energy landscape of TA had several crystal structures
including the observed polymorphs which were tightly clustered around the global
minimum whereas the corresponding cluster for FA contained only the observed and a
closely related structure This observation is supported by past experiments
Many of the crystal structures on the energy landscape for FA overlaid a significant
portion of the coordination environment with other observed or calculated structures
Therefore the phenyl ring substituents determined the relative energies of the crystal
structures and hence whether a specific fenamate would be very polymorphic or not The
FA fragment can be described as a polymorphophore despite only two structures
clustered around the global minimum since the molecular fragment packed in a wide
range of distinct crystal structures with different conformations that were energetically
favourable This finding indicates that being a polymorphophore correlates with but does
(a)
(b)
44 Summary
108
not guarantee polymorphism It is perhaps not surprising that this term has not been more
widely accepted
The similarities between the structures on the final energy landscapes of TA and other
fenamates led my colleague to conduct a templating experiment on TA (section 438)
The subsequent discovery of a new polymorph of TA (form VI section 438) exemplified
one problem with the CSP discussed earlier Restricting the number of crystal structures
that were accurately optimised (step 3 CrystalOptimizer) to just over 100 structures
meant excluding the recently discovered crystal structure of TA (section 438) from the
final crystal energy landscape (Figure 414b) As a result current intermediate steps like
the single-point calculations used in this chapter (step 2) although successful (section
435) had their limitations
The findings of Chapters 3 and 4 indicate the need for a cheaper and more accurate
approach to modelling lattice energy If the evaluation of Eintra (the bulk of computer
time section 439) can be realized through a less expensive method (Chapter 6) then
molecular dynamics calculations and the temperature effects (eg free energies) can be
better accounted for However we must first understand the origin of intramolecular
forces and energies (Chapter 5)
51 Introduction
109
Chapter 5 The Origin of conformational energy barriers in Fenamates
ldquohelliplsquoBegin at the beginningrsquo the King said gravely lsquoand go on till you come to the
end then stoprsquohelliprdquo
mdash Lewis Carroll Alice in Wonderland
51 Introduction
511 Background Chapters 3 and 4 established that lattice energy Elatt could be partitioned into
intermolecular Uinter and intramolecular components Eintra
where Uinter is the sum of the dominant electrostatics Uelec plus the contributions of
repulsion-dispersion Urepul-disp and Eintra is the energy required to distort the molecule
from its gas phase conformation71 The conformation determines the overall molecular
shape so different conformers may lead the crystal to arrange itself in different ways
ultimately influencing the properties of the crystal220 (Chapter 1)
1
6
2
1
9
1
1
813
7
16
Figure 51 The fenamate family showing the low barrier torsion angle (=C7-N1-C8-C9)
=0 when the aromatic rings are coplanar as drawn The fenamates family mentioned in
this chapter includes fenamic acid (FA) R1= R2= H tolfenamic acid (TA) R1= CH3 R2=
Cl mefenamic acid (MA) R1= R2= CH3 clofenamic acid (ClFA) R1=H R2=Cl and
flufenamic aid (FFA) R1=H R2=CF3 The dotted line represents an intramolecular
hydrogen bond
This chapter will investigate the conformational flexibility of fenamate molecules in
isolation Through this investigation we will come to a better understanding of the origin
of torsional barriers which will enable the derivation of an analytical model for the
intramolecular energies of the fenamate molecules FA and TA (Chapter 6) To put this
problem in context there is still an ongoing debate about the origin of the torsional barrier
of the ethane molecule which has only 8 atoms as compared to the 27 and 30 atoms of
FA and TA respectively
Elatt = Uinter + Eintra 51
51 Introduction
110
512 Torsional Barrier for Ethane The torsional barrier is defined as the difference in energy between the least stable and
the most stable conformations in rotation around a bond In order for one full rotation
around a bond to occur this energy barrier must be overcome (Figure 52) The energy
barrier for fenamic acid FA is smaller (Chapter 4) than ethane (Figure 53)
Figure 52 Illustration of the barrier to rotation with the relaxed conformational energy
profile of FA
Previous studies of torsional barriers have focussed on small molecules such as ethane
The torsional barrier for the ethane molecule is one of the most fundamental puzzles in
conformational analysis and researchers have great interest in understanding its origin221
The experimental (1203 to 1225 kJ mol-1) and quantum mechanical (1124 to 1303 kJ
mol-1) calculations of ethanersquos torsional barrier are in good agreement (Table 51)
However researchers disagree upon the origin of the torsional barrier in ethane The
root of the controversy is whether the origin of the torsional barrier in ethane results from
stronger hyperconjugation stabilization222 in the staggered conformation (Figure 53) than
the eclipsed form or whether the barrier originates from greater steric repulsion221 in the
eclipsed conformation (Figure 53) due to electrostatic interaction and Pauli exchange
repulsion Three physical factors may play a role in ethanersquos structural preference
hyperconjugation electrostatic interactions and exchange interactions
51 Introduction
111
Figure 53 The staggered and eclipsed conformations of the ethane molecule (Sources
Ref [222] and enwikipediaorgwikiAlkane_stereochemistry [Accessed 11012015])
Table 51 Torsional barrier height of ethane (Source Reproduced from Ref [223])
Hyperconjugation and exchange repulsion are quantum mechanical effects arising from
orbital overlap The hyperconjugation effect for the ethane molecule is constituted of the
vicinal interactions between the occupied CH bond orbitals of one of the methyl group
and the virtual antibonding CH orbitals of the other methyl group221 The staggered
51 Introduction
112
conformation (Figure 54a) is stabilised through the delocalization of electron charge
density involving these orbitals an attractive contribution
Pophristic and Goodman222 used natural bond orbitals (NBOs) to argue that
hyperconjugation or stabilization of the staggered ethane conformation is the origin of
the barrier to rotation in ethane By showing that if the CH-CH hyperconjugative
interactions were removed and by adding electrons to the unoccupied CH virtual
orbital the steric repulsion favoured the less stable eclipsed conformation (Figure 53)
This model of hyperconjugation interactions relies on NBOs and is not so obvious if
molecular orbitals (MOs) are used let alone if correlated wave functions are used
(a) (b)
Figure 54 (a) Hyperconjugation effects on the staggered (b) Pauli exchange repulsion
in the eclipsed conformation (Source enwikipediaorgwikiHyperconjugation
[Accessed 11012015])
Pauli exchange repulsion which requires that pairs of electrons do not occupy the same
spatial region occurs in the eclipsed conformation (Figure 54b) Electrostatic (Figure
55 also see section 223) repulsion involves the classical R-1 repulsion between charges
At short distances the 1-4 (third nearest neighbour) interactions still have an electrostatic
effect but there are also considerable penetration-effects (section 225) The Pauli
exchange and electrostatic repulsion frequently regarded as the steric factor destabilise
the eclipsed conformation of ethane These interactions are the same as intermolecular
interactions but at shorter distances
51 Introduction
113
Figure 55 Electrostatic steric repulsion (between electrons on the bond black arrow) for
the eclipsed conformation of ethane The red arrow indicates exclusion of van der Waals
repulsion since the van der Waals radii of the hydrogen are too small to make contact
(Source enwikipediaorgwikiConformational_isomerism [Accessed 11012015])
Mo and Gao221 made three arguments in favour of steric repulsion being the origin of
the barrier to rotation One argument was that hyperconjugation is a second-order effect
and hence should have little or no direct role in restricting free rotation224 Second these
researchers argued that overestimation of the hyperconjugative effects led others to
misidentify hyperconjugation as the origin of the rotation barrier Third Mo and Gao
argued that the experimental work on heats of hydrogenation for propene supported a
specific energy decomposition scheme225 In short the researchers argued that their three
points supported the claim that steric repulsion is the origin of the torsional barrier
The origin of the torsional barrier remains controversial226 even for a small molecule
such as ethane The question remains Is the torsion defined by the origin
hyperconjugation221222 or by a similar electronic effect from changes in MOs on the
atoms Or is the barrier equivalent to intermolecular non-bonded repulsion and
electrostatic effects227 at short distances ie as though there were no single covalent
bond The quantitative distinction can be highly dependent upon the precise definitions
and upon the type of charge density calculation that is used
513 Overview The conformational energy barrier of FA (622 kJ mol-1) is smaller than that of the
ethane molecule (123 kJ mol-1) The goal of this chapter is to investigate the qualitative
origin of the conformational barrier to rotation for fenamate molecules in isolation First
I will investigate the effects that different definitions of the same flexible bond have on
the calculated conformational profile of TA The step size of torsion angles various ab
initio methods and relaxation effects will be investigated for various fenamates (Figure
51) Following this I will investigate the electronic contributions using constrained
model molecules that avoid pyramidization (Figure 57) with minimal or no steric effects
Finally an exp-6 atom-atom model which contains both a repulsive and a dispersive part
will be used to investigate the steric effect of FA and TA
52 Method
114
This chapter will show that the barrier to rotation for FA and TA (Figure 51) depends
significantly upon small correlated changes in the entire molecule rather than on the
atomic position of the atoms that define the rotating torsion It will also show that there
is an intrinsic dispersion and electronic energy barrier when the aromatic rings are
perpendicular to one another the barrier to rotation for small model molecules can be
represented by a simple cos2 term
52 Method In section 431 it was established that the PBE06-31+G(d) level of theory is the best
compromise between the cheap but inaccurate HF method and the expensive but accurate
MP2 method for calculating the packing (intermolecular) and conformational
(intermolecular) energies (equation 51) of FA and TA This chapter examines the ab
initio conformational profiles of fenamate molecules in more detail All the ab initio
calculations reported in this chapter were performed using GAUSSIAN0353
521 Determining Conformation Energy Scan for Isolated Molecule
For TA there are 4 definitions of the N1-C8 rotatable bond (Figure 51) (1) = C7-N1-
C8-C9 (2) 2= C7-N1-C8-C13 (3) 3= H6-N1-C8-C9 and (4) 4= H6-N1-C8-C13 The effects
of these different definitions upon the conformational profile of TA were investigated
using the PBE06-31+G(d) level of theory Preliminary relaxed conformation energy
scans were also performed on FA using 2 and 1 step sizes around the maxima and
minima (section 431) respectively at the same level of theory in order to investigate the
origin of the slight asymmetry in FA
522 Ab initio Conformational Energy Profiles for Fenamates To test the sensitivity to method of the different fenamate moleculesrsquo conformational
profiles (Figure 51) I carried out a relaxed scan at the HF6-31+G(d) level of theory as
well as single-point energy calculations at the MP26-31+G(d) level of theory on the
optimized PBE06-31+G(d) conformations The PBE06-31+G(d) energies were then
revaluated within a polarizable continuum model (PCM)180 with dielectric continuum
value of 3 a typical dielectric environment of organic crystals PCM has been shown to
help the relative energy ranking of some conformational polymorphs (Chapter 4)131
The primary aim of this research was not to seek a definitive ab initio conformational
profile for all molecules as this would have been beyond the capability of the available
computational resources Indeed many studies have emphasized the difficulty in
evaluating the relative energies of fenamate polymorphs184211228 Instead the objective
52 Method
115
of this chapter is to present qualitatively correct scans that can be compared among the
fenamate molecules
523 Investigation of Electronic Effects In an attempt to distinguish the steric effects from the electronic effects I studied a
series of model molecules where the steric effects had been minimized (Figure 56)
12
9
1 813
6
Figure 56 Chemical diagram of model molecules used to investigate the electronic
contributions The bonds around N1 are constrained to be planar (ie R2-N1-H6-C8=180deg)
for phenylamine (PA) R1=R2=H N-methylaniline R1=H R2= CH3 N-vinylaniline R1=H
R2 = CH=CH2 and 3-anilinoprop-2-enoic acid R1=H R2 = CH=CHCO2H for 3-
chloroaniline R1= Cl R2=H and 3-methylaniline R1=CH3 R2=H (=R2-N1-C8-C9)
The benzoic acid group was replaced by a series of smaller molecular fragments (Figure
56) for example a hydrogen atom The three bonds to the nitrogen atoms were
constrained to be planar by fixing the torsion involving these atoms (eg H7-N1-H6-
C8=180deg for PA) This constraint prevents the normal pyramidalization at the nitrogen in
the torsional potential of phenylamine227 (Figure 57) or the major rearrangement of the
second hydrogen that occurs in a relaxed scan of H7-N1-C8-C9
Figure 57 Pyramidalization in unconstrained phenylamine (PA) molecule caused by
lone pair on nitrogen atom
The difference in electronic structure with torsion angle was estimated by using the
lowest occupied molecular orbital (ie the highest occupied molecular orbital (HOMO)-
n where n is an integer) and HOMO electron density for the PA model FA and TA For
52 Method
116
selected constrained (fixed ) conformations in the PBE06-31+G(d) scan a single-point
calculation with GAUSSIAN03 was used to generate a density file which was then used
to produce the molecular orbitals (MOs) isovalue surfaces of 002 au The graphical
interface used was GaussView 5229
524 Investigation of the Steric (Non-Bonded) Effects Within organic molecules that are typically used in pharmaceuticals many of the atom-
atom distances are similar to intermolecular distances although some are considerably
shorter The intramolecular steric interactions can be represented as the exp-6 atom-atom
intermolecular parameters which were derived by fitting to crystal structures and heats
of sublimation of hydrocarbons oxahydrocarbons azahydrocarbons chlorohydrocarbons
and nitro compounds42 This provides the parameters for all intramolecular interactions
involving C N O Cl and H but the same parameters are used for all C and H atoms
whether aromatic or in the methyl or carboxylic acid groups which is an approximation
to the most force field eg Sybyl typing230 This approximation is better justified for FA
than for TA (Figure 51) because of the importance of distinguishing C in different
chemical environments That is the chemical environment of aromatic C is different from
that of methyl C There is a polar hydrogen type HB which was used for both polar
hydrogens (H1 and H6 in Figure 51) because the intramolecular energy is expected to be
insensitive to the interactions of the carboxylic acid group
Table 52 Gavezzottirsquos exp-6 atom-atom parameters E=Aexp(-BR)-CR-6 is the well
depth and Rm is the distance at the minimum41231232 Italics represent the hydrogen-
bonded interactions aFrom the UNI intermolecular potential function of Mercury233
Interactions AkJ mol-1 BAring-1 CkJ mol-1Aring-6 kJ mol-1 RmAring
H∙∙∙H 241584 401 1092 004 336
H∙∙∙C 1207921 410 4728 021 329
H∙∙∙N 2282790 452 5021 039 299
H∙∙∙O 2954322 482 4393 051 280
H∙∙∙Cl 2929637 409 11673 050 330
C∙∙∙C 2261452 347 24184 039 389
C∙∙∙N 4914945 386 27907 084 350
C∙∙∙O 3930868 374 26819 067 361
C∙∙∙Cl 3906601 352 38618 067 383
N∙∙∙O 2685710 386 15230 046 350
O∙∙∙O 1953091 374 13347 033 361
O∙∙∙Cl 3382973 363 27824 058 372
HB∙∙∙O (acids) 264163953 875 8577 2929 160
HB∙∙∙N (-NH∙∙∙OH) 238673400a 778a 15774a 2661 180
53 Results
117
The Gavezzotti parameters used for FA and TA are given in Table 52 Although exp-
6 does not model the electrostatic contributions explicitly some of the parameters have
absorbed some electrostatic contributions during the fitting process The energies were
partitioned into repulsion (Aexp(-BR)) and dispersion (-CR6) contributions
The extension of the exp-6 parameterization to hydrogen bonding interactions required
potentials with a particularly deep well at the short hydrogen bonding distances to absorb
the electrostatic interactions in hydrogen bonding231 The polar hydrogens were assumed
not to have significant intermolecular interactions with any atoms other than the hydrogen
bond acceptor interactions which is a reasonable assumption for intermolecular
interactions The parameters for the H∙∙∙HB and C∙∙∙HB that were not determined by
Gavezzotti may be important
Interactions that are three atoms or more apart from each other (ie 1-4 and above) were
then investigated The longest bond path for FA and TA is 1-11 The atom∙∙∙atom
interactions that dominated the intramolecular contributions were analysed with the exp-
6 potential For each fenamate molecule interactions were classed as dominant if the
difference between the minimum and maximum total energy (Erepul-dis) of the conformers
was greater than or equal to 1 kJ mol-1 It is expected that some interactions in FA and
TA will vary with conformations however a few interactions will have constant
contribution (eg HB∙∙∙O (acid) an important intramolecular H-bond) The interactions
with constant contributions are not classed as dominant interactions
53 Results
531 Effect of Different Definitions of the Same Flexible Bond The N1-C8 rotatable bond can be defined in four ways C7-N1-C8-C9 C7-N1-C8-C13 H6-
N1-C8-C9 and H6-N1-C8-C13 (Figure 51) The conformational energy profile of TA
(Figure 58) is sensitive to the atoms used in defining the N1-C8 rotatable bond For
example the intramolecular energy penalty at ξ= 0deg for the C7 torsions (=C7-N1-C8-C9
and 2=C7-N1-C8-C13) are approximately half that of the H6 torsions (3=H6-N1-C8-C9 and
4=H6-N1-C8-C13) (Figure 58) The relaxation of the hydrogen atom (H6) was clearly
playing a vital role in stabilizing the molecular conformation at ξ= 0deg There were some
differences in intramolecular energy penalties as approached 180deg for the C7 torsions (
and 2 in Figure 58)
53 Results
118
Figure 58 Relaxed scan of TA at the PBE06-31+G(d) level of theory with the different
definitions of flexible N1-C8 bond (= C7-N1-C8-C9 2= C7-N1-C8-C13
3=H6-N1-C8-C9
and 4= H6-N1-C8-C13) used as the constrained geometric parameter
The torsional barriers for TA are sensitive to the atoms used in defining the N1-C8
rotatable bond (Table 53) The C7 torsional barriers (Group 2 of Table 53) are larger
than the H6 torsional barriers (Group 2 of Table 53) For the C7 torsions the H6 proton
relaxes to maintain the intramolecular H-bond while for the H6 torsions the benzoic acid
(including the C7 atom) deviates minimally to prevent deformation of aromatic ring and
form better pyramidalization (Figure 57) at N1 for TA These results show that the
torsional barrier and conformational energy profile of TA (Figure 58 and Table 53)
depend upon the selected 4 atoms that define the flexible torsion
Table 54 shows no correlation between shorter (stronger) intramolecular H-bond
distances and smaller energy penalties However a closer inspection of the atom-atom
distances between the H atom of the secondary amine and the H atom of the methyl group
(Group 1 of Table 55) suggest that steric hindrance also contributes to the intramolecular
energy because conformations with higher energy penalties correlate with shorter atom-
atom distances
53 Results
119
Table 53 Torsional barrier height of the relaxed conformational energy profiles in Figure
58 for TA
Torsion Barrier Barrier relative to
kJ mol-1
Group 1 3585 0 2 3572 -013
Group 2 3 2453 -1132
4 3148 -437
Table 54 Comparison of intramolecular energies and hydrogen bond distances of TA for
the near-planar conformer
Torsion N-H∙∙∙O=CAring ∆EintrakJ mol-1
Group 1
= 0deg 1850 706
2= 180deg 1847 648
Δ -0003 -058
Group 2 3= 180deg 1880 1574
4= 0deg 1881 1257
Δ 0001 -317
3(180)-(0) 0030 868
Table 55 Comparison of the intramolecular energies and the N-H7∙∙∙HX-C14 bond
distances of TA for the near-planar conformer where HX-C14 is the methyl group
Group 1 N-H7∙∙∙H10-C14 N-H7∙∙∙H11-C14 N-H7∙∙∙H12-C14
(Aring)
∆Eintra
kJ mol-1
= 0deg 3491 2284 2194 706 2= 180deg 3486 2272 2199 648
Δ -0005 -0012 0005 -058
Group 2
3= 180deg 3358 2135 2090 1574
4= 0deg 3386 2157 2117 1257
∆ 0028 0022 0027 -317
3(180)-(0) -0133 -0149 -0104 868
532 Effect of Step Size on the Conformation Profile of Fenamate Molecule Given that conformational profiles depend on small correlated changes in atomic
positions I investigated the effect of step size on the conformational profiles For FA the
conformation profile is unaffected by the small step size of 1 and 2 for the minima and
maximum respectively (compare Figure 510 with Figure 511) Over all possible
conformations of FA the barrier to rotation is approximately 6 kJ mol-1 (see Figure 510
and Figure 511)
Although the phenyl ring of FA is symmetric the rotation of this ring produces
asymmetry conformational profiles around the maximum and minima points (Figure
510) The slight asymmetry observed for the conformational profile of FA (Chapter 4) is
53 Results
120
therefore not due to the small step size These changes can be substantial for example
the two minima for FA scan at =3894deg and 14471deg (Figure 510) correspond to
conformations that differ by 061 Aring in the 1-4 distance between the amide proton and C13
(or C9) even though the minima only differ in energy by 188 x 10-3 kJ mol-1 (716 x 10-
7 au) Even the C8-C9 and C8-C13 aromatic bond lengths differ by 00037 Aring for =0 or
180deg but only by 00004 Aring for =80deg or 100deg with larger changes in the bonded
hydrogen positions for FA It is therefore clear that the molecular structure of the phenyl
ring is not perfectly symmetric (Figure 59) and that it changes with torsion
Figure 59 Molecular conformation of the relaxed gas phase at PBE06-31+G(d) showing
the bond lengths of the phenyl C-C bond (=180) of FA
For the definitive scans full optimization was performed near each symmetry-
independent potential minimum with a step size of Δ=5deg The highly repulsive points
for the substituted fenamates (TA and MA) were omitted due to the huge energy penalty
as approached 180deg (section 431 and Figure 58)
53 Results
121
Figure 510 Relaxed scans of FA at PBE06-31+G(d) with step sizes 2 and 1deg around the
maxima and minima respectively The red circles indicate the starting points of the scans
while the arrows indicate the directions of the scans
53 Results
122
533 Conformational Energy Profile of the Fenamates The conformational profile for four fenamate molecules (Figure 511) shows that there
are two distinct minima which are only close in energy for the symmetric FA and R2-
substituted ClFA (Figure 51) The ClFA molecule has one global minimum at 14838deg
in addition to the local minimum at 3586deg while FA has two global minima at 3894deg
and 14471deg (Figure 511) There is one potential maximum that varies slightly between
the molecules for the planar conformation (as drawn in Figure 51) there is a second
maximum when the aromatic rings are approximately perpendicular and there is a third
where there is a significant steric clash for the R1-substituted fenamates TA and MA as
the other planar conformation is approached An analysis of the observed values of this
torsion angle in experimental crystal structures containing the fenamate fragment shows
that the observed angles were clustered around the two minima (Chapter 4 Figure 412)
a finding that is consistent with the expectation that most molecules adopt low-energy
conformations in crystal structures208 Hence the two low-energy barriers although only
~5-9 kJ mol-1 clearly have a major effect on the crystal packing Indeed this
conformational energy is very significant it is large compared with most measured
polymorphic energy differences including those of TA which cover less than 2 kJ mol-1
(Chapter 4)
Figure 511 Relaxed conformational scans at the PBE06-31+G(d) level of theory for the
fenamates The minima were at ξ=3894deg and 14471deg for FA 4063deg and 11186deg for
TA 4408deg and 11048deg for MA and 3586deg and 14838deg for ClFA
53 Results
123
(a) (b)
(c) (d)
Figure 512 Relaxed conformational scans of fenamates (a) FA (b) TA (c) MA and (d)
ClFA at HF and PBE0 method with 6-31+G(d) basis set These are contrasted with the
single-point energies at the MP26-31+G(d) level and within a polarizable continuum
model (PCM) with =3 for the PBE06-31+G(d) conformations
By testing the sensitivity of this conformational profile to the choice of ab initio method
(Figure 512) it becomes clear that even obtaining a conformational profile that is in
qualitative agreement with the profile derived from experimental crystal structures is
sensitive to method The SCF scan has only one minimum as seen in Figure 512 at a
conformation that was not observed in the crystal structures of fenamates (section 433
Figure 412) If the CSP study of Chapter 4 were based on a SCF conformational profile
the crystal structures generated for FA and TA would have been qualitatively incorrect
Therefore it is essential that the ab initio methods include some description of the
electron correlation that produces a maximum at around 90deg Although there is moderate
agreement on the barriers to conformational change for TA and MA it is notable that
single-point MP2 calculations swap the relative energy positions of the two minima
(Figure 512) The PBE0 calculations are in better agreement with the analysis of the
53 Results
124
crystalline conformations of fenamate-like fragments with a substituent at C13 (Chapter
4)
The scans carried out within PCM with =3 showed a reduction in energy penalty
around the energy maxima (ξ~90deg) for all three fenamates (Figure 512) This reduction
is more pronounced for TA and MA around the local minima (ξ~110deg) than it is for FA
This finding suggests that the effect of solution or the crystalline environment the method
used for generating the final energy landscapes of FA and TA in Figure 414 of section
436 does not qualitatively change the conformational profile Hence the clustering of
observed torsion angles in fenamate crystal structures around the minima is not an artefact
of the neglect of the environment (Figure 412 in section 433) The results shown in
Figure 512 confirm that the definitive ab initio conformational profiles cannot be
obtained Nonetheless the scans in Figure 511 are adequate for the purposes of this study
534 Rigid Versus Relaxed Scans of Fenamates To establish the importance of changes in the other torsion angles bond angles and
bond lengths during the relaxed scans in Figure 511 the conformation scans were
repeated for the three fenamates starting with the fully optimized structure at the PBE06-
31+G(d) level of theory Only torsion angle was allowed to vary which meant that each
point had an identical conformation for all three ab initio methods (HF MP2 and PBE0)
The difference between rigid (solid lines in Figure 513) and relaxed (dotted line in Figure
513) scans was very marked for all the fenamates even in the lowest energy regions
where the changes in the benzoic acid ring and the intramolecular hydrogen bond were
small
53 Results
125
Figure 513 Comparison of relaxed (solid) and rigid (dotted line) scan of FA (top) TA
(middle) and MA (right) For the rigid scans calculations were performed using HF MP2
and PBE0 methods with 6-31+G(d) basis set as a function of torsion angle The relaxed
scans from Figure 511 were performed at the PBE06-31+G(d) level of theory
53 Results
126
0deg 80deg 110deg
Figure 514 Overlay of relaxed (coloured by element Figure 511) and rigid (red Figure
513) conformations of FA (top) TA (middle) and MA (bottom) overlaying the atoms
defining the ξ torsion angle at the PBE06-31+G(d) level of theory
Figure 514 shows a comparison of the rigid and relaxed conformations at the repulsive
barrier and the second minimum for FA TA and MA For TA the differences in the
relaxed and rigid scan conformations are very marked around the energy maxima (Figure
514 ξ=80deg) even though these maxima are less than 7 kJ mol-1 in the relaxed scans
(Figure 513) For FA there is a significant change in the relative orientation of the
benzoic acid group changing the internal hydrogen bond around all maxima The methyl
torsion is clearly playing a role in reducing the energy penalty around the 90deg maximum
for TA and MA (Figure 514) Indeed even for FA the changes in the other
conformational variables are vital to produce a low energy maximum at 90deg to the extent
that it is not surprising that even the relaxed scans differed in this region producing the
slight asymmetry between the two minima (Figure 511)
The contrast between the relaxed and rigid (Figure 513) scans and the corresponding
conformations (Figure 514) confirm that the changes in the other conformational
variables played a major role in lowering the conformational barriers providing low
values over a wide range of angles as implied by the crystallographic data (Chapter 4)
53 Results
127
535 Splitting electronic from steric contributions to the barrier to rotation
(a) (b)
(c) (d)
(e) (f)
Figure 515 The solid black lines show the relaxed torsional scans of planar-N-
constrained models for the phenyl rotation (Figure 56) where the benzoic acid group of
FA has been replaced by (a) hydrogen atom (PA) (b) methyl (c) vinyl and (d) prop-2-
enoic acid and the hydrogen in the meta position of PA has been replaced by (e) chlorine
and (f) methyl using HF PBE0 and MP2 methods with the 6-31+G(d) basis set Plots of
(h2)(1-cos(2)) where h is the height of the barrier of relaxed PBE06-31+G(d) scans
are shown in green For (c)-(f) the PBE06-31+G(d) relaxed scans of PA from (a) are
shown in grey for comparison In (a) and (b) a rigid scan at the PBE06-31+G(d) level of
theory is shown by a dotted line
53 Results
128
To establish the importance of the intramolecular steric clashes the rigid and relaxed
scans were repeated with model molecules that replaced the benzoic acid group of FA
with smaller fragments and the bonds around the nitrogen constrained to be planar (Figure
56) in order to avoid the pyramidalization of the amine (Figure 57) The potential energy
scan has a very large maximum at 90deg for planar-N-constrained phenylamine (PA)
approximately 6 times higher than the barrier in the fenamates (reflected in the scale
change between Figure 515a and Figure 511) Replacing one constrained hydrogen with
a methyl (Figure 56) produces a slightly larger barrier but very little asymmetry strongly
suggesting that this is an electronic effect of conjugation between the lone pair on the
nitrogen and the aromatic ring
Adding a double bond to PA reduces the barrier to rotation by 1110 kJ mol-1 (Figure
515c) Adding a carboxylic acid that forms an intramolecular H-bond to the N-H group
further reduces this barrier by almost 7 kJ mol-1 (Figure 515d) These observations imply
that the conjugation of the benzoic acid ring of the fenamates contributed significantly to
reducing the electronic barrier The intramolecular hydrogen bond in this model molecule
(Figure 515d) varies in length from 194 to 192 Aring as changes from 0 to 180deg by
comparison the FA hydrogen bond varies from 187 to 184 Aring Thus it is evident that the
intramolecular H-bonding in the fenamates reduces the electronic barrier In contrast
substituting Cl and CH3 at the meta position of PA (Figure 515e and f) shows little change
to the barrier height with half-height (h2) values of 3-chloroaniline (185 kJ mol-1) and
3-methylaniline (178 kJ mol-1) representing only a small increase over that of PA (176
kJ mol-1)
The scans in Figures 515a b e and f have no maxima at 0 or 180deg confirming that
the steric clash between the aromatic C6-H and C13-R1 (Figure 51) of the phenyl ring is
responsible for this maximum These curves are very well reproduced by ((h2)(1-
cos(2ξ)) where h is the potential maximum As the nitrogen substituents (Figures 515c
and d) get larger there are signs of additional steric effects particularly at the MP2 level
suggesting more changes in intramolecular dispersion The difference between a rigid
scan and a relaxed one is small (Figures 515a and b) and the differences in the curves
according to the type of calculation are relatively minor compared with the qualitative
differences between the HF and correlated methods for the fenamates (Figure 512) From
contrasting the conformational scans of model molecules with minimal steric effects
(Figure 515) with those of the fenamates (Figure 511) the overriding conclusion is that
there is an electronic contribution to the torsional barrier at =90 which can be
53 Results
129
represented by a (h2)(1-cos(2ξ)) term where h is the maximum energy from the
electronic contribution
There is a dramatic change in the HOMO isosurfaces of the phenyl ring with torsion
angle (Figure 516) which is remarkably similar between PA and the fenamates FA and
TA This finding suggests that the electronic contribution observed for PA is fundamental
to the fenamates The destructive interference of the MOs at =90 (Figure 516 and
Figure 517b) is the origin of the huge torsional barrier that is seen in each of the model
molecules in Figure 515 The smaller torsional barriers after adding a double bond
(Figure 515c) and acidic (Figure 515d) substituents to PA (Figure 515a) was a result of
increased electron delocalisation (compare Figure 517a with Figure 517b)
0deg 40deg 90deg
Figure 516 The electron density surface of HOMO frontier orbitals for different
conformations of PA (top) FA (middle) and TA (bottom) obtained from the PBE06-
31+G(d) level of theory Contour map isovalues were drawn at a 002 au level
(a) (b)
Figure 517 Alternative HOMO isosurface view of (a) FA and (b) PA molecule at =90
from Figure 516
My attempt at modelling delocalisation over the entire FA molecule even for the lowest
occupied orbital failed (Figure 518) which suggests that a completely flat model of
53 Results
130
FA ( = 0) is unrealistic This is because of the huge steric barrier (Figure 513) of a planar
conformation and the linear combinations of atomic orbitals in many molecular orbitals
are sensitive to conformation The electronic effects are not well defined for TA ie no
Figure 518 equivalent for TA due to the bulky substituent hence excluded in the analysis
= 0 = 40 = 90
Figure 518 HOMO-10 (46 MOs) isosurface view of side (top) and front (bottom) FA
molecule at =0 40 and 90
The MOsrsquo picture can only give a qualitative guide to the electronic contribution
because it is not possible to have an aromatic substitution at R2 or a methyl group
substitution on C13 (as in MA and TA) without steric interactions At present
independently investigating how the electronic barrier varies among the fenamates is not
possible However it is clear from Figure 515 that whilst the benzoic acid substituents
will have a dramatic effect on lowering the barrier the meta-substitution of chlorine and
methyl on the phenyl ring has a much smaller effect on the barrier
536 Estimating the Steric Contributions with an Atom-Atom Potential The steric effects of FA and TA can be analysed by using Gavezzottirsquos parameters
(Table 52) to produce a conformational profile (see Figure 519) which can then be
subdivided into the repulsion (Aexp(minusBRik)) and dispersion (minusCRik6) contributions
This subdivision (Figure 519) suggests that the repulsion terms dominate producing
maxima at 0 and 180deg and minimum at 90deg a finding that is consistent with the
supposition that these maxima occur because of steric clashes However the repulsions
are severely overestimated The dispersion contribution gives a maximum at ~90deg
which is of the same order of magnitude as the ab initio maxima particularly for FA This
confirms the observation from Figure 512 that electron correlation the origin of
dispersion interactions makes a significant contribution to this maximum supplementing
53 Results
131
the electronic effect (cf Figure 515) The difference between TA and FA in Figure 519
is consistent with the large dispersion interaction of the Cl substituent as well as the
repulsion from the methyl substituent
Figure 519 Comparison of the ab initio (black) intramolecular energy scans at the
PBE06-31+G(d) level of theory for FA (top) and TA (bottom) with Gavezzottirsquos exp-6
intramolecular energy models summed over all intramolecular atom-atom distances from
the third nearest neighbour (1-4) and above The net effect (purple) is subdivided into the
repulsive (red) and dispersion (blue) contributions
537 Investigating the Important Interactions with Atom-Atom Potential For FA and TA the dominant interactions involve C H and HB (Table 56) while the
dominant interactions involving N and Cl (Table 57) were exclusive to TA Although FA
and TA have the N atom only TA has the methyl substituent (N1∙∙∙C14 f and N1∙∙∙H12
f
Table 57) Of all the dominant interacting atoms for FA and TA only Cl of TA interacts
with atoms (methyl substituent) belonging to the same aromatic ring (dfC14∙∙∙Cl1
dfCl1∙∙∙H10 and dfCl1∙∙∙H11 Table 57) These results confirm the observation that the
53 Results
132
methyl substituent plays a role in reducing the energy penalty for TA (section 534
Figure 514)
Table 56 Atom-atom interactions of FA that dominate the intramolecular energies as
estimated using Gavezzottirsquos exp-6 potential The interaction is listed as dominant if the
difference between the minimum and maximum total energy (Erepul-dis) is greater than or
equal to 1 kJ mol-1
ati∙∙∙atk neigh RikkJ mol-1 ErepulkJ mol-1 EdispkJ mol-1 Erepul-dispkJ mol-1
min max(∆) min max(∆) Min max(∆) min max(∆)
C7∙∙∙C9 4 307 371(064) 057 533(476) -289 -092(196) -035 245(280)
C7∙∙∙C13 4 307 371(064) 057 532(475) -288 -092(196) -035 244(279)
C6∙∙∙C9 5 310 443(133) 005 475(470) -270 -032(239) -039 205(243)
C6∙∙∙C13 5 311 444(133) 005 468(463) -268 -032(236) -039 200(238)
C6∙∙∙H7 6 252 488(236) 000 398(398) -186 -003(182) -021 212(233)
C8∙∙∙H5 5 254 288(034) 089 357(268) -175 -083(092) 007 182(176)
C9∙∙∙H5 6 257 416(159) 000 317(316) -163 -009(154) -020 154(174)
H5∙∙∙H7 7 208 476(268) 000 578(578) -135 -001(134) -004 443(447)
C13∙∙∙HB6 4 251 330(078) 016 403(387) -187 -037(151) -021 216(236)
HB6∙∙∙H11 5 230 368(138) 001 240(239) -074 -004(070) -004 166(170)
C6∙∙∙H8 4 289 310(020) 485 985(500) -412 -274 (138) 212 573(362)
C6∙∙∙H11 6 252 488(237) 000 396(396) -185 -003(182) -020 211(231)
C13∙∙∙H5 6 257 417(159) 000 314(314) -162 -009(153) -020 152(172)
H5∙∙∙H11 7 209 476(267) 000 548(548) -130 -001(129) -004 418(422)
C9∙∙∙HB6 4 251 330(079) 016 406(390) -188 -036(152) -021 218(238)
HB6∙∙∙H7 5 230 369(139) 001 238(237) -074 -004(069) -004 164(169)
Table 57 Atom-atom interactions of TA that dominate the intramolecular energies as
estimated from Gavezzottirsquos exp-6 potential The interaction is listed as dominant if the
difference between the minimum and maximum total energy (Erepul-dis) is greater than or
equal to 1 kJ mol-1 dInteractions between atoms on the same aromatic ring fInteractions
involving the methyl substituent
ati∙∙∙atk neigh RikkJ mol-1 ErepulkJ mol-1 EdispkJ mol-1 Erepul-dispkJ mol-1
min max(∆) min max(∆) min max(∆) min max(∆)
C7∙∙∙C9 4 302 361(059) 081 630(549) -317 -109(209) -028 313(340)
C7∙∙∙C13 4 314 372(058) 056 417(361) -252 -091(161) -035 165(201)
C6∙∙∙C9 5 308 412(104) 014 513(499) -282 -050(233) -039 231(269)
C6∙∙∙C13 5 324 444(119) 005 292(287) -207 -032(176) -039 085(123)
C6∙∙∙H7 6 248 445(197) 000 458(458) -202 -006(196) -020 256(276)
C8∙∙∙H5 5 254 289(035) 086 363(277) -176 -081(095) 005 187(182)
C9∙∙∙H5 6 260 369(109) 003 286(283) -154 -019(135) -021 132(153)
H5∙∙∙H7 7 214 418(204) 000 451(450) -113 -002(111) -004 337(342)
C13∙∙∙HB6 4 254 322(068) 022 364(341) -176 -043(134) -020 187(207)
HB6∙∙∙H11f 6 219 450(231) 000 364(364) -098 -001(096) -004 266(271)
HB6∙∙∙H12 f 6 228 315(087) 008 254(246) -077 -011(066) -003 177(180)
C6∙∙∙C8 4 289 310(021) 485 995(511) -414 -273(141) 211 581(370)
C6∙∙∙C14 f 6 310 510(200) 000 482(482) -273 -014(259) -039 210(248)
C7∙∙∙C14 f 5 312 414(102) 013 455(442) -264 -048(216) -039 191(230)
C7∙∙∙H12 f 6 255 385(130) 002 344(342) -171 -014(156) -020 173(194)
N1∙∙∙C14 f 4 278 298(021) 487 1081(594) -607 -395(212) 093 474(382)
N1∙∙∙H12 f 5 243 262(019) 162 385(222) -243 -154(088) 008 142(134)
dfC14∙∙∙Cl1 4 304 311(007) 688 875(187) -488 -427(061) 261 387(126) fC14∙∙∙HB6 5 241 371(130) 003 618(615) -241 -018(223) -021 377(397) dfCl1∙∙∙H10 5 257 324(068) 051 813(762) -410 -100(309) -049 404(453) dfCl1∙∙∙H11 5 269 374(105) 007 489(483) -308 -042(266) -050 181(231)
54 Discussion The Physical Origins of Torsional Potentials
133
Analysis of which particular atom-atom interactions vary most with conformation
(Table 56 and Table 57) reveals that intramolecular interactions involving the N-H
proton type HB as well as certain aromatic and TA methyl protons type H vary strongly
with conformation as expected based on Figure 514 Therefore the poorly determined
parameters for HB and H strongly affect the energy profiles of Figure 519
54 Discussion The Physical Origins of Torsional Potentials The torsional barriers for fenamates apart from gt 140 are smaller than for PA and
ethane For the fenamates the difference in energy penalty arises from the high degree of
conjugation between the two aromatic rings of the fenamates via ∙∙∙ overlap involving
the lone pair of electrons of the N atom (Figure 516)234 This conjugation effect is absent
for ethane and reduced for PA because these have just one aromatic ring It is clear that
compared to PA the barrier to rotation reduces as the model molecules tend toward two
aromatic rings These observations confirm that the delocalisation of electrons plays a
role in the origin of the torsional barrier for fenamate molecules FA and TA
The maximum at = 90 (Figure 515) is due to dispersion effects The investigation
of different methods for producing conformational profiles demonstrates the importance
of accounting for correlation effects For example the HF method is hopeless for
reproducing the correct conformation profiles around the minima for fenamate molecules
FA TA MA and ClFA (Figure 512) because the method excludes the correction effects
Therefore it is vital that methods of examining the conformational profiles include the
correlation effects This is most important in CSP where accurate ranking of generated
crystal structures depends upon accurately evaluating the energy penalty contribution to
the total lattice energy (equation 51)
Although the conformational profiles are dependent on specific atoms that define
flexible torsion (Figure 58) the comparison of the rigid and relaxed scans shows the
important role that the atomic positions of other atoms play (Figure 513 and Figure 514)
during relaxation For example during the relaxation of TA methyl rotation plays a role
in reducing the energy penalty and barrier to rotation (section 534) The enormous
difference between the relaxed and rigid conformational profiles (Figure 513) and their
conformers (Figure 514) suggests that the atomic positions of most atoms in a molecule
during relaxation are important Consequently we can conclude that the origin of the
torsional barrier involves most atoms in a molecule
By analysing the low-energy torsional barriers in fenamates (Figure 511) it has
become clear that larger organic molecules retain the contributions as identified for small-
55 Summary
134
model molecules such as ethane There is both an electronic and a steric component to
these torsional barriers in fenamates However as the model molecules become larger
the effects of small correlated changes in the other bond angles and the dispersion
contributions become very significant (Figure 515c and d) As the size of the molecule
increases in both the number of atoms and the electron density there is an increasing
contribution to the torsional profile from the intra-molecular equivalent of the
intermolecular dispersion
Separating the ldquothrough spacerdquo intramolecular dispersion from the other electron
correlation effectsmdashspecifically those that contribute to the (h2)(1-cos(2)) electronic
barrier from ldquoconjugationrdquo or delocalization between the two aromatic ringsmdashis unlikely
to be meaningful when using an ab initio method that is still approaching the quantitative
accuracy needed
55 Summary I could not use the definitive ab initio torsional potential for each fenamate as the
torsional potentials of organic molecules containing aromatic rings are very demanding
of the electronic structure method used However PBE0 method and 6-31+G(d) basis set
were sufficient to investigate the origin of the barrier to rotation for FA and TA
The analysis of the fenamatesrsquo torsional potential reveals that like the classical small-
molecule torsional potentials of ethane there is both an electronic effect (loosely
described as changes in MOs involving ∙∙∙ between the aromatic rings and the nitrogen
lone pair destabilizing the non-planar conformations) and a steric effect from the variation
in overlap of non-bonded atoms For larger molecules like the fenamate molecules the
intramolecular dispersion and small changes in the other conformational variables also
make significant contributions to the torsional profile
When the aromatic rings are perpendicular to each other the destructive interference of
MOs creates an intrinsic barrier The two rings in fenamate molecules stabilise the
expected high-energy barrier A cos2 term accurately represents the torsional barrier of
model molecules with minimal steric effects that have been constrained to prevent
pyramidalization Finally this chapter showed that the torsional barriers for FA and TA
depend on small correlated changes in degrees of freedom other than the most flexible
torsion We observed this by contrasting the conformations and their corresponding
energies of rigid scans against relaxed scans for FA and TA
The origin of the torsional barrier of fenamates is therefore a combination of intrinsic
intramolecular dispersion electronic contribution and the steric repulsion A new
55 Summary
135
analytical form for intramolecular energies (Chapter 6) of fenamates that is physically
justified must incorporate these origins and account for small correlated changes among
different conformations
61 Introduction
136
Chapter 6 Toward New Force fields for Fenamate Molecules
ldquoAvoid complexities Make everything as simple as possiblerdquo
mdash Henry Maudslay
61 Introduction
611 Background Force field methods (section 25) for calculating a systemrsquos energy ignore electronic
motions and instead calculate the systemrsquos energy as a function of the nuclear positions
alone63 Such force field methods are less computationally demanding than quantum
mechanical calculations but they cannot predict properties that depend upon a moleculersquos
electronic distribution In addition the limitations of electronic structure calculations as
discussed in Chapters 2 (section 27) and 4 (sections 438 and 439) suggest the need
for a new analytical model that can combine the accuracy of electronic methods and the
speed of force field methods This chapter proposes a solution to this problem
In general force field methods are based on two important components (i) the
functional form of the potential energy functions and (ii) the parameterisation of these
functions235236 In Chapter 5 I investigated the first component the origin of the torsional
barrier for fenamate molecules For small molecules that were constrained to have
minimal steric clashes the origin is mainly an electronic effect and can be expressed as a
cos2ξ term However for larger molecules like fenamic (FA) and tolfenamic acids (TA)
there are additional correlated changes namely the repulsion and dispersion effects
Chapter 5 by investigating these contributions with an exp-6 term dealt with the first
component required for building a force field
The present chapter deals with the second component of force fields re-
parameterisation In this chapter I will derive an analytical model for FA and TA (Figure
61) by fitting the conformational profiles (Figure 511) to analytical expressions
discussed in Chapter 5 One of the key conclusions of Chapter 5 was that definitive ab
initio conformational energy scans could not be obtained However the ab initio scans at
the PBE06-31+G(d) level of theory (Figure 511) are adequate for the purposes of
creating a new analytical model
61 Introduction
137
1
6
2
1
9
1
1
813
7
16
Figure 61 The fenamate family showing the low-barrier torsion angle (=C7-N1-C8-C9)
and atomic numbering =0 when the aromatic rings are coplanar as drawn The
fenamates mentioned in this chapter are fenamic acid (FA) R1= R2= H tolfenamic acid
(TA) R1= CH3 R2= Cl mefenamic acid (MA) R1= R2= CH3 flufenamic acid (FFA) R1=
H R2= CF3 and clorofenamic acid (ClFA) R1=H R2=Cl The dotted line represents an
intramolecular hydrogen bond
Figure 62 Relaxed conformational scans at the PBE06-31+G(d) level of theory for the
fenamates from section 533 Fenamic acid (FA) tolfenamic acid (TA) mefenamic acid
(MA) and chlorofenamic acid (ClFA)
612 A Case for Modelling Decoupled Intramolecular Energy For challenging applications involving molecular recognition of pharmaceuticals such
as computer-aided drug design the importance of an accurate balance of intermolecular
and intramolecular forces cannot be overemphasized93 The success of CSP studies17127
(Chapters 3 and 4) and the limitations of current force field (section 254) and electronic
structure methods (sections 27 and 439) suggest decoupling the models for the
intermolecular forces from those for the intramolecular forces (ie conformational
61 Introduction
138
changes) as a means of more accurately modelling force fields for pharmaceutical
molecules should be attempted
613 Analytical Models of Intramolecular Energies Traditional force field modelling includes an explicit torsional term237 of the general
form
where defines the phase shift and n the periodicity For FA as defined in Figure 61
requires that = 0 and the near-symmetry dictates that n is an even integer For
substituted fenamates odd values of n could contribute although the conformational
profile should be symmetric about = 0
Non-bonded atomndashatom interactions should be able to represent the intramolecular
energies well if the origin of the conformational profile is predominantly steric (caused
by the varying repulsion between the overlapping charge distributions of 1-4 atoms with
) An exp-6 atomndashatom model (Chapter 5) would be expected to give a better
representation than a Lennard-Jones (R-12) model of the variation of the repulsion with
distance given the success of the overlap model in parameterizing intermolecular
repulsion potentials238239 Thus a crude starting point for my investigation of the ldquonon-
bondedrdquo contribution to the torsion potential is the exp-6 atomndashatom model potential with
a parameterization that was developed for modelling the intermolecular forces between
organic molecules in crystal structures42231
where atoms i and k of atomic types and are separated by intramolecular distances Rik
calculated from the molecular conformation with torsion angle ξ This functional form
with no assumed relationship between the like (and ) and unlike () interactions
means that the parameters (A B and C) have at least partially absorbed the
electrostatic effects in fitting This chapter seeks to re-parameterize the equations of the
origin of torsional potential (equations 61 and 62) in order to derive analytical models
that accurately represent the conformational profiles of fenamic (FA) and tolfenamic
acids (TA)
614 Overview The goal of this chapter is to develop a generalizable method that uses a FORTRAN
code to derive analytical models for the conformational profiles of FA and TA This
( ) [1 cos( )]2
nVE n 61
6
( ) exp( )ik ik
i k
E A B R C R 62
62 Methodology Fitting Analytical Models to Conformational Profiles
139
chapter will investigate three analytical forms the cosine series rescaling repulsion and
combined physical models Each of these new analytical forms will have different
parameters for intramolecular and intermolecular contributions I will discuss the
methodology of fitting analytical models to conformational profiles and test the
transferability properties of the combined physical models for FA and TA to other
fenamate molecules (Figure 61)
This chapter will show that the cosine series and rescaled repulsion models are
inadequate for modelling the conformational energy profiles of fenamates More
importantly this chapter will show that combining a cos2 term to represent the
electronic barrier with an intramolecular atomndashatom exp-6 repulsion-dispersion term for
all atom pairs separated by three or more bonds (bond-paths ge 1-4) allows a very effective
representation of the ab initio conformational energies
62 Methodology Fitting Analytical Models to Conformational Profiles The only weighting applied to the conformational profiles of all the fenamate molecules
(Figure 511 at the PBE06-31+G(d) level of theory) in this chapter was the restriction of
conformational energies to 10 kJ mol-1 or below This weighting was appropriate because
this chapter does not seek to represent the steric barrier above 145deg for TA (and MA)
accurately Hence this chapter considers Np = 37 points for the FA and Np = 30 points for
TA (and MA) Because the definition of the ab initio energies Eab are relative to the
lowest energy conformation for each molecule the analytical modelrsquos energies Emodel
were adjusted by a constant Ebase such that the lowest energy conformation of both the
ab initio and analytical model were zero The algorithms (Figure 63 and Figure 64) in
this chapter fit a constant c that matched the overall conformational curves rather than
the minima As such c differs from Ebase by a fraction of a kJ mol-1 The standard error
σintra in Emodel was
where Np and Nk are the number of data points and fitted coefficients respectively
However there were only Nk -1 physical parameters as one (c ~ Ebase) served only to
adjust the baseline
621 Torsional Potential Model The explicit torsional term (equation 61) can be simplified as the following cosine
series
2
mod
int
ab el
ra
p k
E E
N N
63
62 Methodology Fitting Analytical Models to Conformational Profiles
140
where Nk and Np are the number of fitted coefficients and data points respectively The
intercept c is 0 Using the linear least squares method (section 26) the cosine series
(equation 64) were fitted to the conformational profiles of FA and TA (Figure 511) to
determine the unknown coefficients k Below is a flowchart of the cosine series
algorithm (Figure 63)
Figure 63 An algorithm showing the overview of modelling ab initio intramolecular
energy using a cosine series potential The source codes are included in the CD ROM
attached to this thesis (see Appendix A)
In the initialization step (step 1) the algorithm required the ab initio intramolecular
energies and the inputs of their equivalent torsion angles (Figure 511) These inputs
(generated from the ab initio scans reported in Chapter 5) were used to construct a
regression model (step 2) The G02DDFE97 NAG subroutine (section 262) solved the
resulting linear regression problem that is the unknown coefficients k were
determined Finally the standard error σintra of the modelled intramolecular energy
Emodel (equation 63) was calculated
0
( ) cos( 1 ) 5 1kN
k k p
k
E k N N
64
62 Methodology Fitting Analytical Models to Conformational Profiles
141
622 AtomndashAtom Model Due to the considerable correlation between the atomndashatom coefficients particularly
the two repulsion parameters (A and B) it is difficult to vary both repulsion parameters
simultaneously240241 This section discusses the derivation of analytical atomndashatom
models for conformational profiles of FA and TA as expressed in the algorithm shown
in Figure 64 In particular this section discusses the rescaling of selected repulsion (and
dispersion) coefficients which gives a linear model that contains (an appropriate cosine
term and) a baseline constant c
Figure 64 An algorithm showing the modelling of ab initio intramolecular energy by a
physical potential The source codes are included in the CD ROM attached to this thesis
(see Appendix A)
This algorithm (Figure 64) which uses NAG129 library routines shows the systematic
comparison of how well various selections of linear parameters ( and c) can
represent the conformational profiles of fenamates The algorithm first extracted the
geometries and the corresponding intramolecular energies of the fenamate molecules
which were generated from ab initio calculations These geometries were converted to an
atomic type-friendly mol2 format (Sybyl typing230) using the Babel242 chemical toolbox
The other inputs are the starting values of Gavezzottirsquos atomndashatom exp-6 potential
parameters41231232 (Table 52 of Chapter 5) The covalent 1-1 connectivity (from the mol2
file) helped to distinguish the polar hydrogen HB from the non-polar hydrogen H
atoms The remaining atomndashatom connectivity (ie nearest neighbour or bond-path) and
6
( ) cos(2 ) exp( )ik ik
i k
E A B R C R c 65
62 Methodology Fitting Analytical Models to Conformational Profiles
142
distances Rik within the molecule were determined using the H03ADF subroutine and
the 1-1 connectivity H03ADF subroutine evaluates the nearest neighbour by finding the
shortest path between two atoms
Next the atom-atom interactions were summed over all 1-4 atom-atom distances and
higher bond-paths in the entire molecule (equation 65) The maximum bond-path was 1-
11 for all three fenamates and most pharmaceutical molecules were sufficiently small
that there was no need to define a summation limit in terms of intramolecular distance or
bond-path length for a single molecule The use of 1-4 distances as the shortest
intramolecular interactions included in the atomndashatom summation was traditional
Although it should be noted that 1-3 interactions were used elsewhere eg in the CSP
code of GRACE where they have sometimes been found to be problematic including the
recent case of a bulky side group attached to an aromatic ring which required specific
scaling down13 The atomndashatom formulation resulted in many virtually constant terms
such as the H∙∙∙H C∙∙∙C and H∙∙∙C contributions from within the aromatic rings These
terms contributed to the baseline energy Ebase defined as the minimum energy found in
the scan with a specific parameterized model
The atomndashatom model involved far too many coefficients for all to be fitted
independently to the ab initio data In addition many atomndashatom distances did not change
significantly with the torsion angle as observed from investigating the atomndashatom
interaction that dominated the intermolecular contribution in Chapter 5 There were only
16 and 21 dominant interactions out of 351 and 435 total atomndashatom interactions for FA
and TA Therefore only interactions that were classed as dominant were rescaled The
algorithm in Figure 64 determined the dominant interaction by using a cut-off value of
one ie Ecutoff = 1 kJ mol-1 The dominant atomndashatom interactions for FA and TA were
reported in Chapter 5 (Table 66 and Table 57) which are summarised in Table 61 If
atomndashatom interaction of a given type (∙∙∙) varied less than the Ecutoff (for example Cl∙∙∙O
and O∙∙∙HB) then these parameters were not rescaled but may vary the contribution to
Ebase One notable observation was the significant interaction between atoms of the same
aromatic ring for TA (Table 61d) which was absent in FA
62 Methodology Fitting Analytical Models to Conformational Profiles
143
Table 61 Contrasting the atomndashatom interactions of FA and TA that dominated the
intramolecular energies formed by combining Table 56 and Table 57 from Chapter 5
Interactions unique to FA and TA are coloured blue and red respectively dInteractions
between atoms of the same aromatic ring fInteractions involving the methyl substituent
FA TA FA TA ati∙∙∙atk neigh RikkJ mol-1 RikkJ mol-1 Erepul-dispkJ mol-1 Erepul-dispkJ mol-1
min max(∆) min max(∆) min max(∆) min max(∆) C∙∙∙C
C7∙∙∙C9 4 307 371(064) 302 361(059) -035 245(280) -028 313(340)
C7∙∙∙C13 4 307 371(064) 314 372(058) -035 244(279) -035 165(201)
C6∙∙∙C9 5 310 443(133) 308 412(104) -039 205(243) -039 231(269)
C6∙∙∙C8 4 289 310(021) 211 581(370)
C6∙∙∙C13 5 311 444(133) 324 444(119) -039 200(238) -039 085(123) fC6∙∙∙C14 6 310 510(200) -039 210(248) fC7∙∙∙C14 5 312 414(102) -039 191(230)
C∙∙∙H fC7∙∙∙H12 6 255 385(130) -020 173(194)
C6∙∙∙H7 6 252 488(236) 248 445(197) -021 212(233) -020 256(276)
C6∙∙∙H8 4 289 310(020) 212 573(362) C6∙∙∙H11 6 252 488(237) -020 211(231) C8∙∙∙H5 5 254 288(034) 254 289(035) 007 182(176) 005 187(182)
C9∙∙∙H5 6 257 416(159) 260 369(109) -020 154(174) -021 132(153)
C13∙∙∙H5 6 257 417(159) -020 152(172) H∙∙∙H
H5∙∙∙H7 7 208 476(268) 214 418(204) -004 443(447) -004 337(342)
H5∙∙∙H11 7 209 476(267) -004 418(422) C∙∙∙HB
C13∙∙∙HB6 4 251 330(078) 254 322(068) -021 216(236) -020 187(207)
C9∙∙∙HB6 4 251 330(079) -021 218(238) C14∙∙∙HB6 5 241 371(130) -021 377(397)
HB∙∙∙H
HB6∙∙∙H11 5 230 368(138) -004 166(170) HB6∙∙∙H7 5 230 369(139) -004 164(169)
fHB6∙∙∙H11 6 219 450(231) -004 266(271) fHB6∙∙∙H12 6 228 315(087) -003 177(180)
N∙∙∙C fN1∙∙∙C14 4 278 298(021) 093 474(382)
N∙∙∙H fN1∙∙∙H12 5 243 262(019) 008 142(134)
C∙∙∙Cl fC14∙∙∙Cl1 4 304 311(007) 261 387(126)
Cl∙∙∙H dfCl1∙∙∙H10 5 257 324(068) -049 404(453) dfCl1∙∙∙H11 5 269 374(105) -050 181(231)
63 Results
144
These atomndashatom interactions were grouped into unique atom-type∙∙∙atom-type sets
(∙∙∙) The algorithm then systematically fit different subsets of the ∙∙∙rescaling
parameters using combination mathematics243 Eg for interactions C∙∙∙H C∙∙∙HB and
H∙∙∙HB the following seven subsets of interactions were rescaled
1 C∙∙∙H or C∙∙∙HB or H∙∙∙HB
2 C∙∙∙H and C∙∙∙HB or C∙∙∙H and H∙∙∙HB or C∙∙∙HB and H∙∙∙HB
3 C∙∙∙H C∙∙∙HB and H∙∙∙HB
For each fit the subroutine G02DDFE97 (section 262) calculated the Nk coefficients
( c) being fitted and minimized the residual sum of squares (RSS) using a
general linear regression model244 Within the routine a matrix decomposition process
established whether a solution was unique or whether the parameters were linearly
dependent and therefore had no unique solution Unless otherwise noted all fits reported
in this chapter had a unique solution Finally the standard error intra in the modelrsquos
intramolecular energy was calculated after adjusting the minimum to 0 kJ mol-1 (equation
63)
This chapter used the method discussed above to investigate two analytical models
(1) Rescaling only the repulsion contribution of the atomndashatom exp-6 potential ie
equation 65 with and set at 0 and 1 respectively
(2) Rescaling all the parameters ie equation 65
63 Results
631 Cosine Series Model The traditional cosine series expansion for a torsional potential (equation 64) must
include cos4 to have the correct number of minima for the fenamates Alone this term
gave a poor position of the minima for FA and it was qualitatively wrong for TA (Figure
65) A least squares fit that included the lower cosine terms (Nk=5 equation 64) gave a
qualitatively reasonable representation (Figure 65) but further improvement is slowly
converging (Figure 66) For FA the fitting steadily improved in quality particularly
upon the addition of cos4n terms where n are integers For TA the fitting became
unstable after 21 terms even though there was no attempt to represent the large steric clash
beyond 10 kJ mol-1
This result demonstrated that the cosine series was a fitting exercise and did not reflect
the physics It was effectively an exercise in modelling the relaxed scans by a functional
6
( ) exp( )ik ik
i k
E A B R C R c 66
63 Results
145
form that assumed the scan was rigid (ie only the torsion angle changed) This
assumption is a crude approximation since rigid scans are different from relaxed scans
(see Figure 513) Poor convergence of the cosine model expansion were also reported
for biphenyl245 a dye which required 7 terms while polynorbornene246 required 6 and 15
terms for the meso and racemic dimer respectively
Figure 65 Comparison of the ab initio relaxed scan at the PBE06-31+G(d) level of
theory with linearly fitted least square cosine series model for FA (top) and TA (bottom)
with Nk=5 (red lines) the optimal cos4 terms (blue lines) and Nk=21 (green lines σintra
=017 kJ mol-1 for FA and TA)
63 Results
146
Figure 66 Plot of the standard error of the intramolecular energies against the number of
cosine terms Nk for FA (top) and TA (bottom) The fit is ill-determined ie there is no
unique solution for TA after Nk=21
632 Rescaled Repulsion Model From Chapter 5 it is clear that the repulsion contributions were severely overestimated
for FA and TA with Gavezzottirsquos exp-6 potential Therefore an alternative model is to
rescale just the repulsion terms (ie fit selected in equation 66) as the intermolecular
atomndashatom model clearly overestimated the intramolecular steric effects (Figure 519)
Rescaling just a few of Gavezzottirsquos repulsion parameters for example those involving
the poorly parameterized H∙∙∙H interactions resulted in a qualitatively good fit (Figure
67) as shown by the results for fitting all combinations of repulsion parameters for FA
(Table 62) and the summary in Table 63 of the 511 such fits for TA Rescaling just two
(C∙∙∙H and H∙∙∙H) repulsion contributions for FA and five (C∙∙∙H C∙∙∙HB C∙∙∙N H∙∙∙H and
H∙∙∙HB) for TA produced a model that reproduced the torsional profile well (Figure 67)
63 Results
147
Figure 67 Comparison of the relative energies from ab initio calculations (solid black
lines) of FA (top) and TA (bottom) with selected best-fit exp-6 rescaled repulsion models
For FA the selected Nk=3 intra=032 kJ mol-1 model had βC-H=-453 βH-H=270 and
Ebase=-506 while the Nk =4 intra=027 kJ mol-1 model had βCH=-446 βH-H=210 βH-
HB=257 and Ebase=-875 For TA the selected Nk=6 (intra=034 kJ mol-1) and 10
(intra=022 kJ mol-1) parameter fits are shown bold in Table 63
The rescaling of the C∙∙∙N interaction seemed particularly critical for TA (Table 63)
which can be attributed to the importance of the C(methyl)∙∙∙N interaction in describing
the steric clash involving the methyl group (Figure 514) However many of the fitted
rescaling parameters were negative (which suggested that the exponential steric
repulsion had become attractive Thus again this appeared to be a fitting exercise so that
exponential terms were reducing the over-estimate of the barrier at 90 by the
intermolecular dispersion parameters (Figure 519)
63 Results
148
Table 62 Complete set of results after rescaling Nk (repulsion contributions and
baseline energy Ebase) parameters of various interacting atomic types for FA
ικ Ebase σintra kJ mol-1
Nk C -C C -H C -HB H -H H -HB 2 - -226 - - - 437 168 2 - - -148 - - 1076 284 2 - - - -088 - 2215 287 2 - - - - -423 3579 299 2 -332 - - - - -39948 451 3 - -453 - 269 - -506 032 3 - -428 - - 539 -1511 032 3 -210 -217 - - - -31011 036 3 - -523 365 - - 278 04 3 -523 - -173 - - -62622 045 3 -621 - - -124 - -71356 065 3 -666 - - - -549 -74317 066 3 - - -991 - 2082 -7537 127 3 - - -909 722 - -2278 174 3 - - - -738 1972 -2577 247 4 - -446 - 210 257 -875 027 4 - -467 144 243 - -388 03 4 079 -438 - 258 - -2557 032 4 041 -390 - - 459 -7101 032 4 - -432 109 - 525 -1456 033 4 -173 -254 133 - - -27252 037 4 -458 - -296 - 394 -57220 04 4 -507 - -218 137 - -61133 045 4 -639 - - -035 -157 -72571 064 4 - - -958 006 2275 -7893 125 5 130 -467 - 218 278 2069 028 5 - -448 104 210 251 -849 028 5 236 -591 218 270 - 13231 029 5 -016 -327 037 - 481 -12963 031 5 -456 - -284 061 479 -57209 039 6 208 -550 170 237 225 10068 028
Table 63 Summary table of the best results after rescaling Nk (repulsion contributions
and baseline energy Ebase) parameters of various interacting atomic types for TA
βικ Ebase σintra kJ mol-1 Nk C-C C-Cl C-H C-HB Cl-H C-N H-H H-HB H-N
2 - 909 - - - - - - - 11281 130 3 -008 - - - - -299 - - - -13547 093 4 - - - - 751 -269 - - 1454 11747 087 5 - - -279 622 - -464 - -549 - -5429 051 6 - - -306 472 - -447 426 -529 - -5279 034 7 - - -392 472 - -487 532 -611 -054 -7690 025 8 - 503 -359 387 265 -340 581 -570 - 300 022 9 - 531 -343 355 318 -327 596 -539 190 1748 021
10 084 541 -319 330 347 -331 611 -527 219 681 022
63 Results
149
633 Combined Physical Model Assuming a model that both describes the electronic effects and allows rescaling of the
atomndashatom interactions
Then there is a huge number of ways for finding a satisfactory fitting of the data The
rescaling of the three contributions in equation 67 is physically justified since
(1) The α term represents the electronic barrier that arises from the conjugation of
benzoic acid rings (section 535)
(2) The rescale term is necessary due to the overestimation of the repulsion
contribution (section 536)
(3) The rescale term accounts for electron correlation ie dispersion Section 275
emphasised the importance of the dispersion term while section 533 showed the
consequence of ignoring the electron correlation eg HF method
Cases where and gt 0 retained the repulsive and attractive (dispersion) nature ie
repulsion did not become attraction and vice versa It was also required that was less
than zero ( lt 0) to give a maximum around =90deg corresponding to conjugation (Figure
515) Table 64 contains all the fits to FA which have the physically correct sign for all
parameters and the full set of results for fitting up to 12 parameters (including the baseline
estimate Ebase as given in Table 65) This shows that fitting and only rescaling a few
atomndashatom interactions gives a qualitatively accurate fit (Figure 69) It is notable that the
parameters involving H and HB usually needed the greatest rescaling a finding that is
consistent with the fact that HB parameters were not fitted in the intermolecular potential
model In addition the intermolecular parameterization of H∙∙∙H is a notable exception in
that its minimum is very shallow (Figure 68) and is not sharply defined being repulsive
for a wide range of intermolecular H∙∙∙H distances42 Furthermore there is a huge
difference between other polar H (HB) interactions and H∙∙∙H interactions therefore it is
not surprising that the interactions that involve HB atoms required the greatest rescaling
Table 64 All fits obtained for FA with the physically correct sign for the repulsion
and dispersion and electronic parameters βικ γικ α Ebase σintra
kJ mol-1 Nk C-C C-H C-HB H-H H-HB C-C C-H C-HB H-H H-HB
6 - - 801 1074 - - - 1654 5800 - -339 -12383 026
6 - 028 - - 1109 - 783 - - 3479 -117 -7549 028
4 - - - 1108 - - - - 5003 - -391 -5926 033
4 - 619 - - - - 2082 - - - -157 -18049 036
4 - - - - 3467 - - - - 13698 -530 -1246 057
4 - - 3630 - - - - 11038 - - -945 -33466 076
6
( ) cos(2 ) exp( )ik ik
i k
E A B R C R 67
63 Results
150
Figure 68 Gavezzotti exp-6 potential for all atomndashatom interactions in fenamates
displayed in two different energy scales The parameters are from Chapter 5 (Table 52)
Although virtually perfect fits can be obtained (Table 65) the variation in the fitted
parameters is significant given the exponential sensitivity of the repulsion to changes in
atomndashatom distances These could be substantial for example the lack of symmetry for
the FA torsional scan where the two minima were found at =3894deg and 14471deg though
only differing in energy by 188 x 10-3 kJ mol-1 (716 x 10-7 au) corresponded to a change
of 061 Aring in the 1-4 interaction between the amide proton and C13 or C9 Even the C8-C9
and C8-C13 aromatic bond lengths differed by 00037 Aring for =0 or 180deg but only by
00004 Aring for =80deg or 100deg with larger changes in the bonded hydrogen positions for
FA Hence the systematic consideration of all combinations of sets of parameters that
could be meaningfully fitted and the resulting coefficients only provided a qualitative
guide to which of the atomndashatom interactions dominated the intramolecular energy
(Chapter 5 Table 66) and were most critical
63 Results
151
Table 65 The rescale parameters for the repulsion ικ dispersion ικ and electronic contributions of
the physical exp-6 and cos2 model for all possible combinations of atom type interactions C∙∙∙C C∙∙∙H
C∙∙∙HB H∙∙∙H and H∙∙∙HB for FA Nk are the number of fitted rescale parameters ικ and ικ and the baseline
energy Ebase ικ ικ α Ebase σintra
kJ mol-1 Nk C-C C-H C-HB H-H H-HB C-C C-H C-HB H-H H-HB
4 - - - 1108 - - - - 5003 - -391 -5926 033
4 - 619 - - - - 2082 - - - -157 -18049 036 4 -797 - - - - -1508 - - - - -272 -10530 045
4 - - - - 3467 - - - - 13698 -530 -1246 057
4 - - 3630 - - - - 11038 - - -945 -33466 076
6 -366 461 - - - -1053 1477 - - - -080 -3768 010 6 -436 - - 610 - -764 - - 2966 - -114 -15833 012
6 -852 - -188 - - -1227 - -229 - - 055 -30621 017
6 -600 - - - 1135 -862 - - - 5415 -143 -23513 018 6 - -103 1476 - - - 574 4073 - - -220 -17385 023
6 - - - 1208 -182 - - - 6537 -2918 -208 -9576 024
6 - -255 - 619 - - 013 - 2048 - -216 -1513 025 6 - - 801 1074 - - - 1654 5800 - -339 -12383 026
6 - 028 - - 1109 - 783 - - 3479 -117 -7549 028
6 - - -1326 - 6519 - - -6960 - 32879 -539 24422 036
8 -275 351 - - 271 -935 1344 - - 412 -075 534 008
8 -236 414 - -157 - -1078 1876 - -1719 - -076 9374 009
8 -373 - - 626 334 -681 - - 3475 222 -066 -15208 009
8 -493 551 -189 - - -1218 1530 -642 - - -047 -6499 010 8 -530 - -737 725 - -1054 - -2417 3267 - -044 -3345 010
8 -698 - -1655 - 3047 -1263 - -6095 - 14774 012 5842 013
8 - -419 520 1195 - - -846 691 6039 - -246 -995 019 8 - - 1843 1185 -1677 - - 5881 7251 -11125 -196 -30353 019
8 - -089 2697 - -3196 - 952 9622 - -18054 -082 -40433 021
8 - -445 - 1541 -1016 - -970 - 7719 -6385 -166 -770 021
10 -445 686 -555 -541 - -1577 2664 -1489 -4179 - 017 13752 005 10 -524 469 -740 - 953 -1247 1257 -2481 - 3880 -022 -075 007
10 -320 465 - -026 593 -977 1532 - -349 1763 -064 -3403 008
10 -598 - -1429 455 1804 -1188 - -5112 1825 8695 -025 6986 009 10 - 166 2717 671 -2944 - 788 9384 4350 -17854 -113 -44769 014
12 -383 709 -155 -570 -447 -1498 2835 -035 -4260 -2903 018 9708 006
152
Table 66 The rescale parameters for the repulsion ικ dispersion ικ and electronic contributions of the physical exp-6 and cos2 model for all possible combinations of atom
type interactions C∙∙∙C C∙∙∙Cl C∙∙∙H C∙∙∙HB Cl∙∙∙H C∙∙∙N H∙∙∙H and H∙∙∙HB for TA Nk are the number of fitted rescale parameters and Ebase is the baseline energy ghThe parameters
used in Figure 69b and ifor testing transferability in Figure 610b and Figure 611 ικ ικ α Ebase σintra
kJ mol-1 Nk C-C C-Cl C-H C-HB Cl-H C-N H-H H-HB H-N C-C C-Cl C-H C-HB Cl-H C-N H-H H-HB H-N
4 - 1019 - - - - - - - - 593 - - - - - - - -135 8690 108
4 - - - - - 930 - - - - - - - - 2901 - - - -530 -24891 111
4 - - - - - - - - 1839 - - - - - - - - 5101 -293 -14115 149 4 - - - - - - - 861 - - - - - - - - 3884 - -254 2058 165
4 - - - 303 - - - - - - - - 1102 - - - - - -167 -1133 168
4 181 - - - - - - - - 095 - - - - - - - - -761 13228 193
6 - - - - - 2237 173 - - - - - - - 6517 1810 - - -135 -63604 049 6 - 484 - - - 1974 - - - - 4173 - - - 7186 - - - -848 -99438 067
6 - - 1560 - - - 1856 - - - - 817 - - - 11967 - - -1311 -8678 077
6 - - - - 967 2171 - - - - - - - 4431 6977 - - - -167 -89172 078 6 659 - - - - 4409 - - - 955 - - - - 12397 - - - -1602 -99338 102
6 - - - - - - 604 - 2288 - - - - - - 2012 - 7506 -674 -27619 120 g8 - 1933 - 567 - 2165 - - - - 7289 - 2207 - 6976 - - - -102 -114180 015
8 - - - - 1957 3068 - 498 - - - - - 8130 9634 - 2647 - -096 -133767 016 8 - 1618 - - - 2874 - 676 - - 6263 - - - 8952 - 3754 - -361 -119616 023
8 - 038 - - - 2451 133 - - - 1139 - - - 7574 1528 - - -320 -83684 028
8 - - 1015 801 - - 505 - - - - 083 437 - - 11123 - - -962 -4165 037 8 - - - - 634 2650 027 - - - - - - 2075 7927 1106 - - -313 -86212 041
8 - - - - - 2211 127 367 - - - - - - 6326 1898 1248 - -009 -62350 047
8 - - 156 - - 2356 105 - - - - 189 - - 6873 1561 - - -178 -67559 051 8 - - 1422 - - - 1194 1225 - - - 1118 - - - 8625 5331 - -621 -14314 063
8 - - 768 - - - 1497 - 1353 - - 221 - - - 8154 - 2730 -436 -9301 071 h10 - 1049 - - 2600 2731 - 679 - - 366 - - 9102 8140 - 3889 - -426 -112247 008
10 - - 135 - 853 2173 - 426 - - - 404 - 2724 6867 - 2476 - -193 -83710 009 10 - 853 - - - 2386 227 583 - - 3742 - - - 7431 1238 2941 - -222 -94694 010
10 - - - - 1465 2785 089 542 - - - - - 5788 8569 720 2568 - -107 -112106 011
10 - 1143 194 457 - 2086 - - - - 4833 341 1829 - 6762 - - - -096 -102646 016 10 050 - - - 1763 2692 - 496 - 085 - - - 7084 8615 - 2744 - -032 -123424 018 i10 - - 180 - - 2079 - 604 089 - - 627 - - 6176 - 3544 883 -051 -71971 026
10 - - 413 506 - 1334 018 - - - - 473 1146 - 4010 2532 - - -067 -48308 031 10 314 - 945 1122 - - 535 - - 531 - 110 1833 - - 10029 - - -966 -9528 032
10 - 1160 743 925 - - 365 - - - 2757 057 1532 - - 8017 - - -487 -17128 036
12 - - - 093 1321 2831 314 - 1519 - - - 569 4186 8238 941 - 3812 -414 -110966 007
12 - 709 - 253 1721 2653 - - 903 - 1198 - 1091 5530 7956 - - 1792 -350 -111102 008 12 - - 237 137 1032 2350 - - 700 - - 432 702 2719 7255 - - 1037 -351 -88568 008
12 - - 425 - 843 2274 065 656 - - - 588 - 2415 6938 1356 3101 - -440 -84012 008
12 - - 046 - - 2081 536 274 1391 - - 344 - - 5722 1360 2319 5007 -245 -78093 027
14 - - 384 214 886 2010 190 - 805 - - 456 690 2056 6136 1635 - 1462 -532 -76472 008 14 - - 249 012 954 2442 - 316 410 - - 457 214 2439 7563 - 1279 209 -360 -86183 009
63 Results
153
Figure 69 Comparison of the relative energies from ab initio calculations (solid black
lines) of FA (top) and TA (bottom) with selected physical models For FA the selected
Nk=6 intra=026 kJ mol-1 model has βC-HB =801 γC-HB =1654 βH-H =1074 γH-H =58 α=-
339 and Ebase=-12383 whilst the Nk =6 intra=028 kJ mol-1 model has β C-H =028 γ C-
H =783 β H-HB = 1109 γ H-HB =3479 α=-117 and Ebase=-7549 For TA parameters for
the selected Nk=8 (intra=015 kJ mol-1) and 10 (intra=008 kJ mol-1) are in ghTable 66
In contrast to FA TA (Table 66) gave a qualitatively accurate fit only when at least
three types of atomndashatom parameters were rescaled (Nk=8) including C∙∙∙N as shown in
Figure 69 The relaxed scans were sensitive to a large number of atomndashatom distances
so that the 5 change in did not necessarily give a smooth curve between the analytical
values This was because of the differences in the molecular relaxation and resulting
atomndashatom distances not the step size because Figure 510 of Chapter 5 showed that
smaller step size for FA produced a smooth but asymmetric ab initio energy-curve All
the fits with the physically correct parameters were unique solutions (section 262)
63 Results
154
Depending on which atomic types were being fitted there were some variations in the
parameters for a given atomndashatom interaction I noticed that for TA (Table 66) the C∙∙∙N
parameters consistently needed to be drastically rescaled reflecting the importance of the
methyl carbon (R1=CH3 Figure 61) in the conformational profile of TA Indeed TA
differed from FA in having many more intramolecular atomndashatom distances that changed
significantly within the range = 0 to 145 including some within the same aromatic ring
such as the methylndashchloro interactions (Table 61 or compare Table 56 with Table 57 in
Chapter 5) Day6 also observed that pyramidalizations of atoms (eg the nitrogen atom in
an amine group) significantly affect the intramolecular parameters
By following the procedure described in the methodology (section 622) I obtained a
variety of analytical models of the form of equation 67 that could reproduce the torsional
profiles of FA and TA with a high degree of accuracy despite the significant variation in
many atomndashatom distances during the relaxed torsional scans However the analytical
model had a maximum number of parameters for FA and TA (12 and 22 respectively)
with 5 (plus 1) atomic types C H N O HB (plus Cl) when considering atomic-
type∙∙∙atomic-type interaction that contributed significantly to energy changes with
conformation Fitting too many parameters led to models where some of the fitted
parameters had the wrong sign for their physical interpretation and some of these fits for
TA showed a linear dependence between the parameters (ie the fitted parameters were
not unique section 262) Nonetheless the ease with which this physically justified model
(equation 67) could reproduce the conformational dependence of FA and TA shows that
this approach to modelling the intramolecular energies of fenamates is promising
634 Transferability A further investigation of the physical reasonableness of the atomndashatom plus electronic
functional form (equation 67) is to test whether the models transfer to related molecules
The difference between the energy scans when the substituents are far from the varying
torsion angle for example the change of H to Cl atom ie from FA to ClFA or between
TA and MA (Figure 511) should not change the main steric interactions and should only
have a small effect on the electronic term (Figure 515e and f)
Transferring a set of parameters fitted to FA and adding Gavezzottirsquos Cl parameters
did indeed (Figure 610) give some of the asymmetry in the well depths seen for ClFA
and the higher central barrier as compared to FA (Figure 511) when the electronic term
was fitted Similarly a set of parameters fitted to TA could reproduce the lower barrier
at = 90 and higher barrier at = 0 in MA (Figure 610b) despite the fact that the
63 Results
155
conformational relaxation of the methylndashmethyl interaction was somewhat different from
that of the methyl-chloro geometry (Figure 513)
Figure 610 Comparison of the relative energies from ab initio calculations (solid black
lines) with models using transferred βικ and γικ parameters from FA and TA (dotted grey
plots) to ClFA (top) and MA (bottom) respectively The red curve has only had the
baseline adjusted whereas the blue curve had the parameter refitted to ClFA or MA
respectively The transferred FA parameters are those Nk=6 fit=028 kJ mol-1 in Figure
69 while those of TA Nk= 10 fit= =026 kJ mol-1 are shown in iTable 66
A more stringent test would be to apply the same TA parameters to FA and ClFA
which gave qualitatively correct results around the minima (Figure 611) and the steric
barriers at 0 and 180 However the barrier height around 90 would remain similar to
that in TA and this underestimation would be only partially corrected by refitting the
cos(2) term Given the limitations in the parameter optimization the qualitative
63 Results
156
accuracy is promising In particular the poorer transferability may be attributable to the
fact that the fitting of parameters for C and H interactions in TA was modelling both the
aromatic and methyl atoms and the methyl∙∙∙N interaction was critical in fitting the
parameters to the TA profile
Figure 611 Comparison of the relative energies from ab initio calculations (solid black
lines) with models using βικ and γικ parameters transferred from TA (dotted grey plots) to
(a) FA and (b) ClFA The red curve has only had the baseline adjusted whereas the blue
curve has the parameter refitted to FA or ClFA respectively The transferred TA
parameters are those of Nk= 10 fit= 026 kJ mol-1 as shown in iTable 66
64 Summary
157
64 Summary Neither the cosine terms nor the analytical models that rescaled overestimated repulsion
contributions were adequate for modelling the conformational profile of fenamates
However a physically justified modelmdashone that combined a cos2 term with an
intramolecular exp-6 atomndashatom term for all atom pairs separated by three or more bonds
(1-4 and above)mdashallowed for a very effective representation of the ab initio
conformational energies In this chapter I successfully fitted conformational profiles of
FA and TA to the cos2 plus exp-6 model This success suggests that the separation of
intramolecular and intermolecular forces is a promising new method for discovering force
fields that are more accurate which could in turn pave the way for modelling the
condensed phases of pharmaceutical-like organic molecules Considering a wide range of
molecules and bigger dataset could improve the transferability of this physical model
71 Position of CSP in the Context of this Thesis
158
Chapter 7 Conclusions and Future Work
ldquoIt is good to have an end to journey toward but it is the journey that matters in the
endrdquo
mdash Ernest Hemingway
71 Position of CSP in the Context of this Thesis The CSP results of Chapters 3 and 4 successfully validated the ability of
CrystalPredictor to generate crystal structures of flexible molecules In Chapter 3 I
successfully predicted the crystal structure of BT which has an unusual and unexpected
packing The success required the use of distributed multipoles and ab initio calculations
of intramolecular energy This success inspires hope that the use of multipolar
electrostatic models (as being implemented in the second-generation force fields such as
AMOEBA91) with careful evaluation of the accuracy of the intramolecular forces will
provide a route to greater reliability for computer-aided drug design with uncommon
ligands However the failure of a conventional point charge electrostatic model used in
the intermediate step has considerable implications for other studies that rely on
modelling the intermolecular interactions of 1-substituted 1H-tetrazoles
Chapter 4 successfully investigated the concept of polymorphophore via CSP studies
of FA and TA in an attempt to understand why polymorphism occurs I discovered that
the fenamate fragment did qualify as a polymorphophore in that the dimeric unit could
pack in a variety of ways with different torsion angles of the phenyl groups due to the
torsional flexibility of FA and TA Once the aromatic rings had interdigitated with their
nearest neighbours there was a large barrier to rearrangement to a very different packing
and the polymorphs were long-lived with the torsion angles varying slightly to optimize
the packing for a given structure as we saw for TA It was however the comparison
between the FA and TA crystal energy landscapes that showed that it was the substituents
that played the major role in determining the possible packing and relative energies and
hence the polymorphic behaviours of FA and TA These observations clearly
demonstrate the links among conformational flexibility polymorphism and
polymorphophore
The considerable similarity in large clusters of the known and hypothetical structures
of TA and the closeness of their energies suggested that crystal growth errors were very
likely More importantly though this finding guided my colleague in the discovery of a
new polymorph of TA (form VI) which was nucleated by solution evaporation after
72 Towards more accurate force-fields for pharmaceutical molecules
159
dissolving TA (form I) in ethanol and seeding it with mefenamic acid (form I) The major
component of this new form (form VI is disordered 65 and 35) was not among the
crystal structures on the final energy landscape despite generating the corresponding
hypothetical structure during an intermediate step (CrystalPredictor) Although this
observation emphasised the success of the CrystalPredictor algorithm it also showed the
need for larger numbers of crystal structures to go through CrystalOptimizer This need
for a larger dataset in the subsequent CrystalOptimizer step raises the question ldquoIs there
a clear cut-off in energy for flexible moleculesrdquo This question is even more relevant
when you consider that desolvated solvates can have much higher energy than organic
crystal structures247 In fact it might even be desirable to go even higher in energy due to
likely high conformation energy of the desolvated solvates The CrystalOptimizer
algorithm does allow the build-up of a database known as Local Approximate Models
(LAMs) but it would be preferable to be able to check many more structures If we could
better fit intramolecular energy which requires the bulk of the computing time to a force
field we would be able to compute the energies of many more structures of a target
molecule In addition computing the energies of the higher-energy structures would be
much cheaper
Chapters 3 and 4 used methods suitable for studying flexible molecules17 as the ab
initio charge density for the specific conformation was used in modelling the
intermolecular interactions thus representing the interplay between molecular
conformation and intermolecular interactions which have been shown to be important for
TA211 Conformational changes can optimise the directionality of strong interactions
such as H-bonding and increase the packing density and hence the stabilization of the
structure by dispersion forces Although CSP methodologies have advanced to aid solid
form screening in pharmaceutical development247-250 it is nevertheless desirable to
calculate the relative free energies of organic polymorphs via molecular dynamics
methods251-253 Although there has been a great push to include the kinetics and their
ability to control the polymorphs formed1 a vital first step is to develop a sound
understanding of thermodynamics
72 Towards more accurate force-fields for pharmaceutical molecules The challenge of extending the reliability and accuracy of quantum mechanical
methods to larger molecules which are more typical of pharmaceuticals and realistic
biological molecules in isolation or condensed phases is the subject of active research
This research ranges from empirical corrections to DFT methods to the use of better
73 Future Work
160
functionals254 as well as implementing explicitly correlated wavefunction methods more
effectively
Chapter 5 emphasized the challenges with using a sufficiently realistic method for the
ab initio determination of conformational energies for larger molecules For example the
HF method provides a qualitatively wrong and misleading conformational profile of FA
and TA due to the absence of the dispersion (correlation effect) contribution Dispersion
also plays an important role in the barrier to rotation for the fenamates especially when
the aromatic rings are perpendicular to one another The analysis of the fenamatesrsquo
torsional potential revealed that the origin of the torsional barrier of the fenamates is a
combination of intrinsic intramolecular dispersion electronic contribution and the steric
repulsion In addition small changes to other conformational angles made significant
contributions to the torsional profile of the fenamate molecules
In Chapter 6 a physically motivated analytical modelndashndashcos2 term combined with an
intramolecular exp-6 atomndashatom term for all atom pairs separated by three or more
bondsndashndashwas derived using knowledge gained from Chapter 5 This model accurately fits
the intramolecular energy profiles of FA and TA This approach of modelling the
conformational energies of the fenamates could be extended to pharmaceutical-like
flexible organics
73 Future Work One can envisage a general scheme for determining the physically motivated potentials
(Chapter 6) for a given molecule following a CSP study by an approach that is being
developed127 and applied to pharmaceutical molecules247-249255 The refinement of the
molecular conformations simultaneously with the crystallographic cell using
CrystalOptimizer72 involves the calculation and storage of a large database (LAMs) of ab
initio conformational energies and forces for the molecule For example the CSP studies
for FA and TA contain the results of hundreds of molecular wavefunction calculations
with varying torsion and bond angles
The database generated in a CSP study will cover most of the range of conformations
that are likely to be sampled in a Molecular Dynamics study of the molecules in
condensed phases with a strong bias towards the conformations that occur in low-energy
crystal structures both observed and potential polymorphs1 The LAMs database could
be used to improve the parameterization of the analytical conformational energy model
adapting the potential fitting routines (Appendix A) used in Chapter 6 An advantage of
using an analytical functional form rather than the LAMs to interpolate between the ab
73 Future Work
161
initio points in the CSP study is that the extrapolation to other conformations will be more
realistic The great benefit of this scheme of building up from a CSP study for a specific
molecule is that the model intramolecular force field could be validated by ensuring that
the model reproduces the crystal energy landscape ie the energies of different packing
H-bonding and stacking modes are correctly balanced with the accompanying
conformational changes
The application of separate analytical potentials for both intra- and intermolecular terms
will require adaptation of molecular modelling codes However the coding for the
energies forces and second derivatives of the proposed intramolecular force field
(equation 67) is already present in most codes After inserting the new parameters the
major adaptation that will be required for an existing codendashndashone that uses traditional force
fields such as DL_POLY251256 for Molecular Dynamics simulationsndashndashis separating out
the calculation of inter- and intramolecular terms Accurate intramolecular forces are
most needed in combination with the accurate anisotropic atom-atom intermolecular
potentials for organic molecules where the electrostatic term is represented by atomic
multipoles for example the static organic crystal structure modelling code
DMACRYS34 or the rigid molecule molecular dynamics code DL_MULTI257
Furthermore the adaptation of molecular modelling code would require an adequate
representation for the conformation dependence of the distributed multipoles for specific
molecules but the dependency could be represented by an analytical model258
Although this change in approach to pharmaceutical force fields involves envisaging a
specific model fitted for each molecule the physical basis of the current model and the
results from Chapter 6 suggest that a reasonably transferable set of atom-atom
intramolecular exp-6 potentials could be fitted for families of molecules Deriving a
transferable model would require a very large dataset of ab initio conformational profiles
of many molecules calculated at an appropriate accuracy The transferability of the
electronic term ( coefficients) would need investigating However the use of separate
atom-atom models for the forces within and between molecules appears to provide a
significant improvement in the realism of current force fields In conclusion this
approach could potentially provide an affordable route for Molecular Dynamics
simulations of flexible pharmaceuticals that have the accuracy of CSP
Appendix A
162
Appendix A Contents of enclosed CD-ROM
The CD-ROM attached to this thesis contains FORTRAN source codes of the analytical
models presented in Chapter 6 as well as some of the input files The input data for FA
TA MFA and ClFA that were used in conjunction with the source codes are in directory
A1 The inputs files included for each molecule are as follows
a) The summaryr contains a summary of the flexible degree of freedom ξ and
the intramolecular energy relative to the most stable conformation ΔEintra
b) The geometries of all the optimised conformation in mol2 file format
The source codes and example input files are in directories A2 (cosine model) A3
(rescaled repulsion model) and A4 (physical model) The A2 directory contains
a) an executable file (cos_modelexe)
b) FORTRAN source code (cos_modelf90)
c) input (summaryr) file
d) output (dominantr) file
The A3 and A4 directories contain
a) an executable file (exe)
b) FORTRAN source code (f90)
c) output (dominantr) file
d) an input subdirectory that contains
i Gavezzottirsquos exp-6 atom-atom parameters from Table 52
ii h03adfe subroutine computes the nearest neighbour of two atoms and
iii summaryr file
The A5 directory contains a utility file (extract_mol2sh) that extracts the input data
(summaryr and all the optimised conformations in mol2) from the GAUSSIAN0353
(log) file
Bibliography
163
Bibliography
1 Price S L Why dont we find more polymorphs Acta Crystallogr Sect B
2013 69 313-328
2 Price S L Predicting crystal structures of organic compounds Chem Soc Rev
2014 43 (7) 2098-2111
3 Svaumlrd M Structural Kinetic and Thermodynamic Aspects of the Crystal
Polymorphism of Substituted Monocyclic Aromatic Compounds 2011
4 Svaumlrd M Nordstroumlm F L Jasnobulka T Rasmuson Aring C Thermodynamics
and Nucleation Kinetics of m-Aminobenzoic Acid Polymorphs Cryst Growth
Des 2009 10 (1) 195-204
5 Chemburkar S R Bauer J Deming K Spiwek H Patel K Morris J
Henry R Spanton S Dziki W Porter W Quick J Bauer P Donaubauer
J Narayanan B A Soldani M Riley D McFarland K Dealing with the
impact of ritonavir polymorphs on the late stages of bulk drug process
development Org Process Res Dev 2000 4 (5) 413-417
6 Day G M Current approaches to predicting molecular organic crystal structures
Crystallography Reviews 2011 17 (1) 3-52
7 Byrn S R Pfeiffer R Ganey M Hoiberg C Poochikian G Pharmaceutical
Solids - A Strategic Approach to Regulatory Considerations Pharmaceut Res
1995 12 (7) 945-954
8 Price S L Lattice energy nailed Science 2014 345 (6197) 619-620
9 Newman A Specialized Solid Form Screening Techniques Org Process Res
Dev 2013 17 (3) 457-471
10 Day G M Cooper T G Cruz-Cabeza A J Hejczyk K E Ammon H L
Boerrigter S X M Tan J Della Valle R G Venuti E Jose J Gadre S R
Desiraju G R Thakur T S van Eijck B P Facelli J C Bazterra V E
Ferraro M B Hofmann D W M Neumann M Leusen F J J Kendrick J
Price S L Misquitta A J Karamertzanis P G Welch G W A Scheraga
H A Arnautova Y A Schmidt M U van de Streek J Wolf A Schweizer
B Significant progress in predicting the crystal structures of small organic
molecules - a report on the fourth blind test Acta Crystallogr Sect B 2009 65
(2) 107-125
11 Bardwell D A Adjiman C S Arnautova Y A Bartashevich E Boerrigter
S X Braun D E Cruz-Cabeza A J Day G M la Valle R G Desiraju G
R van Eijck B P Facelli J C Ferraro M B Grillo D Habgood M
Hofmann D W Hofmann F Jose K V Karamertzanis P G Kazantsev A
V Kendrick J Kuleshova L N Leusen F J Maleev A V Misquitta A J
Mohamed S Needs R J Neumann M A Nikylov D Orendt A M Pal R
Pantelides C C Pickard C J Price L S Price S L Scheraga H A van de
Bibliography
164
Streek J Thakur T S Tiwari S Venuti E Zhitkov I K Towards crystal
structure prediction of complex organic compounds - a report on the fifth blind
test Acta Crystallogr Sect B 2011 67 (6) 535-551
12 Price S L Developing Methods of Crystal Structure and Polymorph Prediction
Implications of Molecular and Materials Structures for New Technologies 1999
315-320
13 Neumann M A Tailor-made force fields for crystal-structure prediction J Phys
Chem B 2008 112 (32) 9810-9829
14 Price S L Computed crystal energy landscapes for understanding and predicting
organic crystal structures and polymorphism Accounts Chem Res 2009 42 (1)
117-126
15 Groom C R Reilly A M Sixth blind test of organic crystal-structure prediction
methods Acta Crystallogr Sect B 2014 70 (4) 776-777
16 Beyer T Lewis T Price S L Which organic crystal structures are predictable
by lattice energy minimisation CrystEngComm 2001 3 (44) 178-212
17 Kazantsev A V Karamertzanis P G Adjiman C S Pantelides C C Price
S L Galek P T Day G M Cruz-Cabeza A J Successful prediction of a
model pharmaceutical in the fifth blind test of crystal structure prediction Int J
Pharm 2011 418 (2) 168-178
18 Lopez-Mejias V Kampf J W Matzger A J Nonamorphism in Flufenamic
Acid and a New Record for a Polymorphic Compound with Solved Structures J
Am Chem Soc 2012 134 (24) 9872-9875
19 Lopez-Mejias V Kampf J W Matzger A J Polymer-Induced
Heteronucleation of Tolfenamic Acid Structural Investigation of a Pentamorph
J Am Chem Soc 2009 131 (13) 4554-4555
20 Yu L Polymorphism in Molecular Solids An Extraordinary System of Red
Orange and Yellow Crystals Accounts Chem Res 2010 43 (9) 1257-1266
21 Chen S A Xi H M Yu L Cross-nucleation between ROY polymorphs J
Am Chem Soc 2005 127 (49) 17439-17444
22 Murthy H K Bhat T N Vijayan M Structural studies of analgesics and their
interactions 9 Structure of a new crystal form of 2-([3-(trifluoromethyl) phenyl]
amino) benzoic acid (flufenamic acid) Acta Crystallogr Sect B 1982 38 (JAN)
315-317
23 Lutker K M Tolstyka Z P Matzger A J Investigation of a privileged
polymorphic motif A dimeric ROY derivative Cryst Growth Des 2008 8 (1)
136-139
24 Price S L Price L S Modelling Intermolecular Forces for Organic Crystal
Structure Prediction In Intermolecular Forces and Clusters I Wales D J Ed
Springer-Verlag Berlin Heidelberg Germany 2005 pp 81-123
Bibliography
165
25 Bernstein J Polymorphism in Molecular Crystals Clarendon Press Oxford
2002
26 Stone A J The Theory of Intermolecular Forces 2 ed Oxford University Press
Oxford 2013
27 Buckingham A D Utting B D Intermolecular Forces Annu Rev Phys Chem
1970 21 (1) 287-316
28 Maitland G C Rigby M Smith E B Wakeham W A Intermolecular
Forces Their Origin and Determination Clarendon Press Oxford 1981
29 Israelachvili J Intermolecular and Surface Forces Third Edition Academic
Press 2010
30 London F The general theory of molecular forces Trans Faraday Soc 1937
33 8b-26
31 Spencer N D Moore J H Encyclopedia of Chemical Physics and Physical
Chemistry Fundamentals 1 ed Taylor amp Francis 2001pp 1004
32 Welch G W A Karamertzanis P G Misquitta A J Stone A J Price S L
Is the induction energy important for modeling organic crystals J Chem Theory
Comput 2008 4 (3) 522-532
33 Price S L From crystal structure prediction to polymorph prediction interpreting
the crystal energy landscape Phys Chem Chem Phys 2008 10 (15) 1996-2009
34 Price S L Leslie M Welch G W A Habgood M Price L S
Karamertzanis P G Day G M Modelling Organic Crystal Structures using
Distributed Multipole and Polarizability-Based Model Intermolecular Potentials
Phys Chem Chem Phys 2010 12 (30) 8478-8490
35 Freitag M A Gordon M S Jensen J H Stevens W J Evaluation of charge
penetration between distributed multipolar expansions J Chem Phys 2000 112
(17) 7300-7306
36 Lund A M Orendt A M Pagola G I Ferraro M B Facelli J C
Optimization of Crystal Structures of Archetypical Pharmaceutical Compounds
A Plane-Wave DFT-D Study Using Quantum Espresso Crystal Growth amp Design
2013 13 (5) 2181-2189
37 Neumann M A Perrin M A Energy ranking of molecular crystals using
density functional theory calculations and an empirical van der Waals correction
J Phys Chem B 2005 109 (32) 15531-15541
38 Cox S R Hsu L Y Williams D E Nonbonded Potential Function Models for
Crystalline Oxohydrocarbons Acta Crystallogr Sect A 1981 37 (MAY) 293-
301
Bibliography
166
39 Williams D E Cox S R Nonbonded Potentials For Azahydrocarbons the
Importance of the Coulombic Interaction Acta Crystallogr Sect B 1984 40 (8)
404-417
40 Coombes D S Price S L Willock D J Leslie M Role of Electrostatic
Interactions in Determining the Crystal Structures of Polar Organic Molecules A
Distributed Multipole Study J Phys Chem 1996 100 (18) 7352-7360
41 Gavezzotti A Theoretical Aspects and Computer Modeling of the Molecular
Solid State John Wiley Chichester 1997 Vol 1
42 Filippini G Gavezzotti A Empirical Intermolecular Potentials For Organic-
Crystals the 6-Exp Approximation Revisited Acta Crystallogr Sect B 1993
B49 868-880
43 Williams D E Weller R R Lone-Pair Electronic Effects On the Calculated
Abinitio Scf-Mo Electric-Potential and the Crystal-Structures of Azabenzenes J
Am Chem Soc 1983 105 (13) 4143-4148
44 Karamertzanis P G Pantelides C C Optimal site charge models for molecular
electrostatic potentials Mol Simulat 2004 30 (7) 413-436
45 Spackman M A Molecular Electric Moments from X-ray Diffraction Data
Chem Rev 1992 92 1769-1797
46 Breneman C M Wiberg K B Determining Atom-Centered Monopoles From
Molecular Electrostatic Potentials - the Need For High Sampling Density in
Formamide Conformational-Analysis J Comput Chem 1990 11 (3) 361-373
47 Francl M M Carey C Chirlian L E Gange D M Charges fit to electrostatic
potentials II Can atomic charges be unambiguously fit to electrostatic potentials
J Comput Chem 1996 17 (3) 367-383
48 Stone A J Alderton M Distributed Multipole Analysis - Methods and
Applications Molecular Physics 1985 56 (5) 1047-1064
49 Welch G W A The induction contribution to the lattice energy of organic
crystals PhD 2010
50 Stone A J Distributed Multipole Analysis or How to Describe a Molecular
Charge Distribution Chemical Physics Letters 1981 83 (2) 233-239
51 Stone A J Distributed multipole analysis Stability for large basis sets J Chem
Theory Comput 2005 1 (6) 1128-1132
52 GDMA A Program for Performing Distributed Multipole Analysis of Wave
Functions Calculated Using the Gaussian Program System version 22
University of Cambridge Cambridge United Kingdom 2010
53 Gaussian 03 Gaussian Inc Wallingford CT 2004
Bibliography
167
54 GDMA A Program for Performing Distributed Multipole Analysis of Wave
Functions Calculated Using the Gaussian Program System version 10
University of Cambridge Cambridge United Kingdom 1999
55 Price S L Computational prediction of organic crystal structures and
polymorphism Int Rev Phys Chem 2008 27 (3) 541-568
56 Kazantsev A V Molecular Flexibility in Crystal Structure Prediction PhD
Imperial College London 2011
57 Smith W Point multipoles in the Ewald summation CCP5 Quarterly 1982 4
13-25
58 Cruz-Cabeza A J Bernstein J Conformational Polymorphism Chem Rev
2014 114 (4) 2170-2191
59 Cornell W D Cieplak P Bayly C I Gould I R Merz K M Ferguson D
M Spellmeyer D C Fox T Caldwell J W Kollman P A A Second
Generation Force-Field For the Simulation of Proteins Nucleic-Acids and
Organic-Molecules (Vol 117 Pg 5179 1995) J Am Chem Soc 1996 118 (9)
2309
60 van Mourik T Karamertzanis P G Price S L Molecular conformations and
relative stabilities can be as demanding of the electronic structure method as
intermolecular calculations J Phys Chem A 2006 110 (1) 8-12
61 van Mourik T Assessment of Density Functionals for Intramolecular Dispersion-
Rich Interactions J Chem Theory Comput 2008 4 (10) 1610-1619
62 Comba P Hambley T W Martin B Molecular modeling of inorganic
compounds John Wiley amp Sons 2009
63 Leach A R Molecular Modelling Principles and Applications Longman
Harlow 1996
64 Goodman J M Chemical Applications of Molecular Modelling Royal Society
of Chemistry Cambridge UK 1998
65 Brodersen S Wilke S Leusen F J J Engel G A study of different
approaches to the electrostatic interaction in force field methods for organic
crystals Phys Chem Chem Phys 2003 5 (21) 4923-4931
66 Lommerse J P M Motherwell W D S Ammon H L Dunitz J D
Gavezzotti A Hofmann D W M Leusen F J J Mooij W T M Price S
L Schweizer B Schmidt M U van Eijck B P Verwer P Williams D E
A test of crystal structure prediction of small organic molecules Acta Crystallogr
Sect B 2000 56 697-714
67 Motherwell W D S Ammon H L Dunitz J D Dzyabchenko A Erk P
Gavezzotti A Hofmann D W M Leusen F J J Lommerse J P M Mooij
W T M Price S L Scheraga H Schweizer B Schmidt M U van Eijck
Bibliography
168
B P Verwer P Williams D E Crystal structure prediction of small organic
molecules a second blind test Acta Crystallogr Sect B 2002 58 647-661
68 Ponder J W Case D A Force fields for protein simulations Protein
Simulations 2003 66 27-86
69 Cornell W D Howard A E Kollman P Molecular mechanical potential
functions and their application to study molecular systems Current Opinion in
Structural Biology 1991 201-212 Curr Opin Struc Biol 1991 1 (2) 201-212
70 Comba P Hambley T W Martin B Molecular modeling of inorganic
compounds 2009 3rd completely rev and enlarged ed
71 Kazantsev A V Karamertzanis P G Adjiman C S Pantelides C C
CrystalOptimizer An efficient Algorithm for Lattice Energy Minimisation of
Organic Crystal using Isolated-Molecule Quantum Mechanical Calculations In
Molecular System Engineering Adjiman C S Galindo A Eds WILEY-VCH
Verlag GmbH amp Co Weinheim 2010 Vol 6 pp 1-42
72 Kazantsev A V Karamertzanis P G Adjiman C S Pantelides C C
Efficient Handling of Molecular Flexibility in Lattice Energy Minimization of
Organic Crystals J Chem Theory Comput 2011 7 (6) 1998-2016
73 Jones J E On the Determination of Molecular Fields II From the Equation of
State of a Gas Proceedings of the Royal Society of London Series A 1924 106
(738) 463-477
74 Weiner S J Kollman P A Case D A Singh U C Ghio C Alagona G
Profeta S Weiner P A New Force-Field for Molecular Mechanical Simulation
of Nucleic-Acids and Proteins J Am Chem Soc 1984 106 (3) 765-784
75 Momany F A McGuire R F Burgess A W Scheraga H A Energy
parameters in polypeptides VII Geometric parameters partial atomic charges
nonbonded interactions hydrogen bond interactions and intrinsic torsional
potentials for the naturally occurring amino acids J Phys Chem 1975 79 (22)
2361-2381
76 Nemethy G Pottle M S Scheraga H A Energy parameters in polypeptides
9 Updating of geometrical parameters nonbonded interactions and hydrogen
bond interactions for the naturally occurring amino acids J Phys Chem 1983
87 (11) 1883-1887
77 Hagler A T Lifson S Energy functions for peptides and proteins II Amide
hydrogen bond and calculation of amide crystal properties J Am Chem Soc
1974 96 (17) 5327-5335
78 Hagler A T Huler E Lifson S Energy functions for peptides and proteins I
Derivation of a consistent force field including the hydrogen bond from amide
crystals J Am Chem Soc 1974 96 (17) 5319-5327
Bibliography
169
79 Jorgensen W L Quantum and statistical mechanical studies of liquids 10
Transferable intermolecular potential functions for water alcohols and ethers
Application to liquid water J Am Chem Soc 1981 103 (2) 335-340
80 Wang J M Wolf R M Caldwell J W Kollman P A Case D A
Development and testing of a general amber force field J Comput Chem 2004
25 (9) 1157-1174
81 Brooks B R Bruccoleri R E Olafson B D States D J Swaminathan S
Karplus M CHARMM A Program for Macromolecular Energy Minimization
and Dynamics Calculations J Comput Chem 1983 4 (2) 187-217
82 Becker O M Computational biochemistry and biophysics M Dekker New
York 2001
83 MacKerell A D Bashford D Bellott Dunbrack R L Evanseck J D Field
M J Fischer S Gao J Guo H Ha S Joseph-McCarthy D Kuchnir L
Kuczera K Lau F T K Mattos C Michnick S Ngo T Nguyen D T
Prodhom B Reiher W E Roux B Schlenkrich M Smith J C Stote R
Straub J Watanabe M Wiorkiewicz-Kuczera J Yin D Karplus M All-
Atom Empirical Potential for Molecular Modeling and Dynamics Studies of
Proteins J Phys Chem B 1998 102 (18) 3586-3616
84 Vanommeslaeghe K Hatcher E Acharya C Kundu S Zhong S Shim J
Darian E Guvench O Lopes P Vorobyov I Mackerell A D CHARMM
general force field A force field for drug-like molecules compatible with the
CHARMM all-atom additive biological force fields J Comput Chem 2010 31
(4) 671-690
85 Jorgensen W L Tirado-Rives J Potential energy functions for atomic-level
simulations of water and organic and biomolecular systems P Natl Acad Sci
USA 2005 102 (19) 6665-6670
86 Allinger N L Chen K Lii J H An improved force field (MM4) for saturated
hydrocarbons J Comput Chem 1996 17 (5-6) 642-668
87 Halgren T A Merck molecular force field 1 Basis form scope
parameterization and performance of MMFF94 J Comput Chem 1996 17 (5-
6) 490-519
88 Allinger N L Conformational analysis 130 MM2 A hydrocarbon force field
utilizing V1 and V2 torsional terms J Am Chem Soc 1977 99 (25) 8127-8134
89 Caleman C van Maaren P J Hong M Hub J S Costa L T van der Spoel
D Force Field Benchmark of Organic Liquids Density Enthalpy of
Vaporization Heat Capacities Surface Tension Isothermal Compressibility
Volumetric Expansion Coefficient and Dielectric Constant J Chem Theory
Comput 2011 8 (1) 61-74
90 Stouch T R The errors of our ways taking account of error in computer-aided
drug design to build confidence intervals for our next 25 years J Comput -Aided
Mol Des 2012 26 (1) 125-134
Bibliography
170
91 Ponder J W Wu C J Ren P Y Pande V S Chodera J D Schnieders M
J Haque I Mobley D L Lambrecht D S DiStasio R A Head-Gordon
M Clark G N I Johnson M E Head-Gordon T Current Status of the
AMOEBA Polarizable Force Field J Phys Chem B 2010 114 (8) 2549-2564
92 Day G M Motherwell W D S Jones W Beyond the isotropic atom model in
crystal structure prediction of rigid molecules Atomic multipoles versus point
charges Cryst Growth Des 2005 5 (3) 1023-1033
93 Marshall G R Limiting assumptions in molecular modeling electrostatics J
Comput -Aided Mol Des 2013 27 (2) 107-114
94 Payne R S Rowe R C Roberts R J Charlton M H Docherty R Potential
polymorphs of aspirin J Comput Chem 1999 20 (2) 262-273
95 Gourlay M D Kendrick J Leusen F J J Rationalization of racemate
resolution Predicting spontaneous resolution through crystal structure prediction
Cryst Growth Des 2007 7 (1) 56-63
96 Uzoh O G Analytically Modelling Intramolecular Energies of Fenamic and
Tolfenamic Acids Unpublished Work 2013
97 NAG Fortran Library Routine Document G02DDF Oxford United Kingdom
1989
98 Beran G J Hirata S Fragment and localized orbital methods in electronic
structure theory Physical Chemistry Chemical Physics 2012 14 (21) 7559-7561
99 Orio M Pantazis D A Neese F Density functional theory Photosynthesis
Research 2009 102 (2-3) 443-453
100 Sherrill C D An introduction to Hartree-Fock molecular orbital theory School
of Chemistry and Biochemistry Georgia Institute of Technology 2000
101 Shaik S S Hiberty P C A chemists guide to valence bond theory John Wiley
amp Sons 2007
102 Wu W Su P F Shaik S Hiberty P C Classical Valence Bond Approach by
Modern Methods Chem Rev 2011 111 (11) 7557-7593
103 Gasteiger J Engel T Chemoinformatics a textbook John Wiley amp Sons 2006
104 Fukui K Yonezawa T Shingu H A Molecular Orbital Theory of Reactivity in
Aromatic Hydrocarbons J Chem Phys 1952 20 (4) 722-725
105 Bell S Dines T J Chowdhry B Z Withnall R Computational chemistry
using modern electronic structure methods J Chem Educ 2007 84 (8) 1364-
1370
106 Moller C Plesset M S Note on an approximation treatment for many-electron
systems Phys Rev 1934 46 618-622
Bibliography
171
107 Valdes H Klusak V Pitonak M Exner O Stary I Hobza P Rulisek L
Evaluation of the intramolecular basis set superposition error in the calculations
of larger molecules [n]Helicenes and Phe-Gly-Phe tripeptide J Comput Chem
2008 29 (6) 861-870
108 Simon S Duran M Dannenberg J J How does basis set superposition error
change the potential surfaces for hydrogen bonded dimers Journal of Chemical
Physics 1996 105 (24) 11024-11031
109 Szczesniak M M Scheiner S Correction of the Basis Set Superposition Error
in SCF and MP2 Interaction Energies - the Water Dimer J Chem Phys 1986 84
(11) 6328-6335
110 Stephens P J Devlin F J Chabalowski C F Frisch M J Ab-Initio
Calculation of Vibrational Absorption and Circular-Dichroism Spectra Using
Density-Functional Force-Fields J Phys Chem 1994 98 (45) 11623-11627
111 Car R Introduction to density-functional theory and ab-initio molecular
dynamics Quant Struct -Act Rel 2002 21 (2) 97-104
112 Grimme S Antony J Schwabe T Muck-Lichtenfeld C Density functional
theory with dispersion corrections for supramolecular structures aggregates and
complexes of (bio)organic molecules Organic amp Biomolecular Chemistry 2007
5 (5) 741-758
113 Kohn W Becke A D Parr R G Density functional theory of electronic
structure J Phys Chem 1996 100 (31) 12974-12980
114 Hohenberg P Kohn W Inhomogeneous Electron Gas Physical Review B 1964
136 (3B) B864-B871
115 Kohn W Sham L J Self-consistent equations including exchange and
correlation effects Phys Rev 1965 140 (4A) A1133
116 Becke A D Density-Functional Thermochemistry 3 the Role of Exact
Exchange J Chem Phys 1993 98 (7) 5648-5652
117 Lee C T Yang W T Parr R G Development of the Colle-Salvetti
Correlation-Energy Formula Into A Functional of the Electron-Density Phys
Rev B 1988 37 (2) 785-789
118 Adamo C Barone V Toward reliable density functional methods without
adjustable parameters The PBE0 model J Chem Phys 1999 110 (13) 6158-
6170
119 Sherrill C D Introduction to Electron Correlation School of Chemistry and
Biochemistry Georgia Institute of Technology 2008
120 Grafenstein J Cremer D An efficient algorithm for the density-functional
theory treatment of dispersion interactions J Chem Phys 2009 130 (12)
Bibliography
172
121 Grimme S Density functional theory with London dispersion corrections Wiley
Interdisciplinary Reviews-Computational Molecular Science 2011 1 (2) 211-
228
122 Grimme S Antony J Ehrlich S Krieg H A consistent and accurate ab initio
parametrization of density functional dispersion correction (DFT-D) for the 94
elements H-Pu J Chem Phys 2010 132 (15) 154104
123 Brown T L Chemistry The Central Science Pearson Education 2009
124 Gavezzotti A Filippini G Polymorphic Forms of Organic-Crystals at Room
Conditions - Thermodynamic and Structural Implications J Am Chem Soc
1995 117 (49) 12299-12305
125 Karamertzanis P G Prediction of crystal structure of molecular solids PhD
Imperial College London 2004
126 Karamertzanis P G Pantelides C C Ab initio crystal structure prediction II
Flexible molecules Mol Phys 2007 105 (2-3) 273-291
127 Vasileiadis M Kazantsev A V Karamertzanis P G Adjiman C S
Pantelides C C The polymorphs of ROY application of a systematic crystal
structure prediction technique Acta Crystallogr Sect B 2012 68 (6) 677-685
128 Sobol I M On the distribution of points in a cube and the approximate evaluation
of integrals USSR Comp Math Math Phys 1967 7 86-112
129 The NAG Fortran Library Oxford United Kingdom 2013
130 Karamertzanis P G Price S L Energy Minimization of Crystal Structures
Containing Flexible Molecules J Chem Theory Comput 2006 2 (4) 1184-1199
131 Cooper T G Hejczyk K E Jones W Day G M Molecular Polarization
Effects on the Relative Energies of the Real and Putative Crystal Structures of
Valine J Chem Theory Comput 2008 4 (10) 1795-1805
132 Mennucci B Tomasi J Continuum solvation models A new approach to the
problem of solutes charge distribution and cavity boundaries J Chem Phys
1997 106 (12) 5151-5158
133 Habgood M Price S L Portalone G Irrera S Testing a Variety of Electronic-
Structure-Based Methods for the Relative Energies of 5-Formyluracil Crystals J
Chem Theory Comput 2011 7 (9) 2685-2688
134 Karamertzanis P G Pantelides C C Ab initio crystal structure prediction - I
Rigid molecules Journal of Computational Chemistry 2005 26 (3) 304-324
135 Williams D E Improved intermolecular force field for molecules containing H
C N and O atoms with application to nucleoside and peptide crystals J Comput
Chem 2001 22 (11) 1154-1166
Bibliography
173
136 Day G M Motherwell W D S Jones W A strategy for predicting the crystal
structures of flexible molecules the polymorphism of phenobarbital Physical
Chemistry Chemical Physics 2007 9 (14) 1693-1704
137 Kendrick J Leusen F J Neumann M A van de Streek J Progress in Crystal
Structure Prediction Chemistry - A European Journal 2011 17 (38) 10735-
10743
138 Braun D E Karamertzanis P G Price S L Which if any hydrates will
crystallise Predicting hydrate formation of two dihydroxybenzoic acids Chem
Commun 2011 47 (19) 5443-5445
139 Cruz-Cabeza A J Karki S Fabian L Friscic T Day G M Jones W
Predicting stoichiometry and structure of solvates Chem Commun 2010 46 (13)
2224-2226
140 Karamertzanis P G Kazantsev A V Issa N Welch G W A Adjiman C
S Pantelides C C Price S L Can the Formation of Pharmaceutical Co-
Crystals Be Computationally Predicted II Crystal Structure Prediction J Chem
Theory Comput 2009 5 (5) 1432-1448
141 Issa N Barnett S A Mohamed S Braun D E Copley R C B Tocher D
A Price S L Screening for cocrystals of succinic acid and 4-aminobenzoic acid
CrystEngComm 2012 14 (7) 2454-2464
142 Cruz-Cabeza A J Day G M Jones W Structure prediction disorder and
dynamics in a DMSO solvate of carbamazepine Phys Chem Chem Phys 2011
13 (28) 12808-12816
143 Habgood M Form II Caffeine A Case Study for Confirming and Predicting
Disorder in Organic Crystals Cryst Growth Des 2011 11 (8) 3600-3608
144 Torrisi A Leech C K Shankland K David W I F Ibberson R M Benet-
Buchholz J Boese R Leslie M Catlow C R A Price S L The solid phases
of cyclopentane a combined experimental and simulation study J Phys Chem
B 2008 112 (12) 3746-3758
145 Braun D E Karamertzanis P G Arlin J B Florence A J Kahlenberg V
Tocher D A Griesser U J Price S L Solid-State Forms of beta-Resorcylic
Acid How Exhaustive Should a Polymorph Screen Be Cryst Growth Des 2011
11 (1) 210-220
146 Llinas A Goodman J M Polymorph Control past present and future Drug
Discover Today 2008 13 (56) 198-210
147 Arlin J B Price L S Price S L Florence A J A strategy for producing
predicted polymorphs catemeric carbamazepine form V Chem Commun 2011
47 (25) 7074-7076
148 Maddox J Crystals from first Principles Nature 1988 335 (6187) 201
Bibliography
174
149 Day G M Motherwell W D S Ammon H L Boerrigter S X M Della
Valle R G Venuti E Dzyabchenko A Dunitz J D Schweizer B van Eijck
B P Erk P Facelli J C Bazterra V E Ferraro M B Hofmann D W M
Leusen F J J Liang C Pantelides C C Karamertzanis P G Price S L
Lewis T C Nowell H Torrisi A Scheraga H A Arnautova Y A Schmidt
M U Verwer P A third blind test of crystal structure prediction Acta
Crystallogr Sect B 2005 61 (5) 511-527
150 Collins A Wilson C C Gilmore C J Comparing entire crystal structures
using cluster analysis and fingerprint plots CrystEngComm 2010 12 (3) 801-
809
151 Chisholm J A Motherwell S COMPACK a program for identifying crystal
structure similarity using distances J Appl Crystallogr 2005 38 228-231
152 Asmadi A Kendrick J Leusen F J J Crystal Structure Prediction and
Isostructurality of Three Small Molecules Chem Eur J 2010 16 (42) 12701-
12709
153 Macrae C F Bruno I J Chisholm J A Edgington P R McCabe P
Pidcock E Rodriguez-Monge L Taylor R van de Streek J Wood P A
Mercury CSD 20 - new features for the visualization and investigation of crystal
structures J Appl Crystallogr 2008 41 466-470
154 Chisholm J A Motherwell S A new algorithm for performing three-
dimensional searches of the Cambridge Structural Database J Appl Crystallogr
2004 37 331-334
155 Gelbrich T Hursthouse M B Systematic investigation of the relationships
between 25 crystal structures containing the carbamazepine molecule or a close
analogue a case study of the XPac method CrystEngComm 2006 8 (6) 448-460
156 Gelbrich T Hursthouse M B A versatile procedure for the identification
description and quantification of structural similarity in molecular crystals
CrystEngComm 2005 7 324-336
157 McKinnon J J Spackman M A Mitchell A S Novel tools for visualizing and
exploring intermolecular interactions in molecular crystals Acta Crystallogr
Sect B 2004 60 627-668
158 Spackman M A McKinnon J J Fingerprinting intermolecular interactions in
molecular crystals CrystEngComm 2002 378-392
159 Parkin A Barr G Dong W Gilmore C G Jayatilaka D McKinnon J J
Spackman M A Wilson C C Comparing entire crystal structures structural
genetic fingerprinting CrystEngComm 2007 9 648-652
160 McKinnon J J Mitchell A S Spackman M A Hirshfeld surfaces A new tool
for visualising and exploring molecular crystals Chem Eur J 1998 4 (11) 2136-
2141
Bibliography
175
161 Etter M C MacDonald J C Bernstein J Graph-Set Analysis of Hydrogen-
Bond Patterns in Organic- Crystals Acta Crystallogr Sect B 1990 46 256-262
162 Grell J Bernstein J Tinhofer G Graph-set analysis of hydrogen-bond patterns
some mathematical concepts Acta Crystallogr Sect B 1999 55 1030-1043
163 Press W H Flannery B P Teukolsky S A Vetterling W T Numerical
methods the art of scientific computing (Fortran version) Cambridge University
Press Cambridge 1989
164 Galek P T A Novel comparison of crystal packing by moments of inertia
CrystEngComm 2011 13 (3) 841-849
165 Bonnet P A Streek J v d Trask A V Motherwell W D S Jones W The
crystal structure of an unstable polymorph of beta-D-allose CrystEngComm
2004 6 (86) 535-539
166 Potter B S Palmer R A Withnall R Chowdhry B Z Price S L Aza
analogues of nucleic acid bases experimental determination and computational
prediction of the crystal structure of anhydrous 5-azauracil J Mol Struct 1999
486 349-361
167 Nowell H Frampton C S Waite J Price S L Blind crystal structure
prediction of a novel second polymorph of 1-hydroxy-7-azabenzotriazole Acta
Crystallogr Sect B 2006 62 (4) 642-650
168 DOria E Karamertzanis P G Price S L Spontaneous Resolution of
Enantiomers by Crystallization Insights from Computed Crystal Energy
Landscapes Cryst Growth Des 2010 10 (4) 1749-1756
169 Thornber C W Isosterism and molecular modification in drug design Chem
Soc Rev 1979 8 (4) 563-580
170 Singh H Singh Chawla A Kapoor V K Paul D Malhotra R K 4
Medicinal Chemistry of Tetrazoles In Progress in Medicinal Chemistry Volume
17 ed Ellis and G P Ed Elsevier 1980 pp 151-183
171 Lipinski C A Chapter 27 Bioisosterism in Drug Design In Annual Reports in
Medicinal Chemistry Volume 21 ed Denis M B Ed Academic Press 1986
pp 283-291
172 SHELXL97 University of Goumlttingen Goumlttingen Germany 1997
173 Sheldrick G M A short history of SHELX Acta Crystallogr Sect A 2008 64
(1) 112-122
174 Farrugia L WinGX suite for small-molecule single-crystal crystallography J
Appl Crystallogr 1999 32 (4) 837-838
175 Ladd M F C Palmer R A Structure Determination by X-Ray Crystallography
Springer 2003
Bibliography
176
176 Khan S A Reshak A H First Principle Study of Electronic Structure Chemical
Bonding and Optical Properties of 5-azido-1H-tetrazole International Journal of
Electrochemical Science 2013 8 (7) 9459-9473
177 Desiraju G R Hydrogen bridges in crystal engineering Interactions without
borders Accounts Chem Res 2002 35 (7) 565-573
178 Herrebout W A Suhm M A Weak hydrogen bonds - strong effects Phys
Chem Chem Phys 2011 13 (31)
179 Schmidt M W Baldridge K K Boatz J A Elbert S T Gordon M S
Jensen J H Koseki S Matsunaga N Nguyen K A Su S Windus T L
Dupuis M Montgomery J A General Atomic and Molecular Electronic
Structure Systems J Comput Chem 1993 14 1347-1363
180 Cossi M Scalmani G Rega N Barone V New developments in the
polarizable continuum model for quantum mechanical and classical calculations
on molecules in solution J Chem Phys 2002 117 (1) 43-45
181 An email message sent Febrary 2012 to Rex Palmer stated the following we
would be delighted if it were 2nd_23res P21 a = 79 or 1st_120res P21c a =
100 as our two lowest energy structures
182 Allen F H The Cambridge Structural Database A quarter of a million crystal
structures and rising Acta Crystallogr Sect B 2002 58 (3) 380-388
183 Thakur T S Desiraju G R Crystal Structure Prediction of a Co-Crystal Using
a Supramolecular Synthon Approach 2-Methylbenzoic Acid-2-Amino-4-
methylpyrimidine Cryst Growth Des 2008 8 (11) 4031-4044
184 Surov A O Perlovich G L Thermodynamics of sublimation thermophysical
and structural aspects of the molecular crystals of fenamates J Struct Chem
2010 51 (2) 308-315
185 Li H Stowell J G Borchardt T B Byrn S R Synthesis Conformational
Polymorphism and Construction of a GT Diagram of 2-[(2-Nitrophenyl)amino]-
3-thiophenecarbonitrile Cryst Growth Des 2006 6 (11) 2469-2474
186 Pagola S Stephens P W He X Byrn S R Crystal structure solution of the
dark red light red and orange pollymorphs of 5-methyl-2-[(2-nitro-4-
methylphenyl)amino]-3-thiophenecarbonitrile by high resolution X-ray powder
diffraction and simulated annealing techniques Delhez R Mittemeijer E J
Eds 2001 pp 789-794
187 Zhou T Li F Fan Y Song W Mu X Zhang H Wang Y Hydrogen-
bonded dimer stacking induced emission of aminobenzoic acid compounds
Chem Commun 2009 (22) 3199-3201
188 Mei X F August A T Wolf C Regioselective copper-catalyzed amination of
chlorobenzoic acids Synthesis and solid-state structures of N-aryl anthranilic acid
derivatives Journal of Organic Chemistry 2006 71 (1) 142-149
Bibliography
177
189 Alvarez A J Singh A Myerson A S Polymorph Screening Comparing a
Semi-Automated Approach with a High Throughput Method Cryst Growth Des
2009 9 (9) 4181-4188
190 SeethaLekshmi S Guru Row T N Conformational polymorphism in a non-
steroidal anti-inflammatory drug mefenamic acid Cryst Growth Des 2012 12
(8) 4283-4289
191 Dokorou V Kovala-Demertzi D Jasinski J P Galani A Demertzis M A
Synthesis Spectroscopic Studies and Crystal Structures of Phenylorganotin
Derivatives with [Bis(26-dimethylphenyl)amino]benzoic Acid Novel
Antituberculosis Agents Helv Chim Acta 2004 87 (8) 1940-1950
192 Bernstein J Polymorphism - A Perspective Cryst Growth Des 2011 11 (3)
632-650
193 Yu L Stephenson G A Mitchell C A Bunnell C A Snorek S V Bowyer
J J Borchardt T B Stowell J G Byrn S R Thermochemistry and
Conformational Polymorphism of a Hexamorphic Crystal System J Am Chem
Soc 2000 122 (4) 585-591
194 Yang S S Guillory J K Polymorphism in sulfonamides J Pharm Sci 1972
61 (1) 26-40
195 Rossi D Gelbrich T Kahlenberg V Griesser U J Supramolecular constructs
and thermodynamic stability of four polymorphs and a co-crystal of pentobarbital
(nembutal) CrystEngComm 2012 14 (7) 2494-2506
196 Lutker K M Matzger A J Crystal polymorphism in a carbamazepine
derivative Oxcarbazepine J Pharm Sci 2010 99 (2) 794-803
197 Costantino L Barlocco D Privileged Structures as Leads in Medicinal
Chemistry Current Medicinal Chemistry 2006 13 (1) 65-85
198 Keinaumlnen S Similauml S Kouvalainen K Oral antipyretic therapy Evaluation of the
N-aryl-anthranilic acid derivatives mefenamic acid tolfenamic acid and
flufenamic acid Eur J Clin Pharmacol 1978 13 (5) 331-334
199 Andersen K V Larsen S Alhede B Gelting N Buchardt O
Characterization of two polymorphic forms of tolfenamic acid N-(2-methyl-3-
chlorophenyl)anthranilic acid their crystal structures and relative stabilities J
Chem Soc Perkin Trans 2 1989 (10) 1443-1447
200 Mattei A Li T Polymorph Formation and Nucleation Mechanism of
Tolfenamic Acid in Solution An Investigation of Pre-nucleation Solute
Association Pharmaceut Res 2012 29 (2) 460-470
201 Surov A O Szterner P Zielenkiewicz W Perlovich G L Thermodynamic
and structural study of tolfenamic acid polymorphs J Pharm Biomed Anal
2009 50 (5) 831-840
Bibliography
178
202 Brittain H G Polymorphism in Pharmaceutical Solids Informa Healthcare New
York London 2009 Vol 192
203 van de Streek J Motherwell S Searching the Cambridge Structural Database
for polymorphs Acta Crystallogr Sect B 2005 61 504-510
204 Desiraju G R Polymorphism The same and not quite the same Cryst Growth
Des 2008 8 (1) 3-5
205 Bhatt P M Desiraju G R Tautomeric polymorphism in omeprazole Chem
Commun 2007 (20) 2057-2059
206 de Gelder R Wehrens R Hageman J A A generalized expression for the
similarity of spectra Application to powder diffraction pattern classification J
Comput Chem 2001 22 (3) 273-289
207 Bruno I J Cole J C Edgington P R Kessler M Macrae C F McCabe
P Pearson J Taylor R New software for searching the Cambridge Structural
Database and visualizing crystal structures Acta Crystallogr Sect B 2002 58
389-397
208 Allen F H Taylor R Research applications of the Cambridge Structural
Database (CSD) Chem Soc Rev 2004 33 (8) 463-475
209 Kazantsev A V Karamertzanis P G Adjiman C S Pantelides C C Price
S L Galek P T A Day G M Cruz-Cabeza A J Successful Prediction of a
Model Pharmaceutical in the Fifth Blind Test of Crystal Structure Prediction Int
J Pharm 2011 418 (2) 168-178
210 Macrae C F Edgington P R McCabe P Pidcock E Shields G P Taylor
R Towler M van de Streek J Mercury visualization and analysis of crystal
structures J Appl Crystallogr 2006 39 453-457
211 Mattei A Li T L Interplay between molecular conformation and
intermolecular interactions in conformational polymorphism A molecular
perspective from electronic calculations of tolfenamic acid Int J Pharm 2011
418 (2) 179-186
212 Habgood M Grau-Crespo R Price S L Substitutional and orientational
disorder in organic crystals a symmetry-adapted ensemble model Phys Chem
Chem Phys 2011 13 (20) 9590-9600
213 Lancaster R W Karamertzanis P G Hulme A T Tocher D A Lewis T
C Price S L The Polymorphism of Progesterone Stabilization of a
Disappearing Polymorph by Co-Crystallization J Pharm Sci 2007 96 (12)
3419-3431
214 Gavezzotti A The Calculation of Molecular Volumes and the Use of Volume
Analysis in the Investigation of Structured Media and of Solid-State Organic-
Reactivity J Am Chem Soc 1983 105 (16) 5220-5225
Bibliography
179
215 The Free Dictionary defines herringbone as a way of assembling in a diagonal
zigzag manner
216 Desiraju G R On the presence of multiple molecules in the crystal asymmetric
unit (Z gt 1) CrystEngComm 2007 9 (1) 91-92
217 Anderson K M Steed J W Comment on On the presence of multiple
molecules in the crystal asymmetric unit (Z gt 1) by Gautam R Desiraju
CrystEngComm 2007 9 91 CrystEngComm 2007 9 (4) 328-330
218 Delaney S P Smith T M Pan D Yin S Korter T M Cryogenic Phase
Transition in Crystalline Aripiprazole Leads to an Eighth Polymorph Cryst
Growth Des 2014
219 From private communication with Rona Watson at University College London
220 Thompson H P G Day G M Which conformations make stable crystal
structures Mapping crystalline molecular geometries to the conformational
energy landscape Chem Sci 2014 5 (8) 3173-3182
221 Mo Y Gao J Theoretical Analysis of the Rotational Barrier of Ethane Accounts
Chem Res 2007 40 (2) 113-119
222 Pophristic V Goodman L Hyperconjugation not steric repulsion leads to the
staggered structure of ethane Nature 2001 411 (6837) 565-568
223 Halpern A M Glendening E D An intrinsic reaction coordinate calculation of
the torsional potential in ethane Comparison of the computationally and
experimentally derived torsional transitions and the rotational barrier Journal of
Chemical Physics 2003 119 (21) 11186-11191
224 Mulliken R S Intensities of Electronic Transitions in Molecular Spectra IV
Cyclic Dienes and Hyperconjugation 2004 7 (5) 339-352
225 Mo Y Song L Lin Y Block-Localized Wavefunction (BLW) Method at the
Density Functional Theory (DFT) Level J Phys Chem A 2007 111 (34) 8291-
8301
226 Brunck T K Weinhold F Quantum-Mechanical Studies on the Origin of
Barriers to Internal-Rotation About Single Bonds J Am Chem Soc 1979 101
(7) 1700-1709
227 Pendas A Blanco M Francisco E Steric Repulsions Rotation Barriers and
Stereoelectronic Effects A Real Space Perspective J Comput Chem 2009 30
(1) 98-109
228 Surov A O Perlovich G L Emelyanenko V N Verevkin S P
Thermochemistry of Drugs Experimental and First-Principles Study of
Fenamates J Chem Eng Data 2011 56 (12) 4325-4332
229 GaussView version 5 2009
Bibliography
180
230 Clark M Cramer R D Van Opdenbosch N Validation of the general purpose
tripos 52 force field J Comput Chem 1989 10 (8) 982-1012
231 Gavezzotti A Filippini G Geometry of the Intermolecular X-HY (X Y=N
O) Hydrogen- Bond and the Calibration of Empirical Hydrogen-Bond Potentials
J Phys Chem 1994 98 (18) 4831-4837
232 Gavezzotti A Are Crystal-Structures Predictable Accounts Chem Res 1994 27
(10) 309-314
233 Mercury version 31 2013
234 Lozano J J Pouplana R Loacutepez M Ruiz J Conformational analysis of the
antiinflammatory fenamates a molecular mechanics and semiempirical molecular
orbital study Journal of Molecular Structure THEOCHEM 1995 335 (13)
215-227
235 Rappe A K Casewit C J Colwell K S Goddard W A Skiff W M Uff a
Full Periodic-Table Force-Field For Molecular Mechanics and Molecular-
Dynamics Simulations J Am Chem Soc 1992 114 (25) 10024-10035
236 Jorgensen W L Tirado-Rives J The OPLS potential functions for proteins
energy minimizations and crystals of cyclic peptides and crambin J Am Chem
Soc 1988 110 (6) 1657-1666
237 Hopkins C W Roitberg A E Fitting of Dihedral Terms in Classical Force
Fields as an Analytic Linear Least-Squares Problem J Chem Inf Model 2014
54 (7) 1978-1986
238 Wheatley R J Price S L An Overlap Model For Estimating the Anisotropy of
Repulsion Mol Phys 1990 69 (3) 507-533
239 Totton T S Misquitta A J Kraft M A First Principles Development of a
General Anisotropic Potential for Polycyclic Aromatic Hydrocarbons J Chem
Theory Comput 2010 6 (3) 683-695
240 Sorescu D C Rice B M Thompson D L Intermolecular potential for the
hexahydro-135-trinitro-135-s- triazine crystal (RDX) A crystal packing
Monte Carlo and molecular dynamics study J Phys Chem B 1997 101 (5) 798-
808
241 Williams D E Houpt D J Fluorine Nonbonded Potential Parameters Derived
From Crystalline Perfluorocarbons Acta Crystallogr Sect B 1986 42 (JUN)
286-295
242 OBoyle N Banck M James C Morley C Vandermeersch T Hutchison
G Open Babel An open chemical toolbox Journal of Cheminformatics 2011 3
(1) 33
243 Combinations - Rosetta Code
Bibliography
181
244 Hastie T Tibshirani R Friedman J The Elements of Statistical Learning Data
Mining Inference and Prediction Second Edition 2nd ed 2009 Corr 7th
printing 2013 edition ed Springer New York 2011pp 745
245 Schmidt M U Dinnebier R E Kalkhof H Crystal engineering on industrial
diaryl pigments using lattice energy minimizations and X-ray powder diffraction
J Phys Chem B 2007 111 (33) 9722-9732
246 Ahmed S Bidstrup S A Kohl P A Ludovice P J Development of a new
force field for polynorbornene J Phys Chem B 1998 102 (49) 9783-9790
247 Braun D E McMahon J A Koztecki L H Price S L Reutzel-Edens S M
Contrasting Polymorphism of Related Small Molecule Drugs Correlated and
Guided by the Computed Crystal Energy Landscape Cryst Growth Des 2014
14 (4) 2056-2072
248 Ismail S Z Anderton C L Copley R C Price L S Price S L Evaluating
a Crystal Energy Landscape in the Context of Industrial Polymorph Screening
Cryst Growth Des 2013 13 (6) 2396-2406
249 Price L S McMahon J A Lingireddy S R Lau S-F Diseroad B A Price
S L Reutzel-Edens S M A molecular picture of the problems in ensuring
structural purity of tazofelone J Mol Struct 2014 ASAP
250 Kendrick J Stephenson G A Neumann M A Leusen F J Crystal Structure
Prediction of a Flexible Molecule of Pharmaceutical Interest with Unusual
Polymorphic Behavior Cryst Growth Des 2013 13 (2) 581-589
251 Price S L Hamad S Torrisi A Karamertzanis P G Leslie M Catlow C
R A Applications of DL_POLY and DL_MULTI to organic molecular crystals
Mol Simulat 2006 32 (12-13) 985-997
252 Abramov Y A QTAIM Application in Drug Development Prediction of
Relative Stability of Drug Polymorphs from Experimental Crystal Structures J
Phys Chem A 2011 115 (45) 12809-12817
253 Campeta A M Chekal B P Abramov Y A Meenan P A Henson M J
Shi B Singer R A Horspool K R Development of a Targeted Polymorph
Screening Approach for a Complex Polymorphic and Highly Solvating API J
Pharm Sci 2010 99 (9) 3874-3886
254 Klimes J Michaelides A Perspective Advances and challenges in treating van
der Waals dispersion forces in density functional theory J Chem Phys 2012
137 (12) 120901
255 Vasileiadis M Pantelides C C Adjiman C S Prediction of the crystal
structures of axitinib a polymorphic pharmaceutical molecule Chem Eng Sci
2015 121 60-76
256 Smith W Todorov I T Leslie M The DL_POLY molecular dynamics
package Z Kristallogr 2005 220 (5-6) 563-566
Bibliography
182
257 Leslie M DL_MULTI - A molecular dynamics program to use distributed
multipole electrostatic models to simulate the dynamics of organic crystals Mol
Phys 2008 106 (12-13) 1567-1578
258 Koch U Popelier P L A Stone A J Conformational Dependence of Atomic
Multipole Moments Chem Phys Lett 1995 238 (4-6) 253-260