Embed Size (px)
Citation preview

8/11/2019 Modelling Phase Change Material Thermal Storage
http://slidepdf.com/reader/full/modelling-phase-change-material-thermal-storage 1/173
McMaster University
DigitalCommons@McMaster
Open Access Dissertations and Teses Open Dissertations and Teses
1-1-2010
Modelling Phase Change Material Termal StorageSystems
Joanne M. Bailey
Follow this and additional works at: hp://digitalcommons.mcmaster.ca/opendissertations
Part of the Mechanical Engineering Commons
Tis Tesis is brought to you for free and open access by the Open Disser tations and Teses at DigitalCommons@McMaster. It has been accepted for
inclusion in Open Access Dissertations and Teses by an authorized administrator of DigitalCommons@McMaster. For more information, please
contact [email protected].
Recommended CitationBailey, Joanne M., "Modelling Phase Change Material Termal Storage Systems" (2010). Open Access Dissertations and Teses. Paper4419.

8/11/2019 Modelling Phase Change Material Thermal Storage
http://slidepdf.com/reader/full/modelling-phase-change-material-thermal-storage 2/173
MODELLING
PH SE CH NGE
M TERI L THERM L
STOR GE SYSTEMS
8/11/2019 Modelling Phase Change Material Thermal Storage
http://slidepdf.com/reader/full/modelling-phase-change-material-thermal-storage 3/173
MODELLING PH SE CH NGE M TERI L THERM L STOR GE SYSTEMS
y
JOANNE M. BAILEY B.A.Sc. P .Eng.
A Thesis
Submitted to the School
of
Graduate Studies
in
Partial Fulfillment of the Requirements
for the Degree
Master ofApplied Science
McMaster University
Hamilton Ontario Canada
© Copyright by Joanne Bailey January 2010

8/11/2019 Modelling Phase Change Material Thermal Storage
http://slidepdf.com/reader/full/modelling-phase-change-material-thermal-storage 4/173
MASTER OF APPLIED SCIENCE 2010)
Mechanical Engineering)
McMASTER UNN RSITY
Hamilton, Ontario, Canada
TITLE: Modelling Phase Change Material Thennal Storage Systems
AUTHOR: Joanne
M
Bailey, B.A.Sc., P Eng.
SUPERVISOR: Dr.
J
S Cotton
NUMBER OF PAGES: xiv, 157
8/11/2019 Modelling Phase Change Material Thermal Storage
http://slidepdf.com/reader/full/modelling-phase-change-material-thermal-storage 5/173
BSTR CT
In order to increase the overall efficiency of energy use in a community, excess
thermal energy from inefficient processes can e stored and used for heating applications.
A one-dimensional analytical conduction model is therefore developed for sizing ofphase
change material thermal energy storage systems. The model addresses rectangular
channels ofphase change material separated y flow channels for the addition and
removal
of
thermal energy. The analytical model assumes a planar melt front and linear
temperature profiles throughout the thermal storage cell. Heat flux and interface
temperatures are calculated at various melt fractions based on a quasi-steady electrical
analogue analysis of the instant in question. Compensation is made for the sensible
energy change between melt fractions
y
adding this energy at the calculated heat flux.
A two dimensional, conduction only computational fluid dynamics model is used to
compare the response of the analytical model to changes in the input parameters and
shows good agreement. A test apparatus and a three dimensional computational fluid
dynamics model are also created and melt-time results compared to analytical model
predictions. These comparisons also show good agreement. Finally, a thermal storage
system is sized for a specific application, H2Green Energy Corporation s Distributed
Storage System, with sizing based on the heat load requirements
of
McMaster Innovation
Park during the winter months. Technical feasibility of this system is shown with
analysis also included
on
economic feasibility. It is determined that the analytical model
is sufficient for initial assessment
of
phase change material thermal energy storage
iii

8/11/2019 Modelling Phase Change Material Thermal Storage
http://slidepdf.com/reader/full/modelling-phase-change-material-thermal-storage 6/173
systems where detailed geometry is unavailable Recommendations are made for further
validation
o
the model and the development
o
a phase change material properties
database Suggestions are also presented on additional sources o revenue for the
H2Green Distributed Storage System that will increase its economic feasibility
V
8/11/2019 Modelling Phase Change Material Thermal Storage
http://slidepdf.com/reader/full/modelling-phase-change-material-thermal-storage 7/173
CKNOWLEDGEMENTS
The author would like to acknowledge the financial contributions o the Ontario
Centres o Excellence H2Green Energy Corporation McMaster University Department
o Mechanical Engineering NSERC and the Canadian Engineering Memorial Foundation
towards completion o this thesis.
The author would also like to thank Dan Wright for his assistance with data
acquisition and programming Ron Lodewyks J.P. Talon Mark MacKenzie Jim
McLaren and Joe Verhaeghe for their help with the fabrication
o
the experimental
apparatus Dr. J.S. Cotton for his guidance and supervision over the course o this project
and Dr. H.S. Sadek for his continual support and advice.
v

8/11/2019 Modelling Phase Change Material Thermal Storage
http://slidepdf.com/reader/full/modelling-phase-change-material-thermal-storage 8/173
Table of Contents
Abstract .............................................................................................................................. iii
Acknowledgements ............................................................................................................. v
List of Tables ..................................................................................................................... ix
List
of
Figures ..................................................................................................................... x
Nomenclature .................................................................................................................... xii
Glossary ........................................................................................................................... xiii
CHAPTER
1 - Introduction ................................................................................................... 1
1 1
- Background ............................................................................................................ 1
1.2 - Current Applications of Thermal Storage ................................................... ......... 2
1 3
- Potential Applications
of
Thermal Storage ............................................................ 5
1.4 - Problem .................................................................................................................. 7
1.5 - Scope of Work ....................................................................................................... 8
CHAPTER 2 - Thermal Storage Technologies ................................................................... 10
2.1 - Thermal Storage Options ..................................................................................... 10
2.2 - Phase Change Material Categories ...................................................................... 12
2.3 - Low Temperature Phase Change Materials .........................................................
13
2.4 - Recent Phase Change Material Thermal Storage Research ................................. 19
2.5 - Capture Systems ................................................................................................... 24
2.6 - Recovery Systems ................................................................................................ 26
2.7 - Temperature Mediation Systems ......................................................................... 27
2.8 - Design Methodology ........................................................................................... 27
CHAPTER 3 P M Thermal Storage Models .................................................................... 32
3 1 - P M Mass ............................................................................................................ 32
3.2 - One-Dimensional Storage Cell Geometric Model ...............................................
33
3.3 - Analytical Model Single Storage Cell Time ........................................................ 34
3.3.1 - Pseudo-Steady Heat Transfer Model ............................................................ 35
3.3.2 - Changing Temperature Profile and Sensible Energy .................................... 36
3.3.3 - Equations Used in the Analytical Model ...................................................... 37
3.4 - Fluent Melting/Solidification Model ................................................................... 38
3.5 - Two-Dimensional Numerical Storage Cell Model .............................................. 39
VI
8/11/2019 Modelling Phase Change Material Thermal Storage
http://slidepdf.com/reader/full/modelling-phase-change-material-thermal-storage 9/173
3.5.1
Effect ofTheffilal Conductivity .................................................................... 44
3.5.2 - Effect of Latent Heat of Fusion .................................................................... 49
3.5.3 - Effect
of
Sensible Energy Storage ................................................................ 50
3.5.4 - Effect
of
Capture/Recovery Temperature Difference ................................... 52
3.5.5 - Effect of Dimensional Changes .................................................................... 54
3.5.6 - Effect
of
Capture/Recovery Convective Heat Transfer Coefficient ............. 55
3.6 - Three-Dimensional Sample Cell Model .............................................................. 56
3.6.1 - Lauric Acid Storage Cell ............................................................................... 57
CHAPTER 4 - Test Facility ................................................................................................. 62
4.1 - Test Cell Design Criteria and Constraints ............................................................ 62
4.2 - Phase Change Material Chamber ......................................................................... 65
4.3 - Capture/Recovery Fluid ChanneL ........................................................................ 68
4.4 - Temperature Measurement .................................................................................. 73
4.5 - Flow Measurement and Control. .......................................................................... 75
4.6 - Heat Flux Measurement ....................................................................................... 76
4.7 - Data Acquisition .................................................................................................. 77
4.8 - Experimental Uncertainty .................................................................................... 79
CHAPTER 5 - Experimental Results Discussion and Comparison ................................... 82
5 1 - Experimental Phase Change Results and Model Validation ............................... 82
5.2 - Lauric Acid Storage Cell Low Flow .................................................................... 83
5.3 - Effect
of
Flow Rate .............................................................................................. 89
5.4 - Effect of Flow Direction ...................................................................................... 91
5.5 - Discussion ............................................................................................................
93
CHAPTER 6 - Sample System Sizing ................................................................................. 95
6 1 - H
2
Green Distributed Storage System Theffilal Storage Sizing ........................... 95
6.2 - H2Green Distributed Storage System .................................................................. 95
6.3 - Capture and Recovery System Definition ........................................................... 98
6.4 PCMSelection
................................................................................................... 101
6.5 - McMaster Innovation Park Heating Needs ........................................................ 104
6.6 -
PCM
Theffilal Storage System Sizing Results ................................................... 106
6.7 - DSS System Sizing Results ............................................................................... 112
CHAPTER 7 - Conclusions and Recommendations ......................................................... 116
7.1 - Analytical Model ............................................................................................... 116
7.2 - Further Model Development and Validation ..................................................... 117
7.3 - PCM Effective Theffilal Conductivity Enhancement ........................................ 118
7.4 - Convective Heat Transfer
in
Liquid PCM ......................................................... 118
Vll
8/11/2019 Modelling Phase Change Material Thermal Storage
http://slidepdf.com/reader/full/modelling-phase-change-material-thermal-storage 10/173
7.5 - PCM Properties Library ..................................................................................... 119
7.5.1 Thermal ConductivityTesting .................................................................... 119
7.5.2 - Thermal Cycling Stability Testing .............................................................. 120
7.6 - H
2
Green Distributed Storage System ................................................................ 120
REFERENCES .................................................................................................................... 2
APPENDIX A - Experimental Apparatus Design Details ................................................. 125
A.1 PCM Chamber .................................................................................................. 125
A.2 - CapturelRecovery Flow Channel ...................................................................... 126
A.3 - Refrigerated Bath .............................................................................................. 128
A.4 - Pump ................................................................................................................. 130
A.5 - Flow Meter ........................................................................................................ 3
A.6 - Thermocouples .................................................................................................. 133
A.7 - Heat Flux Sensors ............................................................................................. 133
A.8 - DAQ .................................................................................................................. 135
APPENDIX B - Experimental Procedure .......................................................................... 37
B.1
Cell Assembly ................................................................................................... 137
B.2 - Plumbing and Sensor Connections .................................................................... 138
B.3 - Addition ofPCM ............................................................................................... 139
B.4 - Cell Warm-Up ................................................................................................... 140
B.4 - Capture Test ...................................................................................................... 4
B.5 - Stabilization ......................................................................................................
4
B.5 - Recovery Test .................................................................................................... 4
ApPENDIX C -Calibration and Error Analysis ................................................................. 143
C.1 Material
Property Data ....................................................................................... 143
C 2 Scale PCM Mass Measurement) ...................................................................... 43
C 3 - PCM Thermocouples ........................................................................................ 144
C 4
Flow Meter ........................................................................................................ 145
C 5 - Heat Loss to Surroundings ................................................................................ 146
C 6 Heat Flux Sensors .............................................................................................. 147
C 7 Flow Temperature ............................................................................................. 148
APPENDIX D - CFD Model Set-Ups ................................................................................ 149
D.1 - Two Dimensional Base Case ............................................................................ 149
D.2 - Two Dimensional Parametric Cases ................................................................. 153
D.3 - Three Dimensional Lauric Acid Cell ................................................................ 154
viii
8/11/2019 Modelling Phase Change Material Thermal Storage
http://slidepdf.com/reader/full/modelling-phase-change-material-thermal-storage 11/173
L ST OF T BLES
Table 2.1: Low temperature phase change material properties Zalba et al., 2003) ............................ .......... 17
Table 2.2: Phase change materials with melt temperatures between 50°C and 90°C Ref. 1-Zalba et al.,
2003, Ref. 2-Kenisarin Mahkamov, 2007) .................................................... .......................................... 17
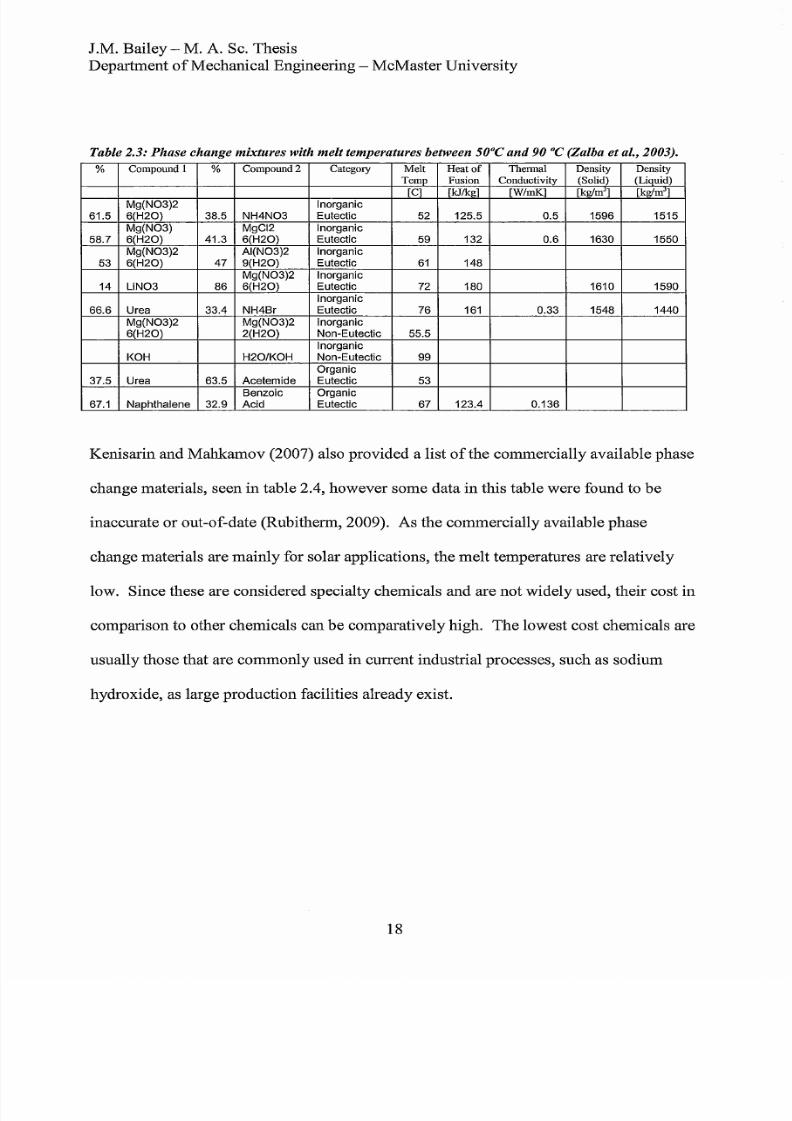
Table 2.3: Phase change mixtures with melt temperatures between 50°C and 90°C Zalba et al., 2003) .....
18
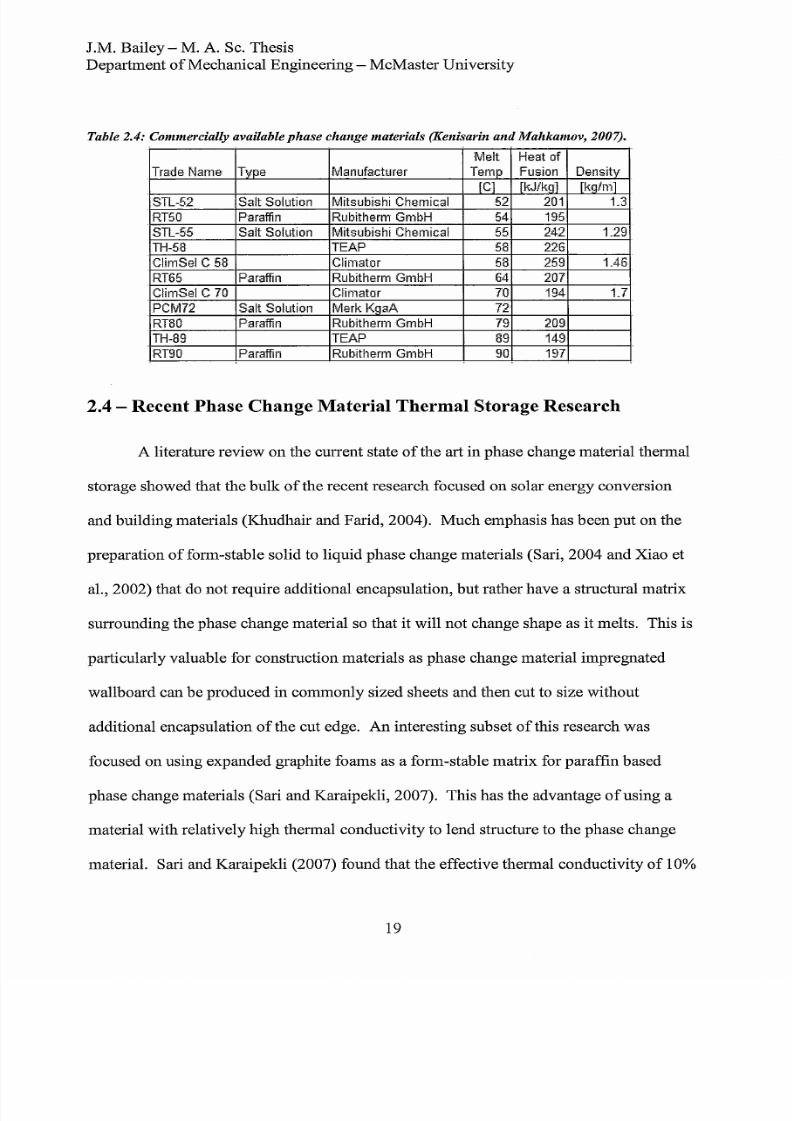
Table 2.4: Commercially available phase change materials Kenisarin and Mahkamov, 2007) ............ ...... 19
Table 2.5: Symbol defInitions for equations 3 through 6 ........................................ ...................................... 22
Table 2.6: Mathematical models for phase change energy storage Verma et al., 2008) .................. ............ 23
Table 2.7: Capture system characterization matrix .............. ....................................... ................................. 26
Table 3.1: Material properties for the two-dimensional CFD base case ...................................................... .40
Table 3.2: Grid independence results for three-dimensional CFD PCM chamber. .......................................
59
Table 5 1 Comparison of half-melt time predictions for tests 1 and 2 with CFD, and analytical models 84
Table 6.1: Time-of-day electricity pricing
in
Ontario, January 2009 Ontario Energy Board, 2009) .... ..... .. 97
Table 6.2: List
ofPCM
candidates with melt temperatures between 60 and
70°C
.................................... 102
Table 6.3: Estimated natural gas usage per month [therms] at McMaster Innovation Park Sandwell
Consulting, 2008) ....................................................... ................................................................................ 104
Table 6.4: Required PCM mass and cost to store 91 GJ oflatent thermal energy ...................................... 105
Table 6.5: Common inputs for the thermal energy storage system for McMaster Innovation Park. ........... 107
Table 6.6: Phase change material inputs for the thermal energy storage system ........................................ 107
Table 6.7: Model outputs for the RT65 thermal energy storage system for several geometries ................. 108
Table 6.8: Model outputs for the stearic acid thermal energy storage system for several geometries ........ 108
Table 6.9: Summary
of
Distributed Storage Systems A and B, with and without storage compression 114
Table 7.1: Summary of successfully tested ranges for model input parameters ......................................... 117
Table 7.2: Additional model limitations and recommendations for use ............................ ......................... 117
Table AI: General and thermal properties ofMakrolon polycarbonate Makrolon, 2009) ..................... .. 126
Table
A2:
Temperature specifications for the Neslabs RTE 110 refrigerated bath Neslabs, 1993) ......... 128
Table
A3:
Physical specifications for the Neslabs RTE 110 refrigerated bath Neslabs, 1993) ................. 129
Table A4: Pump specifications for the RK-07012-20 miniature gear pump Cole Parmer, 2009) ............ 130
Table
A5:
Flow meter calibration constants for the FP-5062 Micro-Flow Sensor Omega, 2007) ............
131
Table
A6:
Electrical properties and responses of the HFS-4 heat flux sensors Omega, 2005) ........... ..... 135
Table C.1: Melt temperature variation for different grades
of
stearic acid ................................................. 143
Table C.2: Flow meter calibration data ................................ .......................................... ............................ 144
Table C.3: Flow meter calibration data ............................................... ......................................... .............. 145
Table D.1: Fluent input parameters for the CFD model base case .. .......................... .......................... ....... 149
Table
D l
continued: Fluent input parameters for the CFD model base case ............................................. 150
Table D.2: ANSYS-Fluent 6.3.26 set up parameters for 2D flow solution ......... ....................... ................ 151
Table D.2 continued: ANSYS-Fluent 6.3.26 set up parameters for 2D flow solution ............. ......... ......... 152
Table D.3: ANSYS-Fluent 6.3.26 set up parameter changes for 2D energy solution ............. ............ ....... 152
Table D.4: ANSYS-Fluent 6.3.26 set up changes for the 2D parametric energy solutions ............. ........... 153
Table D.5: Lauric Acid CFD model boundary conditions and material properties .. .................... .............. 154
Table D.5 continued: Lauric Acid CFD model boundary conditions and material properties .. ...... ..... ...... 155
Table D.6: ANSYS-Fluent 6.3.26 set up parameters for 3D flow solution .......... ...................... ................ 155
Table D.6 continued: ANSYS-Fluent 6.3.26 set up parameters for 3D flow solution ............. ......... ......... 156
Table D.7: ANSYS-Fluent 6.3.26 set up parameter changes for 3D energy solution ............ ........... ......... 157
ix

8/11/2019 Modelling Phase Change Material Thermal Storage
http://slidepdf.com/reader/full/modelling-phase-change-material-thermal-storage 12/173
LIST OF FIGUR S
Figure 2.1: Comparison
of
sensible, latent and chemical energy stored in water. .........................................
11
Figure 2.2: Comparison of sensible, latent and chemical energy stored in ammonia ................................... 11
Figure 2.3: Design methodology for solid to liquid PCM thermal storage systems ...... ............................ ... 29
Figure 3.1: Non-uniform melt distances for round tube banks (staggered and aligned, white for capture
tubes, grey for recovery tubes) versus uniform melt distance for rectangular channels ....... ........................ 34
Figure 3.2: Two-dimensional CFD model geometry with temperature profiles for 50 liquid fraction
during capture (a) and recovery (b) ............................................................................................................... 40
Figure 3.3: Heat flux versus time curves 0-400 s for the rectangular and triangular meshes ................. ..... .42
Figure 3.4: Change in heat flux and melt fraction vs. energy residual during a single time-step ................ .44
Figure 3.5: Effect
of
changing recovery channel thermal conductivity from 0.01 to 1000 W/rrlK during melt
cycle .................................................. ....................................................................... .................................... 45
Figure 3.6: Effect
of
changing capture channel thermal conductivity from 1 to 1000
W/rrlK
during melt
cycle ............................................................................................................................................................. 47
Figure 3.7: Effect
of
changing effective PCM thermal conductivity from 0.1 to 100 W1rrlK ...................... 48
Figure 3.8: Effect
of
changing
P M
latent heat
of
fusion from 91,400 to 219,360 J/kg ............... ..............
50
Figure 3.9: Effect
of
changing difference between initial and melt temperatures (1.05 to 20 QC 51
Figure 3.10: Effect
of
changing the capture fluid temperature difference (2 to 50
QC 53
Figure 3.11: CFD temperature profile at 50 melt for a dT Capture
of
2K. ................................................53
Figure 3.12: CFD base case temperature profile at 50 melt for a dT Capture of21K. ............................... 54
Figure 3.13: Effect of changing the capture fluid convective heat transfer coefficient from 1 to 10,000
W/mzK .......................................................................................................................................................... 56
Figure 3.14: Sliver elements at junction of rounded and non-rounded parts ................................................ 58
Figure 3.15: Lauric Acid storage cell CFD model geometry ........................................................................58
Figure 3.16: Lauric Acid storage cell CFD mesh transverse cross-section ........................... ....................... 59
Figure 3.17: Lauric Acid storage cell CFD mesh lateral cross-section, inlet end ......................................... 60
Figure 4.1: Schematic
of
the phase change material test cell ....................................................................... 64
Figure 4.2: Flanged modular PCM chamber design ...................................................... ............................... 67
Figure 4.3: Flat backing plate with temperature measurement locator baffle ...............................................68
Figure 4.4: Electrical resistance analogy diagram for calculating the heat transfer resistance
of
a phase
change material cell ......................................................................................................................................69
Figure 4.5: CFD flow distribution 3mm from the channel bottom for 0.26 Llmin flow ......... ......... .......... .. 72
Figure 4.6: CFD flow distribution 3mm from the channel bottom for 1.6 Llmin flow ... ............. ............. ...73
Figure 4.7: Thermocouple positioning hole pattern
in
the central baffle (thermocouple spacing in melt front
propagation distance is 1.8 mm) .................................................................................................................... 74
Figure 4.8: Temperature profiles near the baffle in the three-dimensional CFD study ................................75
Figure 4.9: Position
of
heat flux s ~ o r s in the experimental set-up .................................... ........................ 77
Figure 5.1: Lauric acid test 1 melt time results compared to analytical and CFD models ... ......... ........ ....... 84
Figure 5.2: Lauric acid test 2 melt time results compared to analytical and CFD models ........................... 85
Figure 5.3: Repeatability comparison oflauric acid tests 1 and 2 melt time results ..................................... 87
Figure 5.4: Lauric acid test 1 heat flux results compared to analytical and CFD models ......... .................... 87
Figure 5.5: Lauric acid test 2 heat flux results compared to analytical and CFD models ............................. 88
Figure 5.6: Lauric Acid test 3 melt time results compared to the analytical model. ..................................... 90
Figure 5.7: Lauric Acid tests 3 and 4 comparing flow direction for 1.6 LPM capture flow ........ ................. 92
Figure 6.1: Schematic representation
of
the HzGreen Distributed Storage System ..... ................................. 96
Figure 6.2: Design methodology for HzGreen Distributed Storage System thermal battery ........... ............. 99
Figure 6.3: Cell material cost versus charge time for stearic acid and RT65 cells ...................... ................ 109
Figure 6.4: Capture cycle heat flux over time for 6-hour stearic acid capture cell ..................................... 110
Figure 6.5: Net capture cycle heat flux using 6-hour stearic acid capture cells staggered at 15 minute
intervals ...................... ................................................................. ............................................................... 111
x

8/11/2019 Modelling Phase Change Material Thermal Storage
http://slidepdf.com/reader/full/modelling-phase-change-material-thermal-storage 13/173
Figure 6.6: Recovery cycle heat flux over time for 6 hour stearic acid capture cell 1 hour recovery time)
with an average bulk recovery fluid temperature of 25
D
.......................................................................... 111
Figure A.1:
PCM
chamber dimensions ....................................................................................................... 125
Figure
A :
Capture/recovery flow channel external dimensions in millimetres ................. ................. ...... 127
Figure A3: Capture/recovery flow channel internal dimensions in millimetres . .................................. ..... 127
Figure A4: Wiring diagram for the FP-5062 Micro-Flow Sensor Omega, 2007a) ................... ................ 131
Figure A5: Pressure drop across the FP-5062 Micro-Flow Sensor Omega, 2007) ................ ................... 132
Figure A6: Dimensions of the FP-5062 Micro-Flow Sensor Omega, 2007) ............................................. 132
Figure A7: Specifications of the FP-5062 Micro-Flow Sensor Omega, 2007) .......................... .............. 132
Figure A8: Layered construction of the HFS-4 heat flux sensors Omega, 2005) ..................................... 134
Figure
A9:
Dimensions of the HFS-4 heat flux sensors Omega, 2005) ............................................. ....... 134
Figure A l : Position mm) of the heat flux sensors on the capture/recovery channel surface .................. 135
Figure
All
Type T thermocouple data acquisition error for the NI-9213 module ................................... 136
Figure C.1: Heat loss to surroundings under natural convection ................................................................ 147
Figure D.1: Model boundaries for the two-dimensional CFD cases ........................ ....................... ........... 150
Xl

8/11/2019 Modelling Phase Change Material Thermal Storage
http://slidepdf.com/reader/full/modelling-phase-change-material-thermal-storage 14/173
NOMENCL TURE
Symbols Subscripts
A
Area [m
2
] Liquid Phase
Cp Heat Capacity [J kgK] 2 Solid Phase
d
Derivative (i.e. dx/dt)
al Aluminum
D Diameter [m] C Capture
e
Base
of
the Natural Logarithm
cs
Cross Sectional
E
Energy
[ ]
ff Effective
erf
Error Function H Hydraulic
erfc
Complimentary Error Function Initial
f
Heat Flux Density [W/m2]
m Melt
Heat Transfer Coefficient [W m
2
] PCM Phase Change Material
h81
Latent Heat
of
Fusion [J/kg] R Recovery
[J] Joules SC Subcooling
k
Thermal Conductivity, [W1mK ] SH Superheat
[K]
Kelvin sl SolidiLiquid
[kg] Kilograms
ss Stainless Steel
L
Latent Heat
of
Fusion [J kg] store Storage Value
t
Length [m] tube Tube Inner Wall
m
Mass [kg] tube2
Tube Outer Wall
Mass Flow Rate [kg/s]
w Wall Value
n
[m] Meters
Q Heat Flux [W]
q"
Heat Flux Density [W
1m2]
s Position
of
the Solid-Liquid Interface
[m]
[s] Seconds
t
Time [s]
T
Temperature [K]
U
Temperature Distribution [K]
V
Wall Temperature Difference
[K]
[W] Watts [J/s]
x Position [m]
a.
Thermal Diffusivity [m2 sK]
<
Partial Derivative (i.e.
<5x <5t
Y
Melt Fraction []
K
Thermal Diffusivity [m2/sK]
A
Eigen function
J.l
Kinematic Viscosity [kg ms]
Pi (3.14159 )
P
Density [kg m3]
'
Temperature Difference [K]
v
Dynamic Viscosity [m%]
<I>
Temperature Distribution
[K]
xii
8/11/2019 Modelling Phase Change Material Thermal Storage
http://slidepdf.com/reader/full/modelling-phase-change-material-thermal-storage 15/173
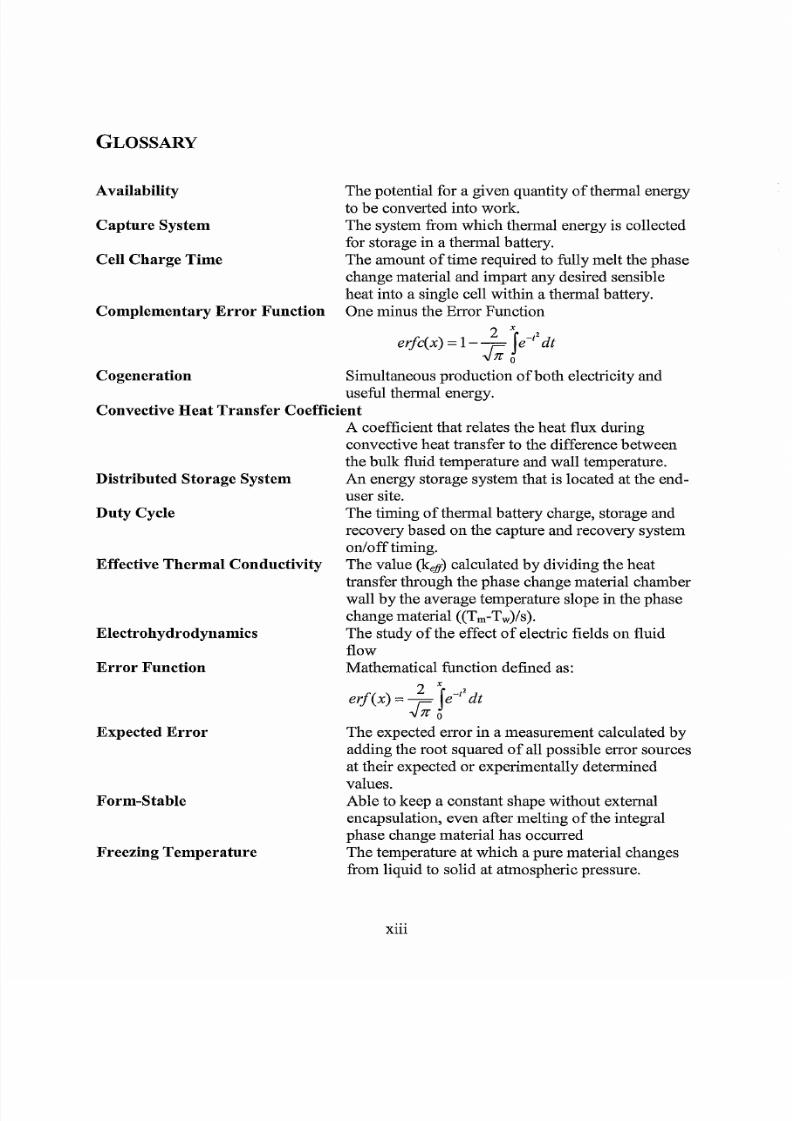
GLOSSARY
Availability
The potential for a given quantity of thermal energy
to
be
converted into work.
Capture System
The system from which thermal energy is collected
for storage in a thermal battery.
Cell Charge Time
The amount of time required to fully melt the phase
change material and impart any desired sensible
heat into a single cell within a thermal battery.
Complementary Error Function
One minus the Error Function
2 x
2
erfc x) =
1
r fe -
t
dt
I/Jr
0
Cogeneration Simultaneous production ofboth electricity and
useful thermal energy.
Convective Heat Transfer Coefficient
A coefficient that relates the heat flux during
convective heat transfer to the difference between
the bulk fluid temperature and wall temperature.
Distributed Storage System An energy storage system that is located at the end-
user site.
Duty Cycle The timing of thermal battery charge, storage and
recovery based
on
the capture and recovery system
on/off timing.
Effective Thermal Conductivity The value k
ef f
) calculated
by
dividing the heat
transfer through the phase change material chamber
wall by the average temperature slope in the phase
change material Tm-Tw ls).
Electrohydrodynamics The study of the effect of electric fields on fluid
flow
Error Function
Expected Error
Form Stable
Freezing Temperature
Mathematical function defined as:
2 x 2
erf x)
=
r
fe-
t
dt
I/Jr
The expected error in a measurement calculated by
adding the root squared of all possible error sources
at their expected or experimentally determined
values.
Able to keep a constant shape without external
encapsulation, even after melting
of
the integral
phase change material has occurred
The temperature at which a pure material changes
from liquid to solid at atmospheric pressure.
Xlll

8/11/2019 Modelling Phase Change Material Thermal Storage
http://slidepdf.com/reader/full/modelling-phase-change-material-thermal-storage 16/173
auricAcid
Liquidus Temperature
Maximum Error
Melt/Melting Temperature
Mushy
Zone
Normalized m
3
Phase Change Material pCM)
Rankine Cycle
Recovery System
Seebeck Effect
Solidus Temperature
Standard Deviation
Stearic Acid
Super-Cooling
Thermal Battery
Thermal Cycling
Thermo-Electric Generator
Variance
A fatty acid with potential for use as a phase change
material T m 317 K).
ANSYS-Fluent term for melt temperature
of
any
pure material or mixture
The maximum possible error in a measurement
calculated
by
adding the root squared of all possible
error sources at their maximum values.
The temperature at which a pure material changes
from solid to liquid at atmospheric pressure.
A region ofpartially solid and partially liquid
material during a melting or solidification process.
Normalized cubic meters as
if
the temperature and
pressure were atmospheric).
A substance that is used to store energy as latent
heat via a change ofphase.
A cyclical process of changing the pressure,
temperature and phase of a fluid usually water) to
extract mechanical energy usually through a steam
turbine) from thermal energy.
The system to which thermal energy is imparted
from storage in a thermal battery.
The thermoelectric phenomenon that causes
electrons to flow through a circuit connecting two
materials at different temperatures.
ANSYS-Fluent term for freezing temperature of any
pure material or mixture.
A statistical value for a normally distributed data set
defined as the square root of the variance.
A fatty acid with potential for use as a phase change
material Tm 341 K).
The degree of cooling below the melt temperature
that a material or mixture can undergo before
solidification occurs.
A thermal energy storage system that decouples the
production of thermal energy from its usage in both
space and time.
Raising and lowering the temperature of a material
several times usually transitioning from solid to
liquid and back each time for a phase change
material).
Devices that use the Seebeck effect to generate
electricity from thermal energy.
The amount that a data point deviates from the
mean value
of
the entire data set.
XIV
8/11/2019 Modelling Phase Change Material Thermal Storage
http://slidepdf.com/reader/full/modelling-phase-change-material-thermal-storage 17/173
J .M. Bailey - M. A. Sc. Thesis
Department of Mechanical Engineering - McMaster University
CHAPTER
1 Introduction
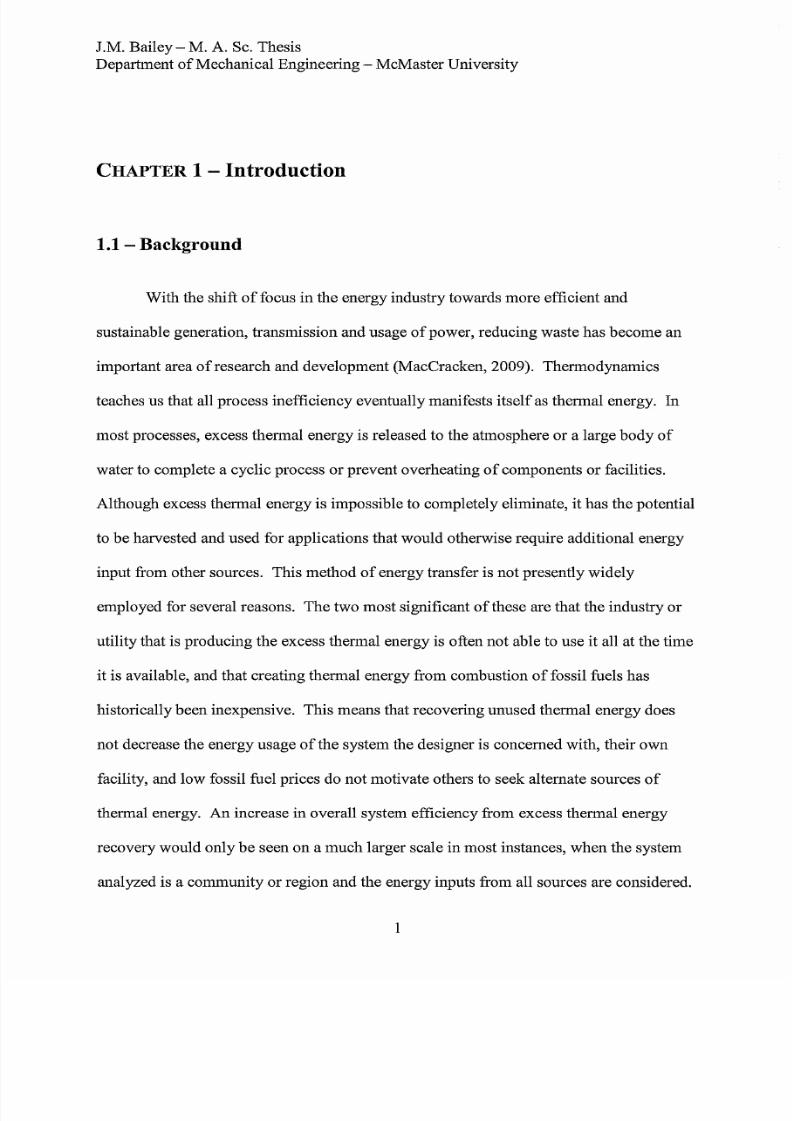
1.1 Background
With the shift
of
focus in the energy industry towards more efficient and
sustainable generation, transmission and usage of power, reducing waste has become
an
important area
of
research and development MacCracken, 2009). Thermodynamics
teaches us that all process inefficiency eventually manifests itselfas thermal energy. In
most processes, excess thermal energy is released to the atmosphere or a large body of
water to complete a cyclic process or prevent overheating of components or facilities.
Although excess thermal energy is impossible to completely eliminate, it has the potential
to be harvested and used for applications that would otherwise require additional energy
input from other sources. This method of energy transfer is not presently widely
employed for several reasons.
he
two most significant of these are that the industry or
utility that is producing
the
excess thermal energy is often not able to
use it
all at the time
it is available, and that creating thermal energy from combustion of fossil fuels has
historically been inexpensive. This means that recovering unused thermal energy does
not decrease the energy usage
of
the system the designer is concerned with, their own
facility, and low fossil fuel prices do not motivate others to seek alternate sources
of
thermal energy.
n
increase
in
overall system efficiency from excess thermal energy
recovery would only be seen
on
a
much
larger scale in most instances,
when
the system
analyzed is a community
or
region and the energy inputs from all sources are considered.

8/11/2019 Modelling Phase Change Material Thermal Storage
http://slidepdf.com/reader/full/modelling-phase-change-material-thermal-storage 18/173
J.M. Bailey M. A Sc. Thesis
Department ofMechanical Engineering - McMaster University
Due to the low fossil fuel prices there is presently no thermal energy market to
encourage the harvest and trade
of
excess thermal energy. The transfer
of
thermal energy
as a commodity would minimize the traditional thermal energy generation requirements
including the use
of
electricity and the chemical energy in fossil fuels to supply the
heating requirements
of
residential and industrial customers. Locating and quantifying
the production and utilization
of
thermal energy
on
a regional scale would allow a more
comprehensive energy system model to
be
developed
in
order to identify potential
efficiency improvements in various communities. It would also allow for small and large
thermal energy recovery systems to be used such that thermal storage and transport can
be
accomplished on all scales. Some
of
the technologies required to make this possible
include thermal storage batteries and transport systems for thermal energy.
1.2 Current Applications o Thermal Storage
Thermal storage is becoming more popular as energy efficiency gains importance
on the global stage. From before the invention of refrigeration systems the thermal
storage capacity and insulative properties of the earth have been used to keep food and
ice cool during the summer in root cellars and ice houses. More recent applications of
thermal energy storage include phase change material impregnated wallboard or concrete
seasonal thermal storage and regulation of
facility temperatures. Phase change material
impregnated wallboard and concrete are used in construction
of
buildings to store thermal
energy during the day as the phase change material melts and keep buildings warm at
night through the solidification of the phase change material. They are created
by
filling
2
8/11/2019 Modelling Phase Change Material Thermal Storage
http://slidepdf.com/reader/full/modelling-phase-change-material-thermal-storage 19/173
J .M. Bailey - M. A. Sc. Thesis
Department of Mechanical Engineering - McMaster University
hollow spaces inside the wallboard
or
concrete with pockets of phase change material.
Seasonal thermal energy storage using soil around boreholes
or
water tanks to store the
summer thermal energy for winter
use
is less common due to the large volumes required
to store seasonal energy. t is also becoming more common to see the use of bricks to
store electrically generated thermal energy when the cost is lower and the
use oflarge-
scale chilled water
or
ice systems to shift cooling energy use to off-peak hours. Several
large-scale cooling systems are already
in use
and can
be
found around
the
world.
The
5 million square foot 1.5 million m
2
)
McCormick Place
in
Chicago, Illinois, along
with
several neighbouring buildings, have
an
8.5 million gallon 32 million litre) chilled water
system Bush and Wolf, 2009)
with
a storage capacity
of
123,000 ton-hours, equivalent
to 430 MW-hours
or 156xl0
12
J
of
thermal storage Engineered Systems, 2000). Again
in
Chicago, three ice storage facilities,
which
freeze water at night and
have
a total
capacity of259 000 ton-hours 910 MW-hours or 3.28xl0
2
J), cool many of the
downtown buildings during the summer through a secondary chilled water distribution
system Williams, 1998). Each of these facilities is the size and shape of a small office
building and constructed to blend
in
with the local architecture.
The
Andasol 3 parabolic
solar facility in Spain uses a 28,500 kg eutectic salt phase change material thermal
storage system to store enough energy to
run
the turbines at full load for
up
to 7.5 hours
when the sun is not shining Solar Millennium, 2008). Each
of
these facilities uses
thermal energy storage to enable the energy to be used whenever
it
is available
or
when it
is economically optimal.
3

8/11/2019 Modelling Phase Change Material Thermal Storage
http://slidepdf.com/reader/full/modelling-phase-change-material-thermal-storage 20/173
J.M. Bailey - M. A Sc. Thesis
Department ofMechanical Engineering - McMaster University
Energy efficiency is not, however, the only motivator for the use of thennal
storage. Comfort and convenience have also spawned some interesting uses
of
thennal
energy storage. In order to keep soldiers and other labourers including animals) who
must work in hot climates more comfortable and effective, several companies offer vests
and other articles of clothing filled with phase change materials to keep the worker at a
constant temperature. One such vest maintains a temperature of 59 of 15°C) for up to
2.5 hours, at which time a freshly charged set
of
cooling packs can
be
inserted Glacier
Tek,2009). This vest weighs less than lbs 2.3 kg) and the cooling packs require
20 minutes to recharge at 32 of 0 ° Glacier Tek, 2009). A similar application ofphase
change material thennal storage is a coffee cup that keeps hot beverages at a constant,
desirable temperature for a long period
oftime
Salton, 2009).
The food, medical and electronics industries also use the thennal storage in phase
change materials for temporary protection of goods. Rather than using expensive back-
up generators to ensure that sensitive electronics installations stay cool during a primary
power outage, phase change materials can
be
included in the enclosure to ensure thennal
protection for a given period of time. A phase change material thennal storage system
can also
be
used to dissipate thennal energy from the enclosure at night to reduce or
eliminate the cost of cooling during the day Intertec, 2009). This same principle is used
to ensure food and medical products are kept at their optimum temperature during
transport to avoid spoilage. Containers with integral phase change materials that
melt/solidify at the optimum temperature
of
the goods can be used as an alternative to
4
8/11/2019 Modelling Phase Change Material Thermal Storage
http://slidepdf.com/reader/full/modelling-phase-change-material-thermal-storage 21/173
J.M. Bailey M.
A
Sc. Thesis
Department of Mechanical Engineering - McMaster University
expensive environmental control systems for transportation during a given period
of
time
Drage, 2009).
1.3 Potential Applications o Thermal Storage
With the proliferation of time-of-day electricity pricing in much of the world to
account for peak system requirements, the number ofpotential sites for thermal energy
storage is growing. While large-scale thermal energy storage sites currently exist, the
greatest potential for development in this area is in transportable systems. An example of
this would
be
a truck, train car or ship that captures thermal energy from a power plant or
large industrial installation and then moves to a city centre to recover the thermal energy
to a communal distributed heating system or absorption system for cooling. Using this
technique, several thermal energy sources can be transferred to a central facility and used
to feed a single or group
of
recovery systems in order to mitigate the risk
if
one of the
sources stops producing thermal energy. If there is excess thermal energy from such a
system during certain times of the year, it can be used to reduce energy input to other
systems. This could include preheating water for hot water systems or snow and ice melt
systems during winter months in parking lots or on airport runways.
Another group
of
potential applications for thermal storage is increasing the
overall efficiency
of
distributed storage systems for storage of off-peak electrical energy
for recovery during peak times. These systems would allow on-site conversion
of
electrical energy into an appropriate storage medium pumped hydro, hydrogen,
compressed gas, etc.) and then regeneration of electricity. This can not only reduce the
8/11/2019 Modelling Phase Change Material Thermal Storage
http://slidepdf.com/reader/full/modelling-phase-change-material-thermal-storage 22/173
J.M.
Bailey
M.
A
Sc. Thesis
Department ofMechanical Engineering - McMaster University
cost
of
electricity based on time-of-day pricing
but
also reduces the peak generating
requirements
of
the electrical grid. Due to the round-trip storage efficiency
of
such
systems causing energy losses as well as transmission losses additional sources
of
revenue are often necessary to justify the system cost. One of the simplest sources of
revenue to consider is the displacement of space heating costs. This transforms the
inefficiencies in the storage and recovery process into useful thermal energy for heating
and absorption cooling applications and reduces the electricity or fossil fuels required to
keep a facility at a comfortable temperature.
Combined heat and power applications could also benefit greatly from thermal
storage systems. This would allow the generation ofheat to
be
decoupled both spatially
and temporally from its use. Facilities that have large electricity demands could store and
transport excess thermal energy to off-site locations for recovery. Conversely smaller
systems could be sized based on the thermal energy requirements
of
a building with
electricity used during peak times and any excess sold back to the grid. This would allow
the high availability chemical energy
in
fossil fuels to be used to generate high
availability electricity with only the resulting inefficiencies put towards low availability
space heating.
Thermal energy from some processes could also
be used to generate electricity.
This can be done using conventional steam generators
if
the temperature is high enough.
An organic Rankine cycle which operates the same way as the Rankine cycle used in
steam generation but uses a fluid with a lower evaporation temperature can be used to
generate electricity from sources at lower than steam generation temperatures. Another

8/11/2019 Modelling Phase Change Material Thermal Storage
http://slidepdf.com/reader/full/modelling-phase-change-material-thermal-storage 23/173
J.M. Bailey M.
A
Sc. Thesis
Department
of
Mechanical Engineering - McMaster University
option for electricity generation directly from thermal energy is using Thermo-Electric
Generators TEGs). These devices operate on the Seebeck effect, promoting electron
flow through two materials connected
by
an electric circuit and subjected to a
temperature differential Seebeck, 1895). Even when thermal energy is used to directly
generate electricity it is still beneficial to be able to store the thermal energy until such a
time when grid electricity is at its most expensive.
1.4 Problem
With the development ofthermal storage and transport technologies, the
utilization
of
by-product thermal energy can
be
decoupled from the primary process that
created it, both temporally and spatially, allowing
it
to be utilized when and where it is
needed. This removes one
of
the major hurdles currently preventing the widespread use
of cogeneration. The creation of a Thermal Energy Market would also lead to more
widespread use of thermal energy storage and transport, as revenue can be generated
from excess thermal energy that is currently released into the atmosphere. This not only
creates an additional source
of
income for some companies and reduces heating costs and
emissions from fossil fuel combustion for others, but also increases the overall efficiency
of
a community, city or region. These technologies also have the advantage
of
helping
mediate intermittent sources
of
energy, such as wind and solar, in order to meaningfully
integrate them into the current generation capacity.
This study focuses on the storage
oflow
temperature thermal energy that cannot
be used to produce electricity via steam generators. Materials and methods for thermal
7
8/11/2019 Modelling Phase Change Material Thermal Storage
http://slidepdf.com/reader/full/modelling-phase-change-material-thermal-storage 24/173
J .M. Bailey - M. A. Sc. Thesis
Department
of
Mechanical Engineering - McMaster University
storage are discussed, a mathematical model developed and a feasibility study performed
on
a distributed storage system DSS), which will
be
described
in
Chapter 6.
he
system
model is also used to analyze the parametric behaviour
of
thermal storage systems to
determine which improvements would produce the most benefit to the system and which
research areas are the most beneficial. The creation
of
such a model aids designers in
evaluating thermal energy storage systems for a wide variety ofpotential applications.
While many mathematical models currently exist for predicting melt and solidification
times in phase change material cavities Verma et aI., 2008), they are not widely used in
industry for preliminary assessments and sizing due to their dependence on specific
geometry information. he models summarized by Verma et al. 2008) based on the first
law of thermodynamics use an energy balance to determine temperature and heat flux
profiles throughout the phase change thermal storage system. As the models based
on
the
second law of thermodynamics, which use the principle entropy generation, have not
been experimentally validated and are not particularly useful for sizing operations, they
were not considered here. he creation
of
a simple and easy to communicate model that
can be used for initial sizing of a phase change material battery will help promote
widespread consideration
of
thermal energy storage systems to help uncover additional
applications for this technology.
1.5 Scope o Work
The scope of this study was the development of an analytical model to facilitate
prediction of the size of a phase change material thermal storage system. he only inputs

8/11/2019 Modelling Phase Change Material Thermal Storage
http://slidepdf.com/reader/full/modelling-phase-change-material-thermal-storage 25/173
J.M. Bailey - M. A. Sc. Thesis
Department
of
Mechanical Engineering - McMaster University
to the model are specifications of the capture and recovery systems including timing for
the capture and recovery needs and properties
of
the phase change material selected.
This allows preliminary sizing without detailed geometric design. The focus was on solid
to liquid phase changes at temperatures between 50°C and 90°C This is a particularly
interesting and challenging range for thermal energy use because it is too low to generate
steam to run through a turbine. t is however attractive for space heating as the range is
well above the air temperature required for indoor air. Storage
ofthermal
energy at these
temperatures would allow
it
to be used at a different time than it is produced. t also
opens up the possibility
of
transporting it to another location with minimal losses for use
elsewhere.
The figure ofmerit used to determine the usefulness of the model was the melt
time calculation for a given configuration.
The
analytical model melt time sensitivity
was compared to computational fluid dynamics results using the same assumptions to
ensure that the model has the correct responses to changes in the input parameters. The
base case was then validated experimentally to ensure reasonable agreement of the
analytical model and computational fluid dynamics simulations.
9

8/11/2019 Modelling Phase Change Material Thermal Storage
http://slidepdf.com/reader/full/modelling-phase-change-material-thermal-storage 26/173
J .M. Bailey - M. A. Sc. Thesis
Department
of
Mechanical Engineering - McMaster University
CHAPTER
2 Thermal Storage Technologies
2.1 Thermal Storage Options
There are three
main
methods of storing thermal energy in any material:
reversible chemical energy, sensible thermal energy and latent thermal energy. Chemical
energy is absorbed
or
released
when
a chemical reaction occurs in a material, thus
changing the organization
of
the molecules.
If
this process is reversible,
it
can
be
used to
capture and recover energy. n example of this is splitting water into its component
gases, diatomic oxygen and diatomic hydrogen and then recombining them into water.
This can also be done to ammonia through the reversible Haber process Soda-Fabrik,
1910)
by
combining and separating the nitrogen and hydrogen atoms.
Sensible thermal energy is stored through increasing the vibrational energy
of
the
molecules in a substance, which manifests itself as an increase in temperature. The
ability
of
a material to store sensible energy is represented by the heat capacity the
amount of energy required to raise the temperature of one kilogram
of
the material
by
one
Kelvin).
Latent thermal energy is the energy required to bring about the reorganization of
molecular structure that accompanies a change
of
phase.
The
phase change can
be
solid-
solid, solid-liquid, solid-gas or liquid-gas. A comparison of the energy that can be stored
in chemical, sensible and latent fonns for water is shown in figure 2.1 and for ammonia
in figure 2.2.
10

8/11/2019 Modelling Phase Change Material Thermal Storage
http://slidepdf.com/reader/full/modelling-phase-change-material-thermal-storage 27/173
J .M. Bailey - M. A. Sc. Thesis
Department
of
Mechanical Engineering - McMaster University
Latent
,
>,., > , , __ -.-,-_._. .-<_0_. _00_
Sensible
; · ' . 1 ' o ( f ~ g ; , ' q t : w a . t ~ f ' f t d ~ 2 b C · · · t o 7 o g . ~
Ice frofil 4 ) ; t o [ ~ C
<
:20.9.MJ .
~ 3 6 J ¥ J M J , ~ ; . { , , ~ ' / '
20C
Figure 2.1:
omparison of
sensible latent and chemical energy
stored
in water.
Sensible
Latent
20C
Figure 2.2: omparison
of
sensible latent
and
chemical energy stored in ammonia.
11

8/11/2019 Modelling Phase Change Material Thermal Storage
http://slidepdf.com/reader/full/modelling-phase-change-material-thermal-storage 28/173
J.M. Bailey
M A
Sc. Thesis
Department ofMechanical Engineering - McMaster University
Because of the relatively large amount of energy that can be stored as latent heat
in a material this was used as the primary storage mode in the design
of
the thermal
batteries. The complexities associated with chemical reactions, such as by-products,
catalysts and secondary reactions, can also
be
avoided by utilizing latent thermal energy
storage. Sensible thermal energy storage was not used as the main method, but may still
be used in certain systems to store some additional energy at peak generation periods
without increasing the size
of
the system. This is dependent
on
the temperatures
of
the
capture and recovery systems as it requires a large enough temperature gradient to drive
the thermal energy into the phase change material after it has surpassed its melt
temperature.
2.2 Phase Change Material Categories
The use of latent heat as the primary thermal energy storage medium requires a
survey of available materials and their relevant properties. Since all materials undergo
phase changes, criteria and constraints have been clearly defined based on the system
requirements to narrow the number of candidate materials. The first decision is the type
ofphase change to
be
employed.
Solid-liquid, solid-gas, solid-solid this only occurs in a few materials that change
molecular structure under specific conditions) or liquid-gas are available as phase
transformations.
n
order for the system to be as simple and compact as possible, the
volume difference between the two phases should be minimized. This means that using a
gas phase would require compression, thus requiring additional energy and reducing the
12
8/11/2019 Modelling Phase Change Material Thermal Storage
http://slidepdf.com/reader/full/modelling-phase-change-material-thermal-storage 29/173
J.M. Bailey - M. A Sc. Thesis
Department
of
Mechanical Engineering - McMaster University
storage efficiency. For this reason solid-gas and liquid-gas phase changes were not
considered
in
this study. This leaves solid-liquid and solid-solid phase change as the two
candidates. Solid-solid phase changes only occur in a few materials such as the n-
alkanes while solid-liquid phase changes can occur in any material.
n
general a solid-
liquid phase change has a higher latent heat than a solid-solid phase change due to the
larger difference in molecular organization and was therefore chosen as the focus
of
this
research. There is potential however to utilize a solid-solid phase change as a secondary
storage mechanism
in
a material with favourable solid-liquid transition properties
but
this opportunity is not usually available.
2.3 Low Temperature Phase Change Materials
Given that solid-liquid phase change was chosen the first constraint
on
material
selection was the melt temperature. The range
of
acceptable melt temperatures was
determined through a preliminary system analysis
of
the proposed capture and recovery
systems. Since this study focused on the applications that lie below steam generation
temperatures
but
above ambient air temperatures the melt range specified was
5 °C
to
90
°C
Since the second law
of
thermodynamics dictates that temperature difference is
the driver for heat transfer the melt temperature ofthe phase change material was set
sufficiently below the input temperature
of
the capture fluid to remove as much thermal
energy as possible
but
also sufficiently above the desired final temperature
of
the
recovery fluid to ensure a reasonable residence time in the thermal battery.
The
longer
the residence time
of
the capture
or
recovery fluid in the thermal battery the closer the
3
8/11/2019 Modelling Phase Change Material Thermal Storage
http://slidepdf.com/reader/full/modelling-phase-change-material-thermal-storage 30/173
J.M. Bailey - M. A. Sc. Thesis
Department ofMechanical Engineering - McMaster University
fluid exit temperature will e to the melt temperature of the phase change material ut the
longer the fluid channel must
e
for a given flow rate and cross-sectional channel
geometry. Longer fluid channels cause higher pressure drop and therefore add parasitic
losses to a system. The next criterion met y the phase change material was chemical
stability for the required number ofthermal cycles. Assuming that heat is stored from the
capture process overnight and used each day
in
the recovery process and that the product
should have a lifetime
of
at least 30 years without replacement, the required number
of
thermal cycles is 10950. This is over ten times the 1000 test cycles recommended
y
Kenisarin Mahkamov 2007). It was therefore difficult to determine if a material could
withstand this many cycles from currently available data. When candidate phase change
materials and corresponding construction materials were chosen, further investigation to
determine the thermal cycle and corrosion lifetime
of
the system
in
order to assess
potential refurbishment costs was recommended since limited information was available.
The remaining parameters considered
in
the choice
of
a phase change material, as
outlined below Kenisarin Mahkamov, 2007), were criteria rather than constraints and
a balance between them to achieve an optimized system was found.
• High heat
of
fusion and specific heat
per
unit volume and mass
• Low vapour pressure at operating temperature to prevent evaporation
• Compatible with common containment materials
• Non-hazardous, non-flammable and non-toxic
• Small degree of super-cooling and high rate of crystal growth
• Small volume variation
on
solidification
14

8/11/2019 Modelling Phase Change Material Thermal Storage
http://slidepdf.com/reader/full/modelling-phase-change-material-thermal-storage 31/173
J .M. Bailey - M. A Sc. Thesis
Department
of
Mechanical Engineering - McMaster University
• High thennal conductivity
• Abundant supply at low cost
Many
of
the desired properties on this list can be achieved through innovative
system and component design, but others are integral to the operation of the thennal
storage system and are not functions of design. he two most important properties on
this list that can be used to rate candidate phase change materials are latent heat of fusion
and cost. These cannot, however,
be
simply compared
per
unit mass
or
volume,
but
the
size and cost ofthe optimized system that results from their selection must be analyzed.
The cost
of
the phase change material itself is difficult to evaluate, as the very large size
of
these systems may warrant the creation
of
a dedicated production facility. This would
significantly change the cost
of
the phase change material.
The size
of
the system is largely based
on
a combination
of
heat transfer surface
design and the effective thennal conductivity
of
the phase change material. Effective
thennal conductivity is defined as a representative value of the coefficient
k ffin
equation
1 that includes the effects
of
all heat transfer enhancements, such as additives, natural
convection cells or mechanical or electrohydrodynamic mixing.
1)
Effective thennal conductivity is a way to approximate a heat transfer region as if
it were conduction in a pure material. This is most applicable to heat transfer
enhancements such as homogeneous mixhlres
of
different materials i.e. nanoparticles
suspended
in
the phase change material),
but
can also be applied to enhancements such as
fins, nanotubes and impregnated foams as long as these enhancements produce effects
5
8/11/2019 Modelling Phase Change Material Thermal Storage
http://slidepdf.com/reader/full/modelling-phase-change-material-thermal-storage 32/173
J.M. Bailey - M. A. Sc. Thesis
Department ofMechanical Engineering - McMaster University
that are similar to a change in thermal conductivity. It is possible that for natural
convection currents or other heat transfer enhancements that keffwould
be
a function
of
time for a given storage cell configuration. Effective thermal conductivity, along with
design options to improve effective properties, is further discussed in the proceeding
section. Preliminary engineering calculations can be made, however, to eliminate some
of
the candidate materials. The advantages and disadvantages
of
organic and inorganic
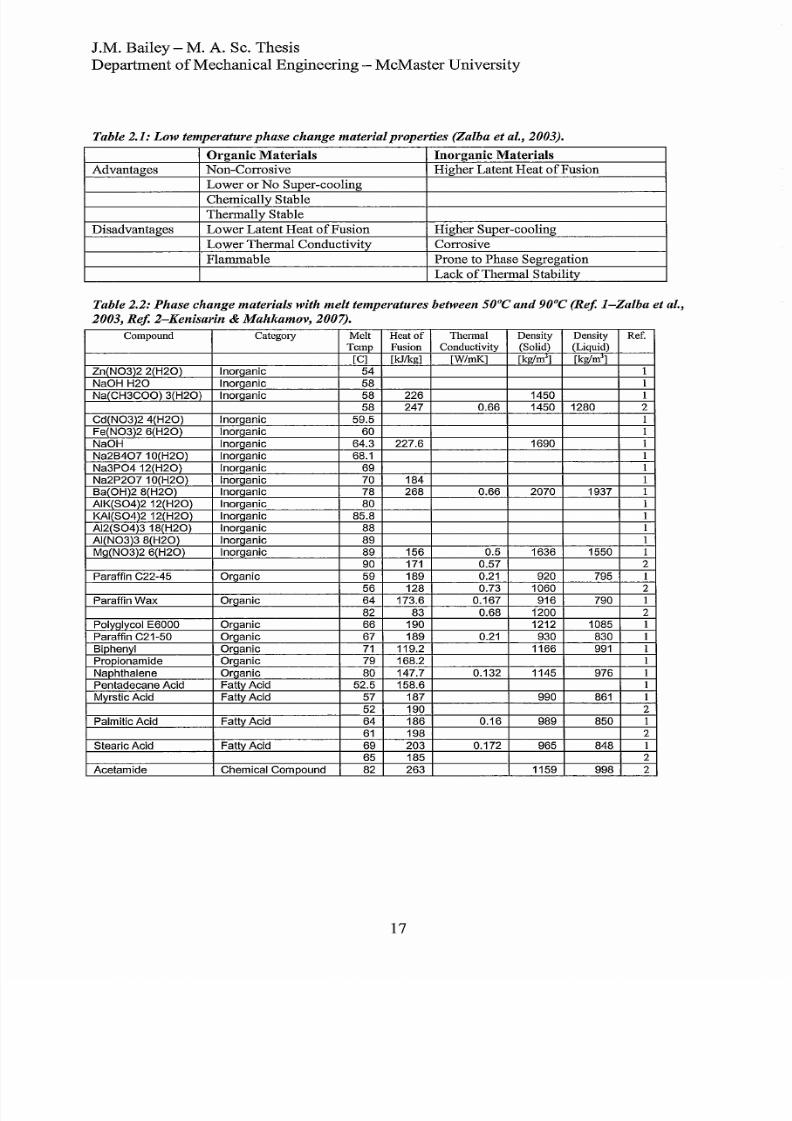
phase change materials are presented in Table 2.1, and show that both have drawbacks.
Since the heat of fusion called phase change enthalpy in the table) and cost are the two
most important factors, it is difficult to eliminate either
of
these categories as both contain
high heat of fusion and low cost options. The selection process therefore continued with
options in both of these categories. Further subdivisions of the materials were made into
eutectics, non-eutectics and fatty acids. Tables 2.2 and 2.3 show examples
oflow
temperature phase change material candidates in these sub-categories found in literature
summaries Zalba et aI., 2003 and Kenisarin Mahkamov, 2007). Available properties
have been listed, although much ofthe information required to properly evaluate each
phase change material is not currently available
in
the literature. he most important
property, melt temperature, is available for all materials and accounts for the bulk
of
the
elimination process, although allowances were made for slight variations due to
differences in material grade and purity.
16
8/11/2019 Modelling Phase Change Material Thermal Storage
http://slidepdf.com/reader/full/modelling-phase-change-material-thermal-storage 33/173
J .M. Bailey - M
A
Sc. Thesis
Department of Mechanical Engineering - McMaster University
Table 2.1: ow temperature phase change material properties Zalba et al., 2003).
Organic aterials Inorganic aterials
Advantages Non-Corrosive Higher Latent Heat
of
Fusion
Lower or No Super-cooling
Chemically Stable
Thennally Stable
Disadvantages Lower Latent Heat
of
Fusion
Higher Super-cooling
Lower Thennal Conductivity Corrosive
Flammable
Prone to Phase Segregation
Lack ofThennal Stability
Table 2.2: Phase change materials with mel t temperatures between 50°C and 90°C Ref. 1-Zalba et al.,
2003, Ref. 2-Kenisarin Mahkamov, 2007).
Compound Category
Melt
Heat of
Thennal
Density Density
Ref
Temp
Fusion Conductivity Solid) Liquid)
[C]
[kJ/kg]
[W mK]
[kg/m]
[kg/m
]
Zn N03)2 2 H20)
Inorganic
54
1
NaOH H2O
Inorganic
58
1
Na CH3COO) 3 H20) Inorganic
58
226 1450
1
58
247 0.66 1450 1280
2
Cd N03)24 H20)
Inorganic 59.5
1
Fe N03)2
6 H20)
Inorganic
60
I
NaOH
Inorganic 64.3 227.6 1690
1
Na2B407 10 H20)
Inorganic
68.1
1
Na3P04
12 H20)
Inorganic
69
1
Na2P20710 H20) Inorganic 70 184
1
Ba OH)2 8 H20) Inorganic
78 268 0.66 2070 1937
1
AIK S04)212 H20)
Inorganic
80
1
KAI S04)212 H20)
Inorganic 85.8
1
AI2 S04)318 H20) Inorganic
88
1
AI N03)3 8 H20) Inorganic
89
1
Mg N03)2 6 H20) Inorganic
89 156
0.5 1636 1550 1
90 171 0.57
2
Paraffin C22-45
Organic
59 189 0.21 920 795
1
56 128
0.73
1060
2
Paraffin Wax
Organic 64 173.6 0.167 916 790 1
82 83 0.68 1200
2
Polyglycol E6000 Organic 66 190 1212 1085
1
Paraffin C21-50
Organic
67 189
0.21
930 830
1
Biphenyl Organic
71
119.2 1166
991
1
Propionamide Organic 79 168.2
1
Naphthalene
Organic
80 147.7 0.132 1145 976
1
Pentadecane Acid
Fatty Acid 52.5 158.6 1
MyrsticAcid Fatty Acid 57 187 990 861
1
52 190
2
Palmitic Acid
Fatty Acid 64 186 0.16 989 850 I
61 198
2
Stearic Acid
Fatty Acid
69 203 0.172 965 848
1
65 185
2
Acetamide Chemical Compound 82 263 1159 998
2
17
8/11/2019 Modelling Phase Change Material Thermal Storage
http://slidepdf.com/reader/full/modelling-phase-change-material-thermal-storage 34/173
J .M. Bailey -
M A.
Sc. Thesis
Department ofMechanical Engineering - McMaster University
Table 2.3: Phase change mixtures with melt temperatures between 50°C
and 9 °C
Zalba et al., 2003).
Compound 1 Compound 2 Category Melt Heat
of
Thennal Density Density
TemIJ
Fusion
Conductivity Solid) Liquid)
[C]
[kJ/kg]
[W mK]
[kglm
J
]
[kglm
J
]
Mg(N03)2 Inorganic
61.5
6 H20)
38.5
NH4N03
Eutectic 52 125.5 0.5 1596 1515
Mg N03)
MgCl2 Inorganic
58.7
6 H20)
41.3
6 H20)
Eutectic 59 132 0.6 1630 1550
Mg(N03)2
AI(N03)2 Inorganic
53
6 H20) 47 9 H20) Eutectic 6 148
Mg(N03)2 Inorganic
14
LiN03
86
6 H20)
Eutectic
72 180
1610 1590
Inorganic
66.6 Urea 33.4
NH4Br Eutectic
76
6
0.33 1548 1440
Mg(N03)2 Mg(N03)2 Inorganic
6 H20) 2 H20) Non-Eutectic
55.5
Inorganic
KOH
H20/KOH
Non-Eutectic
99
Organic
37.5 Urea 63.5 Acetemide
Eutectic
53
Benzoic Organic
67.1
Naphthalene 32.9 Acid Eutectic 67 123.4 0.136
Kenisarin and Mahkamov 2007) also provided a list of the commercially available phase
change materials, seen
in
table 2.4, however some data in this table were found to e
inaccurate or out-of-date Rubitherm, 2009). As the commercially available phase
change materials are mainly for solar applications, the melt temperatures are relatively
low. Since these are considered specialty chemicals and are not widely used, their cost in
comparison to other chemicals can e comparatively high. The lowest cost chemicals are
usually those that are commonly used in current industrial processes, such as sodium
hydroxide, as large production facilities already exist.
18
8/11/2019 Modelling Phase Change Material Thermal Storage
http://slidepdf.com/reader/full/modelling-phase-change-material-thermal-storage 35/173
J .M. Bailey - M. A Sc. Thesis
Department
of
Mechanical Engineering - McMaster University
Table
2.4:
Commercially available
ph se
change materials Kenisarin
nd
Mahkamov, 2007).
Melt
Heat of
Trade Narne
Tvpe fvlanufacturer Temp Fusion
Density
[C]
[kJ/kg] [kg/m]
STL 52 Salt Solution
Mitsubishi Chemical
52
201 1.3
RT50
Paraffin Rubitherm
GmbH
54
195
STL 55
Salt Solution
Mitsubishi
Chemical
55
242 29
TH 58
TEAP
58
226
GlimSel C
58
Climaior
58
259 1.46
RTGS
Paraffin
Rubitherm
GmbH 6
207
ClirnSel
G 70 Climator
70 194 1.7
PCM72
Salt Solution
Merk KgaA
n
RT80
Paraffin Rubitherm GmbH 79 209
TH 89 TEAP 89 149
RT90
Paraffin Rubitherm GmbH
90 197
2.4 Recent Phase Change Material Thermal Storage Research
A literature review on the current state of the art in phase change material thermal
storage showed that the bulk
of
the recent research focused on solar energy conversion
and building materials (Khudhair and Farid, 2004). Much emphasis has been
put on
the
preparation of form-stable solid to liquid phase change materials (Sari, 2004 and Xiao et
aI., 2002) that do not require additional encapsulation, ut rather have a structural matrix
surrounding the phase change material so that it will not change shape as it melts. This is
particularly valuable for construction materials as phase change material impregnated
wallboard can
e
produced
in
commonly sized sheets and then cut to size without
additional encapsulation of the cut edge.
An
interesting subset of this research was
focused on using expanded graphite foams as a form-stable matrix for paraffin based
phase change materials (Sari and Karaipekli, 2007). This has the advantage
of
using a
material with relatively high thermal conductivity to lend structure to the phase change
material. Sari and Karaipekli (2007) found that the effective thermal conductivity
of
10
19
8/11/2019 Modelling Phase Change Material Thermal Storage
http://slidepdf.com/reader/full/modelling-phase-change-material-thermal-storage 36/173
J.M. Bailey M.
A
Sc. Thesis
Department
of
Mechanical Engineering - McMaster University
expanded graphite
by
mass
in
paraffin n-docosane) was 0.82
W/mK
compared to
0 22
W/mK
of
the pure paraffin. This created a form-stable composite balancing the
capillary forces retaining the paraffin
in
the open-celled graphite matrix with gravity.
Mills et al. 2006) have investigated using pieces of metal tubing, aligned and randomly
oriented graphite fibres and graphite foams and have achieved increases in effective
thermal conductivity
of
up to two orders
of
magnitude over pure paraffin
by
using a
graphite foam matrix.
Research into thermally stable phase change materials has produced many novel
materials and mixtures that can withstand a large number of phase change cycles. One
category
of
materials that was particularly relevant to this study was fatty acids. These
chemicals occur in plants and animals and have favourable chemical and thermal
properties including good stability under phase change cycling Sari, 2006). Again, this
research is mainly focused on building materials and solar energy storage due to the
current demand in these areas, but is relevant to a much wider range of applications.
Early phase change material model research resulted
in
the one-dimensional
model known
as
the Stefan-Neumann solution outlined
in
Carslaw and Jaeger 1959).
This model assumes conduction only in the liquid phase and solves equation 2 subject to
the proceeding initial and boundary conditions:
20

8/11/2019 Modelling Phase Change Material Thermal Storage
http://slidepdf.com/reader/full/modelling-phase-change-material-thermal-storage 37/173
J .M. Bailey - M. A. Sc. Thesis
Department ofMechanical Engineering - McMaster University
8u x,t) 8
2
u x,t)
=
2)
u x,t)
=
temperature ofphase change material at location x and time t
Initial Condition
u x,O) qJ x)
<p x)
=
known initial temperature profile at each location x
Stefan Boundary Condition
ds t) 8u s t), t)
dt x
set)
position
ofthe
solid-liquid interface as a function
oftime
Neumann Boundary Condition
8u O,t)
=
J t)
8x
f t) known heat flux at x 0 as a function
oftime
This model results
in
equations 3 and 4 for the position
of
the solid-liquid
interface and equations 5 and 6 for the temperature distributions in the liquid and solid
phases, respectively. Parameter definitions for these equations can e found
in
table 2.5.
_A.
2
O=_e
erf ;L)
s t)=2;LJ
K
l
2
3)
4)
5)

8/11/2019 Modelling Phase Change Material Thermal Storage
http://slidepdf.com/reader/full/modelling-phase-change-material-thermal-storage 38/173
J
.M. Bailey - M. A Sc. Thesis
Department
of
Mechanical Engineering - McMaster University
Table 2.5: ymbol definitionsfor equations 3 through
6
Symbol Definition
Dependencies
A
Root eigenvalue) of equation 3 kl, k
2
, Kl,
K2,
Tl V, L,
CP2
kl
Thennal Conductivity of the Liquid Phase Material Property
k2
Thennal Conductivity
of
the Solid Phase Material Property
KI
Thennal Diffusivity of the Liquid Phase - k/ PICpI)
kh PI.
CPt
K
Thennal Diffusivity of the Solid Phase -
k2/ P2Cp2)
k
2
,
P2,
CP2
PI
Density of the Liquid Phase
Material Property
P2
Density of the Solid Phase Material Property
CPt
Heat Capacity
of
the Liquid Phase Material Property
CP2
Heat Capacity of the Solid Phase
Material Property
V
Wall Temperature minus Initial Temperature
Initial Temperature
T
t
Melt Temperature minus Initial Temperature Initial Temperature
L
Latent Heat ofFusion
Material Property
This solution is dependent
on
finding the root
of
equation 3 in order to
be
able to
solve the position of the interface at time t. This can be done either using eigenvalue
methods or iterative solvers. Unfortunately, this solution requires a constant wall
temperature to solve the melt front, which may not be the case for many real capture and
recovery systems.
If
it is used to
try
to predict such cases using the bulk fluid
temperature as the constant wall temperature, i t will under-predict the time to full melt as
the heat flux during the initial phase
of
the heat transfer will
be
much higher than with
natural convection. The Stephan-Neumann constant temperature model, along with
computational fluid dynamics, is used to compare analytical and numerical model results
and determine
if
there is a significant difference
in
calculation methods and
if
the trends
are reasonable.
22

8/11/2019 Modelling Phase Change Material Thermal Storage
http://slidepdf.com/reader/full/modelling-phase-change-material-thermal-storage 39/173
J.M. Bailey - M. A. Sc. Thesis
Department
of
Mechanical Engineering - McMaster University
More recently, focus
of
model development has shifted to improving the
prediction
of
convective heat transfer effects for given geometries. A detailed description
of the currently available models is available from Verma et al. 2008) for the models
listed
in
table 2.6 and is therefore not provided here. These models provide detailed
calculations for specific system geometries. The difficulty with using most of these
models lies
in
the available material property data.
Many
phase change material
specifications include only properties at a single temperature and therefore do not provide
Table 2.6: Mathematical models for
ph se
change energy storage Verma et al., 2008).
Model Name
Dimensionality Geometry Steady/Transient
Shamsunder et al.
Three Square Transient
Hamden Two
Rectangular
N A
Kurkulu et al.
Two Square
N A
Esen et al.
Two
Cylindrical
Transient
Gong et al. Two
Cylindrical
Transient
Costa et al. One with fins), Rectangular Transient
Two without fins)
Vakilaltojjar Two
Rectangular
Transient
Zhang et al. One
Spherical Capsule
Transient
Benmansour et al. Two
Spherical Capsule
Transient
Xu et al.
One Shape-Stabilized Slab Transient
Halawa et al.
Two
Rectangular
Transient
Sharma et al. Two
Heat Exchanger Transient
Trp
Two Shell and Tube Transient
Hed
and Bellander One
Rectangular
N A
Dwarka and Kim Three Wallboard
N A
sufficient information for these models, such as liquid density and viscosity as a function
of
temperature near the melting point. Another difficulty lies in using these models for
initial assessment
of
phase change material thermal storage systems since this type of
assessment occurs before detailed geometry information is available. Cell geometry
3
8/11/2019 Modelling Phase Change Material Thermal Storage
http://slidepdf.com/reader/full/modelling-phase-change-material-thermal-storage 40/173
J.M. Bailey M. A Sc. Thesis
Department ofMechanical Engineering - McMaster University
required
by
the two and three dimensional models is therefore not available and iterative
design over a wide range
of
dimensions would
be
required. This is cumbersome for an
initial assessment. One-dimensional models are therefore more appropriate for sizing and
budgeting calculations.
2.5 Capture Systems
The most commonly available systems from which low temperature thermal
energy can be captured include furnaces, internal combustion engines, chemical
processes, refrigeration systems, exhaust air ventilation, micro-turbines, drying booths),
and heat sinks for thermodynamic cycles, as
in
combined heat and power applications.
The simplest ways to characterize such systems are
by
the heat transfer medium and
whether it is an open or closed system. Open systems involve heat transfer media that are
not recirculated, while closed systems involve recirculation of all of the heat transfer
medium. The major difference between these two types of system is that closed systems
provide an opportunity for higher efficiency as the only losses are those due to imperfect
insulation, while open systems have lower efficiency due to the temperature difference
required between the medium at the outlet and storage cell temperature to ensure heat
transfer. The heat transfer medium can either
be
a solid conduction), fluid convection).
Since this study focused on low temperature thermal energy, radiation was not
considered. While using conduction to transfer the thermal energy from the capture
system to the thennal battery is possible, using a fluid to transfer the thermal energy via
forced convection is more common and simpler for a modular, transportable system.
24
8/11/2019 Modelling Phase Change Material Thermal Storage
http://slidepdf.com/reader/full/modelling-phase-change-material-thermal-storage 41/173
J .M. Bailey - M. A. Sc. Thesis
Department of Mechanical Engineering - McMaster University
This study therefore focused
on
two types
of
fluid systems either utilizing the primary
fluid that is used in the thermal energy producing process
or
using a secondary heat
transfer fluid with an intermediate heat exchanger. The addition of an intermediate heat
exchanger reduces the temperature
of
the thermal energy that is delivered to the thermal
battery
but
this is acceptable
in many
cases to mitigate
the
effects
of
fouling acid
formation and corrosion that
may
occur
in
exhaust gases and corrosive liquids.
The
addition
of
a heat exchanger may however have negative effects
on
the capture system
due to increased back pressure and this decision must therefore
be
made based on the
specific system in question.
When
the primary heat transfer fluid is used it
may
be either
a liquid or a gas
but if
a secondary fluid is used it would
most
likely
be
a liquid due to
improved heat transfer characteristics.
Another distinction made
when
characterizing the capture system
is
whether
it
is
constant or variable temperature and constant or variable heat flux. any systems will
have a set operating temperature but
may
have variable heat flux depending on the
system load. Conversely some systems may
have
a set heat flux with a variable
temperature to ensure all the heat is dissipated under different conditions. These
considerations resulted
in
the matrix shown
in
table 2.7 for characterizing the capture
system.
t is important that the thermal storage system not detract from the operation of
the capture system.
To
ensure that the backpressure on the capture fluid is minimal
either additional pumping power can
be
added which would result in increased parasitic
5

8/11/2019 Modelling Phase Change Material Thermal Storage
http://slidepdf.com/reader/full/modelling-phase-change-material-thermal-storage 42/173
J .M. Bailey - M. A. Sc. Thesis
Department of Mechanical Engineering - McMaster University
losses, or the pressure drop in the thermal battery can be kept as low as possible. This
can
be
accomplished
by
designing the system for low Reynolds numbers.
Table
2.7:
Capture system characterization matrix
Parameter
Option 1 Option 2
System Configuration
Open
Closed
eat Transfer
Type
Convection Conduction not considered)
eat Transfer Fluid Loop
Primary Fluid
Secondary Fluid
eat Transfer Fluid Type
Liquid
Gas
Input
Temperature
Constant Variable
Input eat Flux
Constant Variable
2.6 - Recovery Systems
As with capture systems, recovery systems can
be
characterized using the matrix
in table 2.7. While closed systems are reasonable for many capture systems, open
recovery systems using the primary fluid are common since the thermal energy is to be
used elsewhere. Some potential applications, both open and closed, include: water
heating pre-heat or full heat), building air pre-heat, full heat or over-heat and
subsequent mixing with fresh air), building radiators and absorption cooling systems.
The one additional parameter considered for the recovery system is whether or not
it can use the same heat transfer medium as the capture system. If this is the case, cost
and volume savings can be realized by having only one set of capture and recovery
channels within the thermal battery. Separation between the two systems can
be
done
using intelligent valve and plumbing design.
The
only drawback to using one set
of
6
8/11/2019 Modelling Phase Change Material Thermal Storage
http://slidepdf.com/reader/full/modelling-phase-change-material-thermal-storage 43/173
J .M. Bailey - M. A. Sc. Thesis
Department
of
Mechanical Engineering - McMaster University
capture and recovery channels is that the capture and recovery cycles cannot be run
through the thermal battery at the same time. This is
not
an issue for most thermal energy
storage systems
s
the thermal energy can
be
used directly in this case and does not need
to be routed through the thermal battery.
2.7 Temperature Mediation Systems
One type
of
system that requires both capture and recovery to occur
simultaneously is a temperature mediation system. any thermodynamic processes
require specific temperatures to operate at optimum efficiency. One example of this is an
organic Rankine cycle, which has an optimum operating temperature due
to
the constant
evaporation temperature of
the fluid. Phase change material thermal storage systems can
be
used to mediate temperature fluctuations in the thermal energy source to ensure that
the optimum operating conditions are met as often as possible. In this case, separate
capture and recovery channels would be required and careful control of the charging and
discharging of thermal energy for a single cell would be needed to ensure that full melt or
full solidification does not occur, allowing sensible heating
or
cooling
of
the cell and drift
from the optimum temperature.
2.8 Design Methodology
The method used in this study to design solid-liquid phase change material PCM)
thermal energy storage systems is shown in figure 2.3. The analytical model outlined in
Chapter 3 deals with the storage cell time and storage cell geometry portions
of
this
27
8/11/2019 Modelling Phase Change Material Thermal Storage
http://slidepdf.com/reader/full/modelling-phase-change-material-thermal-storage 44/173
J.M. Bailey - M. A Sc. Thesis
Department
of
Mechanical Engineering - McMaster University
method. Grey boxes in this figure indicate the system inputs for the design that must be
specified.
n example of the use of this design methodology is presented in Chapter 6
wherein
it
was used to design a thermal storage system for a specific application. Each
step in the process was considered and the model developed in Chapter 3 is used to
determine cell charge time and geometry.
During the preliminary stages
of
the thermal battery design the capture and
recovery systems are clearly defined. This includes defining duty cycles for each. In
many instances this will be complex as conditions will change based on time of day day
of
the week outdoor conditions electricity demand and other factors. While designing
for the worst case scenario m y
be
appropriate in some cases it is far more efficient to
target typical seasonal conditions for a thermal storage system since excess capacity is
costly and does not provide a significant benefit.
It
should also be determined
if
any
sensible thermal energy storage is desired. This would be an option for large temperature
differences between the capture and recovery systems.
28
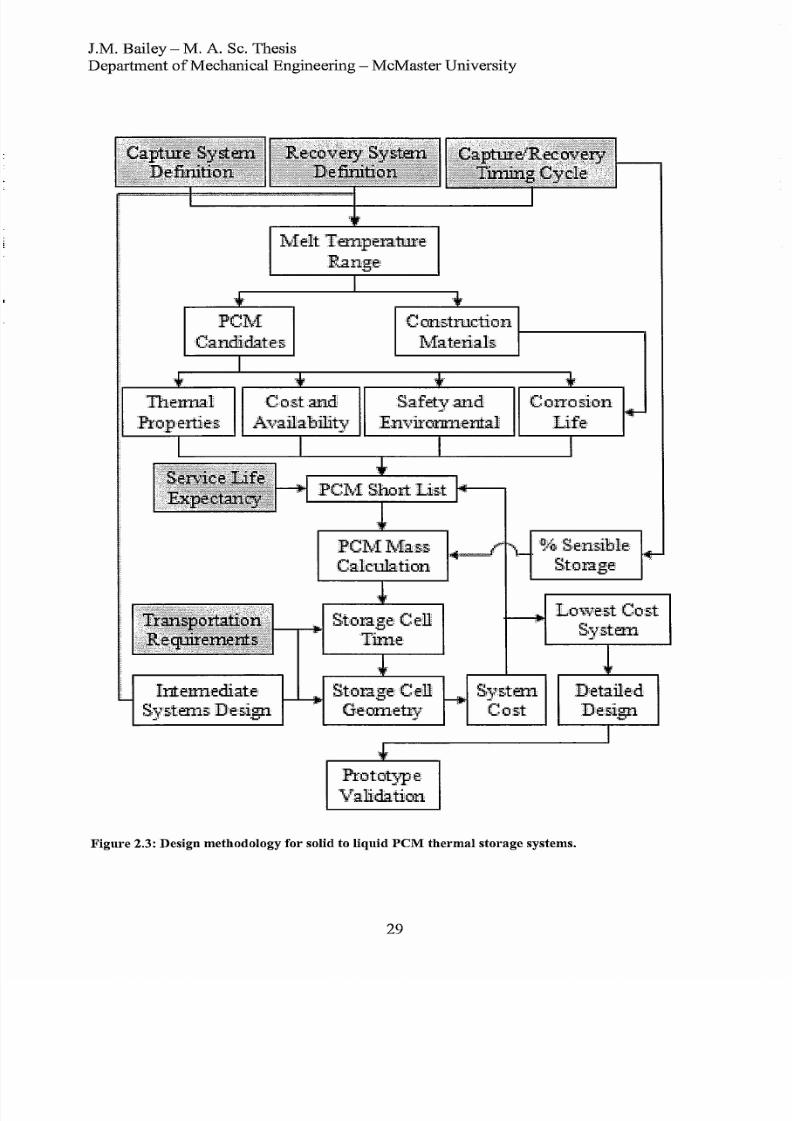
8/11/2019 Modelling Phase Change Material Thermal Storage
http://slidepdf.com/reader/full/modelling-phase-change-material-thermal-storage 45/173
I.M. Bailey-M. A. Sc. Thesis
Department ofMechanical Engineering - McMaster University
1'vfelt
Temperature
P..a.nge'
PC1\{
Candidates
Construction
'via
tellals
Thennal
:Properties
.
Gostand. Safet ,and
",.l\;.,ailab:ilit:'t' Environmental
:PC1V1 ShortList :14-----
PCIv
1\i1ass;
Calculation
. .
1 .
Conosion
~ . .
life
Lowest Cost
i ~
Intenn
edi
ate
Protot:jpe;
Validation
Sys.tem
,Deta:iled
Design
Figure
2.3: Design methodology for solid to
liqui PCM thermal
storage systems.
29
8/11/2019 Modelling Phase Change Material Thermal Storage
http://slidepdf.com/reader/full/modelling-phase-change-material-thermal-storage 46/173
1.M. Bailey M. A. Sc. Thesis
Department
of
Mechanical Engineering - McMaster University
Once the design conditions and cycles are chosen for the capture and recovery
systems, the melt temperature range for the phase change material can be chosen.
With
the chosen melt temperature range, a list of candidate materials can then be compiled.
Along with the relevant heat transfer properties, each material on the list should have an
approximate cost, health and safety concerns and list of compatible construction materials
accompanying it. At this point, many of the materials on the list can be eliminated based
on
latent heat
of
fusion, cost or health and safety concerns
if
they differ significantly from
the other candidates. While other properties, such as thermal conductivity and density,
are also important, more weight should
be
given to latent heat of fusion and material cost
as they have the largest effect on overall system cost.
This leaves a short list of candidate materials that will undergo a more rigorous
analysis before a
PCM
is chosen. A requirement for the service life
of
the thermal battery
must
be
set out in order to evaluate the PCMs based
on
thermal cycling stability.
If
the
service life is a function of the system cost, an estimate should
be
made at this point
based on the expected life of the phase change material and then iterative design cycles
can be performed as necessary.
The latent heat
of
fusion
of
the remaining materials can
be
used along with the
capture and recovery systems and cycles including sensible heating where appropriate)
to detennine the mass of each listed
PCM
that would
be
needed to store the desired
amount of energy.
If
a secondary fluid is being used for either of the capture or recovery
cycles, the pumps, heat exchangers and plumbing can be designed at this point to
determine the fluid temperature and mass flux entering the thermal battery.
30
8/11/2019 Modelling Phase Change Material Thermal Storage
http://slidepdf.com/reader/full/modelling-phase-change-material-thermal-storage 47/173
J.M. Bailey - M. A Sc. Thesis
Department of Mechanical Engineering - McMaster University
Using flow data from the capture and recovery systems and the PCM properties
the storage cell time can
be
chosen and the cell geometry determined using an appropriate
analytical model or computational fluid dynamics. The cell charge time should be based
on the heat removal and addition needs of the capture and recovery system but left as
long as possible to reduce costs. The transient behaviour of the capture and recovery
systems as well as their duty cycles should
be
carefully considered when deciding on a
target cell charge time. This will give a preliminary estimate
of
the material costs for the
cell including capture and recovery channels. This calculation can be performed for all
candidate PCMs and for several storage times. Once enough model data has been
collected the PCM and geometry can
be
chosen from those previously analyzed. Usually
the lowest cost system will
be
chosen however additional considerations such as
financial risk and environmental impact
m y
affect the decision.
Detailed design calculations and prototype validation can then be done to validate
some of the assumptions made in the modelling phase of the process and get a better
estimate of cell charge/discharge time and cost. This detailed design and experimentation
may include heat transfer surface enhancements additives or other means of increasing
the PCM effective thermal conductivity such as electrohydrodynamic
or
mechanical
enhancement of fluid motion. Some of these methods may result in a variable value for
the effective thermal conductivity and a more advanced model or prototype iterations
would need to be used to accommodate such findings.
3

8/11/2019 Modelling Phase Change Material Thermal Storage
http://slidepdf.com/reader/full/modelling-phase-change-material-thermal-storage 48/173
J .M. Bailey - M. A. Sc. Thesis
Department of Mechanical Engineering - McMaster University
CH PTER 3 P M Thermal Storage Models
3.1 PCM Mass
The mass of phase change material required to store a given amount of energy can
be
calculated using the latent heat
of
fusion of the PCM. This is shown in equation 7
with
Estore
as the amount of energy stored in the PCM,
hsl
as the change
n
energy as the
P M
changes from a solid to a liquid or liquid to a solid also
known
as the latent heat
of
fusion) and
mpCM
as the total mass
of
phase change material contained
in
the thermal
battery.
m
[k]
_ store[J]
P M g - h [ / k ]
sf g
7)
In
certain cases where the capture and recovery systems are at very different
temperatures,
it may be
prudent to store some sensible thermal energy
in
order to reduce
the size
of
the system.
In
this case, the mass
of P M
will
be
sized using
both
the latent
and sensible storage up to the safe operating temperature of the phase change material or
capture system limits. The safe operating temperature is determined either by the
degradation
of
the PCM, liquid to gas phase change
of
the
P M
or limits
of
the
construction materials. In this case, the mass of the P M
is
calculated using equation 8
where LiTSH is the temperature difference above the melt temperature to which the P M
will
be
heated Tmax - Tmelt and Cp is the heat capacity
of
the phase change material.
[k
]
- store[J]
m
p M
hsf[J / kg] + p[J / kgK]
LiTs [K]
8)
32
8/11/2019 Modelling Phase Change Material Thermal Storage
http://slidepdf.com/reader/full/modelling-phase-change-material-thermal-storage 49/173
J .M. Bailey - M. A Sc. Thesis
Department of Mechanical Engineering - McMaster University
This simple calculation can
be
used as the first feasibility check to determine if
space and budget are available for a PCM thermal battery.
3.2 One Dimensional Storage Cell Geometric Model
Once the mass ofP M required for the thermal energy storage system has been
determined the cell geometry including the capture and recovery channels must
be
determined. Since most thermal energy storage systems are large
it
is feasible to assume
that custom capture and recovery channels will be economical and therefore channel
geometries will not be limited to commercially available dimensions. Channel
thicknesses must be determined
by
careful consideration of pressure and corrosion
requirements and flow dimensions
by
the desired convective heat transfer coefficient
within the capture and recovery fluids.
The
spacing between the capture and recovery
channels
in
which the
P M
is located determines the time required to charge the
individual storage cells. Since banks of round tubes would result in variable P M
thicknesses between neighbouring tubes as seen in the upper two diagrams of figure 3.1
alternating rectangular channels will be assumed in the model. This will result in the
uniform melt thickness seen
in
the lower diagram
of
figure 3.1. Using this assumption
and neglecting any buoyancy and edge effects the storage cell can be modeled as one-
dimensional heat transfer.
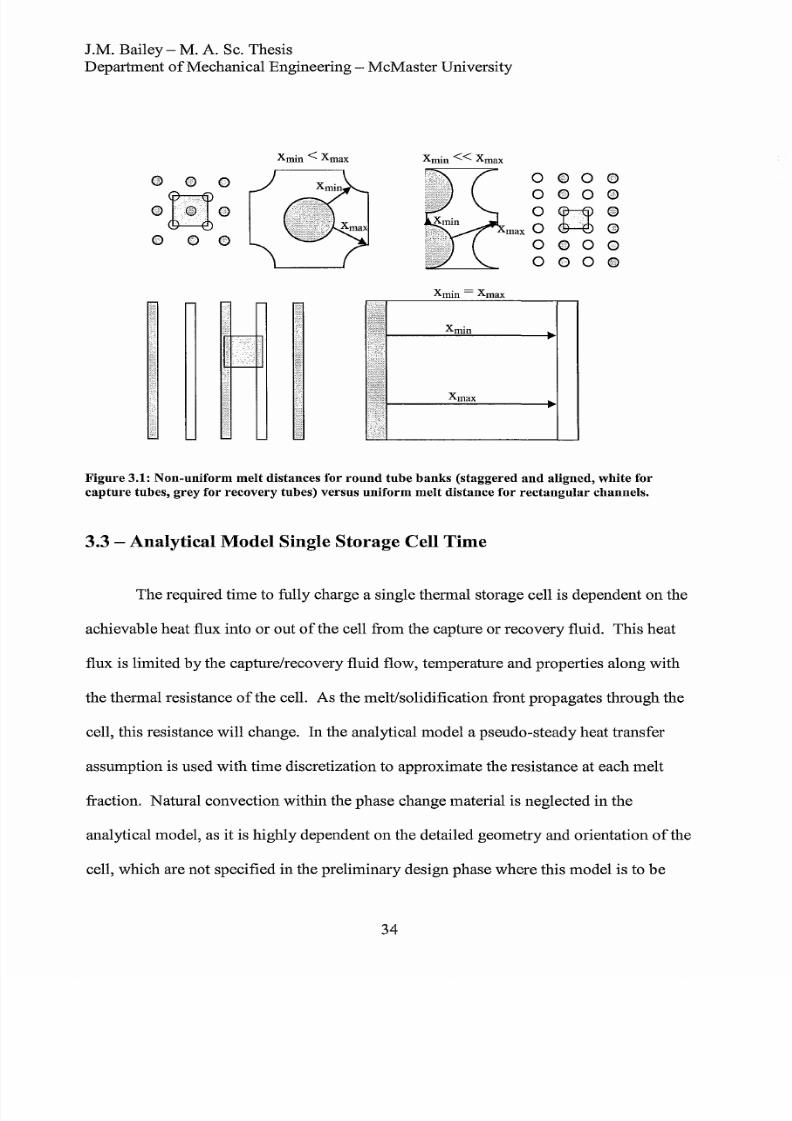
8/11/2019 Modelling Phase Change Material Thermal Storage
http://slidepdf.com/reader/full/modelling-phase-change-material-thermal-storage 50/173
J.M. Bailey M. A Sc. Thesis
Department ofMechanical Engineering - McMaster University
Xmin < Xmax
Q
0 0
°b®Io
o 0 0
Xmin« Xmax
Xmin = Xmax
Xmin
Xmax
0
0
O O ~
~
0
0
Figure
3.1: Non-uniform melt distances
for
round
tube banks
staggered
and
aligned, white for
capture tubes, grey
for
recovery tubes) versus
uniform
melt distance
for rectangular
channels.
3.3 Analytical Model Single Storage Cell Time
The required time to fully charge a single thermal storage cell is dependent on the
achievable heat flux into or out of the cell from the capture or recovery fluid. This heat
flux is limited by the capture/recovery fluid flow, temperature and properties along with
the thermal resistance
of
the cell. As the melt/solidification front propagates through the
cell, this resistance will change.
n
the analytical model a pseudo-steady heat transfer
assumption is used with time discretization to approximate the resistance at each melt
fraction. Natural convection within the phase change material is neglected in the
analytical model, as it is highly dependent on the detailed geometry and orientation
of
the
cell, which are not specified in the preliminary design phase where this model is to
be
34
8/11/2019 Modelling Phase Change Material Thermal Storage
http://slidepdf.com/reader/full/modelling-phase-change-material-thermal-storage 51/173
8/11/2019 Modelling Phase Change Material Thermal Storage
http://slidepdf.com/reader/full/modelling-phase-change-material-thermal-storage 52/173
J.M. Bailey - M. A. Sc. Thesis
Department
of
Mechanical Engineering - McMaster University
The assumption of constant heat flux up to the melt front at a given melt fraction
also causes appreciable error in cases where there is a significantly non-linear
temperature profile due to certain combinations of system parameters and properties.
This error was evaluated with the help
of
the CFD model
in
section 3.5.
Using this pseudo-steady assumption, a heat transfer balance can
be
performed at
each melt fraction in order to solve for each of the interface temperatures. Rather than
using set time steps, which would require iterative calculation
of
the melt front location,
the time-step size is determined by setting the change
in
location of the melt front as 5
of the total P M thickness. The heat fluxes calculated at any of the interfaces is then
used as the average heat flux during that time step. This heat flux, along with the energy
required to melt 5 of the PCM is used to get an estimate of the time required to progress
from one melt front position to the next.
t
is also assumed that the capture or recovery
convective heat transfer coefficient is known at each time step. While it is possible to use
a convective heat transfer coefficient that changes with time, i t would be more common
to encounter a capture or recovery system with a constant flow rate, creating a constant
convective coefficient. In this way the heat flux and time t melt are approximated for
each melt fraction.
3.3.2 Changing Temperature Profile and Sensible Energy
The fact that the linear temperature profiles do change between consecutive time-
steps is partially accounted for
by
determining the sensible heat difference between the
two profiles and adding that amount of thermal energy at the average heat flux for the
time step in question. This allows for a more accurate energy balance, but still neglects
36
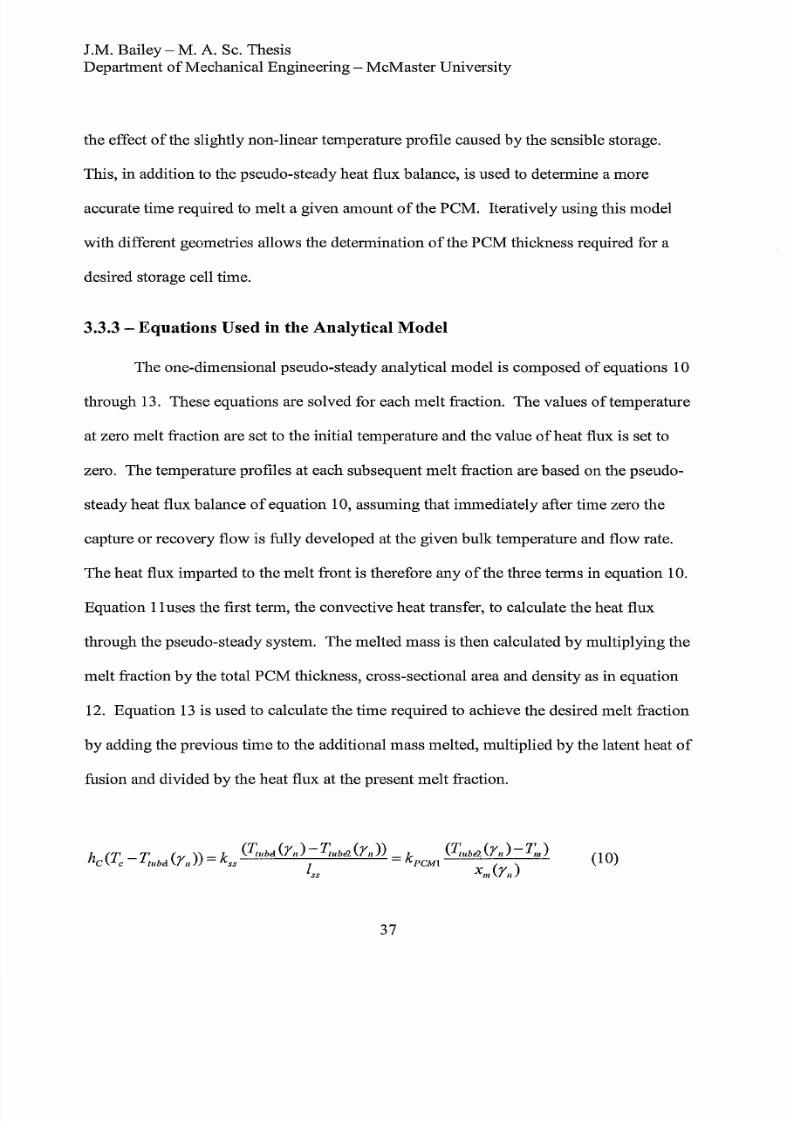
8/11/2019 Modelling Phase Change Material Thermal Storage
http://slidepdf.com/reader/full/modelling-phase-change-material-thermal-storage 53/173
J.M. Bailey - M.
A
Sc. Thesis
Department
of
Mechanical Engineering - McMaster University
the effect ofthe slightly non-linear temperature profIle caused by the sensible storage.
This,
in
addition to the pseudo-steady heat flux balance, is used to determine a more
accurate time required to melt a given amount of the PCM. Iteratively using this model
with different geometries allows the determination of the P M thickness required for a
desired storage cell time.
3.3.3 Equations Used in the Analytical Model
The one-dimensional pseudo-steady analytical model is composed of equations 10
through 13. These equations are solved for each melt fraction. The values of temperature
at zero melt fraction are set to the initial temperature and the value
of
heat flux is set to
zero. The temperature profIles at each subsequent melt fraction are based
on
the pseudo-
steady heat flux balance
of
equation 10, assuming that immediately after time zero the
capture or recovery flow is fully developed at the given bulk temperature and flow rate.
The heat flux imparted to the melt front is therefore any of the three terms in equation 10.
Equation
11
uses the fIrst term, the convective heat transfer, to calculate the heat flux
through the pseudo-steady system. The melted mass is then calculated
by
multiplying the
melt fraction by the total
P M
thickness, cross-sectional area and density as
in
equation
12. Equation 13 is used to calculate the time required to achieve the desired melt fraction
by adding the previous time to the additional mass melted, multiplied by the latent heat of
fusion and divided
by
the heat flux at the present melt fraction.
h
(T
- T
r ) ) =
k
(I;llbd
rn)
I;llb
rn
=
k (I;llb rn)
T,1l
10)
C c
tllbd
n
ss
I
P Ml
)
SS XIII
r
37
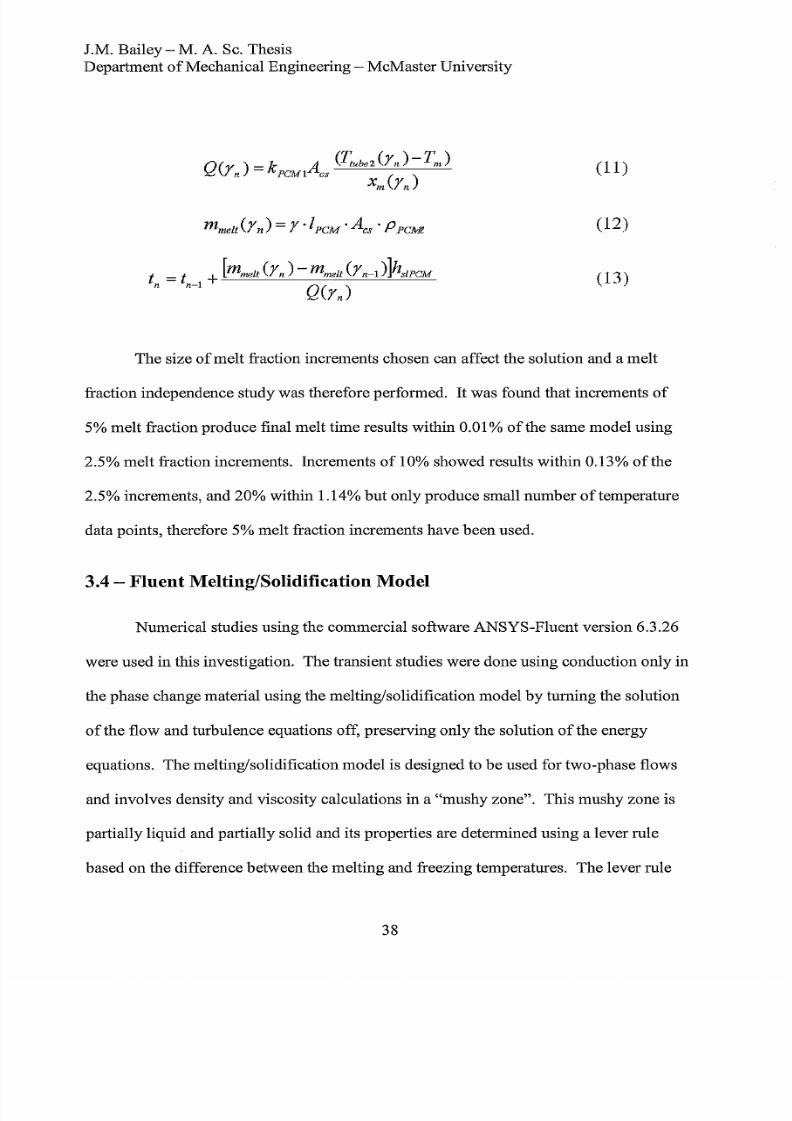
8/11/2019 Modelling Phase Change Material Thermal Storage
http://slidepdf.com/reader/full/modelling-phase-change-material-thermal-storage 54/173
J .M. Bailey - M. A. Sc. Thesis
Department
of
Mechanical Engineering - McMaster University
(11)
mmelt Y
n
=Y · lp M·
Acs
. PP Ml
(12)
(13)
he size ofmelt fraction increments chosen can affect the solution and a melt
fraction independence study was therefore performed. It was found that increments
of
5% melt fraction produce fInal melt time results within 0.01 %
of
the same model using
2.5% melt fraction increments. Increments of 10% showed results within 0.13%
of
the
2.5% increments, and 20% within 1.14% but only produce small number
of
temperature
data points, therefore 5% melt fraction increments have been
used.
3.4 Fluent Melting/Solidification Model
Numerical studies using the commercial software ANSYS-Fluent version 6.3.26
were used
in
this investigation.
he
transient studies were done using conduction only
in
the phase change material using the melting/solidifIcation model
by
turning the solution
ofthe flow and turbulence equations off, preserving only the solution ofthe energy
equations. The melting/solidifIcation model is designed to be used for two-phase flows
and involves density and viscosity calculations in a mushy zone . This mushy zone is
partially liquid and partially solid and its properties are determined using a lever rule
based
on
the difference between the melting and freezing temperatures.
he
lever rule
8

8/11/2019 Modelling Phase Change Material Thermal Storage
http://slidepdf.com/reader/full/modelling-phase-change-material-thermal-storage 55/173
J.M. Bailey - M. A. Sc. Thesis
Department ofMechanical Engineering - McMaster University
calculates the density, viscosity and heat capacity of the mushy zone based on a
proportionally weighted average
of
the liquid and solid properties. Despite the fact that
these calculated mushy zone properties are not used in a conduction-only solution,
problems can arise
in
the model
if
the melting and freezing temperatures are set too close
together. These problems can manifest as convergence issues or cause a discrepancy in
the energy balance equations and are characterized y the integral of the heat flux not
being equal to the change
in
stored energy
ofthe
system. For this reason, a check on the
sum of the heat flux versus the enthalpy increase from the initial to final time step is
necessary each time the melting/solidification model is used.
3.5 Two Dimensional Numerical Storage Cell Model
In order to test assumptions and help develop the mathematical model for the
PCM thermal battery, a two-dimensional CFD model was created. This model, seen in
figure 3.2, consisted of four layers: the capture channel wall, phase change material,
recovery channel wall and recovery fluid. The boundary conditions for the base case
were set to convective heat transfer on the capture channel wall and adiabatic walls for
the other outer boundaries
of
the domain.
n
adiabatic condition was used for the edge
of
the recovery fluid domain because this represents only one-half
of
the fluid width and
can therefore
e
considered as the centerline for one periodic repeating unit with no heat
flux across this plane. Appropriate material properties were set up for the four regions
and can be seen in table 3.1.
39

8/11/2019 Modelling Phase Change Material Thermal Storage
http://slidepdf.com/reader/full/modelling-phase-change-material-thermal-storage 56/173
J .M. Bailey - M. A. Sc. Thesis
Department
of
Mechanical Engineering - McMaster University
1 8mm 1 7mm
Capture Capture
Fluid Channel
Liquid
PCM
T
Liquid
PCM
7.83 mm
Solid
PCM
(a) Capture process (melting)
Solid
PCM
(b) Recovery process (solidification)
1 7mm 1.8 mm
Recovery Recovery
Channel Fluid
Figure 3.2: Two-dimensional eF model geometry with temperature profIles for 50 liquid fraction
during capture (a) and recovery (b).
Table 3.1: Material properties
or
the two dimensional CFD base case.
Property Units Stainless Lauric Aluminum
Air
Steel Acid
Density
[kg/m
j
]
8000 869 2719
1.235
Heat Capacity [J kgK] 500 2150 871
1006.43
Thermal Conductivity [W mK]
16.4
0.17
202.4
0.0242
Kinematic Viscosity
[kg/ms]
N A
0.0073
N/A
1.7894x10-:J
Latent Heat of Fusion
[J/kg]
N A
182,800
N/A
0
Melt Temperature [K]
N A
317.15
N/A
0
Freezing Temperature [K]
N A
316.15
N/A
0
40
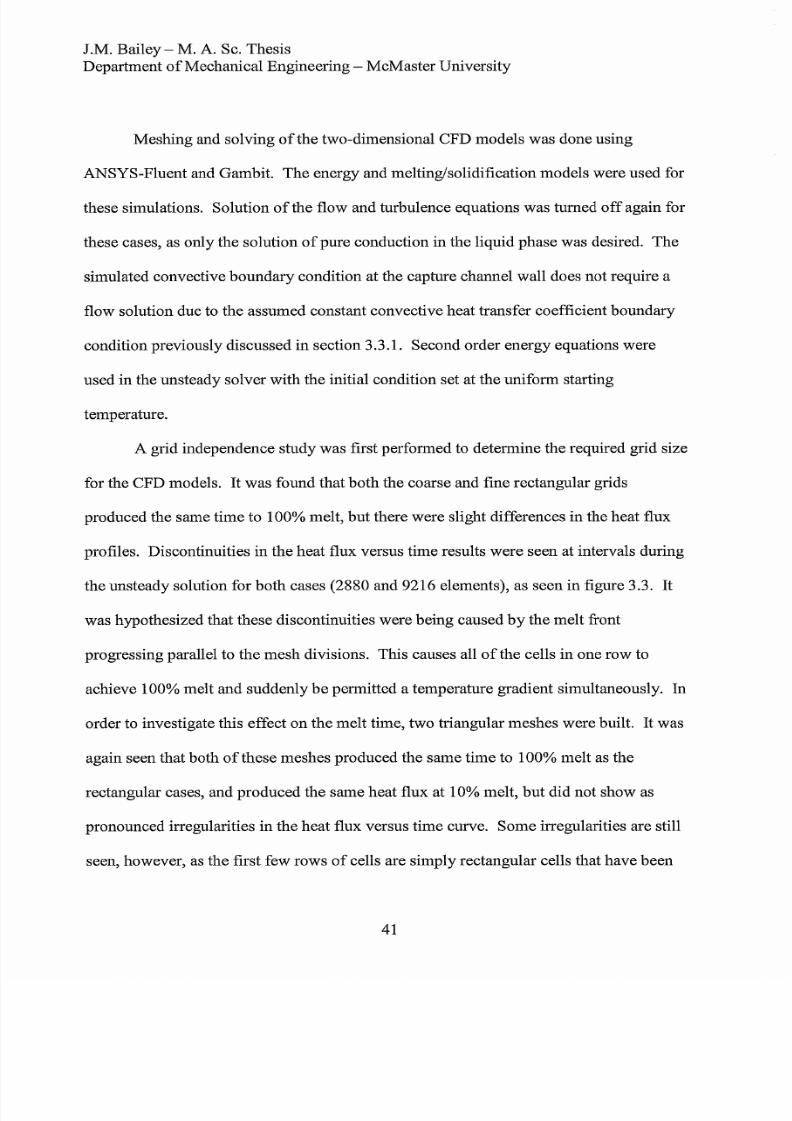
8/11/2019 Modelling Phase Change Material Thermal Storage
http://slidepdf.com/reader/full/modelling-phase-change-material-thermal-storage 57/173
J.M.
Bailey
M.
A
Sc. Thesis
Department ofMechanical Engineering - McMaster University
Meshing and solving
of
the two-dimensional CFD models was done using
ANSYS-Fluent and Gambit.
The
energy and melting/solidification models were used for
these simulations. Solution of the flow and turbulence equations was turned
off
again for
these cases, as only the solution of pure conduction in the liquid phase was desired. The
simulated convective boundary condition at the capture channel wall does not require a
flow solution due to the assumed constant convective heat transfer coefficient boundary
condition previously discussed
in
section 3.3.1. Second order energy equations were
used in the unsteady solver with the initial condition set at the uniform starting
temperature.
A grid independence study was first performed to determine the required grid size
for the CFD models.
t
was found that
both
the coarse and fme rectangular grids
produced the same time to 100 melt,
but
there were slight differences
in
the heat flux
profiles. Discontinuities in the heat flux versus time results were seen at intervals during
the unsteady solution for both cases (2880 and 9216 elements), as seen in figure 3.3.
t
was hypothesized that these discontinuities were being caused by the melt front
progressing parallel to the mesh divisions. This causes all
of
the cells
in
one row to
achieve 100 melt and suddenly
be
permitted a temperature gradient simultaneously.
n
order to investigate this effect on the melt time, two triangular meshes were built. t was
again seen that both of these meshes produced the same time to 100 melt as the
rectangular cases, and produced the same heat flux at 10 melt, but did not show as
pronounced irregularities
in
the heat flux versus time curve. Some irregularities are still
seen, however,
as
the first few rows
of
cells are simply rectangular cells that have been
41
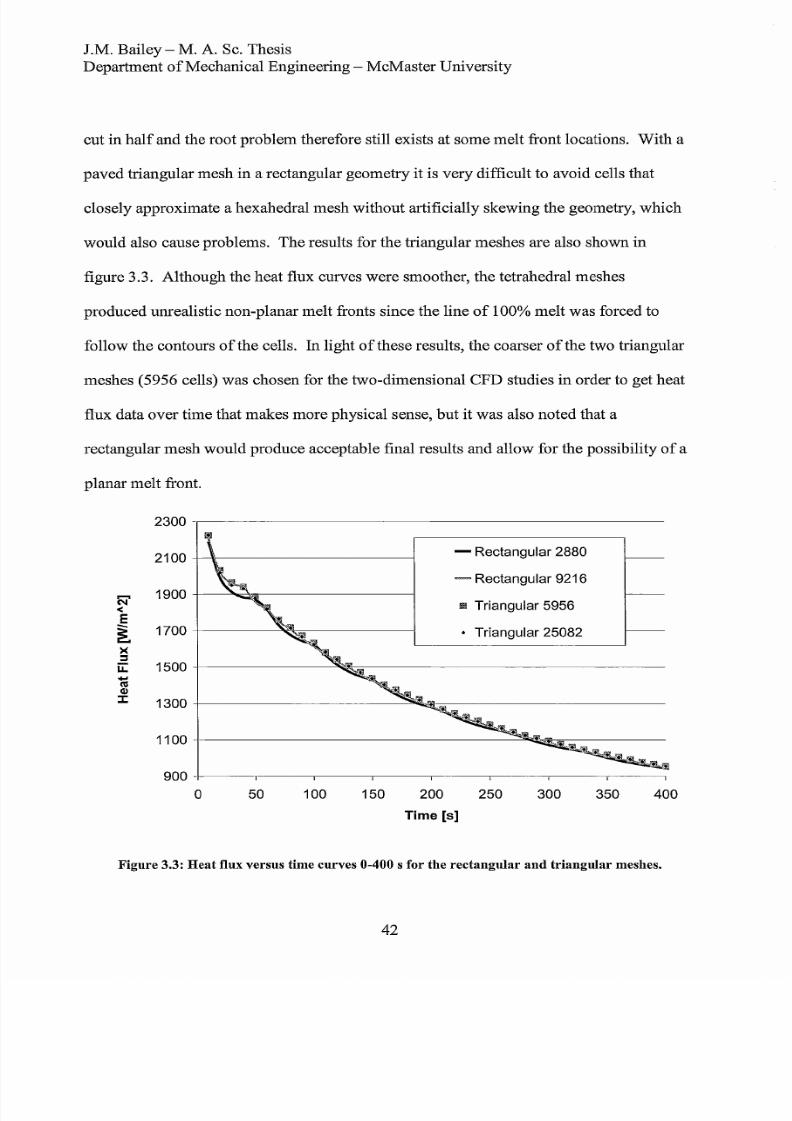
8/11/2019 Modelling Phase Change Material Thermal Storage
http://slidepdf.com/reader/full/modelling-phase-change-material-thermal-storage 58/173
J.M. Bailey M. A. Sc. Thesis
Department
of
Mechanical Engineering - McMaster University
cut
in half
and the root problem therefore still exists at some melt front locations. With a
paved triangular mesh in a rectangular geometry it is very difficult to avoid cells that
closely approximate a hexahedral mesh without artificially skewing the geometry, which
would also cause problems. The results for the triangular meshes are also shown
in
figure 3.3. Although the heat flux curves were smoother, the tetrahedral meshes
produced unrealistic non-planar melt fronts since the line
of
100 melt was forced to
follow the contours
of
the cells.
In
light
of
these results, the coarser
of
the two triangular
meshes (5956 cells) was chosen for the two-dimensional CFD studies in order to get heat
flux data over time that makes more physical sense, but it was also noted that a
rectangular mesh would produce acceptable final results and allow for the possibility of a
planar melt front.
2300
2100
.....
1900
( II
<
E
1700
><
s
ii:
1500
-
IS
Gl
c
1300
1100
900
0 50
100
150
Rectangular 2880
Rectangular 9216
200
Time [ ]
III
Triangular 5956
• Triangular 25082
250 300 350 400
Figure 3.3: Heat flux versus time curves 0-400 s for the rectangular
and
triangular meshes.
42

8/11/2019 Modelling Phase Change Material Thermal Storage
http://slidepdf.com/reader/full/modelling-phase-change-material-thermal-storage 59/173
J.M. Bailey - M. A. Sc. Thesis
Department
of
Mechanical Engineering - McMaster University
A time-step study was also performed for the base case
in
order to determine the
maximum time-step size that could be used
in
the unsteady simulations.
t
was originally
hypothesized that because the only equations being solved were the energy balance and
conductive heat transfer, the time-step used could be very large without significantly
affecting the time to 100 melt. This was verified by using time-steps
of 1
10 and 100
seconds.
t
was shown that, with the exception
of
the accuracy due to the time-step
increment, the
1
10 and 100 second time-step cases produced the same time to full mel t
2152,2160
and 2200 seconds respectively).
The
heat flux at 10 melt fraction was also
within 0.1 for the 1 and 10 second cases (1474 and 1475 m
respectively). t was
therefore decided that a time-step size of 10 seconds would be used for the two-
dimensional simulations
in
order to get good resolution
in
the output data without
increasing the computational time unnecessarily. Along with this time-step size decision,
a maximum energy residual is also required for the iterative solution of each time-step to
optimize computational time. Based on the extremely small changes
in
heat flux and
melt fraction values in the grid independence study for residuals below 10-
8
,
seen in
figure 3.4,
it
was decided to use
10-
8
as the maximum energy residual value for the two-
dimensional time-step convergence.
The
base case for all
of
the two-dimensional CFD work therefore has the
parameters, Fluent set up and model boundaries described in Appendix D. All
deviations from the input parameters are outlined in the individual sections
of
the
parametric studies. The base
case time for the CFD model was 2160 s, while the
analytical model base case time was 2219 s and the Stephan-Neumann base case full mel t
43

8/11/2019 Modelling Phase Change Material Thermal Storage
http://slidepdf.com/reader/full/modelling-phase-change-material-thermal-storage 60/173
J.M. Bailey - M. A. Sc. Thesis
Department
of
Mechanical Engineering - McMaster University
time was 1307 s. As predicted, the Stephan-Neumann model predicts a shorter time to
melt than the CFD and analytical models. The parametric study was based on the change
in the CFD and analytical base case full melt times and is therefore expressed as a
percentage change in the base case melt time.
8
+
• Heat Flux
6
+ Liquid Fraction
G I
I
1j
>
4
s::::
G I
en
2
::::
cu
s::::
)
+
-
::::
m
4
m
G I
- f
CJ
•
1.
-06
1.E-07 1.E-08
1.E-09 1.E-10
1.E-11 1.E-12
1.E-13
I
c
-2
•
•
-4
nergy Residual
Figure 3.4: Change
in heat
flux
and
melt fraction vs. energy residual during a single time-step.
3.5.1 Effect of Thermal onductivity
Four different thermal conductivities are involved in each of the two-dimensional
four layer models that have been studied: 1) that of the capture channel, PCM, recovery
channel and recovery fluid for the capture cycle and 2 that of the recovery channel,
PCM, capture channel and capture fluid for the recovery cycle. Using the Fluent melting
44
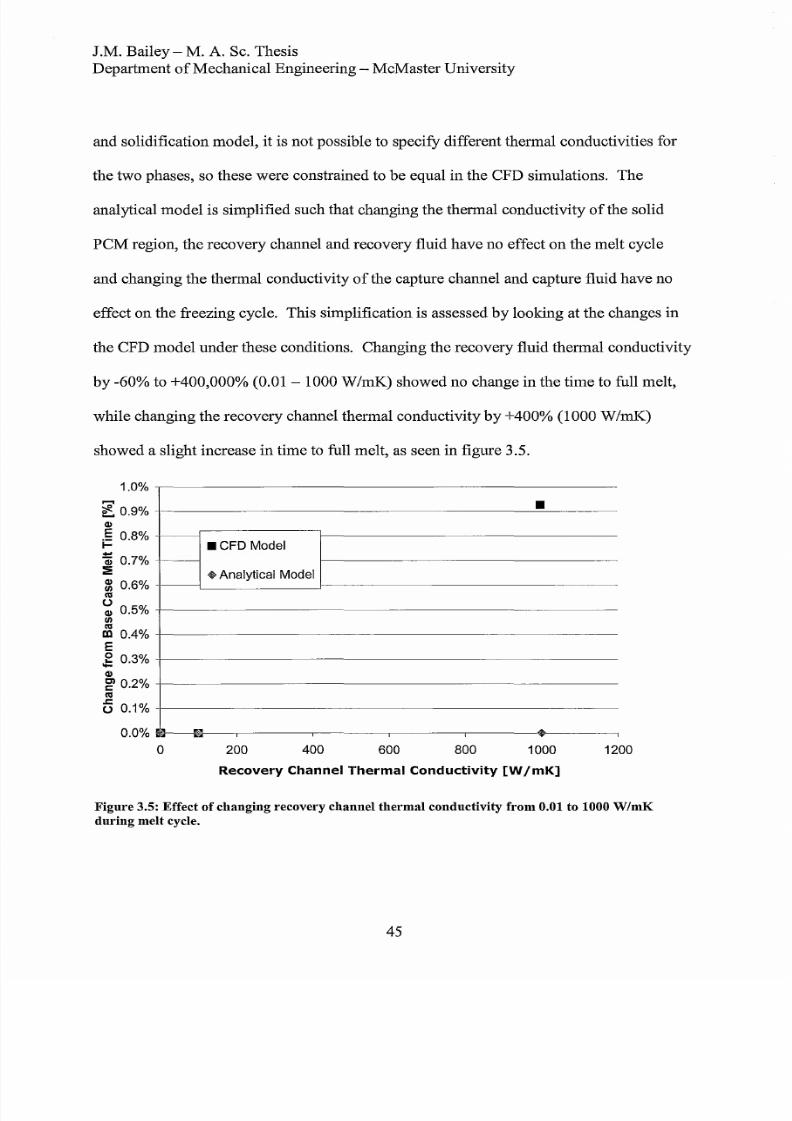
8/11/2019 Modelling Phase Change Material Thermal Storage
http://slidepdf.com/reader/full/modelling-phase-change-material-thermal-storage 61/173
J
.M. Bailey - M.
A.
Sc. Thesis
Department
of
Mechanical Engineering - McMaster University
and solidification model,
it
is not possible to specify different thermal conductivities for
the two phases, so these were constrained to
be
equal
in
the CFD simulations.
The
analytical model is simplified such that changing the thermal conductivity
of
the solid
PCM
region, the recovery channel and recovery fluid have no effect
on
the melt cycle
and changing the thermal conductivity
of
the capture channel and capture fluid have no
effect
on
the freezing cycle. This simplification is assessed
by
looking at the changes in
the CFD model under these conditions. Changing the recovery fluid thermal conductivity
by
-60 to +400,000 (0.01 - 1000
W/mK
showed no change in the time to full melt,
while changing the recovery channel thermal conductivity
by
+400 (1000
W/mK
showed a slight increase in time to full melt, as seen in figure 3.5.
1.0
~ 0 . 9
Q)
§
0.8
0.7
:2:
l 0.6
I ll
~ 0.5
U
I ll
n 0.4
E
g 0.3
Q)
0.2
I ll
c
) 0.1
0.0
'
-
o
•
CFD
Model
• Analytical Model
1>
200
400
600 800 1000
Recovery
hannel
Thermal Conductivity [W mK]
I
1200
Figure 3.5: Effect of changing recovery channel thermal conductivity from 0.01 to 1000
W mK
during melt cycle.
45
8/11/2019 Modelling Phase Change Material Thermal Storage
http://slidepdf.com/reader/full/modelling-phase-change-material-thermal-storage 62/173
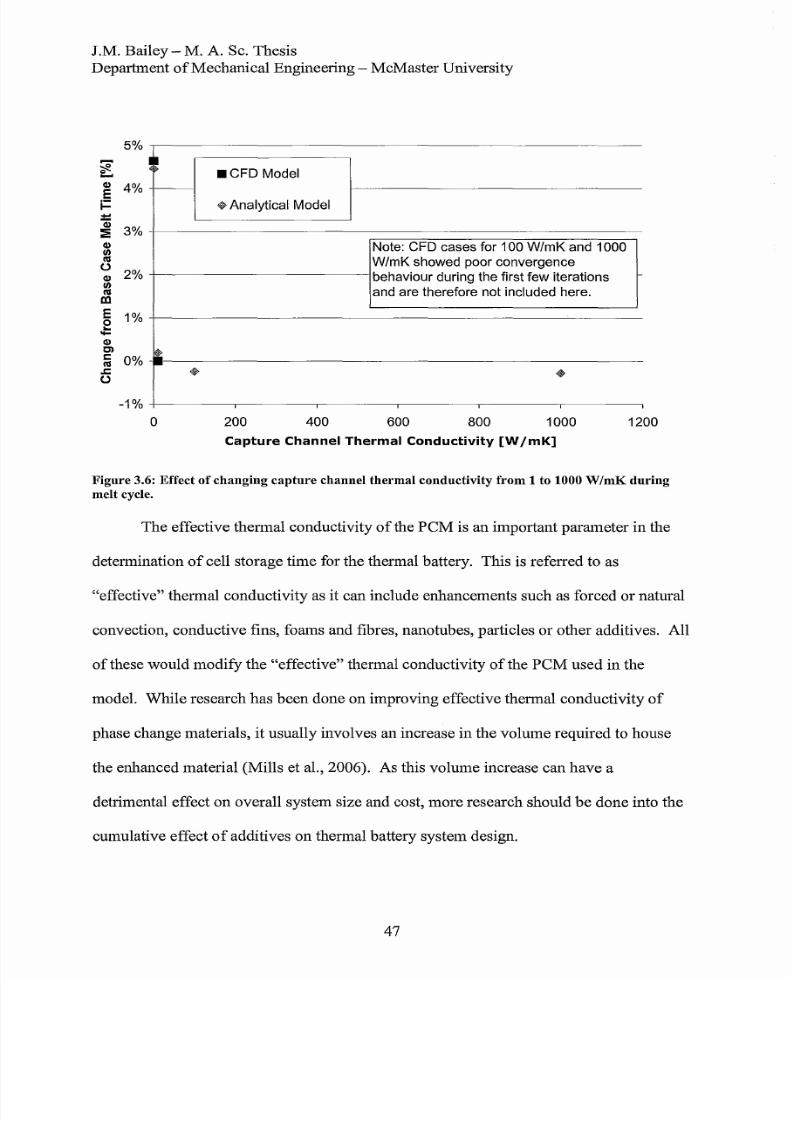
8/11/2019 Modelling Phase Change Material Thermal Storage
http://slidepdf.com/reader/full/modelling-phase-change-material-thermal-storage 63/173
J .M. Bailey - M. A. Sc. Thesis
Department
of
Mechanical Engineering - McMaster University
5%
-
.-
CFD
Model
a
4%
E
i
wAnalytical Model
-
jj
3%
?E
a
III
Note: CFD cases for 100 W/mK and 1000
tU
u
2%
III
tU
OJ
W/mK showed poor convergence
behaviour during the first few iterations
and are therefore not included here.
E
1%
0
a
C
c
0%
U
t
-
c
U
w
+
-1%
o 200 400 600 800
1000 1200
Capture
hannel
Thermal
Conductivity [W
mK]
Figure 3.6: Effect of changing
capture
channel thermal conductivity from 1 to 1000 W mK during
melt cycle.
The
effective thermal conductivity
of
the
PCM
is an important parameter
in
the
determination
of
cell storage time for the thermal battery. This is referred to as
effective thermal conductivity as it can include enhancements such as forced or natural
convection, conductive fins, foams and fibres, nanotubes, particles or other additives. All
of
these would modify the effective thermal conductivity
of
the
PCM
used in the
model. While research has
been
done
on
improving effective thermal conductivity
of
phase change materials,
it
usually involves an increase
in
the volume required to house
the enhanced material (Mills et aI., 2006). As this volume increase can
have
a
detrimental effect
on
overall system size and cost,
more
research should be done into the
cumulative effect
of
additives
on
thermal battery system design.
7

8/11/2019 Modelling Phase Change Material Thermal Storage
http://slidepdf.com/reader/full/modelling-phase-change-material-thermal-storage 64/173
J M. Bailey - M. A. Sc. Thesis
Department of Mechanical Engineering - McMaster University
In
order to ensure that a change
in
the effective thermal conductivity
of
the PCM
produces realistic results
in
the analytical model, these changes are compared to the same
change
in
the CFD model. Figure 3.7 shows the percentage difference
in
total melt time
for three different effective P M thermal conductivities that extend beyond the expected
range for low melt temperature
P M
enhancements found
in
Zalba et al. (2003). The two
models show very good agreement
in
the effect
of
changing effective
P M
thermal
conductivity. The comparative sensitivity studies for the various thermal conductivities
used in both the CFD and analytical models therefore show good agreement, which lends
confidence to the simplifications made in the analytical model.
60
Q)
E 40
i=
20
Q)
1/1
ctI
.) 0
Q)
1/1
ctI
O
-20
E
e
Q) -40
C
c
ctI
<3
-60
-80
o
CFD Model
$ Analytical Model
,
20
40
60
80
100
Effective PCM Thermal Conductivity [W mK]
Figure 3.7: Effect
of
changing effective
P M
thermal conductivity
from
0.1 to 100
W/mK
48
-
120
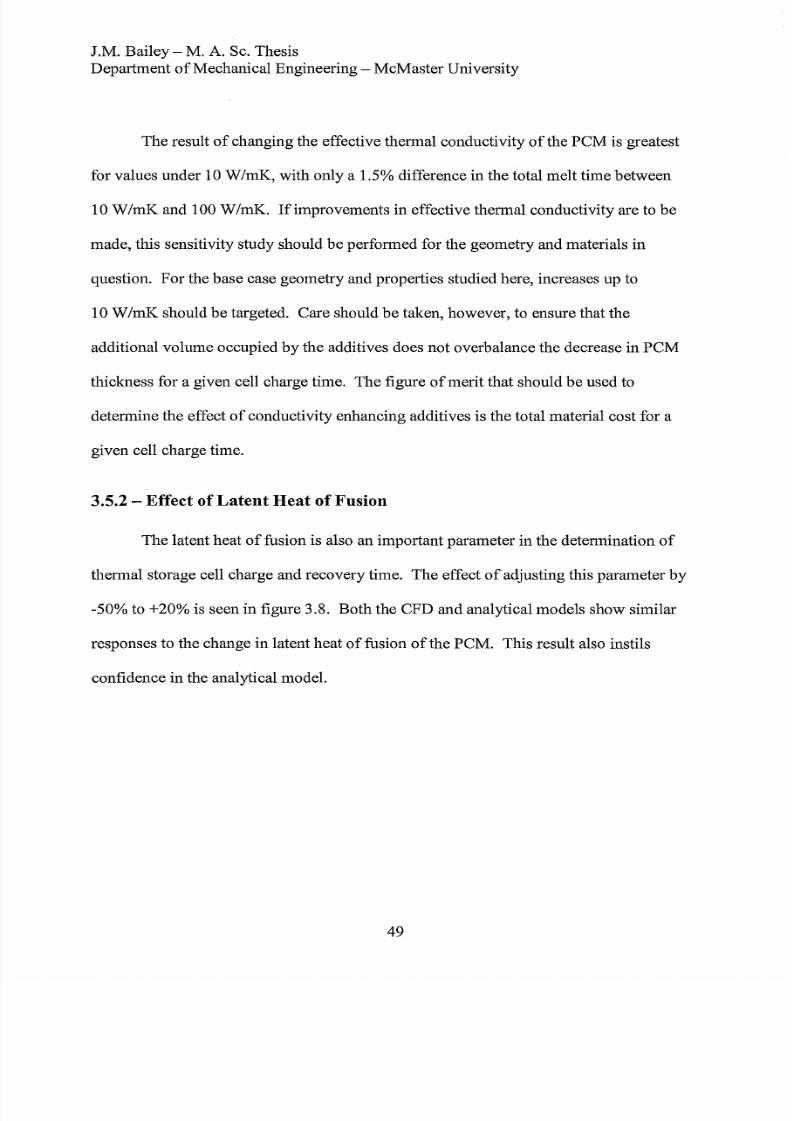
8/11/2019 Modelling Phase Change Material Thermal Storage
http://slidepdf.com/reader/full/modelling-phase-change-material-thermal-storage 65/173
J .M. Bailey - M.
A
Sc. Thesis
Department
of
Mechanical Engineering - McMaster University
The
result
of
changing the effective thermal conductivity
of
the PCM is greatest
for values under 10
W/mK
with only a 1.5 difference
in
the total melt time between
1
W mK
and 100
W/mK.
Ifimprovements
in
effective thermal conductivity are to be
made, this sensitivity study should be performed for the geometry and materials
in
question. For the base case geometry and properties studied here, increases up to
1 W mK
should
be
targeted. Care should be taken, however, to ensure that the
additional volume occupied
by
the additives does
not
overbalance the decrease
in P M
thickness for a given cell charge time.
The
figure
of
merit that should be used to
determine the effect
of
conductivity enhancing additives is the total material cost for a
given cell charge time.
3.5.2 Effect o Latent Heat o Fusion
The
latent heat
of
fusion is also an important parameter
in
the determination
of
thermal storage cell charge and recovery time.
The
effect
of
adjusting this parameter
by
-50 to +20 is seen in figure 3.8. Both the CFD and analytical models show similar
responses to the change
in
latent heat
of
fusion
of
the PCM. This result also instils
confidence
in
the analytical model.
49
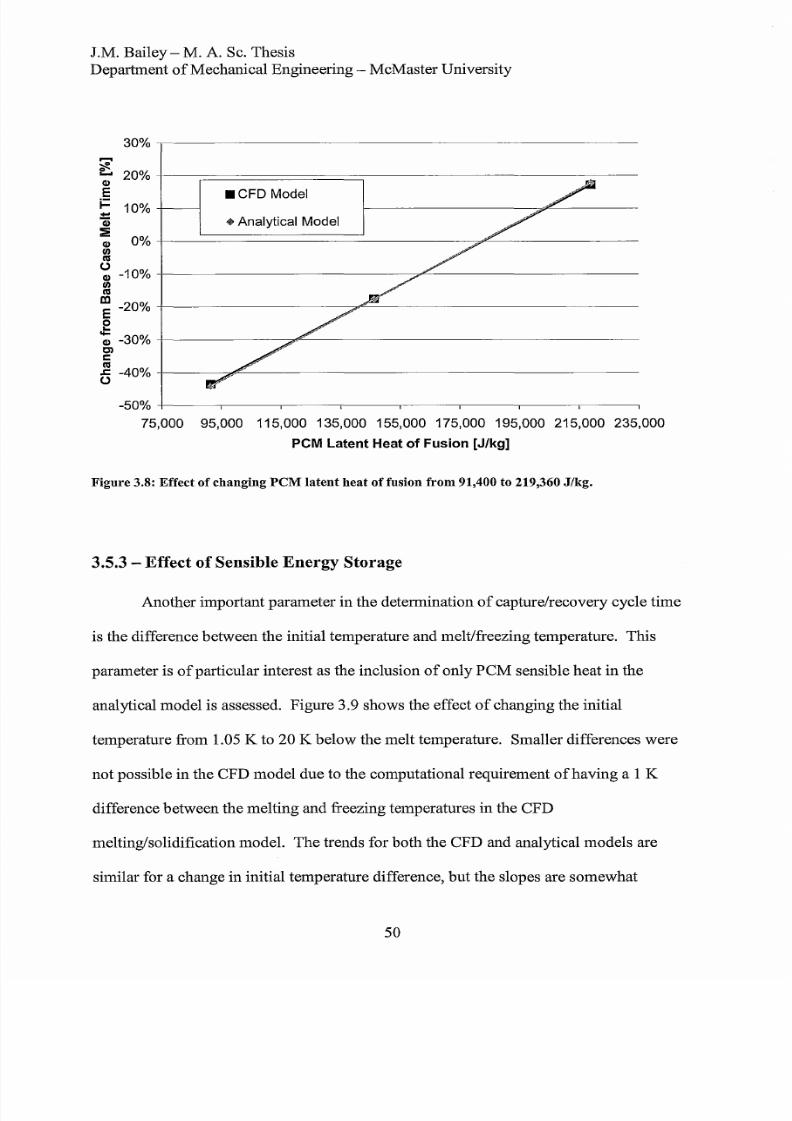
8/11/2019 Modelling Phase Change Material Thermal Storage
http://slidepdf.com/reader/full/modelling-phase-change-material-thermal-storage 66/173
J.M. Bailey - M. A. Sc. Thesis
Department of Mechanical Engineering - McMaster University
3 0 . - - - - - - - - - - - - - - - - - - - - - - - - - - - - - - - - - - - - - - - - - - - - - - - - - - - - -
~
~
2 0 t - - - ~ = = = = = = = = = = = = = = = = ~ - - - - - - - - - - - - - - - - - - - - - - ~ ~ - - - -
E
CFD
Model
j 1
0
+-----1
G> Analytical Model
~ O - - - ~ = = = = = = = = = = = = = = = = ~ - - - - - - - - - - ~ ~ ~ - - - - - - - - - - - - -
m
o
- 1 0 + - - - - - - - - - - - - - - - - - - - - - - - - - - - ~ ~ - - - - - - - - - - - - - - - - - - - - - -
III
IV
~
-20
- - - - - - - - - - - - - - - - - - - ~ ~ - - - - - - - - - - - - - - - - - - - - - - - - - - - - - -
g
- 3 0 + - - - - - - - - - - - - - ~ ~ - - - - - - - - - - - - - - - - - - - - - - - - - - - - - - - - - - -
C )
I
IV
~
-40
- - - - - ~ ~ - - - - - - - - - - - - - - - - - - - - - - - - - - - - - - - - - - - - - - - - - - -
o
-50 - - - - - ~ - - - - ~ - - - - - - ~ - - - - ~ - - - - ~ - - - - - - ~ - - - - ~ - - - - - .
75,000 95,000 115,000 135,000 155,000 175,000 195,000 215,000 235,000
PCM Latent Heat o Fusion [J kg]
Figure 3.8: Effect of changing
P M
latent
heat
of fusion from 91,400 to 219,360 J/kg.
3.5.3 Effect of Sensible Energy Storage
Another important parameter in the determination
of
capture/recovery cycle time
is the difference between the initial temperature and melt/freezing temperature. This
parameter is
of
particular interest as the inclusion
of
only PCM sensible heat in the
analytical model is assessed. Figure 3.9 shows the effect
of
changing the initial
temperature from 1.05 K to 20 K below the melt temperature. Smaller differences were
not possible in the CFD model due to the computational requirement
of
having a 1 K
difference between the melting and freezing temperatures in the CFD
melting/solidification model. The trends for both the CFD and analytical models are
similar for a change in initial temperature difference, but the slopes are somewhat
50
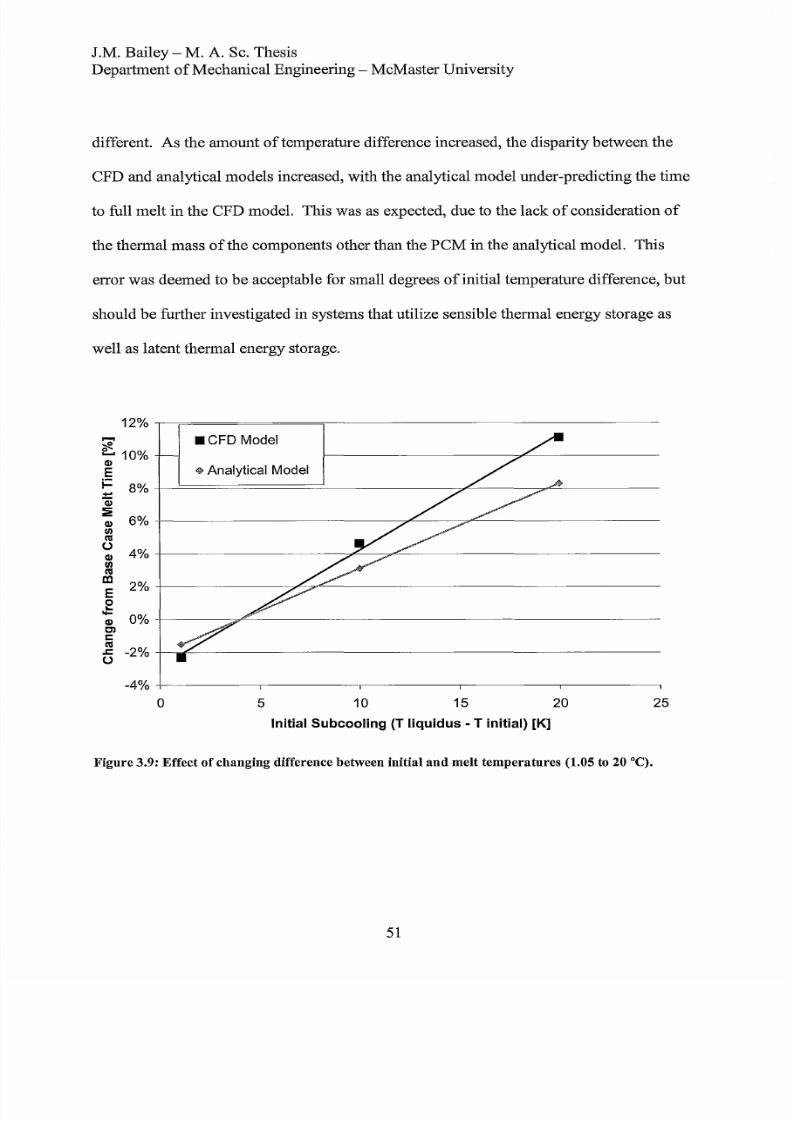
8/11/2019 Modelling Phase Change Material Thermal Storage
http://slidepdf.com/reader/full/modelling-phase-change-material-thermal-storage 67/173
J.M. Bailey - M.
A
Sc. Thesis
Department
of
Mechanical Engineering - McMaster University
different.
As
the amount of temperature difference increased, the disparity between the
CFD and analytical models increased, with the analytical model under-predicting the time
to full melt
in
the CFD model. This was as expected, due to the lack
of
consideration
of
the thermal mass of the components other than the
PCM in
the analytical model. This
error was deemed to
be
acceptable for small degrees
of
initial temperature difference,
but
should
be
further investigated in systems that utilize sensible thermal energy storage as
well as latent thermal energy storage.
1 2 . - r = = = = = = = = = = = = = = = ~ = = - - - - - - - - - - - - - - - - - - - - - - - - - - - - - - - - - -
.-.
~
e 10
Q)
E
CFD Model
w Analytical Model
~ 8 + - ~ = = = = = = = = = = = = = = = - - - - - - - - - - - - - ~ ~ - - - - - - ~ ~ - - - - - - - - -
-
:
Q) 6 + - - - - - - - - - - - - - - - - - - - - - - - - - ~ ~ - - - - ~ ~ - - - - - - - - - - - - - - - - -
II
CIS
)
Q)
4 + - - - - - - - - - - - - - - - - - - - ~ ~ ~ ~ - - - - - - - - - - - - - - - - - - - - - - - - - - -
II
CIS
~
2
+ - - - - - - - - - - - - - - 7 ~ . ~ - - - - - - - - - - - - - - - - - - - - - - - - - - - - - - - - - - - -
g
Q) 00/0 - - - - - - - ~ ~ - - - - - - - - - - - - - - - - - - - - - - - - - - - - - - - - - - - - - - - - - - -
CI
C
CIS
~
-2 + - ~ ~ - - - - - - - - - - - - - - - - - - - - - - - - - - - - - - - - - - - - - - - - - - - - - - - - -
)
-4 ---------- ,---------- ,---------- ,---------- ,---------- ,
o
5
10
15
20
25
Initial Subcooling T liquidus - T initial [K]
Figure 3.9: Effect of changing difference between initial and melt temperatures (1.05 to 20°C).
51
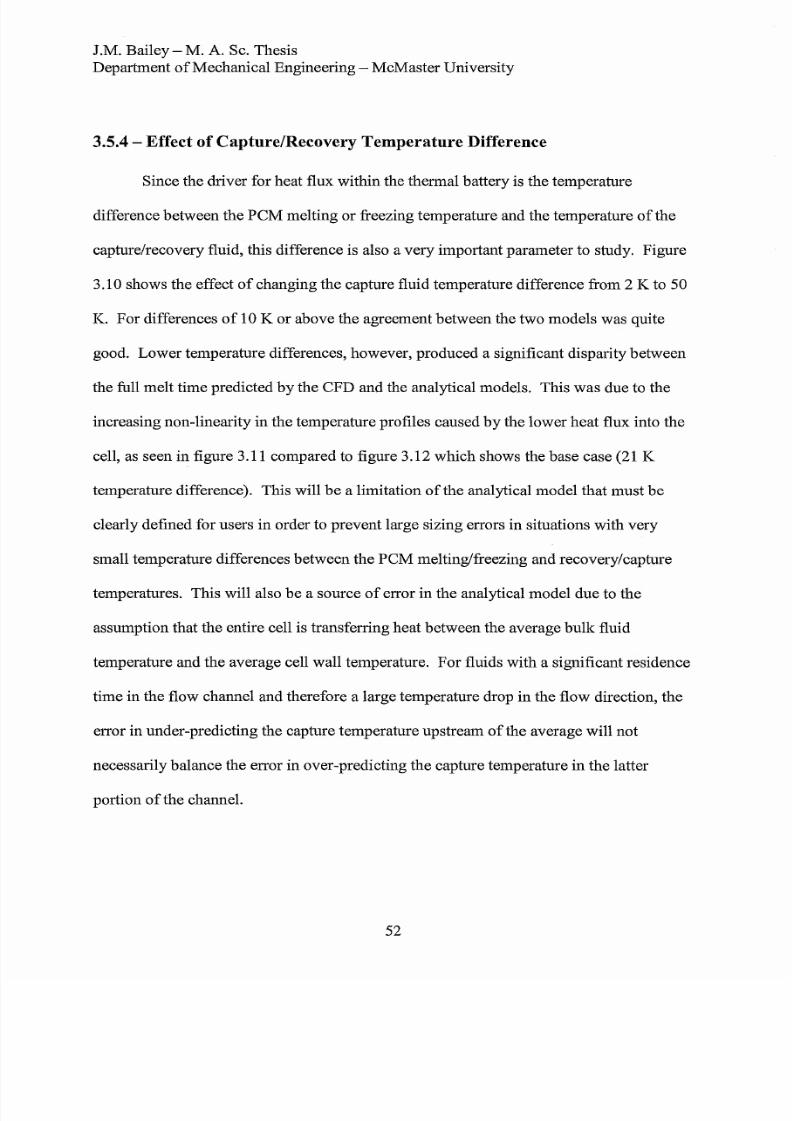
8/11/2019 Modelling Phase Change Material Thermal Storage
http://slidepdf.com/reader/full/modelling-phase-change-material-thermal-storage 68/173
J .M. Bailey - M.
A
Sc. Thesis
Department
of
Mechanical Engineering - McMaster University
3.5.4 Effect o CapturelRecovery Temperature Difference
Since the driver for heat flux within the thermal battery is the temperature
difference between the
P M
melting or freezing temperature and the temperature of the
capture/recovery fluid, this difference is also a very important parameter to study. Figure
3.10 shows the effect
of
changing the capture fluid temperature difference from 2 K to 50
K
For differences
of
10 K
or
above the agreement between the two models was quite
good. Lower temperature differences, however, produced a significant disparity between
the full melt time predicted
by
the CFD and the analytical models. This
was
due to the
increasing non-linearity in the temperature profiles caused by the lower heat flux into the
cell, as seen
in
figure 3.11 compared to figure 3.12 which shows the base case 21 K
temperature difference). This will
be
a limitation
ofthe
analytical model that must
be
clearly defined for users
in
order to prevent large sizing errors
in
situations with very
small temperature differences between the PCM melting/freezing and recovery/capture
temperatures. This will also
be
a source
of
error
in
the analytical model due to the
assumption that the entire cell is transferring heat between the average bulk fluid
temperature and the average cell wall temperature.
For
fluids with a significant residence
time in the flow channel and therefore a large temperature drop
in
the flow direction, the
error in under-predicting the capture temperature upstream
of
the average will not
necessarily balance the error
in
over-predicting the capture temperature in the latter
portion of the channel.
52

8/11/2019 Modelling Phase Change Material Thermal Storage
http://slidepdf.com/reader/full/modelling-phase-change-material-thermal-storage 69/173
J.M. Bailey - M.
A.
Sc. Thesis
Department of Mechanical Engineering - McMaster University
1000
•
)
800
E
j::
-
i
•
CFD
Model
:
600
c-
Q)
If
• Analytical Model
cu
u
400
)
If
cu
ttl
E
200
0
a
Q)
6
Cl
c
0
u
.c
,)
'
'
-200
o
10
20
30 40 50
dT Capture T Capture - T PCM melt) [K]
Figure 3.10: Effect of changing the capture fluid temperature difference 2 to
50
0q.
318 .5 , - - - - - - - - - - - - - - - - - - - - - - - - - - - -
•
18.0 ~ .
~
Z
; - 317.5
+-------
• . -
.
E \
8.
•
E 317.0 ~ .
~
.
316.5 -----------. -------------------
,
~
...................
.
316.0 - - - - - - - - . - - - - - - - - - .- - - - - - - , - - - - .- - - - - - - - - , - - - - - - - - .- - - - - - - , - - - - - - - ,
60
o
0.002 0.004 0.006 0.008
0.01 0.012 0.014 0.016
Position [m]
Figure 3.11: CFD temperature profIle at 50 melt for a
dT Capture
of 2K.
53

8/11/2019 Modelling Phase Change Material Thermal Storage
http://slidepdf.com/reader/full/modelling-phase-change-material-thermal-storage 70/173
J.M. Bailey M. A Sc. Thesis
Department
of
Mechanical Engineering - McMaster University
332
330
328
326
Q)
324
322
E
320
318
316
314
\
•
\
•
a
0.002
\
•
•
•
\
•
0.004 0.006 0.008 0.01 0.012
osition [m]
.
.
0.014
Figure 3.12: CFD base case temperature profIle at 50 melt for a dT Capture of 21K.
3.5.5 - Effect
of
Dimensional Changes
0.016
The effect
of
changing the cell dimensions was investigated
by
producing several
more meshes with the same boundary conditions as the base case, but different
thicknesses for each
of
the four materials. The first geometries investigated were
doubling or halving the PCM thickness. The time to melt the same thickness of PCM,
0.016 m, was compared. The base case and doubled thickness were found to have the
same melt time, but the halved case took 3 longer than the base case. This supports the
analytical model assumption that the geometry past the melt front has very little effect
on
the melt time.
This hypothesis was further investigated by testing a fourfold increase in the
thicknesses of the recovery channel and recovery fluid. This geometric change resulted
54

8/11/2019 Modelling Phase Change Material Thermal Storage
http://slidepdf.com/reader/full/modelling-phase-change-material-thermal-storage 71/173
J.M. Bailey - M.
A
Sc. Thesis
Department of Mechanical Engineering - McMaster University
in a 4 decrease in the time to
h lf
melt but only a 2 decrease in final melt time over
the base case final melt time. These small changes for large geometry changes
in
the
region beyond the phase change material further support the model assumption that
nearly all of the heat flux is absorbed in the phase change front.
The final geometric parameter to
be
analyzed
in
the conduction-only model was
the thickness of the capture channel. This was increased by twofold from the base case
and resulted
in
a 1 increase in the time to both 50 and 100 melt over the base case.
The very small changes in melt time resulting from geometric changes in the
capture and recovery channels show that any error in estimating the size and thickness
of
these portions of the phase change thermal energy storage cell will not have a significant
effect on the sizing of the system. This is an important finding, as it further supports the
use of the analytical model for initial thermal battery assessment without knowledge of
the detailed design.
3.5.6 Effect o CapturelRecovery Convective Heat Transfer Coefficient
Since this study focuses on laminar flow through the capture/recovery channel,
the convective heat transfer coefficient does not change with flow rate in this range. The
analytical model, however, was compared to CFD results for convective heat transfer
coefficients of 10 to 10,000 W/m
2
K
in
order to ensure that the sensitivity showed the
proper trends. Figure 3.13 shows this comparison with good agreement between the two
models.
t
also shows almost no advantage to increasing the heat transfer coefficient
above 1000 W/m
2
K for the analyzed geometry and properties.
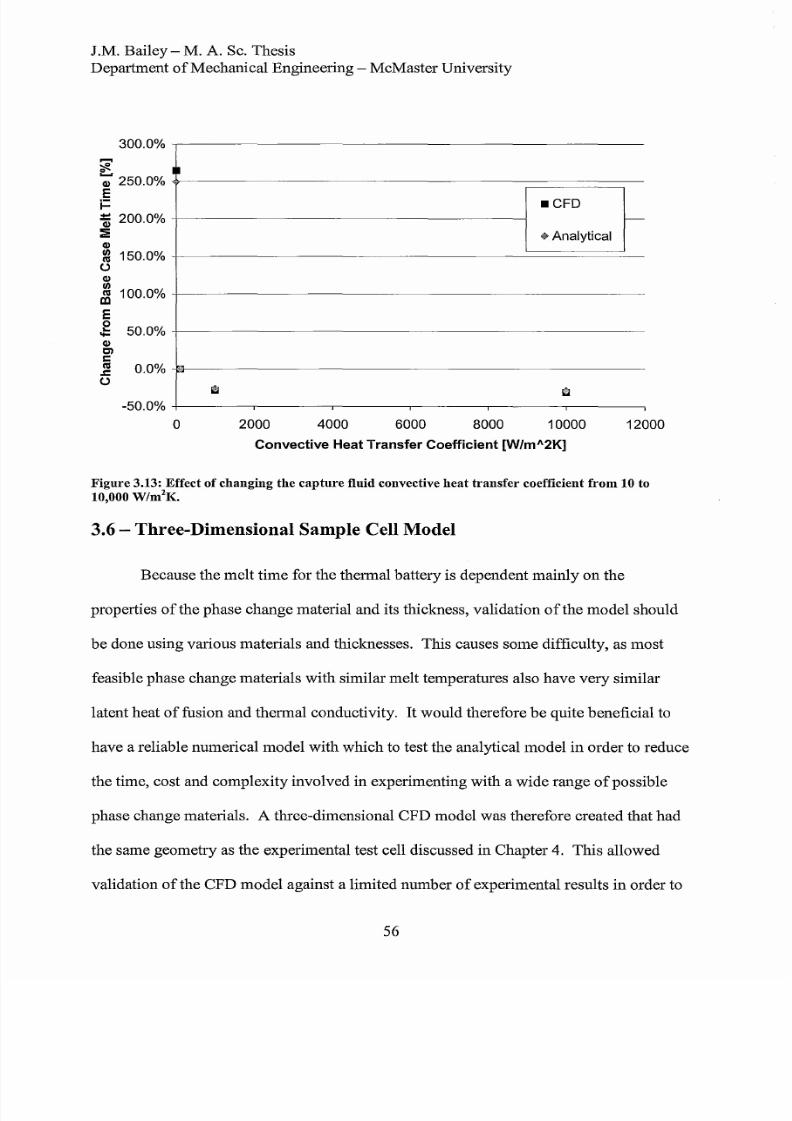
8/11/2019 Modelling Phase Change Material Thermal Storage
http://slidepdf.com/reader/full/modelling-phase-change-material-thermal-storage 72/173
J.M. Bailey - M. A. Sc. Thesis
Department of Mechanical Engineering - McMaster University
300.0
e
0 250.0
E
j::
.CFD
200.0
:: i
0
nalytical
II
150.0
IS
)
0
II
100.0
IS
III
E
0
50.0
0
C)
c
CIS
0.0
c
u
if I
It l
-50.0
o
2000 4000
6000 8000 10000 12000
Convective Heat Transfer Coefficient [W/mA2K]
Figure 3.13: Effect of changing the capture fluid convective heat transfer coefficient from 10 to
10 000
m
2
K
3.6 - Three-Dimensional
Sample
Cell Model
Because the melt time for the thermal battery is dependent mainly on the
properties of the phase change material and its thickness validation of the model should
be
done using various materials and thicknesses. This causes some difficulty as most
feasible phase change materials with similar melt temperatures also have very similar
latent heat of fusion and thermal conductivity. It would therefore be quite beneficial to
have a reliable numerical model with which to test the analytical model in order to reduce
the time cost and complexity involved in experimenting with a wide range
of
possible
phase change materials. A three-dimensional CFD model was therefore created that
had
the same geometry as the experimental test cell discussed
in
Chapter 4. This allowed
validation
of
the CFD
model
against a limited number
of
experimental results in order to
56

8/11/2019 Modelling Phase Change Material Thermal Storage
http://slidepdf.com/reader/full/modelling-phase-change-material-thermal-storage 73/173
J .M. Bailey - M. A. Sc. Thesis
Department
of
Mechanical Engineering - McMaster University
increase confidence
in
using CFD to investigate
the
effects
of
material properties and
geometry changes.
3 6 1 Lauric cid Storage Cell
A model
of
the experimental set
up
using lauric acid as the phase change material
was created to compare
the
results
of
the testing
with
those
of
the CFD model.
Some
simplifications were
made
to facilitate geometry creation and meshing
of
the CFD model.
Sensor geometries were not included after it was discovered that this increased the mesh
size well above the hardware capabilities. It was initially
unknown if
the presence
of
a
baffle would significantly change the results
of the
CFD model, and a simplified
geometry was therefore modeled to determine whether
or
not it should
be
included.
Based
on
the results
of
this simple rectangular
prism
geometry
of
similar dimensions to
the test cell modeled
with
and without a 2
mm
thick baffle,
it was
seen that the baffle
only
changed the fmal
melt
time by 0.1 .
For
this reason the test cell geometry modeled
in
the 3D CFD simulations did not contain a baffle.
ue
to the occurrence
of
sliver elements caused
by any
profiles coming together
with
a mating part
with
square comers, as seen in figure 3.14 all geometries were
approximated as having square comers rather than filleted ones. Fittings and hoses were
not included
in
the 3D CFD model. Instead, 50 mm inlet and outlet tubes were added
above the top
of
the flow channel to capture the turning
of
the fluid
in
these regions.
These simplifications resulted
in
the geometry secn
in
figure 3.15.
57

8/11/2019 Modelling Phase Change Material Thermal Storage
http://slidepdf.com/reader/full/modelling-phase-change-material-thermal-storage 74/173
J.M. Bailey M. A. Sc. Thesis
Department
o
Mechanical Engineering McMaster University
Figure 3.14: Sliver elements at junction o rounded and non rounded parts.
Figure 3.15: Lauric Acid storage cell CFD model geometry.
58
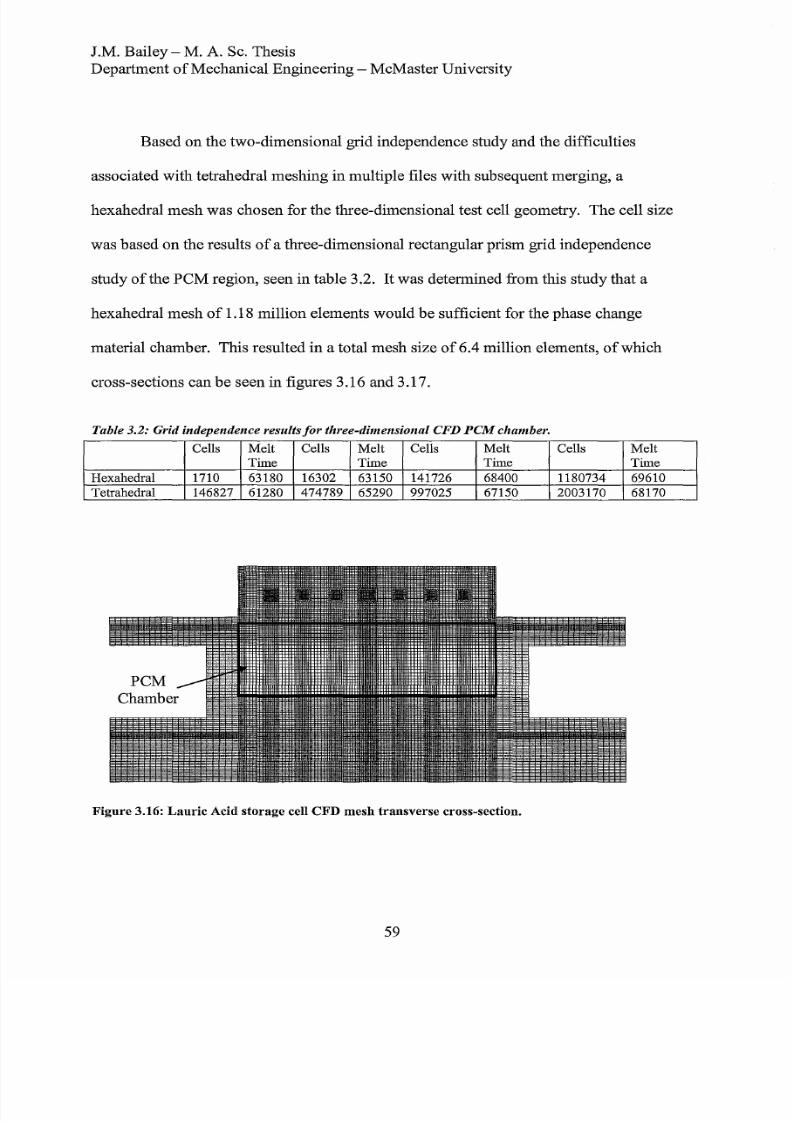
8/11/2019 Modelling Phase Change Material Thermal Storage
http://slidepdf.com/reader/full/modelling-phase-change-material-thermal-storage 75/173
J.M. Bailey - M. A. Sc. Thesis
Department
of
Mechanical Engineering - McMaster University
Based
on
the two-dimensional grid independence study and the difficulties
associated
with
tetrahedral meshing
in
multiple files with subsequent merging a
hexahedral
mesh
was chosen for the three-dimensional test cell geometry.
The
cell size
was based
on
the results
of
a three-dimensional rectangular prism grid independence
study
ofthe
P M
region seen
in
table 3.2. It was determined from this study that a
hexahedral
mesh of
1.18 million elements would
be
sufficient for the
phase
change
material chamber. This resulted
in
a total mesh size
of
6.4 million elements
of
which
cross-sections can
be seen in
figures 3.16 and 3.17.
Table 3.2: Grid independence results for three dimensional CFD P M chamber.
Cells Melt Cells
Melt
Cells Melt Cells
Melt
Time
Time
Time
Time
Hexahedral 171 6318 163 2 6315 141726 684 1180734 6961
Tetrahedral
146827 6128
474789
6529
997 25
6715
2003170
6817
Figure 3.16:
Lauric
Acid storage cell FD mesh transverse cross-section.
59
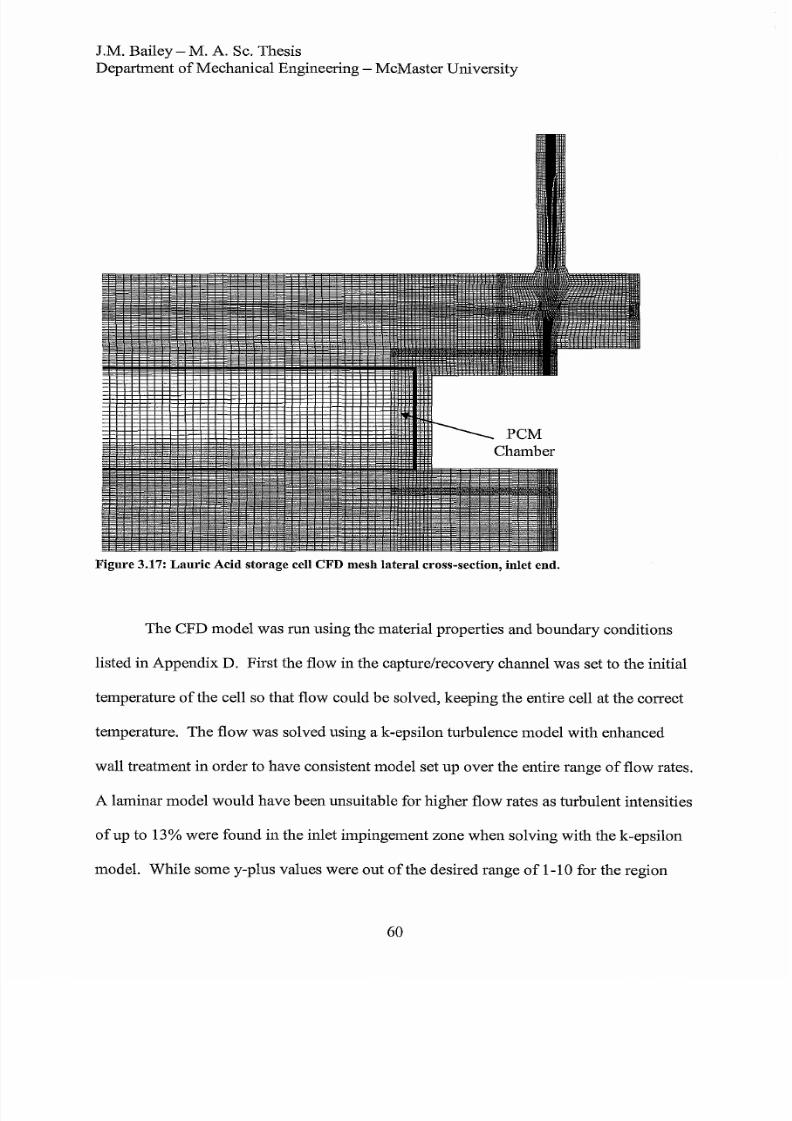
8/11/2019 Modelling Phase Change Material Thermal Storage
http://slidepdf.com/reader/full/modelling-phase-change-material-thermal-storage 76/173
1.M. Bailey - M.
A
Sc. Thesis
Department ofMechanical Engineering - McMaster University
Figure 3.17: auric Acid storage cell CFD mesh lateral cross-section, inlet end.
The CFD model was run using the material properties and boundary conditions
listed
in
Appendix D. First the flow in the capture/recovery channel was set to the initial
temperature
of
the cell so that flow could
be
solved, keeping the entire cell at the correct
temperature. The flow was solved using a k-epsilon turbulence model with enhanced
wall treatment
in
order to have consistent model set up over the entire range
of
flow rates.
A laminar model would have been unsuitable for higher flow rates as turbulent intensities
ofup to 13 were found in the inlet impingement zone when solving with the k-epsilon
model. While some y-plus values were out of the desired range
of
1-10 for the region
6
8/11/2019 Modelling Phase Change Material Thermal Storage
http://slidepdf.com/reader/full/modelling-phase-change-material-thermal-storage 77/173
J.M. Bailey - M. A Sc. Thesis
Department ofMechanical Engineering - McMaster University
where the inlet flow impinges on the flow channel bottom, this region is not in contact
with the phase change material chamber and refmement
of
the cells would have caused a
large increase in the total number of cells in the model. However, based on the location
ofthe
cells, away from the main heat transfer zone, and the maximum y-plus of only 13,
the small errors caused by these y-plus values were not expected to have a significant
effect on the solution. Utilization of the k-epsilon turbulence model for predominantly
laminar flow was verified for a flow rate
of
0.00435 kg/s using a laminar model and the
two solutions were found to be within 3.2 for both average and maximum velocity.
The resulting time to full melt predicted
by
both models was 8.2 hours.
n
additional
solution was also performed with a higher water flow rate
of
0.0266 kg/s to match
additional experimental conditions. The melt time predicted by this model was 8.0 hours.
This slight decrease in melt time makes sense, as it would
be
expected that a higher flow
rate would cause slightly higher local heat transfer coefficients, as the flow is not
everywhere laminar and fully developed and therefore a slightly shorter time to full melt.
6

8/11/2019 Modelling Phase Change Material Thermal Storage
http://slidepdf.com/reader/full/modelling-phase-change-material-thermal-storage 78/173
J.M. Bailey - M. A Sc. Thesis
Department ofMechanical Engineering - McMaster University
CHAPTER
4 Test Facility
4 1
Test Cell Design Criteria and Constraints
In order to ensure that the analytical and numerical models produced valid results,
a test apparatus was designed to compare predicted melt and solidification times.
Constraints to ensure that the test apparatus would adequately test the predictions
of
both
the analytical and numerical phase change material thermal storage models were:
• Able to measure the position and width
of
the melt front
in
the phase change
material to within 10% of the full melt thickness (enough to check
if
there is a
significant mushy zone but still a reasonable spacing for 1/16 thermocouples)
• Able to simultaneously record temperature, heat flux and flow data at an adequate
rate to capture the transient behaviour
of
the melting and solidification processes
(minimum 1 sample set per 10 seconds in order to obtain enough data to capture
the transient behaviour)
• Insulated such that the thermal losses are either reduced to <10%
of
the total heat
transfer or are known to within <10% ofth total heat transfer (to more closely
approximate a real system, which would need excellent insulation in order to
prevent wasted thermal energy)
• Able to accommodate expansion and contraction
ofth
PCM during the entire
range
of
temperatures and states
of
the test matrix (different PCMs will have
62

8/11/2019 Modelling Phase Change Material Thermal Storage
http://slidepdf.com/reader/full/modelling-phase-change-material-thermal-storage 79/173
I.M.
Bailey M.
A. Sc. Thesis
Department of Mechanical Engineering - McMaster University
different expansion coefficients, but the rig constraint is accommodation of up to
20 change
in
volume)
• Initial temperature of the cell controllable to within 1 °C to ensure a known initial
condition and guarantee full melt
or
solidification
• Measurement capabilities for temperature profile within the PCM and
capture/recovery flow rate
• Thermal energy source and sink: temperature controllable to within 2 °C to keep
the fluctuations in the capture
or
recovery fluid temperature to a minimum.
Criteria to
make
the test apparatus effective and easy to use included:
• Easy to assemble and clean
• Safe to handle during set up and operation
• Ease
of
adding and removing
PCM
• Compact and light-weight
• Robust for use with different thermal energy sources and sinks and suitable for a
wide range of operating temperatures
• Adjustable melt thicknesses
• Optically clear for visualization of melt front during some tests
• Large enough cross-section to evaluate one-dimensional assumptions, capable of
operating in multiple orientations to test gravitational effects
• Flexible for the addition of conductivity
or
convection enhancement devices
or
materials
6

8/11/2019 Modelling Phase Change Material Thermal Storage
http://slidepdf.com/reader/full/modelling-phase-change-material-thermal-storage 80/173
J.M. Bailey - M. A. Sc. Thesis
Department
of
Mechanical Engineering - McMaster University
• Modular to accommodate reuse
of
some components for different test conditions
and thermal cycling tests
The
test cell designed using these criteria and constraints is shown schematically
in
figure 4.1 with detailed geometry and test procedures
in
Appendices A and B.
Controlled
Temperature
Reservoir
Flow
apture
/ Recovery
Experimental Test
Facility
Water
n
Capture/Recovery Flow Channel
Moving 0
P M
Test
Cell
Water Out
l
I
Melt Front Lilluid
P M 0
Heat
Flux
Sensors
~ ~
SolidP M 0
Thermocouple Positions
P M Test
Cell Cross-Section Schematic
Figure 4.1: Schematic of the phase change material test cell.
64

8/11/2019 Modelling Phase Change Material Thermal Storage
http://slidepdf.com/reader/full/modelling-phase-change-material-thermal-storage 81/173
1.M. Bailey - M. A. Sc. Thesis
Department ofMechanical Engineering - McMaster University
4.2 Phase Change Material Chamber
The melt time for a PCM thermal battery is dependent largely
on
the PCM
properties and the melt thickness. This means that the thicker the PCM chamber is in the
melt direction, the longer it will take the cell to reach 100 melt. The melt thickness
chosen for the test apparatus was therefore a balance between reasonable melt time and
enough space for several temperature measurement devices along the thickness.
flanged modular design for the PCM chamber was therefore used such that different
thicknesses can e achieved y stacking several cells in series. The single cell thickness
is 40
mm
with room for 16 thermocouples placed
in
three columns. Since the
investigation
of
gravitational effects is eventually desirable, the cell design is a
rectangular cross-section with an aspect ratio of 4.5. This will allow evaluation of
convective currents in the vertical orientation with two different geometries, one with the
longer dimension aligned with gravity and one with the shorter dimension aligned with
gravity.
In
order to have large enough dimensions to reasonably approximate one-
dimensional heat transfer, the chamber width is 100 mm with a height of 460 mm. This
gives a single cell volume of 1.77 x 10
3
m
3
and a reasonable mass of PCM for handling,
assuming the specific gravity of the phase change material is between 0.9 and 2.1, as in
all the materials presented in tables 2.2 and 2.3. Despite the known volume of the PCM
chamber, the mass ofphase change material was verified using a scale with capacity of
5kg and precision
of
1.0g (Starfrit, 2009). The test cells were made from clear
65

8/11/2019 Modelling Phase Change Material Thermal Storage
http://slidepdf.com/reader/full/modelling-phase-change-material-thermal-storage 82/173
J .M. Bailey - M. A Sc. Thesis
Department ofMechanical Engineering - McMaster University
polycarbonate for potential visualization, but this was found to be unrealistic due to
insulation requirements and the opacity
of
the solid phase change material. Holes were
drilled in the short end of the peM in order to fill the chamber with plugs to allow some
leakage as the material melts and expands.
Attachment
of
the
peM
chamber to the capture/recovery flow channel and
backing plate was done using bolted flanges and gaskets. Additional test configurations
are possible using more than one
peM
chamber
in
series. The flanged design can
be
seen
in
figure 4.2 for the single
peM
cell. Up to four of these parts can
be
attached in series,
resulting
in
melt thicknesses
of
40 mm, 80 mm, 120 mm and 160 mm. Additional
adjustment
of
the melt thickness is possible by using a backing plate with a protrusion
into the
PCM
cell cavity. Two backing plates, one flat and one with an 18 mm protrusion
were fabricated giving additional melt thicknesses of 22 mm, 62 mm, 102 mm and
142 mm. Bolts were located, seven per side, at a spacing of7
mm
3 in). No bolt holes
were used along the shorter side of the rectangular peM chamber
in
order to
accommodate the capture and recovery module. Buna-N Nitrile) gaskets at 3.2 mm
118 in) thickness and a layer of silicone caulking were used to seal between flanges.
66

8/11/2019 Modelling Phase Change Material Thermal Storage
http://slidepdf.com/reader/full/modelling-phase-change-material-thermal-storage 83/173
J.M. Bailey M. A. Sc. Thesis
Department
of
Mechanical Engineering - McMaster University
Figure
4.2: Flanged
modular PCM chamber
design.
To facilitate temperature measurements a 2 mm thick 460 mm long
polycarbonate baffle was placed along the centre line of the peM chamber with a total of
18
1116 holes to keep each
of
the temperature measurement devices in their intended
location. A machined slot in the backing plate retains this baffle
in
place during
assembly and testing. Additional baffles can
be
fabricated easily for the multi-cell
configurations or different temperature measurement locations. The flat backing plate
and baffle assembly can
be
seen in figure 4.3. Detailed drawings and specifications for
all test components can
be
found
in
Appendix
A
67
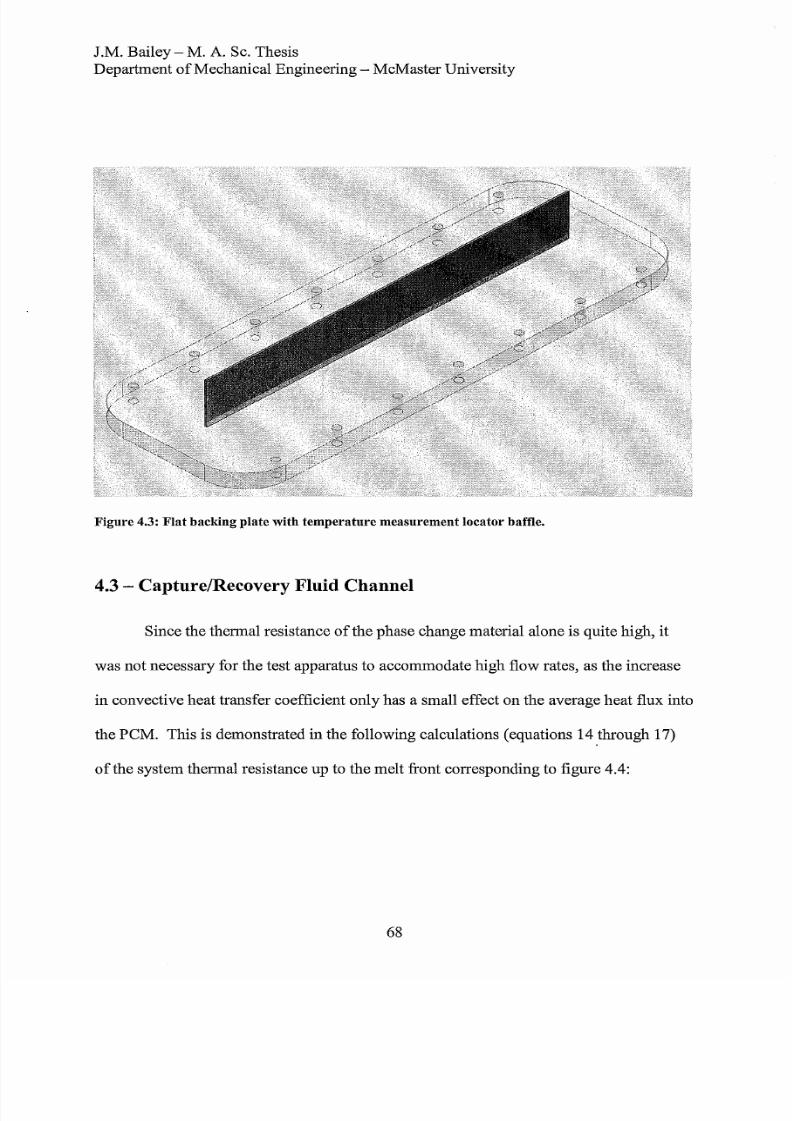
8/11/2019 Modelling Phase Change Material Thermal Storage
http://slidepdf.com/reader/full/modelling-phase-change-material-thermal-storage 84/173
J .M. Bailey - M.
A
Sc. Thesis
Department ofMechanical Engineering - McMaster University
Figure 4.3:
lat
backing plate with temperature measurement locator baffle.
4.3 CapturelRecovery Fluid Channel
Since the thermal resistance of the phase change material alone is quite high, it
was not necessary for the test apparatus to accommodate high flow rates, as the increase
in
convective heat transfer coefficient only has a small effect on the average heat flux into
the PCM. This is demonstrated in the following calculations equations 14 through 17)
of
the system thermal resistance up to the melt front corresponding to figure 4.4:
8

8/11/2019 Modelling Phase Change Material Thermal Storage
http://slidepdf.com/reader/full/modelling-phase-change-material-thermal-storage 85/173
J.M. Bailey - M. A. Sc. Thesis
Department
of
Mechanical Engineering - McMaster University
1
hcAc
Capture
Fluid
Capture
Channel
Wall
Xm
Liquid
PCM
Recovery
Solid Channel Recovery
PCM
Wall Fluid
Figure 4.4: Electr ical resistance analogy diagram for calculating the
heat
transfer resistance of a
phase change material cell.
14)
15)
16)
Xss
= 0.0032m
Xm
= 0 ~ 0 0 4 m kss = 202.4 W mK
k
pCM
= 0.17 W mK
1 T)
Thus the resistance of the flowing fluid has a greater effect at small values of X
m
the
distance the melt front has propagated into the PCM. However,
in
a real system
it
takes
time for the capture or recovery fluid flow to increase from zero at the initial condition to
9
8/11/2019 Modelling Phase Change Material Thermal Storage
http://slidepdf.com/reader/full/modelling-phase-change-material-thermal-storage 86/173
J
M. Bailey - M.
A
Sc. Thesis
Department of Mechanical Engineering - McMaster University
full velocity at the bulk fluid temperature. The resistance equation was therefore
considered when 10 and 90
of
the PCM has been melted.
((jllO melt
'---'
@90 melt
In order for the convection to comprise at least 5 of the thermal resistance with
an estimated hydraulic diameter of 0.03m and a fluid conductivity of 0.6 W mK and
Prandtl number of 4.44, the value ofhe (the convective heat transfer coefficient) would
have to be less than 900 at 10 melt and less than 100 at 90 melt. This means that
increasing the convective heat transfer coefficient above 1000 would have only a small
effect on the time required for 100 of the PCM to melt.
It
was therefore decided that
the flow channel would be designed for a fmal temperature drop
of
approximately 1 °C
and laminar flow.
The working fluid in the capture/recovery flow channel is water at temperatures
between 5°C and 75°C. Using an estimated heat flow value of90 W towards the end of
the test, as determined from the quasi-steady resistance analysis shown in figure 4.4, the
maximum flow rate for a 1 °C temperature difference was 0.0043 kg/s (0.26 LPM). The
flow rate range for the test apparatus was therefore set to 0.0043 kg/s to 0.0266 kg/s
(0.26 to 1.6 LPM).
With the given fluid and flow rate range, the internal cross-sectional dimensions
to give laminar Reynolds numbers were calculated using equations
8
through 20.
70
8/11/2019 Modelling Phase Change Material Thermal Storage
http://slidepdf.com/reader/full/modelling-phase-change-material-thermal-storage 87/173
I M
Bailey - M.
A
Sc. Thesis
Department of Mechanical Engineering - McMaster University
therefore
D
_ A
P
ReJl
p
m
p m
ReJl
18)
19)
20)
This resulted in a channel perimeter of 0.228 m for a Reynolds number of 170 at the low
mass flow and 1000 at the high flow. Since the PCM chamber minus a reasonable
material thickness was 95
mm
wide, the required depth was therefore 19 mm.
alf
of a
rectangular aluminum channel measuring 101 mm by 5 mm with 3 mm wall thickness
therefore comprised the upper portion
of
the flow channel. The lower portion was made
by welding the resulting C channel on to a flat piece of aluminum large enough to
accommodate the flange dimensions
of
the PCM chamber. The open ends were capped
with appropriately sized aluminum sheet and fittings welded
on
to accommodate the fluid
inlet and outlet.
A baffle near the inlet fitting distributed the flow more evenly within the
capture/recovery channel. This baffle was constructed of a piece
of
aluminum sheet the
same dimensions as the fluid flow cross-section with seven 9
mm
holes drilled at even
intervals along the horizontal centre-line. The effect on the flow distribution was
confirmed using a three-dimensional computational fluid dynamics CFD) study, the
parameters for which are discussed in Chapter 4.5. A flow velocity map 3 mm from the
7
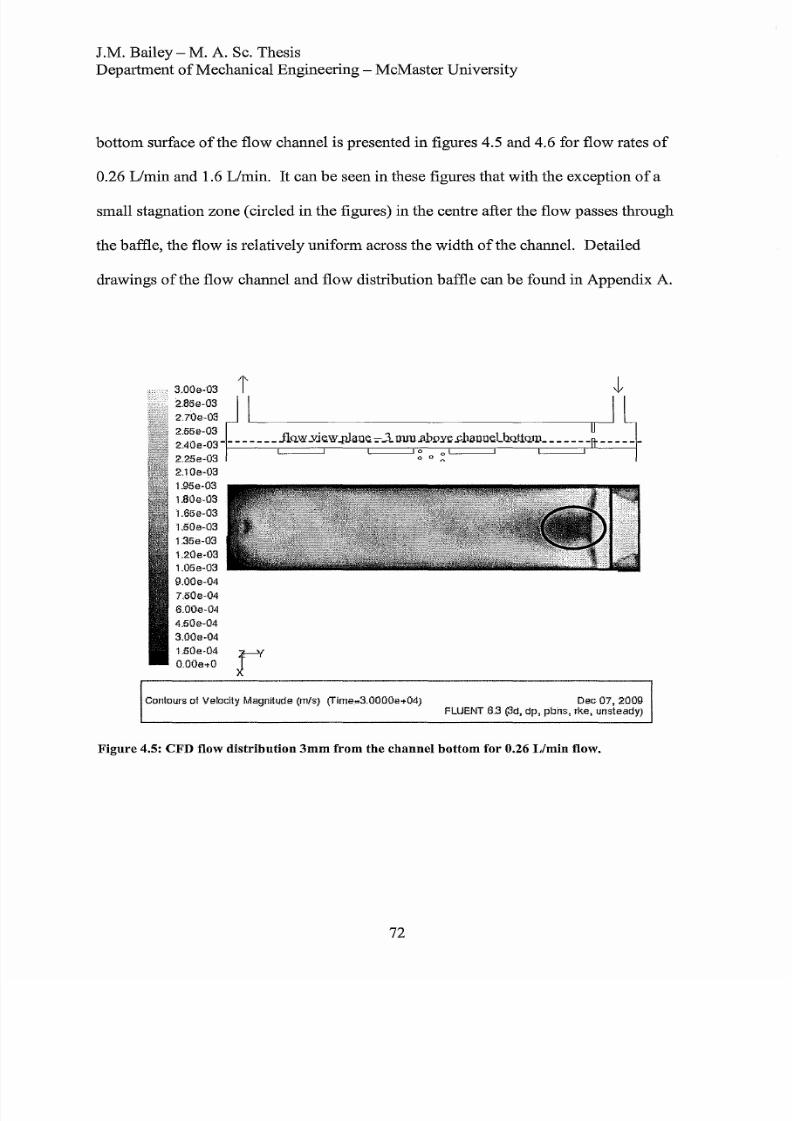
8/11/2019 Modelling Phase Change Material Thermal Storage
http://slidepdf.com/reader/full/modelling-phase-change-material-thermal-storage 88/173
J.M. Bailey - M. A. Sc. Thesis
Department ofMechanical Engineering - McMaster University
bottom surface of
the flow channel is presented
in
figures 4.5 and 4.6 for flow rates
of
0.26 Llmin and 1.6 Llmin.
It
can
be
seen
in
these figures that with the exception
of
a
small stagnation zone circled
in
the figures) in the centre after the flow passes through
the baffle, the flow is relatively uniform across the width of the channel. Detailed
drawings of the flow channel and flow distribution baffle can be found
in
Appendix A.
r
I I
.70e-03
~ ~
U
2.40e-03 - - - - - - - -
JlQ 8Yle W
wane. 1lJl.lU.ab9YI<
s:wuue.lhQt1QllL - - - - - -
o 0
2.25e-03
0 0 n
2.10e-03
1. :)5e-03
1.80e-03
1.65e-03
1.608-03
1.35e-03
1.20e-03
1.05e-03
9.00e-04
7.50e-04
6.00e-04
4.50e-04
3.008-04
1.50e·04
r
.008+0
Contours of Velocity Magnitude
m/s)
c r i m e ~ 3 . 0 0 0 0 e + 0 4
Dec 07, 2009
FLUENT 6.3 @d dp, pbilS,
rke, unsteady
Figure 4.5: CFD flow distribution
mm
from the channel bottom for 0.26
L min
flow.
72
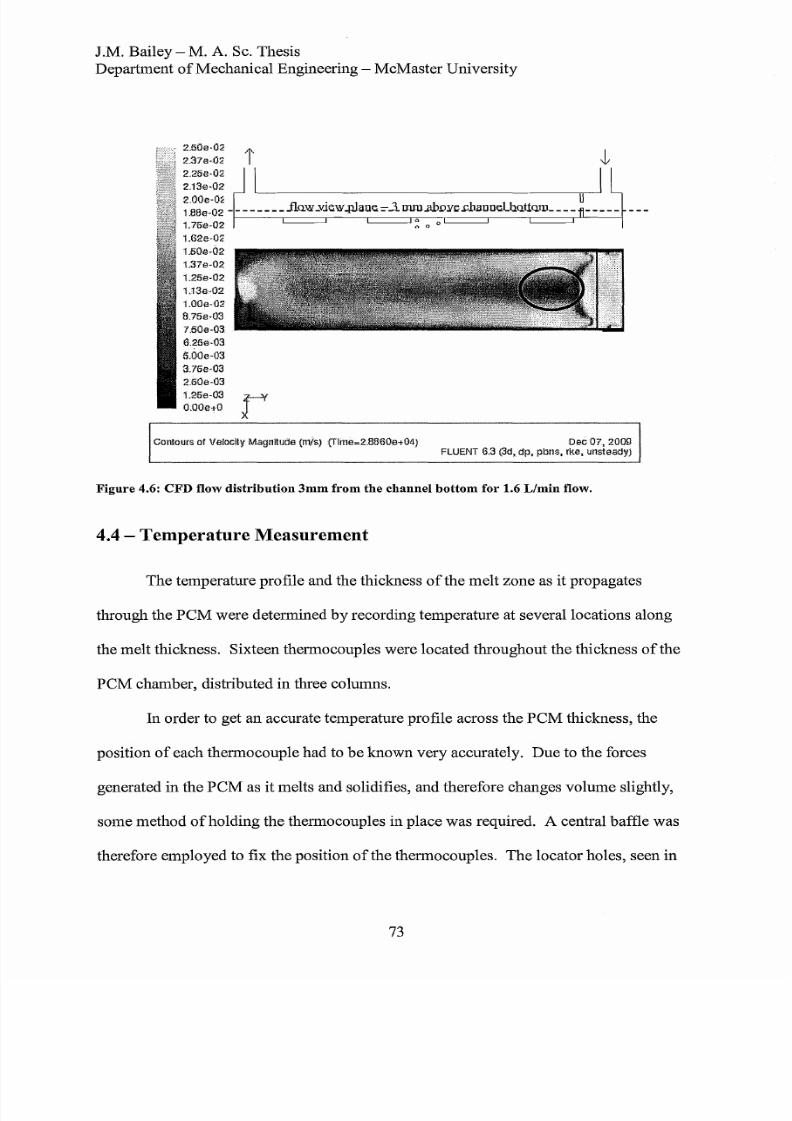
8/11/2019 Modelling Phase Change Material Thermal Storage
http://slidepdf.com/reader/full/modelling-phase-change-material-thermal-storage 89/173
J .M. Bailey - M.
A.
Sc. Thesis
Department
of
Mechanical Engineering - McMaster University
2.50e·0:< -1'
2.37e·02 I
2.25e·02
I
2.13e-02
L------------------------n--
2 . 0 0 e 0 ~
+I
J ~ t t ~
Lh U
1.88e-02 - - - - - - - -
_I-J.QW
YJew -lUaue LDllll.PJ i Ye ;J.1D.une ut1<l1D -
1.75e·02
a
0
1.62e·0:;
1.50e-02
1.37e-02
1.25e·02
1.13e-02
1.00e·02
8.75e·03
7.50e-03
6.25e-03
5.00e·03
3.75e-03
2.50e·03
1.25e-03
r
.OOe O
Contours of Velocity MagnItude m/5) flme=2.8860e+04)
Dec 07, 2009
FLUENT
6.3 {3d,
dp. pbns, rke, unsteady}
Figure 4.6: CFD flow distribution
3mm
from the
channel bottom for
1.6 Llmin flow.
4.4 Temperature Measurement
The temperature profile and the thickness
of
the melt zone as it propagates
through the
PCM were
detennined by recording temperature at several locations along
the
melt
thickness. Sixteen thennocouples were located throughout the thickness
of
the
PCM chamber, distributed
in
three columns.
In
order to get an accurate temperature profile across the
PCM
thickness, the
position
of
each thennocouple had to
be known very
accurately. Due to the forces
generated
in
the PCM as
it
melts and solidifies, and therefore changes volume slightly,
some method
ofholding the thennocouples in place was required. A central baffle was
therefore employed to fix the position of the thennocouples. The locator holes, seen in
7
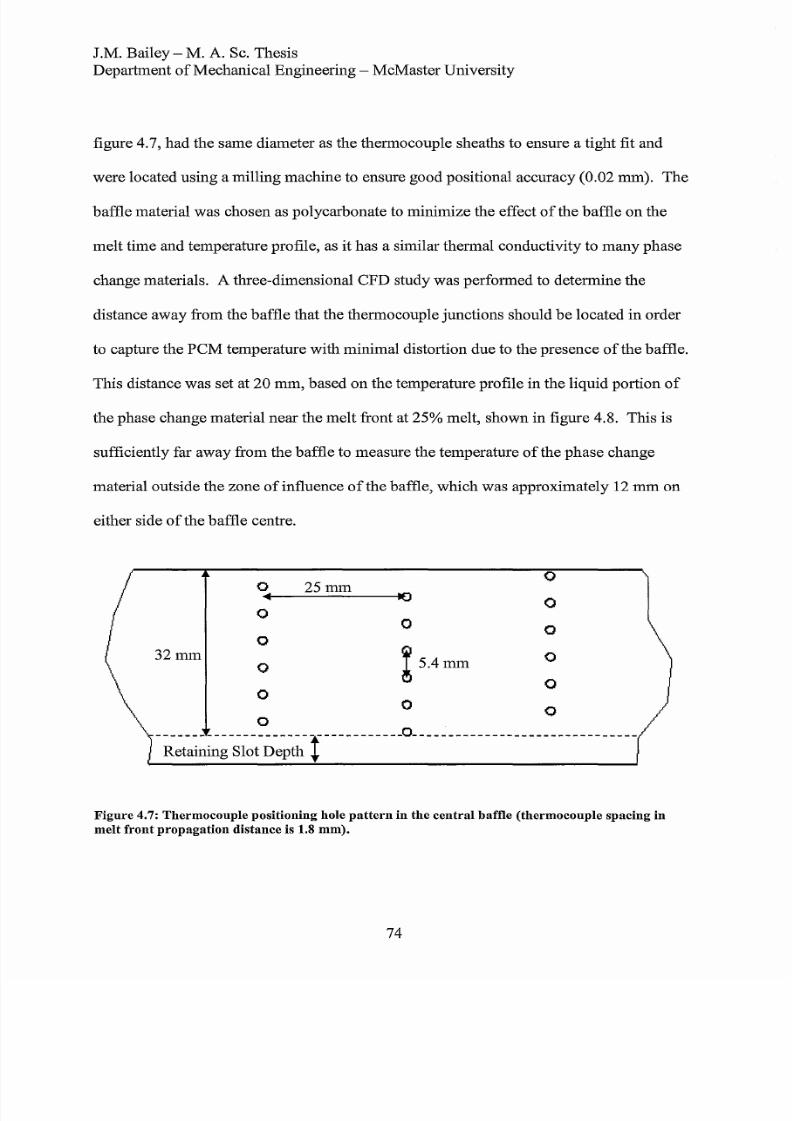
8/11/2019 Modelling Phase Change Material Thermal Storage
http://slidepdf.com/reader/full/modelling-phase-change-material-thermal-storage 90/173
J.M. Bailey - M.
A
Sc. Thesis
Department
of
Mechanical Engineering - McMaster University
figure 4.7, had the same diameter as the thermocouple sheaths to ensure a tight fit and
were located using a milling machine to ensure good positional accuracy (0.02 mm). The
baffle material was chosen as polycarbonate to minimize the effect
of
the baffle on the
melt time and temperature profile, as it has a similar thermal conductivity to many phase
change materials. A three-dimensional CFD study was performed to determine the
distance away from the baffle that the thermocouple junctions should be located
in
order
to capture the PCM temperature with minimal distortion due to the presence
of
the baffle.
This distance was set at 20 mm, based on the temperature profile in the liquid portion of
the phase change material near the melt front at
25
melt, shown in figure 4.8. This is
sufficiently far away from the baffle to measure the temperature
of
the phase change
material outside the zone of influence
ofthe
baffle, which was approximately
2
mm on
either side
of
the baffle centre.
0
0
25mm
a
0
0
0
0
a
32mm
I5 4mm
0
0
0
0
0
0
a
_
Retaining Slot Depth
Figure 4.7: Thermocouple positioning hole
pattern
in the central baffle (thermocouple spacing in
melt front propagation distance is 1.8 mm).
74
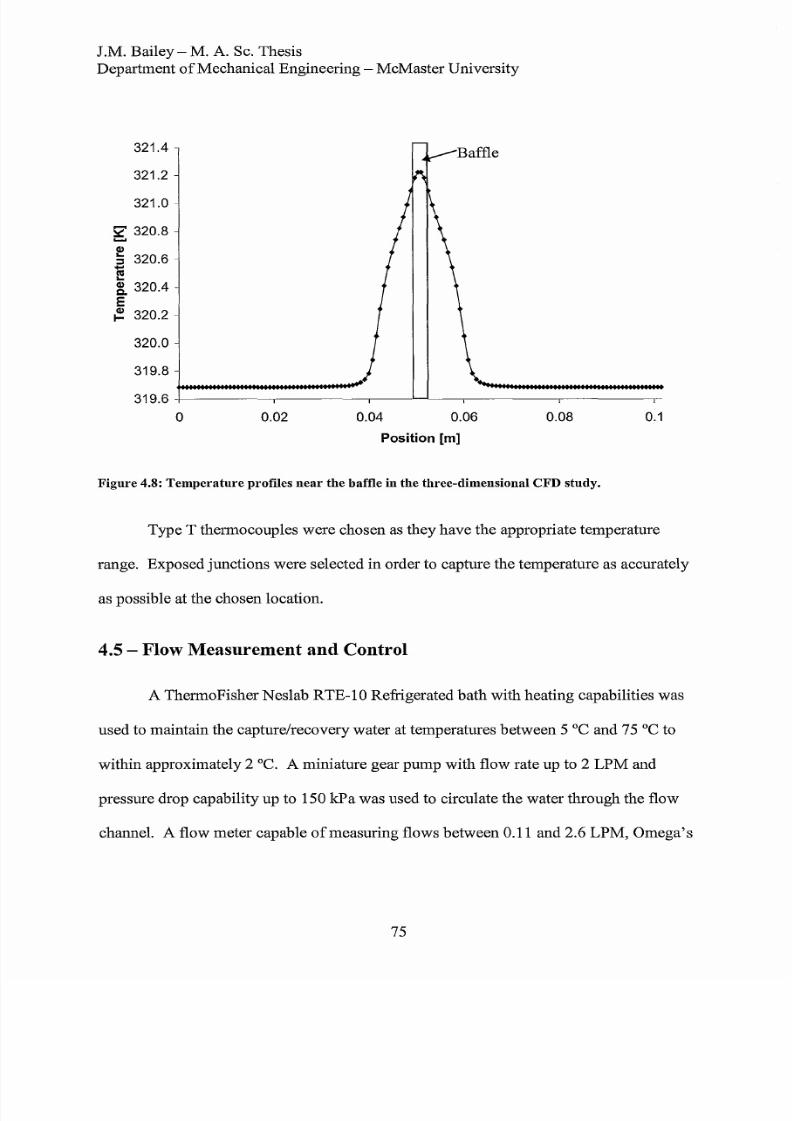
8/11/2019 Modelling Phase Change Material Thermal Storage
http://slidepdf.com/reader/full/modelling-phase-change-material-thermal-storage 91/173
J.M. Bailey - M. A. Sc. Thesis
Department
of
Mechanical Engineering - McMaster University
321.4
321.2
321.0
320.8
Q)
:; 320.6
e
320.4
E
Q)
320.2
320.0
319.8
319.6
0
0.02 0.04 0.06 0.08
0 1
osition [m]
Figure 4.8: Temperature profiles near the baffle n
the
three-dimensional CFD study.
Type T thermocouples were chosen as they have the appropriate temperature
range. Exposed junctions were selected in order to capture the temperature as accurately
as possible at the chosen location.
4.5 Flow Measurement and Control
A ThermoFisher N eslab RTE-10 Refrigerated bath with heating capabilities was
used to maintain the capture/recovery water at temperatures between
5°C
and 75°C to
within approximately
2°C
miniature gear pump with flow rate
up
to 2
LPM
and
pressure drop capability
up
to 150
k
a was used to circulate the water through the flow
channel. A flow meter capable
of
measuring flows between 0.11 and 2.6 LPM, Omega s
75

8/11/2019 Modelling Phase Change Material Thermal Storage
http://slidepdf.com/reader/full/modelling-phase-change-material-thermal-storage 92/173
J .M. Bailey - M. A. Sc. Thesis
Department
of
Mechanical Engineering - McMaster University
FP 5062 was used to determine the capture/recovery flow rate.
Flow
meter and
pump
specifications can
be
found
in
Appendix A.
4.6 Heat Flux Measurement
Knowing the average
heat
flux into the
PCM
helps to validate the analytical
model and give insight into the appropriateness
of
some assumptions. Measuring the
average
heat
flux using the temperature difference and flow rate
of
the capture
or
recovery fluid
would have been
difficult due to
the
small water temperature differences
between
the
inlet and outlet expected for the low
heat
flux either towards
the
end
of
the
melt cycle or for
high
fluid flow rates.
n
order to measure the heat flux under these
conditions four heat flux sensors Omega s HFS-4 model with integral temperature
measurement were cemented to the exterior of the flow channel where it contacts the
PCM using high thermal conductivity epoxy.
The
position
of
the heat flux sensors can be
seen
in
figure 4.9.
These
heat flux sensors were
used
to determine not
only the
average
heat flux
but
also the
heat
flux and temperature distribution on the surface
of
the flow
channel. This helped to determine the validity
of the
quasi one-dimensional
heat
transfer
assumption.
The
readings from these
heat
flux sensors were also time-integrated
and
checked against the amount
of
heat required to
melt
the
known
quantity
of
phase change
material. Unfortunately calibration
of
the heat flux sensors was unsuccessful as all
available methods
of
verification available were less accurate than the
heat
flux readings
expected
in
the experiments. Details
on
heat flux sensors can
be
found
in
Appendix A.
76
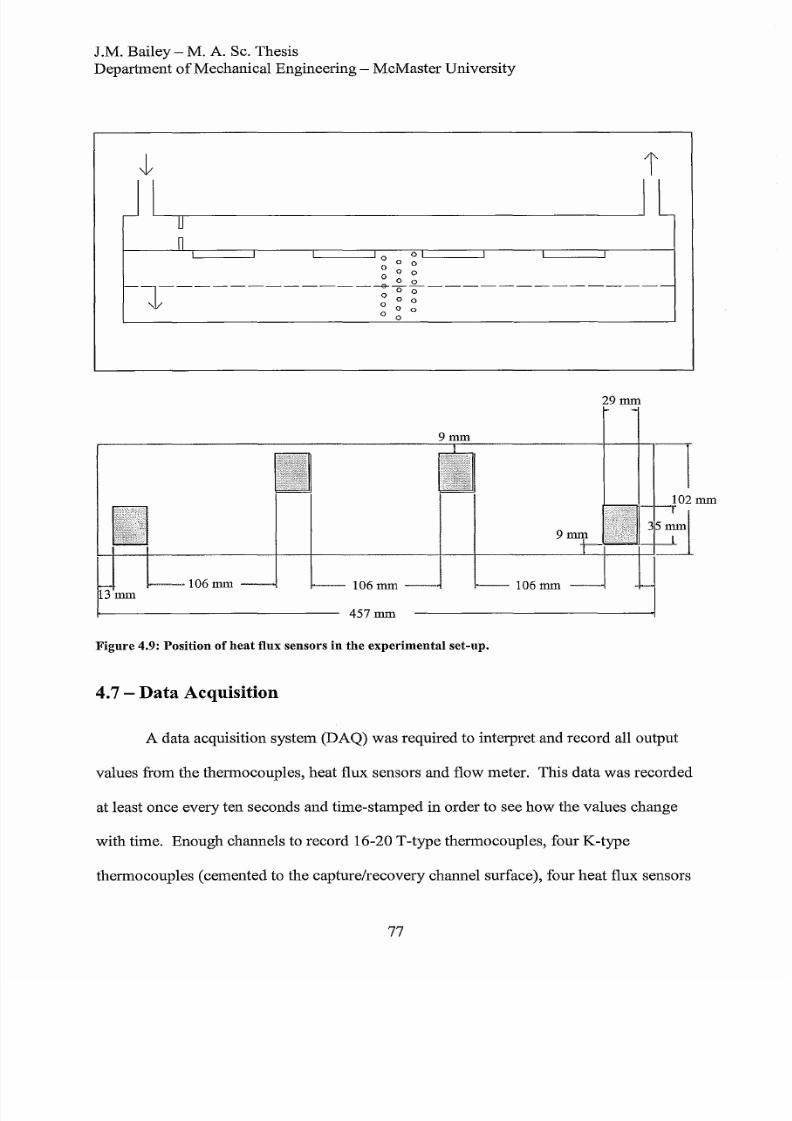
8/11/2019 Modelling Phase Change Material Thermal Storage
http://slidepdf.com/reader/full/modelling-phase-change-material-thermal-storage 93/173
J .M. Bailey - M.
A
Sc. Thesis
Department
of
Mechanical Engineering - McMaster University
I
I
o
I
- - - - - -
0 0
- - - - - -
0 0
o
0
~ ~
o 0
o 0
o
0
29mm
l
l 2mm
- - - , = = , , - 3 ~
j
l 6mm
l 6mm
l 6mm
457mm
Figure 4.9: Position
of
heat flux sensors in the experimental set-up.
4.7 Data Acquisition
A data acquisition system DAQ) was required to interpret and record all output
values from the thermocouples, heat flux sensors and flow meter. This data was recorded
at least once every ten seconds and time-stamped in order to see
how
the values change
with time. Enough channels to record 16-20 T-type thermocouples, four K-type
thermocouples cemented to the capture/recovery channel surface), four
heat
flux sensors

8/11/2019 Modelling Phase Change Material Thermal Storage
http://slidepdf.com/reader/full/modelling-phase-change-material-thermal-storage 94/173
J .M. Bailey - M. A Sc. Thesis
Department
of
Mechanical Engineering - McMaster University
and the frequency signal from the flow meter were required. In order to meet these
requirements a Compact-DAQ system from National Instruments was used with a
chassis that allows eight data acquisition cards simultaneously.
The
Compact-DAQ
chassis sends the data to a computer via a USB cable and a custom LabView program
records the data.
In order to record the thermocouple data a 16-channe1 thermocouple card the
NI-9213 was used. This allows recording
of
14
ofthe
thermocouples
in
the
P M
chamber and the two flow temperatures.
The
flow meter requires a 5-24 V input and
outputs a frequency signal at a slightly lower voltage. This voltage was determined
by
the relative resistance
of
the data acquisition and the pull-up resistor. Therefore a 24 V
source was used
in
conjunction with a 2000 ohm resistor
in
order to produce a 14.4 V
signal.
With
this signal
it
was possible to use the NI-9421 digital input card in slot six
of
the Compact-DAQ system which has an integral counter to measure the frequency
ofthe
flow meter. This card has a digital-on threshold
of 3
V and a digita1-offthresho1d
of
5 V. This means that the 0-14.4 V frequency signal was properly interpreted.
The
data was interpreted
by
Lab View with all associated calibrations found in
Appendix C applied to the raw signals.
The
Lab View program then automatically sent
the processed data to an Excel spreadsheet for further analysis.
78

8/11/2019 Modelling Phase Change Material Thermal Storage
http://slidepdf.com/reader/full/modelling-phase-change-material-thermal-storage 95/173
J.M. Bailey - M. A Sc. Thesis
Department
of
Mechanical Engineering - McMaster University
4.8 Experimental Uncertainty
According to Kline and McClintock (1953), experimental uncertainty
of
a
measured value consists
of
a fixed (bias) error and random (precision) error. The total
uncertainty is the root
of
the sum of the squared values
of
these two quantities. Bias
errors can
be
obtained through calibration curves for most instruments. The experimental
data recorded
in
this study were temperatures, heat fluxes and flow rate measurements.
Flow rate calibration was performed by collecting and weighing water passed
through the meter for a given period of time and comparing it to the time-averaged values
output
by
the data acquisition system. Calibration was performed using all of the
hardware and software that is used in testing.
The
comparison was fit to a linear equation
to obtain the calibration slope and offset for the flow meter, which can be found in
Appendix C Assuming a normal distribution, the standard deviation of the error between
the reading and the measured value was found and the bias error for the flow meter set at
+/- 12 , two standard deviations from the mean.
The thermocouple bias error consists of several cumulative sources. This
includes: RTD calibration instrument uncertainty, RTD drift, RTD reference temperature
uncertainty, RTD instrument uncertainty and thermocouple instrument uncertainty.
Further uncertainty is introduced by the data acquisition system in the form of cold-
junction compensation sensor uncertainty, gain error, offset error and gain error from
source impedance (National Instruments,
2006). The PCM and flow thermocouples were
calibrated against an RTD from °C to
7 °C
using the temperature controlled water
bath. Using the same linear fit technique as the flow calibration
but
comparing to the
79

8/11/2019 Modelling Phase Change Material Thermal Storage
http://slidepdf.com/reader/full/modelling-phase-change-material-thermal-storage 96/173
J.M. Bailey - M. A Sc. Thesis
Department
of
Mechanical Engineering - McMaster University
RTD as the actual value, the maximum range for two standard deviations of any of the
thermocouples was 0.11
°C
This is smaller than the quoted +/- 0.5
°C
from the
manufacturer. The more conservative value from the manufacturer will therefore
be
used
to determine the maximum possible error, while the tested range will
be
used for the
expected error. The calibration coefficients for the thermocouples are found in Appendix
C, table C.2. The bias ofthe RTD is quoted from the calibration lab as 0.057 °C, but due
to potential gradients in the fluid bath and possible drift over time, this value will be
increased by one order ofmagnitude to 0.57
°C
The expected cumulative bias for the
thermocouples is therefore taken as 0.58 °C with the maximum cumulative bias at 1.1
°C
The K-Type thermocouples integral to the heat flux sensors were not calibrated, but
rather the quoted error of +/-1 °C was used. Adding the expected and maximum bias
from the data acquisition system brings the total bias error to +/- 1.2
°C
and +/- 2.3
°C
for
expected and maximum errors respectively.
Random error is associated with the data fluctuations at a steady-state condition.
n the case
of
the flow meter, this is quite complicated as it is difficult to achieve a
constant flow rate for a long enough period of time to collect statistical data. For this
reason, pumping noise will
be
included in the random error calculation for the water flow
rate, even though it is physically present and therefore not really a component of the
error. This results in a much larger flow rate error than is actually occurring. Taking
7500 data points without changing any of the pump system parameters gives a standard
deviation of 0.0062 Llmin for an average value
of2 73
Llmin. A range of two standard
80

8/11/2019 Modelling Phase Change Material Thermal Storage
http://slidepdf.com/reader/full/modelling-phase-change-material-thermal-storage 97/173
J.M. Bailey - M. A Sc. Thesis
Department ofMechanical Engineering - McMaster University
deviations corresponds to 4.5 of the flow rate. This value will therefore be used for the
flow rate random error, giving a total flow rate error
of
+/- 13 .
Random error in the thermocouples is also difficult to assess due to the
unsteadiness involved in taking temperature data over a long period of time. For this
reason solidification data during natural cooling was used such that the temperature of the
thermocouples in the phase change material chamber remained at the freezing
temperature for an extended period
of
time. The random error found from taking two
standard deviations of this data was 0.23 °C This brought the total expected
thermocouple temperature uncertainty to 1.2 °C with a maximum uncertainty
of
2.3
°C
The expected uncertainty was used for error calculations.
Positional uncertainty also exists when using the thermocouple readings to
estimate the position
of
the melt front or determine the temperature gradient. This
uncertainty was set to / 2
mm
after physical testing of the maximum movement of the
thermocouples under a manual load. All of these sources ofuncertainty will be taken into
account when comparing the test data to the analytical and CFD models.
81

8/11/2019 Modelling Phase Change Material Thermal Storage
http://slidepdf.com/reader/full/modelling-phase-change-material-thermal-storage 98/173
J .M. Bailey - M.
A.
Sc. Thesis
Department
of
Mechanical Engineering - McMaster University
CH PTER
5 -
Experimental Results Discussion and
Comparison
5.1 - Experimental Phase Change Results and Model Validation
n
order to compare the experiment
to
the analytical and CFD models, the figure
of merit used is the time to melt at various locations, specifically the half-melt time at a
depth of 0.016 m.
The heat
flux into the cell is also compared to ensure that the trends
and magnitudes are as expected. The first occurrence
of
a thermocouple reading above
the full melt temperature threshold
of
43.5
°C
is used to determine the time to convert the
P M
to liquid at that location. The average
of
all recorded values
of
inlet and outlet
capture fluid temperature is used as the bulk fluid temperature
in
the analytical model,
with the initial temperature set as the average
of
the
P M
thermocouple readings at time
zero. This is an approximation since the average fluid temperature differs between the
two tests and varies with the heat flux during the tests.
The
Reynolds numbers for the
range
oftest
cases were found using equation
2
with mass flow rates
of
0.00435 and
0.0266 kg/s, a perimeter of 0.228 m and viscosity of 0.000453 kg/ms. Because the
Reynolds number range was between 100 and 1100, laminar correlations were used for
the capture/recovery flow. The Nusselt number
of
4.44, based
on
fully developed flow in
a rectangular duct with constant surface temperature and aspect ratio of 1:4 Shah
London, 1978) was used to determine the convective heat transfer coefficient
in
the
82

8/11/2019 Modelling Phase Change Material Thermal Storage
http://slidepdf.com/reader/full/modelling-phase-change-material-thermal-storage 99/173
J .M. Bailey - M. A. Sc. Thesis
Department
of
Mechanical Engineering - McMaster University
capture/recovery fluid. Because the calculated entrance length range for this geometry is
10-25 hydraulic diameters, there is error involved
n
using a fully developed Nusselt
number for this channel, which is only 0.6
m or
20 diameters long. To estimate the
magnitude
of
this potential error, the correlation for annular tubes with a diameter ratio
of
more than 0.5 was used. This produces a Nusselt number range between 4.43 and 5.74
(Kays Perkins, 1972).
A
Nusselt number of 5.74 rather than 4.44 produced only a
2.5 difference
in
the time to 100 melt for the tested cases.
The
fully developed
Nusselt number
of
4.44 was therefore used to calculate the heat transfer coefficient
of
84
W/m
2
K
in
the model using equation 22.
(21)
u k u k P
h
H A
(22)
5.2 Lauric Acid Storage Cell Low Flow
Figures 5.1 and 5.2 show the time to melt for the thermocouple locations within
the lauric acid test cell for the first two tests with a capture flow of 0.26 LPM
(0.00435 kg/s, Re
=
170) at
63°C.
Since some
of
the thermocouples were damaged upon
installation, temperature readings were not available for all
of
the positions within the
PCM. Each ofthe available locations, however, has horizontal error bars
of
+/- 2 mm to
represent the uncertainty n thermocouple position and melt time error bars
of +/-
1.2
C,
shown vertically.
The
half-melt time for the analytical model and CFD results are shown
n table 5.1. The analytical model consistently under-predicts the measured time to half-
8
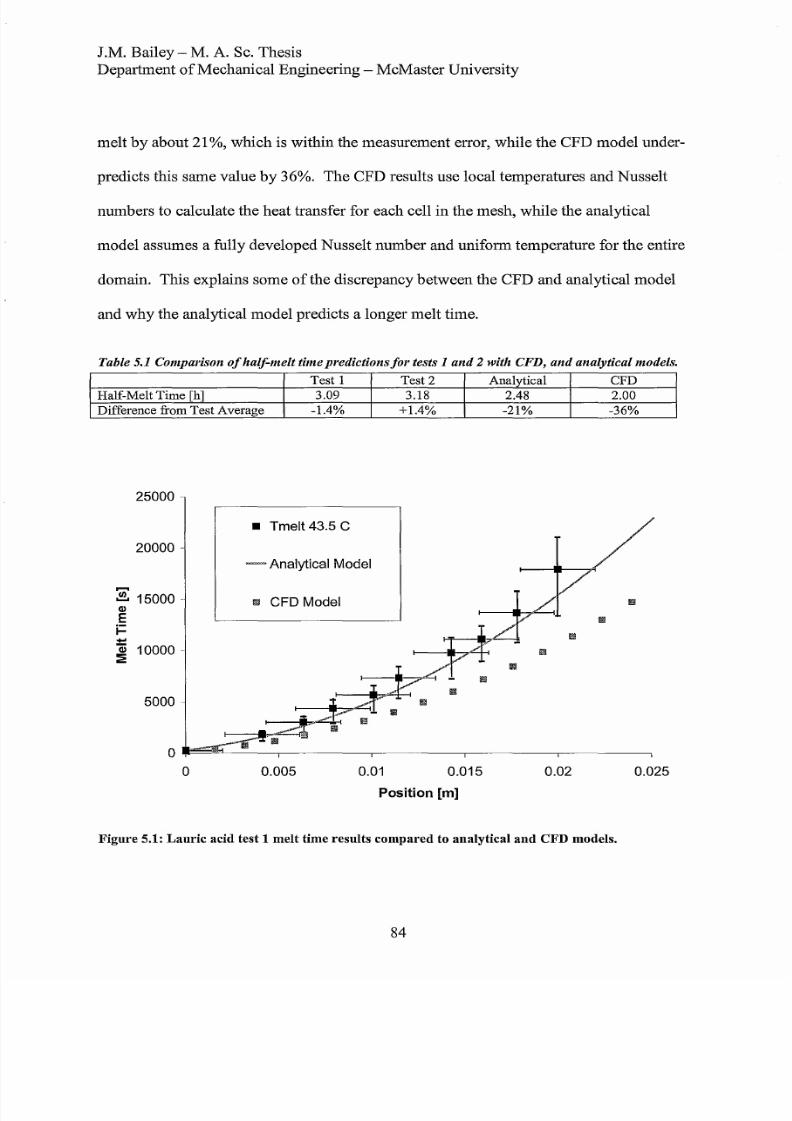
8/11/2019 Modelling Phase Change Material Thermal Storage
http://slidepdf.com/reader/full/modelling-phase-change-material-thermal-storage 100/173
J .M. Bailey - M. A. Sc. Thesis
Department ofMechanical Engineering - McMaster University
melt
by about 21 , which is within the measurement error, while the CFD model under-
predicts this same value
by
36 .
The
CFD results use local temperatures and Nusselt
numbers to calculate the heat transfer for each cell in the mesh, while the analytical
model assumes a fully developed Nusselt number and uniform temperature for the entire
domain. This explains some of the discrepancy between the CFD and analytical model
and
why
the analytical model predicts a longer melt time.
Table 5.1 Comparison ofhalf-melt time predictions for tests 1 nd 2 with CFD and analytical models.
Test 1
Test 2
Half-Melt Time [h] 3.09 3.18
Difference from Test Average
-1.4
+1.4
25000
20000
15000
<Il
E
i=
+
Q
10000
: :
5000
o
• Tmelt 43.5 C
Analytical Model
l CFD Model
0.005 0.01 0.015
osition [m]
Analytical CFD
2.48 2.00
-21 -36
0.02 0.025
Figure 5.1: auric acid test 1 melt time results compared to analytical
and
CFD models.
84
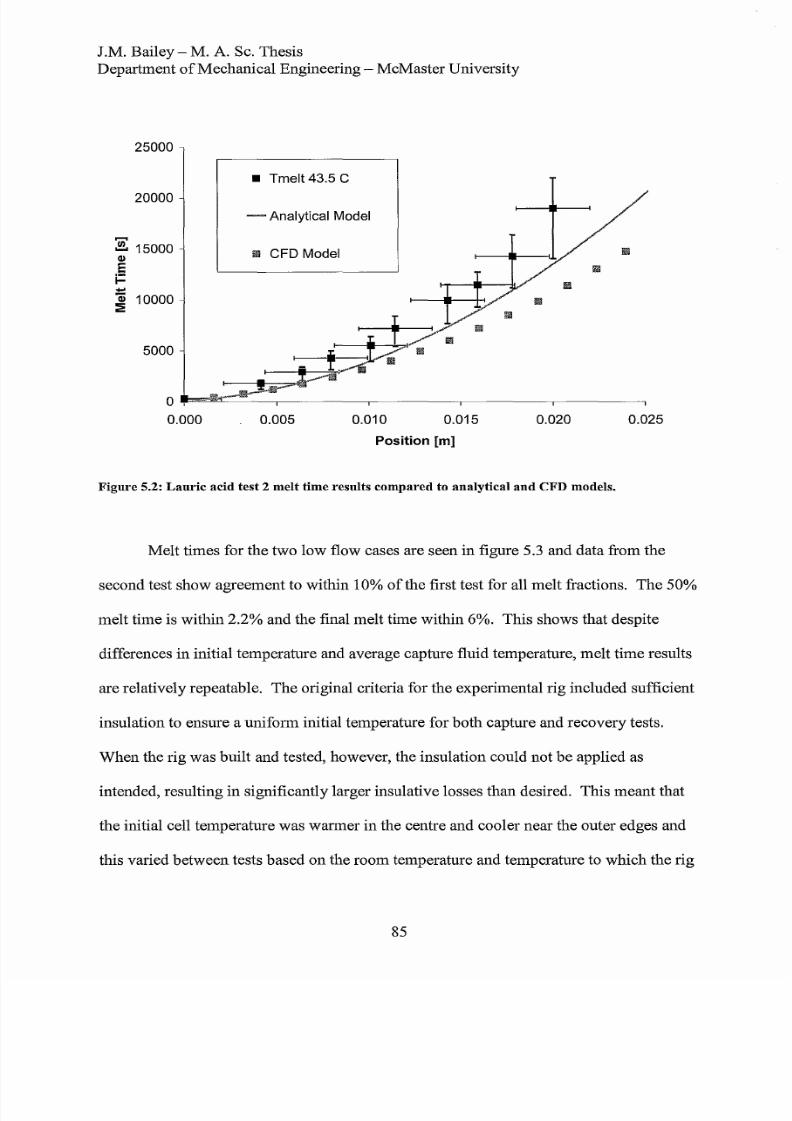
8/11/2019 Modelling Phase Change Material Thermal Storage
http://slidepdf.com/reader/full/modelling-phase-change-material-thermal-storage 101/173
1.M. Bailey - M.
A.
Sc. Thesis
Department
of
Mechanical Engineering - McMaster University
25000
20000
E 15000
Q)
E
j::
-
10000
: 1E
5000
0.000
• Tmelt 43.5 C
Analytical Model
ll CFD Model
0.005
0.010 0.015
osition [m]
0.020
Figure 5.2: Lauric acid test 2 melt time results compared to analytical and FD models.
0.025
Melt times for the two low flow cases are seen
in
figure 5.3 and data from
the
second test show agreement to within 10
of
the first test for all melt fractions.
The
50
melt time is within 2.2 and the final melt time within 6 . This shows that despite
differences
in
initial temperature and average capture fluid temperature, melt time results
are relatively repeatable.
The
original criteria for the experimental rig included sufficient
insulation to ensure a uniform initial temperature for both capture and recovery tests.
When the rig was built and tested, however, the insulation could not
be
applied as
intended, resulting
in
significantly larger insulative losses than desired. This meant that
the initial cell temperature was warmer in the centre and cooler near the outer edges and
this varied between tests based on the room temperature and temperature to which the rig
85
8/11/2019 Modelling Phase Change Material Thermal Storage
http://slidepdf.com/reader/full/modelling-phase-change-material-thermal-storage 102/173
1M Bailey - M. A. Sc. Thesis
Department
of
Mechanical Engineering - McMaster University
was originally heated. In future testing
it
is recommended that the insulation
be
improved
in
order to mitigate the heat loss.
To further compare the test data with model results figures 5.4 and 5.5 show the
heat flux values for the test data analytical and CFD models. Heat flow values were
calculated using the heat flux and multiplying
it
by the relevant area. For the CFD case
this area was 0.129 m
2
and accounted for the averaged heat flux readings over the top
bottom and sides
of
the
PCM
chamber
in
order to capture all
of
the heat flow into the
PCM. Since the output data was an area-weighted average
of
the total surface heat flux
for this entire area this value must
be
used to calculate the total thermal energy input to
the cell.
The
test data and analytical solution
use
only the capture/recovery flow channel
area
in
contact with the PCM which is 0.046 m
2
. The channel surface was divided into
four zones with the divisions equidistant between each pair of neighbouring
heat
flux
sensors.
The
reading from each heat flux sensor was then assigned to the entire area
containing that sensor and the four were summed to produce the total thermal energy
input through the surface of the flow channel.
86
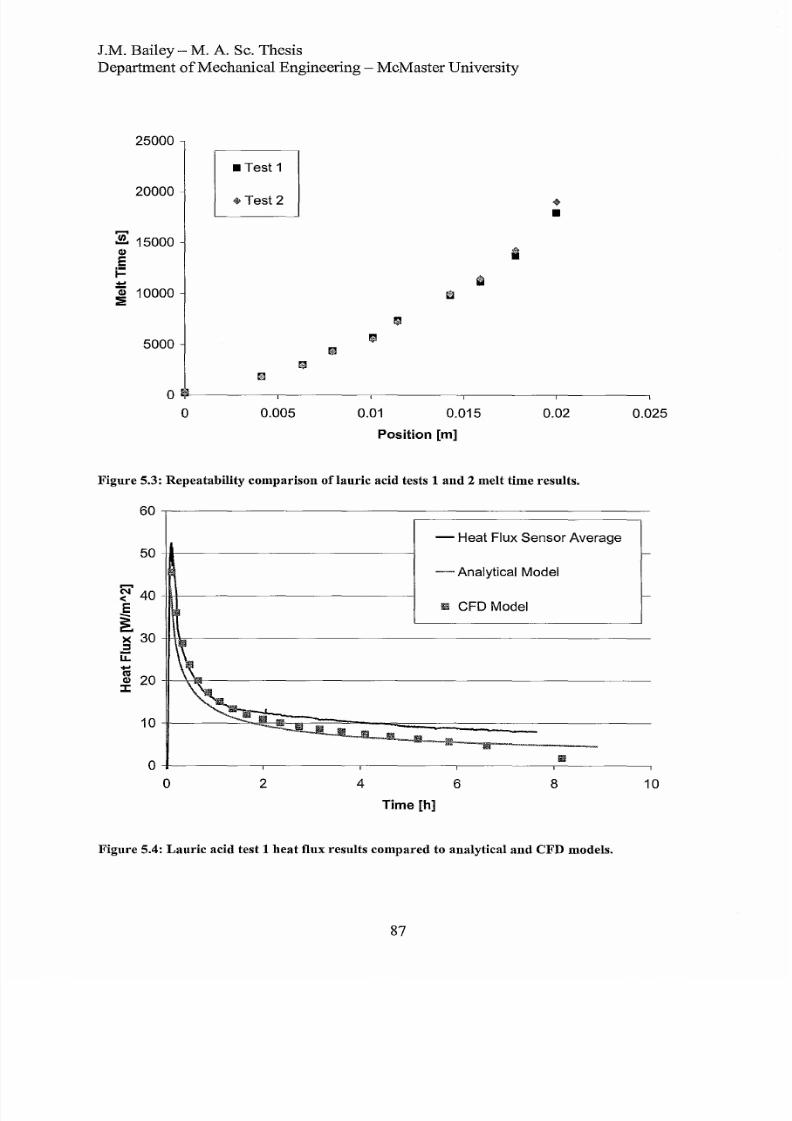
8/11/2019 Modelling Phase Change Material Thermal Storage
http://slidepdf.com/reader/full/modelling-phase-change-material-thermal-storage 103/173
J .M. Bailey M. A. Sc. Thesis
Department ofMechanical Engineering McMaster University
25000
20000
:E
15000
II
E
i=
j) 10000
: :
5000
• Test 1
+ Test 2
~
•
ill
~
g
,
m
rn
+
•
o
- - - - - - - - - - . - - - - - - - - - ~ - - - - - - - - _ - - - - - - - - _ . - - - - - - - - ~
o
0.005
0.01
0.015
0.02
0.025
osition [m]
Figure 5.3: Repeatability comparison oflauric acid tests 1 and 2 melt time results.
60
- Heat Flux Sensor Average
50
- Analytical Model
40
E
ill CFD Model
><
30
:s
9
u:::
IS
20
II
:::c
10
~ -
~ . J i l I 1 1 l i
I1li
..AI..
l l
iIt\I
-
0
IliiI
0
2
4
6 8
10
Time [h]
Figure 5.4: auric acid test 1 heat flux results compared to analytical and CFD models.
87

8/11/2019 Modelling Phase Change Material Thermal Storage
http://slidepdf.com/reader/full/modelling-phase-change-material-thermal-storage 104/173
J M. Bailey - M. A. Sc. Thesis
Department
of
Mechanical Engineering - McMaster University
60
- Heat Flux Sensor Average
50
iii
- Analytical Model
40
i
CFD Model
>
:s
30
iL
-
s
CI
::I:
20
10
0
0 2 4
6 8 10
ime [h]
Figure 5.5:
auric
acid test 2
heat
flux results compared to analytical
and
CFD models.
Both the CFD and analytical models under-predict the majority
ofthe
heat flux
and melt time results seen in the first two test cases. t would be expected that if the heat
flux is under-predicted by a model this would result in the melt time being over-
predicted but this would only occur for a perfectly insulated test apparatus. The fact that
there are thermal energy losses to the surroundings as approximated
in
Appendix C
causes additional heat flux through the capture/recovery channel wall that does not cause
melting
of
the phase change material. Given these losses
it
is therefore expected that the
average of the heat flux sensor readings would
be
higher than the heat flux predicted by
the analytical or CFD models as seen in figures 5.4 and 5.5.
88
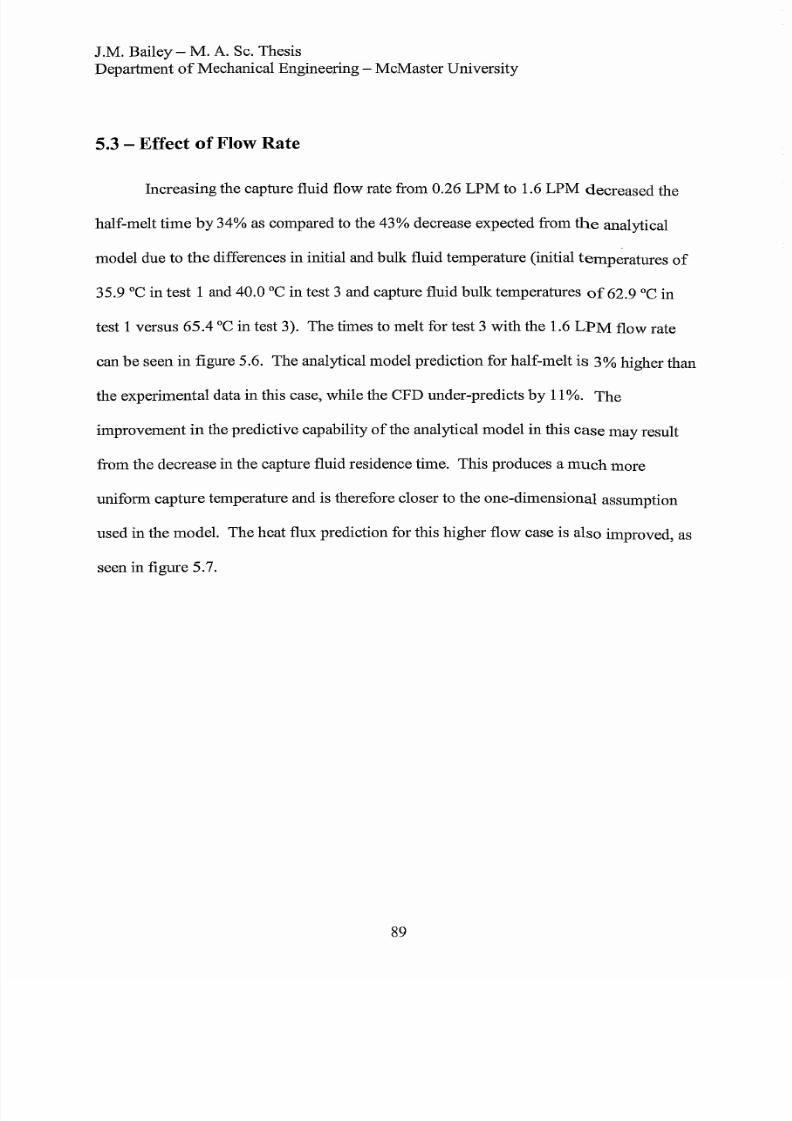
8/11/2019 Modelling Phase Change Material Thermal Storage
http://slidepdf.com/reader/full/modelling-phase-change-material-thermal-storage 105/173
1.M. Bailey - M. A Sc. Thesis
Department of Mechanical Engineering - McMaster University
5.3 Effect
o
Flow Rate
Increasing the capture fluid flow rate from 0.26
LPM
to 1.6 LPM decreased the
half-melt
time by
34 as compared to the 43 decrease expected from the analytical
model due to
the
differences
in
initial and bulk fluid temperature (initial temperatures of
35.9 °C
in test
1 and 40.0 °C
in
test 3 and capture fluid
bulk
temperatures of 62.9 °C
in
test 1 versus 65.4
°C in
test 3).
The
times to melt for test 3 with the 1.6 LPM flow rate
can be seen n figure 5.6. The analytical model prediction for half-melt is 3 higher than
the experimental data
n
this case, while the CFD under-predicts by
11
. The
improvement
in
the predictive capability
of
the analytical model
in
this case
may
result
from the decrease n the capture fluid residence time. This produces a
much
more
uniform capture temperature and is therefore closer to the one-dimensional assumption
used in the model. The heat flux prediction for this higher flow case is also improved, as
seen n figure 5.7.
89
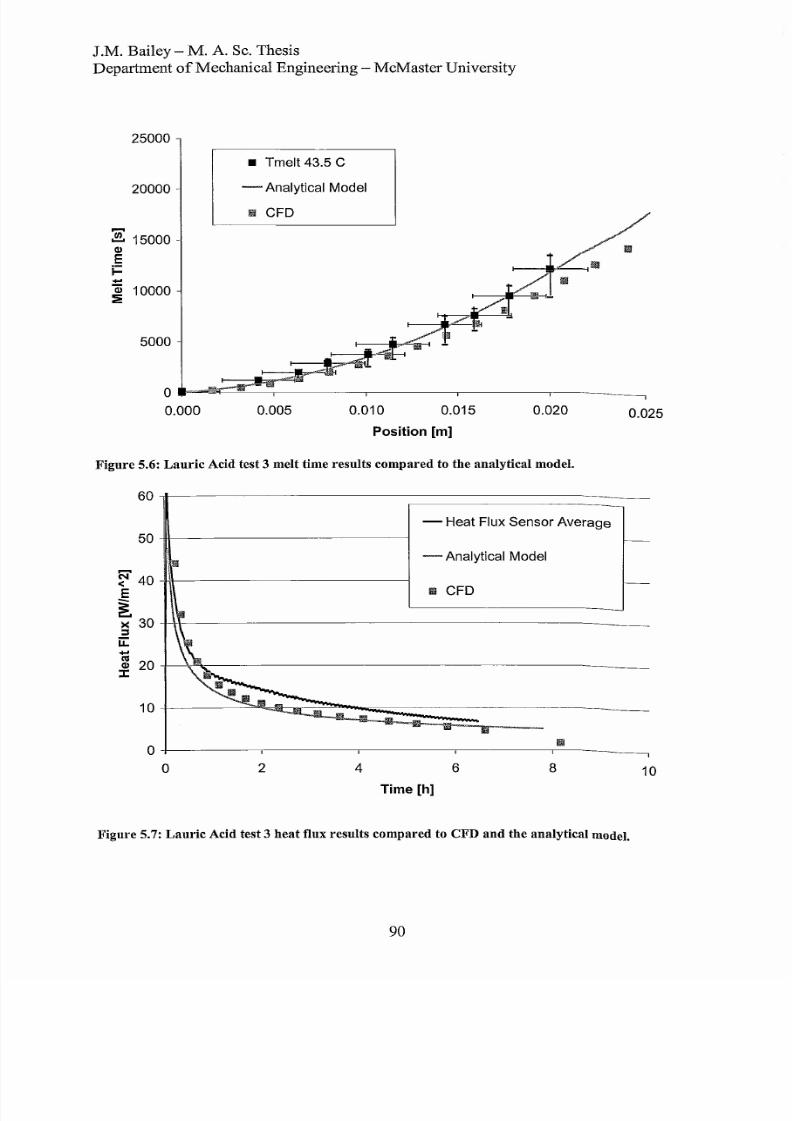
8/11/2019 Modelling Phase Change Material Thermal Storage
http://slidepdf.com/reader/full/modelling-phase-change-material-thermal-storage 106/173
J M. Bailey M. A.
Sc
Thesis
Department ofMechanical Engineering McMaster University
25000
20000
E 15000
II
E
j::
j 10000
:
5000
o
0.000
• Tmelt 43.5 C
Analytical Model
iil i CFD
0.005 0.010 0.015
osition [m]
0.020
Figure 5.6: Lauric Acid test 3 melt time results compared to the analytical model.
60
Heat Flux Sensor Average
50
Analytical Model
F
40
j
E
IIll CFD
>
30
:s
u
IS
20
I
J:
10
0
0
2 4 6 8
Time [h]
0.025
10
Figure 5.7:
Lauric
Acid test 3 heat flux results compared to CFD and the analytical model.
90

8/11/2019 Modelling Phase Change Material Thermal Storage
http://slidepdf.com/reader/full/modelling-phase-change-material-thermal-storage 107/173
J.M. ailey - M
A
Sc. Thesis
Department
of
Mechanical Engineering - McMaster University
5.4
ffect of
Flow Direction
The presence of the flow baffle in the capture/recovery flow channel has an effect
on the fluid flow pattern. For this reason, the high flow rate test was repeated twice with
the capture channel plumbed in the opposite direction to evaluate these effects. There
were two differences in the geometry of tests 3 and
4
The fIrst
of
these is a slight change
in the way the fluid entered and exited the flow channel. For tests 1 through 3 the tee
fIttings that allowed the thermocouple to be inserted into the flow immediately adjacent
to the bosses were oriented with the run branches pointed away from the flow channel.
The addition of quick disconnect fIttings between tests 3 and 4,
as
well as handling issues
caused
by
the long thermocouple leads protruding upward from the fIttings, necessitated
turning these fIttings such that the run was oriented parallel to the flow channel. This
may have caused small differences in the flow entering the channel,
but
these effects do
not show a signifIcant effect on the melt times.
The melt time results for these three high flow tests are shown in fIgure 5.8 and
are very similar, with the exception of one outlier point. The melt time for 50 melt
(0.016 m) is more than that for 63 melt (0.020 m), which does not make physical sense
for a planar melt front. This outlier
may be
caused
by
uneven melting
of
the phase
change material since these two thermocouples are positioned in different columns in the
baffle,
by
trapped gas bubbles or foreign matter inclusions within the phase change
material at the thermocouple skewing the melt data, or by a change in position of some
of
the thermocouples.
91

8/11/2019 Modelling Phase Change Material Thermal Storage
http://slidepdf.com/reader/full/modelling-phase-change-material-thermal-storage 108/173
J.M.
Bailey
M. A Sc. Thesis
Department ofMechanical Engineering - McMaster University
15000
/
Forward Flow Test 3
• Reverse Flow Test 4
10000
. Reverse Flow Test 5
......
P
CI)
Analytical Model
E
j::
/
i
::2:
5000
/
y
.
a
.....
• I I
0.000 0.005 0.010 0.015
0.020
0.025
osition [m]
Figure 5.8: Lauric Acid tests 3 and 4 comparing flow direction for 1.6 LPM
capture
flow.
Investigation into the cause of the outlier in figure 5.7 involved draining the phase
change material from the apparatus and observing the thermocouple position and
condition within the test cell. The first observation that was made was the discoloration
ofthe phase change material.
New
lauric acid is opaque white in the solid form and clear
in the liquid form. When the lauric acid was drained from the test cell it was translucent
yellow-orange in colour and solidified to an opaque yellow-orange. Since this
discoloration was not observed in thermal cycling in glass containers it was hypothesized
that the phase change material reacted with one
of
the apparatus materials. Inspection of
the silicone caulking showed a similar yellowing of the sealant to the phase change
material. t was therefore hypothesized that a chemical reaction between the silicone
92

8/11/2019 Modelling Phase Change Material Thermal Storage
http://slidepdf.com/reader/full/modelling-phase-change-material-thermal-storage 109/173
1M
Bailey - M. A. Sc. Thesis
Department
of
Mechanical Engineering - McMaster University
caulking used to help seal the flanged components
of
the test cell and the phase change
material
may
have caused the discoloration
of
the lauric acid. A simple test was
conducted to verify this hypothesis by placing a sample
of
cured silicone
in
a glass
container with
new
phase change material and cycling
it
twice above and
below
its melt
temperature.
No
yellowing
ofthe
phase change material and silicone was seen during
this investigation as
in
the original tests disproving the hypothesis that a reaction
between only the
PCM
and silicone sealant was causing the discolouration.
t
is therefore
recommended that further material compatibility testing
be
performed for additional
material combinations that occur within the cell.
With
the exception
of
the possibility
of
uneven melting caused by local material
property changes due to this chemical reaction a reasonable explanation was
not
found
for the outlier and more investigation is therefore required.
5.5 Discussion
The
analytical model developed
in
this study produces reasonably similar results
to those from CFD analysis with similar boundary conditions and experimental data.
This supports the
use of
this model
in
preliminary sizing calculations and preliminary
assessment
of
phase change material thermal storage systems.
The
under-prediction
of
the melt times
may be
attributed to thermal energy losses due to insufficient insulation
in
the test apparatus. Ifthis
is not
the case however and the model under-predicts melt
times for well insulated systems
it
means that a system sized
on
a given
melt
time
may
have a slightly thicker
PCM
layer than the final design requirement. This
would
cause a
9
8/11/2019 Modelling Phase Change Material Thermal Storage
http://slidepdf.com/reader/full/modelling-phase-change-material-thermal-storage 110/173
J .M. Bailey - M.
A
Sc. Thesis
Department
of
Mechanical Engineering - McMaster University
corresponding under-prediction
of
the volume multiplier based
on
a given capture and
recovery channel geometry. This is not likely, however, as natural convection within the
liquid phase change material should increase the heat flux
of
the cell above that predicted
by the analytical model.
The
effect
of
an error
in
the prediction of the melt time will have
less of an effect for longer storage cell times due to the smaller volume multipliers
calculated
in
these cases. or example, a 20 error
in
the peM thickness for a geometry
where the peM occupies 50
of
the cell causes a volume multiplier range
of
1.83 to
2.25, while a 20 error
in
the peM thickness for a geometry where the
peM
occupies
90
of
the cell has a volume multiplier range
of
only 1.09 to 1.14. This does not change
the cost
of
the phase change material required to store
the
required amount of energy, but
can have a significant effect on the total system volume and the cost
of
the capture and
recovery channel materials
in
the system. The effect
of
a 20 error
in peM
cell
thickness
on
an actual system will
be
evaluated using the H2Green Distributed Storage
System thermal energy storage battery design
in
the following chapter.
94
8/11/2019 Modelling Phase Change Material Thermal Storage
http://slidepdf.com/reader/full/modelling-phase-change-material-thermal-storage 111/173
J .M. Bailey - M. A. Sc. Thesis
Department
of
Mechanical Engineering - McMaster University
CHAPTER
6 Sample System Sizing
6.1 H
2
Green Distributed Storage System Thermal Storage Sizing
Sizing of a sample system is demonstrated based on inputs from the proposed
Distributed Storage System (DSS) from H
2
Green Energy Corporation. The capture and
recovery systems are based on utilizing the DSS at McMaster Innovation Park, a
170,000 square foot industrial research facility
owned
by McMaster University. This
demonstrates the utility of the analytical thermal battery sizing methodology in
determining the size and economic feasibility ofutilizing thermal energy storage in a
specific application.
6.2 H
2
Green Distributed Storage System
H2Green s
SS
is
an
energy storage system
based
on time-of-day electricity
pricing.
The
system stores energy from the electrical grid at times
when
it is cheap and
abundant for
use
during times
when
it is costly and limited
in
availability. This system
can also
be
used
to store energy during excess supply of renewable energy sources when
demand is not present. The storage system
can
be made in various sizes using various
different types
of
energy storage such as
pumped
hydro, compressed gas, mechanical
flywheels and chemical energy (such as turning water to hydrogen and oxygen).
The
system under investigation is a small-scale storage system that uses hydrogen as the
storage medium
in
order to store and recover energy for an office building, as depicted in
95
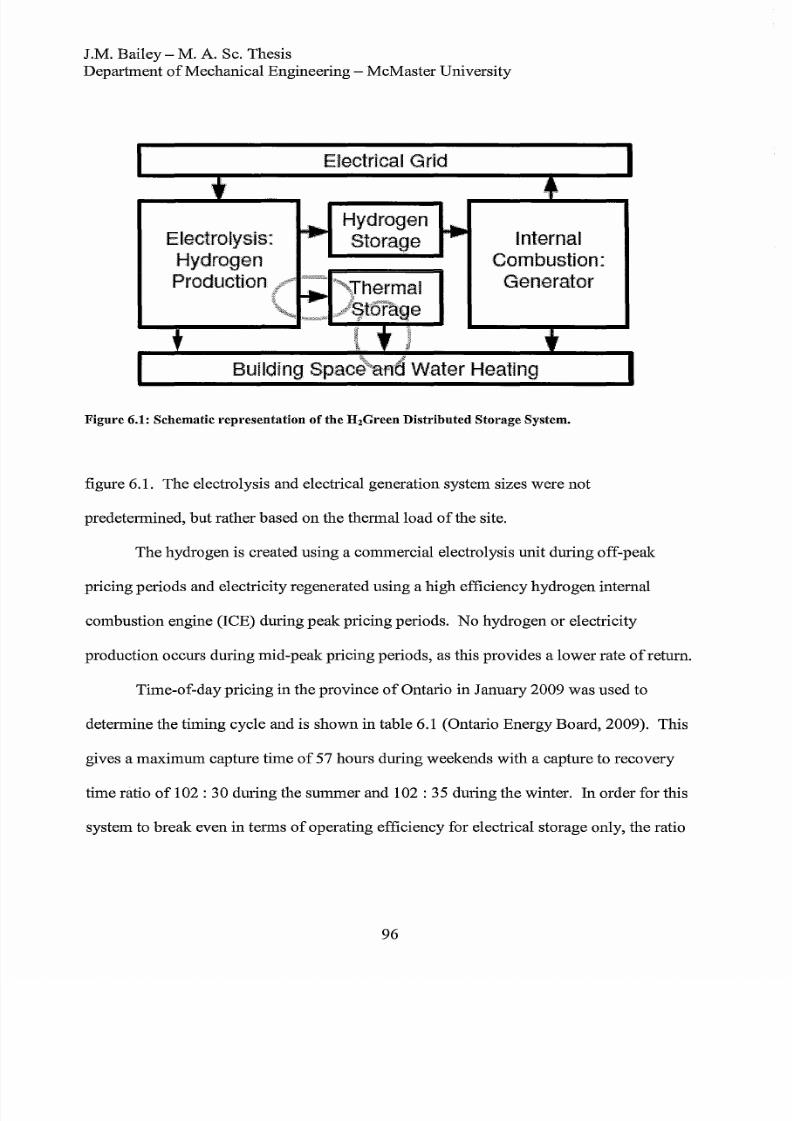
8/11/2019 Modelling Phase Change Material Thermal Storage
http://slidepdf.com/reader/full/modelling-phase-change-material-thermal-storage 112/173
J.M. Bailey - M. A. Sc. Thesis
Department ofMechanical Engineering - McMaster University
Electrolysis
Hydrogen
Production
Electrical Grid
Hydrogen
Storage
Internal
Combustion
Generator
Building Spa f 6 Water Heating
Figure 6.1: Schematic representation
of
the H
2
Green Distributed Storage System.
figure 6.1. The electrolysis and electrical generation system sizes were not
predetermined, but rather based on the thermal load
of
the site.
The hydrogen is created using a commercial electrolysis unit during off-peak
pricing periods and electricity regenerated using a high efficiency hydrogen internal
combustion engine ICE) during peak pricing periods. No hydrogen or electricity
production occurs during mid-peak pricing periods, as this provides a lower rate
of
return.
Time-of-day pricing in the province
of
Ontario in January 2009 was used to
determine the timing cycle and is shown in table
6 1
Ontario Energy Board, 2009). This
gives a maximum capture time
of
57 hours during weekends with a capture to recovery
time ratio
of 1 2:
30 during the summer and 102 : 35 during the winter.
In
order for this
system to break even in terms of operating efficiency for electrical storage only, the ratio
96
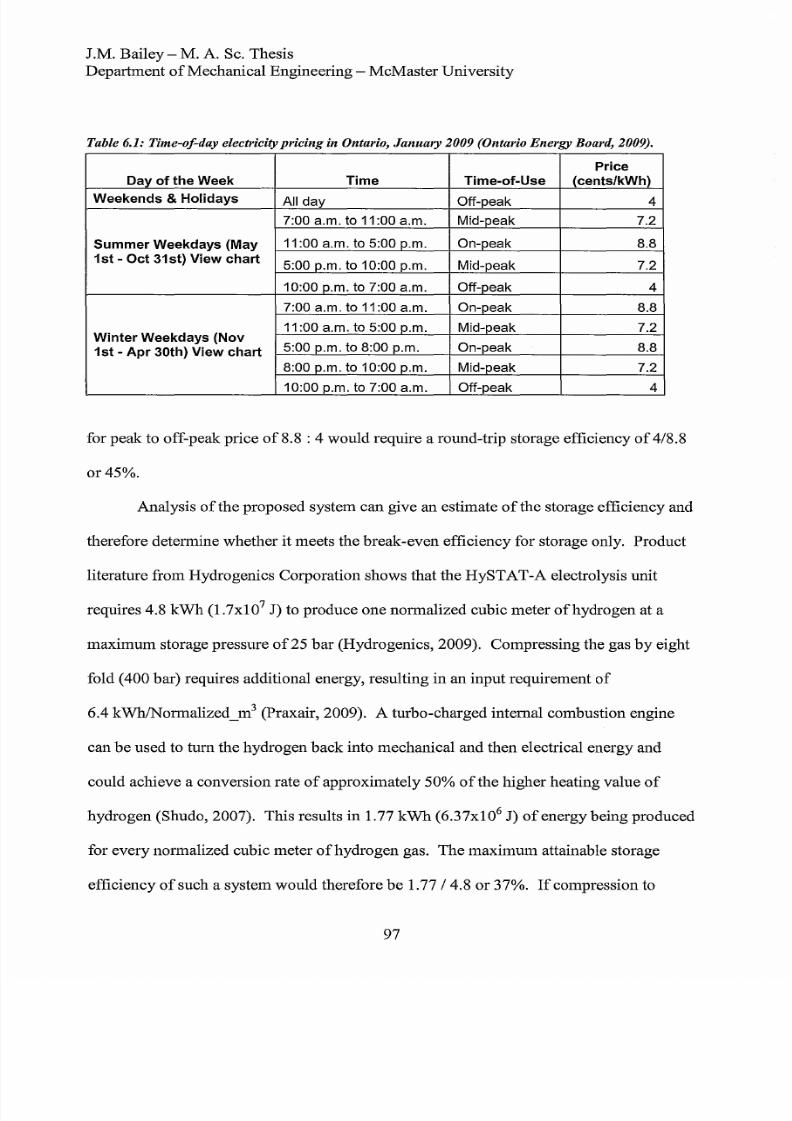
8/11/2019 Modelling Phase Change Material Thermal Storage
http://slidepdf.com/reader/full/modelling-phase-change-material-thermal-storage 113/173
J.M. Bailey M.
A.
Sc. Thesis
Department of Mechanical Engineering - McMaster University
Table 6.1: Time-of-day electricity pricing in Ontario, January 2009 Ontario Energy Board, 2009).
Price
Day
o
the Week Time Time-of-Use
cents/kWh)
Weekends Holidays
All day Off peak 4
7:00 a.m. to :00 a.m. Mid peak
7.2
Summer Weekdays May
:00 a.m. to 5:00 p.m. On peak
8.8
1st - Oct 31st) View chart
5:00 p.m. to 10:00 p.m. Mid peak 7.2
10:00 p.m. to 7:00 a.m. Off peak
4
7:00 a.m. to :00 a.m. On peak
8.8
:00 a.m. to 5:00 p.m. Mid peak
7.2
Winter Weekdays Nov
5:00 p.m. to 8:00 p.m. On peak 8.8
1st - Apr 30th) View chart
8:00 p.m. to 10:00 p.m. Mid peak
7.2
10:00 p.m. to 7:00 a.m. Off peak
4
for peak to off-peak price of 8.8 : 4 would require a round-trip storage efficiency of 4/8.8
or 45 .
Analysis
of
the proposed system can give an estimate
ofthe
storage efficiency and
therefore determine whether it meets the break-even efficiency for storage only. Product
literature from Hydrogenics Corporation shows that the HySTAT-A electrolysis unit
requires 4.8 kWh (1.7x1 0
7
J) to produce one normalized cubic meter of hydrogen at a
maximum storage pressure
of25
bar (Hydrogenics, 2009). Compressing the gas
by
eight
fold (400 bar) requires additional energy, resulting in an input requirement
of
6.4 kWhlNormalized_m
3
(Praxair, 2009). A turbo-charged internal combustion engine
can
be
used to tum the hydrogen back into mechanical and then electrical energy and
could achieve a conversion rate of approximately 50 of the higher heating value of
hydrogen (Shudo, 2007). This results
in
1.77
kWh
(6.37x10
6
J) of energy being produced
for every normalized cubic meter of hydrogen gas. The maximum attainable storage
efficiency
of
such a system would therefore
be
1.77 / 4.8 or 37 .
If
compression to
97
8/11/2019 Modelling Phase Change Material Thermal Storage
http://slidepdf.com/reader/full/modelling-phase-change-material-thermal-storage 114/173
J.M. Bailey - M.
A
Sc. Thesis
Department ofMechanical Engineering - McMaster University
400 bar is required for storage at a compression efficiency
of75
(Praxair, 2003), this
number is further reduced to 28 . Since both are lower than the break-even operating
efficiency of45 dictated
by
the pricing ratio, additional sources of revenue must
be
included to produce an economically feasible system.
While feed-in tariffs for off-peak energy storage are a possibility in the future,
they are not currently available and were therefore not evaluated in this study. Sale of
oxygen gas from the electrolysis process is also a potential source
of
income, but
contracts would have to
be
negotiated with a buyer and these would
be
highly dependent
on the pressure and purity of oxygen that is provided. As these values were also
unavailable, this source of revenue were also not evaluated in this study. Displacement
ofnatural gas heating costs for the building in which the system is housed using a thermal
energy storage system was calculated with readily available data.
6.3 Capture and Recovery System Definition
The thermal energy storage system will
be
based
on
the phase change material
thermal battery design process presented earlier
in
figure 2.3 and reproduced in figure 6.2
with numbered steps for easy reference.
98
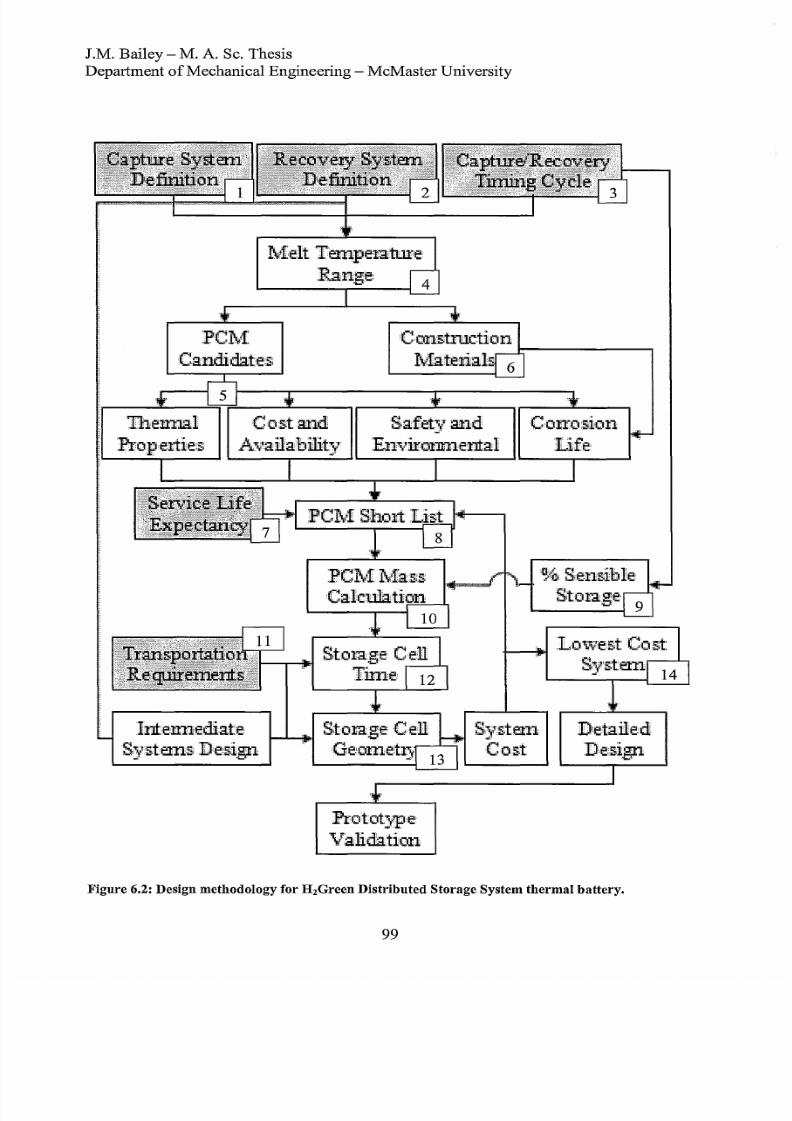
8/11/2019 Modelling Phase Change Material Thermal Storage
http://slidepdf.com/reader/full/modelling-phase-change-material-thermal-storage 115/173
J.M. Bailey - M. A Sc. Thesis
Department
o
Mechanical Engineering - McMaster University
\'lelt
Temperatl.'rre:
Range
P C ~ {
Candidates
·C·onstru.ctlon
I ':fia.tenals
Thennal
l ~ o p e r t i e ~
ost and.
Safet;land.
L\:O;lailab:ilit fl :E.n'llIrmlmeni:al
PC1\{
l'vfas;s
if--='
Calculation .
I ~
Gorro:slon
Life:
Sy.steJ:U
CO.5t
Detailed.
:Design
Protot'Vrie
,,rr
'\.ralidation
Figure 6.2: Design methodology for H
2
Green Distributed Storage System thermal battery.
99
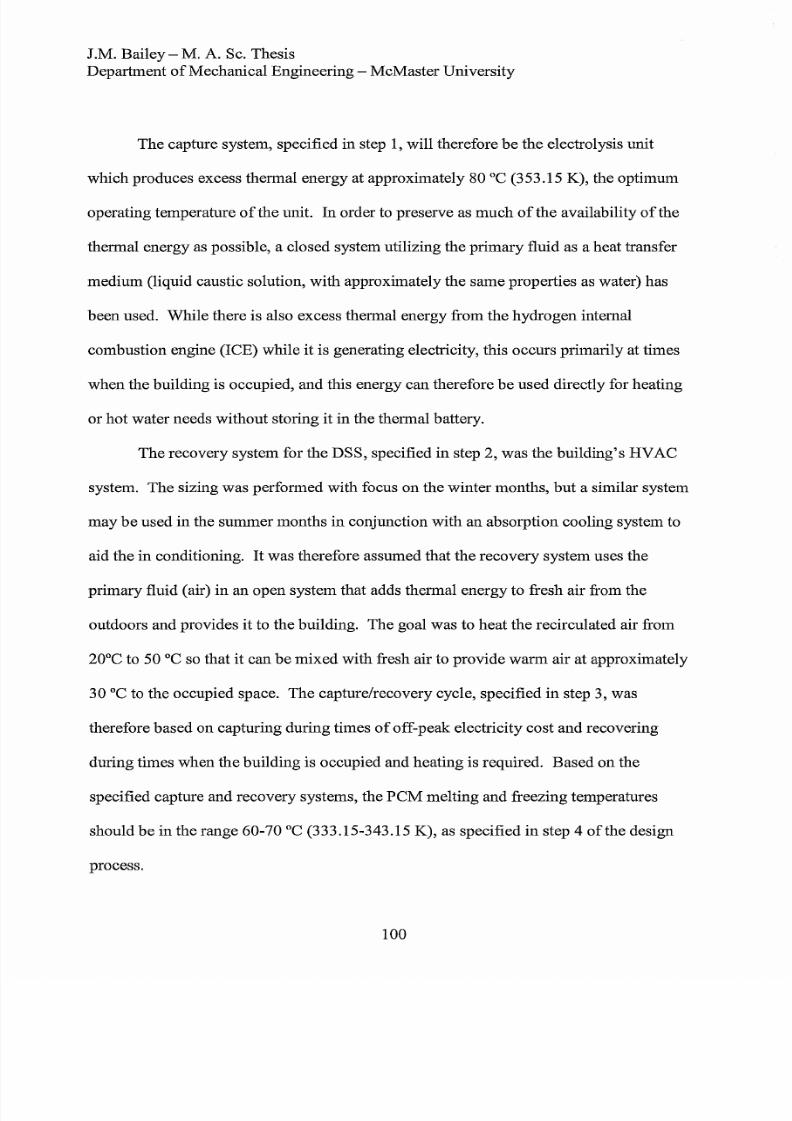
8/11/2019 Modelling Phase Change Material Thermal Storage
http://slidepdf.com/reader/full/modelling-phase-change-material-thermal-storage 116/173
J.M. Bailey M. A Sc. Thesis
Department of Mechanical Engineering - McMaster University
The capture system, specified in step 1 will therefore be the electrolysis unit
which produces excess thermal energy at approximately 80°C (353.15 K), the optimum
operating temperature of the unit.
n
order to preserve as much of the availability of the
thermal energy as possible, a closed system utilizing the primary fluid as a heat transfer
medium (liquid caustic solution, with approximately the same properties as water) has
been used. While there is also excess thermal energy from the hydrogen internal
combustion engine (ICE) while it is generating electricity, this occurs primarily at times
when the building is occupied, and this energy can therefore be used directly for heating
or hot water needs without storing it in the thermal battery.
The recovery system for the DSS, specified in step 2, was the building S HVAC
system. The sizing was performed with focus on the winter months, but a similar system
may
be
used
in
the summer months
in
conjunction with an absorption cooling system to
aid the in conditioning. It was therefore assumed that the recovery system uses the
primary fluid (air) in an open system that adds thermal energy to fresh air from the
outdoors and provides it to the building. The goal was to heat the recirculated air from
20°C to 50°C so that it can
be
mixed with fresh air to provide warm air at approximately
30
°C
to the occupied space. The capture/recovery cycle, specified
in
step 3, was
therefore based on capturing during times
of
off-peak electricity cost and recovering
during times when the building is occupied and heating is required. Based on the
specified capture and recovery systems, the PCM melting and freezing temperatures
should
be
in the range 60-70 °C (333.15-343.15 K), as specified in step 4 of the design
process.
100

8/11/2019 Modelling Phase Change Material Thermal Storage
http://slidepdf.com/reader/full/modelling-phase-change-material-thermal-storage 117/173
J.M. Bailey -
M A
Sc. Thesis
Department ofMechanical Engineering - McMaster University
6.4 PCM Selection
Using PCM material summaries from a literature review (Zalba et
al
2003) with
updated properties from the manufacturers (Rubitherm, 2009) a list of candidate materials
for energy storage is prepared as step 5 and presented
in
table 6.2 along with required
construction materials (step 6). All available properties were included to evaluate the
different materials and narrow the list based on undesirable heat transfer properties, high
cost or service life expectancy
ofless
than 10 years (step 7).
n
the search for additional
properties of Sodium Hydroxide it was determined from figure 6.4.1 that the required
concentration
ofNaO
in water to achieve the listed properties is approximately 68
by
weight (Dow Chemicals, 2009). This is much higher than the saturation solution quantity
of
52 at room temperature (Solvay Chemicals, 2009), seen in figure 6.4.2, which would
result in a decrease in concentration due to precipitate forming
if
the solution were
cooled, as is likely during initial manufacture, shipping and start-up. This would then
change the properties, making this material unacceptable for use as a PCM. Since RT65
is a stabilized form ofparaffin, it will be used instead ofn-triacontane to evaluate the
paraffin family. Several
of
the materials on the list are not common chemical compounds
and prices were therefore not available from suppliers for Polyglycol E6000 and Palmitic
Acid, which were eliminated on this basis, but should be investigated further when data
becomes available. The short list (step 8) is thus the highlighted materials in table 6.2.
The decision ofwhether or not to store some sensible energy is based on the
capture/recovery systems and timing as well phase change material properties. n the
case of the proposed system, there is only a small temperature difference between the
101
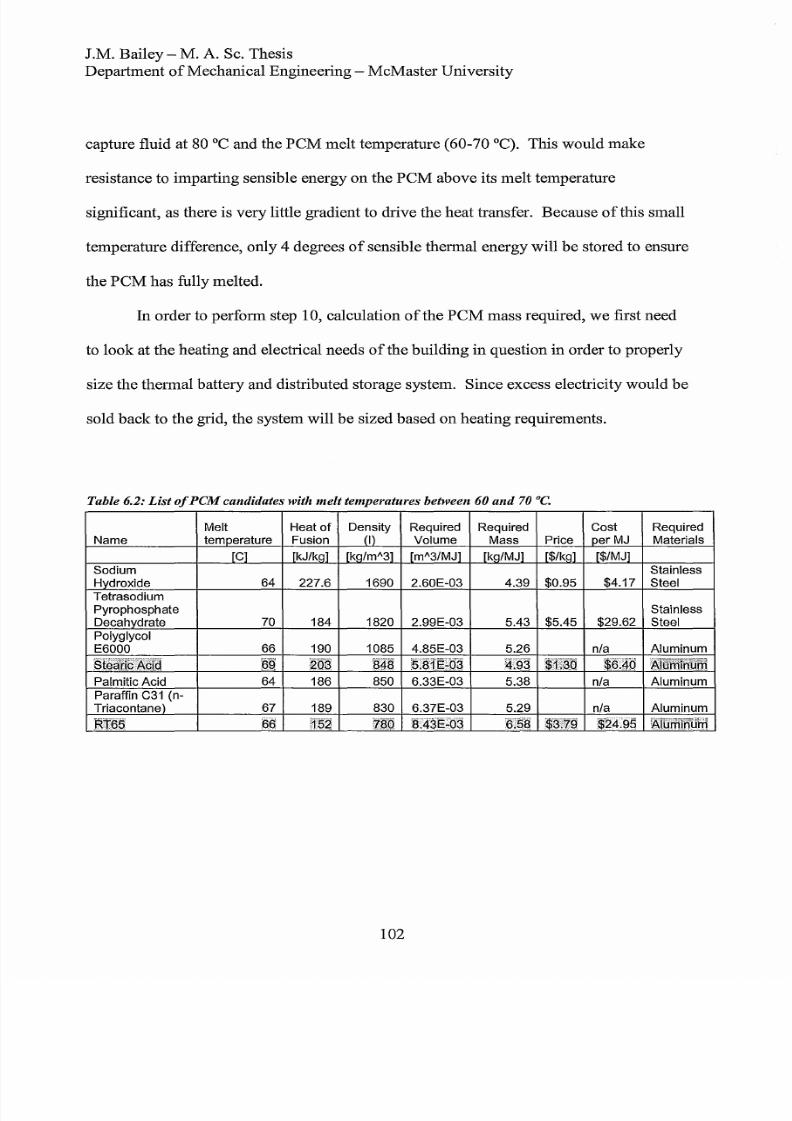
8/11/2019 Modelling Phase Change Material Thermal Storage
http://slidepdf.com/reader/full/modelling-phase-change-material-thermal-storage 118/173
J.M. Bailey - M. A. Sc. Thesis
Department
of
Mechanical Engineering - McMaster University
capture fluid at 8 °C and the PCM melt temperature 60-70 DC). This would make
resistance to imparting sensible energy on the PCM above its melt temperature
significant, as there is very little gradient to drive the heat transfer. Because of this small
temperature difference, only 4 degrees of sensible thermal energy will
be
stored to ensure
the
PCM
has fully melted.
n order to perform step 10, calculation
of
the PCM mass required, we first need
to look at the heating and electrical needs
of
the building
in
question
in
order to properly
size the thermal battery and distributed storage system. Since excess electricity would be
sold back to the grid, the system will be sized based on heating requirements.
Table 6.2:
List
ofPCM candidates with melt temperatures between 6 and
7 °C
Melt Heat of
Density Required
Required
Cost Required
Name
temperature
Fusion
(I)
Volume Mass Price
per MJ Materials
[C] [kJ/kg]
[kg/m
A
3]
[m
A
3/MJ] [kg/MJ] [ /kg] [ /MJ]
Sodium
Stainless
Hydroxide 64 227.6 1690 2.60E-03 4.39 0.95
4.17
Steel
Tetrasodium
Pyrophosphate
Stainless
Decahydrate 70 184 1820 2.99E-03 5.43 5.45
29.62
Steel
Polyglycol
E6000 66 190 1085 4.85E-03 5.26 n/a
Aluminum
SfeaHcACi'a 203 848 's.Blii
i
o
~ . 9 ~
1.aQ
6:40
: 6:1unlihUln
Palmitic Acid
64
186
850 6.33E-03 5.38
n/a
Aluminum
Paraffin
C31
(n-
Triacontane) 67
189
830 6.37E-03 5.29 n/a Aluminum
RIM
M
152
780
8 . 4 3 E ~ b 3
6 ; 5 ~
3;79
2,(95
A r u f l i n ~ U m
102
8/11/2019 Modelling Phase Change Material Thermal Storage
http://slidepdf.com/reader/full/modelling-phase-change-material-thermal-storage 119/173
J.M. Bailey - M.
A.
Sc. Thesis
Department of
Mechanical
Engineering - McMaster University
: ~ t
·-·;,lCE·j>
N i ~ O : ~
H : ~ }
( ; ~ ftvi;tl'
t w
j ~ f 4 & Q - . t f" ;:t}
•
f 'aC"J ,', ttf:?
G -
HnO,}
i,,(>
f:
- f - b ( ; l - - t ' ~
l ~ - t t ~ }
+ fi\n::t
h
}.4
j .1 f
( j ,c _ l ~ { { C i - : l ~ i D )
N ~ l n t l ' 1 4 1 ijJ. ,,<w:nTI It; )
ii
N,.GM;)t i'1i')
J - }4rr{f.'i;j;f,
If}
• rW,(;H;2
H,:?i)
t
tjtfCt i Z t W O ~
ffuC'J Ji1i)
~ \ ; ~
'-'
t ~ { ~ } ~
f ii fM:tt;1tt
t · 1 t ~ } ' , : i t ~ C t - t
P-I{ ,CH
4.(} M # " ~ ' , . ~ - - - v · - " " l _ " ~ " ' ~ ' _ " ' ~ i - " " " , ~ ~ _ · t ' w ' " , _ w ___
+ c_
;re
td
, ~ 1
,, ,,
NOtE
;Ke
Ctln'JE INiYlGAifS THI
§liJ Nl,\T 'I« lCH
Cfl¥l;lAtJj; flXl;:rr
1N CONti-;::l
~ r t i H 50lAITfON.
fWl11
TJ>
HOU.
~ i & m j 1 J c t l l l f l ' \ ,)t ,:';;(fli 1>;2 1,
}?lid EAt
N,'L. fUllrfolltQ Pvl'lfl@I:i:faClAw. 1042,
Fn)jjllnlltt 1fl'lttl
~ l i r " x H l f t \ J
:;i
1
HCif; r
..
'lilA, ,Itt Nt} H,
, I
ljiH)
I,
Figure 6.4.1: Solidus temperature for NaOH H2 systems Dow Chemicals, 2009).
1 3
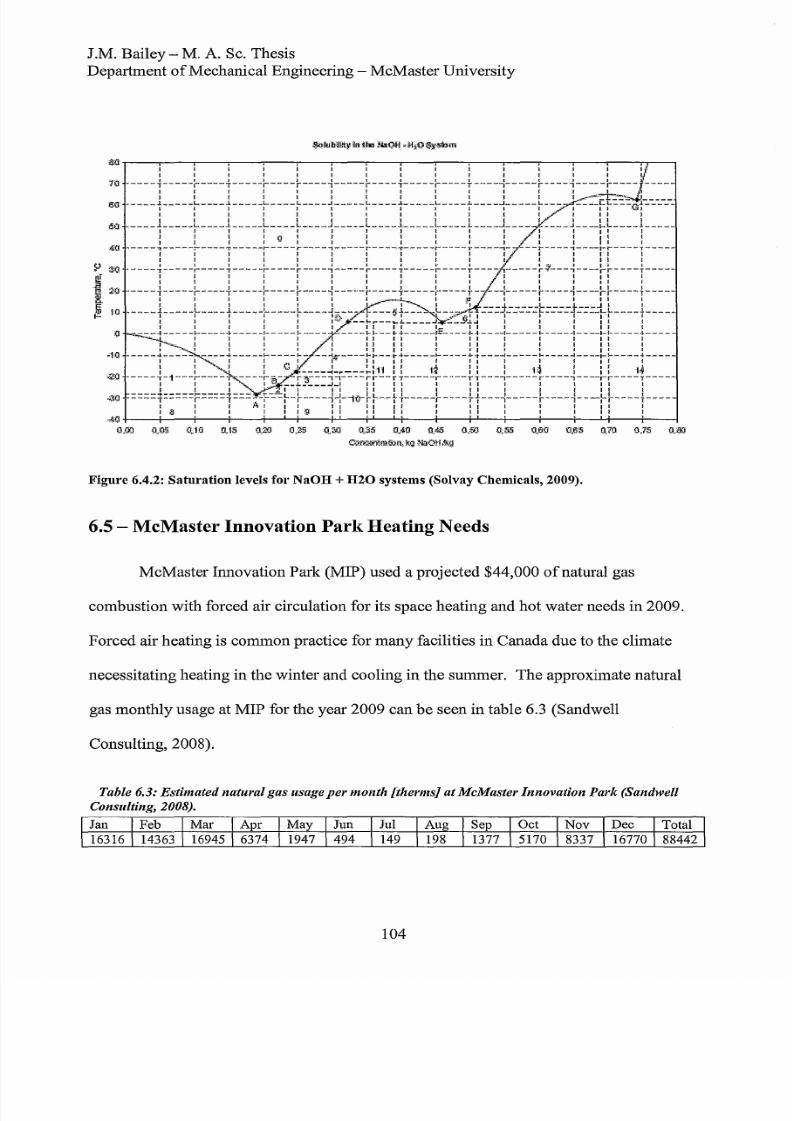
8/11/2019 Modelling Phase Change Material Thermal Storage
http://slidepdf.com/reader/full/modelling-phase-change-material-thermal-storage 120/173
J.M. Bailey - M. A. Sc. Thesis
Department of Mechanical Engineering - McMaster University
a a . - - - - r . - - - - ' - - ~ . _ - - ~ . r _ - - ~ , - - - - . _ - - ~ , - - - - . _ - - _ r . - - ~ . r _ - - . _ - - _ - - - - ~ . - - - - T , - - - - , , r - - .
I I I
j
I I I I I I I J
J
1 /
I I J I J I I J J I I I 1 I I
10 -1
-----r----t-
_
--r--
--r----i-----f
-- -t- --
-
-r---
-t
- ~ - - ' - : - --- f --
- i - - - ~
-r-
--
-.
-----
J I I I t J I I I I I I I - . . ; . - : = r : : : : ; - ~ ____
_
ao ~ - - - - t - - - - - ~ - - - - t - - - - - ~ - - - - ~ - - - - ~ - - - - - ~ - - - - t - - ~ - - ~ - - - - t - - - - ~ - - - - - ~ - - - ~ - - ~ ~ - - - G f - - - -
I I J I I I I I J I I I I I I I
I I t I I
t
I )
J
I I I I I
J
I
O ____ _____ L ____ _____ _ _ _ _ L ____ _____ L _ _ _ _ _ _ _ _ _ L _ _ _ _ L _ _ _ _J____
_ __ ____
i
I I I I if I I I I I I I I
: : : :
Q:
: : : : : : : : I : :
40 ,.---- 1 ...---t ' _-- 1 ---
--t--
---r----"1-----l"'----"t----
- t - ~ ~ - -y.--- -;- -
r
-_ f---I-t----- t----
I I I I I I I
J
I I I I J I I 1
I I I I I I 1 I I I I I: I I I I
30
~ - - - - ~ - - - - - ~ - - - - { - - - - - ~ - - - - ~ - - - - ~ - - - - - ~ - - - - { - - - - - ~ - - - - + - - - - - - - - - ~ ~ - - - ~ - - - - ~ ~ - - - - + - - - -
t I ( I I t I I l l I I I i I
i
f J I I
t
J Itt I J t I I 1
20
- i - - - - + - - - - f - - - - + - - - - ~ - - - - _ l - - - - - r - -
--f----+----f·- . -+----r-- - - _ l - - - - t ~ - - - - f - - - - -
i I I I
~
. . .
,l..,.. I j /g
{ i I I I I
Fi
J
J I I I l . I · 1 ---.l-----IC----l.---
J
I t
ll
fO _____ l
_____
L _ _ _ _ l.
_____
L _ _ _ _ L _ _ _ _ J____ iP L__
;. ___
. _ _ _ _ _ _ _ _ _
J
___ ...L
_ _ _ _
1 _ _ _ _ _
l : : :0
- - L ~ - - , . l ____ ~ _ . 9 1 ~
: : l : : :
I I I it II I I
J:r; J
I I I I I
J
I
g ~ - . : :
--
: -t---- -i -
---i
---
- i ~
r rt--
---F---
-tt---4-----j----1-
---ii-
---t----
i - ~
I ( I
~
I
II
I I
I
I I
J
I (
I I
I
I .,....... I I t I I I I I ttl I
J
J t I
~ ~ J
-
-t-- - - ~ ~ - - - i - --
- - ~ - - ~ - ~ ~
--i4'----ir--
r1-
--- -:----
·-t1--
-1- --- -:-- ----1----rr----
t -- ---
: : I
:
- - - - . . . : - r - - - ~ : · 1 1
::
1*
: : : : : :
----,-t---,---- ----r-- r ~ - - - - - - - r r - - r ' - - - - - r - - - - r ' - - - . - - - - - r - - - - ' - - - - r r - - - - r - - - - -
I I I
lB
_ _ t. _ _ _ _ .J_1 I I I I I 1 I I
J
I I
t
I
) I i 21 I ) I I Il it ) )
f l t
.; g = = = = i : : = = : l = : : : : i : : : - - F - = ~ - r - - - - _ l + i 1 ) - ~ ~ - - t i - - - - - t - - - - t + - - - + - - - - ~ - - - - - l - - - + l - - - - - f - - - -
t I i A
f
I J. 1 I j I I i I I I t Iii ,
t
8 )
I I I
-9
I I ; I I I I 1 I
J
I ) )
4 ) + _ - - - + - - - - r - - - _ r - - - - r _ ~ ; _ - - - 4 ~ - - ~ - - ~ - - - - + _ - - _ r L - ~ r _ - - _ r - - _ ; - - ~ ; _ - - _ + - - ~
0,00
0..15
0 5
(j,OO
Figure
6.4.2:
Saturation
levels for
NaOH +
H20 systems (Solvay Chemicals, 2009).
6.5 - McMaster Innovation
Park
Heating Needs
McMaster Innovation Park (MIP) used a projected $44,000 of natural gas
combustion with forced air circulation for its space heating and hot water needs
in
2009.
Forced air heating is common practice for many facilities in Canada due to the climate
necessitating heating in the winter and cooling in the summer. The approximate natural
gas monthly usage at MIP for the year 2009 can be seen in table 6.3 (Sandwell
Consulting, 2008).
Table
6.3:
Estimated natural gas usage
p r
month [therms] at McMaster Innovation Park Sandwell
Consulting, 2008).
104

8/11/2019 Modelling Phase Change Material Thermal Storage
http://slidepdf.com/reader/full/modelling-phase-change-material-thermal-storage 121/173
J.M. Bailey M. A. Sc. Thesis
Department
of
Mechanical Engineering - McMaster University
Thermal energy usage for the winter months (December to March) therefore
averages to 16,100 therms (1700 GJ) per month.
At
an assumed 85 gas furnace
efficiency based
on
the higher heating value
of
natural gas (38,200 kJ/Normalized_ m
3
,
this is an average winter heating requirement
of334
GJ each week. With 57 hours
of
capture time during the weekend and an additional 9 hours during four week nights, this
results
in
a total capture time of93 hours. Not all ofthis energy needs to
be
stored,
however, as some
of
it
can
be
used directly when
it
is produced. Assuming the heat load
is constant for the entire month, the hourly heat load average for the winter months is
2.0 GJ/hr.
In
order to produce all
of
the thermal energy required for the week during the
93
hours of capture time, this results
in
an hourly thermal energy production requirement
of
3.6 GJ/hr. Not all
of
the thermal energy produced requires storage, however, as
2.0 GJ/hr can
be
used directly.
The
storage capacity requirement for the phase change
material thermal storage system is therefore 1.6 GJ/hr for 57 hours,
or
9 GJ.
In
order to
store this 9 GJ
ofthermal
energy from the distributed storage system, the mass and
volume of each short listed PCM, calculated
in
step 10, is shown
in
table 6.4.
Both
the
RT65 and stearic acid will undergo further calculations although the RT65 was expected
to cost much more.
Table 6.4: RequiredP M mass and cost
t
store 91 GJ of atent thermal energy
Melt Heat of Density Required
Required
Material
Temperature Fusion
l l
Volume
Mass Price PCM Cost
[C] [kJ kQ]
[kQlm
A
]
[m
A
t
[kg] [ /kg]
[ ]
Stearic
Acid
69
199
940
489 459347 1.30 597,151
RT65
64
152 780 771 601382
3.79 2,279,236
105

8/11/2019 Modelling Phase Change Material Thermal Storage
http://slidepdf.com/reader/full/modelling-phase-change-material-thermal-storage 122/173
J.M. Bailey - M. A Sc. Thesis
Department of Mechanical Engineering - McMaster University
Because the DSS sizing was based
on
the thermal energy requirements of
McMaster Innovation Park, no transportation
of
the thermal energy was required
in
this
case. This means that step 11 did not impose any additional requirements on the system.
It was prudent, however, to design the cells such that they can
be
installed using a
standard lift truck and fit through standard sized equipment doors for ease
of
replacement. This also accommodates future needs if transportation becomes desirable.
The next phase
of
the design was therefore the determination
of
the cell storage time,
step 12.
6.6 PCM Thermal Storage System Sizing Results
The model inputs for the cell storage time sizing ofthe DSS thermal energy
storage system can
be
seen
in
tables 6.5 and 6.6 for the different PCMs. Due to the
corrosive nature of the capture fluid, separate capture and recovery channels were
required. Several different geometry iterations were performed, with the outputs for each
simulation found in tables 6.7 and 6.8 along with the raw material costs for each
configuration. For each simulation the capture channels were assumed to be stainless
steel with a total thickness
of
6.7
mm
and a wall thickness
of
1.6 mm. The recovery
channels were made of aluminum with a total thickness of 4.6 mm and a wall thickness of
1 mm. Because the channels are of different metals, the effect of a galvanic charge
between the channels should be evaluated
in
the phase change material to ensure that
significant corrosion and contamination
of
the
P M
do not occur. The commodity prices
of
stainless steel and aluminum are approximately
3
and 2
per
kilogram respectively.
106

8/11/2019 Modelling Phase Change Material Thermal Storage
http://slidepdf.com/reader/full/modelling-phase-change-material-thermal-storage 123/173
J .M. Bailey - M. A. Sc. Thesis
Department
of
Mechanical Engineering - McMaster University
It
can e seen from these results, plotted
in
figure 6.3 that the longer then charge time, the
less material costs in the thermal storage system. This is balanced y the capture and
recovery systems need for constant heat flux to ensure the system temperature does not
undergo large fluctuations.
Table
6.5:
Common inputs or the thermal energy storage system or McMaster Innovation Park
Capture
Recovery Recovery
Function
Units
Capture Fluid
Channel PCM Channel Fluid
Material
Water Stainless Steel Stearic Acid
Aluminum Air
Density [kg/m j 8000 940
2719 1 225
Heat Capacity [J/kgKj 500 2380
871
1006 43
Thermal Conductivity [W/mKj 16 4 0 3
202 4
0 0242
Latent Heat of Fusion [J/kgj 198800
Freezing temperature [Kj
340 95
Melt temperature
[Kj
341 95
Thickness
[mj
0 000508 Table 6 6 0 0015875 0 001778
onvective
Coefficient
[W/m
2
Kj
100
Bulk Temperature [Kj 353 15
Initial Temperature [Kj 337 95 337 95 337 95 337 95
Table
6.6:
Phase change material inputs or the thermal energy storage system
Function
Units
PCM PCM2
Material
RT65
Stearic Acid
Density
[kg/m
3
] 780 940
Heat Capacity [J/kgK] 2200 2380
Thermal Conductivity
[W/mK] 0 2 0 3
Latent Heat of Fusion [J/kg] 152000
198800
Freezing temperature [K] 336 341
Melt temperature
[K]
337 342
Thickness
[m]
Table 6 7 Table 6 8
Initial Temperature
[K]
333
338
107

8/11/2019 Modelling Phase Change Material Thermal Storage
http://slidepdf.com/reader/full/modelling-phase-change-material-thermal-storage 124/173
lM Bailey -
M.
A. Sc. Thesis
Department ofMechanical Engineering - McMaster University
Table
6.7:
Model outputs for the RT65 thermal energy storage system for several geometries.
PCM
Melt
Thickness
Time
PCM 55 AL
PCM
Cost
55
Cost
AL
Cost
Cell
Materials
[m]
[hr]
[%] [%] [%]
[ ] [ ] [ ]
[ ]
0.0075 0.5 78.2% 5.3% 16.5%
2,279,236.00
3,653,970 2,587,278
8 520A84
0.0113 1 84.4% 3.8% 11.9%
2,279,236.00
2A25,202
1J17 220
6A21,657
0.0167
2 88.9% 2.7% 8.4%
2,279,236.00
1,641,005 1,161,951 5,082,192
0.0208 3
90.8%
2.2% 6.9%
2,279,236.00
1,317,537 932,913 4,529,686
0.0243 4 92.1%
1.9%
6.0%
2,279,236.00
1,127,769 798,542
4,205,547
0.0216 5
91.1% 2.1%
6.7%
2,279,236.00
1,000,174
708,196
3,987,607
0.0302 6
93.5% 1.6% 4.9%
2,279,236.00
907A43
642,536 3,829,215
0.0327 7 94.0% 1.5% 4.6%
2,279,236.00
838,067
593A12
3,710,715
0.0351
8 94.4% 1.4% 4.3%
2,279,236.00
780,763 552,837 3,612,836
Table
6.8:
Model outputs
for
the stearic acid thermal energy storage system for several geometries.
PCM
Melt
Thickness
Time
PCM
55
AL PCM
Cost
55
Cost
AL
Cost
Cell
Materials
[m]
[hr]
[%]
[%] [%]
[ ] [ ] [ ]
[ ]
0.0053
0.5 71.7% 6.9% 21.4%
597,151
1,119,892 792,965 2,510,009
0.0083 1
79.9%
4.9% 15.2%
597,151
714,368
505,824 1,817,343
0.0127 2
85.9%
3.4% 10.7%
597,151
468,015
331,389
1,396,554
0.0161 3
88.5% 2.8% 8.7%
597,151
369,363
261,536
1,228,050
0.0190
4 90.1% 2.4% 7.5%
597,151
312,911 221,564 1,131,626
0.0216 5
91.1% 2.1%
6.7%
597,151
276,081
195A85
1,068,717
0.0239 6
91.9% 2.0%
6.1%
597,151
249,386 176,583
1,023,120
0.0260 7
92.5% 1.8% 5.6%
597,151
229,059 162,191
988AOl
0.0280 8
93.0% 1.7% 5.3%
597,151
212,856 150,717 960,724
108

8/11/2019 Modelling Phase Change Material Thermal Storage
http://slidepdf.com/reader/full/modelling-phase-change-material-thermal-storage 125/173
J.M.
Bailey-
M. A. Sc. Thesis
Department ofMechanical Engineering - McMaster University
9,000,000
8,000,000
7,000,000
c
<C
.J
6,000,000
-
II
0
5,000,000
.J
ni
' i :
4,000,000
I)
-
,
\
Stearic Acid
\
\
- .RT65
~ ~
---.
---.----
. .
- - - - -Hi - - - - - - i l i l -_-mI
CIl
e
3,000,000
Q
.J
2,000,000
"
1,000,000
A
-
o
1 2 3 4 5
6
7
8
9
harge Time [hours]
Figure 6.3: Cell material cost versus charge time for stearic acid and RT65 cells.
In
the case of the DSS thermal battery with 91 GJ of storage and either 489 m
3
of
stearic acid or 771 m
3
ofRT65, the limitation was
on
physical cell size rather than
thermal size, so the cell storage time can
be
as long as feasible based on the capture and
recovery cycle timing. The shortest off-peak capture period (Ontario Energy Board
2009), as seen previously in table 6.1, was 10:00 pm to 7:00 am on weekdays, or 9 hours
of
storage. Conversely the recovery was required for the remaining 15 hours per day to
meet heating needs in the winter months. Based on the material cost versus charge time
curve and these capture and recovery times, a cell storage time of 6 hours was therefore
chosen. This allows for some staggering of cell capture cycles to produce a more
constant system heat flux,
if
necessary, while reducing the number ofpartially charged
cells at the end
of
a cycle. These partially charged cells may cause atypical solidification
109

8/11/2019 Modelling Phase Change Material Thermal Storage
http://slidepdf.com/reader/full/modelling-phase-change-material-thermal-storage 126/173
J.M.
Bailey
M. A. Sc. Thesis
Department
of
Mechanical Engineering - McMaster University
behaviour upon recovery or melt behaviour upon charging as the melt front may become
significantly non-planar during the storage period due to potential dendritic growth ofthe
solid.
Based
on
the cell material cost, the RT65 system was eliminated at this point and
calculations continued only with stearic acid.
The
capture heat flux profile for the stearic
acid 6-hour capture time cell with a PCM thickness
of23.9
mm can
be
seen
in
figure 6.4.
The capture cycle heat flux profiles for cells staggered to start at 15 minute intervals is
seen in figure 6.5. Figure 6.6 shows the recovery heat flux for the 6-hour capture time
cell with an average bulk air temperature
of 25°C.
The effect
of
an error
of
+/- 20
in
cell charge time (4.8 to 7.2 hours) was also evaluated and shown to cause only a +/- 5
change
in
the cell material cost for the 6 hour cell. This percentage would, however,
be
larger for a cell with a shorter charge time.
900
800
700
600
E
500
><
l
400
iL
-
IS
300
)
:I:
200
1\
\
\
\
,
100
o
o
1 2 3
ime [h]
Figure 6.4: Capture cycle heat flux over time for 6-hour stearic acid capture cell.
110
5 6

8/11/2019 Modelling Phase Change Material Thermal Storage
http://slidepdf.com/reader/full/modelling-phase-change-material-thermal-storage 127/173
J.M. Bailey
M.
A. Sc. Thesis
Department of Mechanical Engineering - McMaster University
2 0 0 0 ~ - - - - - - - - - - - - - - - - - - - - - - - - - - - - - - - - - - - - - - - - - - - - - - - - -
1 8 0 0 - 4 - 4 - 4 - ~ ~ ~ ~ ~ - - - - 4 - 4 ~ ~ ~ ~ ~ ~ _ - - - 4 - -
1600
+ _ _ - + - _ _ + _ _ _ _ _ l l _ _ _ _ _ _ i l _ _ - - l l - - - - * - - - - - l i - - - l ~ i l - - - * _ _ _ _ _ + _ _ _ _ i l _ _ _ _ _ + _ _ _ _ _ l l _ _ _ _ _ _ i l _ _ _ _ l l I
Single Cell
N 1400 - Cell Average
<
E
~ 1200
x
1 0 0 0 ~ ~ ~ - w ~ ~ - ~ ~ - ~ H - ~ ~ ~ ~ ~ ~ ~ - ~ ~ - ~ H - ~
l
8 0 0 ~ _ H ~ ~ 4 ~ H r ~ ~ _ H ~ ~ ~ 4 _ H _ ~ ~ _ H ~ ~ ~ 4 _ H _ _
U
G
J:
600 +--'4--t-+-*---'ri------'rl-----'l+--'+----'\f-----'rl-'.l----- <f------'rt-''+--++-*---'ri------'rl---'+-'+----'I-+-----\iI-----+l-----''<+______'>
400
-k---- 'k--- ',k-
200
O - - - - - - - ~ - - - - - - - - ~ - - - - - - - - ~ - - - - - - ~ - - - - - - - - ~ - - - - - - - - .
o
1
2 3
Time [h]
4
5
6
Figure 6.5: Net capture cycle
heat
flux using 6-hour stearic acid
capture
cells staggered
at
15 minute
intervals.
3500
3000
2500
N
<
E
~ 2000
X
l
~ 1500
U
G
J: 1000
500
o
\
\
\
~
0.0 0.2
0.4
0.6
Time
h]
0.8
1.0 1.2
Figure 6.6: Recovery cycle
heat
flux over time for 6
hour
stearic acid
capture
cell
1
hour recovery
time with
an
average
bulk
recovery fluid
temperature of 25°C.
111

8/11/2019 Modelling Phase Change Material Thermal Storage
http://slidepdf.com/reader/full/modelling-phase-change-material-thermal-storage 128/173
J .M. Bailey - M.
A
Sc. Thesis
Department
of
Mechanical Engineering - McMaster University
6.7 DSS System Sizing Results
Dependent
on
the volumetric restrictions for the distributed storage system and
thermal battery, a decision was required
on
whether or not the hydrogen will
be
compressed before storage.
The
system volume and electrical requirements were
determined for both cases in order to provide all the relevant information for this
decision.
The
system designed without compression was denoted as system A with the
system using a storage pressure of400
bar
denoted as system B. As noted in section 6.2,
system A has a total electrical storage efficiency
of
37% and system B 28%.
The
electrical output of the system is the portion
of
the total energy that is not thermal energy.
The electrolysis efficiencies
of74
for system A and 55% for system B were based
on
Hydrogenics' (2009) HySTAT-A product literature and compression data from Praxair
(2003). For the proposed system with 9 GJ ofweekly thermal energy storage from
electrolysis this resulted in a required hydrogen production
of
880 Normalized_m
3
/h for
system A and 660 Normalized_m
3
/h
for system B each week. This would require 60 and
44 HySTAT-A cell stacks respectively (Hydrogenics, 2009). Given the cumulative
winter on-peak electricity pricing time
of35
hours
per
week, and a generating efficiency
of 50% of the higher heating value ofhydrogen (Shudo, 2007), 1.77 kWh
Normalized_ m
3
, the distributed storage systems would require generation sets of 4200
kW
and 3200
kW
for systems A and B respectively. With an average on-peak demand
of
410
kW
during the winter months (Sandwell Consulting, 2009) this resulted
in
at least
3790
kW or
2790
kW
of excess energy that can
be
sold back to the grid, while
completely eliminating the need to purchase electricity at on-peak prices. Also, the
2

8/11/2019 Modelling Phase Change Material Thermal Storage
http://slidepdf.com/reader/full/modelling-phase-change-material-thermal-storage 129/173
1.M.
Bailey M
A.
Sc. Thesis
Department
of
Mechanical Engineering - McMaster University
thermal energy created by these generators can either
be
used to generate more electricity
or can
be
sold on the thermal energy market due to its high availability.
The volume required for hydrogen storage was calculated from the longest storage
time
of
57 hours over the weekend. This means that a storage capacity 57 93, or
61
of
the hydrogen gas must
be
available. System A, with a storage pressure
of25
bar would
therefore require 2.7 of the normalized volume and system B, with a storage pressure of
400 bar would require 0.22
ofthe
normalized volume calculated using the ideal gas law
modified with a compressibility factor (Incropera DeWitt, 2002). This results in a
hydrogen storage capacity of 1360 m
3
for system A and 82 m
3
for system B, a 16-fold gas
storage space advantage for the system with gas compression.
The volume required for the thermal storage system is the same for both systems
A and B and is calculated
by
multiplying the required PCM volume
by
the volume ratio.
This volume ratio is calculated
by
dividing the PCM thickness
by
the total cell thickness
from the centre of the capture channel to the centre of the recovery channel and adding an
additional 20 for insulation, fluid routing and structural materials. This volume ratio
for the 6 hour capture cell is 1.48, resulting in a total thermal storage system volume of
730 m
3.
Summaries
of
both systems A and B are shown in table 6.9 for comparison.
113

8/11/2019 Modelling Phase Change Material Thermal Storage
http://slidepdf.com/reader/full/modelling-phase-change-material-thermal-storage 130/173
J.M. Bailey - M. A Sc. Thesis
Department ofMechanical Engineering - McMaster University
Table
6.9:
Summary
of
Distributed Storage Systems A
nd
B with
nd
without storage compression.
Parameter Units
System A SystemB
Thermal Energy Storage GJ
91 91
Cell Material Cost CAD 1.02 M
1.02M
Thermal Storage Cell Volume
m:
730
730
Storage Pressure
Bar 25
400
Storage Efficiency % 37%
28%
Electrolysis Efficiency % 74% 55%
Weekly Hydrogen Production Normalized m' 25,000 19,000
H2 Generation Capacity
Normalized mJ/h
440 330
HySTAT-A Cell Stacks 60 44
Generator Set Capacity kW 4200 3200
Minimum Excess Capacity kW 3790 2790
H2
Storage Capacity
m:
1360 82
While adding a thermal storage system to the DSS does not change the thermodynamic
efficiency
of
the round-trip storage efficiency, it does
tum
the thermal energy caused by
the inefficiency in the electrolysis process into useful energy. For this reason, a new
efficiency for the electrolysis process was defined that is based on the useful thermal
energy not contributing to the component efficiency. Since all of the thermal energy
from the electrolysis is used, the new efficiency of this component was therefore defined
as 100%, increasing the round-trip storage efficiency by a factor
of
1.36. This made the
new average efficiencies for systems A and B 49.8% and 37.4% respectively for
December to March, 47.5% and 35.7% for November to April and 42.8% and 32.1 % for
the entire year.
The total cost of the system requires specific quotes for additional system
components such as hydrolysis units, gas storage cylinders, hydrogen internal combustion
generator sets and associated electrical equipment. t was determined, however, that the
thermal storage system will cost more than one million Canadian dollars. Given a
114

8/11/2019 Modelling Phase Change Material Thermal Storage
http://slidepdf.com/reader/full/modelling-phase-change-material-thermal-storage 131/173
J .M. Bailey - M. A Sc. Thesis
Department ofMechanical Engineering - McMaster University
projected payback period
of3
years, one thirtieth of this cost is 63,000. Since the
potential natural gas savings from using a thermal storage system is 45% (the heating
load not occurring during thermal energy production) of the 44,000 spent on natural gas
per year based on 2009 projections, additional sources of revenue from feed-in tariffs,
carbon offset credits and oxygen sales would need to
be
realized to create an
economically feasible system.
The
carbon offsets realized from eliminating the need for natural gas heating at
McMaster Innovation Park was calculated based on 5.32 metric tonnes of carbon dioxide
per 1000 therms
of
natural gas combustion (Natural Gas, 2009). For the total
88,442 therms ofnatural gas used by MIP this results in a carbon dioxide savings of
470 tonnes. Since the average car produces approximately 4-5 tonnes
of
carbon dioxide
per year (Moblu, 2009), this is an equivalent amount
of
carbon dioxide savings to taking
more than 100 cars off the road.
115

8/11/2019 Modelling Phase Change Material Thermal Storage
http://slidepdf.com/reader/full/modelling-phase-change-material-thermal-storage 132/173
J.M. Bailey - M. A Sc. Thesis
Department
of
Mechanical Engineering - McMaster University
CH PTER
7
Conclusions and Recommendations
7 1
Analytical Model
n analytical model was developed in this study based on one-dimensional
pseudo-steady heat transfer through a phase change material thermal storage cell with
laminar capture and recovery flow and rectangular channels. This model is intended for
use
in
preliminary consideration of thermal energy storage systems where detailed
geometry and phase change material property information is not available and other two
or three dimensional models can therefore not be used. This model was compared to test
data and a three-dimensional CFD model without natural convection and found to have
good agreement with both. The parametric behaviour was also compared to a two-
dimensional CFD model without natural convection and found to match the trends.
he
model limitations that were tested in the parametric study are listed in table 7.1. In
addition to these table 7.2 presents additional limitations and recommendations. While
further refmements to the model are both possible and advised the model developed
in
this study can be used for preliminary sizing of thermal energy storage systems.
116

8/11/2019 Modelling Phase Change Material Thermal Storage
http://slidepdf.com/reader/full/modelling-phase-change-material-thermal-storage 133/173
J .M. Bailey - M. A. Sc. Thesis
Department ofMechanical Engineering - McMaster University
Table
7.1:
Summary
of
successfully tested ranges
for
model input parameters
Parameter Units Minimum Maximum
P M Latent Heat
of
Fusion J/kg 91,400 219.360
P M Thermal Conductivity
W/mK.
0.1 100
P M Heat Capacity J/kgK
1075 2580
CapturelRecovery Fluid Thermal Conductivity
W/mK. 0.01 10
CapturelRecovery Fluid Heat Capacity
J/kgK 100 5000
CapturelRecovery Fluid Convective Heat Transfer Coefficient
W/mL K
10
10,000
Capture/Recovery Flow Regime Laminar
Laminar
Capture/Recovery Channel Thermal Conductivity
W/mK. 202
CapturelRecovery Channel Heat Capacity J/kgK 100 5000
Capture/Recovery Temperature - Melt Temperature
°C
2
50
Initial Subcooling or Superheating
°C
1.05 20
Note: the convectIve coefficIent was tested for a much WIder range of values than would be afforded for
la1ninar flow, however the model is currently set up for laminar flow only.
Table
7.2:
Additional model limitations
nd
recommendations for use
Parameter Recommendation or Limitation
Geometry
Rectangular Channels
CapturelRecovery Temperature to Melt Temperature Difference
No less than 5 °C
Phase Change Material Melting Temperature to Solidification Less than 1
°C
- any more than this
Temperature Difference
should
be
verified experimentally
Channel Orientation V ert ica1- to ensure trapped gas
bubbles do not hinder heat transfer
Channel Thickness Less than 40
mm
- larger
geometries should be verified
experimentally
7.2 Further Model Development and Validation
Further evaluation of the assumptions used in the analytical model should
be
performed based on realistic thermal battery geometries. In order to determine a
reasonable range of phase change material thicknesses, several more systems should be
sized based on a wide range of thermal storage applications. This range of thicknesses,
combined with engineering estimates of reasonable cell heights and widths, will then
provide a range
of
geometries and boundary conditions that should
be
investigated to
assess natural convection and linearity of temperature profiles in the liquid phase change
material. Quantifying the effect of natural convection, discussed later in section 7.4, and
117

8/11/2019 Modelling Phase Change Material Thermal Storage
http://slidepdf.com/reader/full/modelling-phase-change-material-thermal-storage 134/173
J.M.
Bailey
M. A. Sc. Thesis
Department ofMechanical Engineering - McMaster University
non-linear temperature profiles using either CFD or equations from the literature will
then indicate whether
or
not these assumptions should
be
eliminated from the model
or
modified to more accurately represent the behavior of real thermal energy storage
systems.
7.3 PCM Effective Thermal Conductivity Enhancement
A comprehensive literature review
on
effective thermal conductivity
enhancements should
be
performed with specific focus on the effect of overall system
size and cost. Additional investigation into other methods
of
heat transfer enhancement
such as maximizing natural convection cells
in
the liquid phase through optimized
geometric design or utilizing electrohydrodynamics to increase velocities
in
the liquid
phase would also aid
in
decreasing the capture and recovery time for a given thickness.
Enhanced heat transfer structures such as fms within the PCM can also
be
investigated
as they will aid
in
both the capture and recovery processes. All enhancements however
should be evaluated based on the effect they have on overall system cost and size.
7 4 Convective Heat Transfer in Liquid PCM
Even without any enhancements convective heat transfer cells will form
in
the
liquid phase change material. This is highly dependent on the detailed geometry
of
the
cells and therefore difficult to predict in the preliminary feasibility study.
Experimentation should therefore be done on any expected geometries not in the
literature to try to determine the effect
of
convective cells
on
the effective thermal
conductivity
in
the phase change material. In this way estimates
of
this effect can be
118

8/11/2019 Modelling Phase Change Material Thermal Storage
http://slidepdf.com/reader/full/modelling-phase-change-material-thermal-storage 135/173
J.M. Bailey - M. A Sc. Thesis
Department ofMechanical Engineering - McMaster University
applied to the model to improve the accuracy
of
the system sizing. The use
of
effective
thermal conductivity in estimating convective heat transfer cells can also be evaluated
and a modified analytical model created
if
it is found deficient.
7.5 PCM Properties Library
One of the major hurdles facing phase change material thermal battery design is a
lack
of
readily available material property information. Creation
of
a phase change
material properties database including freezing temperature melt temperature density
versus temperature equations latent heat of fusion heat capacity liquid thermal
conductivity solid thermal conductivity liquid viscosity and thermal cycling stability
would allow designers to evaluate a wider range ofphase change materials. This would
also enable automatic phase change material selection via sizing software greatly
reducing the time required for a designer to evaluate the benefits of a thermal storage
system.
7 5 1 Thermal Conductivity Testing
While methods exist for measuring thermal conductivity of solids accurately the
phase change material database requires thermal conductivity near the melting and
freezing temperatures. This necessitates test methods capable ofmeasuring thermal
conductivity in both solids and liquids. Many solid materials also exhibit anisotropic
thermal conductivity behaviour and testing of a single sample in more than one direction
is also desirable. Methods must therefore e developed for testing the thermal
119

8/11/2019 Modelling Phase Change Material Thermal Storage
http://slidepdf.com/reader/full/modelling-phase-change-material-thermal-storage 136/173
J.M. Bailey - M. A Sc. Thesis
Department
of
Mechanical Engineering - McMaster University
conductivity ofboth liquid and solid phase change materials near their phase change
temperature.
7.5.2 Thermal Cycling Stability Testing
While some thermal cycling stability testing has been done
in
the past,
it
has
usually been for less than 1000 cycles. Considering the service life requirements for a
large-scale thermal storage system, the number of cycles should be increased to more
accurately reflect the actual number of cycles a system would undergo in 30 years. This
would change based on the capture and recovery cycle, but is approximately 11,000,
assuming one full cycle
per
day.
7.6 H
2
Green Distributed Storage System
While the H
2
Green distributed storage system for McMaster Innovation Park is
technically feasible, further information is needed to determine economic feasibility.
Since energy storage systems that shift the load on the electrical grid from on-peak to off-
peak times are not cunently included in Ontario s Feed-In Tariffprogram, a contract
would have to be negotiated to determine the price paid for the electricity provided to the
grid at on-peak times. Pricing for oxygen sales would also have to be negotiated with a
potential buyer based on the quantity, pressure and purity
of
oxygen produced by the
electrolysis units. he potential for carbon offset credits should also be explored and a
better estimate
of
material costs based on actual quotations could also be obtained now
with known quantities and preliminary geometries.
120

8/11/2019 Modelling Phase Change Material Thermal Storage
http://slidepdf.com/reader/full/modelling-phase-change-material-thermal-storage 137/173
J .M. Bailey -
M
A Sc. Thesis
Department
of
Mechanical Engineering - McMaster University
REFEREN ES
Bush, Rick and Wolf, Gene. "Utilities Load Shift With Thermal Storage".
tdworld.com substations/thermal-storage-utilities-Ioad-2009080 l/index.html,
Transmission and Distribution World, Penton Media Inc. Web.
19
Oct. 2009.
Carslaw, H.S. and Jaeger J.C. Conduction
of
Heat in Solids, 2
nd
Ed. Oxford University
Press, New York (1964).
Cole Parmer - RK-07012-20 Miniature Gear Pump Specifications.
http://www.coleparmer.ca/catalog/product_view.asp?sku=0701220&pfx=RK. Web.
22 Nov. 2009.
Domanski, R., Rebow, M., Nagano,
K
and Gorczak, D. Investigation
of
Free
Convection
in
Melting Zone During the Solidification and Melting
of
PCMs. lEA, ECES
IA Annex 10, Phase Change Materials and Chemical Reactions for Thermal Energy
Storage 6
th
Workshop Stockholm, Sweden (2000).
Dow Chemicals - Caustic Soda Product Information, http://www.dow.com
PublishedLiterature/dh_0048/0901 b803 80048fl a.pdf?filepath=causticsoda/pdfs/noreg/l 0
2-00417.pdf&fromPage=GetDoc. Web.
18
Nov. 2009.
Drage, Graham. "Phase Change Material Used In Temperature Controlled Packaging &
Transport".
l
Articles (2009). http://www.alarticles.com article_978704_53.html.
Web. 25 Oct. 2009.
Engineered Systems. "Thermal Storage Finds Cool Results In Midwestern Cities".
www.esmagazine.com Articles/Case_In_Point/aI95e38468ba8010VgnVCMI00000f932
a8cO
BNP Media. Web. 24 Oct. 2009.
Glacier Tek - RPCM Coolvest, www.glaciertekcom. Web.
19
Oct. 2009.
Hummel Croton Inc. - Stearic Acid MSDS -
www.hummelcroton.com msds/steara_m.gtml. Web. 14 Dec. 2009.
Hydrogenics - HySTAT-A Energy Station product literature, http://www.hydrogenics
.com onsite/pdflHySTAT-A%20Energy%20Station_web.pdf, accessed Jan 23,2009.
Incropera, F.P., DeWitt, D.P. Fundamentals
of
Heat and Mass Transfer, 5
th
Ed. John
Wiley and Sons,
New
York (2002).
Intertec - DD830-0e Safe Link with Passive PCM Cooling System. www.intertec.info.
Web. 25 Oct. 2009.
121

8/11/2019 Modelling Phase Change Material Thermal Storage
http://slidepdf.com/reader/full/modelling-phase-change-material-thermal-storage 138/173
J.M. Bailey - M. A. Sc. Thesis
Department ofMechanical Engineering - McMaster University
Kays, W.M. and Perkins, H.C. in Rohsenow, W.M., Harnett, J.P. and Fanic, E.N.
Handbook
of
Heat Transfer Fundamentals, Chapter 7, McGraw-Hill, New York, 1985
(1972).
Kenisarin, M. and Mahkamov,
K
Solar energy storage using phase change materials,
Renewable Sustainable Energy Review
11
(9) (2007), pp. 1913-1965.
Khudhair, A. and Farid, M. A review on energy conservation in building applications
with thermal storage
by
latent heat using phase change materials. Energy Conversion and
Management 45 (2004), pp.263-275.
Kline, S.J. and McClintock, F.A. Describing Uncertainties in Single-Sample
Experiments. Mechanical Engineering
73
Jan (1953). pp. 3-9.
Makrolon - Makrolon 2405 Datasheet. http://www.bayermaterialsciencenafta.com
resources/d/document.cfrn?Mode=view&f=13F00037-EOC4-6D2A
E45AA7C274ABEA9F&d=14A728A5-EDFB-DEI8-1B841BB81F34D6D5, Bayer
Material Science LLC, 2007. Web. 27 Oct. 2009.
MacCracken, M., "Energy Storage: A Critical Path to Sustainability". CALMAC
Manufacturing Corporation - Lessons Learned, 6 (2009), pp 49-50. Web.
13
Dec. 2009,
http://www.calmac.com documents/EnergyStorage_ ACriticalPathToSustainability_ Lesso
nsLearned2009.pdf
Mills, A., Farid, M., Selman,
J
and EI-Hallaj, S Thermal conductivity enhancement of
phase change materials using a graphite matrix. Applied Thermal Engineering 26 (2006),
pp. 1652-1661.
Moblu - Frequently Asked Questions - How much C02 does an average car produce in a
year?, http://www.moblu.calfaq#4.
18
Dec. 2009.
Nagano, K., Mochida, T., Iwata, K., Hiroyoshi, H. and Domanski,
R
Thermal
Performance
ofMn
N03)2·6H20
as a New PCM for Cooling System. lEA, ECES IA
Annex 10, Phase Change Materials and Chemical Reactions for Thermal Energy Storage
6
th
Workshop Stockholm, Sweden (2000).
National Instruments - NI-9213 16-Channel Thermocouple Module Data Sheet.
http://sine.ni.com/ds/app/doc/p/id/ds-69/Iang/en. Web. 22 Nov, 2009.
Natural Gas - Environment and Technology Data -
http://www.naturalgas.org/environment/naturalgas.asp. Web.
18
Dec. 2009
Neslabs - Endocal RTE-Series Refrigerated Bath/Circulator Instruction and Operation
Manual. NESLAB Manual
PIN
013853 Rev.
03/22/93, 1993).
122

8/11/2019 Modelling Phase Change Material Thermal Storage
http://slidepdf.com/reader/full/modelling-phase-change-material-thermal-storage 139/173
J.M. Bailey
M
A. Sc. Thesis
Department
of
Mechanical Engineering - McMaster University
Omega - HFS-3, HFS-4 Thin Film Flux Sensors User's Guide. M184411105 (2005).
Omega - FP-5060 Series Micro-Flow Sensors User's Guide. M-2579/0307 2007).
Omega - ANSI and IEC Colour Codes and Thermocouple Tolerances.
http://www.omega.comltemperature/pdf/tc_colorcodes.pdf. Web. 22 Nov 2009.
Ontario Energy Board - Electricity Prices in Ontario,
http://www.oeb.gov.on.ca/OEB/For+Consumers/Understanding+Y our+Bi11+Rates+and+
Prices/Electricity+Prices+in+Ontario. Web. 23 Jan. 2009.
Praxair - Hydrogen Delivery, Liquefaction and Compression ,
http://www1.eere.energy.govlhydrogenandfuelcells/pdfs/liquefaction_comp-.pres
-'praxair.pdf, presentation delivered to Strategic Initiatives for Hydrogen Delivery
Workshop, May (2003). Web. 12 Jan. 2009.
Rubitherm - RT Latent Heat Materials Product Information http://www.rubitherm.coml
english/pages/02a_latenCheat-'paraffins.htm. Web. 18 Nov. 2009.
Salton, Jeff. Phase Change Materials for the Perfect Cup of Coffee .
www.gizmag.comlphase-change-cup-coffeeI12596/. Mike Hanlon Publisher. Web.
19 Oct. 2009.
Sandwell Consulting - Internal Document, MIP- 182923 BLOCK LOAD , calculated at
02:26 PM on 0911112008.
Sari, A. Form-stable paraffinlhigh density polyethylene composites as solid-liquid phase
change material for thermal energy storage: preparation and thermal properties. Energy
Conversion and Management 45 (2004), pp. 2033-2042.
Sari, A. Eutectic mixtures of some fatty acids for latent heat storage: Thermal properties
and thermal reliability with respect to thermal cycling. Energy Conversion and
Management 47 (2006), pp. 1207-1221.
Sari,
A
and Karaipekli, A. Thermal conductivity and latent heat thermal energy storage
characteristics ofparaffInlexpanded graphite composite as phase change material.
Applied Thermal Engineering 27 issues 8-9 (2007) pp.1271-1277.
Seebeck, T.J., Magnetische Polarisation der Metalle und Erze durch Temperaturdifferenz.
Abhandlungen Deutsch Academie der Wissenschaften zu Berlin, Engelmann, Leipzig
(1895) written 1822-1823, 265-373.
123

8/11/2019 Modelling Phase Change Material Thermal Storage
http://slidepdf.com/reader/full/modelling-phase-change-material-thermal-storage 140/173
J.M. Bailey -
M
A
Sc. Thesis
Department ofMechanical Engineering - McMaster University
Shah, R.K. and London, A.L. Laminar Flow Forced Convection in Ducts. Academic
Press, New York, (1978).
Shudo, T. Improving thennal efficiency
by
reducing cooling losses in hydrogen
combustion engines. International Journal of
Hydrogen Energy 32 (2007) 4285-4293.
Sigma-Aldrich - Stearic Acid Product Search - www.sigmaaldrich.comlcanada
english.html. Web. 14 Dec. 2009.
Soda-Fabrik Societe Badische Anilin - Brevet D'Invention: Pro cede pour la production
d'ammoniaque a partir de ses elements. Republique Franyaise - Office National de
la
Propriete Industrielle (1910).
Solar Millenium - The Parabolic Trough Power Plants
ndasoll
to 3
www.solannillennium.de/uploadlDownload/Technologie/ eng Andasoll-3 engl.pdf, Solar
Millenium
G
(2008). Web. 25 Oct. 2009.
Solvay Chemicals - Caustic Soda Infonnation Sheet, http://www.solvaycausticsoda.com
Idocroot/caustic/static_files/attachments/pch_lll 0_0007 _ w _en_ww_.pdf. Web.
18
Nov. 2009.
Starfrit - Electronic Kitchen Scale 93018 - www.starfrit.comlProductslkitcheniGadgets/
Kitchen%20Scales/93018.aspx?sc_lang=en-CA. Web.
13
Dec. 2009.
Venna, P., Varun and Singal,
S
Review
of
mathematical modeling
on
latent heat
thennal energy storage systems using phase-change material. Renewable and Sustainable
Energy Reviews 12
(2008), pp. 999-1031.
Williams, Marie. Chicago District Cooling Plant Exceeds Expectations. The Official
Newsletter of International District Energy Association 14 (2) (1998), p
8
Web.
24 Oct. 2009.
Xiao, M., Feng, B. and Gong, K Preparation and perfonnance
of
shape stabilized phase
change thennal storage materials with high thennal conductivity. Energy Conversion
and Management
43
(2002), pp. 103-108.
Zalba, B; Marin, J; Cabeza, L; Mehling, H. Review on thennal energy storage with phase
change: materials, heat transfer analysis and applications, Applied Thennal Engineering
23 (2003) pp. 251-283.
124

8/11/2019 Modelling Phase Change Material Thermal Storage
http://slidepdf.com/reader/full/modelling-phase-change-material-thermal-storage 141/173
J.M.
Bailey M A
Sc. Thesis
Department
of
Mechanical Engineering - McMaster University
ApPENDIX A EXPERIMENTAL ApPARATUS ESIGN DETAILS
A.1 PCM Chamber
The PCM chambers were made to order
by
P A Plastics at 150 Main St.
E
in
Hamilton, Ontario at a cost of approximately 82 Canadian dollars per unit. The material
used was Makrolon polycarbonate from Bayer Material Science. Dimensions of the PCM
chamber can be found in figure
A.I.
The properties ofMakrolon can be found in the
product data sheet
in
table
A.I
(Makrolon, 2009).
Figure A.1: PCM chamber dimensions.
125

8/11/2019 Modelling Phase Change Material Thermal Storage
http://slidepdf.com/reader/full/modelling-phase-change-material-thermal-storage 142/173
I.M. Bailey -
M
A. Sc. Thesis
Department
of
Mechanical Engineering - McMaster University
Table
A I:
General
and
thermal properties ofMakrolon polycarbonate Makrolon, 2009).
ASTM
Makrolon,g, 240512407/2456
Typical Proper ties' Test Method Resins
for Natural Resin
(olher)
U S. Conventional
I
SIMetric
General
o
pecl1ic
Grflliily
0792
Oensity
0792
O.043lblin'
I
1.20 gtem
Specif ic V{) ume
0792
23.1
in'/lb
0.83
cm /g
M{)ld shrinkaRe
0955
0.005--i).007 inlln 0.005-0.007 mmimm
Waler Absorp ion, Immersion
at 73 F
(2S'C):
0570
24 Hours
0.12%
Equilibrium
0.30%
Mell Ffow Rate
4
at 300 Cf1.2ckg Load
01238
209110 min
Thermal
Oelleclion Temperature, Unannealed: 0648
0.25tHn (6.4-mm} Thickness
264-psi (1.82·MPa) Load 259 F
126'C
56·psi (i146-MPa) load 27S'F
134'C
Coefffcient of Linem Thermal ExpansIOn 0696
3.34 E-{)5 inlinfF
6.0 E-05 mm/mmi C
Thermal Conductivity C177
1.39 Btu.Jn/{h.fWF) 0.20 Wl(m·K)
Specific Heal
02766
0.28 Btu/{lb·
F}
1,172 Jf(kgK)
Relative Temperature Index:
(Ul746B)
0.059·in (L5·mm) Thickness
Etecliical
12S'C
Mechanical wilh Impact
i iS C
Mechanical without Impact 12S'C
Vicat Softening Temperature, 50 N,
50 Clh
D 1525
291'F
I
144'C
A.2 CapturelRecovery Flow Channel
The capture/recovery flow channel was fabricated in-house from 6061 aluminum
sheet 1/8 thick and a rectangular aluminum channel 4 x 2 x 0.120 thick, cut
in half
and tack-welded to the 24 x 8 sheet. The edges were later sealed with silicone caulking
to prevent leaks. The ends of the channel were capped with 0.120 aluminum plate and
fittings attached using welded on I thick custom-made bosses threaded to fit a 1/4 NPT
fitting. Detailed drawings of the Capture/Recovery flow channel can
be
seen in figures
A.2 andA.3.
126

8/11/2019 Modelling Phase Change Material Thermal Storage
http://slidepdf.com/reader/full/modelling-phase-change-material-thermal-storage 143/173
J.M. Bailey M.
A.
Sc. Thesis
Department ofMechanical Engineering McMaster University
..
0
0
0
0
0
0
12
.Ii 0
0
2
VI
0
0
0
0
0
0
a
@]
Figure A.2: Capture/recovery flow channel external dimensions in millimetres.
¢6 35 TY
Figure A.3: Capture/recovery flow channel internal dimensions
in
millimetres.
127

8/11/2019 Modelling Phase Change Material Thermal Storage
http://slidepdf.com/reader/full/modelling-phase-change-material-thermal-storage 144/173
J.M. Bailey - M. A. Sc. Thesis
Department ofMechanical Engineering - McMaster University
A.3 Refrigerated Bath
The temperature controlled bath used to set the capture/recovery fluid temperature
is a Nes1abs RTE 110 Refrigerated bath from ThermoFisher Scientific. Due to a
malfunction in the unit, it was not possible to use the internal circulation pump to provide
flow through the test loop, and an external pump was therefore required. The
specifications for this bath can be seen in tables A.2 and A.3.
Table A.2: Temperature specifications for the Neslabs RT 110 refrigerated bath Neslabs, 1993).
Temperature Range
Basic controller
nalog controller
Digital controller
rogrammable controller
Temperature Stabilityl 2
Temperature Stabilityl 3
Cooling Capacityt 4
RTE·110
-25 C
to
+ 1
OO°
-25 C to +100
G
C
-30°C
to
+130 C
-30 C to +130 C
>500 w tts
at
+20 C
>300
w tts at
O°C
>175
w tts at
-10 C
128
RTE-210
-24 C
to
+100 C
-24 C to +100 C
-2S C
to
+130°C
-2S C to +130°C
±0.1 'C
±O.01 C
>475
watts at
+20 C
>3
watts at
O C
>15 w tts at
-10 C

8/11/2019 Modelling Phase Change Material Thermal Storage
http://slidepdf.com/reader/full/modelling-phase-change-material-thermal-storage 145/173
J.M.
Bailey
M.
A.
Sc. Thesis
Department ofMechanical Engineering - McMaster University
Table A.3: Physical specifications for the Neslabs
RT 11
0 refrigerated bath Neslabs,
1993 .
Heater
Watts)
Main
Boost
Bath Work Area
HxWxD)
Inches
Centimeters
Bath Volume
Gallons
Liters
Unit Dimensions
6
Hx WxD)
Inches
Centimeters
Unit Dimensions
7
HxWxD)
Inches
Centimeters
Shipping Weight
Pounds
Kilograms
RTE-110
5
x5x5.75
12.7 x 12.7 x 14.6
1.3
5.0
20 x 8.785 x 12.375
49.S x22.5 x 31.4
25 x8.785 x 12.375
63.5
x
22.5 x 31.4
70
32
129
RTE·210
800
N
10 x 10 x 5.75
25.4 x 25.4
x
14.6
3.2
12.3
20 x 12.375 x 17.25
49.8 x 31.4 x43.8
25 x 12.375 x 17.25
63.5 x31.4 x 43.8
90
41

8/11/2019 Modelling Phase Change Material Thermal Storage
http://slidepdf.com/reader/full/modelling-phase-change-material-thermal-storage 146/173
I.M.
Bailey-M A.
Sc. Thesis
Department ofMechanical Engineering - McMaster University
A.4 Pump
The pump used to circulate the water through the test loop is the RK-07012-20
miniature gear pump from Cole Parmer, manufactured
by
Greylor Company. Pump
specifications can
be
found on the supplier s website, www.coleparmer.ca. and are
reproduced in table
AA
Table A.4: Pump specifications
for
the RK-07012-20 miniature gear
pump
Cole Parmer, 2009).
Wetted
parts
DELRIN® plastic,
304
stainless
steel,
Buna N and PTFE® PTFE
F-lax pressure
21
psi
Max temperature 200°F (93' C)
Max f low
Liters/min
2.52
rate
GPf< 1
a.57
Port size 3/16 hose barb
Part iculates
no
un
ry no
Relief varve
no
Suction
dry'
4 f
li t
wet 1a ft
Duty
cycle
continuous
Viscosi ty 2.00 cp max
Motor
Amps
2.0
Power cord 8"cord, no plug
Power
VDC 12
Dimensions
4"Lxl-3 4"Wx2-S 8"H
130

8/11/2019 Modelling Phase Change Material Thermal Storage
http://slidepdf.com/reader/full/modelling-phase-change-material-thermal-storage 147/173
J .M. Bailey - M. A. Sc. Thesis
Department
of
Mechanical Engineering - McMaster University
A.5 Flow Meter
The
flow meter used
in
the test apparatus is an Omega FP-5062 Micro-Flow
Sensor.
The
calibration parameters and flow range for this sensor are seen
in
table A.5
and the wiring diagram
in
figure A.4. The recommended 10
len
pull-up resistor was
replaced with a smaller 2
len
resistor due to the resistance of the data acquisition system.
Line voltage was supplied via a 24 V, 0.75 A power supply. Pressure drop across the
flow meter, physical dimensions and other specifications are seen
in
figures A.5 through
A.7.
Table A.5: Flow meter calibration constants or the FP-5062 Micro-Flow Sensor Omega, 2007).
Model
FP-5062
Pulses
per
U.S. Gal Pulses
per
Litre
Pulses
per mL Flow
Range
1/Gal
9950
O M ~ G F P ~ 5 0 O
Sornr;s St)I1S0f
IlL
1/mL Llmin
2629 2.629
0.11-
2.6
ihby l:
~ ~ l I i b > Ii ;
~ ' l . I q ' J i t o o
i3:i1
uta/lUI,
f f
1001 ih« f J ~ m i C:mi;m:;t
OM GATiilaKiitsif SuWQ:' tklw i I J K : , . , > .
Figure A.4: Wiring diagram
for
the FP-5062 Micro-Flow
Sensor
Omega, 2007a .
3
Pulse Range
Hz
5-114

8/11/2019 Modelling Phase Change Material Thermal Storage
http://slidepdf.com/reader/full/modelling-phase-change-material-thermal-storage 148/173
I M
Bailey
M. A Sc. Thesis
Department of
Mechanical
Engineering - McMaster University
~ ~ ~
20 1 . 4
15 i.1.0 ·
1/J
10.1+----
5
1
°.3
{I 0
6._.;;;.0
()
/J.B 15
2.5
Figure A.S: Pressure drop across the FP-S062 Micro-Flow Sensor Omega,
2007).
Top'lliavl
M:mnUng labs for
melrin
1.13
or
standard ii6 lCfem on
t a
mm
{2EiS In.)
bolt
circle
S ~ ~ V i f J t
36
mm
{1.42
in.)
Figure A.6: Dimensions
of
the FP-S062 Micro-Flow Sensor Omega, 2007).
l J ~ a @ t y :
Rer
£lllk1)<:
~ b j . s ,
CliNfr ~ h :
~ ~ ~ I ' ) Y . f .
\ ' \ \ K ~ t :
± i L ' > ~ M M ' i f ~
± ~ . & 0 1 f u m ~
X a j l Pr {lI'l llei <M
ISO
t t -R% t l ~ )
$<11 {25ft.). c:mS 'Iil.1>.Hlp1o;lt.:iJiftl {10(JOtl)limx_
' 2 ; ~ U } t : f
t ' l l f f i l e < j : j ) l l f W J ~ (tl..r,rr,;;. twlH,
2 0 g{9.6 ill.)
W
.1 :ooMatitrlJ Is
• £;",');;61 lM'Mryaoo' co\s: 40'0/' iffli1B11
fl.-led
p ~ ~ E: . fioo
• Rf.)kv; VEEI{, ml\1{ili,
' l l t l ) , j l ' } ~
•
. ? n i o i ' ~ : V o c ~ ,
• Oi'el{t; ViiGl'JJi:.
~ f J I a M c M ( j '
· ~ 1 a c t \ . l M t J \I{I1« ISO s :
. ,
;ru-:U ISO
Ji4(.'iJt
Auld Co fKliiiouJ ,
Mac>:. p ; - " " ' ' S l f e , ~ e . · f l p . e m t i r e
OiG ~ · C (l i t
j{j.
t1<;;'P)@S.l>DBiI{80iYill1malt
Figure A.7: Specifications of the FP-S062 Micro-Flow Sensor Omega, 2007).
132
:3 gpm

8/11/2019 Modelling Phase Change Material Thermal Storage
http://slidepdf.com/reader/full/modelling-phase-change-material-thermal-storage 149/173
J.M. Bailey
M
A. Sc. Thesis
Department ofMechanical Engineering - McMaster University
A.6 Thermocouples
Thermocouples were ordered from Omega Canada under part number TMQSS-
062E-12. These are 1116 inch diameter, 12 inch long, stainless steel sheath, exposed-
junction, T -type thermocouples with miniature quick connect connectors. The T -Type
thermocouple range is -270
D
to 400
D
and the EMF over the full range is -8.05
mV
to
69.553
mV
(Omega, 2009). The published tolerance
ofthese
thermocouples is 0.5
D
or
0.4 above 0 D and 1 D or 1.5 below 0
D
(Omega, 2009).
A.7 Heat Flux Sensors
The heat flux sensors attached to the capture/recovery flow channel are Omega
HFS-4 Thin Film Flux Sensors. The construction of these sensors is seen in figure A.8
and consists of several thermocouple junctions separated
by
thin layers ofmaterial with
known thermal properties. The dimensions
of
the sensors are found in figure A.9 and
placement
ofthe
sensors on the capture/recovery flow channel is seen in figure
A.l O
The electrical properties
of
the heat flux sensors are found
in
table A.6.
133

8/11/2019 Modelling Phase Change Material Thermal Storage
http://slidepdf.com/reader/full/modelling-phase-change-material-thermal-storage 150/173
J .M. Bailey - M. A. Sc. Thesis
Department of Mechanical Engineering - McMaster University
Thermal
Barrier
Thermoelectric
Material B
i.e.
ALOMEGA
Thermoelectric
Material
A
I.e.
CHROMEGA
Copper
Output
Lead
Upper TI Junctions at T
Lower TI Junctions at T2
Figure A.S: Layered construction of the HFS-4 heat flux sensors Omega, 2005).
m
10 ± 0.5 FT)
Figure A.9: Dimensions of the HFS-4
he t
flux sensors Omega, 2005).
134

8/11/2019 Modelling Phase Change Material Thermal Storage
http://slidepdf.com/reader/full/modelling-phase-change-material-thermal-storage 151/173
J.M. Bailey - M.
A.
Sc. Thesis
Department
of
Mechanical Engineering - McMaster University
. ' ~ . ' -
l
r
t
:
e
Q
f-p-
-
]
t
, '-----------i1
I UJ
It>H
l
1 i11Jl
I
-
1*.
I
U·1N
Figure A.10: Position mm) ofthe heat flux sensors on the capture/recovery channel surface.
Table A.
6:
Electrical properties
and
responses
of
he
HFS 4
heat
lUX
sensors Omega, 2005).
Property
Unit Value
Nominal Sensitivity
flV/ BTU/ftL.Hr)
6.5
flV/w/mL
21
Maximum Heat Flux
BTU/ftL.Hr
30,000
W/mL
9000
Response s
0.13
Thermal Capacitance
BTU/ftL °F
0.01
W mLK
0.006
Thermal Resistance
OF
IBTU ftLHr
0.01
K/W/mL
0.02
Nominal Thickness inches
0.007
mm
0.2
A.8 DAQ
Data acquisition for the experimentation used the National Instruments
cDAQ-9172 unit. This is a modular system with up to 8 data acquisition cards docking in
a hub that sends the data to a computer via a USB connection. Three data acquisition
cards were used for testing: the NI-9213 16 channel thermocouple), the NI-9211
135

8/11/2019 Modelling Phase Change Material Thermal Storage
http://slidepdf.com/reader/full/modelling-phase-change-material-thermal-storage 152/173
J.M. Bailey - M. A. Sc. Thesis
Department of Mechanical Engineering - McMaster University
8 channels 80mV
or
thermocouple) and the NI-9421 8 channel digital input). The
quoted sensitivity for the acquisition
ofT type
thermocouple data from the NI-9213 card
is <0.02
D
with the cumulative error shown in figure A.8.1 not including the
thermocouple instrument error). The error is further broken down into its component
parts in the product literature National Instruments, 2009).
o ~ · ~ ~ ~ - ~ ~ ~ ~ ~ ~ ~ ~ ~ ~ ~ ~ ~ ~ ~ ~ ~ ~ ~ ~ ~ ~
=200
200
400
Max
(High
s ~ d , .
-401\ )
7{J
Max
(High
res).
-4QlQ 70 0
600
000
1
QO J
Typ
(High spse d),
room
t ~ p
, ~ = Typ
tHigh
r ~ } ,
room
~ p
This figure accounts for gain errors offset errors differential and integral nonlinearity quantization errors noise errors
50 Q
lead wire resistance and cOld-junction compensation errors. The figure does not account for the accuracy
of
the
thermocouple itself.
Figure A.ll: Type T thermocouple data acquisition
error
for the NI-9213 module.
136

8/11/2019 Modelling Phase Change Material Thermal Storage
http://slidepdf.com/reader/full/modelling-phase-change-material-thermal-storage 153/173
J.M. Bailey M
A
Sc. Thesis
Department ofMechanical Engineering - McMaster University
ApPENDIX
B Experimental Procedure
B l
Cell Assembly
1
Place a bead of 100% Silicone sealant on either side of one of the nitrile gaskets
2 Quickly place the gasket between the polycarbonate flanged chamber and the
polycarbonate backing plate before the silicone begins to dry
3
Insert longer bolts into the
4
holes from the backing plate side, with a washer on
either side
4. Attach nuts to finger-tight
5 Tighten bolt assemblies, starting with opposite comers then proceeding to the
middle bolts on each side
6 Tighten remaining bolts in any order
7
Insert thermocouple positioning baffle, ensuring that it is oriented in such a way
that none of the holes are in the backing plate slot
8 Insert thermocouples into appropriate holes in the positioning baffle and record
the position of each numbered thermocouple
9 Place a bead of 100% Silicone sealant on either side of the remaining nitrile
gasket
10. Quickly place the gasket between the capture/recovery flow channel and the
polycarbonate backing plate before the silicone begins to dry
137

8/11/2019 Modelling Phase Change Material Thermal Storage
http://slidepdf.com/reader/full/modelling-phase-change-material-thermal-storage 154/173
J.M.
Bailey
M. A. Sc. Thesis
Department ofMechanical Engineering - McMaster University
11. Insert shorter bolts into the 14 holes from the flow channel side, with a washer on
either side
12. Attach nuts to finger-tight
13. Tighten bolt assemblies, starting with opposite comers then proceeding to the
middle bolts
on
each side
14. Tighten remaining bolts in any order
15
Allow silicone to cure for 24 hours (this can
be
done concurrently with the
instructions in section D.2)
B.2 Plumbing and Sensor Connections
1 Ensure all hoses are securely attached between the water bath, pump, flow meter,
inlet quick disconnect fitting
2 Insure all hoses are securely attached between outlet quick disconnect fitting and
water bath
3 Attach quick connect fittings to capture/recovery flow channel in desired
orientation ( INLET is labelled on the baffled end with OUTLET on the non-
baffled end)
4 Attach thermocouple leads to data acquisition card and record which
thermocouple corresponds to each channel
5 Attach flow meter leads to data acquisition card and plug
in
power supply
6 Attach heat flux sensor leads (and thermocouple leads,
if
desired) to data
acquisition card and record which heat flux sensor corresponds to each channel
138

8/11/2019 Modelling Phase Change Material Thermal Storage
http://slidepdf.com/reader/full/modelling-phase-change-material-thermal-storage 155/173
J.M. Bailey - M. A. Sc. Thesis
Department of Mechanical Engineering - McMaster University
7 Plug in data acquisition card power supply
8
Attach USB connection from data acquisition card to computer
B.3 Addition o PCM
1 Heat 2 litres
of
phase change material in glass containers with a pour spout
in
a
furnace set at 7 °C until fully liquid
2. Set test cell upright with fill plugs removed and holes at the top
3. Insert glass funnels into fill holes
4. Weigh phase change material containers and funnels
5. Pour liquid phase change materials into funnels ensuring both sides are filling
evenly
6 Fill to just below the top of the phase change material chamber
7. Return excess liquid phase change material to the furnace
8 Allow phase change material to cool until fully solidified
9 Top up remaining space in phase change material chamber ensuring no air is
trapped
10. Quickly replace plugs into fill holes while the phase change material is still liquid
11. Weigh phase change material containers and funnels
12. Allow phase change material to fully solidify
13. Remove any spilled material and weigh
139

8/11/2019 Modelling Phase Change Material Thermal Storage
http://slidepdf.com/reader/full/modelling-phase-change-material-thermal-storage 156/173
J .M. Bailey M. A. Sc. Thesis
Department
of
Mechanical Engineering McMaster University
14. Subtract original mass
of
phase change material containers and funnels from final
mass and spilled material to determine the mass
of
phase change material in the
test apparatus
B.4 Cell Warm Up
1
um
on data acquisition unit and start Lab View program PCM01.vi to display
and record data
2. Ensure correct calibration coefficients are input
in
Lab View program
3. Fill water bath to
just
below the upper slit and replace lid to minimize evaporation
4. um
on
water bath and set temperature to 1.5 °C above desired initial cell
temperature
5
Ensure throttling valve is fully open
6. Plug in pump
7. Tilt flow channel
n
order to remove all air
8 Allow rig to warm
up
until the average temperature
of anyone
thermocouple is
changing less than 0.5 degrees
per
hour
9. Adjust throttling valve to achieve desired test flow rate
10. Unplug pump
11. Stop data acquisition software
12. Set bath temperature to 3 °C above desired average capture temperature
140

8/11/2019 Modelling Phase Change Material Thermal Storage
http://slidepdf.com/reader/full/modelling-phase-change-material-thermal-storage 157/173
J .M. Bailey - M. A. Sc. Thesis
Department
of
Mechanical Engineering - McMaster University
B.4 Capture Test
1 When bath
reaches temperature set point, plug
in
pump and immediately tum
on
data acquisition program
2. Allow test to run until all pe thermocouples are 1.2
D
above the melt
temperature 43.5
D
for lauric acid)
3
Tum off
data acquisition software and restart
4. Set bath temperature to 5
D
above desired initial temperature for recovery test
B.5 Stabilization
1 Allow rig to stabilize until the average temperature of anyone thermocouple is
changing less than 0.5 degrees
per
hour
2. Adjust throttling valve to achieve desired test flow rate
3
Unplug pump
4
Stop data acquisition software
5
Set
bath
temperature to 2 D above desired average capture temperature
B.5 Recovery Test
1 When
bath reaches temperature set point, plug
in
pump and immediately tum
on
data acquisition software
2. Allow test to run until all pe thermocouples are 1.2
D
below the melt
temperature 43.5 D
for lauric acid)
141

8/11/2019 Modelling Phase Change Material Thermal Storage
http://slidepdf.com/reader/full/modelling-phase-change-material-thermal-storage 158/173
1.M. Bailey M. A Sc. Thesis
Department of Mechanical Engineering - McMaster University
3.
Tum off
data acquisition software pump water bath data acquisition module and
computer
142

8/11/2019 Modelling Phase Change Material Thermal Storage
http://slidepdf.com/reader/full/modelling-phase-change-material-thermal-storage 159/173
J.M.
Bailey
M. A. Sc. Thesis
Department
of
Mechanical Engineering - McMaster University
ApPENDIX C -CALIBRATION AND
ERROR
ANALYSIS
C.I -Material Property Data
Melt temperature, freezing temperature, densities, conductivities, heat capacity
and latent heat
of
fusion
of
materials can vary dependent
on
the grade
of
material used.
Since literature values of these properties are used in the model, the range ofpotential
literature values for stearic acid has been studied and is listed in table C.1. Based
on
these ranges, the potential error in material properties has been estimated.
Table
C l:
Melt temperature variation
or
different grades
o
stearic acid
Property
Unit Min.
Ref.
Max. Ref.
Melting
[ C]
53
Hummel
72 Sigma Aldrich,
Temperature Croton, 2009) 2009)
Freezing
[ C]
53
Hummel
72 Sigma Aldrich,
Temperature
Croton, 2009)
2009)
Latent Heat
[J/kg] 155 Kenisarin et
208.6 Sari, 2006)
ofFusion aI., 2007)
Thermal
[W mK]
0.172
Zalba et aI.,
0.30
Karaipekli e t
Conductivity 2003)
aI.,2007)
Heat
[J/kgK]
2.38
Kenisarin et
2.83 Kenisarin et
Capacity aI., 2007)
aI., 2007)
Density [kgim
3
]
848
Zalba et aI.,
965
Zalba et aI.,
2003)
2003)
C.2 - Scale PCM Mass Measurement)
The Starfrit 93033 scale was used to determine the
PCM
mass
by
weighing the
liquid
PCM
container before and after pouring the lauric acid into the test apparatus.
The
143

8/11/2019 Modelling Phase Change Material Thermal Storage
http://slidepdf.com/reader/full/modelling-phase-change-material-thermal-storage 160/173
J.M. Bailey - M. A Sc. Thesis
Department
of
Mechanical Engineering - McMaster University
accuracy of the scale is quoted in the product literature as +-1.0g (Starfrit, 2009). This
was verified using a set
of
calibrated masses and found to
be
true.
n
addition to the 1.0 g
error in the scale, some additional sources of error in the total melted amount of phase
change material exist. A small amount of spillage can occur during filling, causing
approximately 25 g of additional error. This was determined by allowing the excess
material to solidify on the apparatus and then chipping it off and weighing it with an
additional factor
of
1.25 added for losses during this process. The mass
of
phase change
material present in the test apparatus can therefore vary by +/- 26g or +/- 2 .
C.3 P M Thermocouples
Thermocouple error calculations are found in section 3.8. The calibration
coefficients for the PCM thermocouples are found in table C.2.
Table C : Flow meter calibration data
Thermocouple Slope (m)
Offset (b)
1
0.992549 0.353149
2
0.992494 0.396861
3
0.992308 0.431849
4
0.992591 0.443336
5
0.992758 0.461873
6
0.992755 0.469857
7 0.992590 0.499508
8 0.992163 0.530811
9 0.992334
0.537212
1
0.992346 0.476022
0.992319 0.579934
12 0.992119
0.612231
13
0.992088 0.627743
14
0.992236 0.622614
15
0.991665 0.603178
16 0.992081 0.554465
144

8/11/2019 Modelling Phase Change Material Thermal Storage
http://slidepdf.com/reader/full/modelling-phase-change-material-thermal-storage 161/173
J .M. Bailey - M.
A
Sc. Thesis
Department
of
Mechanical Engineering - McMaster University
C.4 Flow Meter
Calibration
of
the flow meter was accomplished
by
hooking the instrument up to
the data acquisition system as
it
is
in
testing. Hoses were attached to the meter with the
inlet routed to a supply water faucet with a shut-off valve and the outlet routed to a
beaker.
he
tare weight
of
the beaker was recorded at the start
of
each test.
he
faucet
was adjusted to achieve several different flow rates with the shut-off valve opened at time
zero.
he
water was allowed to run for either one
or
two minutes depending
on
the flow
rate and then the shut-off valve was closed. The beaker was then weighed to determine
the total mass accumulated during the test period. This was compared to the time-
average flow reading from the data acquisition system.
he
results can
be
seen
in
table
C.3. Comparing these results gives a linear calibration equation with slope
of
1.0408 and
offset of 0.0372. Error for the flow meter readings is calculated in section 3.8.
Table C : Flow meter calibration data
Time Period [s] Mass [kg]
Average Flow from Mass [L/min] Flow Reading [L/min]
120
418
0.209 0.1662
120 747
0.373 0.3252
60
455 0.454 0.3938
60
591
0.590 0.5268
60
734 0.733 0.6677
60
830 0.828 0.7635
6
911
0.909 0.8398
60
945 0.943 0.8755
60
607
0.606
0.5370
60
444 0.443 0.3856
60
276 0.275 0.2339
120
364
0.182
0.1448
145

8/11/2019 Modelling Phase Change Material Thermal Storage
http://slidepdf.com/reader/full/modelling-phase-change-material-thermal-storage 162/173
J.M. Bailey - M. A Sc. Thesis
Department ofMechanical Engineering - McMaster University
c.s
Heat Loss to Surroundings
At the end of the first melting test the apparatus was allowed to cool naturally to
determine the heat loss to the surroundings. The average heat flux per unit area through
the aluminum plate for 27 to 3 °C of temperature loss can be seen in figure
C S
.1. The
heat transfer through the aluminum plate reversed below this temperature difference due
to heat loss back through the stagnant flow channel. Since the flow temperature is
controlled in the experiments it will be assumed that the heat loss is negligible below
27°C of temperature difference from the average cell temperature to the ambient. The
heat loss for the adjusted value is therefore calculated using the polynomial fit shown in
figure C S 1 for temperature differences above 27°C and set to zero for differences below
this.
146

8/11/2019 Modelling Phase Change Material Thermal Storage
http://slidepdf.com/reader/full/modelling-phase-change-material-thermal-storage 163/173
J.M. Bailey M. A. Sc. Thesis
Department ofMechanical Engineering - McMaster University
100
90
80
<
E
70
><
60
I
u
50
-
CI
I)
x
40
I)
en
C CI
30
I)
<C
20
10
0
26
27 28 29
30 31
32
Average Internal Cell Temperature Room Temperature [C]
Figure
C.l:
Heat loss to surroundings under
natural
convection.
C.6 Heat Flux Sensors
Calibration
of
the heat flux sensors was not performed. This was due to the large
error involved in calculating the enthalpy change
of
the capture
or
recovery fluid due to
the cumulative temperature and flow rate error. The temperature measurement in the
fluid was even larger than the calculated values for the phase change material temperature
measurement due to the temperature gradient within the flow. The position ofthe
thermocouple junction within the flow was unknown and not easily adjusted. The
temperature error for the bulk: flow would therefore
be
larger than the 1 °C temperature
difference in the flow towards the end of the melt time. This, in addition to the +-12
error
in
the flow rate and losses to the surroundings makes calibrating the heat flux
147

8/11/2019 Modelling Phase Change Material Thermal Storage
http://slidepdf.com/reader/full/modelling-phase-change-material-thermal-storage 164/173
J.M. Bailey M. A Sc. Thesis
Department ofMechanical Engineering - McMaster University
sensors against the flow enthalpy change unfeasible. Since the heat flux sensor readings
were not used
in
further calculations and accurate values
of
losses through the insulation
are not known error estimates for the heat flux sensors were not used.
C.7 Flow Temperature
Because the heat transfer to the cell using the flow temperature difference is not
being used as a meaningful comparison for the model the error in the capture/recovery
fluid temperature only causes a difference
in
the model input versus the test data
•
148

8/11/2019 Modelling Phase Change Material Thermal Storage
http://slidepdf.com/reader/full/modelling-phase-change-material-thermal-storage 165/173
J.M.
Bailey
M.
A
Sc. Thesis
Department
of
Mechanical Engineering - McMaster University
APPENDIX
D CFD
MODEL SET UPS
D.I Two Dimensional Base Case
Table D l: Fluent input parametersfor the CFD model base case
Category Name Parameter
Units Value
Materials
lauric acid Density
kg/m:
869
Heat Capacity J/kgK
2150
Thermal Conductivity
W/mK 0.17
Viscosity
kg/ms 0.0073 N/A)
Melting Heat
J/kgK 182800
Solidus Temperature
K 316.15
Liquidus Temperature
K 317.15
arr Density
kg/m:
1.225
Heat Capacity
J/kgK 1006.43
Thermal Conductivity
W/mK 0.0242
Viscosity
kg/ms 1.7894e-05
Melting Heat
J/kgK
0
Solidus Temperature
K
0
Liquidus Temperature
K
0
aluminum Density kg/m
J
2719
Heat Capacity J/kgK
871
Thermal Conductivity
W/mK 202.4
stainless steel Density
kg/m
3
8000
Heat Capacity
J/kgK
500
Thermal Conductivity
W/mK 16.4
Boundary al 1 Type
Wall
Conditions
Material Name
aluminum
Thermal
Coupled
al I-shadow Type
Wall
Material Name
aluminum
Thermal Coupled
al 2 Type
Wall
Material Name
aluminum
Thermal
Coupled
al 2-shadow
Type
Wall
Material Name
aluminum
Thermal
Coupled
al tube Type
Solid
Material Name
aluminum
pcm Type
Fluid
Material Name
lauric acid
recovery
Type
Fluid
Material Name
ir
149

8/11/2019 Modelling Phase Change Material Thermal Storage
http://slidepdf.com/reader/full/modelling-phase-change-material-thermal-storage 166/173
J.M. Bailey M. A. Sc. Thesis
Department
of
Mechanical Engineering - McMaster University
Table D l continued: Fluent input parametersfor the CFD model base case
recovery cl
Type
Wall
Material Name Aluminum
NI
A)
Thermal
Heat Flux
Heat Flux
W/mL
0
ss 1
Type
Wall
Material Name
stainless steel
Thermal
Convection
Heat Transfer Coefficient
W/mL K
100
Free Stream Temperature
K 338.15
ss 2 Type
Wall
Material Name
stainless steel
Thermal
Coupled
ss 2-shadow
Type
Wall
Material Name stainless steel
Thermal
Coupled
ss tube
Type
Solid
Material Name
stainless steel
walls Type
Wall
Material Name
Aluminum
NI
A)
Thermal
Heat Flux
Heat Flux
W/mL
0
ss 2
ss 2-shadow
recovery
l
if' -
pcm
recovery
al
al 2
al I-shadow
Figure D l:
Model boundaries for
the
two-dimeusional eFD cases.
150

8/11/2019 Modelling Phase Change Material Thermal Storage
http://slidepdf.com/reader/full/modelling-phase-change-material-thermal-storage 167/173
J.M. Bailey M. A. Sc. Thesis
Department
of
Mechanical Engineering - McMaster University
Table D 2:
ANSYS Fluent
6.3.26 set up parameters
for
2D flow solution
Menu
Category Parameter
Value
File Read
Case
Base Case.msh
Define
Models-Solver
Solver Pressure Based
Space
2D
Velocity Formulation
Absolute
Gradient Option
Green-Gauss Cell Based
Porous Formulation
Superficial Velocity
Models-Energy Energy Equation
On
Models-Viscous Model k-epsilon
k-epsilon Model Realizable
Near-Wall Treatment
Enhanced Wall Treatment
Enhanced Wall Treatment Options None
Viscous Heating Off
C2-Epsilon
1.9
TKE
Prandtl Number
1
TDR Prandtl Number
1.2
Energy Prandtl Number
0.85
Wall Prandtl Number
0.85
User Defined Functions
None
Models-SIM SolidificationlMelting
On
Mushy Zone Constant 100,000
Include Pull Velocities
No
Materials
All
Table 4.9
Boundary Conditions
All Table 4.9
Solve
Controls-Solutions Equations
Flow Turbulence
Pressure-Velocity Coupling
SIMPLE
Under-Relaxation Factors Pressure - 0.3
Density l
Body
Forces - 1
Momentum - 0.7
TKE 0.8
TDR 0.8
Turbulent Viscosity - 1
Liquid Fraction Update - 0.9
Energy l
Discretization Pressure - Standard
Momentum - 2
nd
Order
TKE - 2
nd
Order
TDR - 2
nd
Order
Energy - 2
nd
Order
5

8/11/2019 Modelling Phase Change Material Thermal Storage
http://slidepdf.com/reader/full/modelling-phase-change-material-thermal-storage 168/173
J.M. Bailey - M. A. Sc. Thesis
Department
of
Mechanical Engineering - McMaster University
Table D.2 continued: ANSYS Fluent 6.3.26 set up parameters for 2D flow solution.
Initialize
Reference Frame Relative to Cell Zone
Gauge Pressure
100Pa
X Velocity
omls
Y Velocity o
mls
Z Velocity
Omls
TKE
0.01 ml.ls'
TDR
ml.lsj
Temperature 313.15 K
Monitors-Residual
Check Convergence All
Off
Monitors-Surface
Report Static Pressure
Surfaces Inlet
Report Type Area-Weighted Average
X Axis Iteration
Monitors-Volume Field Variable Velocity Magnitude
Cell Zones
Water
Report Type Max
X Axis Iteration
Table D.3:
ANSYS Fluent
6.3.26 set up parameter changes
for
2D energy solution.
Menu
Category Parameter Value
Boundary Conditions inlet-Temperature
outlet-Temperature
Solve Controls-Solutions
Equations Energy
Monitors-Residual
Check Convergence
On
Energy Residual le-08
Monitors-Surface
When Time Step
I Report
Total Surface Heat Flux
Surfaces
at plate2:005, gaskets:002,
pcm chamber
1 - Report Type Area-Weighted Average
I XAxis Flow Time
2 When
Time Step
2 Report
Total Temperature
2
Surfaces al plate2:005
2 - Report Type Area-Weighted Average
2
X
Axis
Flow Time
Monitors-Volume When Time Step
Field Variable
Liquid Fraction
Cell Zones Water
Report Type Volume-Average
X Axis Flow Time
Iterate
Time Step Size
lOs
Time Stepping Method Fixed
Max Iterations per Time Step
100
Reporting Interval
I
UDF Profile Update Interval I
152

8/11/2019 Modelling Phase Change Material Thermal Storage
http://slidepdf.com/reader/full/modelling-phase-change-material-thermal-storage 169/173
J.M. Bailey M. A Sc. Thesis
Department ofMechanical Engineering McMaster University
D.2 Two Dimensional Parametric Cases
Table D 4: ANSYS Fluent 6.3.26 set up changes for the 2D parametric energy solutions
Zone
Property
Units Alternate Values
PCM
Heat Capacity J/kgK
1075
1720
2580
Latent Heat
of
Fusion J/kg
91400
146240
219360
Thermal Conductivity
W mK
0 1
1
10
100
Capture Channel Heat Capacity J/kgK
100
1000
5000
Thermal Conductivity
W mK 1
10
100
1000
Recovery Channel Heat Capacity
J/kgK
100
500
5000
Thermal Conductivity W mK
1
10
100
1000
Capture Fluid Convective Coefficient
W/ml K
10
100
1000
10000
dT Capture T melt °C
1
100
1000
Recovery Fluid Heat Capacity J/kgK
100
500
5000
Thermal Conductivity
W mK
0 01
0 1
1
10
153

8/11/2019 Modelling Phase Change Material Thermal Storage
http://slidepdf.com/reader/full/modelling-phase-change-material-thermal-storage 170/173
J.M.
Bailey
M.
A.
Sc. Thesis
Department
of
Mechanical Engineering - McMaster University
D.3 Three Dimensional Lauric Acid Cell
Table D 5: Lauric cid CFD model boundary conditions and material properties
Category Name
Parameter
Units Value
Materials
lauric acid
Density
kg/m
j
869
Heat Capacity J/kgK 2150
Thermal Conductivity
W/mK 0.17
Viscosity
kg/ms 0.0073
Melting Heat J/kgK 182800
Solidus Temperature
K
316.15
Liquidus Temperature
K 317.15
water
Density
kg/mj
998.2
Heat Capacity J/kgK 4182
Thermal Conductivity W/mK
0.6
Viscosity kg/ms
0.000453
Melting Heat J/kgK
0
Solidus Temperature
K
0
Liquidus Temperature
K 0
aluminum
Density
kg/m
j
2719
Category Name
Parameter Units Value
Heat Capacity
J/kgK
871
Thermal Conductivity W/mK 202.4
po1ycarbonate
Density
kg/mj
1200
Heat Capacity J/kgK
1500
Thermal Conductivity
W/mK 0.195
nitrile
Density
kg/mj
1100
Heat Capacity J/kgK 2010
Thermal Conductivity
W/mK 0.13
Boundary Conditions external
Type Wall
Thermal
Heat Flux
Heat Flux
W/m }.
0
inlet Type Mass Flow Inlet
Mass Flow Rate kg/s 0.00435
Supersonic Pressure
Pa
0
Direction Specification
Normal to Boundary
Reference Frame Absolute
Turbulence Specification Intensity and
Method Hydraulic Diameter
Turbulent Intensity
1
Hydraulic Diameter
m
0.0127
Total Temperature
K 335.85
int
Type
Interior
nitrile Type solid
Material
nitrile
outlet
Type
Pressure Outlet
Supersonic Initial Gauge
Pa 0
Pressure
Backflow Direction Normal to Boundary
154

8/11/2019 Modelling Phase Change Material Thermal Storage
http://slidepdf.com/reader/full/modelling-phase-change-material-thermal-storage 171/173
I.M. Bailey - M. A. Sc. Thesis
Department ofMechanical Engineering - McMaster University
Table D 5 continued: Lauric Acid CFD model boundary conditions
and
material properties
Backflow Turbulent 1
Intensity
Backflow Hydraulic
m
0.0127
Diameter
Backflow Total
K
335.85
Temperature
pc Type
Solid
Material
P olycarb onate
pcm
Type
Fluid
Material lauric acid
water
Type
Fluid
Material Water
All Type
Wall
Remaining
Thermal
Coupled
Table D 6:
ANSYS Fluent
6.3.26 set up parameters
for
3D flow solution
Menu
Category
Parameter
Value
File
Read Case
LA
Cell.msh
Define
Models-Solver Solver
Pressure Based
Space
D
Velocity Formulation
Absolute
Gradient Option Green-Gauss Cell
Based
Porous Formulation Superficial Velocity
Models-Energy
Energy Equation
On
Models-Viscous
Model
k-epsilon
k-epsilon Model
Realizable
Near-Wall Treatment Enhanced Wall Treatment
Enhanced Wall Treatment
None
Options
Viscous Heating Off
C2-Epsilon
1.9
TKE
Prandtl Number
1
TDR
Prandtl Number
1.2
Energy PrandtlNumber 0.85
Wall PrandtlNumber
0.85
User
Defined Functions
None
Models-Solidification and SolidificationlMelting
On
Melting
Mushy
Zone Constant
100,000
Include Pull Velocities
No
Materials All
Table 4.9
Boundary Conditions All
Table 4.9
Solve
Controls-Solutions Equations
Flow
Turbulence
Pressure-Velocity SIMPLE
Coupling
155

8/11/2019 Modelling Phase Change Material Thermal Storage
http://slidepdf.com/reader/full/modelling-phase-change-material-thermal-storage 172/173
J .M. Bailey M. A. Sc. Thesis
Department of Mechanical Engineering McMaster University
Table D 6 continued: ANSYS Fluent
6.3.26
set up parameters for 3D flow solution
Under Relaxation Factors
Pressure 0.3
Density l
Body Forces 1
Momentum
0.7
TKE 0.8
TDR 0.8
Turbulent Viscosity 1
Liquid Fraction Update 0.9
Energy 1
Discretization Pressure Standard
Momentum
nd
Order
TKE
nd
Order
TDR
nd
Order
Energy
nd
Order
Initialize Reference Frame Relative to Cell Zone
Gauge Pressure 100 Pa
X Velocity
Om/s
YVelocity
Om/s
Z Velocity
Om/s
TKE
0.01
m< s<
TDR
1
mZ sj
Temperature 313.15 K
Monitors Residual Check Convergence
All
Off
Monitors Surface Report
Static Pressure
Surfaces
inlet
Report Type Area Weighted Average
X Axis Iteration
Monitors Volume Field Variable
Velocity Magnitude
Cell Zones
water
Report Type
Max
X Axis
Iteration
156

8/11/2019 Modelling Phase Change Material Thermal Storage
http://slidepdf.com/reader/full/modelling-phase-change-material-thermal-storage 173/173
J.M.
Bailey M.
A Sc. Thesis
Department of Mechanical Engineering - McMaster University
Table D
: ANSYS Fluent 6.3.26
set up parameter changes
for
3D energy solution
Menu
Category Parameter
Value
Boundary Conditions inlet-Temperature
outlet-Temperature
Solve
Controls-Solutions Equations Energy
Monitors-Residual
Check Convergence
On
Energy Residual
1e-08
Monitors-Surface When Time Step
I Report
Total Surface Heat Flux
1 - Surfaces
at plate2:005, gaskets:002,
pcm chamber
1 - Report Type Area-Weighted Average
1 - X Axis Flow Time
2 When Time Step
2 Report
Total Temperature
2 - Surfaces al
l a t e 2 : 5
2 - Report Type Area-Weighted Average
2 - X Axis
Flow Time
Monitors-Volume When
Time Step
Field Variable
Liquid Fraction
Cell Zones Water