Embed Size (px)
Citation preview
Modelling Spatial Distribution of Disability in
Older Persons and the Need for Aged Care in
New South Wales
National Centre for Social and Economic Modelling
• University of Canberra •
Laurie Brown, Sharyn Lymer, Mandy Yap, Mohan Singh and Ann Harding
Conference Paper,
Australian Social Policy Conference,
Sydney, 20-22 July 2005
About NATSEM
The National Centre for Social and Economic Modelling was
established on 1 January 1993, and supports its activities through
research grants, commissioned research and longer term contracts
for model maintenance and development with the federal
departments of Family and Community Services, and
Education, Science and Training.
NATSEM aims to be a key contributor to social and economic
policy debate and analysis by developing models of the highest
quality, undertaking independent and impartial research, and
supplying valued consultancy services.
Policy changes often have to be made without sufficient
information about either the current environment or the
consequences of change. NATSEM specialises in analysing data
and producing models so that decision makers have the best
possible quantitative information on which to base their decisions.
NATSEM has an international reputation as a centre of excellence
for analysing microdata and constructing microsimulation
models. Such data and models commence with the records of real
(but unidentifiable) Australians. Analysis typically begins by
looking at either the characteristics or the impact of a policy
change on an individual household, building up to the bigger
picture by looking at many individual cases through the use of
large datasets.
It must be emphasised that NATSEM does not have views on
policy. All opinions are the authors’ own and are not necessarily
shared by NATSEM.
Director: Ann Harding
© NATSEM, University of Canberra 2005
National Centre for Social and Economic Modelling
University of Canberra ACT 2601 Australia
170 Haydon Drive Bruce ACT 2617
Phone + 61 2 6201 2750 Fax + 61 2 6201 2751
Email [email protected]
Website www.natsem.canberra.edu.au
iii
Abstract Estimating disability levels in older Australians and their demographic and socio-
economic profiles is essential for identifying the need for aged care services and for
the development and implementation of effective social policy on ageing. However,
there is a paucity of such projections in Australia especially at regional levels such as
Statistical Local Areas (SLA). This paper describes the spatial microsimulation
modelling and small area estimation techniques developed to estimate disability
levels and need for aged care in persons aged 55 years or above living in NSW, and
presents preliminary results on the geographical variation in these parameters across
NSW.
Small area estimates are produced by the spatial microsimulation model ‘CareMod’
which is based on the 1998 ABS Survey of Disability, Ageing and Carers (SDAC)
(ABS, 1999), up-rated to 2001. Estimates are generated by reweighting the SDAC
confidentialised unit record file to create ‘synthetic’ datasets for each SLA in NSW.
The SDAC is reweighted using the ABS optimisation algorithm GregWt against a
range of ‘benchmarks’ from the 2001 census. Disability levels and need for age care
can be analysed by a wide range of person and family level demographic and socio-
economic variables. Additional estimates of individual wealth have been added since
it is well known that elderly Australians are usually cash poor but assets rich.
The results show that there are significant variations across NSW in disability levels
and the need for aged care services by older persons, and that these individuals have
differing levels of social and financial support available to them in their older age.
The research findings should assist in the strategic planning and improved targeting
of aged care services, especially in identifying areas of unmet need at the small area
level.
Author note Associate Professor Laurie Brown is Research Director (Health and Ageing) at the
National Centre for Social and Economic Modelling, Ms Sharyn Lymer is a Senior
Research Fellow, Ms Mandy Yap is a Research Officer at NATSEM, Dr Mohan Singh
is a Senior Research Fellow and Professor Ann Harding is Professor of Applied
Economics and Social Policy at the University of Canberra and Director of NATSEM.
Acknowledgments The construction of the current version of the CareMod model is being supported by
an Australian Research Council linkage grant (no. LP0349126), and by NSW
Department of Ageing, Disability and Home Care and the Office for an Ageing
Australia of the Commonwealth Department of Health and Ageing, the Industry
Partners to this grant.
iv
General caveat NATSEM research findings are generally based on estimated characteristics of the
population. Such estimates are usually derived from the application of
microsimulation modelling techniques to microdata based on sample surveys. These
estimates may be different from the actual characteristics of the population because
of sampling and nonsampling errors in the microdata and because of the
assumptions underlying the modelling techniques. The microdata do not contain any
information that enables identification of the individuals or families to which they
refer.
v
Contents
ABSTRACT ......................................................................................................... III
AUTHOR NOTE ................................................................................................ III
ACKNOWLEDGMENTS ............................................................................... III
GENERAL CAVEAT ...................................................................................... IV
1 INTRODUCTION .................................................................................................. 1
2 CAREMOD – A SPATIAL MICROSIMULATION MODEL ................................... 5
2.1 CareMod’s Basefile ...................................................................................................... 6
2.2 Regionalisation Methodology ...................................................................................... 7
2.3 Generating Small Area Estimates ............................................................................... 9
2.4 Modelling Need for Aged Care – CareMod’s Care Modalities .............................. 11
2.5 Creation of Disability Variables and Imputing Need for Care .............................. 13
2.6 Imputing Wealth - Income and Assets ..................................................................... 16
3 PRELIMINARY FINDINGS ................................................................................ 17
4 DISCUSSION AND CONCLUSIONS ................................................................. 24
REFERENCES .......................................................................................................... 27

CareMod 1
1 Introduction
Estimating disability levels in older Australians and their demographic and socio-
economic profiles is essential for identifying the need for aged care services and for
the development and implementation of effective social policy on ageing. However,
there is a paucity of such projections in Australia especially at disaggregated spatial
levels such as Statistical Local Areas (SLA). At the moment, neither the Government
nor the Aged Care Industry have adequate strategic planning and decision-support
tools for forecasting levels of disability in and the future demand for aged care
services by older Australians; identifying areas of Australia where the supply of
services is unlikely to meet need; estimating the expected cost of such services; and
the financial capacity of older Australians to bear a greater share of those costs. Such
estimates have not been available at the small area level i.e. at the spatial level in
which individuals live and conduct their lives, where services are provided and that
is the planning focus of local and State and Territory governments. This is surprising
since geographical and financial access to and equity in care services are high on the
political agenda (AIHW, 2002; Allen Consulting Group, 2002) and are of central
importance to all key stakeholder groups – older persons and their families and
carers, the aged care industry and government.
The very large baby boom cohort born post World War 2 will begin to reach 65 years
of age from 2011 onwards, resulting in a sharp increase in the number and
proportion of the population aged 65 plus during the subsequent 20 years. In 20
years, there will be some 4.2m ‘aged’ Australians - 500,000 of whom will be aged 85
years and over (AIHW, 2002). It is this cohort of old older Australians who will place
greatest demand on formal and informal aged care services, especially high
dependency aged care facilities.
In 1998, there were some 320,000 Australians aged 65 years and above with a
profound disability - 43% of whom lived in residential aged care facilities, 39% lived
with at least one other person (usually their carer) and 16% lived alone (ABS, 1999).
By 2003, this number had increased to 359,637 individuals with 25% now living
alone. At present, there is no evidence that the prevalence of disability in older
Australians is declining, especially in terms of severe or profound core activity
restrictions (AIHW, 2000). In fact, the age standardised rate of severe or profound
core activity restriction for persons aged 65 years and over increased from 16.2% in
1981 to 19.6% in 1998, with the increase being most marked for the very old (AIHW,
2000; AIHW, 2003). The 1998 Survey of Disability, Ageing and Carers (SDAC) (ABS,
1999) shows that 63.5% of persons aged 85-94 years have either a severe or profound
disability and 86.6% of those aged 95 or more years (Giles et al, 2003). The number of
older persons with severe disability has been projected to increase by 35% over the
next 30 years, and those with profound disability by a staggering 70% (Singh, 1995;
2 CareMod
Giles et al, 2003; Percival and Kelly, 2004; AIHW, 2004). This is largely due to
increases in the number of older Australians with musculoskeletal, nervous system,
cardiovascular and respiratory health conditions, and stroke. The expected rise in
the number of older persons with dementia, and Alzheimers in particular, over the
next few decades is now well documented, with estimates at 1.0% of the current total
population reaching 2.8% by 2050 (Henderson and Jorm 1998, AIHW, 2002; Access
Economics, 2005). Importantly, the prevalence of dementia rises exponentially with
age. At present, more than one in every ten individuals aged 80-84 years is estimated
to have dementia and up to one in every four persons aged 85 years and over
(AIHW, 2002). The number of older persons i.e. those aged 65 years or over with
dementia is expected to increase from 153,800 in 2001 to 242,600 by 2020,
representing a near 60% increase over the next 20 years (AIHW, 2002).
Given the projected increase in older persons, and older persons with disability in
particular, there is intense and widespread interest in the future socio-economic
profile of the older population and the likely economic resources available to the
ageing baby boomers (see, for example, the Myer Foundation Report on aged care to
2020 -Allen Consulting Group, 2002). A key question for social policy is the extent to
which these older Australians are likely to be able to draw on their own resources to
help fund their care needs in later life. Recent research suggests that a significant
proportion of ‘baby boomers’ are likely to be financially unprepared, with
inadequate accumulated superannuation, for the three or so decades of retirement
that faces them (Kelly et al, 2002; King 2001, ABS, 2001). Researchers differ in their
assessment of the likely budgetary impact of population ageing (Productivity
Commission, 2004). However, it is already clear that population ageing will place
increased pressure upon the social security and health and aged care budgets
(Treasury, 2002; Productivity Commission, 2004). Older Australians will require
access to services that support them in their later life and help alleviate or retard the
health and disabling effects of ageing. The likely incomes of the baby boomers in
retirement will thus become increasingly important, as Australia looks at possible
changes in its health and aged care programs to help shift more of the costs from
government to consumers (Brown et al, 2002).
Despite the significance of the high costs of residential care, it has to be remembered
that the majority of older Australians live privately within the community. In 2001,
for example, it was estimated that some 1.1m older Australians lived as a couple
without children; some 690,000 lived alone; and over 360,000 lived with a family
member (AIHW, 2002). However, household structures will change in the future. For
example, it is projected that in the coming decades, there will be a steady growth in
the number of older persons living alone (AIHW, 2003). What level of support will
these older Australians require to assist them to live independently within the
community? Projecting the demand for formal aged care services must also involve
projecting the likely family structures of the baby boomers, as in many cases,
CareMod 3
informal care by relatives will substitute for formal care (Percival and Kelly, 2004).
Which baby boomers are likely to have spouses and children will be a very important
issue – as will the projected health, labour force status and incomes of these possible
potential informal carers. In the face of projected longer life spans - but life years not
necessarily free from disability - two key questions currently remain unanswered:
who will pay for the care and support that will be demanded; and who will provide
it? These issues will become critical over the next few years.
As the AIHW observes, “The success of the Australian aged care system depends on,
and is characterised by, a mix of types of provision and a high degree of cooperation
between all levels of government, service providers and the community” (2002, p74).
The residential care sector is already under pressure, as shown by the
Commonwealth Government’s attempts to require those entering residential aged
care facilities to make a greater financial contribution to means-tested daily care and
accommodation fees and payments. This issue was re-examined by the recent review
into pricing arrangements for residential aged care within the Commonwealth
Department of Health and Ageing. Total government expenditure on residential care
alone is expected to grow from 0.71% of GDP to 1.08% by 2020 (Allen Consulting
Group, 2002).
Furthermore, the region in which people live profoundly affects the life experiences
of all Australians and the economic and social opportunities available to them. The
issue of unequal distribution of care needs and funding of services across
geographical areas has been a policy concern for some decades (Gibson et al, 2000).
The approval of new residential aged care facility placements reflects the strong
growth in the aged care industry in some areas, but there is no doubt that access to
care in regional Australia will continue to be one of the most important areas of
social policy, as there are already major concerns about difficulties in attracting
medical and allied health professional staff to rural/remote areas and about lower
service standards. Recent research shows that it is the rural and/or remote areas of
Australia (and, in particular, NSW) that have a lower than average supply of
residential care (although these low levels of residential supply need to be
considered in the context of higher levels of home and community care services -
Gibson et al, 2000). Issues of spatial equity are likely to become even more prominent
in the next two decades — given current trends in the internal migration of older
Australians to ‘sunbelt’ and coastal ‘retirement’ regional centres and as the health
impacts of the ‘baby boomers’ reaching retirement age start emerging. But the
pressures placed on the overall health and aged care budgets by ever-increasing costs
will limit the extent to which special regional needs can be met in the future.
Within the policy context of two key themes of ‘Healthy Ageing’ and ‘Independence
and Self-provision’ in the ‘National Strategy for an Ageing Australia’ (Bishop, 2002
and 2002a), a number of critical issues need addressing -
4 CareMod
What will the disability status of older Australians be like in the future?
Who will need aged care support?
What types of care services will these older Australians need?
Who can provide these services – formal or informal carers?
Who can pay for these services – government or individuals and their
families?
Where do these individuals live? and
Where should support services be provided?
These questions need to be addressed if Australians are to enjoy ‘healthy’ and
productive ageing, be financially secure in their old age and have access to ‘world
class’ high quality affordable and appropriate care.
These issues underscore the need for much more sophisticated databases and
analytical tools that can be used both by Government (Commonwealth and State and
territory Governments) and the other key stakeholders to project the future need for
services in rural/remote areas, as well as within urban Australia. NATSEM in
partnership with the Office for an Ageing Australia and NSW Department of
Disability, Ageing and Home Care, via an ARC linkage grant, has developed a
spatial microsimulation model – known as CareMod - to assist in addressing these
key issues, initially focussing on NSW. The chief aim of CareMod is to produce small
area estimates of levels of disability and the need for aged care, broken down by the
demographic and socio-economic characteristics of individuals and their families.
The aims of this paper are two-fold: first to describe the spatial microsimulation
modelling and small area estimation techniques developed in CareMod to estimate
disability levels and need for aged care in persons aged 55 years and above living in
NSW. This includes a description of the model’s population and data base, the
approach taken to modelling disability levels and need for care, and the regional
methodology that has been developed to generate its small area estimates; and
second to present preliminary results on the geographical variation in the estimated
levels of disability and need for care across NSW. These findings illustrate some basic
applications of the model. The paper concludes with some comments on the likely
impacts of ageing and implications for age care provision and social policy, and
future extensions and applications of CareMod.
CareMod 5
2 CareMod – A Spatial Microsimulation Model
CareMod is a complex – both in technical and policy terms - spatial microsimulation
model of care needs of older Australians living in New South Wales. Basically,
microsimulation is a means of modelling real life events by simulating the actions of
the individual units that make up the system where the events occur (Brown and
Harding, 2005). Microsimulation models are based on microdata i.e. “low-level”
population data – typically the records of individuals from either a national sample
survey conducted by a national Bureau of Statistics or large administrative databases.
In other words, microsimulation models begin with a dataset that contains detailed
information about the characteristics of each person and family (income unit) or
household within a sample survey or an administrative database (Brown and
Harding, 2002). This is one of the most important advantages of these types of
models. Being based on unit records, it is possible to examine the effects of policy
changes for narrowly defined ranges of individuals or demographic groups (Creedy,
2001). Further, the models’ databases can mirror the heterogeneity in the population
as revealed in the large household surveys.
Thus microsimulation techniques bring a range of benefits to social policy modelling,
including the ability to change a greater variety of parameters independently and the
capacity to provide considerably more accurate estimates and detailed projections of
the distributional effects of changes. Two key strengths of microsimulation models
are that: 1) they can replicate the complexity of the policy structures, transfers, and
settings; and 2) they can be used to forecast the outcomes of policy changes and
‘what if’ scenarios i.e. the counterfactual where the results describe what, under
specified conditions, may happen to particular individuals and groups (Brown and
Harding, 2002; Brown and Harding, 2005).
Generation of small area estimates is the key function of CareMod. The census
contains detailed regional socio-demographic information but it has key limitations
that have constrained regional socio-economic analysis in Australia until now. One
limitation is that detailed data on health and disability status and expenditures and
incomes are not available in the census. A second important problem is that output
for the whole census file is only available as a pre-defined series of tables for area
units - the smallest unit being the Census Collection District (CCD) which is
approximately 200 households - rather than being in the form of records for each
person or family, which is what is required for a microsimulation model. This means
that many of the relationships between characteristics of interest cannot be fully
explored.
On the other hand, the ABS sample surveys, like the SDAC, contain exceptionally
detailed health and disability, and expenditure and income data at the individual
and household level, but lack any detailed geographic information. In part, this is to
6 CareMod
protect the confidentiality of respondents to the survey. Often the most detailed
geographic classification available in the publicly released data is the 'State'.
Spatial microsimulation models aim to combine data from the census and ABS
national survey confidentialised unit record files (CURFs) to create synthetic unit
record datasets for small areas. In essence, the characteristics of interest unavailable
in the census but available in the survey are synthesised at small geographic levels
by utilising both data sources. Efforts to develop spatial models are a new initiative
internationally in microsimulation modelling, with the UK appearing to be the only
other country where attempts to develop comparable synthetic spatially detailed
population microdata are well advanced (Huang and Williamson, 2001; Voas and
Williamson, 2000, Ballas and Clarke, 1999). Furthermore, microsimulation models
have traditionally been used in tax and social security policy, and it has only been in
more recent years that they have been extended to the health and aged care fields.
2.1 CareMod’s Basefile
The unit records from the ABS 1998 SDAC provide the base records for the model’s
population. One of the key reasons for using the SDAC as CareMod’s base file rather
than an alternative ABS national survey was that its top-coding of age is 85 years and
above. This allows the ‘older ‘old age groups to be examined in more detail. Being
able to categorise older Australians into narrower aged groups, such as ’75 to 79’, ’80-
84’ and ‘85+’ years enables far more accurate modelling of the likely aged care needs
of Australians by region. The person, income unit, family and household structures
within the SDAC are retained within the model’s base file. Data on socio-
demographic variables, economic factors, disability status, availability of informal
carers etc are retained from the SDAC records.
While CareMod retains all records in the SDAC representing the total population, the
population of most interest is persons living in households in which there is at least
one person aged at or above the model’s minimum age limit of 55 years. Fifty-five
years of age was chosen in preference to 65 years to provide a ‘margin’ that would
ensure ‘full-capture’ of an appropriate target population as well as adequate
numbers for modelling purposes. The SDAC includes both persons living in private
dwellings and non-private dwellings (NPDs) i.e. institutions. This is important as it
contains information about people living in aged care facilities. Non-private
dwellings is divided into two categories – cared accommodation and other non-
private dwellings. Cared accommodation consists of hospitals, homes for the aged
(nursing homes and aged care hostels) and cared accommodation component of
retirement villages. From the 1998 SDAC, among those aged 55 years and over, a
total of 3,633,717 (94%) individuals reported they lived in private dwellings and
239,188 (6%) lived in non-private dwellings. For the ‘old’ old (aged 85 years or
above), however, the proportion living in institutional accommodation (i.e. NPDs)
CareMod 7
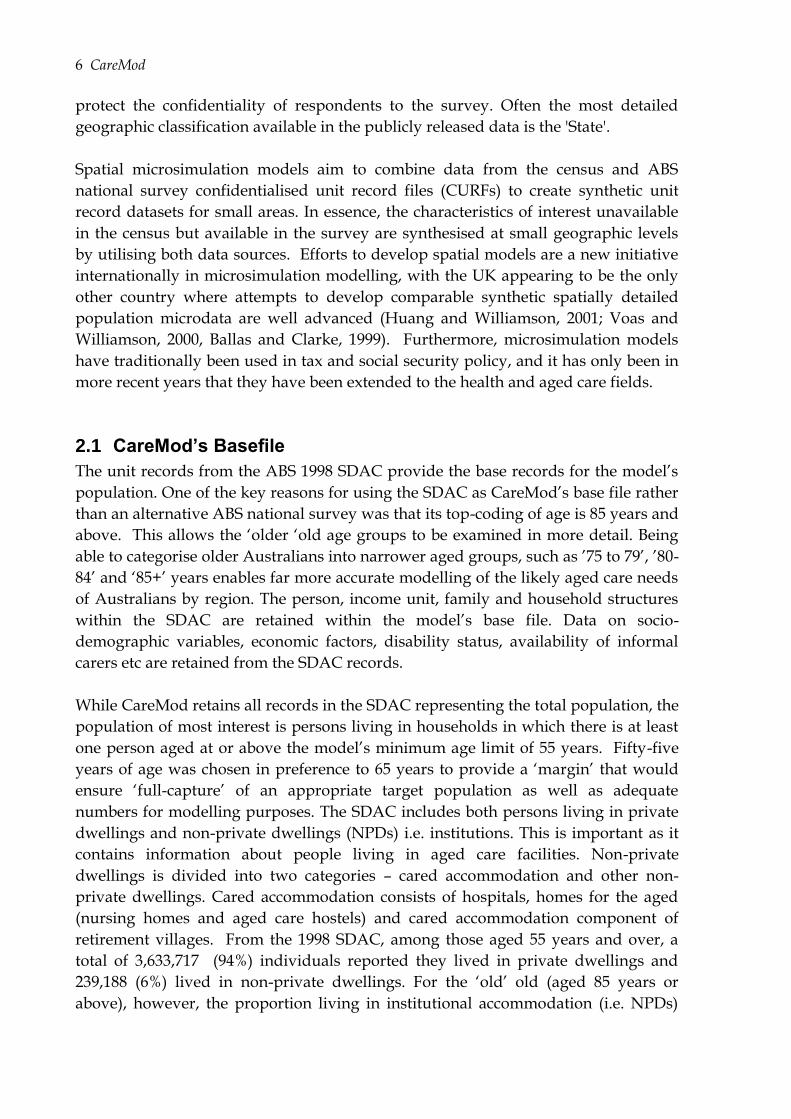
increases to 39%. Of those residing in private dwellings, the majority of ‘young’ older
individuals (55-74 years of age) live in couple households while the old old (75 years
or above) are more likely to live alone. Most of those living in non-private dwellings,
resided in residential aged care facilities (Table 1).
Table 1 Breakdown of persons aged 55 years and over by dwelling structure
55- 64 years 65- 74 years 75 – 84 years 85 years and over
55 years and over
Number % Number % Number % Number % Number %
Private Dwellings
Person living alone 231,534 14.4 289,970 22.5 273,198 36.2 63,751 28.4 858,453 22.2
Couple only 810,928 50.5 702,849 54.5 275,984 36.6 27,708 12.3 1,817,470 46.9
Lliving with dependent children 409994
25.6 154407
12.0 49856
6.6 14948
6.7 629203 16.2
Other Household 127,959 8.0 101,167 7.8 68,759 9.1 30,706 13.7 328,591 8.5
Total 1,580,415 98.5 1,248,393 96.8 667,797 88.5 137,112 61.0 3,633,717 93.8
Non-private Dwellings
Homes for the aged 3,335 0.2 11,728 0.9 37,770 5.0 51,112 22.7 103,945 2.7
Homes-other 975 0.1 1,524 0.1 1,924 0.3 1,766 0.8 6,190 0.2
Retirement Homes 635 0.0 3,526 0.3 12,852 1.7 16,632 7.4 33,645 0.9
Retired or aged accomm. (Self-care)
1,697
0.1
10,684
0.8
20,592
2.7
5,126
2.3
38,098 1.0
Hospital 2,301 0.1 5,558 0.4 10,015 1.3 12,434 5.5 30,309 0.8
Other Accommodation 14929 0.9 7,832 0.6 3,670 0.5 571 0.3 27,002 0.7
Total 23,872 1.5 40,851 3.2 86,823 11.5 87,642 39.0 239,188 6.2
TOTAL 1,604,287 100.0 1,289,244 100.0 754,620 100.0 224,754 100.0 3,872,905 100.0
Source: 1998 SDAC
2.2 Regionalisation Methodology
CareMod’s small area estimates are generated using a methodology that involves the
reweighting of an ABS national (or another) survey CURF to create a ‘synthetic’
dataset for each small area of interest. Specifically, in CareMod, small areas estimates
are generated by reweighting the 1998 SDAC CURF to create ‘synthetic’ datasets for
each statistical local area (SLA) in NSW. A national weight is provided by the ABS in
the SDAC CURF for each person level record. A weight represents the likelihood of
finding persons with a similar set of characteristics in the Australian population.
Conceptually, the SDAC national weight for each record is turned into a ‘synthetic’
SLA weight, so that the new weight now represents the likelihood of finding persons
8 CareMod
with a similar set of characteristics in the local area population. After reweighting,
the weighted characteristics of the survey records should mirror those of the SLA
population as revealed by the 2001 census.
The SDAC is reweighted against a range of ‘benchmarks’, using data from the census
(Table 2). Benchmarks are based on a selection of ‘linkage’ variables that are
common to both the SDAC and census. It is important that these linkage variables
adequately represent the socio-demographic attributes of each SLA population and
address the main issues of concern — in the case of CareMod, the drivers of the need
for aged care and the income and assets of older Australians. Literature on aged care
was reviewed to identify key drivers of the need for aged care — i.e. variables that
predict the need for care (or more typically, the use of aged care services). These
variables may not be direct determinants of the need for care but rather are good
predictors acting through simple or complex relationships with disability status. For
example, the fact that an individual is elderly does not mean that that particular
individual will need aged care services, but age is a key predictor of the need for age
care, since physical and mental impairment increases exponentially with age. Hence,
the need for and rates of utilisation of aged care services are strongly predicted by
age through its relationship with disability status.
Review of the literature indicates that a number of socio-demographic factors are
important drivers for the need for care: age, sex, and ethnic background; income and
wealth; family composition and household type; home ownership and
accommodation arrangements; mobility and transport (e.g. car ownership). Age is
the predominant determinant of the need for care - the relative importance of other
variables is not clear. Although a number of factors drive the need for care, only
those proxy variables that exist in both the Census and survey can be incorporated in
the reweighting as benchmarks. Logistic regression modelling was undertaken to
check the nature of the statistical relationships between putative drivers of the need
for care and various outcome measures such as Activities of Daily Living (ADLs).
As shown in Table 2, the final benchmark variables used included age, sex,
relationship in household (family type), individual income, tenure type (housing
arrangements) and level of education. Because of the importance of age to predicting
the functional status of individuals, every person-based benchmark was cross-
tabulated against four broad age groups (0-54, 55-64, 65-84, 85+ years).
CareMod 9
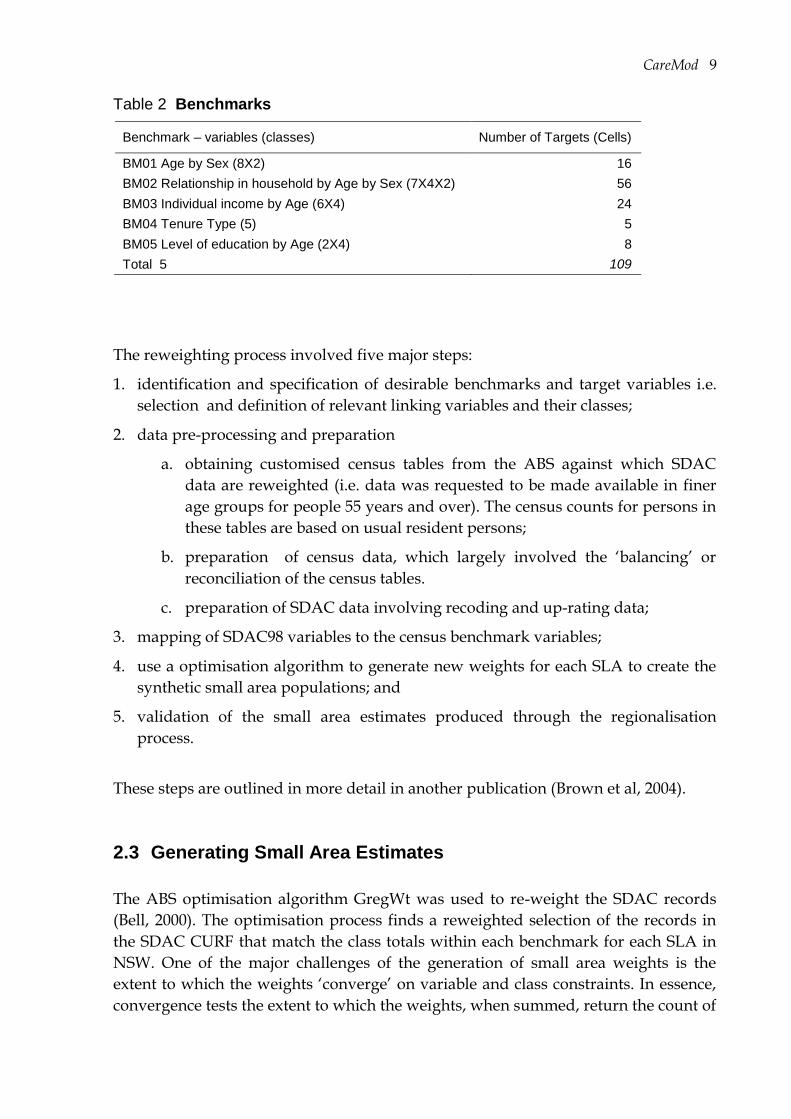
Table 2 Benchmarks
Benchmark – variables (classes) Number of Targets (Cells)
BM01 Age by Sex (8X2) 16
BM02 Relationship in household by Age by Sex (7X4X2) 56
BM03 Individual income by Age (6X4) 24
BM04 Tenure Type (5) 5
BM05 Level of education by Age (2X4) 8
Total 5 109
The reweighting process involved five major steps:
1. identification and specification of desirable benchmarks and target variables i.e.
selection and definition of relevant linking variables and their classes;
2. data pre-processing and preparation
a. obtaining customised census tables from the ABS against which SDAC
data are reweighted (i.e. data was requested to be made available in finer
age groups for people 55 years and over). The census counts for persons in
these tables are based on usual resident persons;
b. preparation of census data, which largely involved the ‘balancing’ or
reconciliation of the census tables.
c. preparation of SDAC data involving recoding and up-rating data;
3. mapping of SDAC98 variables to the census benchmark variables;
4. use a optimisation algorithm to generate new weights for each SLA to create the
synthetic small area populations; and
5. validation of the small area estimates produced through the regionalisation
process.
These steps are outlined in more detail in another publication (Brown et al, 2004).
2.3 Generating Small Area Estimates
The ABS optimisation algorithm GregWt was used to re-weight the SDAC records
(Bell, 2000). The optimisation process finds a reweighted selection of the records in
the SDAC CURF that match the class totals within each benchmark for each SLA in
NSW. One of the major challenges of the generation of small area weights is the
extent to which the weights ‘converge’ on variable and class constraints. In essence,
convergence tests the extent to which the weights, when summed, return the count of
10 CareMod
constrained (i.e. the linkage) variables. The expectation is that if convergence
occurred in the optimisation algorithm then the synthetic weights should reproduce
the benchmark characteristics of each of the small area populations.
Insofar as reweighting is capable of returning results which reflect the actual
combination of characteristics (as opposed to simply a set of weights which satisfy
the constraining counts), reweighting may be regarded as providing useful estimates
of other characteristics in the survey data that are not constrained against
benchmarks. An important question in terms of the validity of this regional
estimation methodology then is ‘how well do the area weights predict unconstrained
variables i.e. those not included in the benchmarks, or replicate administrative data?’
For example, will the application of the regional weights accurately predict the
number of elderly persons living in different areas of NSW who have particular
impairments in core activities? Such prediction is a fundamental goal of this
methodology.
Overall, the methodology performed well for variables ‘constrained’ in the
reweighting process when convergence was achieved. However, validation of the
initial weights indicated that for unconstrained variables – variables on the SDAC
but not used in the benchmarks – especially rare events such as the presence of
disability, the reweighting led to overestimation. Validation was undertaken by
examining the proportions of disabled in NSW by taking a weighted average across
the NSW SLAs and comparing it to NSW estimates from SDAC (where NSW
estimates weren’t publicly available Australian values were used. In 1998, for
disability variables where we had both NSW and Australian estimates, the NSW
estimates seem to be closely aligned to the Australian estimates). Considering
disability status, the estimated percentage of the NSW population with at least a
moderate restriction in at least one core area was 9.6% from the SDAC but the
average from the NSW SLA reweighted estimates was 13.4%.
Hence, post-processing was undertaken to refine the estimation at SLA level to vary
around the NSW average. This involved various methodologies including cloning
records with large weights (multiple records of the same person in the dataset are
made for these records. The new records have proportionally smaller weights so that
the dataset weights still sum to represent the Australian population) and adjustment
of the probabilities of a characteristic being present (scaling).
Logistic regression methods were used to allocate the level of disability and some
disability profile information such as number of core area restrictions and which core
areas were restricted onto the base file. The constrained variables from the
reweighting process were used as predictors. Scaling of the probabilities prior to
allocation of the characteristic was then used to ensure that NSW level estimates
were maintained.
CareMod 11
2.4 Modelling Need for Aged Care – CareMod’s Care Modalities
Aged care services currently range from informal support from family and friends to
high dependency residential care. The type of aged care services used and required
by the elderly will depend on their need for care, personal and family circumstances
and the supply of care.
Extended family and friends are the main providers of in-home support or assistance
for the aged in Australia. According to the SDAC98, 83% of aged Australians living
in community receive care from informal sources, and 59% from formal care
providers. Forty three percent received assistance from both informal and formal
providers (PC, 2003). Informal care is provided mainly for ADLs such as mobility,
paper work, meal preparation and self-care.
The formal care sector consists of: residential (accommodation and related services)
services either low dependency care (formerly hostel care) and high dependency care
(formerly nursing homes); and home and community care and support, ranging from
basic services such as delivered meals to complex specialist medical services. There
are two main community aged care programs – Home and Community Care
(HACC) services which are jointly funded by the Federal and State/Territory
governments and provide the bulk of home and community-based aged care
services; and Community Aged Care Packages (CACPs) which were initiated in 1992
as a Commonwealth funded program to provide an alternative to low level
residential aged care for older people living in the community (AIHW, 2004a). These
two programs aim to enable frail older people to continue living in the community
and delay or prevent the need for residential care. Other types of services include
hospitals, retirement villages, assisted living arrangements, flexible services and day
care centres although there are not many facilities currently offering care for older
people for a couple of hours during the day and many of these services are typically
funded by HACC. In addition, the Extended Aged Care at Home (EACH) Package is
a more recent Commonwealth funded program that aims to provide nursing and
personal care at a standard equivalent to high level residential care to clients in their
own homes (AIHW, 2003; AIHW, 2004b).
In CareMod, the aim has been to map functional status measured by level of
disability to the need for different ‘modalities’ of care. While these modalities of care
may, in turn, map to current aged care services and programs, as mentioned above,
the intention is to avoid defining the type of care required in terms of the services
currently available. Rather, the type of care needed has been defined using a sliding
scale ranging from no or minimal assistance required through to high dependency.
This approach aims to separate the need for care from the existing organisational
structure of age care support and supply of services as described above. It therefore
provides the opportunity of mapping the need for care to new forms of service
delivery and support that may be developed in the future i.e. the needs of elderly
12 CareMod
Australians may be met by a very different looking age care sector in 10 to 20 years
time depending upon future public policy options, community preferences and
demands, and industry goals and initiatives.
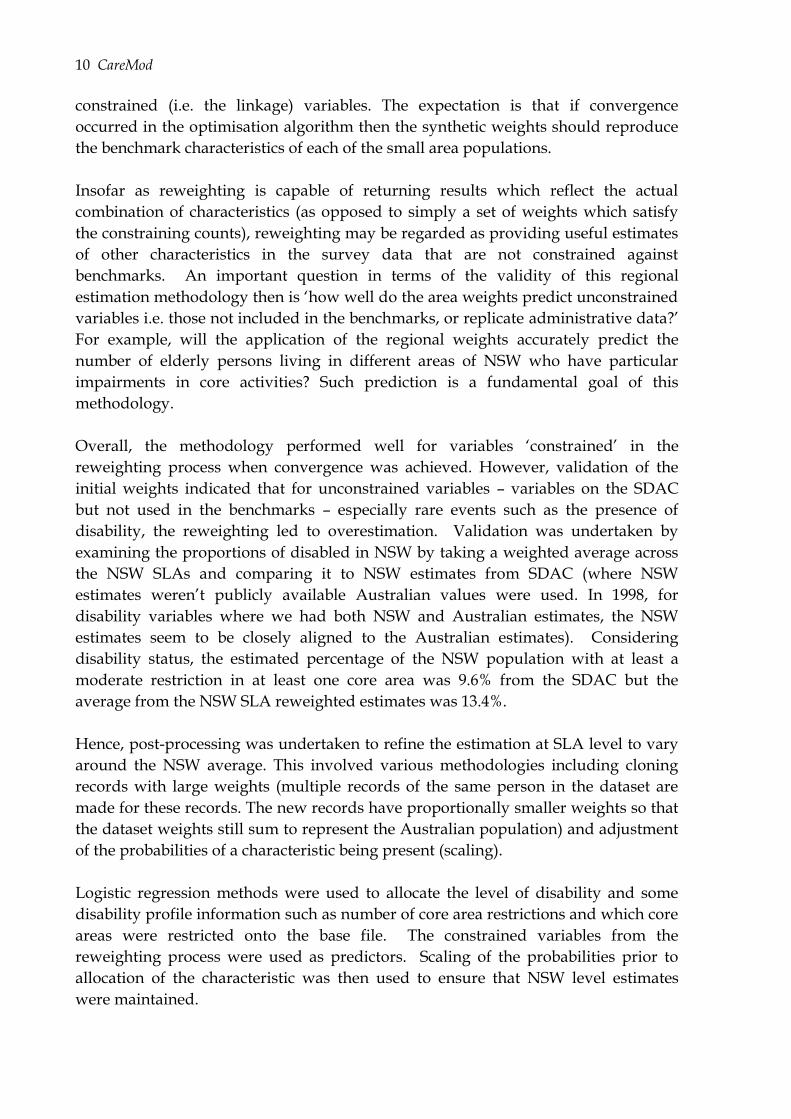
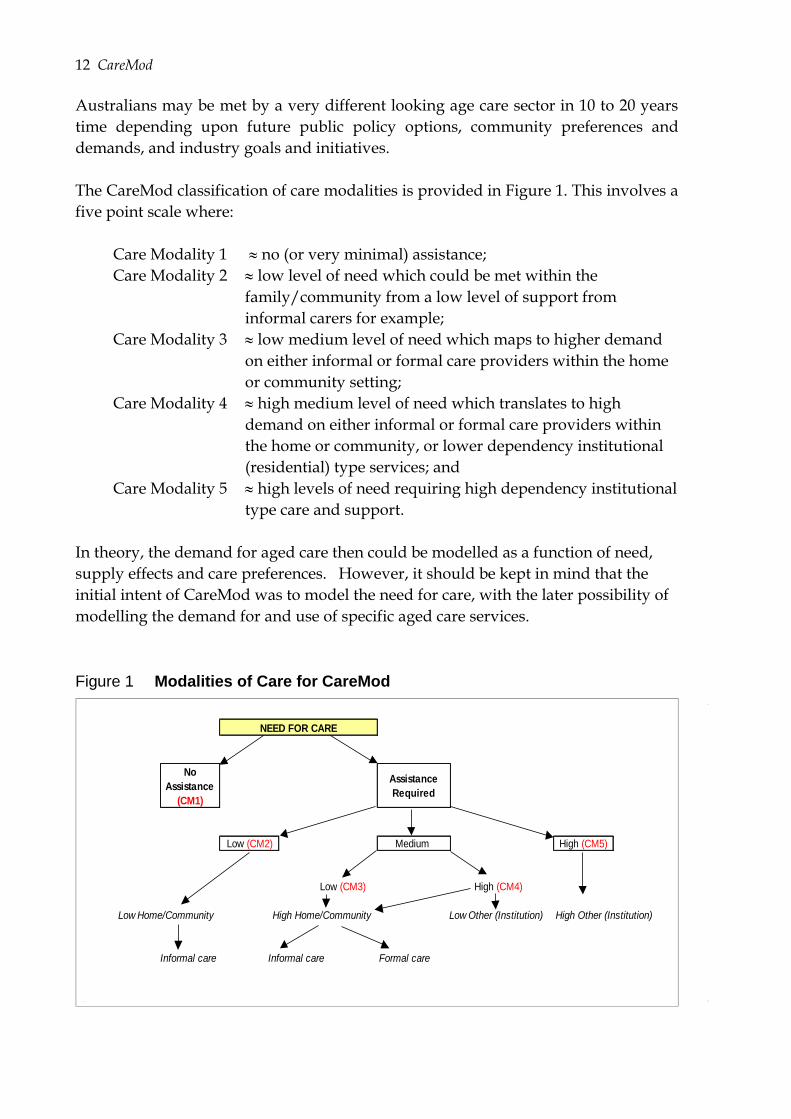
The CareMod classification of care modalities is provided in Figure 1. This involves a
five point scale where:
Care Modality 1 no (or very minimal) assistance;
Care Modality 2 low level of need which could be met within the
family/community from a low level of support from
informal carers for example;
Care Modality 3 low medium level of need which maps to higher demand
on either informal or formal care providers within the home
or community setting;
Care Modality 4 high medium level of need which translates to high
demand on either informal or formal care providers within
the home or community, or lower dependency institutional
(residential) type services; and
Care Modality 5 high levels of need requiring high dependency institutional
type care and support.
In theory, the demand for aged care then could be modelled as a function of need,
supply effects and care preferences. However, it should be kept in mind that the
initial intent of CareMod was to model the need for care, with the later possibility of
modelling the demand for and use of specific aged care services.
Figure 1 Modalities of Care for CareMod
No
Assistance
(CM1)
Assistance
Required
Low (CM2) Medium High (CM5)
Low (CM3) High (CM4)
High Other (Institution)
Informal care Informal care Formal care
NEED FOR CARE
Low Other (Institution)High Home/Community Low Home/Community
CareMod 13
2.5 Creation of Disability Variables and Imputing Need for Care
The aim in CareMod is to use measures of disability to identify the need for care and
more specifically to assign a CareMod care modality to each person. Initially we
aimed to identify whether or not an individual had a disability, the core areas that
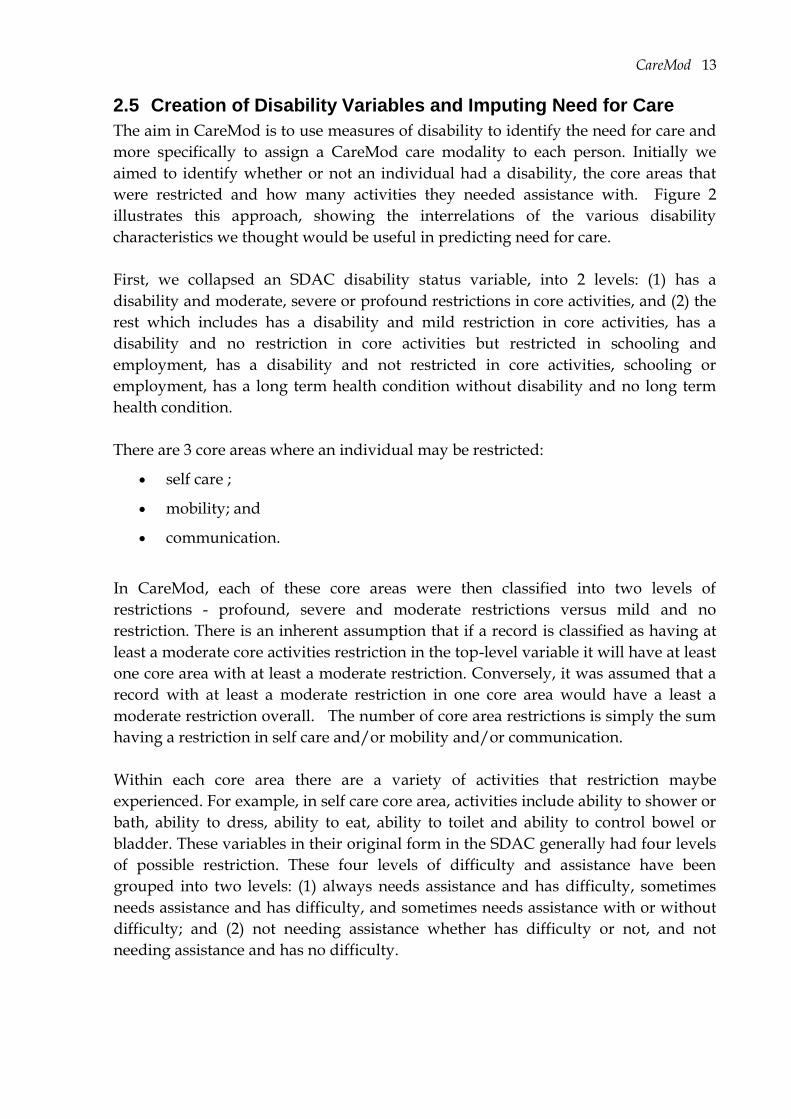
were restricted and how many activities they needed assistance with. Figure 2
illustrates this approach, showing the interrelations of the various disability
characteristics we thought would be useful in predicting need for care.
First, we collapsed an SDAC disability status variable, into 2 levels: (1) has a
disability and moderate, severe or profound restrictions in core activities, and (2) the
rest which includes has a disability and mild restriction in core activities, has a
disability and no restriction in core activities but restricted in schooling and
employment, has a disability and not restricted in core activities, schooling or
employment, has a long term health condition without disability and no long term
health condition.
There are 3 core areas where an individual may be restricted:
self care ;
mobility; and
communication.
In CareMod, each of these core areas were then classified into two levels of
restrictions - profound, severe and moderate restrictions versus mild and no
restriction. There is an inherent assumption that if a record is classified as having at
least a moderate core activities restriction in the top-level variable it will have at least
one core area with at least a moderate restriction. Conversely, it was assumed that a
record with at least a moderate restriction in one core area would have a least a
moderate restriction overall. The number of core area restrictions is simply the sum
having a restriction in self care and/or mobility and/or communication.
Within each core area there are a variety of activities that restriction maybe
experienced. For example, in self care core area, activities include ability to shower or
bath, ability to dress, ability to eat, ability to toilet and ability to control bowel or
bladder. These variables in their original form in the SDAC generally had four levels
of possible restriction. These four levels of difficulty and assistance have been
grouped into two levels: (1) always needs assistance and has difficulty, sometimes
needs assistance and has difficulty, and sometimes needs assistance with or without
difficulty; and (2) not needing assistance whether has difficulty or not, and not
needing assistance and has no difficulty.
14 CareMod
Figure 2: Diagrammatic representation of the initially proposed imputation process
Our aim was to use this approach to assign a care modality to each person in
CareMod’s base population. This method performed reasonably well for a number of
variables, for example,
percentage of individuals with a disability and at least a moderate restriction
in one core area
percentage distribution across the number of core areas with at least a
moderate restriction
percentage distribution of core areas where at least a moderate restriction was
present
However, trying to allocate the number of activities that assistance was required and
which activities assistance was required performed poorly. Consequently, we re-
examined the definition of the disability variables and the requirements of the
disability variables to allocate care modalities. This resulted in a more simplistic
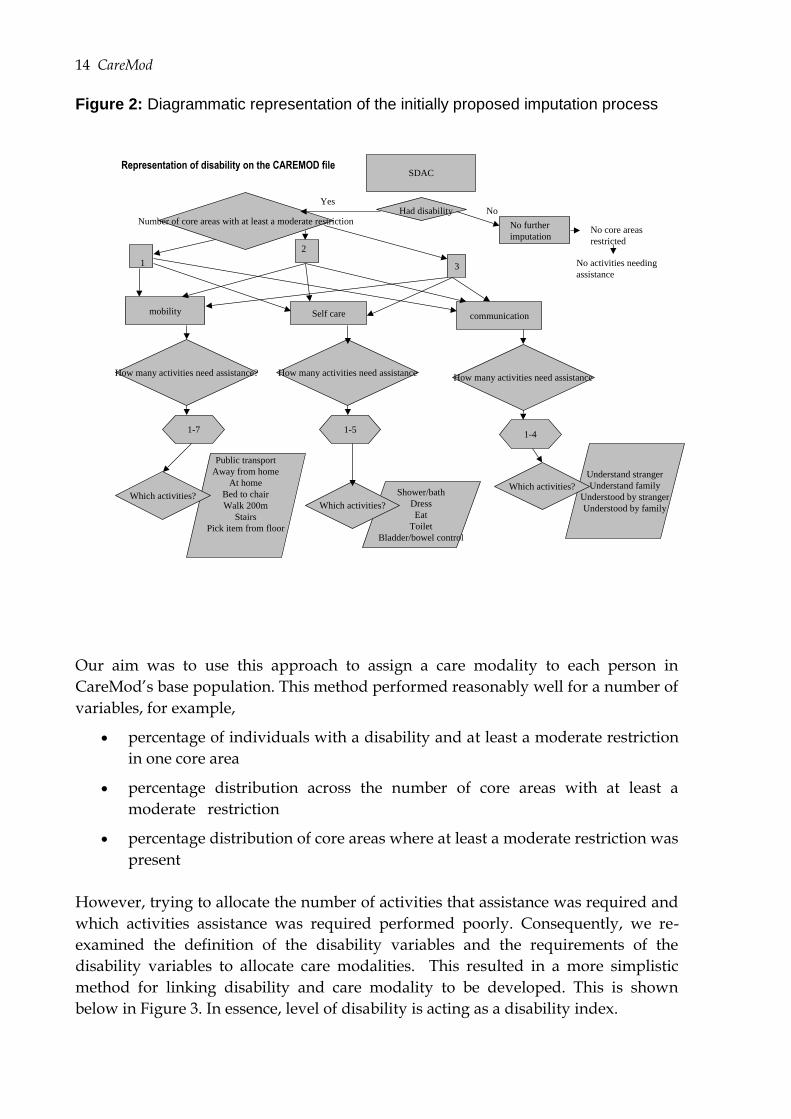
method for linking disability and care modality to be developed. This is shown
below in Figure 3. In essence, level of disability is acting as a disability index.
Representation of disability on the CAREMOD file
mobility Self care communication
3
SDAC
Had disabilityYes
No
No further
imputation
Number of core areas with at least a moderate restriction
1
2
No core areas
restricted
No activities needing
assistance
How many activities need assistance? How many activities need assistanceHow many activities need assistance
Public transport
Away from home
At home
Bed to chair
Walk 200m
Stairs
Pick item from floor
1-7 1-51-4
Shower/bath
Dress
Eat
Toilet
Bladder/bowel control
Understand stranger
Understand family
Understood by stranger
Understood by family
Which activities?Which activities?
Which activities?
CareMod 15
The use of this linkage meant that only one disability variable - level of disability – is
required to allocate the need for care. The consequence of this is it removed the need
for complex, iterative imputations of disability characteristics to allow scaling of
these characteristics to continue maintaining the state average of the occurrence of
these characteristics.
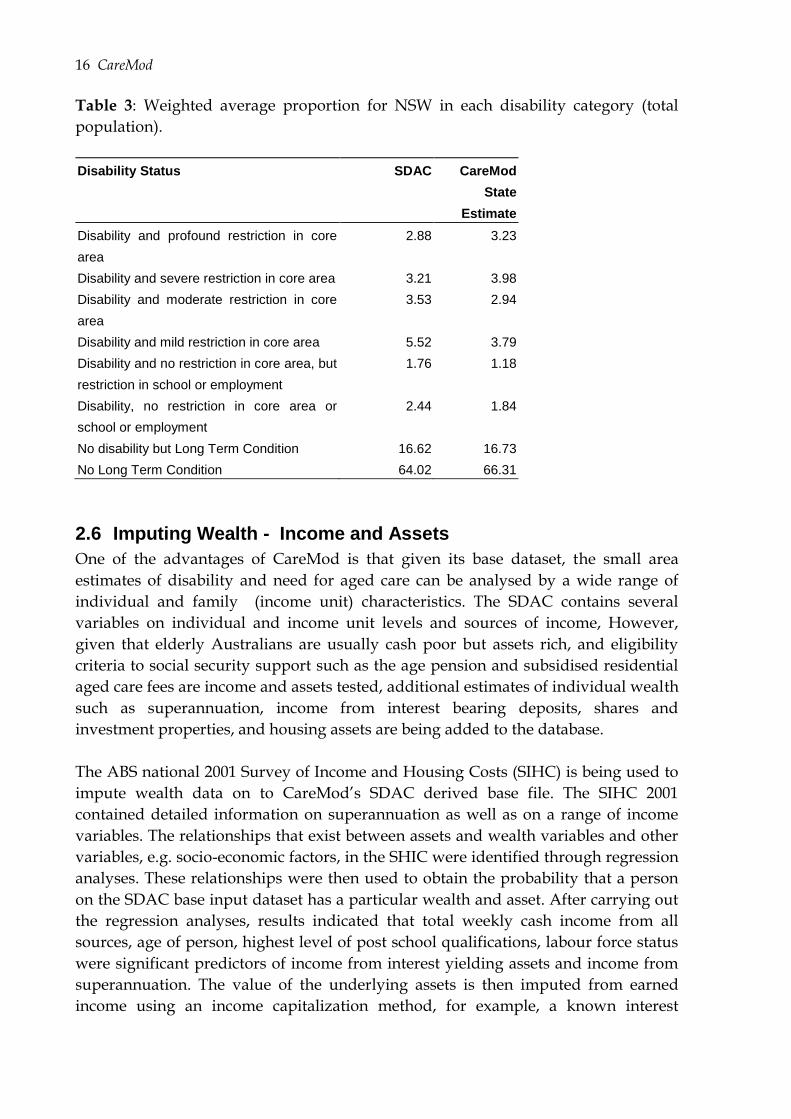
This variable was imputed and scaled using ordinal logistic regression methods. This
method allowed us to obtain the probabilities of a record with the given
demographic characteristics falling into a particular disability status category. Based
on the amount and distribution of overestimation, these probabilities were scaled so
that our regional estimates fluctuate around the State mean. The results are presented
in Table 3 showing the weighted NSW average proportion for each level of disability
status from the SDAC and the CareMod State level estimate. As can be seen, the
estimates produced by CareMod closely match those from the SDAC.
Figure 3: Linkage of Disability Levels to Modalities of Care
Has disability and profoundly
restricted in core activities
Has disability and severely
restricted in core activities
Has disability and moderately
restricted in core activities
Has disability and mildly
restricted in core activities
Has disability and not
restricted in core activities,
but rest. in school or employ.
Has disability and not
restricted in core activities,
schooling or employment
Has a long term health
condition without disability
No long term health condition
Levels of Disability
(DIS402)
Modality 5
Modality 4
Modality 3
Modality 2
Modality 1
Health Care Modality*
*Modalities of care range from 5 – requiring high levels
of formal care down to 1 – no care required
16 CareMod
Table 3: Weighted average proportion for NSW in each disability category (total
population).
Disability Status SDAC CareMod
State
Estimate
Disability and profound restriction in core
area
2.88 3.23
Disability and severe restriction in core area 3.21 3.98
Disability and moderate restriction in core
area
3.53 2.94
Disability and mild restriction in core area 5.52 3.79
Disability and no restriction in core area, but
restriction in school or employment
1.76 1.18
Disability, no restriction in core area or
school or employment
2.44 1.84
No disability but Long Term Condition 16.62 16.73
No Long Term Condition 64.02 66.31
2.6 Imputing Wealth - Income and Assets
One of the advantages of CareMod is that given its base dataset, the small area
estimates of disability and need for aged care can be analysed by a wide range of
individual and family (income unit) characteristics. The SDAC contains several
variables on individual and income unit levels and sources of income, However,
given that elderly Australians are usually cash poor but assets rich, and eligibility
criteria to social security support such as the age pension and subsidised residential
aged care fees are income and assets tested, additional estimates of individual wealth
such as superannuation, income from interest bearing deposits, shares and
investment properties, and housing assets are being added to the database.
The ABS national 2001 Survey of Income and Housing Costs (SIHC) is being used to
impute wealth data on to CareMod’s SDAC derived base file. The SIHC 2001
contained detailed information on superannuation as well as on a range of income
variables. The relationships that exist between assets and wealth variables and other
variables, e.g. socio-economic factors, in the SHIC were identified through regression
analyses. These relationships were then used to obtain the probability that a person
on the SDAC base input dataset has a particular wealth and asset. After carrying out
the regression analyses, results indicated that total weekly cash income from all
sources, age of person, highest level of post school qualifications, labour force status
were significant predictors of income from interest yielding assets and income from
superannuation. The value of the underlying assets is then imputed from earned
income using an income capitalization method, for example, a known interest
CareMod 17
income and the estimated interest rate are used to calculate the value of the
underlying asset, which in this case is an interest bearing deposit.
The term and the values of income from superannuation were derived from
NATSEM’s dynamic microsimulation model DYNAMOD (Kelly, 2003) which models
the accumulation of superannuation assets at the individual level based on sex, age
and labour force status. The amount of superannuation and the value of the deposits
derived from the methods above were then imputed on to the existing SDAC dataset
to enable further analysis of capacity for self-provision.
For estimating housing assets, data on median strata and non-strata house price
values were obtained from NSW Department of Housing. House values will be
imputed on to the CareMod base dataset by SLA according to tenure and dwelling
type. These values will be combined with the other income estimates to approximate
individual wealth. This information will provide a basis for computing the likely
economic resources available to older Australians to contribute to the costs of their
care.
3 Preliminary Findings
Overall, the regionalisation methodology performed very well in generating regional
weights that when applied to the SDAC reproduced the census benchmark data for
the SLAs. However, the reweighting process worked better for some areas than
others. ‘Poor convergence’ (i.e. where the reweighting process yielded unsatisfactory
results), occurred for only four of the 198 SLAs in NSW. These four areas were
Sydney, both Inner and Remainder, South Sydney and Inner Newcastle. These SLAs
are non-typical and have exceptional concentration of some characteristics. These
SLAs could not be modelled and thus were dropped from the analyses.
In NSW, around 20% of the population aged 55 years and over were found to have a
disability with at least a moderate restriction in at least one core area, this proportion
rising to nearly 50% for those aged 85 years or over. These rates do, however, vary
significantly between local areas, ranging between 14 and 30% for those aged 55
years or over, and 30 and 70% for the very old (85 years or over).
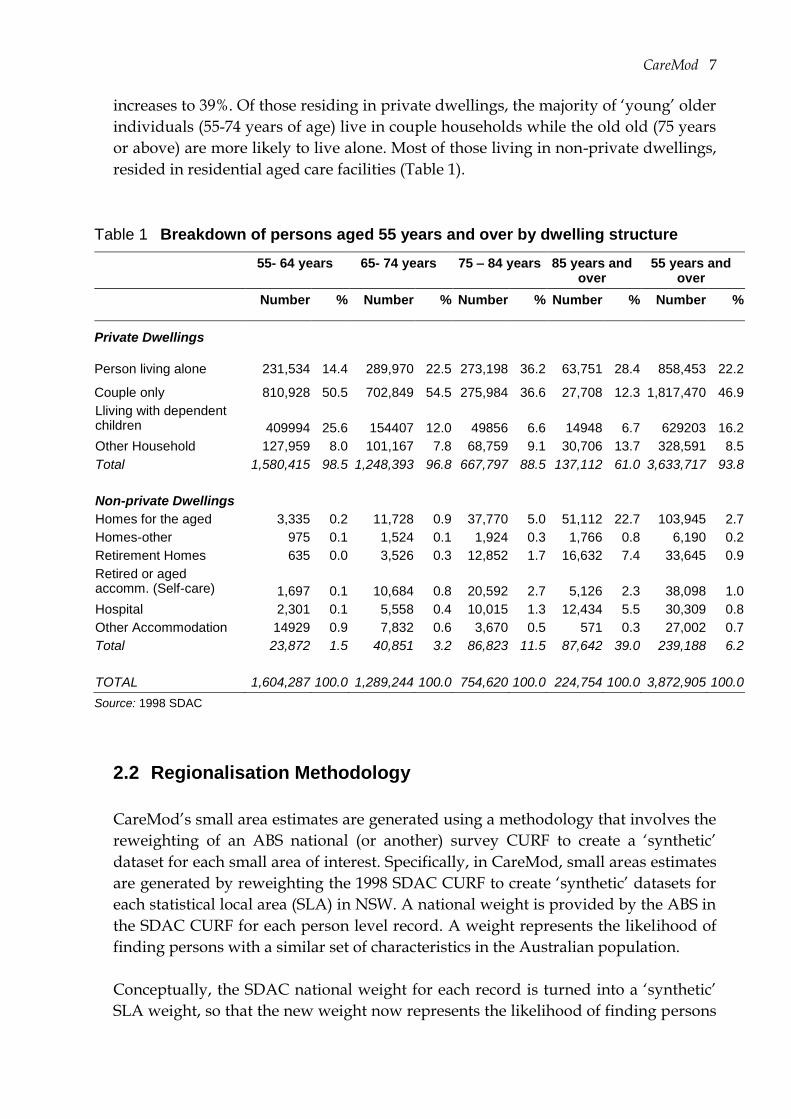
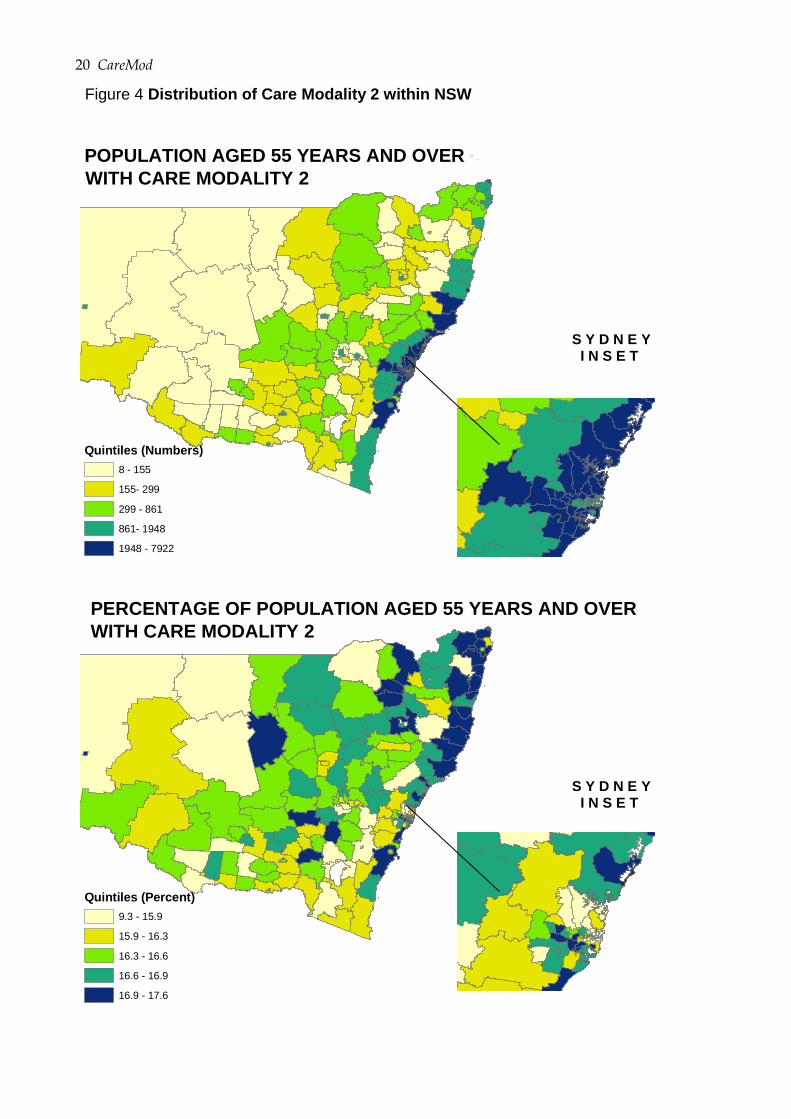
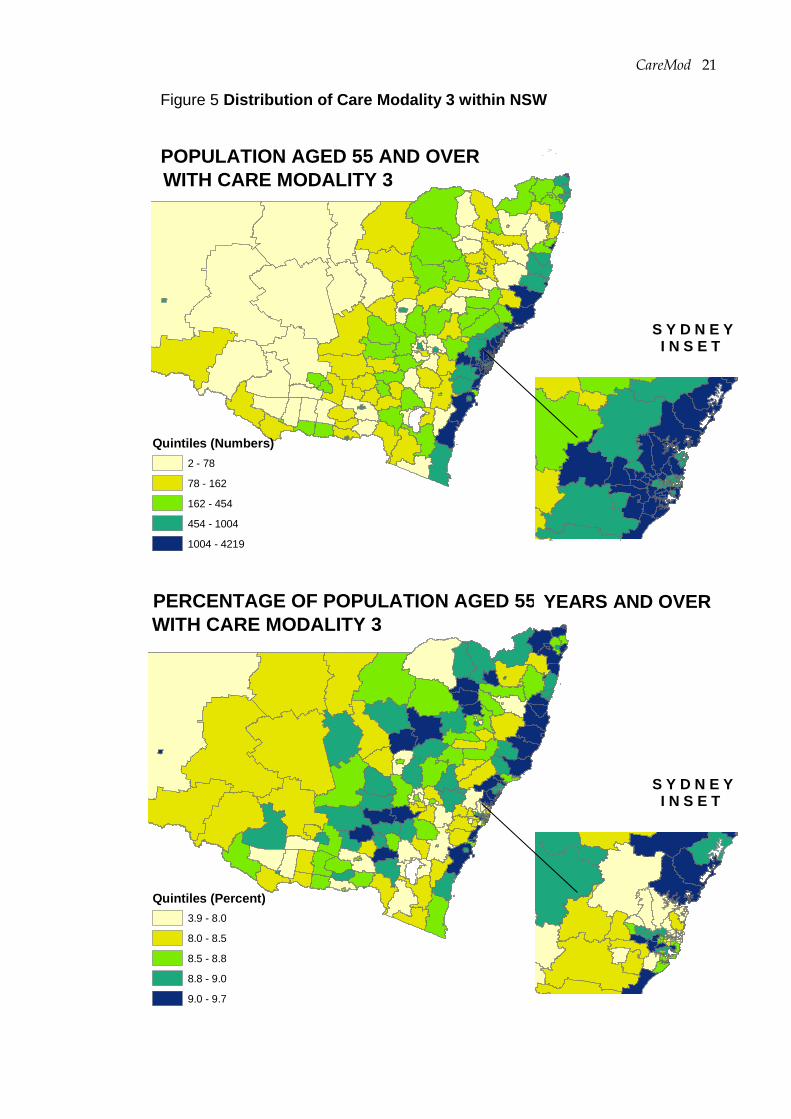
Given there are significant geographical variations in levels of disability, how does
the need for aged care vary around the State? The spatial patterns of CareMod’s four
care modalities where individuals’ may require some assistance are given in Figures
4 to 7. Recall that care modality two represents a low level of need based on an
individual having a disability and being mildly restricted in core activities or not
restricted in core activities but needing assistance at school or work. This need could
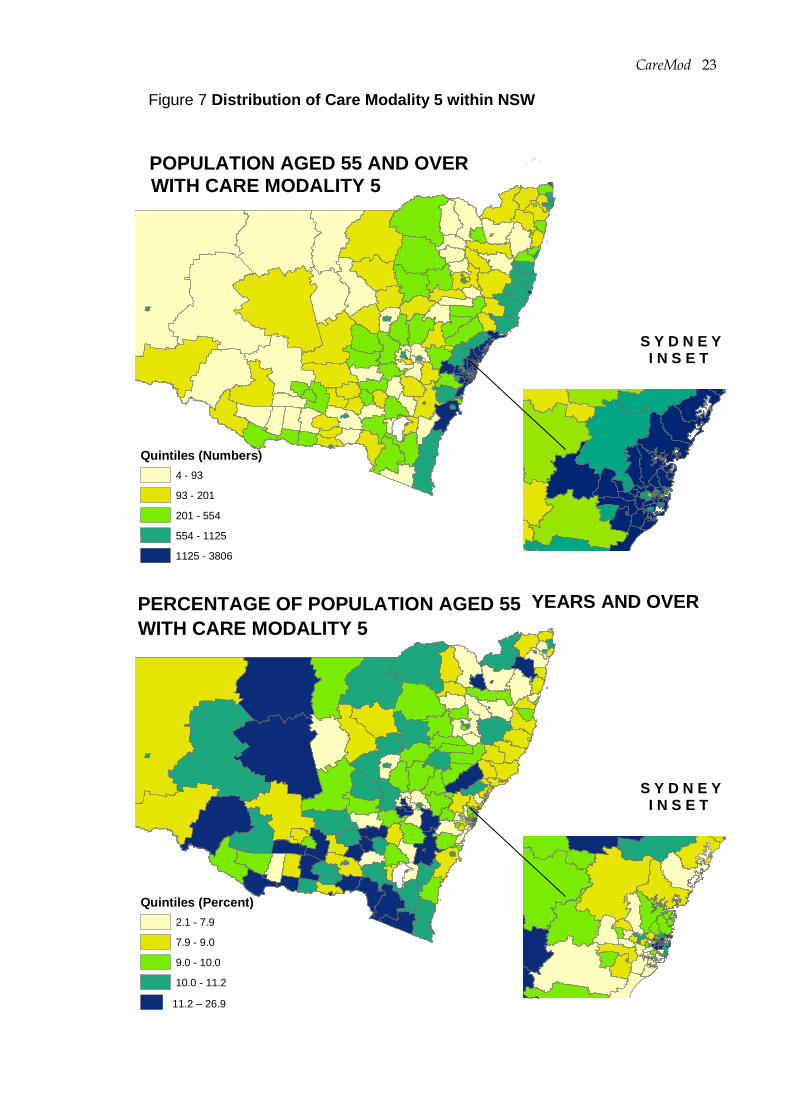
be met, for example, from within the family or community. Care modality five
18 CareMod
represents the highest level of dependency, equating to nursing home care for
example, reflecting an individual having profound disability. Both the numbers of
persons aged 55 years and over and the percentage of individuals in each area
requiring each level of care are shown in the maps. The former reflects the potential
pool of clients for aged care services while the later measures relative differences in
the levels of need on a population basis. The SLAs are classified by quintile.
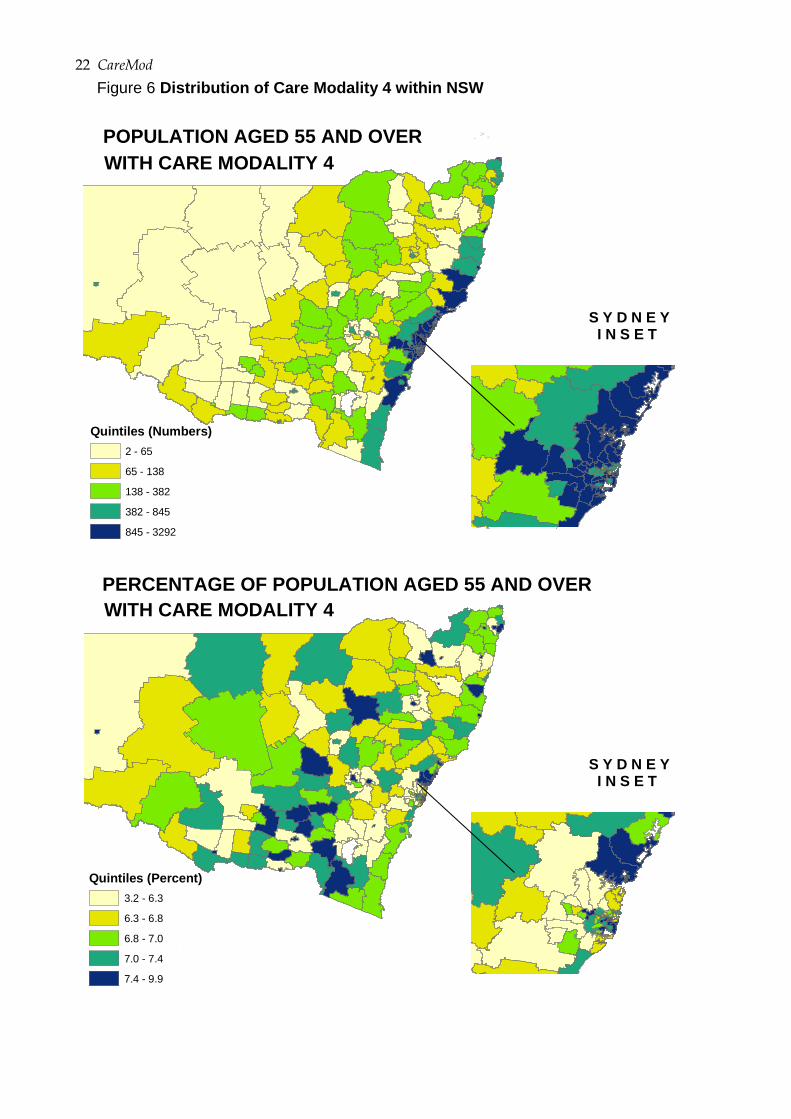
Variations across the SLAs are very noticeable for all four care modalities with clear
west-east gradients in the numbers of individuals requiring care. In terms of care
modality four (e.g. severe disability placing high demand on care providers within
the home or community, or lower dependency residential type services), there are
only seven areas with fewer than 20 individuals with modality four level of need and
20 areas with fewer than 40 individuals identified in the CareMod modelling as
needing these types of care services. Areas in the bottom quintile have fewer than 65
individuals with severe disability while those in the top quintile have more than 845
persons with severe restriction in core activities.
For care modality five (profound disability leading to the highest level of care such as
nursing home care) again there are only seven areas with fewer than 20 individuals
with high dependency needs, and 12 areas with fewer than 40 individuals identified
in the CareMod modelling as needing high level care – all of these areas are located
in rural or remote NSW. Compared to modality four, areas in the bottom quintile for
modality five have fewer than 93 individuals with profound disability while those in
the top quintile have more than 1125 persons with profound restriction in core
activities.
However, these patterns do not simply reflect population distribution. There are
significant regional differences in the proportion of the local community populations
needing care. This is particularly so for care modality five where the percentage of
individuals aged 55 years or over requiring high level care varies between 2% in the
rural area of Cabonne to 27% in the Snowy Mountains. Of the 39 areas in the highest
quintile, 30 (77%) are rural SLAs or regional centres, many of which are located in the
southern part of the State. Interestingly, there is much less variation in the
proportions of local populations requiring moderate to lower high levels of care
(modalities 3 and 4), reflecting a more spatially even prevalence rate for moderate
and severe disability.
Further analyses are currently being undertaken for different age and gender groups
with a view to understanding the extent to which disability levels and care
modalities vary by gender and increasing age. For example, the number of persons
aged 85 years and over living in each SLA who according to the modelling have
profound disability and may need high dependency care ranged between 0
(Windouran, Cabonne (pt B), Yarrowlumla, Lord Howe Island) and 1,240 persons
CareMod 19
(Hornsby). Only 21 SLAs in NSW were identified as having fewer than ten very
elderly residents with high level aged care needs. In contrast, 15 areas were
estimated to have more than 500 very elderly residents with profound restrictions in
core activities and high care needs, these areas being the high population SLAs in
Sydney and the coastal retirement areas such as Wollongong, Newcastle, Wyong,
Lake Macquarie, Gosford and Hornsby. CareMod indicates that the median number
of persons aged 85 years or over with high care needs per area is 72 individuals.
The proportion of SLA populations aged 85 years and over with profound disability
and high dependency needs (modality five) varies between 0 and 68 percent
(Hunters Hill in Sydney) - only 13 SLAs in NSW were seen to have fewer than 20% of
their very elderly residents with high level aged care needs. In contrast, 10 areas
appear to have more than half of their very elderly residents with high care needs.
The median percentage for the 194 SLAs analysed was estimated at 37%.
20 CareMod
Man ly
Curt in
Eppi ng
Mos man
Burban k
Toow ong
Kenmore
Ipsw i ch
Cronul l a
Rose Ba y
Vaucl use
Red Hi llAshg ro ve
Lane Cov e
Bel levu e H il l
±
POPULATION AGED 55 YEARS AND OVER
S Y D N E YI N S E T
Quintiles (Numbers)
8 - 155
155- 299
299 - 861
861- 1948
1948 - 7922
WITH CARE MODALITY 2
100 0 10050
Kilometres
Man ly
Curt in
Eppi ng
Mos man
Burban k
Toow ong
Kenmore
Ipsw i ch
Cronul l a
Rose Ba y
Vaucl use
Red Hi llAshg ro ve
Lane Cov e
Bel levu e H il l
±
PERCENTAGE OF POPULATION AGED 55 YEARS AND OVER
S Y D N E YI N S E T
Quintiles (Percent)
9.3 - 15.9
15.9 - 16.3
16.3 - 16.6
16.6 - 16.9
16.9 - 17.6
WITH CARE MODALITY 2
100 0 10050
Kilometres
Figure 4 Distribution of Care Modality 2 within NSW
CareMod 21
Man ly
Curt in
Eppi ng
Mos man
Burban k
Toow ong
Kenmore
Ipsw i ch
Cronul l a
Rose Ba y
Vaucl use
Red Hi llAshg ro ve
Lane Cov e
Bel levu e H il l
±
POPULATION AGED 55 AND OVER
S Y D N E YI N S E T
Quintiles (Numbers)
2 - 78
78 - 162
162 - 454
454 - 1004
1004 - 4219
WITH CARE MODALITY 3
100 0 10050
Kilometres
Man ly
Curt in
Eppi ng
Mos man
Burban k
Toow ong
Kenmore
Ipsw i ch
Cronul l a
Rose Ba y
Vaucl use
Red Hi llAshg ro ve
Lane Cov e
Bel levu e H il l
±
PERCENTAGE OF POPULATION AGED 55
S Y D N E YI N S E T
Quintiles (Percent)
3.9 - 8.0
8.0 - 8.5
8.5 - 8.8
8.8 - 9.0
9.0 - 9.7
WITH CARE MODALITY 3
100 0 10050
Kilometres
Figure 5 Distribution of Care Modality 3 within NSW
YEARS AND OVER
22 CareMod
Man ly
Curt in
Eppi ng
Mos man
Burban k
Toow ong
Kenmore
Ipsw i ch
Cronul l a
Rose Ba y
Vaucl use
Red Hi llAshg ro ve
Lane Cov e
Bel levu e H il l
±
POPULATION AGED 55 AND OVER
S Y D N E YI N S E T
Quintiles (Numbers)
2 - 65
65 - 138
138 - 382
382 - 845
845 - 3292
WITH CARE MODALITY 4
100 0 10050
Kilometres
Man ly
Curt in
Eppi ng
Mos man
Burban k
Toow ong
Kenmore
Ipsw i ch
Cronul l a
Rose Ba y
Vaucl use
Red Hi llAshg ro ve
Lane Cov e
Bel levu e H il l
±
PERCENTAGE OF POPULATION AGED 55 AND OVER
S Y D N E YI N S E T
Quintiles (Percent)
3.2 - 6.3
6.3 - 6.8
6.8 - 7.0
7.0 - 7.4
7.4 - 9.9
WITH CARE MODALITY 4
100 0 10050
Kilometres
Figure 6 Distribution of Care Modality 4 within NSW
CareMod 23
Man ly
Curt in
Eppi ng
Mos man
Burban k
Toow ong
Kenmore
Ipsw i ch
Cronul l a
Rose Ba y
Vaucl use
Red Hi llAshg ro ve
Lane Cov e
Bel levu e H il l
±
POPULATION AGED 55 AND OVER
S Y D N E YI N S E T
Quintiles (Numbers)
4 - 93
93 - 201
201 - 554
554 - 1125
1125 - 3806
WITH CARE MODALITY 5
100 0 10050
Kilometres
Man ly
Curt in
Eppi ng
Mos man
Burban k
Toow ong
Kenmore
Ipsw i ch
Cronul l a
Rose Ba y
Vaucl use
Red Hi llAshg ro ve
Lane Cov e
Bel levu e H il l
±
PERCENTAGE OF POPULATION AGED 55
S Y D N E YI N S E T
Quintiles (Percent)
2.1 - 7.9
7.9 - 9.0
9.0 - 10.0
10.0 - 11.2
11.2 - 38.6
WITH CARE MODALITY 5
100 0 10050
Kilometres
Figure 7 Distribution of Care Modality 5 within NSW
YEARS AND OVER
11.2 – 26.9
24 CareMod
4 Discussion and Conclusions
The rationale for building CareMod was to be able to provide much more detailed
answers to possible questions about the current and likely future need for,
affordability of, and private and public capacity to fund aged care for older
Australians. The small area forecasting capabilities of CareMod offer a new spatial
estimation tool to assist in forward planning and decision-making on service
provision, including what types of services are needed, what balance will be needed
between formal and informal care, where should services be located and how could
the costs of these services be met by Government and users.
The preliminary results from CareMod indicate that the prevalence of disability and
need for aged care varies significantly across NSW both in absolute and relative
terms. Further, it appears that the greatest spatial variability occurs in the prevalence
of older persons with profound restriction in core activities. It is these individuals
who place demand on high dependency residential aged care facilities or programs
such as EACH. It is acknowledged that these patterns represent only part of the
picture, namely the demand side. This information needs to be combined with data
on the existing provision of services and likely changes in supply to be able to
identify areas of unmet need now and in the future. It is the areas where current
service provision is lacking and the areas in which demand will grow strongly in the
future that will need to be identified and then targeted in terms of planning and
resource allocation.
The maps provided illustrate the basic application of the modelling available within
CareMod. These results can (and will) be further analysed by a wide range of
demographic and socio-economic variables at the person and family level. For
example, the type of income unit to which an elderly disabled individual belongs
and whether or not they own and live within their own home strongly influence the
likelihood of them entering residential aged care facilities. The availability of support
from family is a crucial issue. Currently, one in three NSW residents aged 65 years or
over live alone. In the next two decades, there will be a significant rise in the number
of older Australians living by themselves, many of who will have some impairment
in core activities and will require assistance. The increasing numbers of older persons
with disability but the relative decreasing numbers of younger persons that may be
able to act as care givers poses a very real challenge to the ability of the informal
sector to continue to provide, at current levels, this key welfare support role (AIHW,
2004; Percival and Kelly, 2004). Furthermore, research indicates that there also will
be an increase in the proportion of carers that are elderly themselves (Percival and
CareMod 25
Kelly, 2004; AIHW, 2004) and who may struggle to be able to provide the necessary
levels of care.
CareMod has been constructed to provide small area estimates of disability, to
identify modality of care and in a second planned phase of work to provide regional
projections of older Australians living in NSW over the next 20 years. Such estimates
have enormous potential for informing social policy development and assisting in
addressing the pressing issues that are arising through Australia’s population
ageing. The model offers detailed micro level data at the small area level and allows
the analysis of these data in a range of different ways for further understanding the
characteristics and care needs of older Australians.
A number of extensions to and advanced applications of CareMod are planned in a
follow-up stage of this research. The records within CareMod’s base dataset can be
‘aged’ over time (i.e. the data up-rated) to provide projections over the next couple of
decades. Such projections will allow us to answer questions like:
how many elderly persons will live in different SLAs of NSW in 5, 10, 15 or 20
years time;
what will be their disability status and need for care;
what will be their family status, living arrangements and availability of
informal care;
what income from both government (e.g. age pension) and private sources
(e.g. superannuation, returns on investment) and assets including housing
will they have at their disposal to contribute to their costs of care?
In addition, the model is being built such that key parameters can be changed so that
the distributional consequences of possible policy changes and the significance of key
assumptions to the modelling outcomes can be assessed. For example, what would
be the distributional impact of different social security eligibility criteria and user-
pay contributions to the costs of care or the impact of lower levels of disability due to
medical advances? Because microsimulation models operate at the level of
individuals and their families, it is possible to model complex policy options and to
assess their distributional and revenue consequences. Given that governments are
likely to be under significant budgetary pressure in the ageing portfolio and other
policy areas, greater attention will be devoted to the financial costs to government of
supporting care services and the possibility of greater independence and self-
provision by older Australians. Therefore, a key element of CareMod is its
functionality to simulate the distributional impact of changes in the public and
private distribution of care costs — that is, what will be the likely costs of the
different care modalities and how will these costs be divided between private
contributions compared with government outlays under different policy settings?
26 CareMod
The results produced by CareMod to date indicate that the potential offered by the
socio-spatial methodology trialled in this model can be realised. It has become
increasingly evident that such models do assist in policy debates on the affordability
and funding of both home and community based and residential aged care services
but more specifically in informing regional resource allocation-location decisions.
The local areas in which individuals live are unique in their social and physical
fabric. Small areas are spatially diverse and planning tools such as CareMod can
contribute to the understanding of local needs and to providing solutions to allow
older Australians to undergo healthy and productive ageing.
CareMod 27
References
Access Economics, 2005, Dementia Estimates and Projections: Australian States and
Territories, Alzheimer’s Australia, Canberra.
Allen Consulting Group, 2002. The Financial Implications of Caring for the Aged to 2020. A
report commissioned in conjunction with the Myer Foundation project 2020: A Vision for
Aged Care in Australia. Melbourne.
Bell, P, 2000. Weighting and Standard Error Estimation for ABS Household Surveys, Paper
prepared for ABS methodological Advisory Committee, July 2000. Canberra, ABS.
ABS, 1999. Disability, Ageing and Carers: User Guide, Australia ABS Cat 4431.0, Canberra, ABS.
ABS, 2001. Superannuation and financial characteristics Apr to Jun 2000, ABS Cat 6360.0,
Canberra, ABS.
AIHW, 2004. Carers in Australia: Assisting Frail Older People and People with a disability. AIHW
Cat No AGE 41. Canberra, AIHW.
AIHW, 2004a. Community Aged Care Packages in Australia 2002-03: a statistical overview. AIHW
Cat No AGE 39. Canberra, AIHW.
AIHW, 2004b. Extended Aged Care at Home EACH (Census): A Report on the Results of the Census
Conducted in May 2002. AIHW Cat No AGE 33. Canberra, AIHW.
AIHW, 2003. Australia’s Welfare 2003. Canberra, AIHW
AIHW, 2002. Older Australia at a Glance 2002 (3rd Ed). AIHW Cat No AGE 25. Canberra,
AIHW.
AIHW, 2000. Disability and Ageing: Australian Population Patterns and Implications. AIHW Cat
No DIS 19. Canberra, AIHW.
Ballas, D and G Clarke, 1999, ‘Modelling the local impacts of national social policies: A
microsimulation approach’, 11th European Colloquium on Theoretical and Quantitative
Geography, Durham, England, 3rd to 7th September.
The Hon. Bronwyn Bishop, MP, Minister for Aged Care, 1999, National Strategy for an
Ageing Australia: Healthy Ageing Discussion Paper. Commonwealth of Australia.
The Hon. Bronwyn Bishop, MP, Minister for Aged Care, 1999a, National Strategy for an
Ageing Australia: Independence and Self Provision Discussion Paper. Commonwealth of
Australia.
Brown, L. and Harding, A. 2005. The New Frontier of Health and Aged Care. Chpt 10 in
'Quantitative Tools for Microeconomic Policy Analysis' 2004 Productivity Commission
Conference Proceedings, Commonwealth of Australia, 2005 (Forthcoming).
Brown, L., Yap, M., Lymer, S., Chin, SF., Leicester, S., Blake, M. and Harding, A. 2004. Spatial
Microsimulation Modelling of Care Needs, Costs and the Capacity for Self-Provision:
28 CareMod
Detailed Regional Projections for Older Australians to 2020. Conference Paper,
Australian Population Association Conference, Canberra, September 2004
Brown, L, Walker, A., Waters, A., Harding, A. and Thurecht, L., 2002. Funding of High Cost
Biotechnology and Other Innovative Targeted Therapies under the Pharmaceutical Benefits
Scheme, NATSEM Position Paper, University of Canberra.
Department of the Treasury 2002, Intergenerational Report 2002-03, Budget Paper No. 5,
Treasury, Commonwealth of Australia, May.
Gibson, D., Braun, P. and Liu Z., 2000. Spatial Equity in the Distribution of Aged Care Services.
Welfare Division Working Paper No 25., AIHW, Canberra.
Giles, L.C., Cameron, I.D., and Crotty, M. 2003. Disability in Older Australians: Projections
for 2006-2031. MJA, 179(3), 130-133.
Henderson AS and Jorm AF, 1998, Dementia in Australia, (Aged and Community Care
Service Development and Evaluation Report No 35), Department of Health and Ageing,
AGPS, Canberra.
Huang Z and Williamson P (2001) A comparison of synthetic reconstruction and
combinatorial optimisation approaches to the creation of small-area microdata. Working
Paper 2001/2, Population Microdata Unit, Department of Geography, University of
Liverpool, Liverpool L69 3BX. http://pcwww.liv.ac.uk/~william/microdata
Kelly, S. 2003 Australia’s Microsimulation Model – DYNAMOD, Conference Paper
www.natsem.canberra.edu.au/publications/papers/cps/cp03/2003_025/cp2003_025.p
df
Kelly, S., Harding, A. and Percival, R, 2002, ‘Live Long and Prosper? Projecting the Likely
Superannuation of the Baby Boomers in 2020’ , Paper presented at the Business
Symposium of the Annual Conference of Economists, University of Adelaide, 4 October.
King. S. A. 2001, 'Superannuation – The Right Balance'?, Report prepared for CPA Australia,
CPA Australia, Melbourne.
Percival, R. and Kelly, S. 2004, Who’s going to care? Informal Care and an ageing population,
Carers Australia, Canberra, June (available from www.natsem.canberra.edu.au)
Productivity Commission (2003) Productivity Commission Submission to the Review of
Pricing Arrangements in Residential Aged Care, June.
Productivity Commission 2004, Economic Implications of an Ageing Australia. Draft Research
Report, Productivity Commission, Canberra.
Singh, M. 1995. Disability and Handicap among Future Elderly Australians. Populatio
Geography, 15(1&2), 1-21.
Voas, D and Williamson, P, 2000, ‘An Evaluation of the Combinatorial Optimisation
Approach to the Creation of Synthetic Microdata’, International Journal of Population
Geography, vol 6, pp 348-366.