Embed Size (px)
Citation preview

UUnniivveerrssiittyy ooff PPrreettoorriiaa eettdd –– LLaakkaa--MMaatthheebbuullaa,, MM RR ((22000044))
MODELLING THE RELATIONSHIP BETWEEN ORGANIZATIONAL COMMITMENT, LEADERSHIP
STYLE, HUMAN RESOURCES MANAGEMENT PRACTICES AND ORGANIZATIONAL TRUST
By
MMAKGOMO ROSELINE LAKA-MATHEBULA
Submitted in partial fulfilment of
the requirements for the degree
PHILOSOPHIA DOCTOR
With specialisation in
Organisational Behaviour
in the
FACULTY OF ECONOMIC AND MANAGEMENT SCIENCES
at the
UNIVERSITY OF PRETORIA
PRETORIA January 2004

UUnniivveerrssiittyy ooff PPrreettoorriiaa eettdd –– LLaakkaa--MMaatthheebbuullaa,, MM RR ((22000044))
ii
SUMMARY
MODELLING THE RELATIONSHIP BETWEEN
ORGANIZATIONAL COMMITMENT, LEADERSHIP
STYLE, HUMAN RESOURCES MANAGEMENT
PRACTICES AND ORGANIZATIONAL TRUST
By
MMAKGOMO ROSELINE LAKA-MATHEBULA
PROMOTER : DR R VAN WYK
CO-PROMOTER : PROF AB BOSHOFF
DEGREE : PHILOSOPHIA DOCTOR(Organisational Behaviour)
Research in the organizational psychology and organizational behaviour literature has identified the existence of multiple dimensions of OC and found different relationships between these dimensions and important organizational factors and outcomes. In an attempt to add to the efforts to clarify these relationships, this study focuses on the relationships between organizational factors such as human resources management (HRM) practices, leadership and trust, and organizational commitment within an academic environment.
A sample of 246 employees from eleven South African institutions of higher learning was used in the study. The sample was made up of 67.88% respondents from Technikons and 28.86% from Universities. Females accounted for 45.12% of the sample while males were 54.51%. The average age of respondents was 41.9 years.
ANOVA was used to determine the relationship between demographic factors and organizational commitment. The results of the ANOVAs showed no significant relationship between the demographic factors and organizational commitment. The only significant relationship was found between the type of academic institution and total organizational commitment. Tukey’s studentized range test indicated significant differences in the means of respondents from full-time residential institutions and those from institutions with a combination of fulltime residential and part-time non-residential students. Respondents from the
UUnniivveerrssiittyy ooff PPrreettoorriiaa eettdd –– LLaakkaa--MMaatthheebbuullaa,, MM RR ((22000044))
iii
later type of institutions had reported more total organizational commitment. Pearson’s Product Moment Coefficient was used to determine the inter-relationships between the total scales and subscales of the different variables. Significant inter-correlations were found between trust and HRM, trust and organizational commitment, leadership style and trust, and leadership style and HRM. Multiple Regression Analysis indicated weak predictions of organizational commitment by the different independent variables. Structural equations models could not be accepted as they showed weak fits with the data.
In light of these findings, suggestions are provided for academic institution managers to evaluate the role of HRM practices, leadership style and trust in influencing commitment to the organization and organizational trust. Suggestions are also made as to how leadership style and HRM practices can affect the role of trust in the development of organizational commitment, and how OC research can provide practical results for academic institutions.
UUnniivveerrssiittyy ooff PPrreettoorriiaa eettdd –– LLaakkaa--MMaatthheebbuullaa,, MM RR ((22000044))
iv
ACKNOWLEDGEMENTS
I wish to thank my study promoters, Dr. Rene Van Wyk and Prof Adre Boshoff for
making this a meaningful learning process. I am greatly indebted to them for opening my
eyes to the importance of commitment in the workplace. They guided and encouraged
me throughout the process of formulating my ideas. Their help and support was
invaluable when I struggled with the formulation of concepts and models for this study.
Thank you Dr Van Wyk for being my champion throughout. I would not have finished if it
were not for your kindness and support. Prof Boshoff your immense wealth of knowledge
was an inspiration for me. I wish to also thank Ms. Rina Owen for her expert advice
during the data analysis stage of the work.
I was fortunate to have a great family and friends who supported me throughout
the entire period of my studies. To my girls: Nyikiwe, Lonene and Woxonga, thank you
for your patience and understanding. You gave me the time to be a student when you
needed a mother. To David, my husband: you will never know how much you motivated
me through this period. To my mother, Mary Laka: “Ma, I would have never made it
without you”. You are the world’s greatest mother.
I cannot begin to list every one who helped me but I extend my thanks to each of
them, especially to everyone who helped me with my sample collection, Ntebo, Caroline,
and many other colleagues, thank you. Thank you to the leaders of all the academic
institutions who allowed me to use their staff as respondents, the Deans and secretaries
who helped in distributing my questionnaires and to the employees who took time to
complete the questionnaires.
This study was partly financed by means of a bursary from the National
Research Foundation. The opinions expressed in this dissertation are the responsibility
of the author and do not necessarily reflect the views of the NRF.

UUnniivveerrssiittyy ooff PPrreettoorriiaa eettdd –– LLaakkaa--MMaatthheebbuullaa,, MM RR ((22000044))
v
TABLE OF CONTENTS
TITLE ..........................................................................................................i ABSTRACT ................................................................................................i ACKNOWLEDGEMENTS.........................................................................iv
TABLE OF CONTENTS.............................................................................v
LIST OF FIGURES. ..................................................................................ix
LIST OF TABLES. .....................................................................................x
CHAPTER ONE: THE PROBLEM AND ITS SETTING .............................1
1.1 INTRODUCTION..................................................................................1
1.2 BACKGROUND TO THE STUDY ........................................................2
1.3 SIGNIFICANCE OF THE STUDY ........................................................9
1.4 PURPOSE OF THE STUDY ................................................................9
1.5 DESCRIPTIONS OF CONCEPTS USED IN THE STUDY.................11
1.5.1. Organizational commitment............................................................11
1.5.2. The concept of HRM ......................................................................16
1.5.3. The concept of leadership behaviour .............................................20
1.5.4. The concept of Trust ......................................................................22
1. 6 SUMMARY........................................................................................27
CHAPTER TWO: LITERATURE REVIEW...............................................28
2.1 INTRODUCTION................................................................................28
2.2 ORGANIZATIONAL COMMITMENT..................................................28
2.2.1. Dimensions of Organizational Commitment ...................................29
2.2.1.1. Affective Commitment .................................................................29
2.2.1.2. Continuance Commitment...........................................................30
2.2.1.3. Normative Commitment ..............................................................31
2.2.2. Variables associated with Organizational Commitment..................33
2.2.2.1. Variables associated with Affective Commitment........................33
2.2.2.2. Variables associated with Continuance Commitment. ................37
2.2.2.3. Variables associated with Normative Commitment .....................40
2.2.3. Organizational Commitment within academic institutions...............42

UUnniivveerrssiittyy ooff PPrreettoorriiaa eettdd –– LLaakkaa--MMaatthheebbuullaa,, MM RR ((22000044))
vi
2.3 HUMAN RESOURCES MANAGEMENT PRACTICES ......................45
2.3.1. Introduction ....................................................................................45
2.3.2. HRM Practices within academic institutions ...................................46
2.3.3. The association of HRM practices and organizational commitment
.................................................................................................................46
2.3.3.1. Selective staffing .........................................................................50
2.3.3.2. Comprehensive Training .............................................................52
2.3.3.3. Equitable rewards .......................................................................53
2.3.3.4. Promotions..................................................................................55
2.3.3.5. Job Security ................................................................................58
2.3.3.6. Employee Participation ...............................................................60
2.3.3.7. Information sharing .....................................................................61
2.3.3.8. Developmental performance appraisal........................................63
2.4 LEADERSHIP STYLES......................................................................65
2.4.1. Introduction ....................................................................................65
2.4.2. Approaches to Leadership .............................................................65
2.4.3. Multifactor leadership theory ..........................................................66
2.4.3.1. Transformational leadership style ...............................................67
2.4.3.2. Transactional leadership style.....................................................70
2.4.3.3. Laissez-Faire leadership style.....................................................71
2.4.4. Leadership style and HRM practices..............................................72
2.4.5. Leadership styles within academic institutions ...............................73
2.4.6. Leadership behaviour and Organizational commitment .................77
2.5 TRUST IN ORGANIZATIONS ............................................................78
2.5.1. Introduction ....................................................................................78
2.5.2. Dimensions of trust within organizations ........................................79
2.5.3. Referents of trust within organizations ...........................................81
2.5.4. Bases of trust within organizations.................................................83
2.5.5. HRM practices and trust.................................................................83
2.5.6. Leadership style and trust ..............................................................84
2.5.7. Studies of trust within academic organizations...............................87

UUnniivveerrssiittyy ooff PPrreettoorriiaa eettdd –– LLaakkaa--MMaatthheebbuullaa,, MM RR ((22000044))
vii
2.5.8. Trust and organizational commitment ............................................89
2. 6 RESEARCH QUESTIONS ................................................................91
2.7 SUMMARY.........................................................................................91
CHAPTER THREE: RESEARCH METHODOLOGY ...............................94
3.1 INTRODUCTION................................................................................94
3.2 RESEARCH DESIGN.........................................................................94
3.3 PARTICIPANTS .................................................................................95
3. 4 MEASURING INSTRUMENTS........................................................116
3.4.1. Allen and Meyer’s (1990) Organizational Commitment
Questionnaire.........................................................................................118
3.4.2. HRM Practices Questionnaire ......................................................119
3.4.3. Bass and Avolio’s (1995) Multifactor Leadership Questionnaire ..121
3.4.4. Organizational Trust Questionnaire..............................................123
3.5 PROCEDURES FOR DATA COLLECTION.....................................124
3.5.1. Questionnaire administration........................................................124
3.5.2. Handling of returned questionnaires and data..............................125
3.6 PROCEDURES FOR DATA ANALYSIS ..........................................128
3.6.1. Factor structure of the Organizational Commitment scale............130
3.6.2. Factor structure of the HRM practices scale ................................132
3.6.3. Factor structure of the Trust scale................................................141
3.6.4. Factor structure of the Multifactor Leadership scale.....................145
3.5 SUMMARY.......................................................................................149
CHAPTER FOUR: RESEARCH FINDINGS ..........................................150
4.1 INTRODUCTION..............................................................................150
4.2 RESULTS.........................................................................................152
4.2.1. Demographics and OC.................................................................152
4.2.2. The relationship between HRM, leadership, trust and OC. ..........156
4.2.3. The relationship between Organizational commitment and predictor
variables.................................................................................................163
4.2.4. A structural equation model of OC, HRM, Leadership style and trust
...............................................................................................................167
UUnniivveerrssiittyy ooff PPrreettoorriiaa eettdd –– LLaakkaa--MMaatthheebbuullaa,, MM RR ((22000044))
viii
CHAPTER 5: SUMMARY AND IMPLICATIONS...................................172
5.1 INTRODUCTION..............................................................................172
5.2 DISCUSSION OF FINDINGS...........................................................172
5.3 CONTRIBUTIONS OF THE CURRENT STUDY..............................179
5.4 IMPLICATIONS FOR MANAGEMENT.............................................179
5.5 DIRECTIONS FOR FUTURE RESEARCH ......................................181
5.6 LIMITATIONS OF THE STUDY .......................................................181
5.7 CONCLUSION .................................................................................182
REFERENCES.......................................................................................183
UUnniivveerrssiittyy ooff PPrreettoorriiaa eettdd –– LLaakkaa--MMaatthheebbuullaa,, MM RR ((22000044))
ix
LIST OF FIGURES Figure 1.1. The proposed relationships between HRM practices, leadership style,
organizational trust and organizational commitment. ..................................10
Figure 2.1. HR practices and work commitment. ................................................47
Figure 2.2. The effects of communication openness information adequacy,
participation in decision-making, employee age, length of service, job
position work shift, and job satisfaction on organizational commitment. .....61
Figure 2.3. Explaining the formation of teacher’s leader perceptions..................75
Figure 3.1. From population to sample: the process followed in obtaining the
sample. .......................................................................................................97
Figure 3.2. A comparison of language used as mother tongue and current home
language. ..................................................................................................111
Figure 4.1. Structural equation model of total HRM practices,
transformational/transactional leadership style, total trust as independent
variables and affective commitment as final dependent variable. .............168
Figure 4.2. Structural equation model of total HRM practices,
Transformational/Transactional leadership style, total trust as independent
variables and organizational commitment as dependent variable.............170
UUnniivveerrssiittyy ooff PPrreettoorriiaa eettdd –– LLaakkaa--MMaatthheebbuullaa,, MM RR ((22000044))
x
LIST OF TABLES
Table 1.1 Dimensions of Organizational Commitment within Multidimensional
Models ........................................................................................................15
Table 1.2 A Comparison of Personnel Management and HRM ........................19
Table 1. 3 A Summary of Some of the Definitions of Trust in the Organizational
Context .......................................................................................................23
Table 2.1 The effect of HR practices on types of commitment............................49
Table 3.1 Age distributions of respondents.........................................................98
Table 3.2 A distribution of respondent’s ages into age groups .........................100
Table 3.3 Respondents’ gender .......................................................................100
Table 3.4 Distribution of respondents according to level of education ..............101
Table 3.5 Distribution of respondents per current position................................102
Table 3.6 Distribution of respondents per number of years spent in an academic
institution...................................................................................................103
Table 3.7 Number of years in academic environment per category..................104
Table 3.8 Distribution of respondents per number of years in current position .105
Table 3.9 Distribution of respondents per number of years in current position per
category ....................................................................................................106
Table 3.10 Distribution of respondents per number of years in current institution
..........................................................................................................................107
UUnniivveerrssiittyy ooff PPrreettoorriiaa eettdd –– LLaakkaa--MMaatthheebbuullaa,, MM RR ((22000044))
xi
Table 3.11 Distribution of respondents according to involvement in decision-
making ......................................................................................................108
Table 3.12 Respondent’s distribution by current home language .....................109
Table 3.13 Distribution of respondents by mother tongue.................................110
Table 3.14 Distribution of respondents per type of Campus .............................112
Table 3.15 Distribution of respondents per type of institution ...........................112
Table 3.16 Institution size (as indicated by enrolment figures) and age of
institution...................................................................................................113
Table 3.17 Type of academic institution............................................................114
Table 3.18 Distribution of respondents with regard to organization’s restructuring
..........................................................................................................................115
Table 3.19 Distribution of respondents with regard to the time their organization
had undergone restructuring.....................................................................116
Table 3.20 Summary of measuring instruments ...............................................117
Table 3.21 Three factor rotated structure of Organizational commitment scale
(N=246).....................................................................................................131
Table 3.22 Factor correlations for a three-factor rotated structure of OCS (N=
246)...........................................................................................................132
Table 3.23 Results of Confirmatory Factor Analysis of the Organizational
Commitment scale (N =246) .....................................................................133
Table 3.24 Three-factor rotated structure of Boselie et al’s scale (N=246) .......135
UUnniivveerrssiittyy ooff PPrreettoorriiaa eettdd –– LLaakkaa--MMaatthheebbuullaa,, MM RR ((22000044))
xii
Table 3.25 Inter-factor correlations of the three-factor structure of the Boselie et
al (2001)’s scale........................................................................................136
Table 3.26 Results of Confirmatory Factor Analysis of Boselie et al’s scale for
HRM (N =246)...........................................................................................137
Table 3.27 Two-factor rotated structure of Snell and Dean (1992) scale (N = 246)
..........................................................................................................................138
Table 3.28 Results of Confirmatory Factor Analysis of Snell and Dean’s HRM
scale (N =246) ..........................................................................................140
Table 3.29 One factor structure of the commitment to HRM practices scale ....141
Table 3.30 Two-factor structure of the trust scale (N=246) ...............................142
Table 3.31 Results of Confirmatory Factor Analysis of the Trust scale (N =246)
..........................................................................................................................144
Table 3.32 Three factor rotated structure of Bass and Avolio’s MLQ scale (N =
246)...........................................................................................................146
Table 3.33 Inter-correlations of the rotated three factors of Bass and Avolio’s
MLQ scale (N= 246)..................................................................................147
Table 3.34 Results of Confirmatory Factor Analysis of Bass and Avolio’s MLQ
scale (N =246) ..........................................................................................148
Table 4.1 Variables included in the analyses....................................................151
Table 4.2 Results of Analysis of Variance of with demographic variables as
independent variables and affective commitment as dependent variable (N
= 246) .......................................................................................................153

UUnniivveerrssiittyy ooff PPrreettoorriiaa eettdd –– LLaakkaa--MMaatthheebbuullaa,, MM RR ((22000044))
xiii
Table 4.3 Results of Analysis of Variance with demographic variables as
independent variables and Continuance commitment as dependent variable.
(N= 246)....................................................................................................154
Table 4.4 Results of Analysis of Variance with demographic variables as
independent variables and normative commitment as dependent variable (N
=246) ........................................................................................................155
Table 4.5 Results of Analysis of Variance with demographic variables as
independent variables and total organizational commitment as dependent
variable (N = 246) .....................................................................................156
Table 4.6 Pearson Correlation Coefficients between factor variables (N = 246)
..........................................................................................................................158
Table 4.7 Calculation of 100r2 (N= 246)............................................................159
Table 4.9 Results of Multiple Regression Analysis with Affective Commitment as
dependent variable and HRM practices subscales as predictor variables 164
Table 4.10 Results of Multiple Regression Analysis with Continuance
Commitment as dependent variable and HRM practices subscales as
predictor variables.....................................................................................165
Table 4.11 Results of Multiple Regression Analysis with Normative Commitment
as dependent variable and trust, HRM practices and leadership behaviour
sub-scales as predictor variables..............................................................166
Table 4.12 Results of Multiple Regression Analysis with Total organizational
Commitment as dependent variable and Trust, HRM practices and
Leadership behavior subscales as predictor variables..............................166
UUnniivveerrssiittyy ooff PPrreettoorriiaa eettdd –– LLaakkaa--MMaatthheebbuullaa,, MM RR ((22000044))
xiv
Table 4.13 Results of Multiple Regression Analysis with Total organizational
Commitment as dependent variable and total scale of Trust and
organizational commitment to HRM practices as predictor variables........167
Table 4.14 Indices obtained from the Structural Equations Analysis the model in
Figure 4.1 (N =246)...................................................................................169
Table 4.15 Indices obtained from the Structural Equations Analysis of figure 4.2
(N =246)....................................................................................................171
UUnniivveerrssiittyy ooff PPrreettoorriiaa eettdd –– LLaakkaa--MMaatthheebbuullaa,, MM RR ((22000044))
1
CHAPTER ONE: THE PROBLEM AND ITS SETTING
1.1 INTRODUCTION
Many researchers point out that organizational commitment has remained
a topic of interest ever since it was introduced in the early 1950s to the field of
organizational behaviour (Aryee & Heng, 1990; Meyer & Allen, 1997; Baruch,
1998; Mowday, 1998; Goulet & Frank, 2002). These authors indicate that the
continued interest is a result of the belief that if properly managed, organizational
commitment can lead to beneficial consequences such as organizational
effectiveness, improved performance, reduced turnover and reduced
absenteeism (Meyer & Allen, 1997 and Mowday, 1998). This quest to harness
the potential organizational benefits has resulted in the large number of studies
that focus on the nature of organizational commitment.
Although a great deal has been written about organizational commitment,
there still is no clear understanding on how the factors purported to be
associated with it contribute to its development or how these organizational
factors can be managed to promote the development of organizational
commitment (Beck & Wilson, 2001). Human resources management practices,
leadership styles and trust within the organization are some of the organizational
factors that have been associated with organizational commitment (Meyer &
Allen, 1997). The exact manner in which these factors influence the development
of organizational commitment is still not well understood. Empirical evidence is
still needed to unravel the development of organizational commitment.
UUnniivveerrssiittyy ooff PPrreettoorriiaa eettdd –– LLaakkaa--MMaatthheebbuullaa,, MM RR ((22000044))
2
1.2 BACKGROUND TO THE STUDY
Organizational commitment is widely described in the management and
behavioural sciences literature as a key factor in the relationship between
individuals and organizations. For example, Raju and Srivastava (1994); Mowday
(1998); and Gilbert and Ivancevich (1999) all describe organizational
commitment as the factor that promotes the attachment of the individual to the
organization. Employees are regarded as committed to an organization if they
willingly continue their association with the organization and devote considerable
effort to achieving organizational goals (Raju & Srivastava, 1994; Mowday,
1998). These authors argue that the high levels of effort exerted by employees
with high levels of organizational commitment would lead to higher levels of
performance and effectiveness at both the individual and the organizational level.
As there seems to be considerable evidence that committed employees
are more valuable than those with weak commitment (Raju & Srivastava, 1994;
Mowday, 1998), researches have focused on the identification of organizational
factors that can be managed in order to foster employee commitment. A search
of the extensive literature reveals a long list of factors that are associated with
the development of organizational commitment. Mowday, Steers and Porter
(1979) have categorized these factors into four major categories of variables.
These are personal characteristics, job characteristics, work experiences and
structural characteristics. Other organizational factors that have been suggested
to influence organizational commitment include organizational size,
organizational culture, leadership style, and human resources management
practices that influence salary, career prospects and possibilities for further
education (Nijhof, de Jong & Beukhof, 1998). Among these, there are some
factors such as organizational culture, leadership style, and human resources
practices, which could be deliberately manipulated by organizations to influence
the levels of organizational commitment in their employees.
UUnniivveerrssiittyy ooff PPrreettoorriiaa eettdd –– LLaakkaa--MMaatthheebbuullaa,, MM RR ((22000044))
3
Human Resources Management (HRM). The importance of
organizational characteristics in the creation and maintenance of employee work
attitudes such as organizational commitment has been recognized by authors
like Reichheld (1996) and Pfeffer (1998). These authors argue that organizations
that pursue a strategy of increasing employee commitment gain a competitive
advantage over other organizations that do not follow a similar strategy.
Reichheld (1996) in his book “The Loyalty Effect”, states that organizations that
exhibit loyalty to their customers, employees and investors realize growth and
profit that support a competitive advantage. He argues that when employees are
satisfied with their organization, they will in turn show loyalty to the organization
and will ensure that the customer is satisfied by the organization’s services or
products. As satisfied employees tend to stay with an organization, the
organization will save costs on recruiting and training new employees as loyal
employees remain with the organization. He cites several examples of
companies that have pursued strategies of attracting developing and re-training
competent employees as evidence that loyalty to employees can be a powerful
source of competitive advantage.
Pfeffer (1998) writes in his book “The Human Equation: Building Profits by
Putting People First” that firms that pursue “high involvement, high performance
and high commitment management practices” produce superior economic
returns over time. He supports this viewpoint by identifying a set of seven
management practices that he believes lead to organizational outcomes related
to higher economic returns. These are: (1) employment security; (2) selective
hiring; (3) self-managed teams and decentralization of decision making; (4) high
compensation contingent on performance; (5) employee training; (6) reduced
status differentials and (7) information sharing. He refers to these management
practices as people-centred strategies and states that people-centred strategies
are an important source of competitive advantage, as they cannot be easily
imitated.
UUnniivveerrssiittyy ooff PPrreettoorriiaa eettdd –– LLaakkaa--MMaatthheebbuullaa,, MM RR ((22000044))
4
As both Reichheld’s (1996) and Pfeffer’s (1998) books lack empirical
evidence to support their arguments, there arises a need for researchers to
produce more empirical evidence to support the proposed link between
management practices and positive organizational outcomes. Meyer and Allen
(1997), in their book “Commitment in the workplace: Theory, research and
application” describe several empirical studies which have shown a positive
relationship between organizational practices, organizational commitment and
desirable work outcomes such as performance, organizational citizenship
behaviour, turnover, adaptability and job satisfaction.
In addition to the references quoted by Meyer and Allen (1997) there are
other researchers who have reported relationships between human resource
management systems or strategies and organizational outcomes such as
employee retention, productivity, quality and organizational economic success at
the organizational level (Arthur, 1994; Huselid, 1995; Tsui, Pearce, Porter &
Tripoli, 1997; Whitener, 2001). Arthur (1992) showed through Multiple
Regression Analysis, that human resources systems were significantly
associated with variation in steel mini-mills’ performance. Tsui et al. (1997) found
that organizational investments in employees is associated with significantly
higher levels of employee affective commitment as well as higher levels of
organizational citizenship behaviour, greater intention to stay with the
organization and fewer unexcused absences.
Whitener (2001), using hierarchical linear modelling, found that
employee’s commitment is significantly related to both actual and perceived HRM
practices such as internal promotion, training opportunities and employment
security. These authors suggest that adopting an integrated set of human
resource management practices focusing on commitment can produce high
levels of employee affective commitment and subsequent organizational
performance. However, the linkage between human resource management
strategies and individual level employee commitment needs further exploration
by researchers.
UUnniivveerrssiittyy ooff PPrreettoorriiaa eettdd –– LLaakkaa--MMaatthheebbuullaa,, MM RR ((22000044))
5
Trust: In the same way that organizational commitment is seen as an
antecedent to desirable organizational outcomes, researchers argue that trust is
the key to producing excellent organizational functioning (Whitener, 1997;
Tschannen-Moran & Hoy, 1998; and Kerfoot, 1998). Whitener (1997) argues that
the levels of trust within an organization can influence the successful
implementation of the HRM practices. She makes a case that trust influences the
employee’s perception of procedural and distributive justice associated with the
implementation of human resources management policies. Therefore, the
effectiveness and success of HRM policies and practices will be dependent on
the employee’s trust of the management in the organization (Whitener, 1997).
Organizational life is characterized by interactions between individuals
within and outside the organization. Mishra (1996) and Tschannen-Moran and
Hoy (1998) argue that trust is important for these interactions to be successful.
They see trust as a necessary element that promotes effective co-operation and
communication in well functioning organizations. Kerfoot (1998) supports the
idea that trust is an important factor in organizational success. She argues that
social and professional collaborations, which are essential for producing positive
outcomes within an organization, succeed if there is trust between the involved
parties. She takes the argument further by stating that the level of trust is the
foundation upon which financial and quality success can be built.
Researchers have shown that trust has significant positive relationships
with many organizational variables such as communication, performance,
citizenship behaviour and co-operation (Mishra & Morrisey, 1990; Sashittal,
Berman & Ilter, 1998; Costigan, Ilter & Berman, 1998). The results of a survey by
Mishra and Morrisey (1990) of West Michigan managers present a list of seven
main advantages of trust. These are (1) improved communication, (2) greater
predictability, (3) dependability and confidence, (4) reduction in employee
turnover, (5) an openness, willingness to listen and accept criticism non-
defensively, (6) repeat business, and (7) a reduction of friction among
employees. The managers surveyed also agreed that organizational

UUnniivveerrssiittyy ooff PPrreettoorriiaa eettdd –– LLaakkaa--MMaatthheebbuullaa,, MM RR ((22000044))
6
ineffectiveness is largely due to widespread distrust among employees towards
management.
The results obtained by Costigan et al. (1998) indicate a link between
affect-based trust in work relationships and employee behaviour such as risk
taking, motivation, assertiveness and personal initiative to improve
professionally. This means that when employees trust the organization, they
work hard and are able to take risks and show initiative in ways that can only
benefit the organization. Guarrero (1998) supports this argument when he
contends that when an individual operates in an environment with high trust
levels, the individual becomes more creative and effective, which consequently
leads to organizational success.
Several researchers ascribe negative organizational and individual
consequences to a lack of trust (Mishra & Morrisey, 1990; Kerfoot, 1998 and
Guarrero, 1998). They point out that when trust levels are low, individuals tend to
be less creative, less forthcoming with ideas and exert less effort towards
organizational goals. Mishra and Morrisey (1990) state that in an environment
where trust does not exist, individuals expand a lot of their energy trying to
protect themselves rather than achieve organizational goals. Kerfoot (1998) lists,
among others, a culture of insecurity, high turnover and marginal loyalty as some
of the organizational consequences of low trust. Guarrero, (1998) takes the
effects of lack of trust beyond the individual by indicating the organizational costs
associated with a lack of trust. He indicates that without trust, management may
erroneously assume that employees need more rigid supervision and tighter
controls, which would stifle employee initiative and creativity.
Concerning factors that induce trust, Mishra and Morrissey (1990) identify
four factors: (1) open communication, (2) giving workers greater share in the
decision making, (3) sharing of critical information, and (4) true sharing of
perceptions and feelings. Guerrero (1998) also describes four basic conditions
that need to exist in an organization for trust to be developed and established.
The conditions include an (1) openness that allows information to be shared with
employees, (2) a commitment to fostering employee talent, (3) a willingness to

UUnniivveerrssiittyy ooff PPrreettoorriiaa eettdd –– LLaakkaa--MMaatthheebbuullaa,, MM RR ((22000044))
7
allow disagreement within the organization, and (4) a leadership base that
consistently acts with integrity. All these support the notion that trust develops in
an environment where information is freely shared and the organization shows
commitment to its employees.
From the list of factors described by Mishra and Morrisey (1990) and
Guarrero (1998), it seems that human resources management practices might
have an influence on the development of trust. For example, information
dissemination within an organization and the extent to which employees are
involved in the decision making process are determined by human resources
policies of an organization. Whitener (2001) has shown that human resources
management practices like training and development, promotions, compensation,
job security, recruitment and selection and performance evaluation have been
found to affect the development of trust.
From the literature, it seems that there is evidence to support the
argument that trust and organizational commitment are critical to an
organization’s success. In addition, Siegall and Worth (2001) argue that trust in
organizations is needed so that employees can feel confident that their efforts will
result in some benefit to themselves. Therefore, it can be argued that employees
need to trust that their commitment to an organization and the efforts they exert
on behalf of the organization will lead to personal benefits. Thus, it can be argued
that if employees can trust that their efforts will lead to organizational success
and that they will benefit from the organization’s success, they will develop
commitment to the organization. There is however, limited empirical evidence
that clarifies the relationship between organizational commitment and trust.
The literature again supports the notion that human resources practices
can affect the development of both organizational commitment and trust.
Although there seems to be evidence that links specific human resources
management systems with either commitment of individual employees or trust,
what remains to be demonstrated is whether human resources management
systems have a relationship with both trust and organizational commitment in the
same people. A study in which all these variables are included is therefore called

UUnniivveerrssiittyy ooff PPrreettoorriiaa eettdd –– LLaakkaa--MMaatthheebbuullaa,, MM RR ((22000044))
8
for. Another important organizational characteristic that could affect the
development of organizational commitment and trust is leadership style.
Leadership Style. Several authors have associated leaders’
characteristics with the development of either organizational commitment or trust
(Bennis & Goldsmith, 1994; Bennis & Townsend, 1995; Kerfoot, 1998). Bennis
and Goldsmith (1994), and Bennis and Townsend (1995) believe that vision,
empathy, consistency and integrity in a leader could foster the development of
trust. They also indicate that leaders generate and sustain trust by acting in ways
that produce constancy, congruity, reliability and integrity. Kerfoot (1998) adds to
these availability and accessibility, communicating with candour and a
willingness to invest in employees.
According to the HRM philosophy, organizational commitment is the joint
responsibility of line managers and the human resources department (Shepperd
& Matthews, 2000). The way leaders behave as they practise the organization’s
human resources policies can influence employee’s behaviour (Whitener, 2001).
The interpersonal treatment employees receive from their supervisors such as
“adequately considering their view points, supporting their personal biases,
explaining their decisions and providing feedback timely and applying decision-
making criteria consistently” could have strong effect on the employee’s
perceptions of fairness (Whitener, 2001). Therefore, organizations that have
supervisors who treat employees fairly as they enact procedures and HR
practices could increase their employee’s trust in the organization and
supervisors, which will in turn positively affect the levels of organizational
commitment.
Relatively, there is still very limited research that supports the argument
that organizational characteristics such as the leadership style practised and the
HRM practices can affect the level of trust and organizational commitment within
organizations. Given this situation it is imperative that more research is done
around this area. The present study therefore aims to determine the relationship
between organizational factors such as human resource management practices

UUnniivveerrssiittyy ooff PPrreettoorriiaa eettdd –– LLaakkaa--MMaatthheebbuullaa,, MM RR ((22000044))
9
and leadership style with the level of trust and organizational commitment of
academics.
1.3 SIGNIFICANCE OF THE STUDY
Organizational commitment has been studied extensively among diverse
professional groups. The notion that commitment is important for the realization
of organizational and professional goals particularly in the educational institutions
has remained untapped by researchers. However, only a few studies have
addressed commitment in these institutions. These studies on organizational
commitment of educators have focused on teachers in schools and to a lesser
extent on educators in higher education institutions. The study of employee
commitment should be important to educational institutions receiving large
amounts of public funds and playing an important role in the development of the
skills and knowledge of employees of the future and the community as a whole.
The study of organizational commitment and trust will especially be
relevant to South African higher education institutions at this point in time as
several are faced with imminent mergers.
1.4 PURPOSE OF THE STUDY
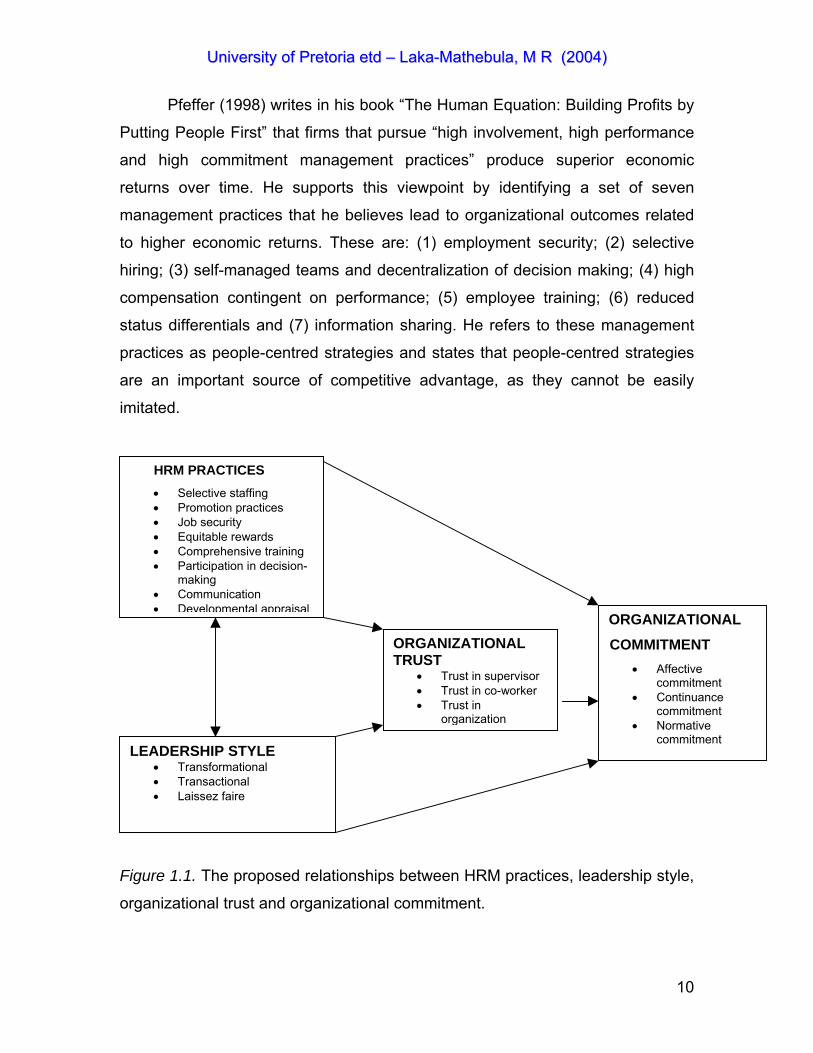
The purpose of this study is to determine the relationship between
selected human resource management practices, leadership style and the
organizational trust and organizational commitment of employees within higher
education institutions in South Africa. The proposed relationship of the variables
of interest is illustrated in Figure 1.1. on page 10. The results of the study would
help managers of academic institutions to determine the types of HRM practices
and leadership styles to adopt in order to induce and maintain trust and
organizational commitment from their employees.
UUnniivveerrssiittyy ooff PPrreettoorriiaa eettdd –– LLaakkaa--MMaatthheebbuullaa,, MM RR ((22000044))
10
Pfeffer (1998) writes in his book “The Human Equation: Building Profits by
Putting People First” that firms that pursue “high involvement, high performance
and high commitment management practices” produce superior economic
returns over time. He supports this viewpoint by identifying a set of seven
management practices that he believes lead to organizational outcomes related
to higher economic returns. These are: (1) employment security; (2) selective
hiring; (3) self-managed teams and decentralization of decision making; (4) high
compensation contingent on performance; (5) employee training; (6) reduced
status differentials and (7) information sharing. He refers to these management
practices as people-centred strategies and states that people-centred strategies
are an important source of competitive advantage, as they cannot be easily
imitated.
turnover.
Figure 1.1. The proposed relationships between HRM practices, leadership style,
organizational trust and organizational commitment.
HRM PRACTICES • Selective staffing • Promotion practices • Job security • Equitable rewards • Comprehensive training • Participation in decision-
making • Communication • Developmental appraisal
ORGANIZATIONAL COMMITMENT
• Affective commitment
• Continuance commitment
• Normative commitment
ORGANIZATIONAL TRUST
• Trust in supervisor • Trust in co-worker • Trust in
organization
LEADERSHIP STYLE • Transformational • Transactional • Laissez faire

UUnniivveerrssiittyy ooff PPrreettoorriiaa eettdd –– LLaakkaa--MMaatthheebbuullaa,, MM RR ((22000044))
11
1.5 DESCRIPTIONS OF CONCEPTS USED IN THE STUDY
1.5.1. Organizational commitment
Organizational researchers agree that a consensus has not yet been
reached over the definition of organizational commitment (Scholl, 1981;
Benkhoff, 1997a; Mowday, 1998; Suliman & Isles, 2000a, 2000b; Zangaro,
2001). Scholl (1981) indicates that the way organizational commitment is defined
depends on the approach to commitment that one is adhering to. Accordingly,
organizational commitment is defined either as an employee attitude or as a
force that binds an employee to an organization. According to Suliman and Isles
(2000a), there are currently four main approaches to conceptualising and
exploring organizational commitment. There is the attitudinal approach, the
behavioural approach, the normative approach and the multidimensional
approach.
The attitudinal approach views commitment largely as an employee
attitude or more specifically as a set of behavioural intentions. The most widely
accepted attitudinal conceptualisation of organizational commitment is that by
Porter and his colleagues who define organizational commitment as the relative
strength of an individuals’ identification with, and involvement in a particular
organization (Mowday et al., 1979). They mention three characteristics of
organizational commitment: (1) a strong belief in and acceptance of the
organization’s goals and values, (2) a willingness to exert a considerable effort
on behalf of the organization and (3) a strong intent or desire to remain with the
organization. Within this approach, the factors associated with commitment
include positive work experiences; personal characteristics and job
characteristics while the outcomes include increased performance, reduced
absenteeism and reduced employee turnover.
UUnniivveerrssiittyy ooff PPrreettoorriiaa eettdd –– LLaakkaa--MMaatthheebbuullaa,, MM RR ((22000044))
12
The second approach refers to organizational commitment as behaviour
(Suliman & Isles, 2000b; Zangaro, 2001). The focus of research according to the
behavioural approach is on the overt manifestations of commitment. The
behavioural approach emphasizes the view that an employee continues his/her
employment with an organization because investments such as time spent in the
organization, friendships formed within the organization and pension benefits, tie
the employee to the organization. Thus an employee becomes committed to an
organization because of “sunk costs” that are too costly to loose. Becker’s (1960)
side bet theory forms the foundation of this approach. According to him,
employee commitment is continued association with an organization that occurs
because of an employee’s decision after evaluating the costs of leaving the
organization. He emphasizes that this commitment only happens once the
employee has recognized the cost associated with discontinuing his association
with the organization.
In a similar vein, Kanter (1968) defined organizational commitment as
“profit” associated with continued participation and a “cost” associated with
leaving. That is, an employee stands to either profit or lose depending on
whether he/she chooses to remain with the organization. Whereas the attitudinal
approach uses the concept of commitment to explain performance and
membership, the behavioural school uses the concept of “investments” as “ a
force that ties employees to organizations”, to explain organizational commitment
(Scholl, 1981).
The normative approach is the third approach, which argues that
congruency between employee goals and values and organizational aims make
the employee feel obligated to his/her organization (Becker, Randall, & Reigel
1995). From this point of view, organizational commitment has been defined as
“the totality of internalised normative pressures to act in a way which meets
organizational goals and interests” (Weiner, 1982).
The last approach, the multi-dimensional approach, is relatively new. It
assumes that organizational commitment is more complex than emotional
attachment, perceived costs or moral obligation. This approach suggests that

UUnniivveerrssiittyy ooff PPrreettoorriiaa eettdd –– LLaakkaa--MMaatthheebbuullaa,, MM RR ((22000044))
13
organizational commitment develops because of the interaction of all these three
components. Several studies, according to Suliman and Isles (2000b) have
contributed to this new conceptualisation of organizational commitment. They
credit Kelman (1958) as the earliest contributor to the multidimensional
approach. Kelman lay down the foundation for the multidimensional approach
when he linked compliance, identification and internalisation to attitudinal
change. Another earlier contributor is Etzioni (1961) who, as cited by Zangaro
(2001), describe organizational commitment in terms of three dimensions; moral
involvement, calculative involvement and alienative involvement, with each of
these dimensions representing an individual’s response to organizational powers.
Moral involvement is defined as a positive orientation based on an employee’s
internalisation and identification with organizational goals. Calculative
involvement is defined as either a negative or a positive orientation of low
intensity that develops due to an employee receiving inducements from the
organization that match his/her contributions. Alienative involvement on the other
hand is described as a negative attachment to the organization. In this situation,
individuals perceive a lack of control or of the ability to change their environment
and therefore remain in the organization only because they feel they have no
other options. Etzioni’s three dimensions incorporate the attitudinal, behavioural
and normative aspects of organizational commitment.
O’Reilly and Chatman (1986) also support the notion that organizational
commitment should be seen as a multidimensional construct. They developed
their multidimensional approach based on the assumption that commitment
represents an attitude toward the organization, and the fact that various
mechanisms can lead to attitudes development of attitudes. Taking Kelman’s
(1958) work as their basis, they argue that commitment could take three distinct
forms that they called compliance, identification, and internalisation. They
believed that compliance would occur when attitudes and corresponding
behaviours are adopted in order to gain specific rewards. Identification would
occur when an individual accepts influence to establish or maintain a satisfying

UUnniivveerrssiittyy ooff PPrreettoorriiaa eettdd –– LLaakkaa--MMaatthheebbuullaa,, MM RR ((22000044))
14
relationship. Lastly, internalisation would occur when the attitudes and
behaviours that one is encouraged to adopt are congruent with one’s own values.
The most popular multi-dimensional approach to organizational
commitment is that of Meyer and his colleagues. In 1984, Meyer and Allen,
based on Becker’s side-bet theory, introduced the dimension of continuance
commitment to the already existing dimension of affective commitment. As a
result, organizational commitment was regarded as a bi-dimensional concept that
included an attitudinal aspect as well as a behavioural aspect. In 1990, Allen and
Meyer added a third component, normative commitment to their two dimensions
of organizational commitment. They proposed that commitment as a
psychological attachment may take the following three forms: the affective,
continuance and normative forms.
Meyer and Allen (1984) defined affective commitment as “an employee's
emotional attachment to, identification with, and involvement in the organization”,
continuance commitment as “commitment based on the costs that employees
associate with leaving the organization”, and normative commitment as “an
employee's feelings of obligation to remain with the organization”. Each of these
three dimensions represents a possible description of an individual’s attachment
to an organization.
Inverson and Buttibieg (1999) examined the multidimensionality of
organizational commitment. Based on a sample of 505 Australian male fire-
fighters, they found that four dimensions that are affective, normative, low
perceived alternatives, and high personal sacrifice, best represent organizational
commitment.
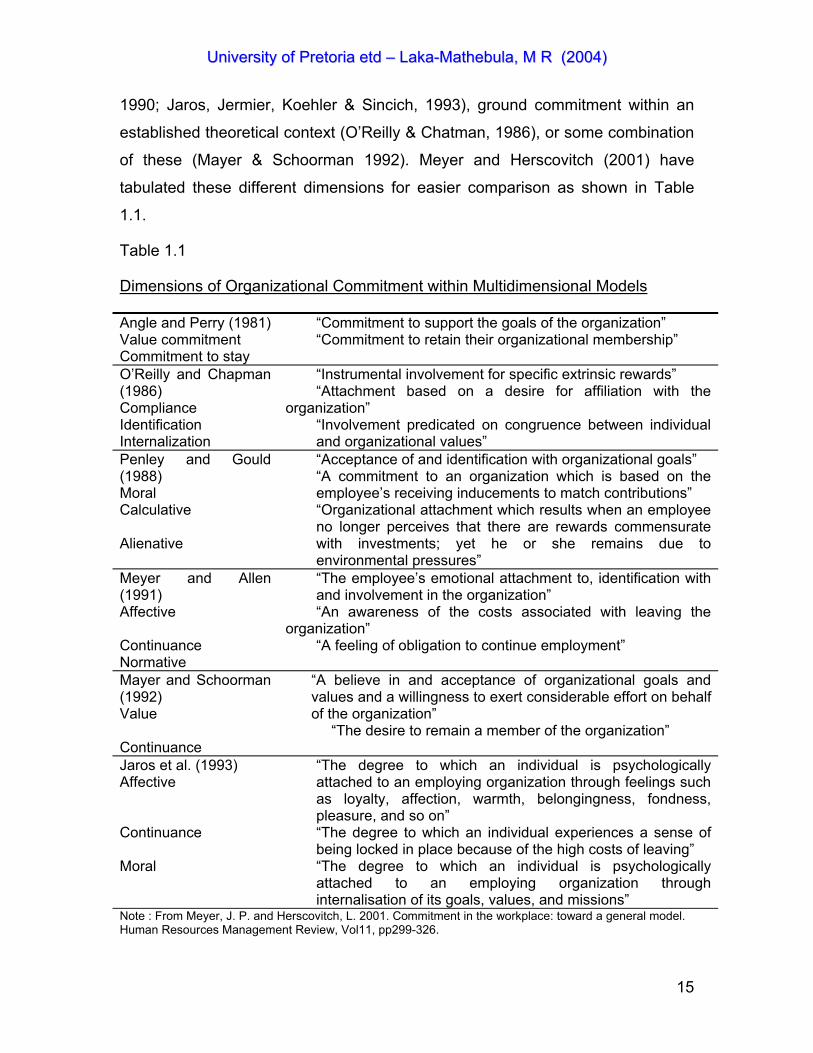
Meyer and Herscovitch (2001) have pointed out that there are differences
in the dimensions, forms or components of commitment that have been
described in the different multidimensional conceptualisations of organizational
commitment. They attribute these differences to the different motives and
strategies involved in the development of these multidimensional frameworks.
These included attempts to account for empirical findings (Angle & Perry, 1981),
distinguish among earlier one-dimensional conceptualisations (Allen & Meyer,
UUnniivveerrssiittyy ooff PPrreettoorriiaa eettdd –– LLaakkaa--MMaatthheebbuullaa,, MM RR ((22000044))
15
1990; Jaros, Jermier, Koehler & Sincich, 1993), ground commitment within an
established theoretical context (O’Reilly & Chatman, 1986), or some combination
of these (Mayer & Schoorman 1992). Meyer and Herscovitch (2001) have
tabulated these different dimensions for easier comparison as shown in Table
1.1.
Table 1.1
Dimensions of Organizational Commitment within Multidimensional Models
Angle and Perry (1981) Value commitment Commitment to stay
“Commitment to support the goals of the organization” “Commitment to retain their organizational membership”
O’Reilly and Chapman (1986) Compliance Identification Internalization
“Instrumental involvement for specific extrinsic rewards” “Attachment based on a desire for affiliation with the
organization” “Involvement predicated on congruence between individual and organizational values”
Penley and Gould (1988) Moral Calculative Alienative
“Acceptance of and identification with organizational goals” “A commitment to an organization which is based on the employee’s receiving inducements to match contributions” “Organizational attachment which results when an employee no longer perceives that there are rewards commensurate with investments; yet he or she remains due to environmental pressures”
Meyer and Allen (1991) Affective Continuance Normative
“The employee’s emotional attachment to, identification with and involvement in the organization” “An awareness of the costs associated with leaving the
organization” “A feeling of obligation to continue employment”
Mayer and Schoorman (1992) Value Continuance
“A believe in and acceptance of organizational goals and values and a willingness to exert considerable effort on behalf of the organization”
“The desire to remain a member of the organization”
Jaros et al. (1993) Affective Continuance Moral
“The degree to which an individual is psychologically attached to an employing organization through feelings such as loyalty, affection, warmth, belongingness, fondness, pleasure, and so on” “The degree to which an individual experiences a sense of being locked in place because of the high costs of leaving” “The degree to which an individual is psychologically attached to an employing organization through internalisation of its goals, values, and missions”
Note : From Meyer, J. P. and Herscovitch, L. 2001. Commitment in the workplace: toward a general model. Human Resources Management Review, Vol11, pp299-326.
UUnniivveerrssiittyy ooff PPrreettoorriiaa eettdd –– LLaakkaa--MMaatthheebbuullaa,, MM RR ((22000044))
16
The focus of the present study is on organizational commitment as a
multidimensional concept that represents the relationship between an employee
and his/her employer. The definition of organizational commitment that is
adopted is that of Allen and Meyer (1990) which looks at commitment as a three
dimensional concept which has an attitudinal aspect, a continuance aspect and a
normative aspect. This approach is relevant to the current research as like Angel
and Perry (1983), it is argued that different factors within the organization will
influence the development of different components of organizational
commitment. For example, it is hypothesized that specific HRM practices like
compensation HRM practices, may induce continuance commitment as the
employee might be reluctant to lose benefits while training HRM practices might
induce normative commitment. On the other hand, certain types of HRM may
induce both affective and continuance commitment of employees toward their
organizations. Other organizational factors that can possibly have an influence
on the development of organizational commitment include trust and leadership
behaviour.
In order to further explore the multidimensional nature of organizational
commitment, the present study will treat it as a dependent variable that can be
influenced by organizational factors such as HRM practices, leadership style and
trust levels. Our analysis will determine which type of organizational factors will
influence the development of which type of organizational commitment.
1.5.2. The concept of HRM
The concept of human resources management is comparatively new in
the management and organizational behaviour literature. Human resources
management only emerged as a planned and systematic approach to human
resources in the latter half of the 20th century (Ferris, Hochwarter, Buckley,
Harrel-Cook & Frink, 1999; Armstrong, 2000). It has emerged as an
interdisciplinary and integrated approach towards the development of human

UUnniivveerrssiittyy ooff PPrreettoorriiaa eettdd –– LLaakkaa--MMaatthheebbuullaa,, MM RR ((22000044))
17
resources. It focuses on developing the competency of the individual, throughout
his association with the organization, by improving his skills, attitudes and job
knowledge (Ferris et al., 1999).
The origin of HRM as a defined school of thought can be traced back to
the 1970s with the development of the human resource accounting theory
(Storey, 1995a). Earlier to this theory, human resources were considered a cost
to the organization. Their value was seen only in terms of their ability to render
services that would lead to financial gain by the organization. Human resources
accounting revolutionized this thinking and brought about the idea that people
represented assets of any organization. Human resources management,
according to this approach, is defined as a process of identifying, measuring, and
communicating information about human resources to decision makers,
specifically about their cost and value of these assets.
Storey (1989) asserts that HRM models suggest that employees should
be regarded as valued assets and that there should be an emphasis on
commitment, adaptability and consideration of employees as a source of
competitive advantage. HRM is an integrated strategy and planned development
process for effective utilization of human resources for the achievement of
organizational goals. Practically, HRM is the development of abilities and the
attitude of the individuals, leading to personal growth and self-actualisation,
which enable the individual to contribute to organizational objectives. HRM
believes that human potential is limitless and it is the duty of the organization to
help the individual to identify his/her strengths and make full use of them. The
concept of HRM aims at understanding the needs and hopes of people in a
better way.
The concept of HRM as a more effective approach to managing the
organization’s key asset, its people, has attracted enormous attention and
stimulated significant debate among academics and practitioners (Storey, 1992;
Luthans, 1998; McGunnigle & Jameson, 2000). Much of the debate has been
around the meaning of HRM. There is yet no universally accepted definition of
UUnniivveerrssiittyy ooff PPrreettoorriiaa eettdd –– LLaakkaa--MMaatthheebbuullaa,, MM RR ((22000044))
18
HRM. The literature (Guest, 1989; Storey, 1992, 1995a, 1995b) suggests a range
of definitions. Some of these interchange HRM with personnel management or
industrial relations. Others regard HRM as a distinct approach aimed at
integrating the management of people into overall business strategy and
organizational goals (Storey1995b).
Personnel management characteristically focused on a range of activities
centred on the supply and development of labour to meet the immediate and
short-term needs of the organization (Legge, 1995). Under personnel
management, the activities of recruitment, selection, rewards development and
others, are viewed as separate individual functions. HRM aims to integrate all of
the personnel function into a cohesive strategy. Personnel management was
largely something that managers did to subordinates, whereas HRM takes the
entire organization as a focal point for analysis and stresses development at all
levels (Legge, 1995).
Storey (1992) proposed three “models” of HRM referred to as a normative,
which prescribes the ideal approach, a descriptive model that focuses on
identifying development and practices in the field and a conceptual approach that
seeks to develop a model of classification. At the normative level, differences
between HRM, personnel management, employee relations and industrial
relations are described.
A comparison of HRM and Personnel management as developed by
Storey (1995a) is shown in Table 1.2 on pages 19. From this comparison, it can
be seen that personnel management is seen as a control activity that focuses on
an administrative processes without any focus on the developmental needs of
the individual employee. HRM on the other hand, is seen as an approach that
aims to involve managers in the development of their employees and the
organization. It is also suggested that HRM is engaged in an identifiable set of
functions or practices that are administered on an organization-wide basis for
enhancing the effectiveness of employees. The term practice is used according
to Baruch (1997)’s definition that practices are all kinds of techniques, activities,
methods and programs conducted by the HRM department and line managers.

UUnniivveerrssiittyy ooff PPrreettoorriiaa eettdd –– LLaakkaa--MMaatthheebbuullaa,, MM RR ((22000044))
19
HRM practices therefore can serve as an indication of the way in which the
organization takes care of its people.
Table 1.2
A Comparison of Personnel Management and HRM
Dimension Personnel and IR HRM Beliefs and assumptions 1. Contract Careful delineation of
written contracts Aim to go “beyond contract”
2. Rules Importance of devising clear rules/mutuality
“Can-do” outlook, impatience with “rules”
3. Guide to management action
Procedures “Business need”
4. Behaviour referent Norms/custom and practice
Values/mission
5. Managerial task vis-à-vis labour
Monitoring Nurturing
6. Nature of relations Pluralist Unitarist 7. Conflict Institutionalized De-emphasized Strategic aspects 8. Key relations Labour management Customer 9. Initiatives Piecemeal Integrated 10. Corporate plan Marginal to Central to 11. Speed of decision Slow Fast Line management
12. Management role Transactional Transformational leadership 13. Key managers Personnel/IR specialists General/business/line managers 14. Communication Indirect Direct 15. Standardization High (e.g. “parity” seen as
an issue) Low (e.g. “parity not seen as relevant)
16. Prized management skill
Negotiation Facilitation
Key levers
17. Selection Separate, marginal task Integrated, key task 18. Pay Job evaluation (fixed
grades) Performance-related
19. Conditions Separately negotiated Harmonization 20. Labour management Collective bargaining
contracts Towards individual contracts
21. Thrust of relations with stewards
Regularized through facilities and training
Marginalized (with exception of some bargaining for change models)
Note: From “ Is HRM Catching on?” by Storey, J. 1995. International Journal of Manpower, Vol.
16, No. 4, pp3-12.

UUnniivveerrssiittyy ooff PPrreettoorriiaa eettdd –– LLaakkaa--MMaatthheebbuullaa,, MM RR ((22000044))
20
HRM therefore can be defined as a strategic approach to acquiring,
developing, managing, motivating and gaining the commitment of an
organization’s key resources, its employees (Ahmed, 1999). As a result, HRM
encompasses a variety of functions designed to manage, support and develop
employees working in organizations. In this study, HRM will be viewed as Storey
(1995a) defined it. It will be seen as an approach to people management that
regards employees as valuable assets and influences an organization to practice
specific approaches to acquiring, developing, managing, motivating and gaining
commitment from the organization’s employees.
1.5.3. The concept of leadership behaviour
There are many definitions of the concept of leadership as there are
authors on the subject (Nirenberg, 2001). Some of these authors have defined
leadership as a position, a person, a behavioural act, a style, a relationship or a
process. Examples of those who define leadership in terms of a person include
Hosking (1988), who describes leaders as those who consistently make effective
contributions to the social order. Conger (1999), also describes leadership in
terms of a person. He says leaders are individuals who establish direction for a
working group of individuals. According to Conger, leaders also have the
responsibility to motivate the group members and to gain the group’s
commitment to the direction they have set.
Other authors regard leadership as the behaviour of an individual when he
is directing the activities of a group toward a shared goal. Rowden (2000) is one
of those authors who define leadership as the behaviour of an individual when
that person is directing and coordinating the activities of a group toward the
accomplishment of a shared goal. Those who define leadership as an act
include, Benis and Goldsmith (1994) who define leadership as what leaders do
such as acting with integrity and competence, interpreting reality, explaining the
present and painting a picture of the future.
UUnniivveerrssiittyy ooff PPrreettoorriiaa eettdd –– LLaakkaa--MMaatthheebbuullaa,, MM RR ((22000044))
21
Several authors define leadership as a process whereby an individual
influences a group of individuals to achieve a common goal. Gardner (1990)
defines leadership as the process of influencing the activities of an individual or a
group in efforts toward goal achievement in a given situation. Leadership is a
process of giving purpose to collective effort, and causing others to willingly exert
effort in order to achieve a specific purpose (Jacobs & Jacques, 1990). Jacques
and Clement (1994) also define leadership as process. They regard leadership
as a process in which one person sets the purpose or direction for others and
gets them to move along together with him/her in that direction with competence
and commitment.
Nirenberg (2001) defines leadership as a social function necessary for the
achievement of collective objectives. Leadership is therefore not just a position in
a hierarchy or a chain of command, but involves the actions of the leader. This
approach to leadership sees leadership as a process of mutual interaction
between leader and follower. The process of leadership may be thought of as
consisting of a number of different functions such as inspiring subordinates,
forming and reaching collective goals, and preserving group cohesion. Each of
these functions can be accomplished by many different leadership behaviours.
Bass has been in the forefront of approaching leadership in terms of
styles. Bass (1990) has described three well-known styles of leadership: laissez-
faire, transactional, and transformational leadership. Laissez-faire leaders
abdicate their responsibility leaving their subordinates to work relatively on their
own and avoid making decisions (Bass, 1990). Transactional leaders identify and
clarify job tasks for their subordinates and communicate how successful
execution of those tasks will lead to receipt of desirable job rewards (Bass,
1990). Transactional managers determine and define goals for their
subordinates, and suggest how to execute tasks. They also provide feedback on
completed tasks. Research has shown that transactional leadership could have a
favourable influence on attitudinal and behavioural responses of employees.
Transformational leaders adopt a long-term perspective (Bass, 1990). Rather
than focusing solely on current needs of their employees or themselves, they
UUnniivveerrssiittyy ooff PPrreettoorriiaa eettdd –– LLaakkaa--MMaatthheebbuullaa,, MM RR ((22000044))
22
also focus on future needs. They also concern themselves with long-term issues
instead of being concerned only with short-term problems and opportunities
facing the organization. In addition, transformational leaders tend to have a
holistic perspective of intra- and extra-organizational factors.
From the above definitions of leadership, it is clear that leadership can be
viewed in terms of multiple perspectives, and that it can be represented as
existing as an act, behaviour or process. It is also clear that each of these
perspectives alone does not give a full explanation of what leadership is.
Leadership is complex and encompasses all these aspects at varying degrees
depending on the situation. In this study, we will take an integrative approach to
leadership. This study will focus on leadership as both an individual and group-
directed measure of leader behaviour and style and use measures that question
the subordinates about the leader’s behaviour toward an individual subordinate
or toward an entire group of subordinates.
1.5.4. The concept of Trust
Within organizational behaviour, trust has been described as a complex
concept that is thought to be central to the interpersonal relationships that are
characteristic of organizations (Tschannen-Moran & Hoy, 1998). As a result, it
has received a great deal of attention by organizational researchers who defined
it from different perspectives. Some of these definitions are summarized in Table
1.3. Sitkin and Roth (1993) suggest that the definitions of trust could be divided
into four basic categories: trust as an individual attribute, trust as behaviour, trust
as a situational feature, and trust as an institutional arrangement. Hosmer (1995),
on the other hand, suggests that individual expectations, interpersonal relations,
economic exchanges, social structures and ethical principles represent major
approaches to trust.

UUnniivveerrssiittyy ooff PPrreettoorriiaa eettdd –– LLaakkaa--MMaatthheebbuullaa,, MM RR ((22000044))
23
Table 1. 3
A Summary of Some of the Definitions of Trust in the Organizational Context
Author Definition of trust
Rotter, 1967 “An expectancy held by an individual or group that the word,
promise, verbal or written statement of another individual or group
could be relied upon”
Zand, 1972 “The willingness of one person to increase his/her vulnerability to the
actions of another person.”
Cook and Wall, 1980 “The extent to which one is willing to ascribe good intentions to and
have confidence in the words and actions of other people”.
Hosmer, 1995 “Optimistic expectations of the outcome of an uncertain event under
conditions of personal vunerability.
Hunt and Morgan (1994) “Trust exists when one party has confidence in an exchange
partner’s reliability and integrity”
Mohr and Spekman
1994
“The belief that a party’s word is reliable and that a party will fulfill its
obligation in an exchange.
Mayer et al. 1995 “Trust is the willingness of a party to be vulnerable to the actions of
another party based on the expectation that the other will perform a
particular action important to the trustor, irrespective of the ability to
monitor or control that other party.”
Rousseau et al. 1998 “Trust is a psychological state comprising the intention to accept
vulnerability based upon positive expectations of the intentions or
behaviour of another.”
Gilbert and Li-ping Tang,
1998
“Organizational trust is a feeling of confidence and support in an
employer… organizational trust refers to employee faith in corporate
goal attachment and organizational leaders and to the belief that
ultimately, organizational action will prove beneficial for employees.”
Tschannen-Moran, and
Hoy, 1998
“It is an individuals or a group’s willingness to be vulnerable to
another party based on the confidence that the latter party is
benevolent, reliable, competent, honest and open.”

UUnniivveerrssiittyy ooff PPrreettoorriiaa eettdd –– LLaakkaa--MMaatthheebbuullaa,, MM RR ((22000044))
24
According to Tschannen-Moran and Hoy (1998), the empirical study of
trust began in the late 1950s when Deutsch (1958) studied trust using mixed-
motive games in laboratory experiments with participants who were strangers to
one another. He defined trust in behavioural terms, referring to trust as an
expectation of possible positive benefits. When a player made a move that would
benefit both players even where there was a risk of greater potential loss if an
opponent exploited one’s co-operative behaviour, then the player was said to
exhibit trust. Thus, according to Deutsch (1958), trust consisted of actions that
increased one’s vulnerability to another whose behaviour was not under one’s
control in a situation in which one would suffer if the other abused that
vulnerability.
Rotter (1967) defined trust in the context of communication, describing it
as “an expectancy that the word, verbal promise or written statement of another
individual can be relied on.” He goes on to say that the trustor should have faith
or confidence in the intentions or actions of another person. Rotter further
emphasizes that the whole exchange relationship relies on the expectation that
all concerned will act ethically with no intentions to cause harm to the other
partners.
Mayer, Davis and Schoorman (1995) define trust as the “willingness of a
party to be vulnerable to the actions of another party based on the expectation
that the other party will perform a particular action important to the trustor,
irrespective of the ability to monitor or control that other party”. In a similar vein,
Hoy and Tschannen-Moran (1999) define trust as an “individual’s or group’s
willingness to be vulnerable to another party based on the confidence that the
latter party is benevolent, reliable, competent, honest and open.”
Although different authors have used different words or constructs to
define trust, Rousseau, Sitkin, Burt, and Camerer (1998) have noted several
similarities within these definitions. They argue that these definitions reflect three
important facets of trust. First, trust in another party reflects an expectation or
belief that the other party will act benevolently. Second, one cannot control or
force the other party to fulfil this expectation, thus, trust involves a willingness to

UUnniivveerrssiittyy ooff PPrreettoorriiaa eettdd –– LLaakkaa--MMaatthheebbuullaa,, MM RR ((22000044))
25
be vulnerable and risk that the other party may not fulfil that expectation. Third,
trust involves some level of dependency on the other party so that the outcomes
of one individual are influenced by the actions of another. These three aspects,
that is, expectations or beliefs, a willingness to be vulnerable, and dependency
on another are the major dimensions of trust within organizations. These aspects
are highlighted in Table 1.3 on page 23, which summarizes some of the
definitions of trust available in the literature.
Hupcey, Penrod, Morse and Mitcham (2001) performed a concept
analysis of trust that led to the realization that trust has several important aspects
which include (1) depending on another individual to have a need met; (2) choice
or willingness to take some risk; (3) an expectation that the trusted individual will
behave in a certain way; (4) limited focus on the area or behaviour related to the
need and (5) testing of the trustworthiness of the individual.
In addition to the growing acceptance that trust is a multi-dimensional
concept, organizational researchers are starting to realize that just like
organizational commitment, trust has multiple bases and foci or referents.
McCauley and Kuhnet (1992) identified the notion that trust consists of lateral
and vertical elements. They refer to lateral trust in an organization as the trusting
relationship between the employee and co-workers while vertical trust, concerns
employee trust of his/her immediate supervisor, subordinates and top
management.
In this study, Hoy and Tschannen-Moran (1999)’s multidimensional
approach to trust will be adopted. This definition is adopted because it is one of
the most frequently used definitions of trust and because it captures the key
elements of the constructs that are included in the instrument that will be used to
measure trust and it has already been applied to the study of organizational trust
in schools. Recognizing McCauley and Kurtner (1992)’s conceptualisation of trust
as having multiple foci and applying this to the academic institution environment,
trust will be approached in this study as the attitude held by the referent
employee towards co- workers, supervisor/s and management. This attitude is
derived from the employee’s perceptions, beliefs and attributions about the

UUnniivveerrssiittyy ooff PPrreettoorriiaa eettdd –– LLaakkaa--MMaatthheebbuullaa,, MM RR ((22000044))
26
trustees based upon his/her observations about the trustee’s behaviour
(Whitener, Brodt, Korsgaard & Werner, 1998). Trust of co-workers has become
important in today’s organizations, which are more reliant on groups or work
teams. Work teams are made of groups of individuals with complementary skills
who are equally committed to a common purpose and goal (Dirks, 1999). Dirks
(1999, 2000) argue that trust seem to have an influence on team dynamics and
performance. He suggests that trust should be understood as a construct that
influences team performance indirectly by channelling the group member’s
energy towards reaching goals. Therefore, trust among the individual members
of the team is essential for the team to work effectively.
In this study, we are concerned with the trust of academics and non-
academics as expressed towards their leaders (Managers, Deans, etc.) and
towards fellow employees, and the institution. As a result, the three aspects of
trust, that is, trust in the supervisor, trust in colleagues and trust in the
organization will be measured. Trust in the supervisor will refer to the confidence
the academics and non-academic staff members have in their
manager/supervisor (Managers, Deans, Directors, etc.) to keep their word and
act in their best interest. Trust in co-workers will refer to the confidence that the
academics and non-academics can depend on each other in difficult situations
and that they can rely on the integrity of their colleagues. Trust in the
organization will reflect the employee’s faith in corporate goal attainment and
organizational leaders, and the belief that ultimately, organizational actions will
prove beneficial for the employee. It is therefore assumed that the academics
and non-academics included in this study believe that they can rely on and
believe that the organizational structures and systems, such as HRM policies,
that are in place can enable them to anticipate a successful future.

UUnniivveerrssiittyy ooff PPrreettoorriiaa eettdd –– LLaakkaa--MMaatthheebbuullaa,, MM RR ((22000044))
27
1.6 SUMMARY
In this chapter, the researcher presented background information on the
dependent variable, organizational commitment, and on the independent
variables that are assumed to have an influence on the development of
organizational commitment. The independent variables are HRM practices, trust
and leadership behaviour. From the literature, it is shown that organizational
commitment is a multidimensional construct with each of the constructs having
multiple factors associated with its development. This study aims to determine
how the different dimensions of the leadership and trust as well as different HRM
practices relate to the different aspects of organizational commitment.

UUnniivveerrssiittyy ooff PPrreettoorriiaa eettdd –– LLaakkaa--MMaatthheebbuullaa,, MM RR ((22000044))
28
CHAPTER TWO: LITERATURE REVIEW
2.1 INTRODUCTION
Many authors associate the development of organizational commitment
with variables such as the personal characteristics of the employee,
organizational characteristics and work characteristics (Mowday et al., 1979;
Nijhof et al., 1992). The influence of personal characteristics on organizational
commitment has been extensively studied with the focus on demographic
variables such as age, gender, tenure and educational level and dispositional
attributes (Nijhof et al., 1992). The organizational characteristics that have been
studied include leadership or management style, organizational culture and trust.
In our attempt to understand organizational commitment, we need to understand
how these various variables fit together and lead to the development of
organizational commitment.
2.2 ORGANIZATIONAL COMMITMENT
Organizational commitment researchers can be divided into two major
camps, those who view organizational commitment as an attitude and those who
view it as behaviour (Meyer & Allen 1991; Jaros et al., 1993). Meyer and Allen
(1991) regard attitudinal commitment as the way people feel and think about their
organizations, while behavioural commitment reflects the way individuals have
become locked into the organizations. The attitudinal approach regards
commitment as an employee attitude that reflects the nature and quality of the
linkage between an employee and an organization (Meyer & Allen, 1991).
UUnniivveerrssiittyy ooff PPrreettoorriiaa eettdd –– LLaakkaa--MMaatthheebbuullaa,, MM RR ((22000044))
29
2.2.1. Dimensions of Organizational Commitment
Among the proponents of the attitudinal approach, researchers have
started to view organizational commitment as a multi-dimensional concept that
has different factors associated with it, outcomes, and implications for human
resources management (Meyer & Allen, 1997). Meyer and his colleagues (Allen
& Meyer, 1990; Meyer & Allen, 1991; Meyer & Allen, 1997; Meyer & Herscovitch,
2001) have been at the forefront of the multidimensional approach. Their three-
component model of organizational commitment incorporates affective,
continuance and normative as the three dimensions of organizational
commitment.
2.2.1.1. Affective Commitment
Allen and Meyer (1990) refer to affective commitment as the employee’s
emotional attachment to, identification with, and involvement in the organization.
Defined this way, affective commitment involves three aspects: (1) the formation
of an emotional attachment to an organization, (2) identification with, (3) and the
desire to maintain organizational membership. Allen and Meyer (1990) argue that
an individual will develop emotional attachment to an organization when he/she
identifies with the goals of the organization and is willing to assist the
organization in achieving these goals. They further explain that identification with
an organization happens when the employee’s own values are congruent with
organizational values and the employee is able to internalise the values and
goals of the organization. With this, there is a psychological identification with
and a pride of association with the organization.
Jaros et al. (1993) suggest that affective commitment is the most widely
discussed form of psychological attachment to an employing organization. This
could probably be because affective commitment is associated with desirable
organizational outcomes. Meyer and Herscovitch (2001) report that affective
commitment has been found to correlate with a wide range of outcomes such as

UUnniivveerrssiittyy ooff PPrreettoorriiaa eettdd –– LLaakkaa--MMaatthheebbuullaa,, MM RR ((22000044))
30
turnover, absenteeism, job performance and organizational citizenship
behaviour.
2.2.1.2. Continuance Commitment
The second of Allen and Meyer’s (1990) dimensions of organizational
commitment is continuance commitment, which is based on Becker’s (1960) side
bet theory. The theory posits that as individuals remain in the employment of an
organization for longer periods, they accumulate investments, which become
costly to lose the longer an individual stays. These investments include time, job
effort, organization specific skills that might not be transferable or greater costs of
leaving the organization that discourage them from seeking alternative
employment, work friendships and political deals.
Allen and Meyer (1990) describe continuance commitment as a form of
psychological attachment to an employing organization that reflects the
employee’s perception of the loss he/she would suffer if they were to leave the
organization. They explain that continuance commitment involves awareness on
the employee’s part of the costs associated with leaving the organization. This
then forms the employee’s primary link to the organization and his/her decision to
remain with the organization is an effort to retain the benefits accrued.
Romzek (1990) describes this type of attachment as a transactional
attachment. He argues that employees calculate their investments in the
organization based on what they have put into the organization and what they
stand to gain if they remain with the organization. For example, an individual
might choose not to change employers because of the time and money tied up in
an organization’s retirement plan. Such an employee would feel that he/she
stands to lose too much if he/she were to leave the organization.
In addition to the fear of losing investments, individuals develop
continuance commitment because of a perceived lack of alternatives. Allen &
Meyer (1990) and Meyer & Allen (1991) argue that such an individual’s
commitment to the organization would be based on his/her perceptions of
UUnniivveerrssiittyy ooff PPrreettoorriiaa eettdd –– LLaakkaa--MMaatthheebbuullaa,, MM RR ((22000044))
31
employment options outside the organization. This occurs when an employee
starts to believe that his/her skills are not marketable or that he does not have
the skill required to compete for positions in the field. Such an employee would
feel tied to his current organization. People who work in environments where the
skills and training they get are very industry specific can possibly develop such
commitment. As a result, the employee feels compelled to commit to the
organization because of the monetary, social, psychological and other costs
associated with leaving the organization. Unlike affective commitment, which
involves emotional attachment, continuance commitment reflects a calculation of
the costs of leaving versus the benefits of staying.
2.2.1.3. Normative Commitment
The third dimension of organizational commitment is normative
commitment, which reflects a feeling of obligation to continue employment.
Employees with a high level of normative commitment feel they ought to remain
with the organization (Allen & Meyer, 1990). Researchers have overlooked this
view of organizational commitment, as relatively few studies explicitly address
normative commitment. Randall and Cote (1990) Allen and Meyer (1990) and
O’Reilly, Chatman and Caldwell (1991) are some of the few who have attempted
to differentiate normative commitment from the other components of
organizational commitment.
Randall and Cote (1990) regard normative commitment in terms of the
moral obligation the employee develops after the organization has invested in
him/her. They argue that when an employee starts to feel that the organization
has spent either too much time or money developing and training him/her, such
an employee might feel an obligation to stay with the organization. For example,
an employee whose organization paid his tuition while he/she was improving
qualifications might believe that he/she can reimburse the organization by
continuing to work for it. In general, normative commitment is most likely when
individuals find it difficult to reciprocate the organization's investment in them.
UUnniivveerrssiittyy ooff PPrreettoorriiaa eettdd –– LLaakkaa--MMaatthheebbuullaa,, MM RR ((22000044))
32
O’Reilly et al. (1991) on the other hand defined and measured normative
commitment in terms of values. They argue that congruence between an
individual’s and organization’s values leads to the development of organizational
commitment. In support of this viewpoint are Mayer and Schoorman (1992) who
describe value commitment as an employee’s acceptance of an organization’s
goals and values.
Jaros et al. (1993) agree with Allen and Meyer (1990) and refer to
normative commitment as moral commitment. They emphasize the difference
between this kind of commitment and affective commitment because normative
commitment reflects a sense of duty, or obligation or calling to work in the
organization and not emotional attachment. They describe it as the degree to
which an individual is psychologically attached to an employing organization
through internalisation of its goals values and missions. This type of commitment
differs from continuance commitment because it is not dependent on the
personal calculations of sunken costs.
The multidimensionality of organizational commitment reflects its highly
complex nature. The three aspects of organizational commitment as we have
seen, seem to have different foundations. As all those forces that are attributed
to be variables associated with the different forms of commitment co-exist in an
organization, it can be assumed that the three types of commitment can also co-
exist. It is important to realize that the three different dimensions of organizational
commitment are not mutually exclusive. An employee can develop one or any
combination or none of the three aspects of commitment. These aspects of
organizational commitments differ only on the bases of their underlying motives
and outcomes (Becker, 1992; Becker, Billings, Eveleth, & Gilbert, 1996). For
example an employee with affective commitment will stay with an organization
and be willing to exert more effort in organizational activities while an employee
with continuance commitment may remain with the organization and not be
willing to exert any more effort than is expected.

UUnniivveerrssiittyy ooff PPrreettoorriiaa eettdd –– LLaakkaa--MMaatthheebbuullaa,, MM RR ((22000044))
33
In order for us to understand these different dimensions of organizational
commitment better, it is important that we also understand how organizational
factors associated with it affect the development of commitment.
2.2.2. Variables associated with Organizational Commitment
Students of organizational behaviour researching organizational
commitment have tried to determine what it is about the organization and the
employee’s experiences that influence the development of the organizational
commitment once the individual has selected membership in an organization. As
a result, a lot of empirical research has focused on the variables associated with
organizational commitment. Mowday et al. (1979) have grouped the factors that
may lead to greater organizational commitment into three major groups.
According to them commitment depends on 1) personal factors, 2) organizational
factors, and 3) non-organizational factors. Each of these categories of factors
might contribute to the development of the different dimensions of organizational
commitment at varying degrees.
2.2.2.1. Variables associated with Affective Commitment.
Although multiples of variables have been hypothesized to be variables
associated with affective commitment, Meyer and Colleagues (Meyer & Allen,
1991; Meyer & Allen, 1997; Meyer & Herscovitch, 2001) suggest that these
variables can all be categorized into three major categories: personal
characteristics, organizational characteristics, and work experiences.
Personal characteristics. An analysis of the organizational commitment
literature reveals a long list of demographic factors that have been associated
with commitment. Variables associated with commitment that may be significant
for those employed in higher education institutions and business organizations in

UUnniivveerrssiittyy ooff PPrreettoorriiaa eettdd –– LLaakkaa--MMaatthheebbuullaa,, MM RR ((22000044))
34
general include personal characteristics such as age, tenure, gender, family
status, and educational level, need for achievement sense of competence and a
sense of professionalism (Thornhill, Lewis & Saunders 1996). Only those
personal characteristics of particular interest to this study will be reviewed further.
Age. Mathieu and Zajac’s (1990) meta-analytic study involving 41
samples and 10 335 subjects, has shown a statistically significant positive
correlation of .20 (p < .01) between age and affective organizational commitment.
Allen and Meyer (1993) also studied the relationship between age and affective
commitment. In a study of university librarians and hospital employees, they
obtained a statistically significant positive mean correlation of .36 (p < .05)
between age and affective commitment.
Age has been regarded as a positive predictor of commitment for a variety
of reasons. Kaldenberg, Becker, and Zvonkovic (1995) argue that as workers
age, alternative employment options generally decrease, making their current job
more attractive. They furthermore state that older individuals may have more
commitment to the organization because they have a stronger investment and
greater history with the organization than younger workers.
Other researchers have not been able to show a significant link between
age and organizational commitment. For example, Hawkins (1998) in a study of
the affective commitment levels of 396 high school principals found a statistically
non-significant correlation (r = -.004) between age and affective commitment.
Colbert and Ik-Whan (2000) in a study of 497 college and university internal
auditors failed to show any reliable relationship between age and organizational
commitment. Overall, age seem to have an inconsistent although moderate
correlation with affective commitment.
Gender. As far as gender is concerned, the reports are inconsistent.
Mathieu & Zajac, (1990) in a meta-analytic study of 14 studies with 7420 subjects
involving gender and organizational commitment obtained a mean correlation of -
.089 for organizational commitment and gender. Although they report a weak

UUnniivveerrssiittyy ooff PPrreettoorriiaa eettdd –– LLaakkaa--MMaatthheebbuullaa,, MM RR ((22000044))
35
relationship between gender and attitudinal commitment, they suggest that
gender may affect employee’s perceptions of their workplace and attitudes
towards the organization.
Kalderberg et al. (1995) found no significant differences in the work
attitudes and commitment of males and females. In addition, Hawkins (1998)
found no significant difference between the mean level of commitment for female
and male high school principals. Wahn (1998) on the other hand argues that
women can exhibit higher levels of continuance commitment than men can. She
cites reasons such as the fact that women face greater barriers than men when
seeking employment as possible explanations to the high continuance
commitment of women. She argues that having overcome these barriers women
would be more committed to continue the employment relationship.
Although the literature quoted here is not exhaustive on the subject of the
effect of gender on organizational commitment, it seems as if gender makes no
difference on organizational commitment levels. Ngo and Tsang (1998) support
the viewpoint that the effects of gender on commitment are very subtle.
Tenure. Mathieu and Zajac (1990) reviewed 38 samples that included
12290 subjects and found a positive link between organizational tenure and
affective commitment. They report an overall weighted mean correlation of r = .17
(p < .01). Kushman (1992) in his study of urban elementary and middle school
teachers also found a positive correlation (r = .17; p > .05) between the number
of years in teaching and organizational commitment. Meyer and Allen (1993)
indicated that an analysis of organizational tenure showed a mild curvilinear
relationship with organizational commitment. They showed that middle tenure
employees exhibited less measured commitment than new or senior employees
did. These findings are supported by Liou and Nyhan (1994), who found a
negative relationship between tenure and affective commitment (t = -3.482).
However, these two authors did not fined significant correlations between
continuance commitment and employee tenure.

UUnniivveerrssiittyy ooff PPrreettoorriiaa eettdd –– LLaakkaa--MMaatthheebbuullaa,, MM RR ((22000044))
36
In a study of Japanese industrial workers, Tao, Takagi, Ishida and Masuda
(1998) found that organizational tenure predicted internalisation (R2 = .262 p <
.05). Consistent with other researchers, Hawkins (1998) found a statistically
significant positive correlation of r = .25 between the organizational commitment
and tenure of 202 high school principals. Colbert and Kwon (2000) found a
significant relationship (r =. 11, p < .05) between tenure and organizational
commitment. They found that employees with a longer tenure had a higher
degree of organizational commitment than that of their counterparts.
Although there seem to be empirical evidence to positively link tenure and
organizational commitment, it is still not clear how this link operates (Meyer &
Allen, 1997). Meyer and Allen (1997) suggest that employees with long
organizational tenure may develop retrospective attachment to the organization.
These kinds of employees attribute their long service to emotional attachment in
an effort to justify to themselves why they have stayed that long. Meyer and Allen
(1997) also suggest that the results of a positive relationship between tenure and
affective commitment might be a simple reflection of the fact that uncommitted
employees leave an organization and only those with a high commitment remain.
Although the relationship between gender, age and tenure and
educational level and organizational commitment has been extensively studied,
the literature has yet to provided strong and consistent evidence to enable an
unequivocal interpretation of the relationship (Meyer & Allen, 1997). However,
Meyer and Allen (1997) caution that one cannot assume that growing older
makes one develop higher affective commitment. They argue that the positive
association might simply be because of differences in the particular generational
cohorts that were studied. On the other hand, older employees might have more
positive work experiences than younger employees might. Overall, empirical
evidence suggests that age and affective commitment are significantly related.
Organizational Characteristics. Meyer and Allen (1991) suggest that
affective commitment develops as the result of experiences that satisfy
employee’s need to feel physically and psychologically comfortable in the
UUnniivveerrssiittyy ooff PPrreettoorriiaa eettdd –– LLaakkaa--MMaatthheebbuullaa,, MM RR ((22000044))
37
organization. These experiences include those that lead to a perception of
support from the organization. Employees who perceive a high level of support
from the organization are more likely to feel an obligation to repay the
organization in terms of affective commitment (Meyer & Allen, 1991).
Organizational characteristics such as structure, culture and organizational level
policies, which can induce perceptions of organizational support, would probably
induce organizational commitment. The idea that organizational policies are
related to affective commitment has some support in the organizational
commitment literature (Meyer & Allen, 1997). For example, Greenberg, (1994)
reported that the manner in which employees perceive these policies and the
manner in which they are communicated are related to affective commitment.
The organizational policies assumed to affect the development of organizational
commitment will be discussed in detail in the section on human resources
management (HRM) practices later.
2.2.2.2. Variables associated with Continuance Commitment.
Continuance commitment refers to the employee's decision to continue
employment because it would be costly to leave the organization (Allen & Meyer,
1990). Continuance commitment can develop because of any action or event that
increases the costs of leaving the organization, provided the employee
recognizes that these costs have been incurred (Meyer & Allen, 1991). They
summarized these actions and events in terms of two sets of antecedent
variables: investments and employment alternatives.
Investments. In terms of organizational commitment, investments refer to
any actions that would result in considerable potential loss should the individual
decide to leave the organization (Allen & Meyer, 1990). Once an employee
realizes that moving to a new organization would result in the forfeiture of
benefits, the employee might decide to stay within the current organization rather

UUnniivveerrssiittyy ooff PPrreettoorriiaa eettdd –– LLaakkaa--MMaatthheebbuullaa,, MM RR ((22000044))
38
than lose the investments. Such an employee develops continuance commitment
as he/she stays with the organization as a calculated decision rather than an
eagerness to do so.
Investments can take any form and may be either work or non-work
related. Work related investments include such things as the time spent acquiring
non-transferable skills, the potential loss of benefits and giving up a senior
position and its associated rewards (Meyer & Allen, 1990). Non-work related
investments might include the disruption of personal relationships and the
expense and human cost of relocating a family to another city. Investments can
also take the form of time devoted to a particular career track or development of
work groups or even friendship networks (Romzek, 1990). Leaving the
organization could mean that the employee would stand to lose or would have
wasted time, money, or effort that was invested. These investments are assumed
to increase in number and magnitude over time. Thus, age and tenure are
associated with the accumulation of investments.
Romzek (1990) suggests that organizations can easily get employees to
feel that they have made big investments in the organization. He reckons that
organizations have only to offer opportunities and working conditions that are
competitive with other prospective employers. Typically, investment factors
include promotion prospects, development of work group network performance
bonuses and the accrual of vacation sick leave, family-friendly policies, and
retirement benefits. If these cannot be easily matched by prospective employers,
the organization’s employees might remain “stuck” in the organization even
though they are no longer effective.
Employment alternatives. The other hypothesized antecedent of
continuance commitment is the employment alternatives. Meyer and Allen (1997)
suggest that an employee’s perception of the availability of alternatives will be
negatively correlated with continuance commitment. They reckon that employees
who think they have viable alternatives will have weaker continuance
commitment than those who think their alternatives are limited.

UUnniivveerrssiittyy ooff PPrreettoorriiaa eettdd –– LLaakkaa--MMaatthheebbuullaa,, MM RR ((22000044))
39
As with investments, several events or actions can influence one's
perceptions of the availability of alternatives (Meyer & Allen 1997; Iverson &
Buttigieg, 1998). For example, one employee might base his/her perceptions of
available alternative jobs by scanning the external environment, looking at local
employment rates and the general economic climate. On the other hand, another
employee might base perceived alternatives on the degree to which his/her skills
seem current and marketable. Meyer and Allen (1997) also suggest that such
things as the results of previous job search attempts and whether other
organizations have tried to recruit the employee and the extent to which family
factors limit the employee's ability to relocate can also influence perceptions of
alternatives. For example, if the employee had applied for work and have not
been successful on several occasions, such an employee might begin to think
that he/she has no alternatives and would rather continue with the current
employer. On the other hand, an employee who has been approached by other
organizations might believe that he/she has ample alternatives and would not
feel tied to the current employer.
The availability of alternative employment does not influence continuance
commitment on its own (Iverson & Buttigieg, 1998). It may often work in
conjunction with the extent to which family factors permit or enable an
employee’s ability to relocate or take up a new job. For example, even though an
employee might have a better paying job offer and it turns out that there are no
schools for his/her children or his/her spouse would not be able to find
employment in the new town, the employee might choose to decline the offer and
remain with the current employer.
In addition to perceived alternatives, there are other potential variables
associated with continuance commitment. These factors accumulate over time.
Time-based variables such as age and tenure are also hypothesized as factors
associated with continuance commitment (Meyer & Allen, 1997). Studies using
these as variables have shown mixed results. For some employees, the
perceived cost associated with leaving an organization will increase as they get
older and increase their organizational tenure. For others, however, the costs of

UUnniivveerrssiittyy ooff PPrreettoorriiaa eettdd –– LLaakkaa--MMaatthheebbuullaa,, MM RR ((22000044))
40
leaving might actually decrease as experience and skills increase. For this
reason, Meyer and Allen (1997) recommend that age and tenure are best
thought of as substitute variables of accumulated investments and perceived
alternatives and not as direct predictors of continuance commitment. Associated
with time-based investments is the employee's perception about the
transferability of their skills and their education to other organizations will
determine their judgment of the availability of alternatives (Meyer and Allen,
1997). Those employees who think their educational or training investments are
less easily transferable elsewhere would tend to perceive lack of alternatives and
thus expressed stronger continuance commitment to their organization.
Meyer and Allen (1997) emphasize the fact that neither investments nor
alternatives will have an influence on continuance commitment unless or until the
employee is aware of them and the implications of losing them. Thus, the
employee's recognition that investments and/or lack of alternatives make leaving
more costly represents the process that develops continuance commitment.
According to Meyer and Allen (1997), the fact that recognition plays a central role
in this process raises two points. First, it means that people who are in
objectively similar situations can have different levels of continuance
commitment. Second, for some cost-related variables to influence continuance
commitment, a particular triggering event is required to focus the employee's
attention on these variables. The final point to make in that the specific set of
variables that influence an employee's continuance commitment might be
idiosyncratic to that person. It can include both work-related and non-work
related variables.
2.2.2.3. Variables associated with Normative Commitment
Compared to affective and continuance commitment, very few factors
have been described as variables associated with normative commitment.
According to Meyer & Allen (1990), normative commitment might develop based
on the psychological contract between an employee and the organization. A
UUnniivveerrssiittyy ooff PPrreettoorriiaa eettdd –– LLaakkaa--MMaatthheebbuullaa,, MM RR ((22000044))
41
psychological contract refers to the beliefs of the parties involved in an exchange
relationship regarding their reciprocal obligations. Although psychological
contracts can take different forms, Meyer and Allen (1990) suggest that the
transactional and relational might be closely related to continuance commitment.
They describe transactional contracts as more objective and based on principles
of economic exchange while relational contracts as more abstract and based on
principles of social exchange. Furthermore, they consider relational contracts
more relevant to normative commitment while transactional contracts might be
involved in the development of continuance commitment.
Meyer and Allen (1997) also refer to the possible role that early
socialization experiences might have in the development of normative
commitment. They suggest that socialization can carry with it all sorts of
messages about the appropriateness of particular attitudes and behaviours within
the organization. Amongst these attitudes could be the idea that employees owe
it to the organization to continue employment. Meyer and Allen (1997) assume
internalisation to be the process involved in the development of normative
commitment during the early days of assuming employment with an organization.
They reason that through a complex process involving both conditioning and
modelling of others, individuals can develop normative commitment.
It has also been suggested that normative commitment develops on the
basis of a particular kind of investment that the employees finds difficult to
reciprocate (Meyer & Allen, 1997). For example, if an organization sponsored
tuition payments on behalf of employees, the employee might feel uncomfortable
and indebted. Given the norms of reciprocity, the employee might develop
feelings of obligation to the organization as he/she tries to rectify the imbalance.
Cultural and individual differences exist in the extent to which people will
internalise reciprocity norms and therefore in the extent to which organizational
investments will lead to feelings of indebtedness.
UUnniivveerrssiittyy ooff PPrreettoorriiaa eettdd –– LLaakkaa--MMaatthheebbuullaa,, MM RR ((22000044))
42
2.2.3. Organizational Commitment within academic institutions
Several studies have investigated the organizational commitment of both
educators and administrators in academic institutions and both groups were
found to exhibit commitment to their organizations (Chiefo, 1991; Billingsley &
Cross, 1992; Celep, 1992; Richards, Arkyod, & O’Brein, 1993; Raju & Srivastava,
1994; Thornhill et al., 1996; Borchers and Teahen, 2001; Richards, O’Brein &
Arkyod, 2000; Wolverton, Montez, Guillory and Gmelch, 2001). Chieffo (1991)
found that mid-level administrators in higher education are fairly committed to
their organizations largely because they are proud of what they are doing and the
autonomy of their work. Her results also showed a significant correlation between
leadership behaviours (.60 to .70, p<. 0001) such as, vision, influence orientation,
people orientation, motivational orientation and values orientation, and
organizational commitment. She also positively linked factors such as
participation in decision-making meetings and the organizational structure with
higher levels of organizational commitment.
In a survey of 1147 general and special educators, Billingsley and Cross
(1992) determined the predictors of teacher’s commitment. Their cross-validated
regression results suggested that work-related variables such as leadership
support, role conflict, role ambiguity and stress are the best predictors of
commitment of educators. They concluded that increasing administrative support
and principals’ behaviours such as feedback, encouragement,
acknowledgement, use of participative decision-making and collaborative
problem solving are important in building a committed and satisfied teaching
staff.
Celep (1992) tried to determine the level of organizational commitment of
teachers with regard to the commitment to the school, to teaching work, to work
group and to the teaching profession. Teacher’s commitment to the school was
tested with such factors as exerting effort on behalf of the school, and having
proper pride in belonging to the school, among others. His results indicated a
direct relationship between the teacher’s organizational commitment and having
UUnniivveerrssiittyy ooff PPrreettoorriiaa eettdd –– LLaakkaa--MMaatthheebbuullaa,, MM RR ((22000044))
43
proper pride to belong to the school (t = 7.13, p < .01) and work group (t = 13.25,
p < .05).
In a study to explore the ability of extrinsic and intrinsic work related
rewards to predict the organizational commitment of health occupations
educators, Richards et al. (1993), found that two intrinsic and one extrinsic work
related rewards significantly predicted organizational commitment. Significance,
involvement and general working conditions, were significant at the .01 level with
standardized beta weights of .2411, .2135 and .1591, respectively. Similar results
were found by Richards et al. (2002) when they predicted the organizational
commitment of marketing education teachers. They found that six of the eight
work related rewards entered the stepwise Multiple Regression. The variables
that were significant at the .01 level were supervision (.2188), significance
(.2158), involvement (.2137), promotion (.1592), and co-workers (.1258).
Thornhill et al. (1996) have showed that communication with employees is
significantly related to the organizational commitment of higher education
institutions. They found that communication in terms of information flow down the
organization, information flow up the organization and leadership or management
style were important in the context of higher education. Of the employees, who
believed that management made a positive effort to keep staff well informed, 68
percent indicated that they felt part of the institution, 88 percent reported that it
was a good place to work and 85 percent reported that their organization had a
great future.
The interest in the commitment of educators has extended to the study of
organizational commitment of part-time faculty. In a study of 479 full time and
part-time academics at two Mid-Western universities, Borchers and Teahen
(2001) found that the level of organizational commitment does not vary
significantly between faculty members who are part-time on-ground, part-time on
line, full-time on-ground and full-time on line. These findings indicate that despite
employment status educators are equally committed to their organizations.
In a study of the factors related to the organizational commitment of
college and university auditors, Colbert and Kwon (2000), found that
UUnniivveerrssiittyy ooff PPrreettoorriiaa eettdd –– LLaakkaa--MMaatthheebbuullaa,, MM RR ((22000044))
44
organizational characteristics such as organizational dependability (R2 = 1.61, p <
.01), organizational support (R2 = 1.75, p < .01), and instrumental communication
(R2 = 2.09, p < .01), were significantly related to organizational commitment.
They also found a significant positive relationship between organizational
commitment and organizational tenure (R2 = 2.06, p < .05), and skill variety (R2 =
1.51, p < .01).
Wolverton et al. (2001) found that organizational commitment of deans
seemed to increase with age (t = 2.46, p < .05), number of years in the position (t
= 3.00, p < .05), and the level of overall job satisfaction (t = 2.69, p < .05). They
also found that if deans believed they worked for universities that exhibited high
academic quality (t = 2.88, p < .01) and good environmental quality (t = 4.19, p <
.01) they tended to be more committed to the organizations. In addition, the
found that deans who were inside hires also seemed more committed to their
universities than those who were brought in from outside.
From this analysis of studies of organizational commitment within
academic institutions, it can be seen that the development of commitment is
dependent on several organizational factors such as leadership and
organizational culture, policies and practices. We therefore now turn to the
exploration of the literature on the organizational factors that will form part of this
study.
The idea that organizational commitment is important for the realization of
organizational goals and professional goals in educational institutions has
remained untapped by researchers. Organizational commitment research can
possibly provide practical results for academic institutions by providing insight
into the commitment profiles of their professional employees. From the
employing organizations' standpoint, it is useful to identify which factors motivate
academics’ desire to remain with the organization.
UUnniivveerrssiittyy ooff PPrreettoorriiaa eettdd –– LLaakkaa--MMaatthheebbuullaa,, MM RR ((22000044))
45
2.3 HUMAN RESOURCES MANAGEMENT PRACTICES
2.3.1. Introduction
The influence of human resources management practices on organizational
outcomes such as organizational commitment has become an important topic of
research in the 1990s. HRM involves the development of an individual’s abilities
and attitudes in such away that the individual is able to grow personally and
contribute towards organizational interests (Guest, 1987, 1989; Storey, 1989,
1992, 1995a, 1995b; Kinicki, Carson & Bohlander, 1992). It attaches importance
to the motivational aspect of organizational practices in the development and
best utilization of human potential. Therefore, HRM is an integrated strategy and
planned development process for effective utilization of human resources for the
achievement of organizational objectives.
Arthur (1992) showed through Multiple Regression analysis that human
resources systems were significantly associated with variation in steel mini-mills’
performance. Tepstra (1994) found that large US companies that used specific
HRM practices had significantly higher annual profit than those companies that
did not use them. Authors like Pfeffer (1994) have described HRM as a means of
achieving competitive advantage. Pefffer (1994) identifies the following types of
HRM practices as the ones that seem to characterize organizations that are
effective in achieving competitive advantage through their people: (1)
employment security, (2) information sharing, (3) participation and
empowerment, and (4) incentive pay.
Tsui et al. (1997) report an association between organizational
investments in employees and levels of affective employee commitment as well
as levels of organizational citizenship behaviour, greater intention to stay with the
organization and fewer unexcused absences. These papers suggest that
adopting an integrated set of human resource management practices focusing on
commitment, can produce high levels of employee affective commitment and
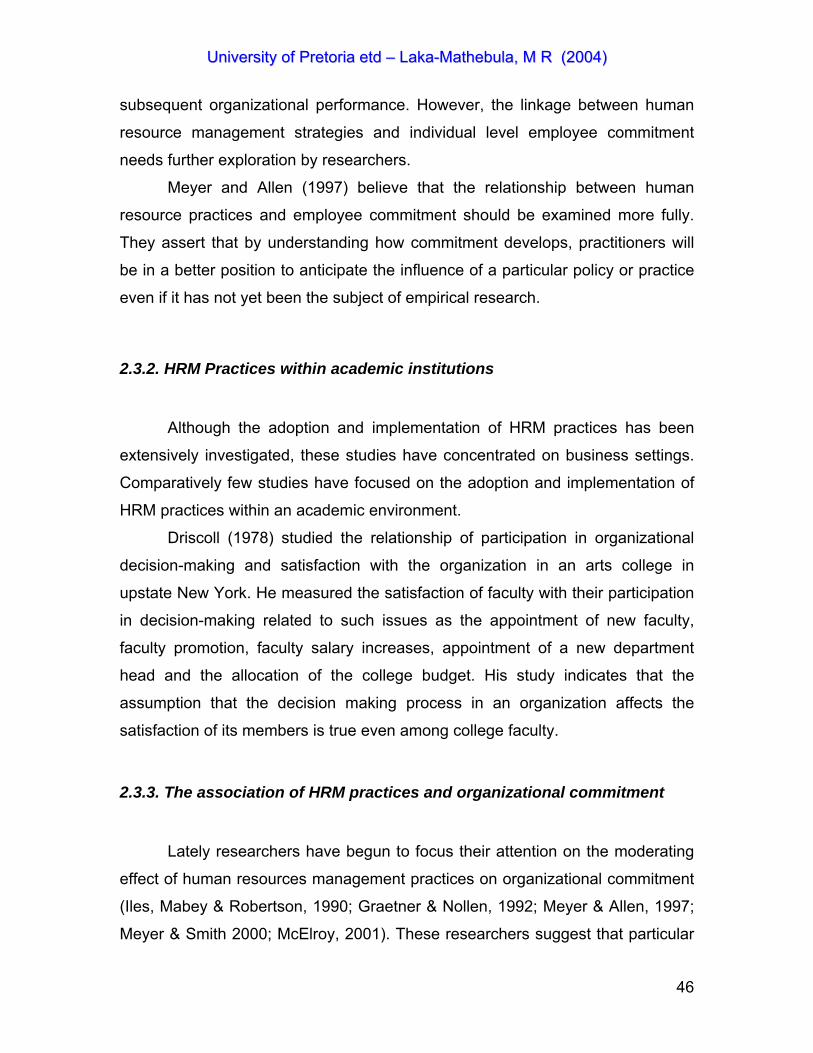
UUnniivveerrssiittyy ooff PPrreettoorriiaa eettdd –– LLaakkaa--MMaatthheebbuullaa,, MM RR ((22000044))
46
subsequent organizational performance. However, the linkage between human
resource management strategies and individual level employee commitment
needs further exploration by researchers.
Meyer and Allen (1997) believe that the relationship between human
resource practices and employee commitment should be examined more fully.
They assert that by understanding how commitment develops, practitioners will
be in a better position to anticipate the influence of a particular policy or practice
even if it has not yet been the subject of empirical research.
2.3.2. HRM Practices within academic institutions
Although the adoption and implementation of HRM practices has been
extensively investigated, these studies have concentrated on business settings.
Comparatively few studies have focused on the adoption and implementation of
HRM practices within an academic environment.
Driscoll (1978) studied the relationship of participation in organizational
decision-making and satisfaction with the organization in an arts college in
upstate New York. He measured the satisfaction of faculty with their participation
in decision-making related to such issues as the appointment of new faculty,
faculty promotion, faculty salary increases, appointment of a new department
head and the allocation of the college budget. His study indicates that the
assumption that the decision making process in an organization affects the
satisfaction of its members is true even among college faculty.
2.3.3. The association of HRM practices and organizational commitment
Lately researchers have begun to focus their attention on the moderating
effect of human resources management practices on organizational commitment
(Iles, Mabey & Robertson, 1990; Graetner & Nollen, 1992; Meyer & Allen, 1997;
Meyer & Smith 2000; McElroy, 2001). These researchers suggest that particular
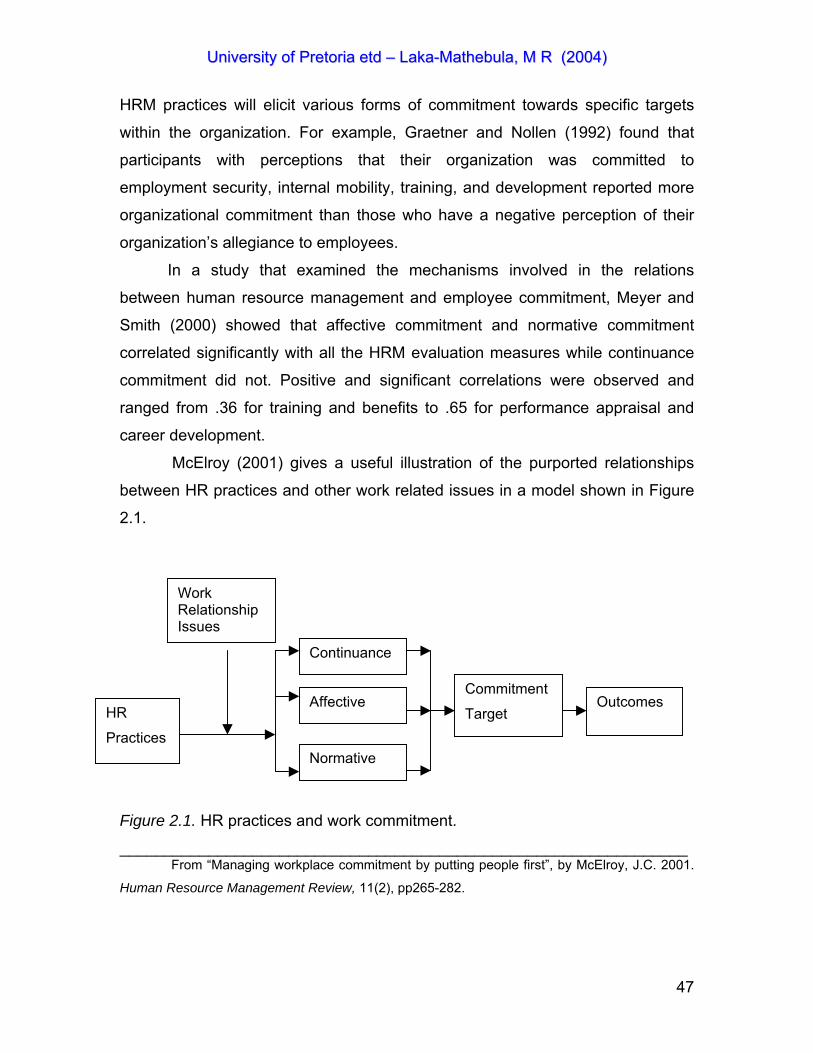
UUnniivveerrssiittyy ooff PPrreettoorriiaa eettdd –– LLaakkaa--MMaatthheebbuullaa,, MM RR ((22000044))
47
HRM practices will elicit various forms of commitment towards specific targets
within the organization. For example, Graetner and Nollen (1992) found that
participants with perceptions that their organization was committed to
employment security, internal mobility, training, and development reported more
organizational commitment than those who have a negative perception of their
organization’s allegiance to employees.
In a study that examined the mechanisms involved in the relations
between human resource management and employee commitment, Meyer and
Smith (2000) showed that affective commitment and normative commitment
correlated significantly with all the HRM evaluation measures while continuance
commitment did not. Positive and significant correlations were observed and
ranged from .36 for training and benefits to .65 for performance appraisal and
career development.
McElroy (2001) gives a useful illustration of the purported relationships
between HR practices and other work related issues in a model shown in Figure
2.1.
Figure 2.1. HR practices and work commitment.
________________________________________________________________ From “Managing workplace commitment by putting people first”, by McElroy, J.C. 2001.
Human Resource Management Review, 11(2), pp265-282.
HR
Practices
Continuance
Affective
Normative
Commitment
Target Outcomes
Work Relationship Issues
UUnniivveerrssiittyy ooff PPrreettoorriiaa eettdd –– LLaakkaa--MMaatthheebbuullaa,, MM RR ((22000044))
48
The model suggests that work relationship issues moderate the effect
human resource practices have on organizational commitment. This raises the
question of whether organizations through their HRM practices could encourage
selective organizational commitment in their employees. It also raises the
question of whether work relationship issues such as trust and leadership would
have any role in the management of organizational commitment.
The relationship between a variety of HRM practices and organizational
commitment has been investigated (McElroy 2001; Meyer & Herscovich, 2001;
Whitener, 2001). McElroy (2001) argues that it is natural that HRM practices
would influence organizational commitment, as they are concerned with the
management of people. He points out that organizations that do not select the
right employees to begin with, may not be able to keep these employees in the
end because of low employee morale arising from a poor job fit. He also
contends that organizations that do not socialize new employees into their jobs
and/or the organization may not be able to cultivate from them a sense of loyalty
and commitment to the organization. This he attributes to the lack of attachment
demonstrated by the organization to the newcomers.
Iles et al. (1990), and Meyer and Herscovich (2001) warn that when
examining how HRM practices can be used to foster affective commitment
toward a target, one must be aware that the same practices may also induce
other forms of commitment. That is, the practice of an HRM policy might elicit
multiple effects on the employee and the manifestation of one effect might be
neutralized or even negated by another effect. In terms of commitment, it means
that instead of an HRM policy to elicit affective commitment it might elicit
continuance or normative commitment instead. For example, an organization
might use training to foster affective commitment in its employees. However, if its
employees perceive the skills obtained through the training as non-transferrable,
they might develop continuance commitment instead. On the other hand, an
employee might feel a moral obligation to remain with the organization after the
training is complete. It is therefore important that the right kind of HRM practice is
adopted to induce and manage the right kind of commitment.
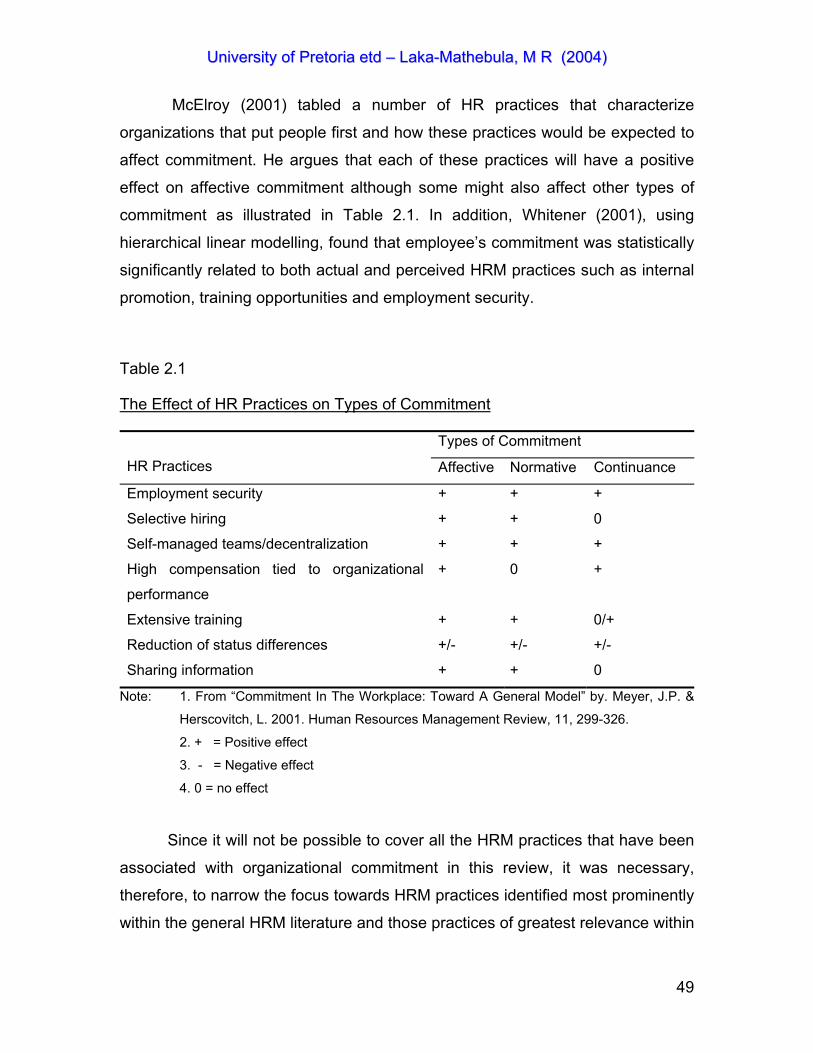
UUnniivveerrssiittyy ooff PPrreettoorriiaa eettdd –– LLaakkaa--MMaatthheebbuullaa,, MM RR ((22000044))
49
McElroy (2001) tabled a number of HR practices that characterize
organizations that put people first and how these practices would be expected to
affect commitment. He argues that each of these practices will have a positive
effect on affective commitment although some might also affect other types of
commitment as illustrated in Table 2.1. In addition, Whitener (2001), using
hierarchical linear modelling, found that employee’s commitment was statistically
significantly related to both actual and perceived HRM practices such as internal
promotion, training opportunities and employment security.
Table 2.1
The Effect of HR Practices on Types of Commitment
Types of Commitment
HR Practices Affective Normative Continuance
Employment security
Selective hiring
Self-managed teams/decentralization
High compensation tied to organizational
performance
Extensive training
Reduction of status differences
Sharing information
+
+
+
+
+
+/-
+
+
+
+
0
+
+/-
+
+
0
+
+
0/+
+/-
0
Note: 1. From “Commitment In The Workplace: Toward A General Model” by. Meyer, J.P. &
Herscovitch, L. 2001. Human Resources Management Review, 11, 299-326.
2. + = Positive effect
3. - = Negative effect
4. 0 = no effect
Since it will not be possible to cover all the HRM practices that have been
associated with organizational commitment in this review, it was necessary,
therefore, to narrow the focus towards HRM practices identified most prominently
within the general HRM literature and those practices of greatest relevance within
UUnniivveerrssiittyy ooff PPrreettoorriiaa eettdd –– LLaakkaa--MMaatthheebbuullaa,, MM RR ((22000044))
50
the specific context of academic institutions. On this basis, this review will focus
on practices relating to recruitment and selection, training and development,
promotion, job security, communication, involvement in decision-making and
rewards systems, in no particular order. The following gives a description of how
each of these practices might be expected to influence the various forms of
organizational commitment.
2.3.3.1. Selective staffing
Many writers (Weiner, 1982; Guest 1987; Caldwell, Chatman & O’Reilly,
1990; Iles et al., 1990; Meyer and Allen, 1991; Storey, 1992; Tepstra, 1994) have
identified a link between recruitment and selection and the development of
organizational commitment. They argue that by carefully selecting the people
who join their organizations, organizations can make sure there is congruency
between the organization and the employee to an extent that organizational
commitment could easily develop. They also describe several recruitment and
selection techniques that can instil this link. Weiner (1982) argues that
commitment oriented recruitment relies strongly on communicating the
organization’s values and beliefs and selecting candidates through assessments
that identify strong congruency between the organization and individual values.
Iles et al. (1990) argue candidates might develop organizational
commitment if they perceive the selection procedures to be accurate and fair.
Guest (1987) includes psychometric testing and profiling, occupational
personality questionnaires, bio-data analysis, behavioural event and episodic
questioning techniques as some of the techniques that can be applied. He
argues that these techniques can enable managers to select employees with
desired specific characteristics that can fit in with organizational norms and
values.
In a study of 291 respondents from 45 firms, Caldwell et al. (1990), found
that rigorous recruitment and selection procedures are associated with higher
levels of employee commitment based on internalisation and identification. They
UUnniivveerrssiittyy ooff PPrreettoorriiaa eettdd –– LLaakkaa--MMaatthheebbuullaa,, MM RR ((22000044))
51
found that the presence of a consistent and well-documented set of selection
policies is positively related to shared values (r = .17, p < .01). They also found a
positive correlation between selection practices and normative commitment (r =
.15, p < .05).
Meyer and Allen (1991), also agree that an employee’s commitment to an
organization can largely be determined by early job experiences especially by the
recruitment process and the socialization process. Storey (1992) suggests that
systematic techniques, such as testing that assess behavioural and attitudinal
aspects are being used by employers to control the type of employee recruited,
which contributes to the management of organizational culture. Tepstra (1994)
on the other hand identifies seven HRM practices that might be involved in the
development of organizational commitment. These are recruitment studies,
validation studies, cognitive aptitude and ability tests, biographical information
banks, structured interviews, goal setting and rigorous evaluations of
developmental activities. He maintains that the use of effective staffing practices
can benefit most organizations irrespective of contingency factors. He believes
an organization can have great influence on employee performance and
commitment during the initial stage of selection.
In a study to determine the overall association between affective and
calculative commitment with human resources procedures, Randall and
O’Driscoll (1997) found that employees with higher affective commitment
reported stronger agreement with human resource policies. They reported
positive correlation coefficients between affective commitment and assessing job
performance(r = .34, p <. 01), training policies(r = .27, p <. 01), reward systems(r
= .34, p <. 01), promotion policies(r = .42, p <. 01), decision-making procedures(r
= .46, p <. 01), personal selection procedures(r = .36, p <. 01) and human
resource management procedures(r = .38, p <. 01). Calculative commitment
showed nonsignificant negative correlations with the same measures of human
resource management.
According to McElroy (2001), selective hiring is another HRM practice that
sends a clear message to employees that people matter. He points out that
UUnniivveerrssiittyy ooff PPrreettoorriiaa eettdd –– LLaakkaa--MMaatthheebbuullaa,, MM RR ((22000044))
52
extensive recruitment and targeted selection of the best might increase affective
commitment for several reasons. In addition, McElroy (2001) maintains that the
practice helps to ensure that only people who are seen as a good fit with
organization goals and culture are selected. If the selection is successful,
affective commitment should be enhanced by the very fact that the selected
employees identify with organizational goals. The employee’s knowledge that
he/she was selected out of an extensive pool will create a perception that the
organization thinks highly of him/her and will value his/her contributions to the
organization.
However, McElroy (2001) also argues that being made to feel special
might induce a moral sense of obligation to one’s new employers, thus inducing
normative commitment. He further argues that the knowledge that to get into a
position one needs to beat a large number of competitors might create an
unwillingness to look for alternative employment and enhance continuance
commitment. Thus according to McElroy (2001) recruitment and selection
practices might influence the development of all forms of organizational
commitment. He argues that by carefully selecting the people who join their
organizations, managers can make sure there is congruency between the
organization and the employee to the extent that organizational commitment
could easily develop.
2.3.3.2. Comprehensive Training
Training and development are also closely associated with culture change
and indirectly employee commitment in much of the HRM literature. Guest (1987)
alludes to training and development as one of the key policy areas necessary to
achieve a new culture. This culture can be one in which organizational
commitment ranks high.
McElroy (2001) claims that organizations that extensively train their
employees create a reputation for valuing and developing employees. He adds
that this provides a vehicle through which they can attract the right kind of
UUnniivveerrssiittyy ooff PPrreettoorriiaa eettdd –– LLaakkaa--MMaatthheebbuullaa,, MM RR ((22000044))
53
employees. Thus, people who are high achievers would be attracted to
organizations known to value their employees. McElroy (2001) suggests that
increased self-worth and importance could be the mechanism through which
training is predicted to increase organizational commitment. He argues that
organizations that invest in training send a clear message to their employees that
the organization is committed to the development of its people. The employees
are bound to respond in kind to this show of commitment to themselves The
response might be in the form of affective commitment because of the
psychological attachment to the organization and its goal that is induced by
organization specific training, or it might be a moral obligation to give the
organization its money’s worth if the organization has funded the training.
When the training involves organization specific skills, the training might
induce continuance commitment if the skills acquired are perceived to be un-
transferable (McElroy, 2001). Generalized skills training can be easily
transferable to other organizations, while specialized training may result in the
creation of sunken costs in terms of time and effort that an employee stands to
lose if he/she leaves the organization.
2.3.3.3. Equitable rewards
In studies related to HRM practices researchers have shown a link
between rewards and benefits and organizational outcomes. Pfeffer (1994
1995,1998) argues that reward systems such as a higher salary base, gain-
sharing, bonuses and employee stock options, act as incentives for employees to
be committed and motivated to achieve organizational goals. In a study of 250
employees of a manufacturing operation, Oliver (1990) found a positive
correlation (r = .56, p < .01) between work rewards and commitment. Buchko
(1993) suggest that benefit practices can be associated with turnover. He found
that in organizations in which benefits were a higher percentage of total labour
costs and those organizations whose benefits packages were described to be of
higher quality, tended to report lower rates of employee attrition. Buchko (1993)
UUnniivveerrssiittyy ooff PPrreettoorriiaa eettdd –– LLaakkaa--MMaatthheebbuullaa,, MM RR ((22000044))
54
suggests that this may be because employees are satisfied with the benefits they
receive or it might be because the rewards and benefits received are binding
investments that would induce organizational commitment. These results imply
that the size and types of benefits provided for by organizations play a significant
role in reducing employee turnover.
Williams and McDermid (1994) found that a negative performance-
turnover relationship was stronger in organizations using performance-contingent
reward systems. This means that individuals who were compensated more for
their high levels of performance were less likely to quit. This might be because
the high compensation becomes an investment that ties the employee down.
Similarly, Park and Ofori-Dankwa 1994) also found that turnover is negatively
associated with levels of pay, particularly when individual incentive programs
determined pay. However, they also found that employee turnover was positively
associated with the presence of group incentive programs. Employees were
found to be unsupportive of group incentive programs, as these were not tied
directly to the individual's efforts.
In studies related to compensation, Trevor, Gerhart and Boudreau (1997)
found that salary growth had a pronounced effect on turnover. They found that
the effects of salary growth on turnover were greatest for high performers. High
performing employees were less likely to leave the organization if their salary
growth was significant. This result suggested that organizations should adopt
pay-for-performance programs to retain high performing employees.
Stum (1999) found that pay and benefits are still the foundation for
choosing a new employer or for leaving the present one. He found that benefits
such as medical plans, retirement plans, vacation, sick leave and short-term
disability are important to employees in that order. His results also showed that
stock purchase/ownership plans, profit sharing/cash bonus plans and defined
benefit pension plans are the benefit plans that correlated best with employee
commitment. Based on his results Stum (1999) concluded that employees are
likely to be highly committed to the organization when they clearly understand the
UUnniivveerrssiittyy ooff PPrreettoorriiaa eettdd –– LLaakkaa--MMaatthheebbuullaa,, MM RR ((22000044))
55
overall compensation program and believe the compensation program provides
internal pay equity.
According to McElroy (2001), providing high compensation could lead to
higher affective organizational commitment through a variety of mechanisms.
First, it allows the organization to attract a larger pool of applicants from which to
selectively recruit. Second, high compensation serves as an indication of how
much an organization values its people, thereby enhancing their self-worth and
feelings of importance. Third, linking individual rewards directly to the future of
the organization makes compensation dependent on performance. This
motivates the individual to exert more effort on behalf of the organization. Finally,
tying compensation to organizational performance makes comparison among
employees more equitable, thus enhancing perceptions of fairness within the
organization. For these reasons, high compensation that is tied to organizational
performance is predicted to lead to increased levels of affective organizational
commitment.
McElroy (2001), however, does not expect the tying of compensation to
performance to create the norm of reciprocity associated with normative
commitment. Since compensation is earned by the employee’s performance and
not given, the employee will not feel any obligation to the organization. Thus,
McElroy (2001) argues that there would be no association between
compensation and normative commitment. He suggests that high compensation
might however affect continuance commitment. He speculates that if employees
are paid high salaries they may perceive a loss of control over their high
compensation should they decide to leave the organization. This might induce in
the employee a desire to remain with the organization where the high
compensation is guaranteed.
2.3.3.4. Promotions
Authors (Grusky, 1966; Iles et al, 1990; Snell & Dean, 1992; Kallenberg &
Mastekaase, 1994) have linked promotion procedures and the presence of

UUnniivveerrssiittyy ooff PPrreettoorriiaa eettdd –– LLaakkaa--MMaatthheebbuullaa,, MM RR ((22000044))
56
promotion opportunities or career paths to have a positive relationship with
organizational commitment. In a study of 1649 managers of large business
companies, Grusky (1966) found positive statistically significant positive
correlations between career mobility and organizational commitment. They found
that managers with moderate mobility were less committed to the organization
than managers who were most mobile during their careers. Iles et al. (1990) and
other authors suggest that perceptions of the fairness of the promotion
procedures of an organization can alienate those employees who were passed
over especially if they perceive the procedures to be unfair.
HRM practices/policies dealing with internal career opportunities are
called firm internal labour markets or FILMS (Kalleberg & Mastekaasa, 1994).
FILMS are characterized by the presence of job ladders the entry point of which
is only at the bottom. Movement up the ladders is associated with the
progressive development of skills and knowledge (Kallenberg & Mastesaaka,
1994). The provision of mobility opportunities along with skill acquisition and
development are central to the idea of promotion and advancement policies.
FILMS are often thought to create a closer psychological bond between
the worker and the organization’s culture (Kallenberg & Mastekaase, 1994).
Hence, employees who identify with and are loyal to the organization can be
expected to work hard and remain with the organization even if this action does
not result in greater expected lifetime earnings and other job rewards. Kallenberg
and Mastekaase (1994) provide five possible explanations for the link between
organizational commitment and FILMS: 1) FILMS increase opportunities for intra-
organizational mobility, 2) FILMS enhance earnings, 3) FILMS help to create firm
specific skills, 4) FILMS influence autonomy and 5) FILMS decrease collective
actions. These five sets of variables are not mutually exclusive nor are they
necessarily competitive with one another. All of these variables may help to
account for why FILMS are related to commitment. An important thing is that
these factors may affect organizational commitment differently. For example,
mobility and rewards may increase organizational commitment while lower
opportunities for autonomy may detract from organizational commitment.

UUnniivveerrssiittyy ooff PPrreettoorriiaa eettdd –– LLaakkaa--MMaatthheebbuullaa,, MM RR ((22000044))
57
FILMS are generally assumed to lead to higher intra-organizational
mobility and this mechanism is perhaps the most obvious reason why FILMS are
thought to enhance organizational commitment (Kalleberg & Mastekaasa 1994).
Employees in organizations with FILM should exhibit greater loyalty and
attachment to their organizations while absence of opportunities is expected to
lower organizational commitment. In addition, internal labour market policies
provide the structural context within which organization training occurs, many
skills are acquired, mobility and career advancement takes place, and higher
earnings are often obtained. FILMS such as career advancement and promotion
opportunities are often used as incentives to employees.
Supporting these arguments are Young and Worchel’ s (1998) results that
show high positive correlation between satisfaction with promotion opportunities
and organizational commitment (t = .1059, p < .0001). These policies help
employers to reduce the cost of training and retaining employees with the
necessary qualifications, and provide employees with effective assurances that
exerting effort will be beneficial. Such policies raise the importance to employees
of good performance and career advancement within the organization, and
provide the employer with opportunities to observe the behaviour of employees
on a long-term basis. Empirical evidence on the linkage between organizational
commitment and FILMS is however scarce.
According to Rogers (2000), many organizations have adopted internal
rules and administrative procedures that have the effect of shielding their core
employees from the competitive external labour markets. These measures
provide opportunities for the promotion of their employees. Rogers (2000)
maintains that such policies usually contain core characteristics that include rules
governing entry into the organization through a limited number of ports of entry at
the bottom of long career ladders. Other factors associated with these type of
policies is that they include formal and written rules regarding entry into the job
ladders, firm specific skills requirements and job competition and other rewards
are attached to positions rather than individuals (Rogers, 2000). Entry into the
organization is followed by the acquisition of organization-specific skills through
UUnniivveerrssiittyy ooff PPrreettoorriiaa eettdd –– LLaakkaa--MMaatthheebbuullaa,, MM RR ((22000044))
58
internal training and experience. All these lead to eligibility for internal
promotions. Thus, it can be argued that if employees were assured of
progression within the organization, they often would not look for external
alternatives. They would be happy to continue their association with the
organization.
2.3.3.5. Job Security
Bansal, Mendelson and Sharma (2001) define job security as providing
employees with a reasonable assurance that they will not be laid off, even during
tough economic times. A number of studies have shown that perceived job
security has a positive correlation with commitment and trust. Ashford, Lee and
Bobko (1989) reported that perceptions of low levels of job security could result
in reduced employee commitment. Hallier and Lyon (1996) suggest that if
employees perceive a threat to their employment, their organizational
commitment will decline. They assert that employees who are not assured of
their place in the organizational structure tend to look for security outside the
organization. This perception is based on the notion that organizations that
provide employment security are committed to their workforce (Pfeffer, 1995).
Pfeffer and Viega (1999) argue that providing employment security is
fundamental to a philosophy of putting people first in order to attain
organizational success. Their argument is based on Pfeffer (1994)’s assertion
that the provision of job security is deemed an important exhibition of the
organization’s commitment to its employees. Organizations that put people first
would tend to have a corporate philosophy to provide employment security. This
would enable the organization to take deliberate actions in implementing the
other HRM policies associated with organizational commitment (McElroy, 2001).
An organization would not be prepared to invest in employees who will not be
staying with the organization for long. Continued employment therefore is
essential as it affects an organization’s willingness and ability to implement other

UUnniivveerrssiittyy ooff PPrreettoorriiaa eettdd –– LLaakkaa--MMaatthheebbuullaa,, MM RR ((22000044))
59
practices and the employee’s willingness to engage in or benefit from
organizational activities.
The provision of employment security, particularly in this day and age of
downsizing, outsourcing and rationalization, characterizes a commitment by the
employer to its employees (Pfeffer, 1994). Norms of reciprocity and social
exchange theory dictate that employees should return the commitment (Tsui et
al., 1997). This characterizes the exchange nature of the psychological contract
between the employer and the employee. That is, in exchange for the
employee’s commitment to the organization, the employer provided employment
security (Hallier & Lyon, 1996). Thus, it can be assumed that organizational
commitment would be difficult to sustain in an environment where job security
was not ensured. That is, perceptions of job insecurity might tend to diminish
attachments to work and organization.
An employee is considered to enjoy job security when an individual
remains employed with the same organization without a reduction of seniority,
pay, pension benefits, and other benefits (Yousef, 1998). It also refers to the
extent to which an organization provides stable employment. Job security is
important because of the fact that it is critical for influencing work-related
outcomes. In a study of 447 individuals in various organizations in the United
Arab Emirates, Yousef (1998) found a statistically significant correlation (r = .53;
p<. 0001) between satisfaction with job security and organizational commitment.
According to McElroy (2001), employment security may induce several
forms of commitment. Continued employment may enhance affective levels of
commitment by virtue of the fact that an employee can get to like his/her work
environment after a while. In addition, it might happen that as an employee
continues membership of an organization, his/her belief in organizational values
might increase and so might his/her willingness to exert effort on behalf of the
organization. Alternatively, the employee might feel obliged to return the loyalty
exhibited by the organization. Finally, the provision of secure employment might
induce continuance commitment due to the fact that an employee might continue

UUnniivveerrssiittyy ooff PPrreettoorriiaa eettdd –– LLaakkaa--MMaatthheebbuullaa,, MM RR ((22000044))
60
employment because the employee might face unemployment due to the lack of
alternatives elsewhere.
2.3.3.6. Employee Participation
From as early as the late 1970s organizational researchers were
interested in the relationship between participation in organizational decision-
making and outcomes such as satisfaction with the organization (Driscoll, 1978).
Driscoll (1978) showed that increasing levels of participation are associated with
greater overall satisfaction with the organization as well as with specific
satisfaction with participation itself. He argued that participation in decision-
making might satisfy the employee’s psychological needs for responsibility and
autonomy.
According to Meyer and Allen (1997) changing from a system of
hierarchical control to one in which employees are encouraged to demonstrate
initiative clearly shows that the organization is supportive of its employees and
values their contributions. In agreement with this are Pfeffer and Viega (1999)
who believe that allowing employees the opportunity to make and take
responsibility for decisions that affect their work should increase their sense of
responsibility and stimulate more initiative and effort on the part of employees.
McElroy (2001) claims that participation can increase affective
commitment when employees are involved in decision-making and the
organization is decentralized. He maintains that organizations that give their
employees more responsibility and autonomy indicate trust in their employees.
This indication of trust in the employee might create a sense of obligation on the
part of the employee (McElroy, 2001). Consequently, this might lead to an
increase in the level of normative commitment. This especially happens when the
employee perceives that he/she may have to give up his/her self-determination
should they leave the organization.

UUnniivveerrssiittyy ooff PPrreettoorriiaa eettdd –– LLaakkaa--MMaatthheebbuullaa,, MM RR ((22000044))
61
2.3.3.7. Information sharing
The relationship between communication and organizational commitment
has been of interest to researchers for many years. Trombetta and Rogers
(1988) illustrated and tested this relationship as shown in Figure 2.2.
Figure 2.2. The effects of communication openness information adequacy,
participation in decision-making, employee age, length of service, job position
work shift, and job satisfaction on organizational commitment.
________________________________________________________________ Note: From Trombetta,J.J & Rogers, D.P. (1988) Communication climate, job satisfaction and
organizational commitment: The effects of information adequacy, communication openness and
decision participation. Management Communication Quarterly, 1(4), 494-514.
Social information processing theory suggests that practices of
communication that promote open communication within an organization and
open access to information, and free information sharing, can increase affective
organizational commitment (Thornhill et al., 1996). Information sharing is
suggested to have direct influence on the variables associated with affective
commitment by enhancing trust and building employee self-worth and
perceptions of importance (Meyer & Allen, 1997). This means that information
Communication Openness Participation in decision-making Information sharing
Job Satisfaction
Age Tenure Position Shift
OrganizationalCommitment

UUnniivveerrssiittyy ooff PPrreettoorriiaa eettdd –– LLaakkaa--MMaatthheebbuullaa,, MM RR ((22000044))
62
sharing should promote increased perceptions of fairness on the nature of
decisions and the processes by which decisions are made. According to Meyer
and Allen (1997), both these factors have been associated with the development
of affective commitment.
Thornhill et al. (1996) regard communication with employees as one of
those organizational strategies that can be employed to encourage employee
involvement and commitment. They assert that employers can use
communication strategies such as “increased information flow down the
organization” to involve employees. The study by Thornhill et al. (1996) of 439
employees of a British higher education institution shows a statistically significant
relationship between organizational commitment and communication. They found
that 68% of those employees who believed that management made a positive
effort to keep staff well informed indicated that they felt part of the institution.
Eighty eight percent (88%) of those felt that their organization was a good place
to work and 85% that it had a bright future.
Young and Worchel (1998) also found that perceptions of both upward
and downward communication were positively related to organizational
commitment. Guzley (2001) found that employee’s perceptions of organizational
climate and communication climate were positively correlated with the level of
employee commitment. Specifically their multiple regression results indicated that
organizational clarity, participation and superior-subordinate communication
accounted for 41% of the variance in organizational commitment (R2 = .418, p <
.001) with participation (t = 4.910, p< .001) and organizational clarity (t = 4.783,
p< .001) emerging as significant predictors of commitment.
In a study using an instrument developed by the international
Communication Association, Putti, Aryee and Phua (2001) used Pearson
correlations to show that the global measure of communication relationship
satisfaction has a strong correlation with organizational commitment (r = .54, p <
.01).
To shed more light on the relationship between communication and
organizational commitment, Postmes, Tanis and de Wit (2001) attempted to

UUnniivveerrssiittyy ooff PPrreettoorriiaa eettdd –– LLaakkaa--MMaatthheebbuullaa,, MM RR ((22000044))
63
identify aspects of organizational commitment that might contribute to affective
organizational commitment. They made a distinction between horizontal and
vertical communication with horizontal communication referring to the informal
interpersonal and socio-emotional interaction between immediate colleagues and
vertical communication referred to work-related communications up and down
the organizational hierarchy. Results of their studies show that horizontal
communications are less strongly related with organizational commitment while
vertical communication was found to be the stronger predictor of organizational
commitment.
Mayfield and Mayfield (2002) state that organizational loyalty and
attachment are best nurtured when communication practices take place in an
organization that places high value on employees and engenders trust. They also
add that leader communication skills and practices help to generate
organizational loyalty. Managerial communication practices that have been
shown to encourage organizational commitment include managers explaining
why decisions are made, communication occurring in a timely manner, important
information flowing continuously, direct supervisors and other leaders explaining
the specific implications of environmental and organizational changes to each
level of employees and validating employee responses to leader communications
(Mayfield & Mayfield, 2002).
2.3.3.8. Developmental performance appraisal
The creation of a “performance culture” is characterized by a search for
strategies to improve the contribution of individuals to the overall success of the
organization (Fletcher & Williams, 1996). Performance management is
associated with an approach to creating a shared vision of the purpose and aims
of the organization. This helps individual employees to understand and recognize
the role they can play in achieving organizational goals. In so doing, performance
management is supposed to enhance performance both at the individual and
organizational level.
UUnniivveerrssiittyy ooff PPrreettoorriiaa eettdd –– LLaakkaa--MMaatthheebbuullaa,, MM RR ((22000044))
64
According to Fletcher and Williams (1996), elements of a performance
management system include among others: (1) the development of a mission
statement and business plan, and the enhancement of communications within
the organization so that employees are aware of the business plan and
organizational objectives and can contribute to their formulation, (2) the
clarification of individual responsibilities and accountabilities through job
descriptions and clear role definitions, leading to the measurement of individual
performance, and (3) implementing appropriate strategies and developing
people. Fletcher and Williams (1996) found that aspects of performance
management such as seeing the strategic relevance of one’s goals and being
aware of how well the organization is performing contribute to organizational
commitment.
The relationship between performance management and organizational
commitment is not very clear. The research by Mathieu and Zajac (1990)
suggests that job, role and organizational characteristics are amongst the
antecedents of organizational commitment. This indicates that some elements of
a performance management system may influence the levels of organizational
commitment. In a study of public and private sector organizations, Fletcher and
Williams (1996) found weak correlations between organizational commitment and
several measures of performance management. The correlations were .11 (F
value = 8.99) for participation, .14 (F value =15.41) for feedback, and .16 (F
value = 16.47) for difficulty of goals set.
Taylor and Pierce (1999) found that a significant change occurred in
employees over the time that a performance management system was
implemented at a regional environment council in New Zealand. They found a
significant effect of the performance management system on the organizational
commitment levels of those staff labelled as competent.
In addition to using HRM practices as organizational strategies to induce
organizational commitment, organizations can change their leadership or
management style towards a more participative approach (Guest, Peccei &
Thomas, 1993). This apparent importance of leadership style in the
UUnniivveerrssiittyy ooff PPrreettoorriiaa eettdd –– LLaakkaa--MMaatthheebbuullaa,, MM RR ((22000044))
65
implementation of HRM policies and by implication the development of
organizational commitment requires a thorough understanding of leadership
styles. What follows now is review of the literature on leadership styles.
2.4 LEADERSHIP STYLES
2.4.1. Introduction
The fact that leadership is one of the most complex concepts studied by
organizational and psychological researchers is attested to by the many different
definitions of leadership that one finds in the literature (Van Seters & Field, 1989;
Johns & Moser, 1989). Some of these definitions describe leadership as an act of
influence, some as a process, and yet others have looked at a person’s trait
qualities (Johns & Moser, 1989; Horner, 1997). Each one of these approaches to
leadership attempts to describe the nature and characteristics of leadership. As
there seem to be considerable difficulties in specifying the factors associated with
leadership, Johns and Moser (1989) recommend that it is more feasible to study
leader behaviour or actual acts of the leader. Leadership style or behaviour
describes the way in which a leader interacts with others rather than his traits.
Before describing leadership styles, it is useful to place them in their context
within the evolution of leadership theories.
2.4.2. Approaches to Leadership
Leadership has been accompanied throughout time by numerous theories
that have been categorized into several historically distinct approaches that focus
either on traits, behaviours, situational contingencies, or transformational
leadership or into cultural contingency approach. These theories have been
described in papers by such authors as Yukl (1989), Van Seters and Fields
(1989), Johns and Moser (1989) Gibson and Marcoulides, (1995) and more

UUnniivveerrssiittyy ooff PPrreettoorriiaa eettdd –– LLaakkaa--MMaatthheebbuullaa,, MM RR ((22000044))
66
recently, Yukl (1999). Although these authors have used different classifications,
they all have grouped different leadership theories with a common theme. Since
it is not the intention of this section to give detailed descriptions of the different
leadership approaches/eras or ideas, a detailed literature review will not be given
on the other leadership theories except for the multifactor leadership theory,
which is of interest to this study.
2.4.3. Multifactor leadership theory
The multifactor leadership theory developed by Bass in the 1980s
encompasses a range of leader behaviours. This approach incorporates the:
transformational, transactional, laissez-faire leadership and charismatic styles of
leadership. These leadership styles have been described to have a direct effect
on individual and organizational level outcomes (Bass, 1990a; Yukl & Van Fleet
1992).
Bass (1985) based his descriptions of transformational and transactional
leaders on Burns‘s (1978) ideas. Burns (1978) proposed that one could
differentiate ordinary from extra-ordinary leadership. He described
ordinary/transactional leaders as those leaders who influence employee
compliance by expected rewards. Transactional leadership is an exchange
relationship that involves the reward of effort, productivity and loyalty.
Transformational leaders as those who motivate their followers to perform
beyond expectation by raising the follower’s confidence levels and providing
support for developing to higher levels.
The work of Bass and his colleagues (Bass & Avolio, 1990a, 1995)
expanded Burns’s factors of leadership to include a third factor laissez faire
leadership. Bass (1985) investigated key behaviours of leaders in public and
private organizations and developed a model of transformational leadership.
Based on this model and evidence collected from using the MLQ questionnaire
they expanded the factors to what they called the “full range leadership model”.

UUnniivveerrssiittyy ooff PPrreettoorriiaa eettdd –– LLaakkaa--MMaatthheebbuullaa,, MM RR ((22000044))
67
The key factors associated with multifactor leadership appeared in the
original version of the Multifactor Leadership questionnaire (MLQ) an instrument
developed by Bass (1985) to measure transactional and transformational
leadership. The original five factors identified by Bass (1985) are charisma
(idealized influence), intellectual stimulation, individualized attention, contingent
reward, and management-by-exception. The first three factors he associated with
transformational leadership and the latter two with transactional leadership. The
validity of the MLQ has been confirmed by various studies. Bass and his
colleagues have revised the MLQ and included an additional factor of
inspirational motivation associated with transformational leadership. This is
based on the four I’s of transformational leadership described by Bass and Avolio
(1990a; 1990b) and Avolio, Waldman and Yammarino (1991) A measure of
laissez-faire behaviours, an ineffective form of leadership is also included in the
current form of the MLQ as part of the full measure of full-range leadership.
2.4.3.1. Transformational leadership style
There is considerable variation in the way transformational leadership is
conceptualised. Bennis ‘s 1959 notion of the transformational leader as someone
with the ability to reach the souls of their followers has been modified. It has been
modified by such authors as Burns (1978), who was first to propose that
transformational leadership represents the transcendence of self-interest by the
leader and followers. Transformational leaders, according to Burns (1978), are
able to ensure that followers are consciously aware of the importance of sharing
organizational goals and values. They also find ways to ensure that followers
know how to achieve these goals. Burns (1978) further states that
transformational leaders motivate their followers to go beyond their own self-
interests and give effort on behalf of the organization by appealing to the higher
order needs of followers.
Bass and colleagues (Bass, 1985; 1997; Avolio, Bass, & Jung, 1995;
1999) have identified five factors which represent the behavioural components of

UUnniivveerrssiittyy ooff PPrreettoorriiaa eettdd –– LLaakkaa--MMaatthheebbuullaa,, MM RR ((22000044))
68
transformational leadership: 1) idealized influence (attributes); 2) idealized
influence (behaviour); 3) inspirational motivation; 4) intellectual stimulation; and
5) individualized consideration. Idealised influence attributes occur when
followers identify with and emulate those leaders who are trusted and seen as
having an attainable mission and vision. Idealized influence behaviour refers to
leader behaviour that results in followers identifying with leaders and wanting to
emulate them. Inspirational motivation is closely related to idealized influence. It
implies that leaders behave in ways that motivate and inspire those around them
by providing meaning and challenge to their followers' work. Intellectual
stimulation occurs when leaders encourage their followers to be innovative and
creative by questioning assumptions, reframing problems, and approaching old
situations in new ways. Individual consideration occurs when leaders relate to
followers on a one-to-one basis in order to elevate goals and develop skills.
Leaders who display individual consideration treat each employee as an
individual and are attentive to the unique needs, capabilities and concerns of
each individual (Bass, 1985). They also consider the individual’s developmental
and growth needs. Managers who demonstrate individualized consideration often
coach, mentor, and counsel their subordinates. Leaders manifesting inspirational
motivation articulate high expectations to subordinates (Bass 1985). They
communicate important issues very simply and use various symbols to focus
their efforts. They also demonstrate self-determination and commitment to
attaining objectives and present an optimistic and achievable view of the future.
A transformational leader provides intellectual stimulation to employees by
encouraging them to try out new approaches for solving problems (Bass, 1985).
They challenge the status quo and encourage employees to explore new ways of
achieving organizational goals and objectives. Subordinates under such
leadership are not hesitant to offer their ideas, become critical in their problem
solving and tend to have enhanced thought processes.
Yukl (1989) defined transformational leadership as the process of
influencing major changes in attitudes and assumptions of organizational
members and building commitment for the organization’s mission and objectives.

UUnniivveerrssiittyy ooff PPrreettoorriiaa eettdd –– LLaakkaa--MMaatthheebbuullaa,, MM RR ((22000044))
69
Transformational leaders are said to appeal to higher ideals and moral values of
followers, heighten their expectations, and spur them to greater effort and
performance on behalf of the organization (Bass, 1990a; Bass & Avolio, 1990b).
Bass and Avolio (1990b) suggest that transformational leaders inspire followers
with a vision of what can be accomplished through extra personal effort, thus
motivating followers to achieve more than they thought they would achieve.
In addition, transformational leaders have the ability to motivate their
subordinates to commit themselves to performance beyond expectations (Bass,
1990a; Bryman, 1992; Howell & Avolio, 1992). According to Bass (1990b), this
occurs in three main ways. First, it is by raising the level of awareness of the
objective of the organization and how it is to be achieved. Second, it is to
encourage co-workers to put the organization’s objective above their own
personal interests. Finally the leader has to satisfy and stimulate people's higher-
order needs. To accomplish these results, transformational leaders must possess
and display four characteristics namely idealized influence or charisma,
inspirational motivation, intellectual stimulation, and individual consideration
(Bass, 1985; 1990b; Bass & Avolio, 1990a; 1990b).
Leaders demonstrating idealized influence or charisma have a vision, a
strong influence and a sense of mission (Bass, 1990a; Bass & Avolio, 1990a).
They also instil pride in their subordinates and command respect. Employees
have a high level of trust and confidence in such leaders, tend to adopt their
vision , seek to identify with them, and develop a strong sense of loyalty to them.
A charismatic leader does not derive his/her authority and the legitimisation of
his/her leadership from rules, position, or tradition, but from the followers' faith
and trust in him. The leader's power is personal and due to these extraordinary
qualities. Leaders who encourage their followers to be innovative and creative
provide intellectual stimulation (Bass & Avolio, 1990b). When the leader prompts
the followers to provide alternative solutions to problems and challenges their
assumptions it creates intellectual stimulation. An idealized influence attribute
occurs when the followers identify with and emulate the leader. The followers
also tend to trust the leader whom they perceive as someone with an attainable

UUnniivveerrssiittyy ooff PPrreettoorriiaa eettdd –– LLaakkaa--MMaatthheebbuullaa,, MM RR ((22000044))
70
mission and vision. Idealized influence behaviour refers to the leader when the
leader’s behaviour results in followers identifying with the leader and wanting to
emulate him/her. Inspirational motivation is about motivating and inspiring
followers and providing challenges and meaning within their work environment.
The relational relationship of transformational leaders and their followers is
one characterized by pride, and respect (Bass & Avolio, 1990a). The employees
often develop a high level of trust and confidence in such a leader. The
employees are proud to identify themselves with the leader and develop a strong
sense of loyalty to them. Transformational leaders therefore do not rely on rules,
position or regulations to legitimise their leadership.
2.4.3.2. Transactional leadership style
Bass (1985; 1990a; 1990b; 1999) referred to transactional leadership as
an exchange relationship between leader and follower. Transactional leadership
theory is grounded in the social learning and social exchange theories, which
recognize the reciprocal nature of leadership (Deluga, 1990). It is based on the
realization that leadership does not necessarily reside in the person or situation
but resides in the social interaction between the leader and the follower (Van
Seters & Fields, 1989).
Bass (1985), and Bass and Avolio (1990a) described transactional
leadership in terms of two characteristics: the use of contingent rewards and
management by exception. They described contingent reward as the reward that
the leader will bestow on the subordinate once the latter has achieved goals that
were agreed to. Contingent reward is therefore the exchange of rewards for
meeting agreed-on objectives. By making and fulfilling promises of recognition,
pay increases and advancement for employees who perform well, the
transactional leader is able to get things done. Bass (1985) therefore argues that
by providing contingent rewards, a transactional leader might inspire a
UUnniivveerrssiittyy ooff PPrreettoorriiaa eettdd –– LLaakkaa--MMaatthheebbuullaa,, MM RR ((22000044))
71
reasonable degree of involvement, loyalty, commitment and performance from
his/her subordinates.
Transactional leaders may also rely on active management by exception
which occurs when the leader monitors followers to ensure mistakes are not
made, but otherwise, allows the status quo to exist without being addressed
(Bass & Avolio, 1995). In passive management by exception, the leader
intervenes only when things go wrong. In general, one can conclude that
transactional leadership is an exchange relationship that involves the reward of
effort, productivity and loyalty.
2.4.3.3. Laissez-Faire leadership style
Both the transformational and transactional leaders are described as leaders
who actively intervene and try to prevent problems, although they use different
approaches. When researching these two active forms of leadership, one finds
that they are often contrasted with a third style of leadership, called laissez-faire
leadership (Bass, 1990a; Deluga, 1990). Deluga (1990) describes the laissez-
faire leader as an extremely passive leader who is reluctant to influence
subordinates, make decisions or give direction. Such a leader generally refrains
from participating in group, or individual decision-making thus giving his/her
subordinates considerable freedom, to the point of abdicating his/her
responsibility. In a sense, this extremely passive type of leadership indicates the
absence of leadership.
The laissez-faire style of leadership is also referred to as management-by-
exception (Bass & Avolio, 1990a). Management-by-exception characterizes how
leaders monitor negative subordinate behaviour and exert corrective action only
when subordinates fail to meet objectives. Leaders who manage by exception
intervene only when procedures and standards for accomplishing tasks are not
met. It can therefore be concluded that by 'laissez-faire' it is meant that the leader
is not sufficiently motivated or adequately skilled to perform supervisory duties.

UUnniivveerrssiittyy ooff PPrreettoorriiaa eettdd –– LLaakkaa--MMaatthheebbuullaa,, MM RR ((22000044))
72
2.4.4. Leadership style and HRM practices
Avolio et al (1991) argue that leaders in today’s changing organizations
need to develop their followers to handle greater levels of responsibility and
uncertainty. This requires training and development of the employees. Avolio et
al. (1991) argue that the transformational leader will be a good manager in this
environment. The “four Is of transformational leadership” they describe enable
the transformational leader to adopt and practice appropriate HRM policies that
would bring about the desired outcomes. Since individualized consideration is
displayed when leaders pay attention to the developmental needs of followers
(Bass, 1999), it can be argued that the transformational leader would tend to
practice those HRM policies that would encourage the training and
developmental needs of his/her followers. Idealized influence and inspirational
motivation are displayed when the leader envisions a desirable future and
articulates how it can be achieved (Bass, 1999). This would require that
organizational HRM policies favour the sharing of information. A transformational
leader would be assumed to practice HRM practices that encourage
communication. Intellectual stimulation on the other hand is displayed when the
leader helps followers to become more innovative and creative (Bass, 1999).
Such a leader can be expected to practice HRM policies that promote
participation in decision-making.
Employees’ behaviour can also be influenced by the treatment they
receive from their supervisors or managers, as they are often the people who
carry out the practices (Whitener, 2001). The interpersonal treatment employees
receive from their supervisors such as adequately considering their view points,
supporting their personal biases, explaining their decisions and providing
feedback timely and applying decision-making criteria consistently could have
strong effect on the employee’s perceptions of fairness (Whitener, 2001).
Therefore, organizations that have supervisors who treat employees fairly as
they enact procedures and HR practices could increase their employee’s trust in

UUnniivveerrssiittyy ooff PPrreettoorriiaa eettdd –– LLaakkaa--MMaatthheebbuullaa,, MM RR ((22000044))
73
the organization and supervisors, which will in turn positively affect the levels of
organizational commitment.
2.4.5. Leadership styles within academic institutions
According to Bryman (1992), transformational forms of leadership have
only recently become the subject of systematic inquiry in educational contexts,
although it has been studied extensively within business settings. The studies of
leadership within an educational context are important for several reasons.
Educational institutions, especially higher education institutions, which use public
funds, are under scrutiny and are pressurized to produce value for money
performance (Bess & Goldman, 2001; Pounder, 2001). Expectations are that
these institutions should operate as “business units” making profit. This has led
to a tendency to transfer commercial business models into the educational arena.
As Bess and Goldman (2001) have put it, a new managerial culture, which
promotes economic efficiency and bottom line results, dominates both policy and
practice often overriding most concerns for social goals, quality of teaching and
research and internal human relations, is being adopted in higher education. As a
result, leaders within academic institutions struggle to respond to business
pressures of controlling costs, maintaining enrolment, and fundraising while
managing employees who often do view business interests as secondary to
academic freedom.
As a sub-discipline or content area of leadership studies, educational
leadership is still in its infancy. Most of the empirical studies conducted have
been done in schools with a limited number of studies concentrating on higher
education (Brown & Moshavi, 2002). While it is acknowledged that the
organizational cultural legacies and leadership within schools and higher
education institutions may be different, Bess and Goldman (2001) point out that
professors and teachers have much in common. Both do work with a significant
cognitive and intellectual content, and have substantial independence and

UUnniivveerrssiittyy ooff PPrreettoorriiaa eettdd –– LLaakkaa--MMaatthheebbuullaa,, MM RR ((22000044))
74
autonomy where they work closely with students and associate with their own
peers. Professors and teachers enjoy a tenure system that provides job security
and a buffer that characterizes their profession and the leadership context.
Based on Bess and Goldman ’s (2001) arguments, it is assumed that the
common goal of education pursued by both types of institutions might allow for
comparisons or generalizations from one to the other.
Educational leadership researchers have drawn selectively from the
broader perspectives or approach to leadership and concentrated mainly on
transformational and charismatic leadership. A review of the literature indicates a
limited number of papers focusing on the efficacy of transformational and
transactional leadership in the context of higher education. In a study of
principals of 89 high schools, Koh, Steers and Telborg (1995), found that
transformational leadership behaviours hold an additive effect on outcomes such
as satisfaction and effectiveness. In a more recent study of 440 university faculty
members, Brown and Moshavi (2002) showed that the idealized influence or
charisma factor of transformational leadership was significantly predictive of
desired organizational outcomes. Using the MLQ, they found that the aggregated
measure of transformational leadership is significantly related to the faculty’s
satisfaction, their perceptions of their organization’s effectiveness and their
willingness to expend extra effort.
Leithwood and his colleagues, with their research within schools, also
contributed a great deal towards our understanding of transformational
leadership within an educational environment (Leithwood, 1994, Leithwood &
Jantzi, 1997, 1999a,b, c; Yu, Leithwood & Jantzi, 2002). Leithwood (1994)
showed that transformational leadership practices had significant direct and
indirect effects on progress within school restructuring initiatives and teacher
perceptions of student outcomes. Leithwood (1994) synthesized the effects of
transformational leadership on organizational aspects such as the purpose,
people, structures and culture. His summary shows that a transformational leader
shares the school’s vision with the individuals within the school and that he also
shares the responsibility and decision making power with staff.
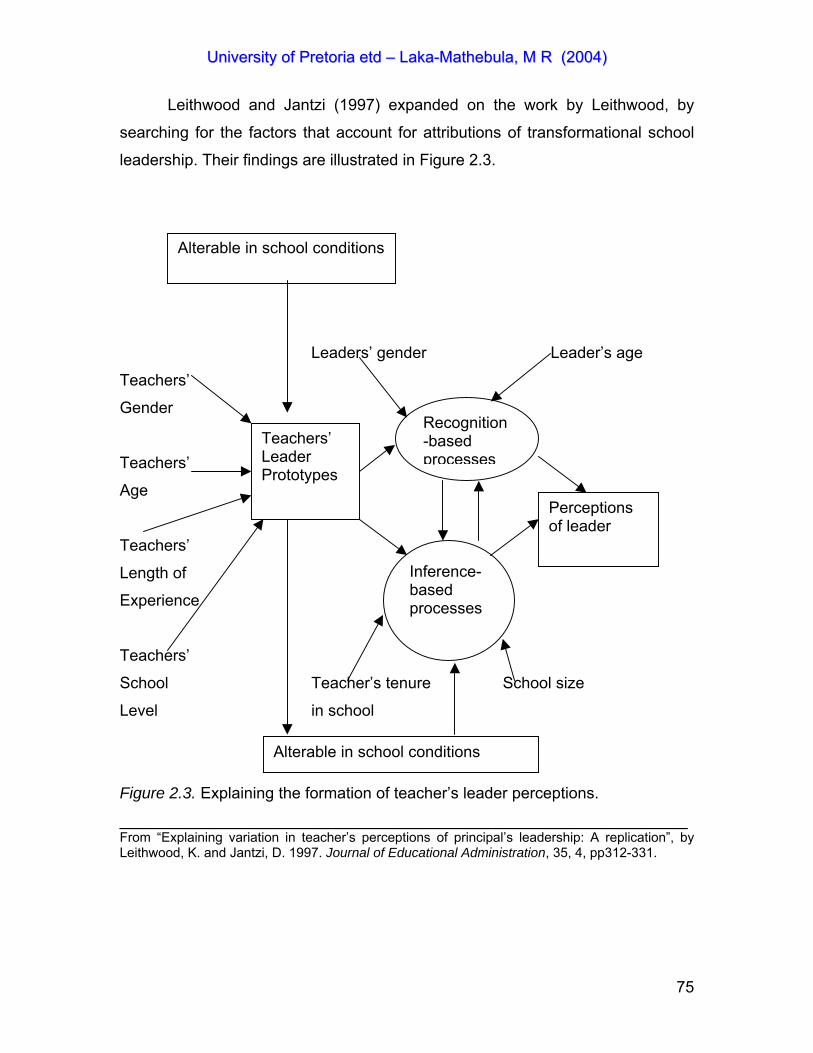
UUnniivveerrssiittyy ooff PPrreettoorriiaa eettdd –– LLaakkaa--MMaatthheebbuullaa,, MM RR ((22000044))
75
Leithwood and Jantzi (1997) expanded on the work by Leithwood, by
searching for the factors that account for attributions of transformational school
leadership. Their findings are illustrated in Figure 2.3.
Leaders’ gender Leader’s age
Teachers’
Gender
Teachers’
Age
Teachers’
Length of
Experience
Teachers’
School Teacher’s tenure School size
Level in school
Figure 2.3. Explaining the formation of teacher’s leader perceptions.
________________________________________________________________ From “Explaining variation in teacher’s perceptions of principal’s leadership: A replication”, by Leithwood, K. and Jantzi, D. 1997. Journal of Educational Administration, 35, 4, pp312-331.
Alterable in school conditions
Recognition-based processes
Teachers’ Leader Prototypes
Perceptions of leader
Alterable in school conditions
Inference-based processes
UUnniivveerrssiittyy ooff PPrreettoorriiaa eettdd –– LLaakkaa--MMaatthheebbuullaa,, MM RR ((22000044))
76
In this replication study, they found that personal characteristics like the
teachers’s gender, age, length of experience, tenure in school and level in
school, and the leader’s age and gender as well as the school size have an
influence on both recognition-based processes and inference-based processes,
perceptions of teachers and the teacher’s leader prototypes. Leithwood and
Jantzi (1999a) also showed that transformational leadership had strong
significant direct effects on organizational conditions. In a replication study,
Leithwood and Jantzi (1999b) confirmed their earlier results. Considering these
results, it is reasonable for one to assume that transformational leadership and
transactional leadership within higher education institutions might be associated
with desirable outcomes such as trust and organizational commitment.
Other authors who also believe that leadership is essential in educational
institutions include Rowley (1997) and Ogshabeni (2001). Rowley (1997) argues
that the type of leadership exercised in academic institutions, which is academic
leadership, is unique to higher education. He indicates that this leadership
extends beyond the organization into the wider community served by higher
education and is central to academic excellence. Such leadership is important in
managers at all levels in higher education and is not only vested in top
management.
Ogshabemi (2001) looked at the level of satisfaction that academics
derive from the behaviour of their line managers. Line managers in higher
education could be a head of department, a dean of a faculty, a director of a
school or unit, or the Vice Chancellor of the institution. He found that
approximately half (52.4%) of university teachers are satisfied with the behaviour
of their line managers while about a third (34.4%) are dissatisfied. Through
regression analysis, he found that age and the length of service in higher
education were important in explaining an academic’s satisfaction or
dissatisfaction with the behaviour of their line managers.
The literature review on leadership in academic institutions indicates that
leadership is as essential as it is in other organizations and that it has an
influence on employee’s work attitudes.
UUnniivveerrssiittyy ooff PPrreettoorriiaa eettdd –– LLaakkaa--MMaatthheebbuullaa,, MM RR ((22000044))
77
2.4.6. Leadership behaviour and Organizational commitment
According to Stum (1999), employee commitment reflects the quality of an
organization’s leadership. Therefore it is logical to assume that leadership
behaviour would have a significant relationship with the development of
organizational commitment. Managerial research suggests a positive direct
relationship between leadership behaviours and organizational commitment.
Transformational leadership is generally associated with desired
organizational outcomes such as the willingness of followers to expend extra
effort (Bass, 1985; Bass, Waldman, Avolio & Bebb, 1987; Yammarino & Bass,
1990). A willingness to expend extra effort indicates some degree of
commitment. Contingent reward behaviours that represent transactional
leadership have been found to be reasonably associated with performance and
work attitudes of followers although at a lower level than transformational
leadership behaviours (Bass, 1990a; Bass & Avolio, 1990a).
A relationship between commitment and leadership style has been
reported in the organizational and management literature. Billingsley and Cross
(1992) reported a positive relationship between leader support and commitment.
Tao et al. (1998) also found that supervisory behaviour predicted internalisation
(R2 = .180, p <.01). In three separate studies, Popper, Mayseless and
Castelnovo (2000) found evidence to support the hypothesis that a positive
correlation existed between transformational leadership and attachment
Podsakoff, MacKenzie, and Bommer (1996) found that leadership behaviours
explained 48% of the variance in organizational commitment and 55% of trust.
Authors like Kent and Chelladurai (2001) took the analysis further and
looked at the correlation between the different aspects of transformational
leadership and organizational commitment. These authors found that
individualized consideration has positive correlations with both affective
commitment (r = .475, p < .001) and normative commitment (r = .354, p < .001).

UUnniivveerrssiittyy ooff PPrreettoorriiaa eettdd –– LLaakkaa--MMaatthheebbuullaa,, MM RR ((22000044))
78
They also found positive correlations between intellectual stimulation and both
affective commitment (r = .487, p < .001) and normative commitment (r = .292, p
< .05).
The positive relationship between leadership behaviour and organizational
commitment was found even in non-western populations. Chiok Foong Loke
(2001) studied the effect of leadership behaviours on employee outcomes in
Singapore. A high, positive significant correlation was shown among
organizational commitment and leadership behaviours. The Person Product
correlations ranged from .60 for enabling others to act and inspiring a shared
vision to .84 for enabling others to act and modelling the way.
2.5 TRUST IN ORGANIZATIONS
2.5.1. Introduction
Organizational scholars have believed for some time that trust has a
number of important benefits for organizations and their members (Carnevale
and Wechsler, 1992; McCauley & Kuhnert, 1992; Mayer et al., 1995). According
to Carnevale and Wechsler (1992) trust provides a basis for security and
confidence in the intentions and actions of supervisors, managers and
organizational leaders. This idea is reflected in most theoretical treatments of
trust and its effects on workplace attitudes, behaviours and performance
(Kramer, 1999; Dirks & Ferrin, 2001). Dirks & Ferrin (2001) argue that trust
results in effects such as more positive attitudes, higher levels of cooperation and
other forms of workplace behaviour and superior levels of performance.
Although organizational researchers have devoted a significant amount of
attention to examining the numerous potential benefits of trust, they have
devoted less attention to examining the different dimensions of trust as well as
ways in which trust elicits the benefits. It is therefore important that the
UUnniivveerrssiittyy ooff PPrreettoorriiaa eettdd –– LLaakkaa--MMaatthheebbuullaa,, MM RR ((22000044))
79
dimensions of trust within organizations are first understood before we can study
their links with other organizational outcomes. In this section, we will therefore
start by reviewing what the literature has to say about the different dimensions of
trust within organizations, the organizational bases of trust and then look at the
relationship of trust and organizational commitment.
2.5.2. Dimensions of trust within organizations
The conceptualisation of the construct and its dimensions is certainly one
of the most controversial issues in the studies about trust. The conceptualisation
of the concept of trust in the literature has in the beginning been one-
dimensional. Among the authors who have proposed a multidimensional
definition of trust, Moorman, Zaltman and Deshpande (1992) identify cognitive
and behavioural dimensions of trust. The cognitive dimension consists of the
belief in the partner’s reliability or credibility, which comes from his motivation
and knowledge. These dimensions are similar to those described by Ganesan
(1994). Ganesan (1994) proposes two dimensions of trust: credibility, which
depend on the trustor’s belief that the trusted has the required expertise to carry
out his/her role effectively and reliably and benevolence, which is based on the
trustor’s belief that the supplier acts on the basis of intentions that are beneficial
to the trustor. The behavioural dimension of trust is concerned with the act of
placing trust in another and implies vulnerability and uncertainty on the part of the
trustor (Moorman et al., 1992).
Researchers who make a distinction on the cognitive and affective
aspects of trust suggest that trust is based on both knowledge (cognitive-based
trust) and feelings or emotions (affect-based trust) that the trustor has in dealing
with the trustee (MacAllister, 1995). Those researchers who approach trust in
terms of trustworthiness or the degree to which a subject perceives his partner as
trustworthy, hold that perceived trustworthiness and trusting behaviour are
respectively a determinant and a consequence of trust (Mayer et al., 1995).

UUnniivveerrssiittyy ooff PPrreettoorriiaa eettdd –– LLaakkaa--MMaatthheebbuullaa,, MM RR ((22000044))
80
Three factors are assumed to lead a subject to consider a partner trustworthy.
These are: ability, which relates to the partner’s competence to supply what the
trustor expects; integrity, which relates to the fact that the partner is guided by
principles accepted to the trustor; benevolence, which relates to the intention of
the trustee to do his best for the trustor.
Rousseau et al. (1998) propose a cross-disciplinary conceptual definition
of trust that defines trust as a psychological state comprising the intention to
accept vulnerability based upon positive expectations of the intentions or
behaviour of another. When conceptualised as a psychological state, trust has
been defined in terms of several dimensions (McCauley & Kuhnert, 1992;
McAllister, 1995; Kramer, 1999). McCauley and Kuhnert (1992) describe trust as
a multidimensional variable. They also distinguish between lateral and vertical
trust. Lateral trust is trust relations among peers who share a similar work
situation while vertical trust refers to trust relations between individuals and their
immediate supervisor, top management or the organization as a whole.
McAllister (1995) suggests that interpersonal trust can be categorized into
two different dimensions: effective and cognitive. Cognitive forms of trust reflect
issues such as the integrity or capability of another party. Affective forms of trust
reflect a special relationship with the party that may cause the referent to
demonstrate concern about one’s welfare and a feeling of benevolence. In
addition, to the affective and cognitive aspects of trust, researchers have
described the rational and the relational aspects of trust (Kramer, 1999). The
rational approach posits that the choice to trust depends on a conscious
calculation of advantages. This approach includes two central elements: the
knowledge that enables a person to trust another and the incentives for the
trusted person to honour or fulfil that trust. The relational approach of trust
suggest that trust has both a calculative orientation toward risk and a social
orientation toward other people and society as a whole. This approach implicates
a variety of organizational structures such as networks and governance systems
in the emergence and diffusion of trust within organizations.

UUnniivveerrssiittyy ooff PPrreettoorriiaa eettdd –– LLaakkaa--MMaatthheebbuullaa,, MM RR ((22000044))
81
2.5.3. Referents of trust within organizations
Carnevale and Welchsler (1992) indicate that the foci of trust within an
organization can differ as employees can trust co-workers but not supervisors or
they can trust top management and not the work unit and each type of trust has
different outcomes. Dirks and Skarliski (2002) believe that it is just as important
to identify the exact referent of trust, as it is to identify the different dimensions of
trust. They argue that in order to effectively leverage the benefits of trust within
the workplace, there needs to be a better understanding of which referent/s may
be most relevant and important for eliciting such outcomes as performance,
organizational citizenship and organizational commitment. McCauley and
Kuhnert (1992) indicate that research can examine trust among peers, between
employee and supervisor, management and others. Accordingly, an employee
may trust his co-workers but distrust his supervisor or management. Dirks and
Skarliski (2002) agree with this and regard workplace referents of trust to include
supervisors, subordinates, co-workers and top managers.
McCauley and Kuhnert (1992) endorse the view that organizational
processes communicate top management’s attitude towards its employees. They
argue that employees monitor the organizational environment when assessing
whether to place trust in management. If the structures, roles and climate define
a trustworthy system employees will reciprocate trust relations communicated by
management. If on the other hand they reflect a lack of trust in employees by top
management employees will respond with distrust. The type of trust that is
bestowed on co-workers and immediate supervisors is often relationship and/or
character based (Dirks & Skarliski, 2002). Following the social exchange
principle, the relationship-based perspective implies that followers will reciprocate
benefits received, and that individuals will target their efforts to reciprocate
toward the source of the benefit received.
Tan and Tan (2000) emphasise the importance of distinguishing the
referents of trust within an organization. They argue that trust in the supervisor
and trust in the organization, are two distinct but related constructs, each with its

UUnniivveerrssiittyy ooff PPrreettoorriiaa eettdd –– LLaakkaa--MMaatthheebbuullaa,, MM RR ((22000044))
82
own antecedents and outcomes. Their study showed that although trust in
supervisor and trust in organization were positively and significantly correlated,
trust in supervisor was more strongly associated with variables such as ability,
benevolence, and the integrity of the supervisor, whereas trust in organization
was more strongly correlated with global variables such as perceived
organizational support and justice.
Reciprocating trust in one’s immediate leader may also be related to job-
related outcomes such as increasing job performance or engaging in citizenship
behaviours (Dirks & Ferrin, 2000). For example, employees might give extra time
to fulfil supervisor requests or may engage in helping behaviour such as staying
late to help a supervisor or co-worker due to social exchange process involving a
supervisor. In contrast, trust in senior leadership may involve reciprocating to that
referent with high commitment to the organization. The character-based
perspective, with its concerns on integrity, reliability and honesty of specific
leaders would also suggest that understanding which referent is trusted will
predict the response or concern toward a specific individual.
Dirks and Skarliski (2002) caution against researchers focusing solely on
trust in supervisor at the expense of other important referents. They argue that
exploring trust from the viewpoint of colleagues is very important in the growing
presence of lateral relationships within organizations. Workplaces have become
more reliant on teams or work groups that make it important for researchers to
focus on exchanges between co-workers. Trust in co-workers might also have
work related benefits such as exchanges of information with co-workers and
helping co-workers in need.

UUnniivveerrssiittyy ooff PPrreettoorriiaa eettdd –– LLaakkaa--MMaatthheebbuullaa,, MM RR ((22000044))
83
2.5.4. Bases of trust within organizations
Researchers have spent considerable effort in identifying the bases of
trust within organizations (McCauley & Kuhnert, 1992; Mayer et al., 1995;
Kramer, 1999). In a survey conducted at a large federal government training
organization, McCauley & Kuhnert (1992) found that job/relational variables such
as participation in decision-making, autonomy, feedback, supportive supervisor
behaviour and communication can significantly explain trust in management (r =
.70, p < .001). They also showed that system wide variables such as professional
development, job security, and performance appraisal, do add a significant
explanation (r = .76, p < .001) beyond that provided by relational variables.
Antecedent conditions that promote the emergence of trust include
psychological, social and organizational factors that influence individual
expectations about others’ trustworthiness and their willingness to engage in
trusting behaviour when interacting with them. The organizational factors that
have been associated with the development of trust include the HRM policies
practiced in the organization and the leadership within the organization (Whitener
et al., 1998).
2.5.5. HRM practices and trust
The levels of trust within an organization can influence the successful
implementation of the HRM practices (Whitener, 1997). Therefore, the
effectiveness and success of the HRM policies and practices will be dependent
on the employee’s trust of the management in the organization (Whitener, 1997).
At the same time, human resources management (HRM) practices like training
and development, promotions, compensation, job security, recruitment and
selection and performance evaluation have been shown to affect the
development of trust (Whitener, 2001). Employee’s trust will affect their
perception of the accuracy and fairness of the HRM practices. Employees are

UUnniivveerrssiittyy ooff PPrreettoorriiaa eettdd –– LLaakkaa--MMaatthheebbuullaa,, MM RR ((22000044))
84
concerned about the procedural and distributive justice and fairness of the HR
practices that determine outcomes such as promotion, rewards and training.
When the implementation of the practices is perceived to be procedurally fair and
the associated benefits are fairly distributed, HRM practices could have a positive
influence on the development of employees’ trust in the organization and
management.
2.5.6. Leadership style and trust
The importance of leadership style as an important organizational
characteristic that could also affect the development of trust cannot be over
emphasized. Trust has been identified as an important part of numerous
leadership theories. As a result, researchers spent effort in an attempt to identify
leadership characteristics that can instil trust. Researchers have shown that
transformational and charismatic leaders built trust in their followers (Podsakoff,
Mackenzie, Moorman & Fetter, 1990). According to several researchers,
transformational leaders engage in actions that gain the trust of their followers
(Podsakoff et al., 1990). Bennis and Goldsmith (1994), describe the
characteristics of leaders who can establish trust as vision, empathy, consistency
and integrity. These authors also indicate that leaders generate and sustain trust
by acting in ways that produce constancy, congruity, reliability and integrity.
According to Bennis and Townsend (1995) these are four essential
characteristics of the leader who are likely to develop trust in the organization.
Kerfoot (1998) adds to these characteristics, four other characteristics that
include availability, accessibility, communicating with candour and a willingness
to invest.
The identification of leadership characteristics does not fully explain the
relationship between trust and leadership. Several researchers have put forward
some explanations. Podsakoff et al. (1990) showed that trust, conceptualised as
faith in and loyalty to the leader, was directly related to transformational

UUnniivveerrssiittyy ooff PPrreettoorriiaa eettdd –– LLaakkaa--MMaatthheebbuullaa,, MM RR ((22000044))
85
leadership. Lewicki and Bunker (1996) argue that trust may result from a sense
of identification with the other's desires and intentions. The types of activities that
strengthen identification based trust include developing a collective identity,
creating joint products and goals, and committing to commonly shared values
(Lewicki & Bunker, 1996). Thus, transformational leaders may be able to build
mutual trust by developing a common vision that group members can collectively
identify with and pursue with the objective of creating joint products.
Mayer et al.’s (1995) model of trust is based on the perspective that
transformational leadership behaviours such as individual consideration,
intellectual stimulation and, individual motivation have an influence on the
development of trust. This model proposes that when followers believe their
leaders have integrity, capability or benevolence they become more comfortable
when engaging in behaviours that put them at risk. By treating each employee as
an individual and being attentive to their unique needs, capabilities and concerns
of each individual, a transformational leader would instil trust.
Tyler and Degoey (1996) argue that there is greater empirical support for
a relational model of trust between supervisors and subordinates than for an
instrumental model of trust. Trust is more likely to result when a social bond has
been created between a subordinate and his/her supervisor as it would in a
transformational relationship, than in the case where instrumental judgments are
more important as it is the case in a transactional relationship. Thus, based on
my review of past research, I feel it is more plausible to argue for direct and
partially mediated roles for trust as the best way to model its relationship with
transformational leadership.
Some researchers describe trust in leadership as operating according to a
social exchange process (Whitener, et al., 1998). Whitener et al. (1998) assert
that manager’s actions and behaviours provide the foundation for trust. Using the
relational perspective, they propose five types of leader behaviour that have an
influence on trust. These include behavioural consistency, behavioural integrity,
participative decision-making, communication and demonstrating concern.
According to this perspective, followers see their relationship with their leaders as

UUnniivveerrssiittyy ooff PPrreettoorriiaa eettdd –– LLaakkaa--MMaatthheebbuullaa,, MM RR ((22000044))
86
beyond the basic economic contract such that the parties operate based on trust,
goodwill and perceptions of mutual obligations. Issues of care and consideration
in the relationship are central to such relationships. Individuals who feel that their
leader has or will demonstrate care and consideration tend to reciprocate this
sentiment in the form of behaviour desired by their leader.
Researchers have used this perspective in describing the operation of
transformational leadership and trust (Pillai, Schriesheim, & Williams, 1999).
Pillai et al. (1999) suggest that transformational leaders may operate by
establishing social exchange relationships with followers. Fairholm and Fairholm
(1999) also believe that leaders can lead effectively in a united and harmonious
environment characterized by trust. They argue that in such an environment the
leader and subordinate are able to trust each other enough to trust the purposes,
actions, and intentions of each other and others which will enable them to further
the goals of the organization.
According to Bass (1999) in today’s cynical world trust in leadership is
required for willingness to identify with the organization and to internalise its
values. For this, transformational leadership is required along with corresponding
HRM policies and practices in the selection, training, and development of the
employees. Transformational leaders build trust by demonstrating individualized
concern and respect for followers (Jung & Avolio, 2001). Arnold, Barling and
Kelloway (2001) also showed that transformational leadership increases trust
and organizational commitment. A hierarchical regression analysis found that
transformational leadership accounted for a significant contribution to trust (R2 =
.52, p < .05) and organizational commitment (R2 = .36, p < .05)
Existing research argues that the responsibility for building and
maintaining trust lies with the leader (Dirks & Ferrin, 2001; Dirks & Skarliski,
2002). Dirks and Ferrin (2001) have shown that trust in leadership has a
significant relationship with individual outcomes including job performance (r =
.16), organizational citizenship behaviour altruism (r =. 19), turnover intention (r =
.40), job satisfaction (r = .51), and organizational commitment (r = .49). They also
found that trust in supervisor was more strongly related to job level variables

UUnniivveerrssiittyy ooff PPrreettoorriiaa eettdd –– LLaakkaa--MMaatthheebbuullaa,, MM RR ((22000044))
87
whereas trust in senior leadership was more strongly related to organizational
level variables. For example, they found job performance to be related
significantly higher level with trust in supervisor (r =. 17) than with trust in senior
management (r =. 00). In contrast, organizational commitment was related at a
significantly higher level with trust in senior leadership (r = .57) than with trust in
supervisor (r = .44).
The findings of Dirks and Ferrin (2001) seem to confirm the significance of
the follower’s perceptions of leadership actions and styles. They report
substantial relationships between perceptions of leadership actions including
transformational leadership (r = .72), interactional justice (r = .65), participative
decision-making (r = .46), and failure to meet expectations of subordinates (r =
.40). These results indicate that trust in leadership appears to be associated with
well-established set of leadership actions and behaviours.
According to Dirks and Ferrin (2002), individuals observe leader’s actions
and draw inferences about the nature of their relationship with the leader and/or
the character of the leader. Employee’s trust in their leaders can also be
influenceed by level of perceived fairness or justice in the organizational
practices or decisions because the practices are seen as a signal of the nature of
the relationship with the leader and/or the character of the leader. Participative
decision making sends a message that the leader enacting the program has
confidence in and concern and respect for subordinates or it may influence
followers’ overall perceptions about the character of the leader (Dirks & Ferrin,
2002). Trust in organizational leadership may involve reciprocal action at the
organizational level with organizational outcomes such as organizational
commitment.
2.5.7. Studies of trust within academic organizations
That trust is critical to management–subordinate exchange cannot be
denied. It is therefore imperative that academic institutions managers gain and

UUnniivveerrssiittyy ooff PPrreettoorriiaa eettdd –– LLaakkaa--MMaatthheebbuullaa,, MM RR ((22000044))
88
maintain the trust of their faculty. As Pelton, Strutton and Rawwas (1994) explain,
the ability of academic managers to develop and preserve long-term, trusting
relationships with members of their faculty is a key component of the long-run
success of academic institutions. Within academic settings, faculty and
administrators are interrelated partners who are jointly responsible for all forms of
educational exchange. They often are dependent on each other to perform
successfully. It is therefore important that they agree on institutional goals, as
their ensuing attitudes about the institution and its educational mission are pivotal
to the character of the institution.
Several studies have provided empirical evidence of the importance of
trust within academic organizations. Driscoll (1978) have shown that trust in
organizational decision-making emerges as a predictor of satisfaction attitudes.
He found that organizational trust within a college of arts was strongly associated
with participation in decision making. He showed that organizational trust was
just as important as participation in decision making for faculty within an arts
college. His results showed that this importance was consistent within the
hierarchical levels of the college. Higher trust in each level is significantly
associated with both overall satisfaction and satisfaction with participation. Pelton
et al. (1994) studied the role of trust of faculty-administrators on faculty
performance.
Hoy and his colleagues have engaged in research on trust within schools.
According to their findings, trust of teachers in their colleagues and the principal
is an important element of trust within schools (Hoy, Tarter, & Witkoskie, 1992).
In addition, trust of colleagues and the principal by teachers is very important for
the effectiveness of the school (Tarter, Sabo & Hoy, 1995) as well as a positive
school climate (Hoy, Sabo & Barnes, 1996). More recently, Hoy, Smith and
Sweetland (2002) showed that aspects of teacher trust were related to positive
aspects of school climate. Teacher trust in colleagues was related to all aspects
of school climate (r = .27, p < .05), such as collegial leadership (r =. 44, p <. 01).
Taken together, the literature indicates that trust is important in academic
institutions and that it has an influence on the effectiveness of the institution.
UUnniivveerrssiittyy ooff PPrreettoorriiaa eettdd –– LLaakkaa--MMaatthheebbuullaa,, MM RR ((22000044))
89
2.5.8. Trust and organizational commitment
According to Mayer et al. (1995)’s model, individual’s beliefs about
another’s ability, benevolence and integrity, lead to a willingness to risk which
manifest in a variety of behaviours. Researchers have used this basic idea to
examine the main effects of trust on a variety of behavioural and performance
outcomes such as communication and information sharing, organizational
citizenship behaviour, effort,conflict, commitment, individual performance and
unit performance.
In two studies of British blue-collar workers, Cook and Wall (1980) found
that trust subscales correlate positively with organizational commitment
subscales. The overall correlation between trust and organizational commitment
was .56 (p< .0001), while faith in peers had a correlation of .30 with trust and of
.32 with organizational identification. Confidence in peers had a correlation of .23
with trust.
Trust in organizational authorities has been shown to influence a variety of
subordinate’s work attitudes and behaviour (Brockner, Siegel, Daly, Martin &
Tyler, 1997). Employees are supportive of or committed to authorities and the
institutions that the authorities represent, when trust is relatively high. Employees
committed to organizations are likely to be satisfied with their relationship with
the authorities, and willing to behave in ways that help to further the authorities
goals and by extension the goals of the organization. Brockner et al. (1997)
report that trust has a positive although non-significant effect on employee
commitment (r = .05).
Sashital, Berman, and Ilter (1998) conducted a study that analysed the
influence of trust of a manager by his/her superiors and subordinates on the
outcome of the manager’s performance evaluation. They found that the nature

UUnniivveerrssiittyy ooff PPrreettoorriiaa eettdd –– LLaakkaa--MMaatthheebbuullaa,, MM RR ((22000044))
90
and extent of trust developed by managers in their relationship with colleagues
and superiors appears to influence the way their performance is evaluated by
others. They found that superiors would evaluate a manager’s performance
favourably if they trust him.
Trust has been described in the literature as a variable that has direct
influence on work group processes and performance (Dirks, 1999). This implies
that when trust levels are high a group would experience superior group
processes such as higher levels of cooperation and higher performance. On the
other hand, when trust is decreased, a group will experience inferior group
processes and lower performance. Dirks (1999) argue that the effect of trust
does not necessarily have to be direct. He reckons that interpersonal trust could
influence group processes and performance indirectly through moderation. In this
role, trust moderates the relationship between other variables and group
performance.
Dirks and Ferrin (2001; 2002) have reviewed the consequences of trust in
leaders and other referents within organizations. They have found inconsistent
results with regard to trust and performance and behavioural variables and some
consistent evidence regarding trust and attitudinal variables. Most studies that
examine the relationship between trust and interpersonal behaviour are based on
the premise that trust affects how individuals behave towards one another (Dirks
& Ferrin, 2001). Trust is also linked to a number of attitudinal variables such as
organizational commitment (Dirks & Ferrin, 2002). Following the character-based
perspective, and the recognition that managers are responsible for many duties
that have a major effect on employee’s organizational commitment such as
performance evaluations, guidance and assistance with job responsibilities and
training, it can be assumed that employees would trust those managers whom
they regard as trustworthy in those activities. This idea implies that when
employees have high levels of trust in their leaders, they will also have higher
levels of organizational commitment. This idea seems to be supported by Dirks
and Ferrin (2002)’s meta-analytic findings that demonstrate a substantial
relationship between trust in leadership and organizational commitment (r =. 46).

UUnniivveerrssiittyy ooff PPrreettoorriiaa eettdd –– LLaakkaa--MMaatthheebbuullaa,, MM RR ((22000044))
91
2. 6 RESEARCH QUESTIONS
The researcher addressed the following questions:
Research question 1: What is the relationship between demographic variables
and organizational commitment?
Research question 2: What is the inter-relationship between organizational
commitment, HRM practices, leadership style, and
organizational trust?
Research question 3: To what degree do HRM practices predict organizational
commitment subscales and total organizational
commitment?
Research Question 4: Can a structural model be built to indicate the relationship
between organizational commitment, HRM practices,
leadership style and trust?
2.7 SUMMARY
In this chapter, the researcher aimed to provide an overview of the literature
regarding organizational commitment and variables that could lead to its
development. The literature review indicates that organizational commitment is
linked to various variables which include both personal variables such as age
and gender and organizational characteristics such as HRM practices, leadership
style and trust.

UUnniivveerrssiittyy ooff PPrreettoorriiaa eettdd –– LLaakkaa--MMaatthheebbuullaa,, MM RR ((22000044))
92
While each of the organizational factors, that is, leadership style, HRM
practices and trust, have been individually shown to be positively associated with
organizational commitment, studies examining the combined effect of these
factors are limited. Researchers also need to look at the relative effects of the
individual dimensions of leadership styles, individual HRM practices and
individual dimensions of trust on the different dimensions of organizational
commitment. Although transformational leadership may be an important
antecedent of trust, possible consequences of trust include commitment,
satisfaction, and citizenship behaviours (Whitener et al 1998). Commitment
entails a high level of identification with the organization's goals and values, a
willingness to exert extra effort for the benefit of the organization, and a strong
desire to maintain membership in the organization (Morrow, 1983). Both trust in
the leader and the organization, and commitment, are necessary for successful
attainment of the leader's vision. Research that would indicate the influence of
the different leadership styles, which is transformational, transactional and
laissez-faire leadership, on the different types of organizational commitment
would be enlightening.
Organizations with high trust cultures have distinct managerial
communication practices that will encourage organizational commitment
(Mayfield & Mayfield, 2002). Leadership styles and HRM practices would
probably have interactive influence with each other. That means that HRM
practices and leadership styles can be mutually supportive. For example,
transformational leadership, which involves intellectual stimulation, would be
supportive of HRM practices that promote employee training and development.
At the same time, the presence of HRM practices that promote employee
development would enable a leader to practice transformational behaviours.
The previous review of the literature allows us to formulate a hypothesised
model of the relationship between organizational commitment, HRM practices,
leadership styles and trust. This hypothesised model is shown in Figure 1.1 in
page 10. Testing the model will help us to understand the relationship of the
variables in the study. The model includes the multiple dimensions of the

UUnniivveerrssiittyy ooff PPrreettoorriiaa eettdd –– LLaakkaa--MMaatthheebbuullaa,, MM RR ((22000044))
93
variables studied. The three dimensions of organizational commitment, that is,
affective, normative and continuance aspects are included. Selective staffing,
comprehensive training, job security, equitable rewards, information sharing,
promotions, employee participation and developmental performance appraisals
were included in HRM practices. Trust dimensions included in the study were
trust in co-workers, trust in leadership and trust in the organization. Leadership
styles such as transformational style, transactional and laissez faire were
included.
Even though not included in the model demographic factors might also
affect organizational commitment. The respondent’s age, gender, level of
education, language, and tenure and the relationship with organizational
commitment will be investigated in the current study
UUnniivveerrssiittyy ooff PPrreettoorriiaa eettdd –– LLaakkaa--MMaatthheebbuullaa,, MM RR ((22000044))
94
CHAPTER THREE: RESEARCH METHODOLOGY
3.1 INTRODUCTION
The purpose of this chapter is to address the methods used in this study.
Items that will be addressed include the research design, population and sample,
instrumentation, reliability and validity of the instrumentation, scoring techniques,
data-gathering procedures, and the method of statistical analysis.
3.2 RESEARCH DESIGN
The survey design is regarded as the most appropriate research design to
measure the perceptions of the respondents in this study. A survey is the most
appropriate research design as it can enable the researcher to collect information
from a large population. The information obtained from the sample can then be
generalized to an entire population (Kerlinger & Lee, 2000). Survey research is
usually a quantitative method that requires standardized information in order to
define or describe variables or to study the relationships between variables.
Surveys generally fall into one of two categories, descriptive or relational
(Rungtusanatham, Choi, Hollingsworth, Wu & Forza, 2003). Descriptive surveys
are designed to provide a snapshot of the current state of affairs while relational
surveys are deigned to empirically examine relationships among two or more
constructs either in an exploratory or in a confirmatory manner. The current study
is a relational survey that seeks to explore the relationship between
organizational commitment, HRM practices, organizational trust, and leadership
behaviour.
UUnniivveerrssiittyy ooff PPrreettoorriiaa eettdd –– LLaakkaa--MMaatthheebbuullaa,, MM RR ((22000044))
95
3.3 PARTICIPANTS
Population: The population for this study is academic staff members of
higher education institutions in South Africa. There are 36 higher education
institutions in South Africa, which consist of 15 Technikons and 21 universities.
Because of the binary system of higher education in South Africa as well as the
legacy of the apartheid policies respondents were asked to indicate whether their
institution is a Technikon or a University. Technikons are higher education
institutions that focus on providing career-oriented training with an emphasis on
experiential training incorporated in the curriculum. The Technikon was coded as
1 and University as 2. These institutions were then distinguished into either a
previously disadvantaged or advantaged Technikon or University. Previously
disadvantaged institutions served the black community and did not receive the
same degree of government subsidy as the previously advantaged institutions,
which served the white community.
In the present study, all employees of South African higher education
institutions made up the study population. With 36 institutions, each with at least
300 staff members, the research population would be in excess of 10000. It
would be almost impossible to reach all employees of all 36 institutions. As a
result, it was necessary to sample the population. As the results will be
generalized, it is essential that the sample should ideally be representative of all
the employees of higher education institutions. The sampling frame was decided
to include only those employees within these institutions who have some
“professional” status or training with professional being defined as someone who
has received specialized training for his work. Employees involved in unskilled
labour such as cleaners and gardeners were excluded. Employees included in
the sampling frame were academics (which included lecturing staff irrespective of
post level) and non-academics which included technical support staff like
computer technicians, laboratory technicians, professional practitioners like
librarians, researchers and administrative support staff like administration
officers, secretaries and others in similar positions.

UUnniivveerrssiittyy ooff PPrreettoorriiaa eettdd –– LLaakkaa--MMaatthheebbuullaa,, MM RR ((22000044))
96
The Sample: As it was not possible to reach all employees of the higher
education institutions that participated in the study because of the geographical
dispersion of the institutions and the large population, it was decided to use the
convenience sampling method to obtain the study sample. A convenience
sample was obtained by requesting someone within an institution to distribute
and collect questionnaires within a faculty/department. The lead contact person
was given instructions to distribute the questionnaires to at least one person in
the positions specified in the sampling frame. The lead contact person
approached the potential participants and only issued a questionnaire if the
individual agreed to participate. Only full time employees were asked to complete
the questionnaire. The sampling process is illustrated in Figure 3.1.
Courier services were used to send questionnaires to the lead contact
persons. Eight hundred and fifty (850) questionnaires were sent out to the eleven
institutions that agreed to participate. The returned number of questionnaires was
255 (30%). Of these, nine (3.5%) were not usable, as several items were not
answered. This brought the response rate to 28.9% (N = 246). The sample
included employees from five (5) Technikons and six (6) Universities. Most of the
respondents were Technikon employees at 167 (70.19 %) while 71 (29.283%)
participants were from Universities.
Respondent’s characteristics: The biographical characteristics of the
sample of respondents are presented in order to get a clear picture of the
sample. Demographic information of the respondents is given in tabular form.
Demographic variables that were measured from the respondents were as
follows:
• Age • Gender • Level of education • Current position at work • Total number of years in an academic
institution • Number of years with
current institution • Number of years in current position • Current home language and mother
tongue
• Frequency of involvement in decision-making meetings

UUnniivveerrssiittyy ooff PPrreettoorriiaa eettdd –– LLaakkaa--MMaatthheebbuullaa,, MM RR ((22000044))
97
Figure 3.1. From population to sample: the process followed in obtaining the
sample.
________________________________________________________________ Note: the numbers in brackets represent the number of institutions.
Population: All employees of higher education institutions in South Africa (36).
Write a letter requesting permission to use employees as respondents.
Permission granted (11).
Permission not granted.
No further action taken.
Approach Dean of Faculty/Director of school/unit.
Appoint a lead contact person.
Sample unit: All employees within Faculties that agreed to participate.
Population: All employees within institutions that agreed to participate (11).
Distribute questionnaires according to sampling frame
Sampling frame: all employees at the level of Dean, HOD, academic, technical support, administrative support, researcher, and professional practitioner.
Subjects. Completed questionnaires collected
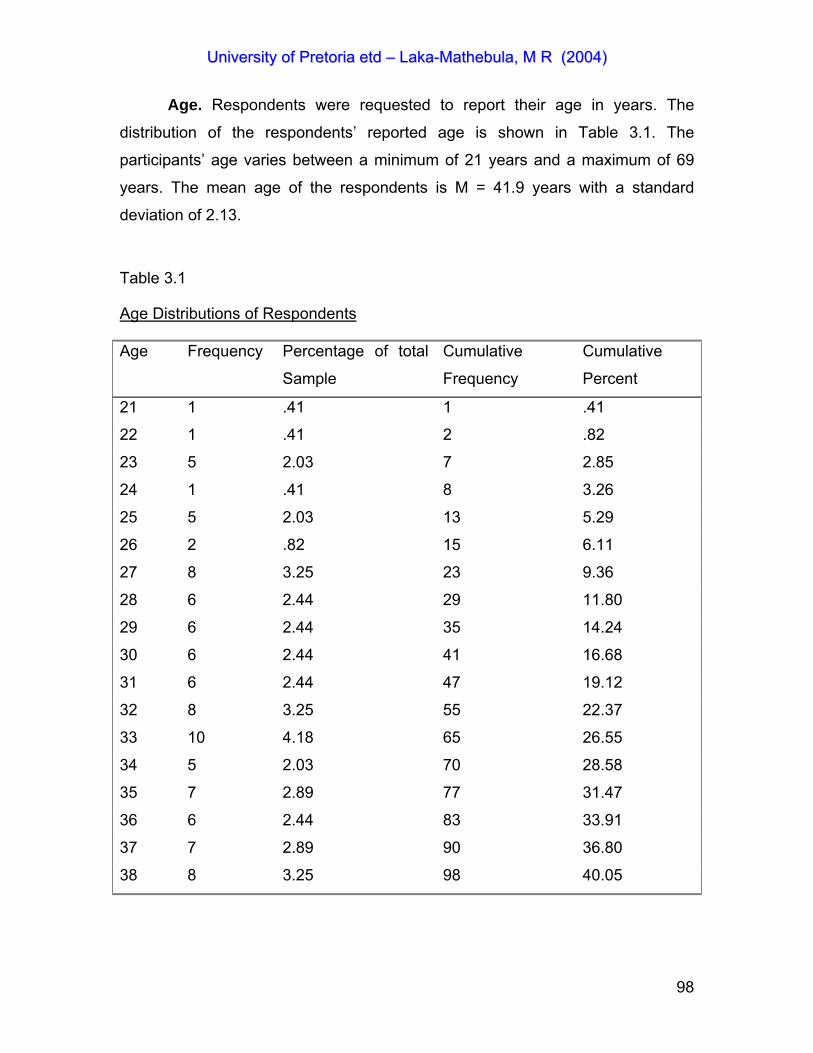
UUnniivveerrssiittyy ooff PPrreettoorriiaa eettdd –– LLaakkaa--MMaatthheebbuullaa,, MM RR ((22000044))
98
Age. Respondents were requested to report their age in years. The
distribution of the respondents’ reported age is shown in Table 3.1. The
participants’ age varies between a minimum of 21 years and a maximum of 69
years. The mean age of the respondents is M = 41.9 years with a standard
deviation of 2.13.
Table 3.1
Age Distributions of Respondents
Age Frequency Percentage of total
Sample
Cumulative
Frequency
Cumulative
Percent
21 1 .41 1 .41
22 1 .41 2 .82
23 5 2.03 7 2.85
24 1 .41 8 3.26
25 5 2.03 13 5.29
26 2 .82 15 6.11
27 8 3.25 23 9.36
28 6 2.44 29 11.80
29 6 2.44 35 14.24
30 6 2.44 41 16.68
31 6 2.44 47 19.12
32 8 3.25 55 22.37
33 10 4.18 65 26.55
34 5 2.03 70 28.58
35 7 2.89 77 31.47
36 6 2.44 83 33.91
37 7 2.89 90 36.80
38 8 3.25 98 40.05

UUnniivveerrssiittyy ooff PPrreettoorriiaa eettdd –– LLaakkaa--MMaatthheebbuullaa,, MM RR ((22000044))
99
Table 3.1 (Continued) Age distribution of respondents Age Frequency Percentage of total
Sample
Cumulative
Frequency
Cumulative
Percent
39 8 3.25 106 43.30
40 8 3.25 114 46.55
41 4 1.62 118 48.17
42 16 6.50 134 54.67
43 10 4.18 144 58.85
44 6 2.44 150 61.29
45 9 3.66 159 64.95
46 7 2.89 166 67.84
47 4 1.62 170 69.46
48 7 2.89 177 72.35
49 1 .41 178 72.76
50 13 5.28 191 78.04
51 3 1.21 194 79.25
52 7 2.89 201 82.14
53 9 3.66 210 85.80
54 2 .82 212 86.62
55 6 2.44 218 89.06
56 3 1.21 221 90.27
57 4 1.62 225 91.89
58 6 2.44 231 94.33
59 3 1.21 234 95.54
60 1 .41 235 95.95
62 2 .82 237 96.77
67 1 .41 238 97.18
69 1 .41 239 97.59
Unknown 7 2.89 246 100.00

UUnniivveerrssiittyy ooff PPrreettoorriiaa eettdd –– LLaakkaa--MMaatthheebbuullaa,, MM RR ((22000044))
100
The respondents were classified into five age groups as indicated in Table
3.2. The largest single group (31.31%) of respondents are between the ages of
41 and 50, 29.67% are between 31 and 40 years. Respondents in the age group
51 to 60 years made up 18.29 % of the sample while those between 21 and 30
years made up 16.67 %. A small fraction of the sample (1.63%) is above 60
years of age.
Table 3.2
A Distribution of Respondent’s Ages into Age Groups
Age Frequency Percentage of
total Sample
Cumulative
Frequency
Cumulative
Percent
21-30 41 16.67 41 16.67
31-40 73 29.67 114 46.34
41-50 77 31.31 191 77.65
51-60 45 18.29 236 95.94
Above 60 4 1.63 239 97.57
Unknown 7 2.85 246 100.00
Gender. Respondents were asked to state their gender. The gender
distribution of the respondents is shown in Table 3.3. The majority of the
respondents are male (n=133) representing 54.51 % of the sample. Females
made up 45.12% of the sample.
Table 3.3
Respondents’ Gender
Gender Frequency Percentage Cumulative
Frequency
Cumulative
Percent
Male 133 54.51 133 54.41
Female 111 45.12 244 99.53
Unknown 2 .81 246 100.00
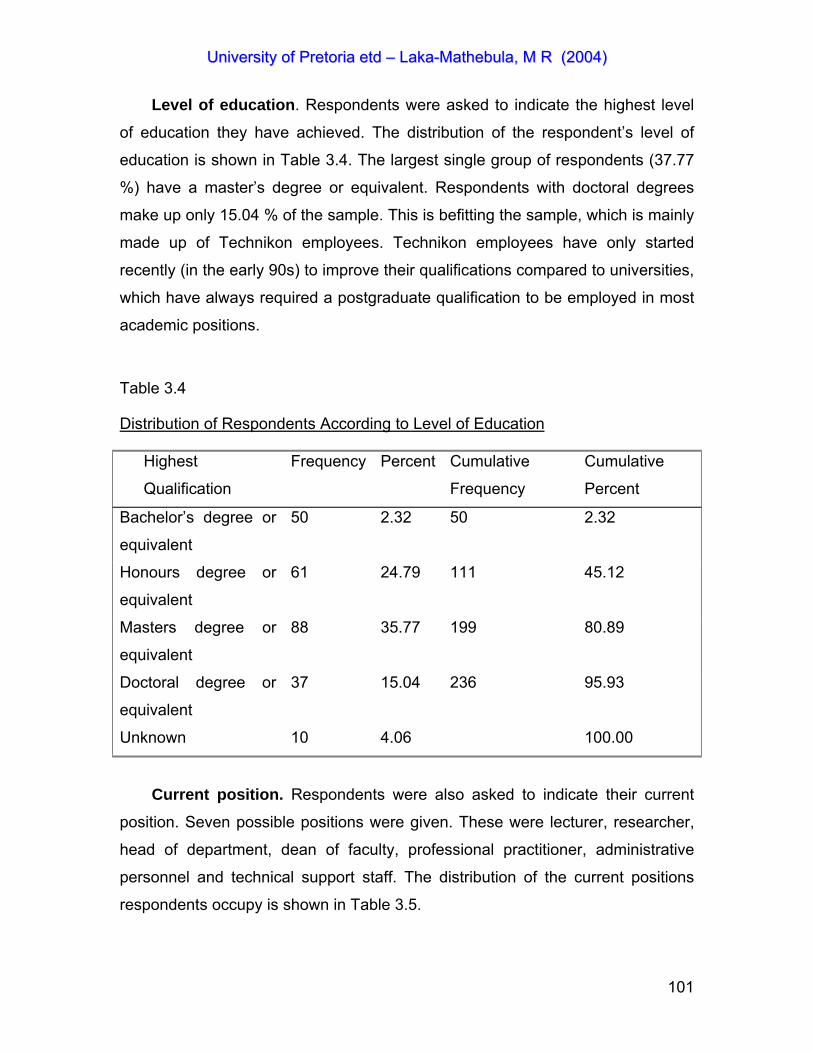
UUnniivveerrssiittyy ooff PPrreettoorriiaa eettdd –– LLaakkaa--MMaatthheebbuullaa,, MM RR ((22000044))
101
Level of education. Respondents were asked to indicate the highest level
of education they have achieved. The distribution of the respondent’s level of
education is shown in Table 3.4. The largest single group of respondents (37.77
%) have a master’s degree or equivalent. Respondents with doctoral degrees
make up only 15.04 % of the sample. This is befitting the sample, which is mainly
made up of Technikon employees. Technikon employees have only started
recently (in the early 90s) to improve their qualifications compared to universities,
which have always required a postgraduate qualification to be employed in most
academic positions.
Table 3.4
Distribution of Respondents According to Level of Education
Highest
Qualification
Frequency Percent Cumulative
Frequency
Cumulative
Percent
Bachelor’s degree or
equivalent
50 2.32 50 2.32
Honours degree or
equivalent
61 24.79 111 45.12
Masters degree or
equivalent
88 35.77 199 80.89
Doctoral degree or
equivalent
37 15.04 236 95.93
Unknown 10 4.06 100.00
Current position. Respondents were also asked to indicate their current
position. Seven possible positions were given. These were lecturer, researcher,
head of department, dean of faculty, professional practitioner, administrative
personnel and technical support staff. The distribution of the current positions
respondents occupy is shown in Table 3.5.

UUnniivveerrssiittyy ooff PPrreettoorriiaa eettdd –– LLaakkaa--MMaatthheebbuullaa,, MM RR ((22000044))
102
Table 3.5
Distribution of Respondents Per Current Position
Level of position Frequency Percentage Cumulative
Frequency
Cumulative
Percent
Lecturer 154 62.60 154 62.60
Researcher 9 3.66 163 66.26
Head of
Department
36 14.63 199 80.89
Dean 6 2.44 205 83.33
Professional
practitioner
6 2.44 211 85.77
Administrative
personnel
26 1.56 237 96.33
Technical support
staff
5 2.03 242 98.36
Unknown 4 1.62 246 100.00
Approximately sixty-three (62.60%) percent of respondents are in a lecturing
position, 3.66% are researchers, 14.63% Heads of Departments, 2.44% Deans,
2.44% professional practitioners, 1.56 % administrative personnel and 2.03%
Technical support staff. Overall, 83.33 % are academics and 16.67% non-
academics.
Number of years working in an academic institution. Respondents
were asked to report on the total number of years they have worked in an
academic institution. Figures reported in months were rounded off to the nearest
year. The distribution of the respondent’s number of years in an academic
institution is shown in Table 3.6. The number of years in an academic
environment ranged from 1 year to 37 years.

UUnniivveerrssiittyy ooff PPrreettoorriiaa eettdd –– LLaakkaa--MMaatthheebbuullaa,, MM RR ((22000044))
103
Table 3.6
Distribution of Respondents Per Number of Years Spent in an Academic
Institution
Number of years in an
academic institution
Frequency Percentage Cumulative
Frequency
Cumulative
Percent
1 7 2.85 7 2.85
2 15 6.09 22 8.94
3 15 6.09 37 15.03
4 12 4.87 49 19.90
5 11 4.47 60 24.37
6 15 6.09 75 30.46
7 11 4.47 86 34.93
8 20 8.13 106 43.06
9 8 3.25 114 46.31
10 20 8.13 134 54.44
11 5 2.03 139 56.47
12 7 2.85 146 59.31
13 7 2.85 153 62.16
14 5 2.03 158 64.19
15 6 2.44 164 66.63
16 3 1.21 167 67.84
17 4 1.62 171 69.46
18 7 2.85 178 72.31
19 3 1.21 181 73.52
20 17 6.91 198 80.43
21 4 1.62 202 82.05
22 8 3.25 210 85.30
23 3 1.21 213 86.51
24 3 1.21 216 87.72
25 7 2.85 223 90.57

UUnniivveerrssiittyy ooff PPrreettoorriiaa eettdd –– LLaakkaa--MMaatthheebbuullaa,, MM RR ((22000044))
104
Table 3.6 (continued) Number of Years Spent in an Academic Institution Number of years in an
academic institution
Frequency Percentage Cumulative
Frequency
Cumulative
Percent
26 2 .82 225 91.39
27 2 .82 227 92.21
28 1 .41 228 92.62
29 1 .41 229 93.03
30 3 1.21 232 94.24
31 1 .41 233 94.65
32 1 .41 234 95.06
34 1 .41 235 95.47
35 3 1.21 238 96.68
37 1 .41 239 97.15
Unknown 7 2.85 246 100.00
The number of years that respondents spent in an academic environment
was then categorised into five groups with an interval of five years in between as
shown in Table 3.7
Table 3.7
Number of Years in Academic Environment Per Category
Number of years in
academic environment
Frequency Percent Cumulative
Frequency
Cumulative
Percent
1-5 60 24.39 60 24.39
6-10 74 30.08 134 54.47
11-15 30 12.19 164 66.66
16-20 34 13.82 198 80.48
More than 20 41 16.67 239 97.15
Unknown 7 2.85 246 100.00
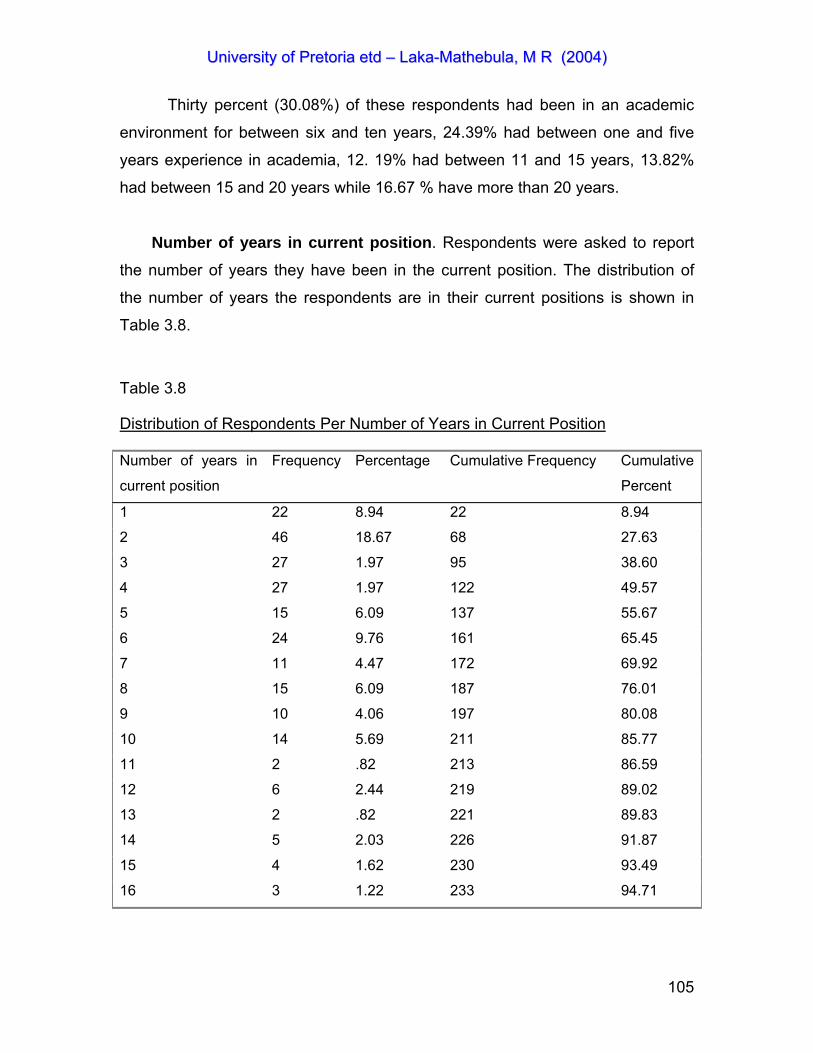
UUnniivveerrssiittyy ooff PPrreettoorriiaa eettdd –– LLaakkaa--MMaatthheebbuullaa,, MM RR ((22000044))
105
Thirty percent (30.08%) of these respondents had been in an academic
environment for between six and ten years, 24.39% had between one and five
years experience in academia, 12. 19% had between 11 and 15 years, 13.82%
had between 15 and 20 years while 16.67 % have more than 20 years.
Number of years in current position. Respondents were asked to report
the number of years they have been in the current position. The distribution of
the number of years the respondents are in their current positions is shown in
Table 3.8.
Table 3.8
Distribution of Respondents Per Number of Years in Current Position
Number of years in
current position
Frequency Percentage Cumulative Frequency Cumulative
Percent
1 22 8.94 22 8.94
2 46 18.67 68 27.63
3 27 1.97 95 38.60
4 27 1.97 122 49.57
5 15 6.09 137 55.67
6 24 9.76 161 65.45
7 11 4.47 172 69.92
8 15 6.09 187 76.01
9 10 4.06 197 80.08
10 14 5.69 211 85.77
11 2 .82 213 86.59
12 6 2.44 219 89.02
13 2 .82 221 89.83
14 5 2.03 226 91.87
15 4 1.62 230 93.49
16 3 1.22 233 94.71

UUnniivveerrssiittyy ooff PPrreettoorriiaa eettdd –– LLaakkaa--MMaatthheebbuullaa,, MM RR ((22000044))
106
Table 3.8 (continued)
Distribution of Respondents Per Number of Years in Current Position Number of years in
current position
Frequency Percentage Cumulative Frequency Cumulative
Percent
17 3 1.22 236 95.93
18 2 .82 238 96.74
19 1 .41 239 97.15
23 2 .82 241 97.96
25 1 .41 242 98.37
27 1 .41 243 98.78
Unknown 3 1.22 246 100.00
The respondents were grouped into categories according to the number of
years they are in the current position. The distribution of respondents per
category of number of years in their current positions is shown in Table 3.9.
Table 3.9
Distribution of Respondents Per Number of Years in Current Position Per
Category
Number of years in
current position
Frequency Percent Cumulative
Frequency
Cumulative
Percent
1-5 137 55.69 137 55.69
6-10 74 30.08 211 85.77
11-15 19 7.72 230 93.49
16-20 9 3.65 239 97.15
More than 20 4 1.62 243 98.78
Unknown 3 1.22 246 100.00
The largest single group of respondents (55.69%). have been in their current
position for between 1 and 5 years. Those who have been in the current position
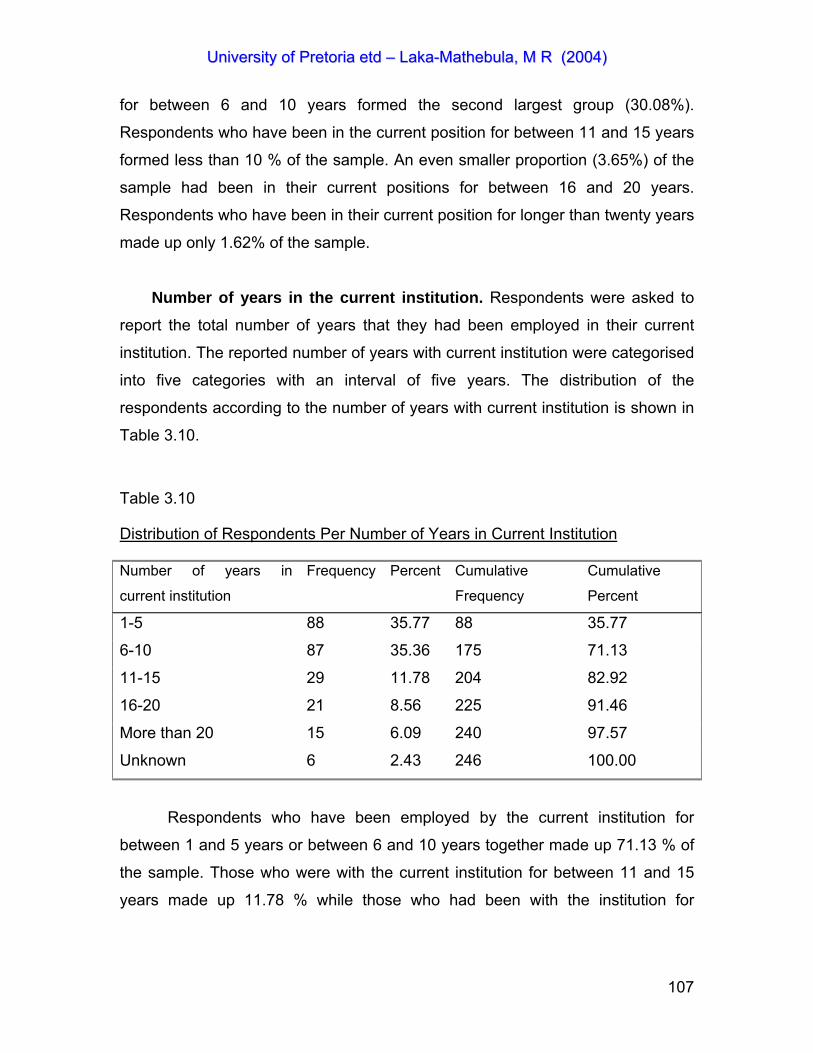
UUnniivveerrssiittyy ooff PPrreettoorriiaa eettdd –– LLaakkaa--MMaatthheebbuullaa,, MM RR ((22000044))
107
for between 6 and 10 years formed the second largest group (30.08%).
Respondents who have been in the current position for between 11 and 15 years
formed less than 10 % of the sample. An even smaller proportion (3.65%) of the
sample had been in their current positions for between 16 and 20 years.
Respondents who have been in their current position for longer than twenty years
made up only 1.62% of the sample.
Number of years in the current institution. Respondents were asked to
report the total number of years that they had been employed in their current
institution. The reported number of years with current institution were categorised
into five categories with an interval of five years. The distribution of the
respondents according to the number of years with current institution is shown in
Table 3.10.
Table 3.10
Distribution of Respondents Per Number of Years in Current Institution
Number of years in
current institution
Frequency Percent Cumulative
Frequency
Cumulative
Percent
1-5 88 35.77 88 35.77
6-10 87 35.36 175 71.13
11-15 29 11.78 204 82.92
16-20 21 8.56 225 91.46
More than 20 15 6.09 240 97.57
Unknown 6 2.43 246 100.00
Respondents who have been employed by the current institution for
between 1 and 5 years or between 6 and 10 years together made up 71.13 % of
the sample. Those who were with the current institution for between 11 and 15
years made up 11.78 % while those who had been with the institution for

UUnniivveerrssiittyy ooff PPrreettoorriiaa eettdd –– LLaakkaa--MMaatthheebbuullaa,, MM RR ((22000044))
108
between 16 and 20 years formed 8.56% of the sample. Respondents with more
than twenty years with the current institution constituted 6.09% of the sample.
Involvement in Decision-making. Respondents were asked to indicate
how often they are involved in decision-making. The distribution of respondents
in terms of how often they perceived themselves to be involved in decision-
making is shown in Table 3.11.
Table 3.11
Distribution of Respondents According to Involvement in Decision-making
Involvement in
decision making
Frequency Percent Cumulative
frequency
Cumulative
percent
Always 59 23.98 59 23.98
Sometimes 129 52.43 188 76.42
Rarely 36 14.63 224 91.05
Never 20 8.13 244 99.19
Unknown 2 .81 246 100.00
The majority of respondents (52.43%) reported that they were sometimes
involved in decision-making processes, while 23.98 % reported that they were
always involved. This corresponds to the reported positions of the respondents
as only 17.09% percent are in what can be regarded as managerial positions as
heads of departments or deans as illustrated in Table 3.8.
Language. Respondents were asked to report their mother tongue as well
as the language they currently use at home. Respondents were asked to report
on the language this way because of an apparent tendency among South
Africans to adopt English as a language spoken at home. The distribution of
respondents according to current home language is shown in Table 3.12. The
largest single group of respondents (48.78 %) currently use Afrikaans a home
language while the second largest home language group is English speakers

UUnniivveerrssiittyy ooff PPrreettoorriiaa eettdd –– LLaakkaa--MMaatthheebbuullaa,, MM RR ((22000044))
109
(19.11 %). Amongst the African languages, North Sotho speakers formed the
largest group (16.26 %).
Table 3.12
Respondent’s Distribution by Current Home Language
Home
language
Frequency Percentage Cumulative
Frequency
Cumulative
Percent
English 47 19.10 47 19.10
Afrikaans 120 48.78 167 67.88
Zulu 6 2.44 173 70.32
Xhosa 2 .82 175 71.13
Ndebele 2 .82 177 71.95
North Sotho 40 16.26 217 88.21
South Sotho 8 3.25 225 91.46
Tsawna 5 2.03 230 93.49
Venda 8 3.25 238 96.74
Other 5 2.03 243 98.78
Unknown 3 1.22 246 100.00
Table 3.13 shows the distribution according to the language respondents
spoke when growing up (mother tongue). Fifty percent of respondents (50.00%)
reported Afrikaans as their mother tongue. North Sotho at 17.07% is the second
highest mother tongue followed by English at 12.60%.
Figure 3.2 compares the distribution of the languages as mother tongue
and as current language. Although there is a numerical decrease in the
distribution of Afrikaans (it showed a 1.23% decrease from mother tongue to
current language), it is still the most common language used by the sample. The
distribution of English increased from 12.60% as mother tongue to 19.10% as
current language. As the frequency of the usage of African languages was very
low, it was decided to group all African languages together. As a result, African
languages were used by 31.27 % as current home language and 36.86% as

UUnniivveerrssiittyy ooff PPrreettoorriiaa eettdd –– LLaakkaa--MMaatthheebbuullaa,, MM RR ((22000044))
110
mother tongue. Comparing English, Afrikaans and African languages as the
language currently used by respondents, Afrikaans is the most used at 48.78 %,
followed by African languages at 31.27 % and then English at 19.34 %. These
three languages will be used as the language variables during statistical analysis.
Table 3.13
Distribution of Respondents by Mother Tongue
Mother
tongue
Frequency Percentage Cumulative
Frequency
Cumulative
Percent
English 31 12.60 31 12.60
Afrikaans 123 5.00 154 62.60
Zulu 7 2.85 161 65.45
Xhosa 3 1.21 164 66.67
Ndebele 1 .41 165 67.07
North Sotho 42 17.07 207 84.15
South Sotho 7 2.85 214 86.99
Tswana 6 2.44 220 89.43
Venda 11 4.47 231 93.90
Other 13 5.28 244 99.19
Unknown 2 .81 246 100.00

UUnniivveerrssiittyy ooff PPrreettoorriiaa eettdd –– LLaakkaa--MMaatthheebbuullaa,, MM RR ((22000044))
111
0
10
20
30
40
50
60
English
Afrikaa
ns ZuluXho
sa
Ndebe
le
North S
otho
South
Sotho
Tswan
aVen
daOthe
r
Unkno
wn
Percent current languagePercent mother tongue
Figure 3.2. A comparison of language used as mother tongue and current home
language.
Organizational characteristics. Organizational characteristics have been
suggested to have an influence on work attitudes such as organizational
commitment (Nijhoff et al, 1998). Respondents were therefore requested to
report on the type of campus they work in, the age of the organization, the size of
organization as measured by student enrolment figures, the type of academic
institution, whether the institution has undergone any restructuring recently and
when the restructuring happened.
Type of campus. Respondents were requested to indicate the type of
campus they are working in. They choose from three options, a main campus,
satellite campus or branch campus. This item was included in the questionnaire
because it is assumed that an organization’s decentralised structure could have
an influence on organizational outcomes. The respondent’s distribution is shown
in Table 3.14. Approximately two-thirds of respondents came from a Main
campus, a quarter came from a satellite campus and less than 10 % from a
branch.
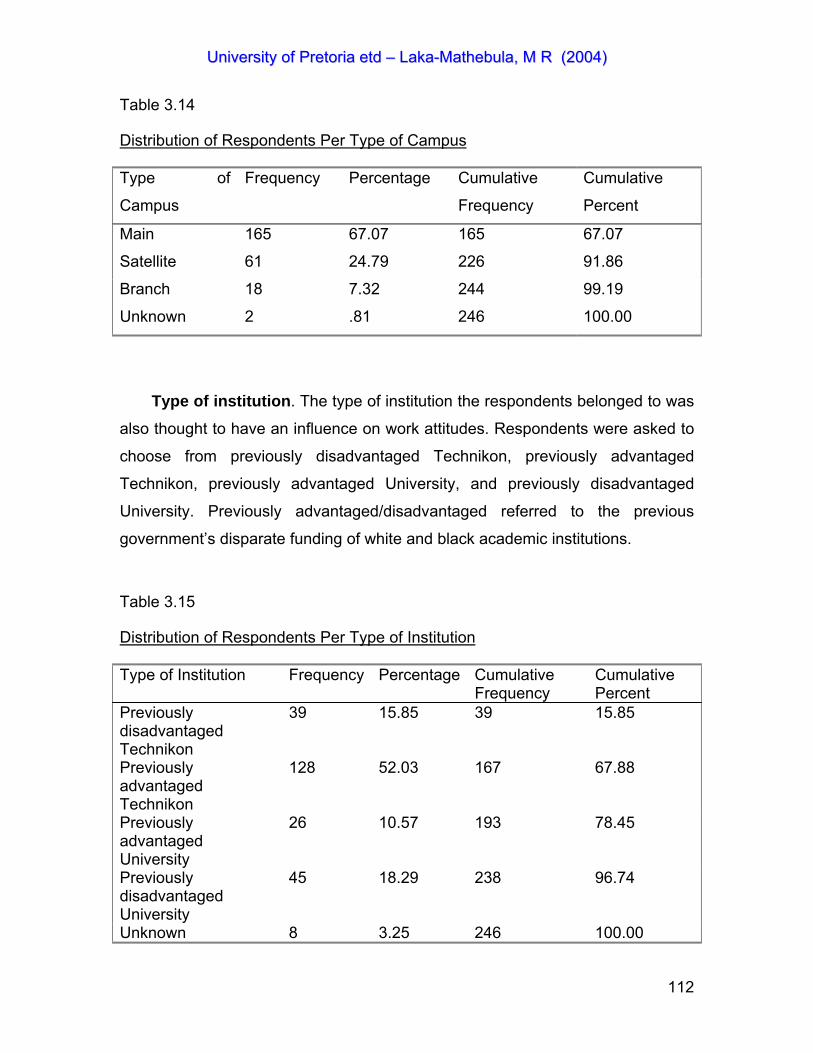
UUnniivveerrssiittyy ooff PPrreettoorriiaa eettdd –– LLaakkaa--MMaatthheebbuullaa,, MM RR ((22000044))
112
Table 3.14
Distribution of Respondents Per Type of Campus
Type of
Campus
Frequency Percentage Cumulative
Frequency
Cumulative
Percent
Main 165 67.07 165 67.07
Satellite 61 24.79 226 91.86
Branch 18 7.32 244 99.19
Unknown 2 .81 246 100.00
Type of institution. The type of institution the respondents belonged to was
also thought to have an influence on work attitudes. Respondents were asked to
choose from previously disadvantaged Technikon, previously advantaged
Technikon, previously advantaged University, and previously disadvantaged
University. Previously advantaged/disadvantaged referred to the previous
government’s disparate funding of white and black academic institutions.
Table 3.15
Distribution of Respondents Per Type of Institution
Type of Institution Frequency Percentage Cumulative Frequency
Cumulative Percent
Previously disadvantaged Technikon
39 15.85 39 15.85
Previously advantaged Technikon
128 52.03 167 67.88
Previously advantaged University
26 10.57 193 78.45
Previously disadvantaged University
45 18.29 238 96.74
Unknown 8 3.25 246 100.00
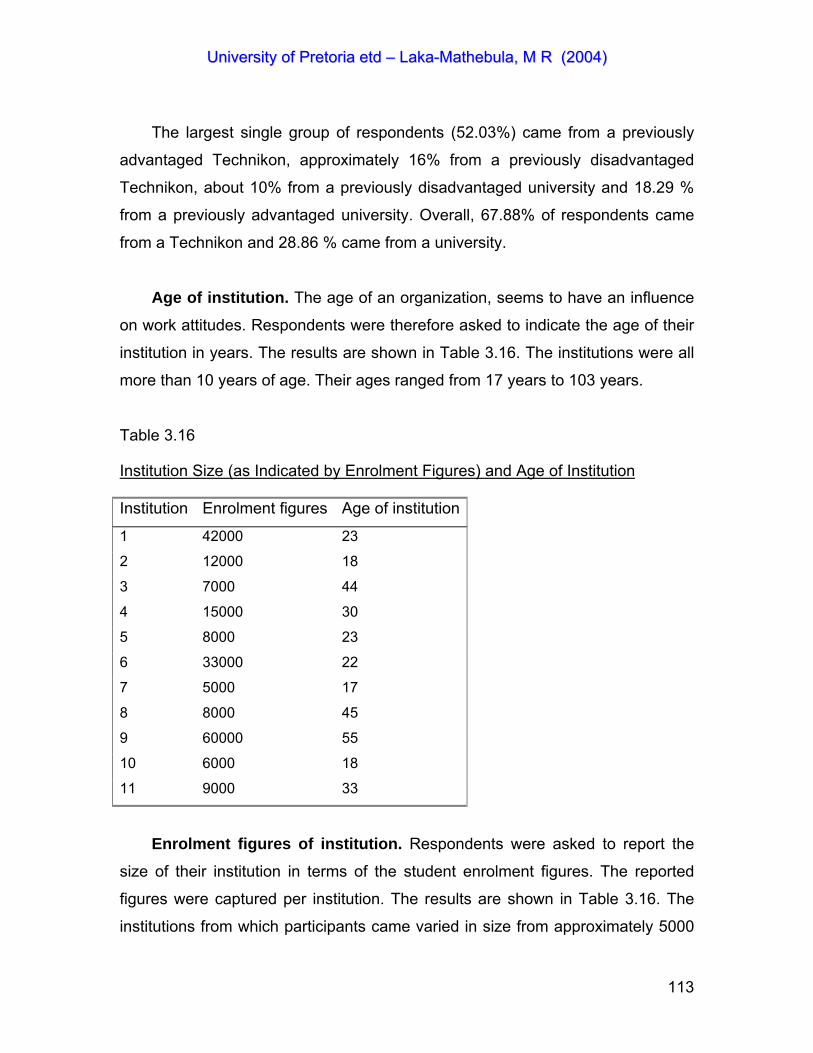
UUnniivveerrssiittyy ooff PPrreettoorriiaa eettdd –– LLaakkaa--MMaatthheebbuullaa,, MM RR ((22000044))
113
The largest single group of respondents (52.03%) came from a previously
advantaged Technikon, approximately 16% from a previously disadvantaged
Technikon, about 10% from a previously disadvantaged university and 18.29 %
from a previously advantaged university. Overall, 67.88% of respondents came
from a Technikon and 28.86 % came from a university.
Age of institution. The age of an organization, seems to have an influence
on work attitudes. Respondents were therefore asked to indicate the age of their
institution in years. The results are shown in Table 3.16. The institutions were all
more than 10 years of age. Their ages ranged from 17 years to 103 years.
Table 3.16
Institution Size (as Indicated by Enrolment Figures) and Age of Institution
Institution Enrolment figures Age of institution
1 42000 23
2 12000 18
3 7000 44
4 15000 30
5 8000 23
6 33000 22
7 5000 17
8 8000 45
9 60000 55
10 6000 18
11 9000 33
Enrolment figures of institution. Respondents were asked to report the
size of their institution in terms of the student enrolment figures. The reported
figures were captured per institution. The results are shown in Table 3.16. The
institutions from which participants came varied in size from approximately 5000
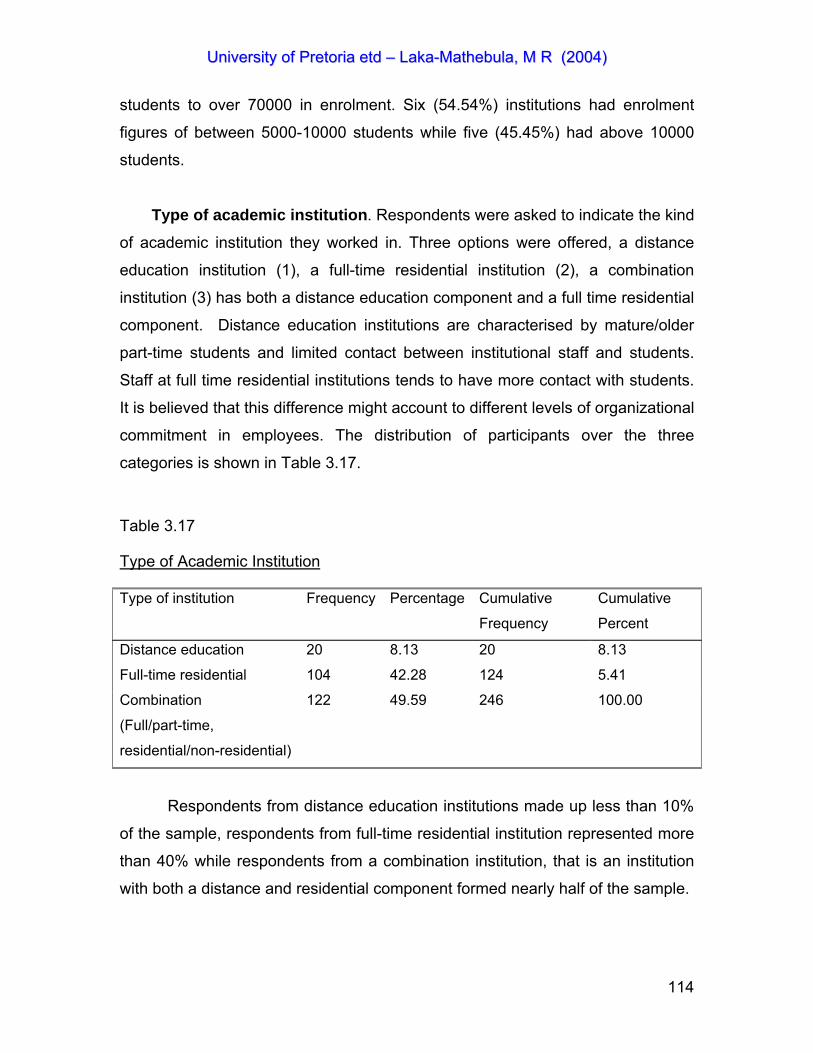
UUnniivveerrssiittyy ooff PPrreettoorriiaa eettdd –– LLaakkaa--MMaatthheebbuullaa,, MM RR ((22000044))
114
students to over 70000 in enrolment. Six (54.54%) institutions had enrolment
figures of between 5000-10000 students while five (45.45%) had above 10000
students.
Type of academic institution. Respondents were asked to indicate the kind
of academic institution they worked in. Three options were offered, a distance
education institution (1), a full-time residential institution (2), a combination
institution (3) has both a distance education component and a full time residential
component. Distance education institutions are characterised by mature/older
part-time students and limited contact between institutional staff and students.
Staff at full time residential institutions tends to have more contact with students.
It is believed that this difference might account to different levels of organizational
commitment in employees. The distribution of participants over the three
categories is shown in Table 3.17.
Table 3.17
Type of Academic Institution
Type of institution Frequency Percentage Cumulative
Frequency
Cumulative
Percent
Distance education 20 8.13 20 8.13
Full-time residential 104 42.28 124 5.41
Combination
(Full/part-time,
residential/non-residential)
122 49.59 246 100.00
Respondents from distance education institutions made up less than 10%
of the sample, respondents from full-time residential institution represented more
than 40% while respondents from a combination institution, that is an institution
with both a distance and residential component formed nearly half of the sample.

UUnniivveerrssiittyy ooff PPrreettoorriiaa eettdd –– LLaakkaa--MMaatthheebbuullaa,, MM RR ((22000044))
115
Institutional restructuring. Another organizational factor that has been
suggested to have an influence on organizational commitment and trust levels is
whether or not the organization has undergone restructuring. Researchers have
shown that restructuring, especially when accompanied by job losses, affects the
levels of employee commitment and trust (Hallier & Lyon, 1996). Respondents
were therefore requested to indicate whether or not their institution has recently
undergone any restructuring and how recent that was. The distribution of the
responses is shown in Table 3.17 and 3.18.
Table 3.18
Distribution of Respondents with Regard to Organization’s Restructuring
Any
restructuring
Frequency Percentage Cumulative
Frequency
Cumulative
Percent
Yes 133 54.06 133 54.06
No 107 43.49 240 97.56
Unknown 6 2.44 246 100.00
A small majority (54.06%) of respondents came from institutions that had
experienced restructuring while 43.49% came from institutions that had not been
restructured. Of the respondents who have experienced restructuring, more than
40% reported the restructuring had happened in the last three years. Less than
10 % reported that restructuring had happened in the past two years while a
quarter experienced restructuring in the year preceding the research. The results
are summarized in Table 3.19.

UUnniivveerrssiittyy ooff PPrreettoorriiaa eettdd –– LLaakkaa--MMaatthheebbuullaa,, MM RR ((22000044))
116
Table 3.19
Distribution of Respondents with Regard to the Time Their Organization Had
Undergone Restructuring
When restructuring
occurred
Frequency Percentage Cumulative
Frequency
Cumulative
Percent
During the current
year
34 25.00 34 25.00
In the past year 28 20.59 62 45.59
In the past 2-3
years
61 44.85 123 90.44
More than three
years ago
13 9.56 136 100.00
3. 4 MEASURING INSTRUMENTS
The aim of this study was to determine the relationship between
organizational commitment, HRM practices, and trust and leadership styles. The
following instruments were used in a survey to measure the variables in the
study:
• Organizational commitment: Allen and Meyer’s (1990) questionnaire
• HRM practices: a three part questionnaire made up of items from Boselie,
Hesselink, Pauwe and Van der Weile’s (2001) questionnaire, Snell and
Dean’s (1992) questionnaire and own items
• Trust: Ferres (2002) trust questionnaire
• Leadership style: Bass and Avolio’s (1995) MLQ 5x
The instruments used are summarised in Table 3.20.
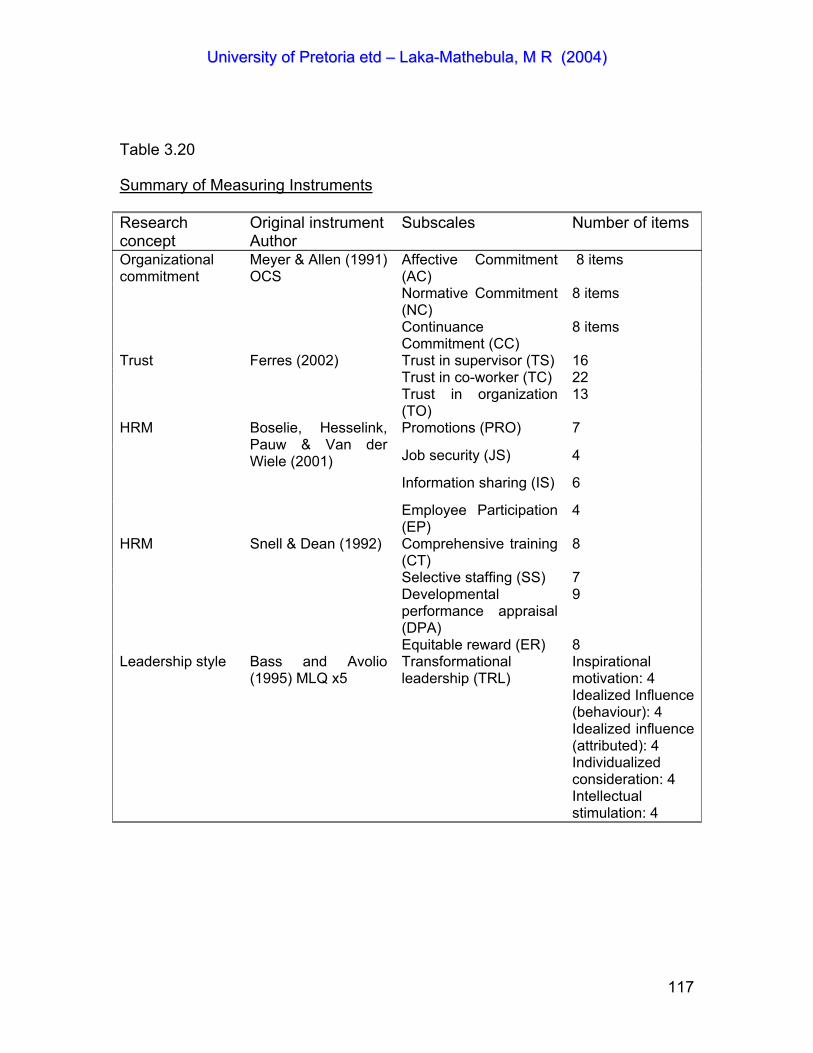
UUnniivveerrssiittyy ooff PPrreettoorriiaa eettdd –– LLaakkaa--MMaatthheebbuullaa,, MM RR ((22000044))
117
Table 3.20
Summary of Measuring Instruments
Research concept
Original instrument Author
Subscales Number of items
Affective Commitment (AC)
8 items
Normative Commitment (NC)
8 items
Organizational commitment
Meyer & Allen (1991) OCS
Continuance Commitment (CC)
8 items
Trust in supervisor (TS) 16 Trust in co-worker (TC) 22
Trust Ferres (2002)
Trust in organization (TO)
13
Promotions (PRO) 7
Job security (JS) 4
Information sharing (IS) 6
HRM Boselie, Hesselink, Pauw & Van der Wiele (2001)
Employee Participation (EP)
4
Comprehensive training (CT)
8 HRM Snell & Dean (1992)
Selective staffing (SS) 7 Developmental
performance appraisal (DPA)
9
Equitable reward (ER) 8 Leadership style Bass and Avolio
(1995) MLQ x5 Transformational leadership (TRL)
Inspirational motivation: 4 Idealized Influence(behaviour): 4 Idealized influence (attributed): 4 Individualized consideration: 4 Intellectual stimulation: 4
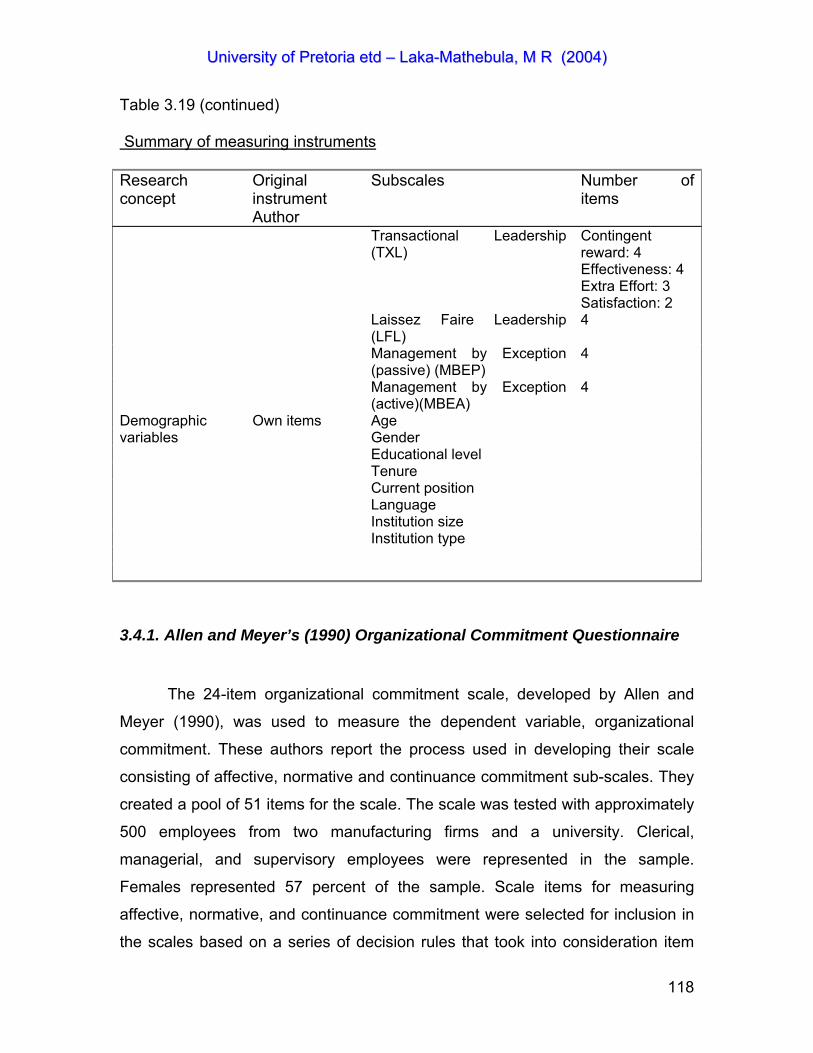
UUnniivveerrssiittyy ooff PPrreettoorriiaa eettdd –– LLaakkaa--MMaatthheebbuullaa,, MM RR ((22000044))
118
Table 3.19 (continued) Summary of measuring instruments Research concept
Original instrument Author
Subscales Number of items
Transactional Leadership (TXL)
Contingent reward: 4 Effectiveness: 4 Extra Effort: 3 Satisfaction: 2
Laissez Faire Leadership (LFL)
4
Management by Exception (passive) (MBEP)
4
Management by Exception (active)(MBEA)
4
Age Gender Educational level Tenure Current position Language Institution size Institution type
Demographic variables
Own items
3.4.1. Allen and Meyer’s (1990) Organizational Commitment Questionnaire
The 24-item organizational commitment scale, developed by Allen and
Meyer (1990), was used to measure the dependent variable, organizational
commitment. These authors report the process used in developing their scale
consisting of affective, normative and continuance commitment sub-scales. They
created a pool of 51 items for the scale. The scale was tested with approximately
500 employees from two manufacturing firms and a university. Clerical,
managerial, and supervisory employees were represented in the sample.
Females represented 57 percent of the sample. Scale items for measuring
affective, normative, and continuance commitment were selected for inclusion in
the scales based on a series of decision rules that took into consideration item
UUnniivveerrssiittyy ooff PPrreettoorriiaa eettdd –– LLaakkaa--MMaatthheebbuullaa,, MM RR ((22000044))
119
endorsement proportions, item-total correlations, direction of scoring and content
redundancy (Allen & Meyer, 1990).
According to the rules, items were eliminated if the endorsement
proportion was greater than .75, or the item correlated less with its sub-scale
than with one or both of the other sub-scales, or the content of the item was
redundant with respect to other items on the scale (Allen & Meyer 1990). Both
positively and negatively scored items were selected. Following the application of
the rules Allen and Meyer (1990) selected eight items for inclusion into each of
the scales. They report the reliability of the affective commitment scale (ACS) as
.87, continuance commitment scale (CCS) as .75 and for the normative
commitment scale as .79. Factor analysis of the 24 items indicated that the three
factors accounted for 58.8, 25.8 and 15.4 percent of the total variance,
respectively. Allen and Meyer’s (1990) results showed that the three commitment
constructs could be reliably measured.
3.4.2. HRM Practices Questionnaire
Three different questionnaires were used to measure HRM practices. A
short 8-item questionnaire was used to determine the respondent’s perception of
the employing organization’s commitment to the HRM practices of choice. A five-
point scale was used with 0 representing “very uncommitted”, 3 representing
unsure and 5 representing “very committed”.
Snell and Dean’s 1992 questionnaire was used to measure the following
HRM practices: selective staffing, comprehensive training, development
appraisal, and equitable rewards. Selective staffing was measured with a 7-item
scale that measured the extensiveness of the organization’s selection process as
demonstrated by the time and money spent and the number of people involved in
the selection process. An 8-item scale measured the extensiveness of training
and development opportunities. The items measured such things as the
frequency and variety of training, the amount of money spent on the training, and
the percentage of people who had undergone training. Developmental appraisal

UUnniivveerrssiittyy ooff PPrreettoorriiaa eettdd –– LLaakkaa--MMaatthheebbuullaa,, MM RR ((22000044))
120
was measured with a 9-item scale that measured whether performance appraisal
was used for developing employees. This consisted of items addressing issues
such as the frequency of feedback, the diagnosis of training needs, problem
solving approaches and discussing future issues. Equitable rewards were
measured with an 8-item scale measuring the degree to which pay was
competitive for the industry and whether it was based on individual performance.
Although a 7-point Liker-type response scale was used, each item had a different
formulation of the end points. For example, in one item, 1 would represent “very
little” and 7 would represent “a great deal”, while in another item 1 would be “not
closely” and 7 would be “very closely”.
Snell and Dean (1992) factor analysed these scales using principal
components with varimax rotation. They report that the analyses produced five
factors, which correspond with staffing, training, appraisal, equitable rewards
(external) and equitable reward (individual equity). This meant that the measure
for equitable reward was broken into two separate subscales that represented
external and individual equity. Snell and Dean (1992) did not report fully on the
construct validity of their scales.
Employee participation, Information sharing, and job insecurity were
measured using items from a questionnaire developed by Boselie et al (2001).
The items were scored with a 7 point likert scale with 1 = strongly disagree and
7= strongly agree. Employee participation was measured by 4 items and had a
Cronbach Alpha of .72. The information sharing subscale contained 6 items with
a Cronbach Alpha of .72. Job insecurity was measured with 5 items with a
Cronbach Alpha of .76. Seven items that were developed by the present
researcher measured promotion.
UUnniivveerrssiittyy ooff PPrreettoorriiaa eettdd –– LLaakkaa--MMaatthheebbuullaa,, MM RR ((22000044))
121
3.4.3. Bass and Avolio’s (1995) Multifactor Leadership Questionnaire
Bass (1985) developed an instrument to measure both transactional and
transformational leadership behavior. The resulting instrument, the Multifactor
Leadership Questionnaire (MLQ), was conceptually developed and empirically
validated to reflect the complementary dimensions of transformational and
transactional leadership with sub-scales to further differentiate leader behavior.
The initial 142-item pool for the MLQ was developed by combining a review of
the literature with an open-ended survey asking 70 executives for their
descriptions of attributes of transformational and transactional leaders. The 142
items were categorized into either transformational, transactional or “can’t say”
by 11 MBA and social science students. The final questionnaire contained 73
items. The MLQ has since acquired a history of research as the primary
quantitative instrument to measure the transformational leadership construct.
Since it was first used, the MLQ has undergone several revisions. These
have been done in an attempt to address concerns about its psychometric
properties (Avolio et al, 1995). The current version of MLQ, the MLQ Form 5X
was developed based on the results of previous research using earlier versions
and confirmatory factor analyses (Avolio, Bass & Jung, 1999). The MLQ 5X was
developed in response to criticisms of the original MLQ 5R. The MLQ 5X is
composed of behavioural items for the following leadership styles:
transformational, transactional, laissez faire and management by-exception. The
transformational leadership style is divided into idealized charismatic behaviours
and attributions. Factors representing transformational leadership include
idealized influence (attributed), idealized influence (behaviour), inspirational
motivation, individualized consideration and intellectual stimulation. Transactional
leadership was represented by two factors called contingent rewards and
management-by-exception. Management-by-exception is divided into
Management-by-Exception-Active (MBEA) and Management-by-Exception-
Passive (MBEP). As a result, the MLQ 5X contains nine factors.
UUnniivveerrssiittyy ooff PPrreettoorriiaa eettdd –– LLaakkaa--MMaatthheebbuullaa,, MM RR ((22000044))
122
In the MLQ 5X, transformational leadership is measured by 20 items made
up of Inspirational motivation (4 items), Idealized Influence (behaviour)(4 items),
Idealized influence (attributed) (4 items), Individualized consideration (4 items)
and Intellectual stimulation (4 items). Transactional Leadership (TXL) is
measured by 12 items made up of Contingent reward (4 items), Management by
Exception (passive) (MBEP) (4 items) and Management by Exception
(active)(MBEA) (4 items) Laissez Faire Leadership (LFL) is measured by 4 items.
In addition, there are nine items that measure leadership outcomes. These are:
Effectiveness (4 items), Extra Effort (3 items), and Satisfaction (2 items). The
MLQ 5X therefore contains 45 items; there are 36 items that represent the nine
leadership factors and 9 items that assess three leadership outcome scales.
Tepper and Percy (1994) investigated the latent structure of the multifactor
leadership questionnaire. Their investigation revealed two areas of concern
regarding the structural validity of the MLQ. First, they found that models that
contained items measuring management by exception (passive and active) did
not indicate a good fit with the data. They also found the charismatic and
inspirational leadership scales failed to display convincing evidence of
discriminant validity from each other. They then recommended that the MLQ be
refined further before it is employed in further studies.
In response to the concerns raised about the MLQ, Avolio et al (1995)
and Avolio et al (1999) used Confirmatory Factor Analysis (CFA) on a large pool
of data (N= 1394), in order to provide evidence for the construct validity of the
MLQ 5X. According to them, the MLQ 5X scales exhibited high internal
consistency and factor loadings. They reported reliabilities for total items and for
each leadership factor scale that ranged from .74 to .94. Den Hartog, Van Muijen
and Koopman (1997) also tested the factor structure of the MLQ in a Dutch
organization. The results of their factor analysis show that although
transformational, transactional and laissez faire leadership can be found in the
data, the scales found are slightly different from Bass’ scale.
However, Tejeda, Scandura and Pillai (2001) confirmed the validity of the
MLQ 5X. Using four different samples, Tejeda et al (2001) found internal

UUnniivveerrssiittyy ooff PPrreettoorriiaa eettdd –– LLaakkaa--MMaatthheebbuullaa,, MM RR ((22000044))
123
consistency coefficients (Cronbach Alphas) of between .85 and .90 for attributed
charisma; between .86 and .91 for idealised influence; between 89 and .94 for
inspirational leadership; between .86 and .91 for intellectual stimulation; between
.86 and .93 for individual consideration; between .84 and .88 for contingent
reward; between .69 and .79 for management by exception (active); between .82
and .90 for management by exception (passive) and .72 - .88 for the non-
leadership scale. Antonakis, Avolio and Sivasubramaniam (2003) also confirmed
the nine-factor leadership model proposed by Bass and Avolio.
3.4.4. Organizational Trust Questionnaire
Organizational trust was measured using a 51-item questionnaire
composed by Ferres, Travaglione, Munro, Albercht and Boshoff (2001). A seven
point Likert scale items with 1 = strongly disagree, 4= Undecided, and 7 =
strongly agree. Ferres et al (2001) used data from two samples, a South African
sample and an Australian sample, to determine the psychometric properties of
the trust questionnaire. With the Australian sample, they found a two-factor
structure with Factor 1 containing 28 items and Factor 2 with 20 items. The two
factors had Cronbach Alphas of .98 and .96 respectively. Data from the South
African sample gave a three-factor structure. Factor 1 contained 19 items
(Cronbach Alpha = .97), Factor 2 contained 18 items (Cronbach Alpha = .94) and
Factor 3 contained 6 items (Cronbach Alpha = .90). Ferres et al (2001) named
these factors, trust in organization, trust in co-workers and trust in supervisors,
respectively. Factor analyses of the trust scale indicated that the three factors
accounted for 48.8, 5.41 and 5.48 percent of the total variance, respectively.
UUnniivveerrssiittyy ooff PPrreettoorriiaa eettdd –– LLaakkaa--MMaatthheebbuullaa,, MM RR ((22000044))
124
3.5 PROCEDURES FOR DATA COLLECTION
3.5.1. Questionnaire administration
A self-administered questionnaire was developed by combining six
separate instruments. A section on demographics was added for gathering
background, personal and organizational information. The questionnaire was a
pencil-and-paper instrument. Each questionnaire was accompanied by a
covering letter explaining the purpose of the study to the prospective respondent.
General instructions on completing the questionnaire and the importance of
completing all questions were included. The covering letter also explained why it
was important that the potential respondent personally completed the
questionnaire.
In order not to confuse the respondents, the different instruments were
separated into sections. According to Babbie’s (1998) recommendations, short
instructions were given at the beginning of each section. The Allen and Meyer
(1990) questionnaire was placed at the start of the instrument. It was followed by
the Ferres et al’s (2001) trust questionnaire, the HRM questionnaire (made up of
items from Boselie et al’ (Section C), Snell and Dean’s (1992) (Section D) and
own items (Section E). Section F contained the MLQ questionnaire. Items
regarding personal information and organizational information were placed at the
end of the measuring instrument.
The questionnaire was pre-tested using a few (n = 5) non-academics from
two of the participating institutions. These individuals were not included in the
final sample. The qualitative comments received were mostly regarding wording,
construct validity, and length of the questionnaire. Since the questionnaire was
compiled from pre-existing scales that were standardized, the length of the
questionnaire could not be changed. The word organization used in most items
was replaced with “institution”, unit with “department” or “faculty” where
UUnniivveerrssiittyy ooff PPrreettoorriiaa eettdd –– LLaakkaa--MMaatthheebbuullaa,, MM RR ((22000044))
125
appropriate. Apart from this, the items were not modified in any way. The original
author’s wording and response scale were maintained.
A letter to request permission to use academic staff members as
respondents in the study was sent to all the heads of the 36 institutions of higher
education. Only 11 of the 36 institutions gave permission. That amounted to
27.8% of the 36 institutions. Once permission was obtained, the questionnaire
was sent by courier mail to a lead contact person at the different faculties of the
institutions. The lead contact person’s responsibility was to distribute and collect
the questionnaire. Eight hundred questionnaires were sent out. The completed
questionnaires were then sent back to the researcher either by post or courier
mail. Every two weeks, an e-mail reminder was sent to the lead contact person
who then reminded the respondents by telephone to complete and return the
questionnaires.
3.5.2. Handling of returned questionnaires and data
The returned questionnaires were coded and the raw data entered into a
generic processing program. As the data was collected through a self-response
questionnaire, it was not possible for the researcher to ensure that the
respondents answered all survey items. There were a few questionnaires with
some unanswered items. According to Roth and Switzer, (1995) missing data
causes two major problems. First, missing data reduce statistical power as it
increases the size of the sample needed for the statistical test to be accurate.
Statistical power refers to the ability of an analytic technique to detect a
significant effect in a data set (Roth & Switzer, 1995). Secondly, missing data
affects the accuracy of estimating parameters. According to Roth and Switzer
(1995) accuracy refers to both the amount of dispersion around a true score in a
study and the over or underestimation of a true score in a study. They argue that
missing data may increase the variance around true scores because there is less
data to analyse in the sample.

UUnniivveerrssiittyy ooff PPrreettoorriiaa eettdd –– LLaakkaa--MMaatthheebbuullaa,, MM RR ((22000044))
126
The literature provides several guidelines in dealing with missing data.
These include among others listwise deletion, pairwise deletion, mean
substitution, regression imputation, and hot-deck imputation (Roth & Switzer,
1995). Listwise deletion eliminates all the data for an individual when there is any
missing data. Pairwise deletion eliminates information on a statistic-by-statistic
basis. Mean substitution inserts the mean value of a variable in the place of the
missing value. This approach saves a great deal of data that listwise deletion
eliminates. It also saves more data than pairwise deletion. Regression imputation
uses related variables to estimate or impute missing values. Hot deck imputation
replaces missing score with a real score from a similar individual. In this study, a
two-step process was followed to deal with missing data. First, listwise deletion
was used where more than five consecutive items or an entire section missed
data. This resulted with only 246 questionnaires being retained. In the second
step, missing items were entered as the mean value of the particular scale. This
was “sometimes”, “unsure” or “undecided” depending on the scale. As a result,
two hundred and forty six (246) questionnaires were usable, providing a return
rate of 28.9 % percent.
The response rate of 28.9% is low when compared to guidelines in the
literature. Babbie (1998) suggests that a 50 % response rate is adequate, a 60 %
is considered good while a 70 % response rate is considered very good. A low
response rate is not acceptable, as many survey researchers have found that
responses obtained from a small portion of a sample cannot be generalized to
the sample (Roth & BeVier, 1998). This leads to concerns regarding the external
validity of the study. The low response rate in this study was despite the use of a
lead contact within the institution and follow-ups as efforts to enhance the
response rate.
There are multiple reasons that can be attributed to the low response rate.
The first is the length of the questionnaire. The length of the questionnaire is
commonly believed to reduce response rates (Roth & BeVier, 1998). Frochlich
(2002) suggests that a questionnaire length of 40-50 items spread at 10-12 items
over four-five pages would elicit high response rates. He argues that if a survey
UUnniivveerrssiittyy ooff PPrreettoorriiaa eettdd –– LLaakkaa--MMaatthheebbuullaa,, MM RR ((22000044))
127
is under four or five pages, resistance to participate would be lower and the
response rate higher. The questionnaire used in the study was 18 pages long
and contained four different instruments with multiple items. The negative
influence of the length of the questionnaire was indicated by the comments on
some of the questionnaires that were returned incomplete. The present
researcher could not alter carefully developed instruments and as such, the
length of the questionnaire, could not be reduced by eliminating items.
Another reason for the low response rate could be the attitude of the
sample group. This research used employees in academic institutions. These
employees could possibly be over researched/sampled by other researchers to
an extent that they have been unwilling to participate (Frohlich, 2002). It could
also be that employees in academic institutions have less free time to respond to
surveys for reasons ranging from expanded responsibilities and being busy with
their own research.
Roth and BeVier (1998) suggest that the nature of the sample might have
an influence on the response rate. They suggest that where the sample was
drawn across many institutions, the response rate might be low. They argue that
workers who are sampled within a single organization might be more likely to
respond to surveys than those sampled across organizations. Another reason for
the low response rate could be that the contact leads at the respective
institutions failed to deliver the questionnaires to prospective respondents or that
they did not make follow-ups.
The response rate is important in that it is an indication of the success of a
survey research study (Roth & BeVries, 1998; Frohlich, 2002). According to
Frohlich (2002), response rates are important for three reasons. First, a high non-
response rate is associated with a real risk that the data will be biased. If the data
is biased, there is a risk that the low responses might only reflect the perspective
of certain types of academic institutions and not all institutions in the country.
Second, many statistical tests require a suitable number of cases. For example,
Frohlich (2002) attests that at least 10 degrees of freedom are generally required
for each variable in a Multiple Regression model to achieve sufficient statistical

UUnniivveerrssiittyy ooff PPrreettoorriiaa eettdd –– LLaakkaa--MMaatthheebbuullaa,, MM RR ((22000044))
128
power. Finally, high response rates are an indirect indication of relevance and
rigor of a study in the eyes of the respondents. Respondents are more likely to
return a questionnaire if they perceive that the study is important and warrants
their cooperation.
3.6 PROCEDURES FOR DATA ANALYSIS
The statistical analysis of the data was done at the Department of
Statistics at the University of Pretoria. The researcher, the study promoter, co-
promoter, and a statistics practitioner were involved in the planning and
execution of the analysis. The SAS package was used to perform the required
calculations.
Since the researcher used instruments that have been developed and
validated with samples other than South Africans and in addition, some of the
instruments, for example, the Snell and Dean (1992) questionnaire did not have
sufficient psychometric information available, the researcher was obliged to
validate the instruments, as their portability was not guaranteed. Validation of an
instrument requires that the researcher determine the construct validity of the
measures. Determining the construct validity of the measures is very important
as any attempt to correctly identify significant relationships among variables
depends on our ability to correctly measure the variables. O’Leary-Kelly and
Vorkuka (1998) indicate that studies in which measures are flawed lead to
erroneous conclusions.
Factor analysis was found to be the most popular method in the literature
for determining construct validity. Factor analysis was used to revalidate the
structure and internal reliability of the instruments used. When used to determine
construct validity, factor analysis is usually a two-step process, Exploratory
Factor Analysis and Confirmatory Factor Analysis (O`Learry-Kelly & Vorkuka,
1998; Kerlinger & Lee, 2000). According to Kerlinger and Lee (2000),
UUnniivveerrssiittyy ooff PPrreettoorriiaa eettdd –– LLaakkaa--MMaatthheebbuullaa,, MM RR ((22000044))
129
Exploratory Factor Analysis is used to determine the underlying factor structure
of a set of data or a construct when one has obtained measures on a number of
variables and wants to identify the number and nature of the underlying factors. It
offers a means of examining the interrelationships among the items of a scale
that are used to reveal the clusters of items that have sufficient common variation
to justify their grouping together as a factor. This process condenses a group of
items into a smaller set of composite factors with a minimum loss of information.
The second stage of factor analysis, the Confirmatory Factor Analysis stage is
used to test propositions about item groupings and the construct.
The procedure for factor analysis followed was as explained by
Schriesheim and Eisenbach (1995). First, reverse-scored items were properly
scored. Then a Pearson product-moment correlation matrix was computed and a
principal axis factor analysis undertaken with R2s as initial communality
estimates. The Eigenvalue greater than 1.00 rule and the Scree test were used
to determine the number of appropriate factors to extract. The Scree test was
used to determine “Clear” breaks between the Eigenvalues greater than 1.0.
Once the number of potential factors was determined, a Principal Factor Analysis
was done according to the number of determined factors. The extracted factors
were then subjected to Direct Quartimin rotation. As it is commonly done, items
that do not load ≥ .25 on any factor in any solution and those items loading ≥ .25
on more than one factor and the difference in loadings was less than .25 in any
of the solutions were identified and left out of the following round of the analysis.
The process was repeated until no “problematic” items remain on any factor
according to the described evaluative procedure. After the Exploratory Factor
Analysis, items are either discarded or retained for interpretation.
Once the underlying structure of a set of data has been obtained,
Confirmatory Factor Analysis was used to determine how well the obtained
structure( that is the measurement model) fits the data. Confirmatory Factor
Analysis represents the actual testing of hypotheses about the structures
underlying responses to individual items on the instrument (Schriesheim &
Eisenbach, 1995). In CFA, hypotheses about specified factors and how the

UUnniivveerrssiittyy ooff PPrreettoorriiaa eettdd –– LLaakkaa--MMaatthheebbuullaa,, MM RR ((22000044))
130
factors are arranged in a larger model and how much of an underlying construct
the factors can explain are tested.
Once the factor structures of the various instruments were established, the
next step was to determine the relationships of the demographic variables and
organizational commitment. Analysis of Variance (ANOVA) was the procedure of
choice to determine the relationships. ANOVA requires that the sample from
which the data is obtained be drawn from a normally distributed population.
3.6.1. Factor structure of the Organizational Commitment scale
In order to determine the psychometric properties of Allen and Meyer’s
(1990) organizational commitment scale, the factor analysis procedure described
in section 3.5 was followed. An analysis of the total 24 items identified seven (7)
Eigenvalues of >1.00 and the Scree test suggested that it was possible to extract
up to six factors. The Eigenvalues of the factors that are >1.00 were 4.575,
2.973, 1.746, 1.307, 1.144, 1.032, and 1.008 respectively. The Scree test showed
a “clear” break between Eigenvalues 1 and 2; Eigenvalues 2 and 3; Eigenvalues
3 and 4; Eigenvalues 4 and 5; and Eigenvalues 5 and 6. The break between
Eigenvalues 6 and 7 was not clear. It was then decided to analyse 1 to 7 factor
structures.
In the one-factor structure analysis of Allen and Meyer (1990)’s
organizational commitment scale, eight items were eliminated and the remaining
sixteen items satisfactorily loaded onto the one factor with loading values ranging
from .266 to .805. The two-factor solution retained 19 items while five items were
eliminated. Thirteen items with factor loadings ranging from .254 to .814 loaded
onto factor 1, while six items with factor loadings that ranged from .406 to .605
loaded on factor 2. The Cronbach Alphas of the factors are .80 and .71
respectively. Factor 1 explained 18.45% of the total variance and factor 2
explained 10.60% of the total variance. Factor 1 contributed 63.49 % to the
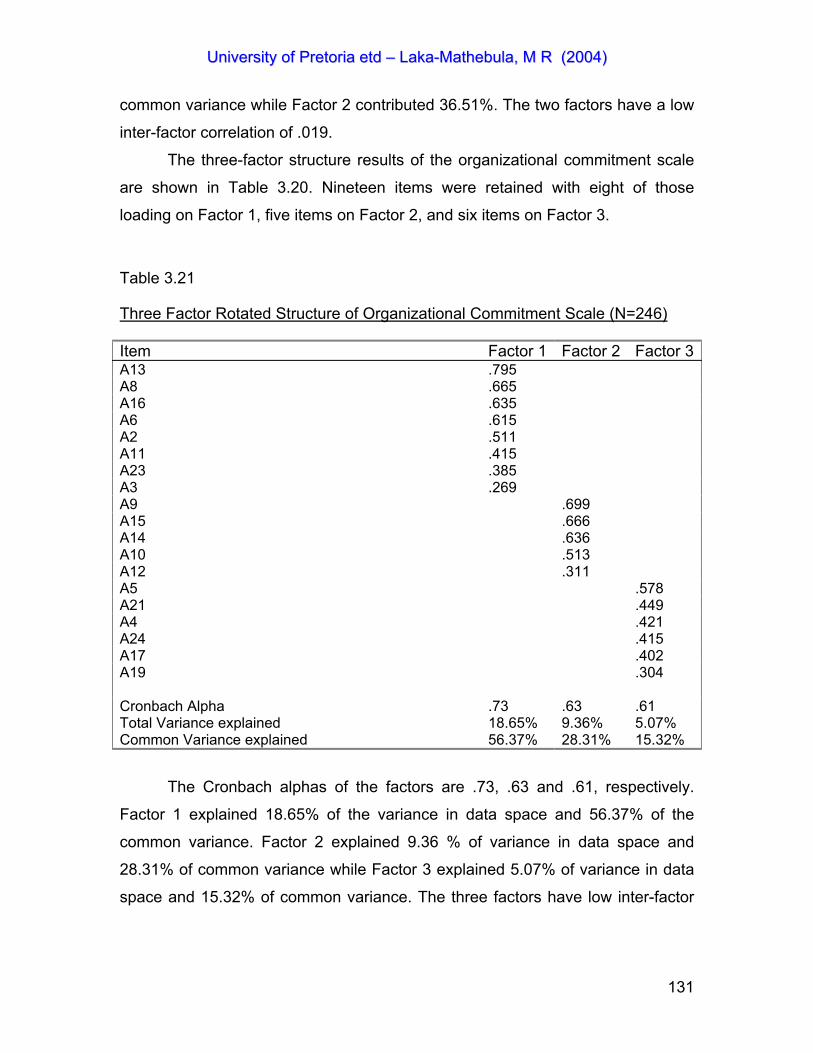
UUnniivveerrssiittyy ooff PPrreettoorriiaa eettdd –– LLaakkaa--MMaatthheebbuullaa,, MM RR ((22000044))
131
common variance while Factor 2 contributed 36.51%. The two factors have a low
inter-factor correlation of .019.
The three-factor structure results of the organizational commitment scale
are shown in Table 3.20. Nineteen items were retained with eight of those
loading on Factor 1, five items on Factor 2, and six items on Factor 3.
Table 3.21
Three Factor Rotated Structure of Organizational Commitment Scale (N=246)
Item Factor 1 Factor 2 Factor 3A13 .795 A8 .665 A16 .635 A6 .615 A2 .511 A11 .415 A23 .385 A3 .269 A9 .699 A15 .666 A14 .636 A10 .513 A12 .311 A5 .578 A21 .449 A4 .421 A24 .415 A17 .402 A19 .304
Cronbach Alpha Total Variance explained Common Variance explained
.73 18.65% 56.37%
.63 9.36% 28.31%
.61 5.07% 15.32%
The Cronbach alphas of the factors are .73, .63 and .61, respectively.
Factor 1 explained 18.65% of the variance in data space and 56.37% of the
common variance. Factor 2 explained 9.36 % of variance in data space and
28.31% of common variance while Factor 3 explained 5.07% of variance in data
space and 15.32% of common variance. The three factors have low inter-factor

UUnniivveerrssiittyy ooff PPrreettoorriiaa eettdd –– LLaakkaa--MMaatthheebbuullaa,, MM RR ((22000044))
132
correlations that range from – .041 to .281. The inter-correlations between the
three factors are shown in Table 3.21.
Table 3.22
Factor Correlations for a Three-factor Rotated Structure of OCS (N= 246)
Factor 1 Factor 2 Factor 3
Factor 1 1.000
Factor 2 -.034 1.000
Factor 3 .281 -.041 1.000
The results of the Confirmatory Factor Analysis of the one-, two-, and
three-factor solutions are shown in Table 3.23. A comparison of the one-, two-
and three-factor solution CFA indices indicate that the three-factor solution of the
organizational commitment scale best approximates the factor structure of the
original authors. The three factors were named factor 1: Affective Commitment,
factor 2: Continuance Commitment and factor 3: Normative Commitment,
according to the original author’s nomenclature.
3.6.2. Factor structure of the HRM practices scale
The HRM scale was made up of three sections, Section C with items from
Boselie et al (2001), Section D items from Snell and Dean (1992), and Section E
with own items. As the scales used different response scales, the scales were
treated as separate questionnaires when determining their psychometric
properties.

UUnniivveerrssiittyy ooff PPrreettoorriiaa eettdd –– LLaakkaa--MMaatthheebbuullaa,, MM RR ((22000044))
133
Table 3.23
Results of Confirmatory Factor Analysis of the Organizational Commitment Scale
(N =246)
Indices 1 Factor Structure
2 Factor Structure
3 Factor Structure
Fit function .0612 .3499 .1659 Goodness of fit Index (GFI) .9723 .8952 .9534 GFI Adjusted for Degrees of Freedom (AGFI)
.8615 .8165 .8912
Root Mean Square Residual (RMR) .0383 .3290 .0626 Parsimonious GFI (Mulaik, 1989) .3241 .7161 .5448 Chi-Square (df =; p > Chi Square) 14.9835 (2;
.0006) 85.7230(12; < .0001)
4.6377(12; < .0001)
Independence model Chi-Square (df)
302.44 (6) 33.21 (15) 413.33 (21)
RMSEA Estimate (90% CI) .1628(.0925- .2442)
.1584(.1278-
.1907) .0987(.0664-.1329)
ECVI Estimate (90 % CI) .1278(.0918-.1949)
.4255(.3194-
.5631) .3009(.2363-.3976)
Probability of Close Fit .0057 .0000 .0085 Bentler’s Comparative Fit Index .9562 .7661 .9270 Normal Theory Reweighted LS Chi-Square
13.9638 75.8060 41.9429
Akaike’s Information Criterion 1.9835 61.7230 16.6377 Bozdogan’s (1987) CAIC 1.9728 7.6591 -37.4262 Schwarz’s Bayesian Criterion 3.9728 19.6591 -25.4262 McDonald’s (1989) Centrality .9740 .8608 .9435 Bentler & Bonett’s (1980) Non-normed Index
.8686 .7076 .8723
Bentler & Bonett’s (1980) NFI .9505 .7404 .9017 James Mulaik, & Brett (1982) Parsimonious NFI
.3168 .5923 .5152
Z-Test of Wilson & Hilferty (1931) 3.2035 6.9402 3.8228 Bollen (1986) Normed Index Rho1 .8514 .6755 .8279 Bollen (1988) Non-normed Index Delta2
.9568 .7683 .9286
Hoelter’s (1983) Critical N 99 62 128

UUnniivveerrssiittyy ooff PPrreettoorriiaa eettdd –– LLaakkaa--MMaatthheebbuullaa,, MM RR ((22000044))
134
An analysis of the total 22 items in Section C identified five (5) Eigenvalues
of >1.00 and the Scree test suggested that it was possible to extract up to five
factors. The Eigenvalues of the factors that are >1.00 were 6.552, 2.417, 1.632,
1.225, and 1.064 respectively. The Scree test showed a break between
Eigenvalues 1 and 2; Eigenvalues 2 and 3; Eigenvalues 3 and 4; and
Eigenvalues 4 and 5. This suggested that there are possibly five factors in the
scale. The same rules as described in the factor analysis of the organizational
commitment scale were followed in determining which items are excluded or
retained.
Four items were eliminated in the one-factor solution. The one factor scale
has a Cronbach Alpha of .89 and explains 32.02 % of the total variance. In the
two-factor analysis of Boselie et al (2001)’s scale, two items were eliminated.
Sixteen items loaded onto factor 1 with factor loadings ranging from .287 to .782
while four items loaded onto factor 2 with loadings ranging from .403 to .901. The
Cronbach Alphas of the factors were .89 and .77 respectively. Factor 1 explained
24.86 % of the variance and 64.56 % of the common variance while, Factor 2
explained 13.65 % of the total variance and contributed 35.44 % to the common
variance. The factors are not inter-correlated as the inter-factor correlation is
.180. Only two items were eliminated from the three-factor structure of the
Boselie et al (2001) scale. The three factors have Cronbach Alphas of .83, .76
and .74 respectively. The Factor Analysis results are shown in Table 3.24. Factor
1 explained 23.16 % of the total variance, while Factors 2 and 3 explained
13.69% and 5.24 % respectively. The factors contributed 55.01%, 32.53% and
12.46%, respectively to the common variance.
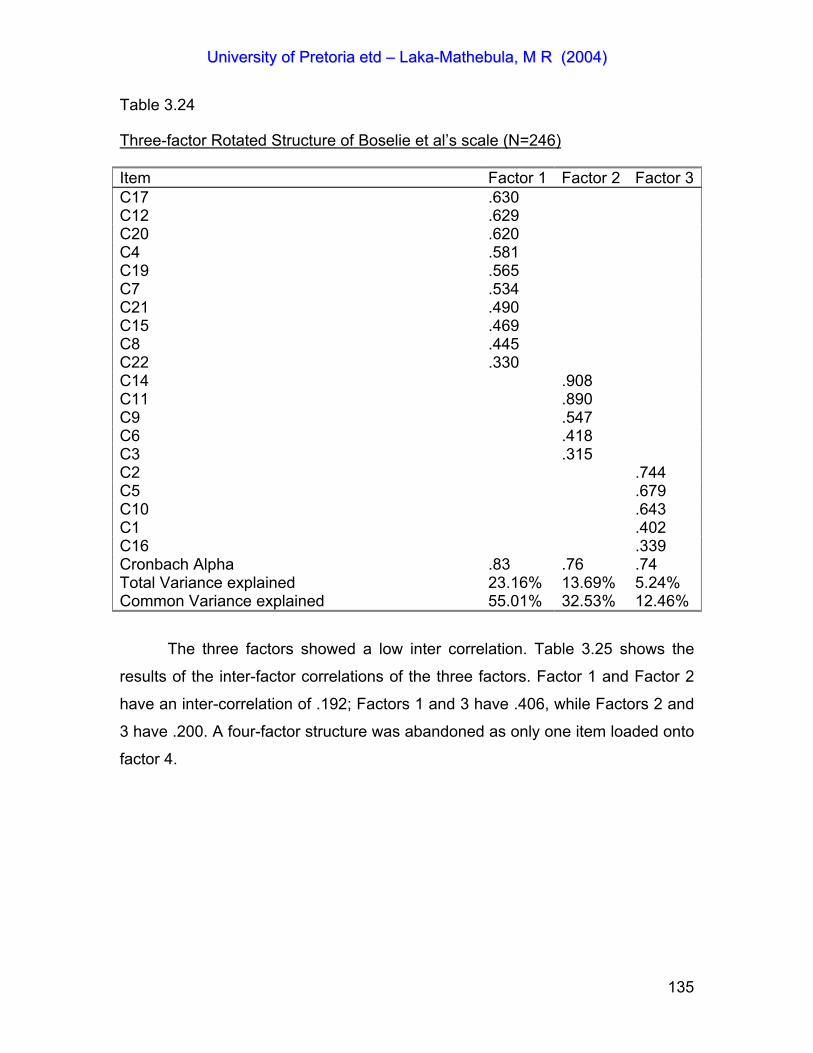
UUnniivveerrssiittyy ooff PPrreettoorriiaa eettdd –– LLaakkaa--MMaatthheebbuullaa,, MM RR ((22000044))
135
Table 3.24
Three-factor Rotated Structure of Boselie et al’s scale (N=246)
Item Factor 1 Factor 2 Factor 3C17 .630 C12 .629 C20 .620 C4 .581 C19 .565 C7 .534 C21 .490 C15 .469 C8 .445 C22 .330 C14 .908 C11 .890 C9 .547 C6 .418 C3 .315 C2 .744 C5 .679 C10 .643 C1 .402 C16 .339 Cronbach Alpha Total Variance explained Common Variance explained
.83 23.16% 55.01%
.76 13.69% 32.53%
.74 5.24% 12.46%
The three factors showed a low inter correlation. Table 3.25 shows the
results of the inter-factor correlations of the three factors. Factor 1 and Factor 2
have an inter-correlation of .192; Factors 1 and 3 have .406, while Factors 2 and
3 have .200. A four-factor structure was abandoned as only one item loaded onto
factor 4.
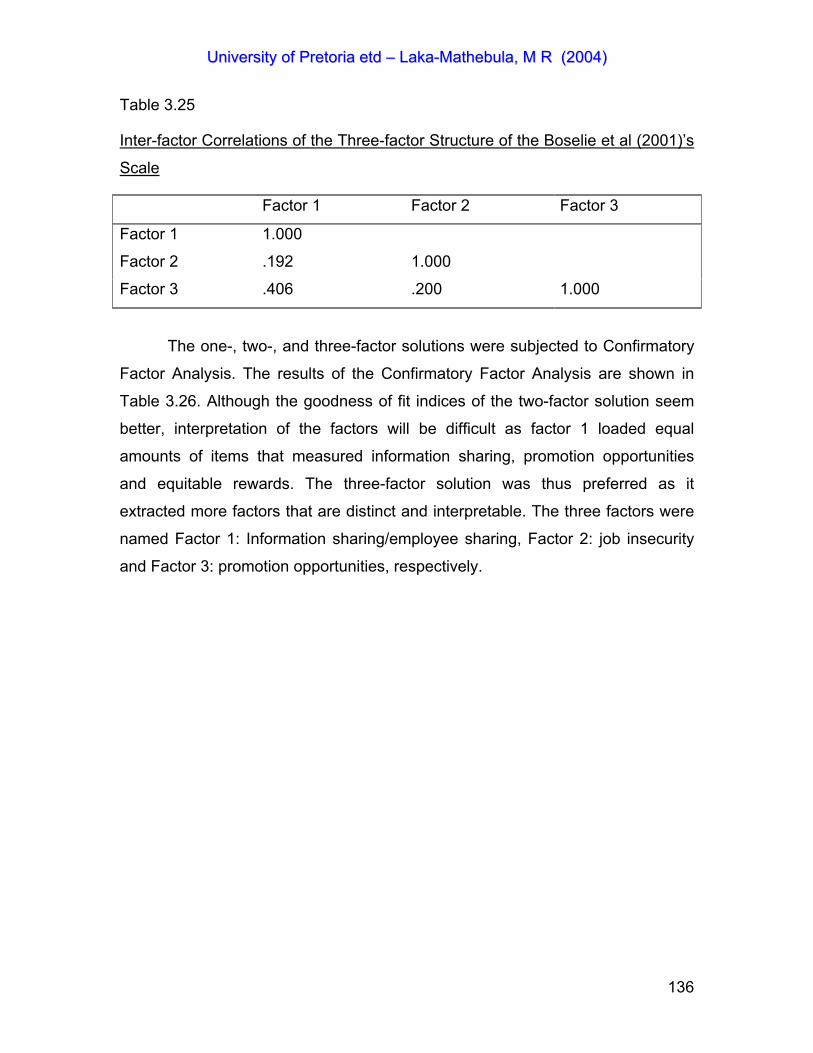
UUnniivveerrssiittyy ooff PPrreettoorriiaa eettdd –– LLaakkaa--MMaatthheebbuullaa,, MM RR ((22000044))
136
Table 3.25
Inter-factor Correlations of the Three-factor Structure of the Boselie et al (2001)’s
Scale
Factor 1 Factor 2 Factor 3
Factor 1 1.000
Factor 2 .192 1.000
Factor 3 .406 .200 1.000
The one-, two-, and three-factor solutions were subjected to Confirmatory
Factor Analysis. The results of the Confirmatory Factor Analysis are shown in
Table 3.26. Although the goodness of fit indices of the two-factor solution seem
better, interpretation of the factors will be difficult as factor 1 loaded equal
amounts of items that measured information sharing, promotion opportunities
and equitable rewards. The three-factor solution was thus preferred as it
extracted more factors that are distinct and interpretable. The three factors were
named Factor 1: Information sharing/employee sharing, Factor 2: job insecurity
and Factor 3: promotion opportunities, respectively.

UUnniivveerrssiittyy ooff PPrreettoorriiaa eettdd –– LLaakkaa--MMaatthheebbuullaa,, MM RR ((22000044))
137
Table 3.26
Results of Confirmatory Factor Analysis of Boselie et al’s Scale for HRM (N
=246)
Indices 1 Factor Structure
2 Factor Structure
3 Factor Structure
Fit function .0702 .1525 .2113 Goodness of fit Index (GFI) .9757 .9649 .9636 GFI Adjusted for Degrees of Freedom (AGFI)
.9271 .9335 .9414
Root Mean Square Residual (RMR)
.0312 .0412 .0451
Parsimonious GFI (Mulaik, 1989) .4878 .6548 .7183 Chi-Square (df =; Chi square) 17.2031 (5;
.0041) 37.3631 (19; .0071)
51.7638 (41; .1209)
Independence model Chi-Square (df)
58.63(10) 932.08(28) 1049.3(55)
RMSEA Estimate (90% CI) .0998(.0509-.1533)
.0628(.0320-
.0924) .0327(. -.0576)
ECVI Estimate (90% CI) .1539(.1169-.2226)
.2966(.2408-
.3854) .4249(. -.5195)
Probability of Close Fit .0474 .2186 .8595 Bentler’s Comparative Fit Index .9786 .9797 .9892 Normal Theory Reweighted LS Chi-Square
15.2607 35.6457 5.8655
Akaike’s Information Criterion 7.2031 -.6369 -3.2362 Bozdogan’s (1987) CAIC -15.3235 -86.2382 -214. 9548Schwarz’s Bayesian Criterion -1.3235 -67.2382 -173. 9548McDonald’s (1989) Centrality .9755 .9634 .9784 Bentler & Bonett’s (1980) Non-normed Index
.9572 .9701 .9855
Bentler & Bonett’s (1980) NFI .9704 .9599 .9507 James Mulaik, & Brett (1982) Parsimonious NFI
.4852 .6514 .7087
Z-Test of Wilson & Hilferty (1931) 2.6283 2.4461 1.1712 Bollen (1986) Normed Index Rho1
.9407 .9409 .9338
Bollen (1988) Non-normed Index Delta2
.9788 .9799 .9893
Hoelter’s (1983) Critical N 159 199 271

UUnniivveerrssiittyy ooff PPrreettoorriiaa eettdd –– LLaakkaa--MMaatthheebbuullaa,, MM RR ((22000044))
138
An analysis of the 32 items in the Snell and Dean (1992) scale for HRM
practices rendered seven Eigenvalues > 1.0. The Eigenvalues were 11.094,
1.903, 1.612, 1.426, 1.232, 1.173 and 1.050. The Scree test showed a clear
break between Eigenvalues 1 and 2; Eigenvalues 2 and 3; Eigenvalues 3 and 4;
and Eigenvalues 4 and 5. The break between Eigenvalues 5 and 6 was not clear
while that between 6 and 7 was clear. This suggests that probably six factors can
be extracted. The results of the two-factor solution for the Snell and Dean’s scale
are shown in table 3.27.
Table 3.27
Two-factor Rotated Structure of Snell and Dean (1992) Scale (N = 246)
Item Factor 1 Factor 2 D9 .858 D3 .848 D14 .782 D11 .723 D30 .679 D25 .613 D22 .612 D17 .442 D16 .392 D10 .293 D24 .814 D31 .730 D20 .700 D15 .656 D12 .601 D8 .285 .552 D26 .541 D32 .517 D7 .510 D27 .472 D28 .435 D5 .319 Cronbach Alpha Total Variance explained Common Variance explained
.88 36.18% 85.71%
.86 6.03% 14.29%

UUnniivveerrssiittyy ooff PPrreettoorriiaa eettdd –– LLaakkaa--MMaatthheebbuullaa,, MM RR ((22000044))
139
Following the common rules for factor elimination and retention, the one-
factor structure eliminated four items. Thus, 28 items were retained in the final
one-factor structure. In the two-factor structure of Snell and Dean’s (1992) scale,
seven items were eliminated. The Cronbach Alphas of the factors in the two-
factor solution were .89 and .77 respectively. Factor 1 explained 36.18 % of the
variance and 85.71 % of the common variance while, Factor 2 explained 6.03 %
and contributed 14.29 % to the common variance. A three-factor structure was
abandoned as only one item loaded onto Factor 3.
The two factors showed a rather high inter correlation of .657. A three-factor
structure was abandoned as only one item loaded onto factor 3.
The one- and two-factor solutions were subject to Confirmatory Factor
Analysis. The results of the Confirmatory Factor Analysis are shown in Table
3.28. The two-factor solution was preferred as it showed a better fit with the data.
The two factors were named Factor 1: Comprehensive training and Factor 2:
Staff selection, development and retention. Factor 2 was made up of items that
represented selective staffing practices, developmental performance appraisal
and equitable rewards. Selecting appropriate staff and providing developmental
opportunities and rewarding them equitably seem to be indicative of an
organization that is committed to its employees.

UUnniivveerrssiittyy ooff PPrreettoorriiaa eettdd –– LLaakkaa--MMaatthheebbuullaa,, MM RR ((22000044))
140
Table 3.28
Results of Confirmatory Factor Analysis of Snell and Dean’s HRM scale (N =246)
Indices 1 Factor Structure
2 Factor Structure
Fit function .1600 .0859 Goodness of fit Index (GFI) .9553 .9770 GFI Adjusted for Degrees of Freedom (AGFI) .9106 .9505 Root Mean Square Residual (RMR) .0287 .0292 Parsimonious GFI (Mulaik, 1989) .6369 .6048 Chi-Square (df=; p >chi-square) 39.2020(14;
.0003) 21.0348 (13; .0722)
Independence model Chi-Square 1266.9(21) 949.82 (21) RMSEA Estimate (90 % CI) .0857(.0546-
.1181) .0502 (.0 - .0880
ECVI Estimate (90% CI) .2782(.2166-.3720)
.2124 (.0 -
.2815) Probability of Close Fit .0314 .4514 Bentler’s Comparative Fit Index .9798 .9913 Normal Theory Reweighted LS Chi-Square 4.1437 2.1891 Akaike’s Information Criterion 11.2020 -4.9652 Bozdogan’s (1987) CAIC -51.8726 -63.5345 Schwarz’s Bayesian Criterion -37.8726 -5.5345 McDonald’s (1989) Centrality .9501 .9838 Bentler & Bonett’s (1980) Non-normed Index .9697 .9860 Bentler & Bonett’s (1980) NFI .9691 .9779 James Mulaik, & Brett (1982) Parsimonious NFI
.6460 .6053
Z-Test of Wilson & Hilferty (1931) 3.3762 1.4615 Bollen (1986) Normed Index Rho1 .9536 .9642 Bollen (1988) Non-normed Index Delta2 .9799 .9914 Hoelter’s (1983) Critical N 150 262
In addition to the HRM subscales, the respondent’s overall perception of
the institution’s commitment to certain HRM practices was measured. The Scree
test showed one factor, with an Eigenvalue of 4.794. All eight items loaded
satisfactorily on the one factor with factor loading values that ranged from .573 to
.822. The factor explained 43.59% of the variance. The factor analysis results are
shown in Table 3.29.

UUnniivveerrssiittyy ooff PPrreettoorriiaa eettdd –– LLaakkaa--MMaatthheebbuullaa,, MM RR ((22000044))
141
Table 3.29
One factor Structure of the Commitment to HRM Practices Scale
Item Factor loading
E7 .822
E8 .820
E5 .736
E2 .725
E4 .724
E3 .718
E1 .713
E6 .573
Cronbach Alpha .90
Variance Explained 43.59%
This factor is labeled Perceptions of HRM. It was not regarded as feasible
to do a confirmatory factor analysis on a one-factor, eight-item scale.
3.6.3. Factor structure of the Trust scale
In order to determine the psychometric properties of Ferres (2002) trust
scale when applied to the research sample, the factor analysis procedure
described in 3.5 was followed. An analysis of the total 51 items identified eight (8)
Eigenvalues of >1.00 and the Scree test suggested that it was possible to extract
up to seven factors. The Eigenvalues of the factors that are >1.00 were 22.038,
3.703, 2.635, 2.363, 1.528, 1.296, 1.109 and 1.018, respectively. The Scree test
showed a break between Eigenvalues 1 and 2; Eigenvalues 2 and 3;
Eigenvalues 3 and 4; Eigenvalues 4 and 5; Eigenvalues 5 and 6; and
Eigenvalues 6 and 7. The break between Eigenvalues 7 and 8 was not clear. It
was then decided to extract 1 to 8 factor structures.

UUnniivveerrssiittyy ooff PPrreettoorriiaa eettdd –– LLaakkaa--MMaatthheebbuullaa,, MM RR ((22000044))
142
Table 3.30
Two-factor Structure of the Trust Scale (N=246)
Item Factor 1 Factor 2 B16 .897 B17 .865 B23 .824 B15 .820 B21 .791 B20 .786 B13 .777 B50 .753 B45 .743 B8 .722 B25 .714 B33 .706 B18 .706 B40 .694 B29 .694 B36 .692 B31 .686 B14 .678 B51 .673 B46 .670 B27 .663 B38 .656 B11 .625 B43 .609 B7 .604 B9 .567 B6 .449 B35 .787 B34 .775 B44 .773 B42 .771 B39 .712 B47 .686 B48 .677 B12 .677 B32 .676 B37 .641 B24 .620 B49 .574 B41 .547 B30 .488 B1 .421 B5 .360 B2 .308 B4 .288 B3 .255 Cronbach Alpha Total Variance explained Common Variance Explained
.97 41.59% 85.91%
.92 6.83% 14.09%

UUnniivveerrssiittyy ooff PPrreettoorriiaa eettdd –– LLaakkaa--MMaatthheebbuullaa,, MM RR ((22000044))
143
The results of the one factor structure analysis resulted with 49 items being
retained. Three items were eliminated as they had factor loadings of <. 25. The
Cronbach Alpha of the one factor structure was .98. In the two-factor structure
analysis of Ferres (2002) questionnaire, five items were eliminated. Factor 1
explained 41.59% of the total variance while factor 2 explained 6.83%. Factor 1
was made up of twenty-seven items and factor 2 has nineteen items. Factor 1
contributed 85.91% of the common variance while factor 2 contributed 14.09%.
The Cronbach Alphas of the factors were .97 and .92 respectively. The two-factor
solution of the organizational trust questionnaire is shown as Table 3.30 in page
143. Fourty-seven of the fifty-one items in the trust scale were retained when a
three-factor analysis was done. Factor 1 was made up of eighteen items; factor 2
had twenty items while factor 3 had nine items. Factor 1, factor 2 and factor 3
explained 41.29 %; 6.32% and 5.54% of the total variance in data space,
respectively. A four-factor structure was abandoned as only one item loaded onto
factor 4.
The results of the Confirmatory Factor Analysis of the organizational trust
scale are shown in Table 3.31. The two factor solution showed better goodness
of fit indices. The two factors were named Factor 1: trust in supervisor and
organization, and Factor 2: trust in co-workers. The two factors showed a
moderate inter-correlation of .624
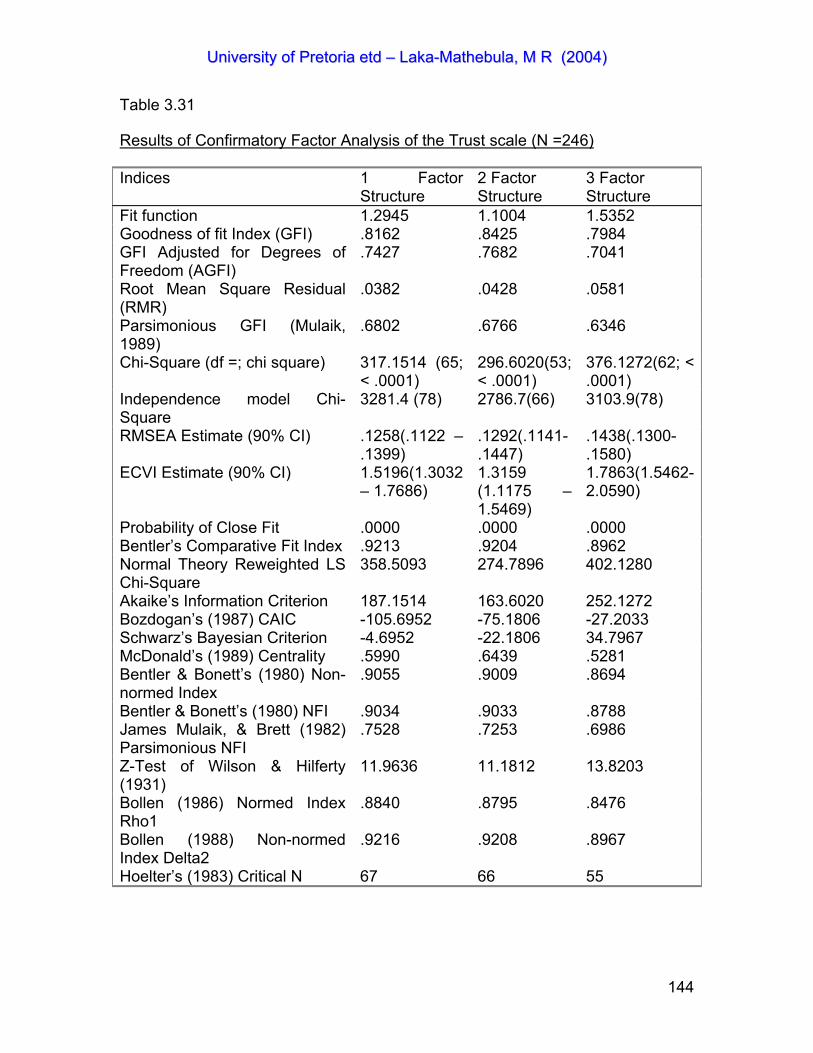
UUnniivveerrssiittyy ooff PPrreettoorriiaa eettdd –– LLaakkaa--MMaatthheebbuullaa,, MM RR ((22000044))
144
Table 3.31
Results of Confirmatory Factor Analysis of the Trust scale (N =246)
Indices 1 Factor Structure
2 Factor Structure
3 Factor Structure
Fit function 1.2945 1.1004 1.5352 Goodness of fit Index (GFI) .8162 .8425 .7984 GFI Adjusted for Degrees of Freedom (AGFI)
.7427 .7682 .7041
Root Mean Square Residual (RMR)
.0382 .0428 .0581
Parsimonious GFI (Mulaik, 1989)
.6802 .6766 .6346
Chi-Square (df =; chi square) 317.1514 (65; < .0001)
296.6020(53; < .0001)
376.1272(62; < .0001)
Independence model Chi-Square
3281.4 (78) 2786.7(66) 3103.9(78)
RMSEA Estimate (90% CI) .1258(.1122 – .1399)
.1292(.1141-
.1447) .1438(.1300-.1580)
ECVI Estimate (90% CI) 1.5196(1.3032 – 1.7686)
1.3159 (1.1175 – 1.5469)
1.7863(1.5462-2.0590)
Probability of Close Fit .0000 .0000 .0000 Bentler’s Comparative Fit Index .9213 .9204 .8962 Normal Theory Reweighted LS Chi-Square
358.5093 274.7896 402.1280
Akaike’s Information Criterion 187.1514 163.6020 252.1272 Bozdogan’s (1987) CAIC -105.6952 -75.1806 -27.2033 Schwarz’s Bayesian Criterion -4.6952 -22.1806 34.7967 McDonald’s (1989) Centrality .5990 .6439 .5281 Bentler & Bonett’s (1980) Non-normed Index
.9055 .9009 .8694
Bentler & Bonett’s (1980) NFI .9034 .9033 .8788 James Mulaik, & Brett (1982) Parsimonious NFI
.7528 .7253 .6986
Z-Test of Wilson & Hilferty (1931)
11.9636 11.1812 13.8203
Bollen (1986) Normed Index Rho1
.8840 .8795 .8476
Bollen (1988) Non-normed Index Delta2
.9216 .9208 .8967
Hoelter’s (1983) Critical N 67 66 55

UUnniivveerrssiittyy ooff PPrreettoorriiaa eettdd –– LLaakkaa--MMaatthheebbuullaa,, MM RR ((22000044))
145
3.6.4. Factor structure of the Multifactor Leadership scale
In order to validate the psychometric properties of Bass and Avolio’s (1995)
MLQ scale when applied to the research sample, the factor analysis procedure
described in 3.5 was followed. An analysis of the total 45 items identified seven
(7) Eigenvalues of >1.00 and the Scree test suggested that it was possible to
extract up to five factors. The Eigenvalues of the factors that are >1.00 were
2.600, 3.247, 1.859, 1.327, 1.181, 1.038 and 1.008, respectively. The Scree test
showed a break between Eigenvalues 1 and 2; Eigenvalues 2 and 3;
Eigenvalues 3 and 4; and Eigenvalues 5 and 6. The breaks between Eigenvalues
4 and 5; and Eigenvalues 6 and 7 were not clear. This suggests a possible five
factors.
The results of the one-factor structure analysis resulted in 39 items being
retained. Six items were eliminated as they had factor loadings of <. 25. The
Cronbach Alpha of the one factor structure was .97. In the two-factor structure,
eight items were eliminated. These items loaded onto both factors with loadings
greater than .25.
In the three-factor structure, Factor 1 explained 48.37% of the total
variance in data space and 87.22% of the common variance. Factor 2 explained
4.28% of the total variance and 7.72% of common variance while Factor 3
explained 2.81% of the total variance and 8.49% of the common variance. The
Cronbach alphas of the factors were .97, .60, .63, respectively. The three-factor
solution is shown in Table 3.32.
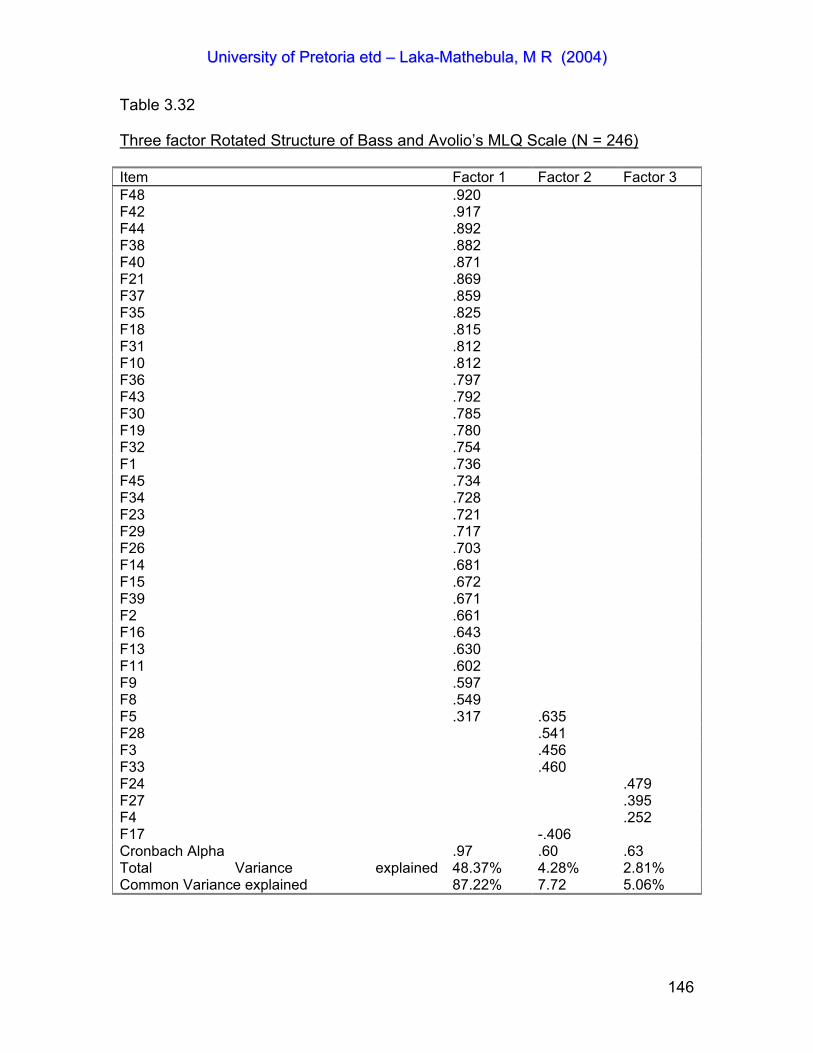
UUnniivveerrssiittyy ooff PPrreettoorriiaa eettdd –– LLaakkaa--MMaatthheebbuullaa,, MM RR ((22000044))
146
Table 3.32
Three factor Rotated Structure of Bass and Avolio’s MLQ Scale (N = 246)
Item Factor 1 Factor 2 Factor 3 F48 .920 F42 .917 F44 .892 F38 .882 F40 .871 F21 .869 F37 .859 F35 .825 F18 .815 F31 .812 F10 .812 F36 .797 F43 .792 F30 .785 F19 .780 F32 .754 F1 .736 F45 .734 F34 .728 F23 .721 F29 .717 F26 .703 F14 .681 F15 .672 F39 .671 F2 .661 F16 .643 F13 .630 F11 .602 F9 .597 F8 .549 F5 .317 .635 F28 .541 F3 .456 F33 .460 F24 .479 F27 .395 F4 .252 F17 -.406 Cronbach Alpha Total Variance explained Common Variance explained
.97 48.37% 87.22%
.60 4.28% 7.72
.63 2.81% 5.06%
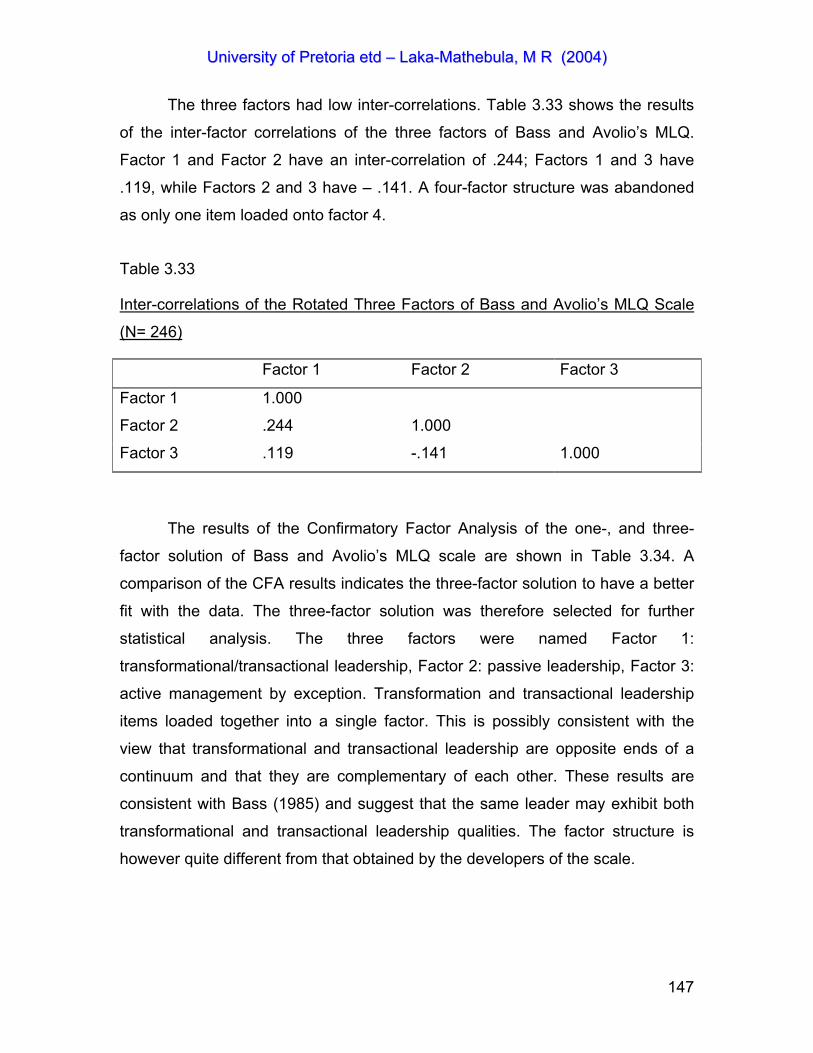
UUnniivveerrssiittyy ooff PPrreettoorriiaa eettdd –– LLaakkaa--MMaatthheebbuullaa,, MM RR ((22000044))
147
The three factors had low inter-correlations. Table 3.33 shows the results
of the inter-factor correlations of the three factors of Bass and Avolio’s MLQ.
Factor 1 and Factor 2 have an inter-correlation of .244; Factors 1 and 3 have
.119, while Factors 2 and 3 have – .141. A four-factor structure was abandoned
as only one item loaded onto factor 4.
Table 3.33
Inter-correlations of the Rotated Three Factors of Bass and Avolio’s MLQ Scale
(N= 246)
Factor 1 Factor 2 Factor 3
Factor 1 1.000
Factor 2 .244 1.000
Factor 3 .119 -.141 1.000
The results of the Confirmatory Factor Analysis of the one-, and three-
factor solution of Bass and Avolio’s MLQ scale are shown in Table 3.34. A
comparison of the CFA results indicates the three-factor solution to have a better
fit with the data. The three-factor solution was therefore selected for further
statistical analysis. The three factors were named Factor 1:
transformational/transactional leadership, Factor 2: passive leadership, Factor 3:
active management by exception. Transformation and transactional leadership
items loaded together into a single factor. This is possibly consistent with the
view that transformational and transactional leadership are opposite ends of a
continuum and that they are complementary of each other. These results are
consistent with Bass (1985) and suggest that the same leader may exhibit both
transformational and transactional leadership qualities. The factor structure is
however quite different from that obtained by the developers of the scale.

UUnniivveerrssiittyy ooff PPrreettoorriiaa eettdd –– LLaakkaa--MMaatthheebbuullaa,, MM RR ((22000044))
148
Table 3.34
Results of Confirmatory Factor Analysis of Bass and Avolio’s MLQ Scale (N
=246)
Indices 1Factor Structure
3 Factor Structure
Fit function .7504 .6095 Goodness of fit Index (GFI) .8806 .9185 GFI Adjusted for Degrees of Freedom (AGFI) .8124 .8804 Root Mean Square Residual (RMR) .0641 .0473 Parsimonious GFI (Mulaik, 1989) .6849 .7301 Chi-Square (df =; chi square) 183.8486(35;
< .0001) 149.3322(62; < .0001)
Independence model Chi-Square 2555.0(55) 2823.5(78) RMSEA Estimate (90% CI) .1318(.1133-
.1508) .0758(.0604-.0914)
ECVI Estimate (90% CI) .9213(.7604-1.1145)
.8606(.7278-1.0268)
Probability of Close Fit .0000 .0039 Bentler’s Comparative Fit Index .9407 .9682 Normal Theory Reweighted LS Chi-Square 166.0606 141.2750 Akaike’s Information Criterion 113.8486 25.3322 Bozdogan’s (1987) CAIC -43.8380 -253.9984 Schwarz’s Bayesian Criterion -8.8380 -191.9984 McDonald’s (1989) Centrality .7389 .8374 Bentler & Bonett’s (1980) Non-normed Index .9238 .9600 Bentler & Bonett’s (1980) NFI .9280 .9471 James Mulaik, & Brett (1982) Parsimonious NFI
.7218 .7528
Z-Test of Wilson & Hilferty (1931) 9.3456 5.7467 Bollen (1986) Normed Index Rho1 .9075 .9335 Bollen (1988) Non-normed Index Delta2 .9409 .9684 Hoelter’s (1983) Critical N 68 135
UUnniivveerrssiittyy ooff PPrreettoorriiaa eettdd –– LLaakkaa--MMaatthheebbuullaa,, MM RR ((22000044))
149
3.7 SUMMARY
This chapter presented a description of the research methodology used in
this study: the participants of the study, the research instruments, and the
procedure of data collection and data analysis. The psychometric properties of
the research instruments used in the study were reported.
The Meyer and Allen (1991) questionnaire was factor analysed to reveal
three factors, which corresponded with the authors’ original factors. The factors
were named Affective Commitment; Continuance Commitment and Normative
Commitment. The HRM questionnaire’s factor analysis resulted with six factors.
These factors were: Information Sharing, Promotions Opportunities, Job
Insecurity; Comprehensive Training; Performance and Equitable Rewards and
Commitment to HRM practices. Selective Staffing and Employee Participation
were not extracted with this sample.
Although a three-factor solution was obtained for the Ferres et al (2001)
trust questionnaire, the two-factor solution was selected as it gave a better
though only a reasonable fit with the data. The two factors were named Trust in
Supervisor and Organization and Trust in Co-worker. Factor analysis of Bass and
Avolio’s (1995) 5X MLQ questionnaire resulted with three factors instead of the
expected five. The factors were named Transformational/Transactional
Leadership; Laissez Faire Leadership and Management by Exception (active).
These factors will be used for further analysis in Chapter VI.
UUnniivveerrssiittyy ooff PPrreettoorriiaa eettdd –– LLaakkaa--MMaatthheebbuullaa,, MM RR ((22000044))
150
CHAPTER FOUR: RESEARCH FINDINGS
4.1 INTRODUCTION
The main aim of this research was to model the relationships between
organizational commitment, HRM practices, leadership styles and trust. A
secondary aim was to explore the relationship of demographic variables peculiar
to academic institutions on the different types of organizational commitment. To
accomplish these purposes the study was designed to explore these questions:
1) What is the relationship between demographic variables and
organizational commitment?
2) What is the inter-relationship between HRM practices, leadership style,
organizational trust and organizational commitment?
3) To what degree do specific subscales predict organizational commitment
subscales and total organizational commitment?
4) Can a structural equations model be built regressing HRM practices,
leadership style and organizational trust on organizational commitment as
a dependent variable?
The psychometrically defined variables as well as the demographic
variables to be used in further analyses, aimed at finding answers to the four
research questions are shown in Table 4.1.

UUnniivveerrssiittyy ooff PPrreettoorriiaa eettdd –– LLaakkaa--MMaatthheebbuullaa,, MM RR ((22000044))
151
Table 4.1
Variables Included in the Analyses
Variable Description AC Affective Commitment CC Continuance commitment NC Normative commitment OCtot Total organizational commitment IS Information sharing JS Job security PO Promotions opportunities CT Comprehensive training PER Performance & equitable rewards CHRM Commitment to HRM HRMtot Total HRM practices TSO Trust in supervisor & organization TCW Trust in co-worker Ttot Total trust TNF/TNX Transformational/Transactional leadership LFL Laissez faire leadership MBEA Management by exception (active) G183 Age G184 Gender G185 Educational level G 186 Current position G187 Tenure in academia G188 Tenure in position G189 Tenure in organization G190 Involvement in decision-making G191 Current Language G192 Mother tongue G193 Type of campus G194 Type of educational institution G195 Institutional age G196 Institutional size G197 Type of academic institution G198 Restructuring in institution G199 Time when restructuring happened G200 Institution

UUnniivveerrssiittyy ooff PPrreettoorriiaa eettdd –– LLaakkaa--MMaatthheebbuullaa,, MM RR ((22000044))
152
4.2 RESULTS
4.2.1. Demographics and OC
Research Question 1: What is the relationship between demographic
variables and organizational commitment?
In order to investigate the relationships between organizational
commitment and the demographic variables of the respondents, Analysis of
variance (ANOVA) was used to investigate the variance of the organizational
commitment responses of the respondents to the demographic variables. The
proper application of the ANOVA procedure requires that certain assumptions
are met, one assumption being that the sample with which we work was drawn
from a population that is normally distributed (Kerlinger & Lee, 2000). Kerlinger
and Lee (2000) recommend that where the normality of the data was not certain,
nonparametric tests should be preferred. However, Kerlinger and Lee (2000)
indicate that ANOVA can be used if the distributions are not very skewed.
All the variables measured on continuous were divided into categories and
ANOVAs were done with commitment scores as dependent variables and
categorical variables as independent variables. The results are shown in Tables
4.2 to 4.6.

UUnniivveerrssiittyy ooff PPrreettoorriiaa eettdd –– LLaakkaa--MMaatthheebbuullaa,, MM RR ((22000044))
153
Table 4.2
Results of Analysis of Variance of with Demographic Variables as Independent
Variables and Affective Commitment as Dependent Variable (N = 246)
Variable df Sum
of squaresMean of squares
F value P > F
Age 3 151.116 50.371 .78 .5133Gender 1 73.093 73.092 1.13 .2946Educational level 3 157.238 52.412 .81 .4963Current position 2 123.991 61.995 .96 .3928Tenure in academia 4 381.395 95.348 1.47 .2298Tenure in position 2 190.370 95.185 1.47 .2427Tenure in organization 3 82.322 27.440 .42 .7367Involvement in decision-making 3 814.759 271.586 4.20* .0118Current Language 2 39.811 19.905 .31 .7370Mother tongue 2 66.235 33.117 .51 .6035Type of campus 2 115.788 57.894 .90 .4172Type of educational institution 3 20.467 6.822 .11 .9564Institutional age 2 25.038 12.519 .19 .8248Institutional size 5 307.020 61.404 .95 .4610Type of academic institution 2 346.980 173.490 2.68 .0817Restructuring in institution 1 54.926 54.926 .85 .3627Time when restructuring happened 2 252.584 126.292 1.95 .1563Institution 10 569.093 56.909 .88 .5598
Note * = statistically significant at the 95% level of confidence
Almost all the results of the ANOVAs indicate that significant relationships
between the demographic variables and the affective commitment subscale did
not exist. The only groups that were significantly different at p ≤ 0.05 were the
groups formed in terms of the degree of involvement in decision-making. Tukey’s
studentized range test, however, failed to indicate any significant differences
between the scores of the groups on this variable.
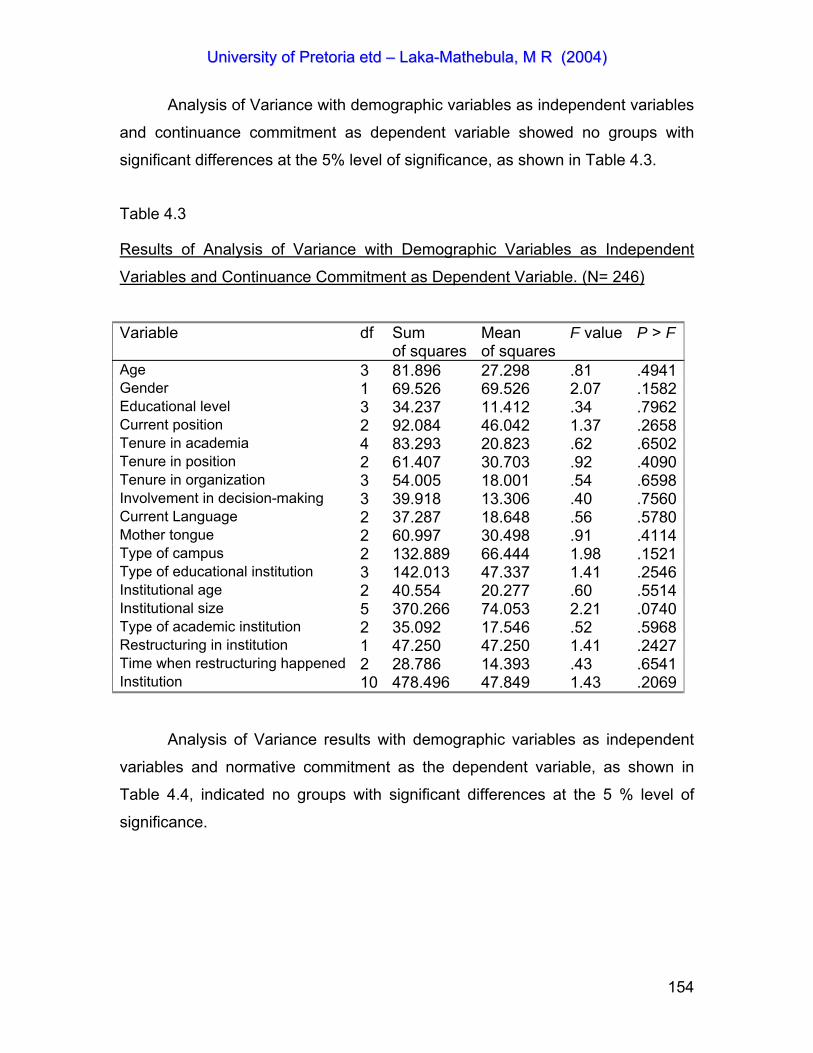
UUnniivveerrssiittyy ooff PPrreettoorriiaa eettdd –– LLaakkaa--MMaatthheebbuullaa,, MM RR ((22000044))
154
Analysis of Variance with demographic variables as independent variables
and continuance commitment as dependent variable showed no groups with
significant differences at the 5% level of significance, as shown in Table 4.3.
Table 4.3
Results of Analysis of Variance with Demographic Variables as Independent
Variables and Continuance Commitment as Dependent Variable. (N= 246)
Variable df Sum
of squaresMean of squares
F value P > F
Age 3 81.896 27.298 .81 .4941Gender 1 69.526 69.526 2.07 .1582Educational level 3 34.237 11.412 .34 .7962Current position 2 92.084 46.042 1.37 .2658Tenure in academia 4 83.293 20.823 .62 .6502Tenure in position 2 61.407 30.703 .92 .4090Tenure in organization 3 54.005 18.001 .54 .6598Involvement in decision-making 3 39.918 13.306 .40 .7560Current Language 2 37.287 18.648 .56 .5780Mother tongue 2 60.997 30.498 .91 .4114Type of campus 2 132.889 66.444 1.98 .1521Type of educational institution 3 142.013 47.337 1.41 .2546Institutional age 2 40.554 20.277 .60 .5514Institutional size 5 370.266 74.053 2.21 .0740Type of academic institution 2 35.092 17.546 .52 .5968Restructuring in institution 1 47.250 47.250 1.41 .2427Time when restructuring happened 2 28.786 14.393 .43 .6541Institution 10 478.496 47.849 1.43 .2069
Analysis of Variance results with demographic variables as independent
variables and normative commitment as the dependent variable, as shown in
Table 4.4, indicated no groups with significant differences at the 5 % level of
significance.
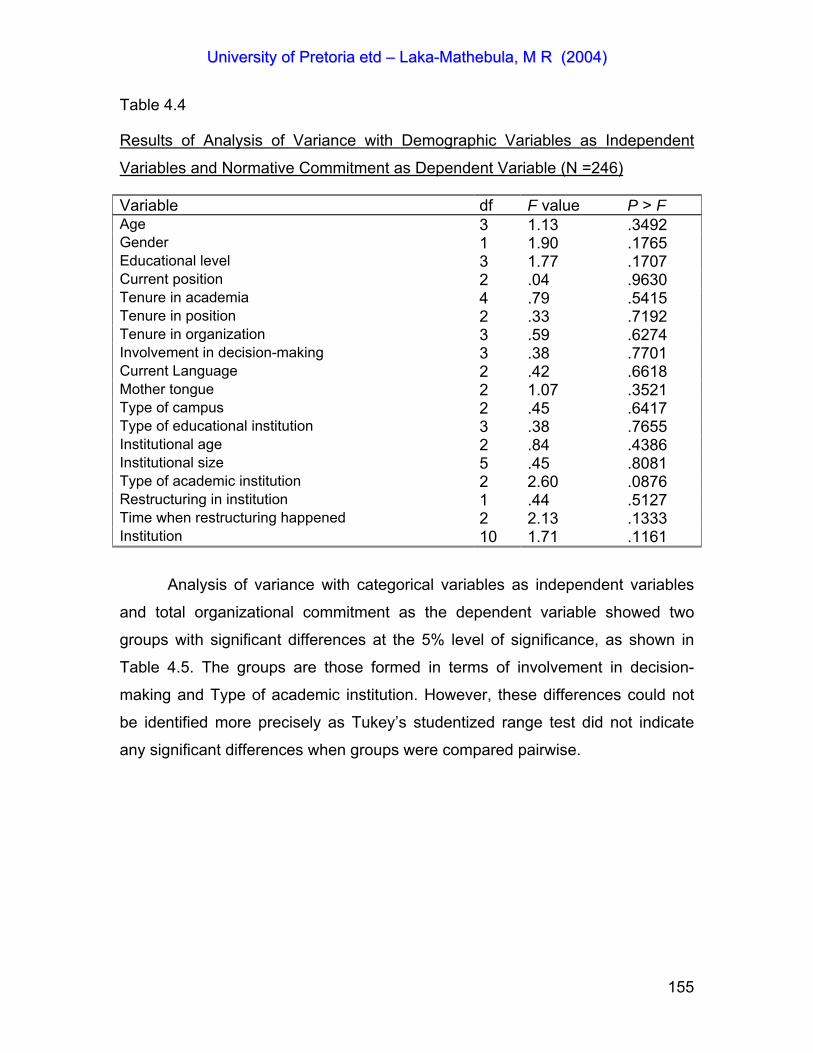
UUnniivveerrssiittyy ooff PPrreettoorriiaa eettdd –– LLaakkaa--MMaatthheebbuullaa,, MM RR ((22000044))
155
Table 4.4
Results of Analysis of Variance with Demographic Variables as Independent
Variables and Normative Commitment as Dependent Variable (N =246)
Variable df F value P > F Age 3 1.13 .3492 Gender 1 1.90 .1765 Educational level 3 1.77 .1707 Current position 2 .04 .9630 Tenure in academia 4 .79 .5415 Tenure in position 2 .33 .7192 Tenure in organization 3 .59 .6274 Involvement in decision-making 3 .38 .7701 Current Language 2 .42 .6618 Mother tongue 2 1.07 .3521 Type of campus 2 .45 .6417 Type of educational institution 3 .38 .7655 Institutional age 2 .84 .4386 Institutional size 5 .45 .8081 Type of academic institution 2 2.60 .0876 Restructuring in institution 1 .44 .5127 Time when restructuring happened 2 2.13 .1333 Institution 10 1.71 .1161
Analysis of variance with categorical variables as independent variables
and total organizational commitment as the dependent variable showed two
groups with significant differences at the 5% level of significance, as shown in
Table 4.5. The groups are those formed in terms of involvement in decision-
making and Type of academic institution. However, these differences could not
be identified more precisely as Tukey’s studentized range test did not indicate
any significant differences when groups were compared pairwise.
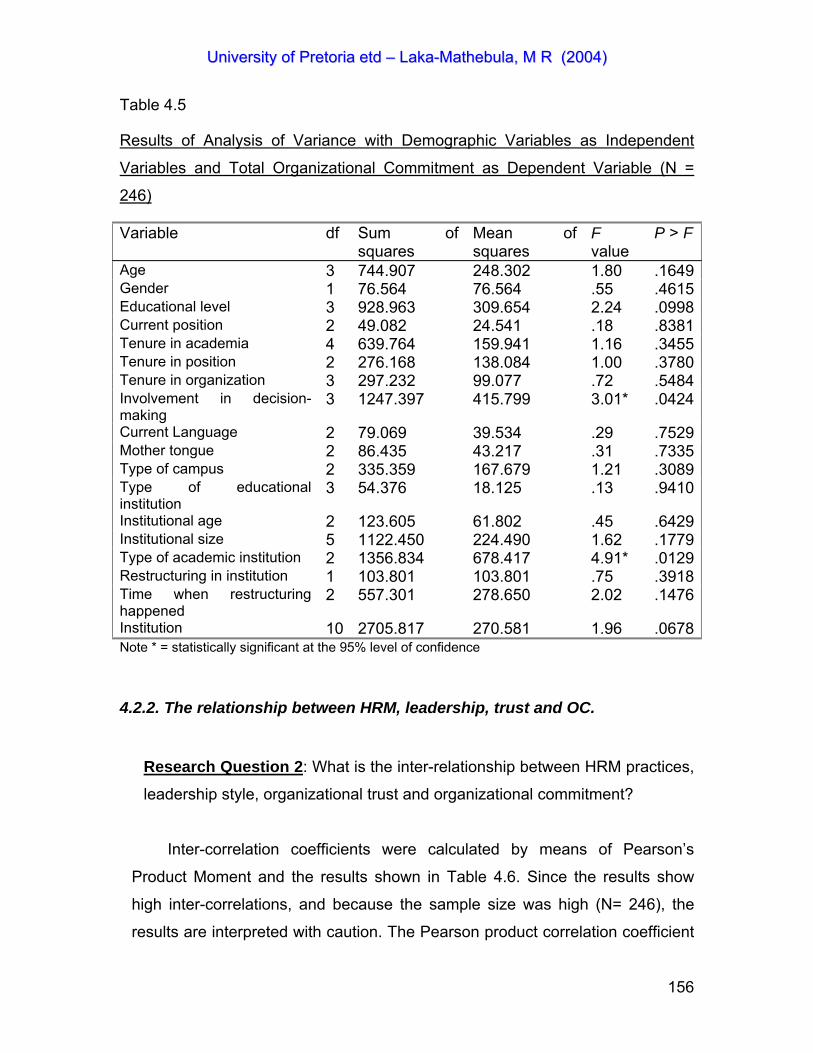
UUnniivveerrssiittyy ooff PPrreettoorriiaa eettdd –– LLaakkaa--MMaatthheebbuullaa,, MM RR ((22000044))
156
Table 4.5
Results of Analysis of Variance with Demographic Variables as Independent
Variables and Total Organizational Commitment as Dependent Variable (N =
246)
Variable df Sum of squares
Mean of squares
F value
P > F
Age 3 744.907 248.302 1.80 .1649Gender 1 76.564 76.564 .55 .4615Educational level 3 928.963 309.654 2.24 .0998Current position 2 49.082 24.541 .18 .8381Tenure in academia 4 639.764 159.941 1.16 .3455Tenure in position 2 276.168 138.084 1.00 .3780Tenure in organization 3 297.232 99.077 .72 .5484Involvement in decision-making
3 1247.397 415.799 3.01* .0424
Current Language 2 79.069 39.534 .29 .7529Mother tongue 2 86.435 43.217 .31 .7335Type of campus 2 335.359 167.679 1.21 .3089Type of educational institution
3 54.376 18.125 .13 .9410
Institutional age 2 123.605 61.802 .45 .6429Institutional size 5 1122.450 224.490 1.62 .1779Type of academic institution 2 1356.834 678.417 4.91* .0129Restructuring in institution 1 103.801 103.801 .75 .3918Time when restructuring happened
2 557.301 278.650 2.02 .1476
Institution 10 2705.817 270.581 1.96 .0678Note * = statistically significant at the 95% level of confidence
4.2.2. The relationship between HRM, leadership, trust and OC.
Research Question 2: What is the inter-relationship between HRM practices,
leadership style, organizational trust and organizational commitment?
Inter-correlation coefficients were calculated by means of Pearson’s
Product Moment and the results shown in Table 4.6. Since the results show
high inter-correlations, and because the sample size was high (N= 246), the
results are interpreted with caution. The Pearson product correlation coefficient
UUnniivveerrssiittyy ooff PPrreettoorriiaa eettdd –– LLaakkaa--MMaatthheebbuullaa,, MM RR ((22000044))
157
was squared and the results multiplied by 100 (100 r2) to calculate coefficient of
determination. It represents the percent of the variance in the dependent
variable explained by the independent variable, that is, the common variance.
The 100 r2 results are shown in Table 4.7.
The interpretation of the correlation coefficients and the common variance
was based on the classical five “rules of thumb” as suggested by Franzblau
(1958). These are:
• r ranging from 0 to .20 may be regarded as indicating no or negligible
correlation
• r ranging from .20 to .40 may be regarded as indicating a low degree of
correlation
• r ranging from .40 to .60 may be regarded as indicating a moderate
degree of correlation
• r ranging from .60 to .80 may be regarded as indicating a marked
degree of correlation
• r ranging from .80 to 1.00 may be regarded as indicating high
correlation
The following interpretations are made for the 100 r2:
o Lower than 5% = low conceptual correlation
o 6-10% = useful conceptual correlation
o 11-15% = moderate conceptual correlation
o 16-25% = high conceptual correlation and
o >25 = very high conceptual correlation
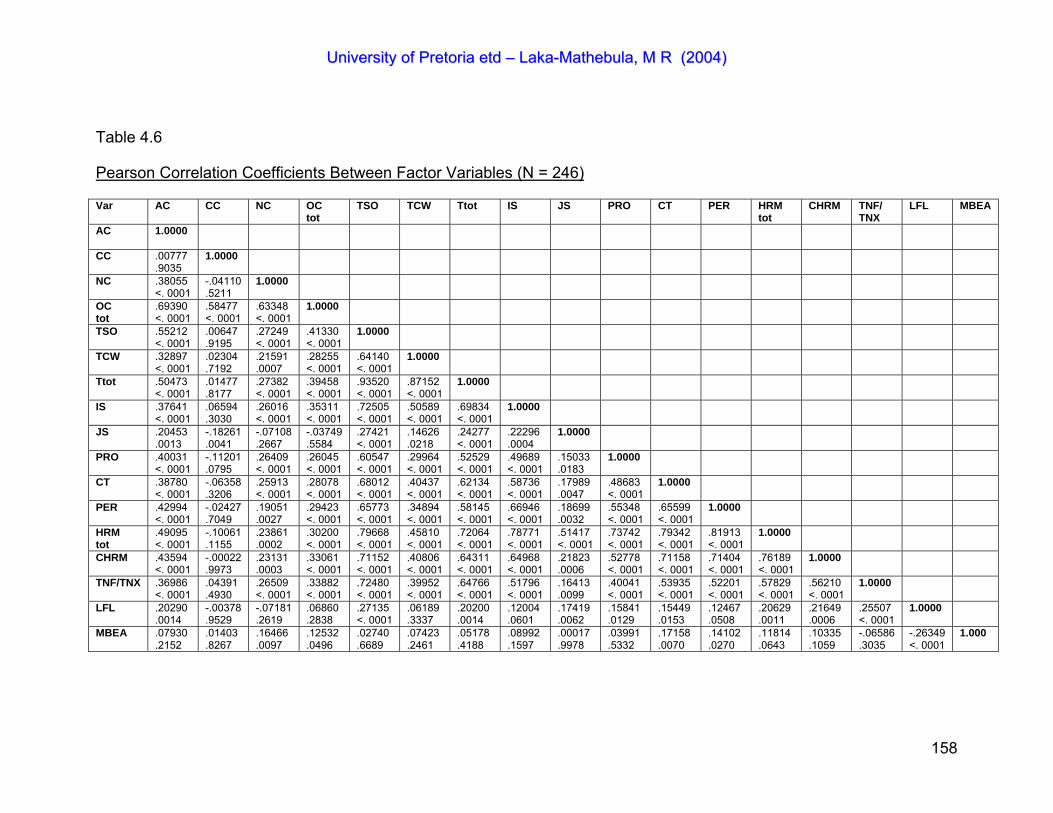
UUnniivveerrssiittyy ooff PPrreettoorriiaa eettdd –– LLaakkaa--MMaatthheebbuullaa,, MM RR ((22000044))
158
Table 4.6
Pearson Correlation Coefficients Between Factor Variables (N = 246)
Var AC CC NC OC tot
TSO TCW Ttot IS JS PRO CT PER HRM tot
CHRM TNF/ TNX
LFL MBEA
AC 1.0000
CC .00777 .9035
1.0000
NC .38055 <. 0001
-.04110 .5211
1.0000
OC tot
.69390 <. 0001
.58477 <. 0001
.63348 <. 0001
1.0000
TSO .55212 <. 0001
.00647
.9195 .27249 <. 0001
.41330 <. 0001
1.0000
TCW .32897 <. 0001
.02304
.7192 .21591 .0007
.28255 <. 0001
.64140 <. 0001
1.0000
Ttot .50473 <. 0001
.01477
.8177 .27382 <. 0001
.39458 <. 0001
.93520 <. 0001
.87152 <. 0001
1.0000
IS .37641 <. 0001
.06594
.3030 .26016 <. 0001
.35311 <. 0001
.72505 <. 0001
.50589 <. 0001
.69834 <. 0001
1.0000
JS .20453 .0013
-.18261 .0041
-.07108 .2667
-.03749 .5584
.27421 <. 0001
.14626
.0218 .24277 <. 0001
.22296
.0004 1.0000
PRO .40031 <. 0001
-.11201 .0795
.26409 <. 0001
.26045 <. 0001
.60547 <. 0001
.29964 <. 0001
.52529 <. 0001
.49689 <. 0001
.15033
.0183 1.0000
CT .38780 <. 0001
-.06358 .3206
.25913 <. 0001
.28078 <. 0001
.68012 <. 0001
.40437 <. 0001
.62134 <. 0001
.58736 <. 0001
.17989
.0047 .48683 <. 0001
1.0000
PER .42994 <. 0001
-.02427 .7049
.19051
.0027 .29423 <. 0001
.65773 <. 0001
.34894 <. 0001
.58145 <. 0001
.66946 <. 0001
.18699
.0032 .55348 <. 0001
.65599 <. 0001
1.0000
HRM tot
.49095 <. 0001
-.10061 .1155
.23861
.0002 .30200 <. 0001
.79668 <. 0001
.45810 <. 0001
.72064 <. 0001
.78771 <. 0001
.51417 <. 0001
.73742 <. 0001
.79342 <. 0001
.81913 <. 0001
1.0000
CHRM .43594 <. 0001
-.00022 .9973
.23131
.0003 .33061 <. 0001
.71152 <. 0001
.40806 <. 0001
.64311 <. 0001
.64968 <. 0001
.21823
.0006 .52778 <. 0001
.71158 <. 0001
.71404 <. 0001
.76189 <. 0001
1.0000
TNF/TNX .36986 <. 0001
.04391
.4930 .26509 <. 0001
.33882 <. 0001
.72480 <. 0001
.39952 <. 0001
.64766 <. 0001
.51796 <. 0001
.16413
.0099 .40041 <. 0001
.53935 <. 0001
.52201 <. 0001
.57829 <. 0001
.56210 <. 0001
1.0000
LFL .20290 .0014
-.00378 .9529
-.07181 .2619
.06860
.2838 .27135 <. 0001
.06189
.3337 .20200 .0014
.12004
.0601 .17419 .0062
.15841
.0129 .15449 .0153
.12467
.0508 .20629 .0011
.21649
.0006 .25507 <. 0001
1.0000
MBEA .07930 .2152
.01403
.8267 .16466 .0097
.12532
.0496 .02740 .6689
.07423
.2461 .05178 .4188
.08992
.1597 .00017 .9978
.03991
.5332 .17158 .0070
.14102
.0270 .11814 .0643
.10335
.1059 -.06586 .3035
-.26349 <. 0001
1.000
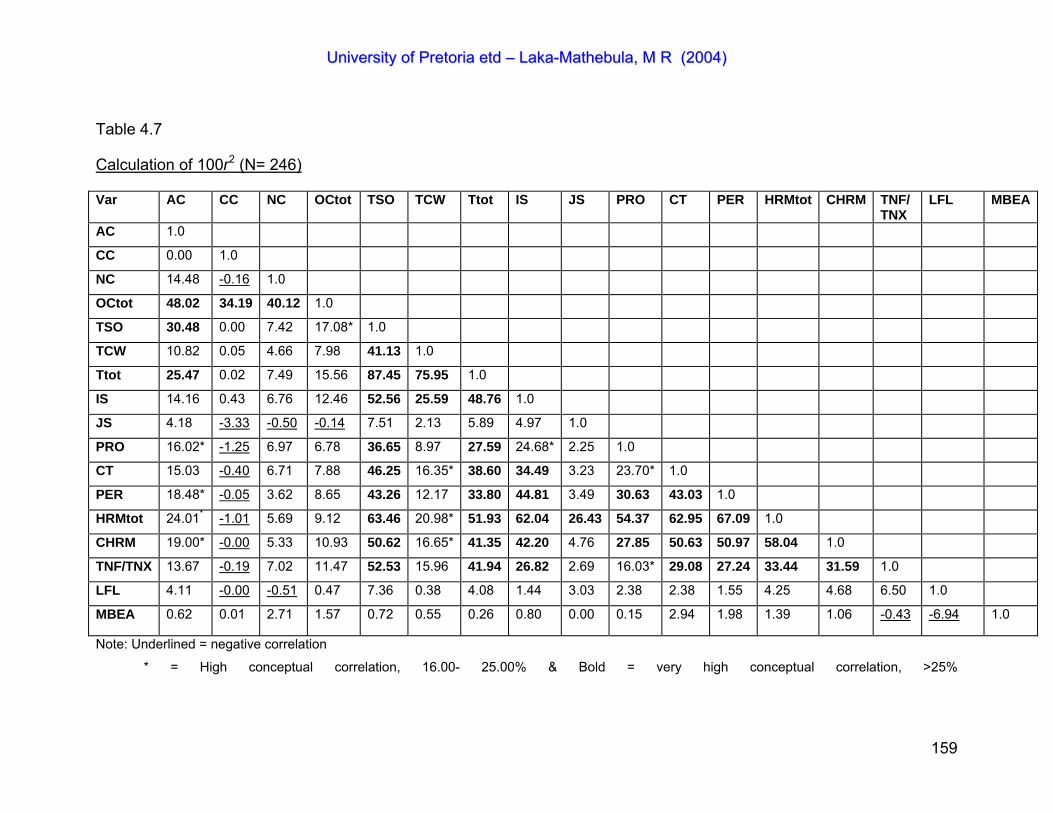
UUnniivveerrssiittyy ooff PPrreettoorriiaa eettdd –– LLaakkaa--MMaatthheebbuullaa,, MM RR ((22000044))
159
Table 4.7
Calculation of 100r2 (N= 246)
Var AC CC NC OCtot TSO TCW Ttot IS JS PRO CT PER HRMtot CHRM TNF/TNX
LFL MBEA
AC 1.0
CC 0.00 1.0
NC 14.48 -0.16 1.0
OCtot 48.02 34.19 40.12 1.0
TSO 30.48 0.00 7.42 17.08* 1.0
TCW 10.82 0.05 4.66 7.98 41.13 1.0
Ttot 25.47 0.02 7.49 15.56 87.45 75.95 1.0
IS 14.16 0.43 6.76 12.46 52.56 25.59 48.76 1.0
JS 4.18 -3.33 -0.50 -0.14 7.51 2.13 5.89 4.97 1.0
PRO 16.02* -1.25 6.97 6.78 36.65 8.97 27.59 24.68* 2.25 1.0
CT 15.03 -0.40 6.71 7.88 46.25 16.35* 38.60 34.49 3.23 23.70* 1.0
PER 18.48* -0.05 3.62 8.65 43.26 12.17 33.80 44.81 3.49 30.63 43.03 1.0
HRMtot 24.01* -1.01 5.69 9.12 63.46 20.98* 51.93 62.04 26.43 54.37 62.95 67.09 1.0
CHRM 19.00* -0.00 5.33 10.93 50.62 16.65* 41.35 42.20 4.76 27.85 50.63 50.97 58.04 1.0
TNF/TNX 13.67 -0.19 7.02 11.47 52.53 15.96 41.94 26.82 2.69 16.03* 29.08 27.24 33.44 31.59 1.0
LFL 4.11 -0.00 -0.51 0.47 7.36 0.38 4.08 1.44 3.03 2.38 2.38 1.55 4.25 4.68 6.50 1.0
MBEA 0.62 0.01 2.71 1.57 0.72 0.55 0.26 0.80 0.00 0.15 2.94 1.98 1.39 1.06 -0.43 -6.94 1.0
Note: Underlined = negative correlation
* = High conceptual correlation, 16.00- 25.00% & Bold = very high conceptual correlation, >25%

UUnniivveerrssiittyy ooff PPrreettoorriiaa eettdd –– LLaakkaa--MMaatthheebbuullaa,, MM RR ((22000044))
160
HRM and OC: Table 4.7 indicates that HRM practices have a useful
conceptual correlation with organizational commitment. Total HRM practices
explain 9.12% (r = .302, p < .0001) of the variance of total organizational
commitment. Organizational commitment to HRM practices explains 10.93% (r =
.330, p < .0001) of the variance of total organizational commitment. HRM and
affective commitment subscales however shows moderate to high common
variance. Information sharing and comprehensive training have moderate
common variance with affective commitment of r = .376, p < .0001; 100r2 =
14.16% and r = .388, p < .0001; 100r2 = 15.03%, respectively. Promotion
opportunities, and performance and equitable rewards have high conceptual
correlations with affective commitment of r = .400, p < .0001; 100r2 = 16.02%
and r = .429, p < .0001; 100r2 = 18.48%, respectively. A perception that the
organization is committed to HRM practices is highly correlated with affective
commitment (r = .436, p < .0001; 100r2 = 19.00%). Total HRM is also highly
correlated with affective commitment (r = .491, p < .0001; 100r2 = 24.01%).
Continuance commitment showed negative non-significant common variance
with all of the HRM scales. Normative commitment on the other hand showed
only low common variance with information sharing (r = .260, p < .0001; 100r2 =
6.76%), promotion opportunities (r = .264, p < .0001; 100r2 = 6.97%), total HRM
(r = .239, p < .0001; 100r2 = 5.69%), comprehensive training (r = .259, p < .0001;
100r2 =6.71%), and organizational commitment to HRM practices (r = .231, p <
.0001; 100r2 = 5.33%).
Trust and OC: The relationship between trust and organizational
commitment seems to be a significant one. Total trust has a substantial common
variance of r = .505, p < .0001; 100r2 = 25.47% with affective commitment and a
moderate correlation with total organizational commitment (r = .395, p < .0001;
100r2 = 15.56%). Trust in supervisor and organization has a quite high common
variance of 30.48% (r = .552, p < .0001) with affective commitment. Trust in co-
workers has a useful correlation with affective commitment (r = .329, p < .0001;

UUnniivveerrssiittyy ooff PPrreettoorriiaa eettdd –– LLaakkaa--MMaatthheebbuullaa,, MM RR ((22000044))
161
100r2 = 10.82%) but a low common variance with total commitment (r = .282, p <
.0001; 100r2 = 7.98%). Continuance commitment shows no correlation with any
of the trust scales. Normative commitment on the other hand shows low common
variance with trust in supervisor and organization (r = .272, p < .0001; 100r2 =
7.42%) and total trust (r = .274, p < .0001; 100r2 = 7.49%).
Leadership and OC: Transformational/Transactional leadership style
shows a moderate common variance with affective commitment (r = .369, p <
.0001; 100r2 = 13.69%) and a low common variance with normative commitment
(r = .265, p < .0001; 100r2 = 7.02%). Continuance commitment shows no
correlation with any of the leadership style scales. Laissez faire leadership
behaviour is not usefully related to any of the organizational commitment sub-
scales or the total scale score.
HRM and trust: The organizational trust and HRM practices variables
show a significant correlation. Total HRM practices and total trust have a
common variance of 51.93%. Total HRM on the other hand, has a common
variance with trust in supervisor and organization of r = .797, p < .0001; 100r2 =
63.46% and a moderate common variance of r = .458, p < .0001; 100r2 = 20.
98% with trust in co-worker. Trust in supervisor and organization has a
substantial degree of common variance with information sharing (r = .725, p <
.0001; 100r2 = 52.56%), promotion opportunities (r = .605, p < .0001; 100r2 =
36.65%), comprehensive training (r = .680, p < .0001; 100r2 = 46.25%), and
performance and equitable rewards (r = .658, p < .0001; 100r2 = 43.26%). The
relationship between trust in supervisor and organization and job security is
significant but not strong (r = .274, p < .0001; 100r2 = 7.51%). Trust in supervisor
and organization is positively and highly correlated with the perception of the
organization’s commitment to HRM practices (r = .712, p < .0001; 100r2 =
50.62%). Trust in co-worker has high conceptual correlation with information
sharing (r = .506, p < .0001; 100r2 = 25.59%), comprehensive training (r = .404, p
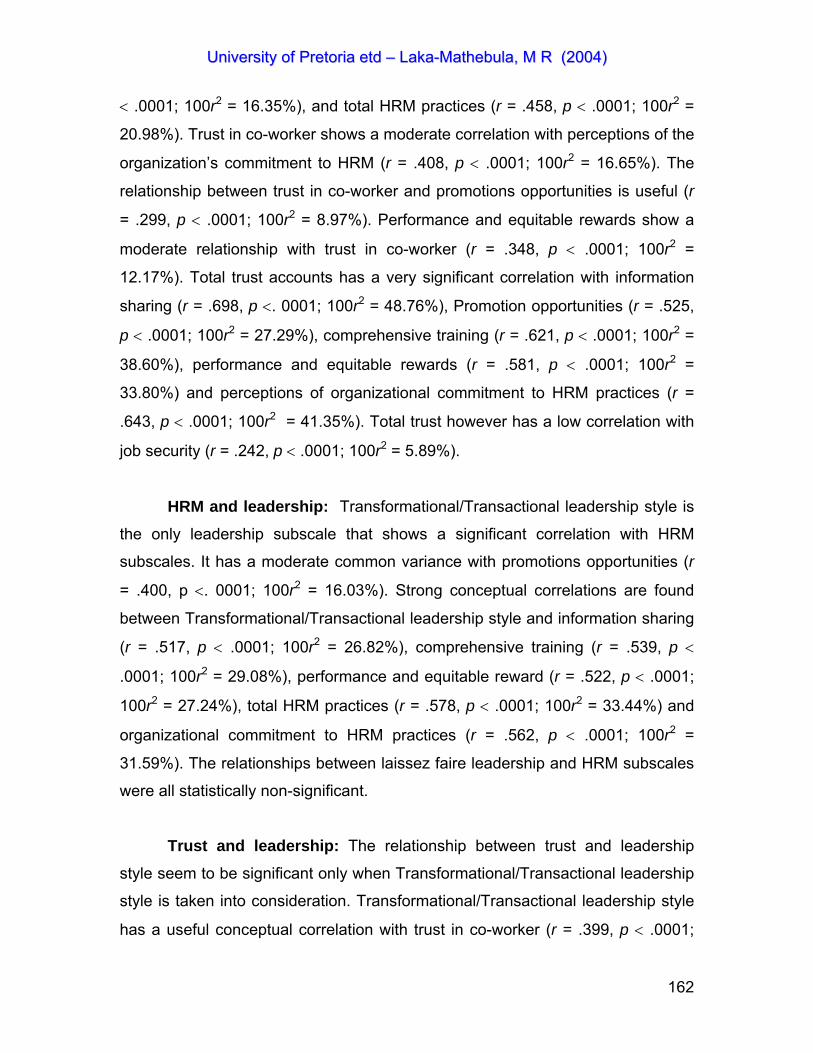
UUnniivveerrssiittyy ooff PPrreettoorriiaa eettdd –– LLaakkaa--MMaatthheebbuullaa,, MM RR ((22000044))
162
< .0001; 100r2 = 16.35%), and total HRM practices (r = .458, p < .0001; 100r2 =
20.98%). Trust in co-worker shows a moderate correlation with perceptions of the
organization’s commitment to HRM (r = .408, p < .0001; 100r2 = 16.65%). The
relationship between trust in co-worker and promotions opportunities is useful (r
= .299, p < .0001; 100r2 = 8.97%). Performance and equitable rewards show a
moderate relationship with trust in co-worker (r = .348, p < .0001; 100r2 =
12.17%). Total trust accounts has a very significant correlation with information
sharing (r = .698, p <. 0001; 100r2 = 48.76%), Promotion opportunities (r = .525,
p < .0001; 100r2 = 27.29%), comprehensive training (r = .621, p < .0001; 100r2 =
38.60%), performance and equitable rewards (r = .581, p < .0001; 100r2 =
33.80%) and perceptions of organizational commitment to HRM practices (r =
.643, p < .0001; 100r2 = 41.35%). Total trust however has a low correlation with
job security (r = .242, p < .0001; 100r2 = 5.89%).
HRM and leadership: Transformational/Transactional leadership style is
the only leadership subscale that shows a significant correlation with HRM
subscales. It has a moderate common variance with promotions opportunities (r
= .400, p <. 0001; 100r2 = 16.03%). Strong conceptual correlations are found
between Transformational/Transactional leadership style and information sharing
(r = .517, p < .0001; 100r2 = 26.82%), comprehensive training (r = .539, p <
.0001; 100r2 = 29.08%), performance and equitable reward (r = .522, p < .0001;
100r2 = 27.24%), total HRM practices (r = .578, p < .0001; 100r2 = 33.44%) and
organizational commitment to HRM practices (r = .562, p < .0001; 100r2 =
31.59%). The relationships between laissez faire leadership and HRM subscales
were all statistically non-significant.
Trust and leadership: The relationship between trust and leadership
style seem to be significant only when Transformational/Transactional leadership
style is taken into consideration. Transformational/Transactional leadership style
has a useful conceptual correlation with trust in co-worker (r = .399, p < .0001;
UUnniivveerrssiittyy ooff PPrreettoorriiaa eettdd –– LLaakkaa--MMaatthheebbuullaa,, MM RR ((22000044))
163
100r2 = 15.96%), and a very high degree of common variance with trust in
supervisor and organization (r = .724, p < .0001; 100r2 = 52.53%) and total trust
(r = .647, p < .0001; 100r2 = 41.94%). Laissez faire leadership has a low
conceptual correlation with trust in supervisor and organization (r = .271, p <
.0001; 100r2 = 7.36%).
4.2.3. The relationship between Organizational commitment and predictor
variables.
Research Question 3: To what degree do specific subscales predict
organizational commitment subscales and total organizational commitment?
Stepwise Multiple Regression was carried out with scale and sub-scales of
organizational commitment as dependent variables and the other subscales as
independent (predictor) variables. Kerlinger and Lee (2000) define multiple
regression as a statistical method that relates one dependent variable to a linear
combination of one or more independent variables. They further explain that this
procedure can help researchers determine how much each independent variable
explains or relates to the dependent variable. In order to carry out Stepwise
Multiple Regression, Ordinary Least Squares regressions are computed in
stages. In one stage, an independent variable that correlates well with the
dependent variable is included in the equation. In the second stage, the
remaining independent variables with the highest partial correlation with the
dependent are entered while at the same time controlling for the first variable.
This process is repeated, at each stage controlling for each previously entered
independent variables until the addition of a remaining variable does not increase
R2 by a significant amount or until all variables are entered. Multiple Regression
is therefore used to predict the variance in an dependent variable by various
independent variables.

UUnniivveerrssiittyy ooff PPrreettoorriiaa eettdd –– LLaakkaa--MMaatthheebbuullaa,, MM RR ((22000044))
164
An important output of Multiple Regression is the multiple correlation
coefficient, R2, which is the proportion of the variance in the dependent explained
uniquely or jointly by the independent variables. The significance of R2 is
determined by the F-test, which is the same as testing the significance of the
regression model as a whole. If the probability of obtaining a large value of (F) <
0.05 then the model would be considered to be significantly better than would be
expected by chance and it can be concluded that there is a linear relationship
between the dependent variable and the independent variable.
Stepwise Multiple Regression with affective commitment as the dependent
variable indicates that only two independent variables, trust in supervisor and
organization, and promotions opportunities, contributed significantly towards
affective commitment at the <.05 level of significance. The prediction model
indicated that 31.17% common variance existed between predictors and the
dependent variable. The C (p) value of 2.86 indicates a good fit with the data as it
approaches the number of variables in the model. The results are summarized in
Table 4.9.
Table 4.9
Results of Multiple Regression Analysis with Affective Commitment as
Dependent Variable and HRM Practices Subscales as Predictor Variables
Variable Partial R2 Model R2 C(p) F(df) P > F
TSO 0.3048 0.3048 3.2894 107.00 (1) <0.0001
PRO 0.0069 0.3117 2.8616 2.43 (2) 0.1204

UUnniivveerrssiittyy ooff PPrreettoorriiaa eettdd –– LLaakkaa--MMaatthheebbuullaa,, MM RR ((22000044))
165
Table 4.10 illustrates the results of the Multiple Regression with
continuance commitment as the dependent variable. The model indicates a weak
prediction of the dependent variable (7.01%) with three independent variables.
Job security, information sharing and promotion opportunities contributed 3.33%,
1.20% and 2.48% respectively to the total prediction. The C(p) value of –0.97 is
numerically lower than the number of variables in the model.
Table 4.10
Results of Multiple Regression Analysis with Continuance Commitment as
Dependent Variable and HRM Practices Subscales as Predictor Variables
Variable Partial R2 Model R2 C(p) F(df) P > F
JS 0.0333 0.0333 4.4035 8.42 (1) 0.0041
IS 0.0120 0.0453 3.3521 3.05(2) 0.0821
PRO 0.0248 0.0701 -0.9748 6.46(3) 0.0117
Table 4.11 indicates that six independent variables entered the prediction
model of normative commitment. The independent variables involved are trust in
supervisor and organization (7.43%), management by exception (active) (2.
47%), job security (2.26%,) promotion opportunities (1.37%), laissez faire
leadership (0.92%) and transformational/transactional leadership (0.10%). The
total prediction of the variance in normative commitment is 15.47%. The C(p)
value of 5.74 indicates a good fit of the data as it approaches the number of
variables in the model.

UUnniivveerrssiittyy ooff PPrreettoorriiaa eettdd –– LLaakkaa--MMaatthheebbuullaa,, MM RR ((22000044))
166
Table 4.11
Results of Multiple Regression Analysis with Normative Commitment as
Dependent Variable and Trust, HRM Practices and Leadership Behaviour Sub-
scales as Predictor Variables
Variable Partial R2 Model R2 C(p) F(df) P > F
TSO 0.0743 0.0743 18.3780 19.57(1) <0.0001
MBEA 0.0247 0.0990 13.4224 6.67(2) 0.0104
JS 0.0226 0.1216 9.0586 6.23(3) 0.0132
PRO 0.0137 0.1353 7.2128 3.819(4) 0.0521
LFL 0.0092 0.1445 6.6198 2.59 (5) 0.1091
TNF/TNX 0.0102 0.1547 5.7482 2.89(6) 0.0906
Table 4.12 illustrates the prediction model of total organizational
commitment by three independent variables; trust in supervisor and organization,
management by exception (active) and job security. The three independent
variables together account for 25.46% of the variance in total organizational
commitment with trust in supervisor and organization accounting for 22.63% of
the variance, management by exception (active) for 1.46% and job security for
1.37 %. The C(p) value of 0.02 indicates a weak fit with the data as it is lower
than the number of variables in the model.
Table 4.12
Results of Multiple Regression Analysis with Total organizational Commitment as
Dependent Variable and Trust, HRM Practices and Leadership Behaviour
Subscales as Predictor Variables
Variable Partial R2 Model R2 C(p) F(df) P > F
TSO 0.2263 0.2263 5.0665 71.37(1; 245) <0.0001
MBEA 0.0146 0.2409 2.3948 4.68(2; 245) 0.0314
JS 0.0137 0.2546 0.0280 4.44(3; 245) 0.0361
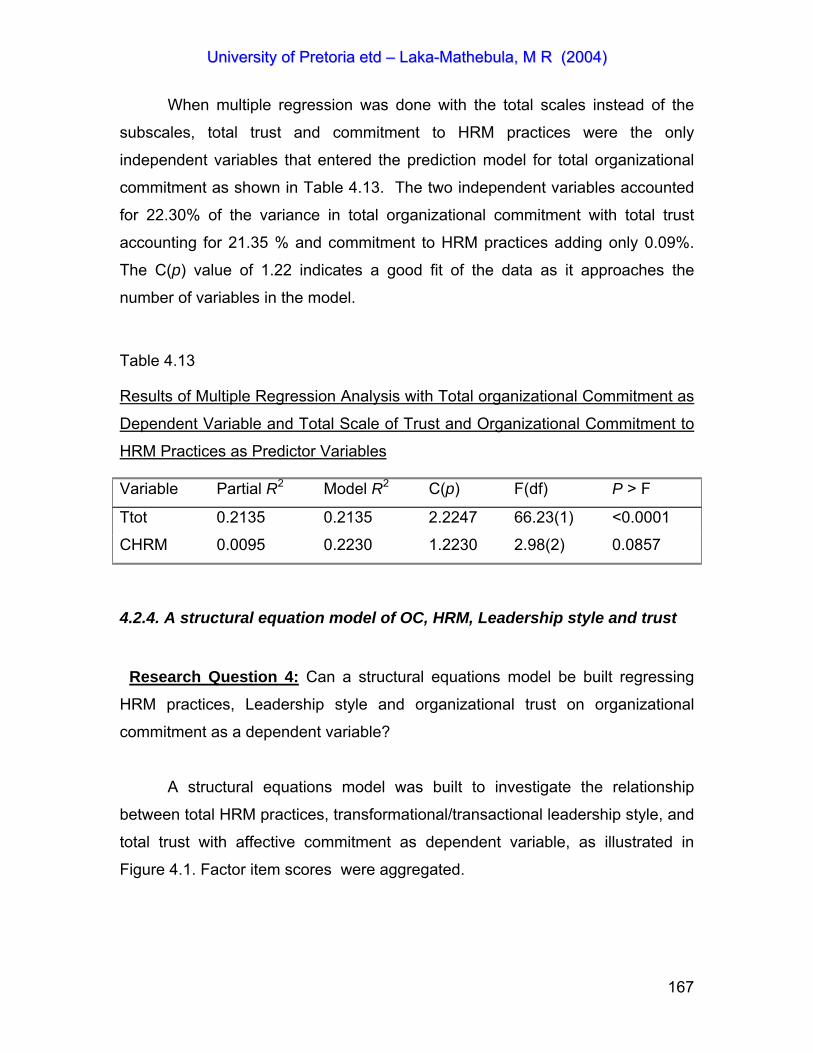
UUnniivveerrssiittyy ooff PPrreettoorriiaa eettdd –– LLaakkaa--MMaatthheebbuullaa,, MM RR ((22000044))
167
When multiple regression was done with the total scales instead of the
subscales, total trust and commitment to HRM practices were the only
independent variables that entered the prediction model for total organizational
commitment as shown in Table 4.13. The two independent variables accounted
for 22.30% of the variance in total organizational commitment with total trust
accounting for 21.35 % and commitment to HRM practices adding only 0.09%.
The C(p) value of 1.22 indicates a good fit of the data as it approaches the
number of variables in the model.
Table 4.13
Results of Multiple Regression Analysis with Total organizational Commitment as
Dependent Variable and Total Scale of Trust and Organizational Commitment to
HRM Practices as Predictor Variables
Variable Partial R2 Model R2 C(p) F(df) P > F
Ttot 0.2135 0.2135 2.2247 66.23(1) <0.0001
CHRM 0.0095 0.2230 1.2230 2.98(2) 0.0857
4.2.4. A structural equation model of OC, HRM, Leadership style and trust
Research Question 4: Can a structural equations model be built regressing
HRM practices, Leadership style and organizational trust on organizational
commitment as a dependent variable?
A structural equations model was built to investigate the relationship
between total HRM practices, transformational/transactional leadership style, and
total trust with affective commitment as dependent variable, as illustrated in
Figure 4.1. Factor item scores were aggregated.

UUnniivveerrssiittyy ooff PPrreettoorriiaa eettdd –– LLaakkaa--MMaatthheebbuullaa,, MM RR ((22000044))
168
.6317
.71571 .6814
.3437
Figure 4.1. Structural equation model of total HRM practices,
transformational/transactional leadership style, total trust as independent
variables and affective commitment as final dependent variable.
In the above figure 4.1 path coefficients are all satisfactory above .30. The
indices obtained from a structural equations analysis of the model are shown in
Table 4.14 in page 170. A weak fit is indicated between the data and the causal
model in Figure 4.1 The RMR and RMSEA values are above the levels
acceptable for a good fit and the relevant fit indices are mostly below .90.
Total HRM
Transformational/transactional leadership
Total trust Affective commitment
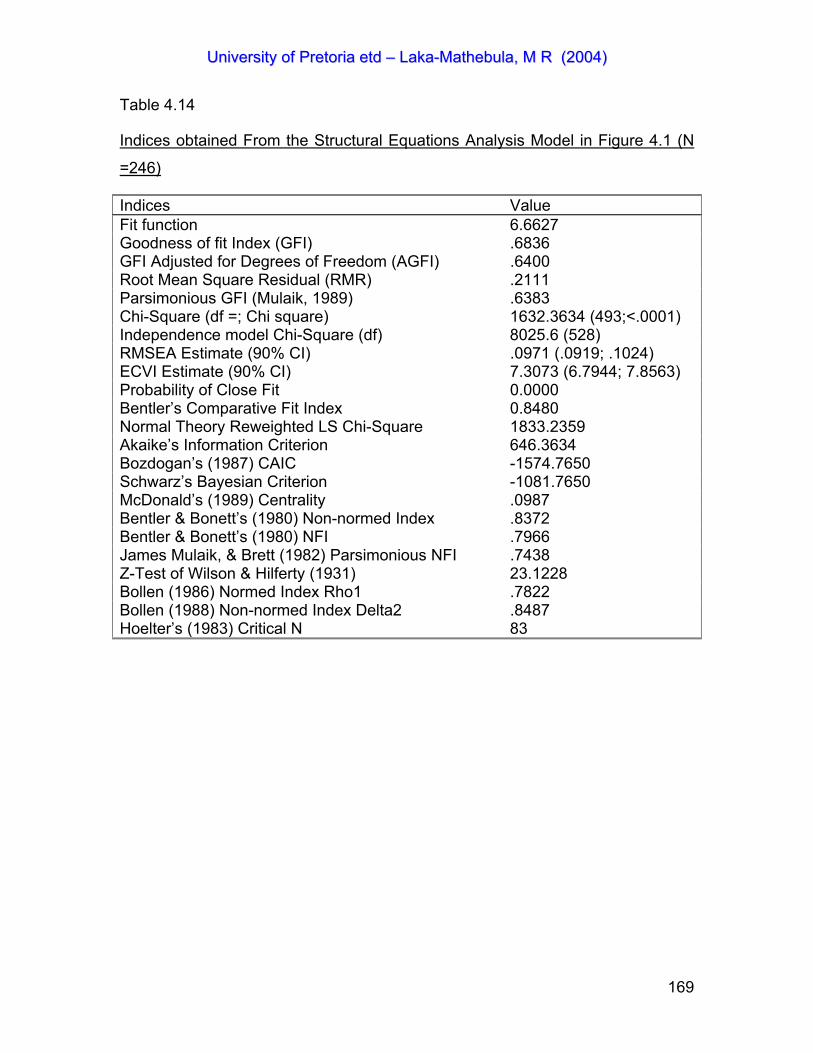
UUnniivveerrssiittyy ooff PPrreettoorriiaa eettdd –– LLaakkaa--MMaatthheebbuullaa,, MM RR ((22000044))
169
Table 4.14
Indices obtained From the Structural Equations Analysis Model in Figure 4.1 (N
=246)
Indices Value Fit function 6.6627 Goodness of fit Index (GFI) .6836 GFI Adjusted for Degrees of Freedom (AGFI) .6400 Root Mean Square Residual (RMR) .2111 Parsimonious GFI (Mulaik, 1989) .6383 Chi-Square (df =; Chi square) 1632.3634 (493;<.0001) Independence model Chi-Square (df) 8025.6 (528) RMSEA Estimate (90% CI) .0971 (.0919; .1024) ECVI Estimate (90% CI) 7.3073 (6.7944; 7.8563) Probability of Close Fit 0.0000 Bentler’s Comparative Fit Index 0.8480 Normal Theory Reweighted LS Chi-Square 1833.2359 Akaike’s Information Criterion 646.3634 Bozdogan’s (1987) CAIC -1574.7650 Schwarz’s Bayesian Criterion -1081.7650 McDonald’s (1989) Centrality .0987 Bentler & Bonett’s (1980) Non-normed Index .8372 Bentler & Bonett’s (1980) NFI .7966 James Mulaik, & Brett (1982) Parsimonious NFI .7438 Z-Test of Wilson & Hilferty (1931) 23.1228 Bollen (1986) Normed Index Rho1 .7822 Bollen (1988) Non-normed Index Delta2 .8487 Hoelter’s (1983) Critical N 83
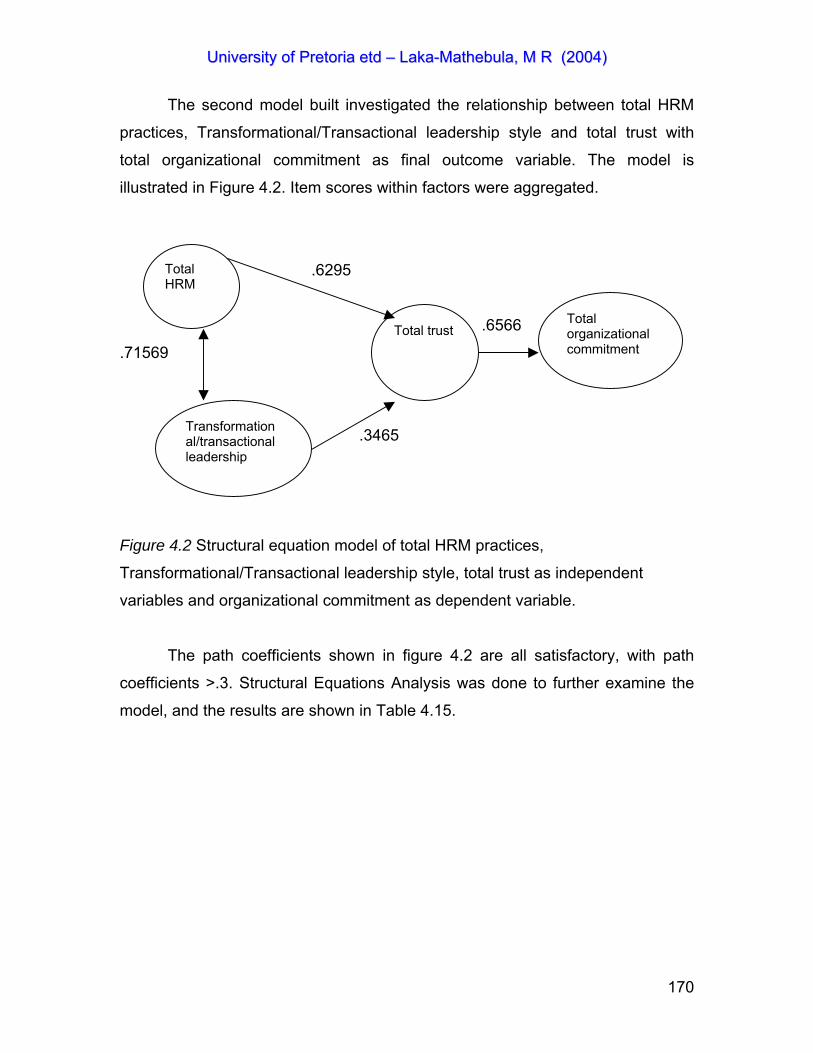
UUnniivveerrssiittyy ooff PPrreettoorriiaa eettdd –– LLaakkaa--MMaatthheebbuullaa,, MM RR ((22000044))
170
The second model built investigated the relationship between total HRM
practices, Transformational/Transactional leadership style and total trust with
total organizational commitment as final outcome variable. The model is
illustrated in Figure 4.2. Item scores within factors were aggregated.
.6295
.6566
.71569
.3465
Figure 4.2 Structural equation model of total HRM practices,
Transformational/Transactional leadership style, total trust as independent
variables and organizational commitment as dependent variable.
The path coefficients shown in figure 4.2 are all satisfactory, with path
coefficients >.3. Structural Equations Analysis was done to further examine the
model, and the results are shown in Table 4.15.
Total HRM
Transformational/transactional leadership
Total trustTotal organizational commitment
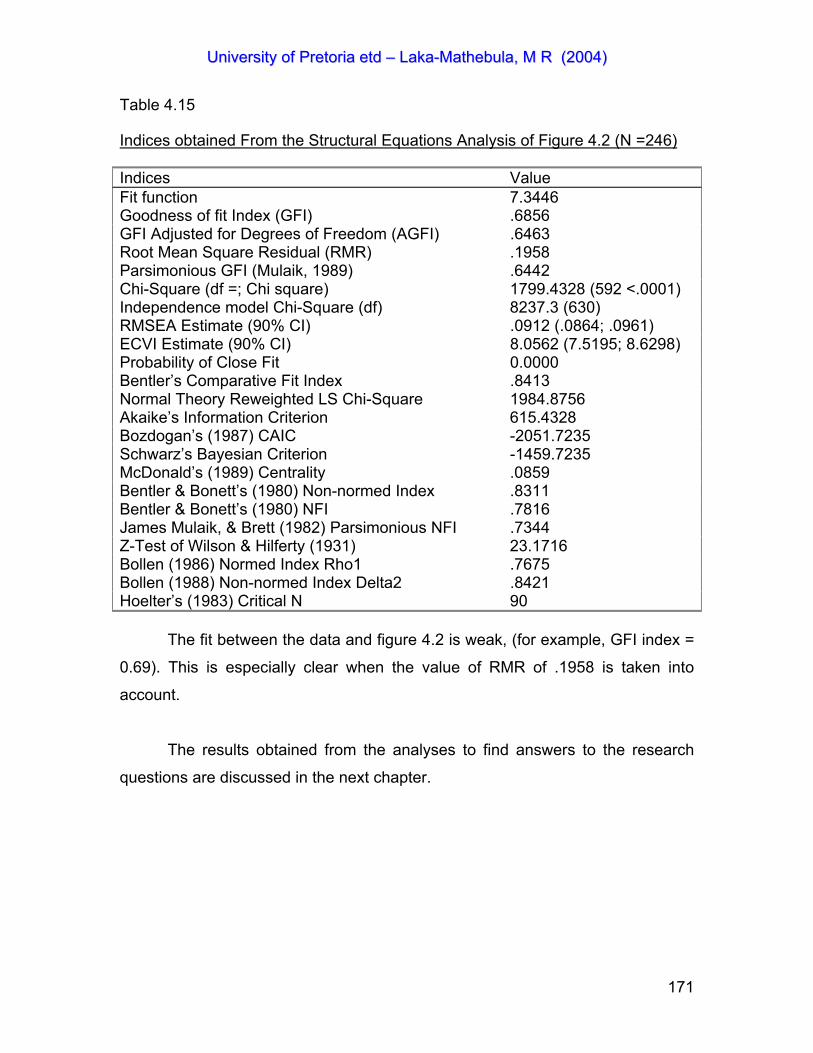
UUnniivveerrssiittyy ooff PPrreettoorriiaa eettdd –– LLaakkaa--MMaatthheebbuullaa,, MM RR ((22000044))
171
Table 4.15
Indices obtained From the Structural Equations Analysis of Figure 4.2 (N =246)
Indices Value Fit function 7.3446 Goodness of fit Index (GFI) .6856 GFI Adjusted for Degrees of Freedom (AGFI) .6463 Root Mean Square Residual (RMR) .1958 Parsimonious GFI (Mulaik, 1989) .6442 Chi-Square (df =; Chi square) 1799.4328 (592 <.0001) Independence model Chi-Square (df) 8237.3 (630) RMSEA Estimate (90% CI) .0912 (.0864; .0961) ECVI Estimate (90% CI) 8.0562 (7.5195; 8.6298) Probability of Close Fit 0.0000 Bentler’s Comparative Fit Index .8413 Normal Theory Reweighted LS Chi-Square 1984.8756 Akaike’s Information Criterion 615.4328 Bozdogan’s (1987) CAIC -2051.7235 Schwarz’s Bayesian Criterion -1459.7235 McDonald’s (1989) Centrality .0859 Bentler & Bonett’s (1980) Non-normed Index .8311 Bentler & Bonett’s (1980) NFI .7816 James Mulaik, & Brett (1982) Parsimonious NFI .7344 Z-Test of Wilson & Hilferty (1931) 23.1716 Bollen (1986) Normed Index Rho1 .7675 Bollen (1988) Non-normed Index Delta2 .8421 Hoelter’s (1983) Critical N 90
The fit between the data and figure 4.2 is weak, (for example, GFI index =
0.69). This is especially clear when the value of RMR of .1958 is taken into
account.
The results obtained from the analyses to find answers to the research
questions are discussed in the next chapter.

UUnniivveerrssiittyy ooff PPrreettoorriiaa eettdd –– LLaakkaa--MMaatthheebbuullaa,, MM RR ((22000044))
172
CHAPTER 5: SUMMARY AND IMPLICATIONS.
5.1 INTRODUCTION
In this final chapter, the major findings of the study will be discussed with
regard to previous findings in other studies. The implications of the findings for
management practices, contributions of the current study, directions for future
research and the limitations of the present study will be discussed.
5.2 DISCUSSION OF FINDINGS
The first research question is concerned with the relationship between
demographic variables such as age, tenure, organizational characteristics and
organizational commitment. The results suggest that the studied demographic
variables have no significant relationship with either organizational commitment
sub-scales or total organizational commitment. Each one of these demographic
variables will accordingly be discussed.
In this study, age showed no significant relationship with any of the
organizational commitment subscales or total organizational commitment. This
finding is in contrast to Mathieu and Zajac’s (1990) who reported a positive
significant correlation between age and affective commitment. The current
study’s non-significant findings are similar to what was reported by Hawkins
(1998), and Colbert and Kwon’s (2000). Age therefore seem to have no
statistically significant relationship with organizational commitment of employees
of higher education institutions in South Africa.
Similar to age, gender showed no significant influence on the
organizational commitment of respondents in this study. This finding is in line
with similar reports by Kalderberg et al. (1995) and Hawkins (1998). This finding
differs from popular belief and reports by Mathieu and Zajac (1990) as well as
Wahn (1998) who reported that women have higher organizational commitment

UUnniivveerrssiittyy ooff PPrreettoorriiaa eettdd –– LLaakkaa--MMaatthheebbuullaa,, MM RR ((22000044))
173
than men. Researchers who have reported differences in the organizational
commitment of men and women have argued that women tend to have stronger
continuance commitment because they find it difficult to obtain employment and
therefore would hold on to it once they have found it. The women in this study
probably do not perceive lack of alternatives as they are professionals and most
institutions in South Africa have become equal opportunity employers. These
women might feel that they have better opportunities of finding employment and
therefore do not feel obliged to remain with an institution.
The level of education also showed no significant differences in the
organizational commitment of respondents. This was despite the expectation that
employees with higher education levels would report lower organizational
commitment, as they would perceive themselves as marketable with more
alternatives. The non-significant relationship between organizational commitment
and level of education might be explained by Irving et al. ’s (1997) argument that
individuals with high levels of training and education might be more attached to
their occupations rather than the organization as they regard their skills as
employable in the occupation. In this study, the majority of respondents had a
bachelor’s degree or higher qualification, and therefore they might be of the
perception that they are marketable.
The current position of the respondents also showed no significant
relationship with organizational commitment. One would have expected
significant differences between respondents at different levels of the hierarchy
and between employees in different occupation types. It was expected that
employees in positions with higher levels of responsibility, decision-making and
accountability such as heads of department, deans and directors would report
stronger affective commitment. Significant differences were also expected
between academics and non-academics. The non-significant differences found in
this study can possibly be attributed to the low numbers of some of the different
groups in the sample.
The only demographic variable that showed a significant relationship with
any form of commitment is the type of academic institution. A significant
UUnniivveerrssiittyy ooff PPrreettoorriiaa eettdd –– LLaakkaa--MMaatthheebbuullaa,, MM RR ((22000044))
174
difference in the means of affective commitment of employees from a full-time
residential institution and a combination institution was found. The affective
commitment of employees from combination institutions was reportedly higher
than that of employees at full-time residential institutions.
No significant relationships were found between the demographic
variables and continuance or normative commitment.
The findings of this study confirm the assertion that demographic variables
play a relatively minor role in the development of organizational commitment as
was shown by Mathieu and Zajak (1990) and Meyer, Stanley, Herscovitch and
Topolnytsky ’s (2002) meta-analyses.
The second research question looked at the inter-relationship between
HRM practices, leadership style, trust and organizational commitment. Although
the results indicate a low degree of correlation between total HRM practices and
total organizational commitment, the HRM subscales and organizational
commitment subscales are significantly correlated. HRM subscales and affective
commitment show a moderate to high correlation. Information sharing and
comprehensive training both have a moderate degree of correlation with affective
commitment. These results confirm Putti et al.’s (2001) and Guzley’s (2001)
findings. These positive significant relationships can be explained by the fact that
both information sharing and comprehensive training practices create a
perception of being valued by the organization, which in turn might induce a
reciprocal positive feeling about the organization (Thornhill et al.’s 1996; McElroy,
2001).
Promotion opportunities, and performance and equitable rewards have
high inter-correlations with affective commitment. Kallenberg and Mastekaase
(1994) argue that possibilities of internal career movement create a closer bond
between the employee and the organization’s culture. The high correlation
between performance and equitable rewards and affective commitment is
expected as it might be indicative of satisfaction with the rewards or as McElroy
UUnniivveerrssiittyy ooff PPrreettoorriiaa eettdd –– LLaakkaa--MMaatthheebbuullaa,, MM RR ((22000044))
175
(2001) suggests, high compensation might serve as an indication of how much
an organization values its people, thereby enhancing their self-worth.
None of the HRM subscales had a statistically significant relationship with
continuance commitment. This is understandable since continuance commitment
is associated with lack of alternatives and/or side bets. It is possible that in an
academic environment those factors that might be regarded as side bets in other
industries, such as extensive training, promote marketability and employability.
Higher education institutions compete for academics and other employees with
extensive training and qualifications. On the other hand, normative commitment
showed a low degree of correlation with information sharing, promotion
opportunities, total HRM and organizational commitment to HRM practices. Total
HRM and normative commitment showed a high correlation.
Job security had a positive albeit non-significant relationship with affective
commitment (r = .204, p = .0013) and a negative non-significant relationship with
continuance commitment and normative commitment. These results are
somewhat similar to Ugboro’s (2003) findings who reported correlations of r = -
.37 between job insecurity and affective commitment and non-significant
associations with continuance and normative commitment. The negative
relationship between job insecurity and affective commitment makes sense
considering the fact that academic institutions like public sector institutions
traditionally offer lifelong employment (Hallier and Lyon 1996). Organizations that
provide job security can expect loyalty and organizational commitment (Whitener
et al. 1998). Ugboro (2003) argues that employees in such organizations are
insulated from the uncertainties and instability experienced in the private sector.
As such, these employees are expected to have higher levels of job security and
subsequent organizational commitment.
A perception that the organization is committed to HRM practices is
strongly correlated with affective commitment. This finding is consistent with the
argument that organizations that want employees with affective commitment
must demonstrate their own commitment to the employees by providing a
supportive work environment (Meyer & Smith, 2001). Among the things that can

UUnniivveerrssiittyy ooff PPrreettoorriiaa eettdd –– LLaakkaa--MMaatthheebbuullaa,, MM RR ((22000044))
176
be done to show commitment to employees is sharing information, providing
comprehensive training and promotion opportunities, as well as providing strong
visionary leadership. It is therefore not surprising that significant correlations
were found between affective commitment and various HRM subscales
(information sharing, promotion opportunities, performance and equitable
rewards and comprehensive training).
The relationship between trust and organizational commitment seem to be
significant and consistent. Total trust has a marked correlation with affective
commitment and a moderate correlation with total organizational commitment.
These findings correspond with reports in the literature (Cook & Wall’s, 1980;
Brockner et al., 1997; Dirks & Ferrin, 2002). Trust in supervisor and organization
has a significant correlation with affective commitment. Trust in co-worker has a
low degree of, albeit useful, correlation with affective commitment. Continuance
commitment again showed no correlation with any of the trust scales. Normative
commitment on the other hand shows a useful correlation with trust in supervisor
and organization and total trust.
Leadership style shows low correlation with organizational commitment.
Transformational/Transactional leadership shows a moderate degree of
correlation with affective commitment and a low correlation with normative
commitment. The organizational commitment of employees in the academic
institutions included in the present study does not seem to be strongly related to
the leadership style of their superiors.
Trust and HRM practices show significant correlations. Total HRM
practices and total trust have a significant correlation. Total HRM on the other
hand has a significant correlation with trust in supervisor and organization, and a
moderate correlation with trust in co-worker. Trust in supervisor and organization
has a significant correlation with information sharing, promotion opportunities,
comprehensive training and performance and equitable rewards. The relationship
between trust in supervisor and organization and job insecurity was not strong.
Trust in co-worker has a marked correlation with information sharing, a moderate
correlation with comprehensive training and total HRM. However, trust in co-

UUnniivveerrssiittyy ooff PPrreettoorriiaa eettdd –– LLaakkaa--MMaatthheebbuullaa,, MM RR ((22000044))
177
worker and promotion opportunities have a low degree of correlation.
Performance and equitable rewards show a moderate correlation with trust in co-
worker.
Transformational /transactional leadership is the only leadership subscale
that shows a notable correlation with HRM subscales. It has a moderate
correlation with promotion opportunities, a significant correlation with information
sharing, comprehensive training, performance and equitable rewards, total HRM
and commitment to HRM practices.
The relationship between trust and leadership style seem to be significant
only when transformational/transactional leadership is taken into consideration.
Transformational/transactional leadership has a useful correlation with trust in co-
worker and a significant correlation with trust in supervisor and organization and
total trust. Laissez faire leadership has a low correlation with trust in supervisor
and organization.
The fact that transformational/transactional leadership behaviour is the
only leadership behaviour that has significant correlations with HRM practices
and trust can be explained by considering the characteristics of both
transformational and transactional leaders. Transformational leaders, according
to Burns (1978), are able to ensure that followers are consciously aware of the
importance of sharing organizational goals and values. This can best be
supported by HRM practices that promote sharing of information. In addition, a
transformational leader can provide intellectual stimulation and take care of each
individual’s developmental and growth needs in an organization that is committed
to the comprehensive training of its employees. Transformational leaders can
also motivate their subordinates to commit themselves to performance beyond
expectations (Bass, 1990a; Bryman, 1992; Howell & Avolio, 1992), if the
organization’s compensation policies recognize performance and provide
equitable rewards. Similarly, transactional leaders can use contingent rewards in
exchange for meeting agreed-on objectives. By motivating employees, providing
training opportunities, making and fulfilling promises of recognition, pay increases
UUnniivveerrssiittyy ooff PPrreettoorriiaa eettdd –– LLaakkaa--MMaatthheebbuullaa,, MM RR ((22000044))
178
and advancement for employees who perform well, the
transformational/transactional leader can get things done.
Following the findings of this study and the recognition that leaders are
responsible for HRM practices that have an effect on organizational commitment,
it can be assumed that the development of organizational commitment can be
influenced by organizational policies that build trust.
Research question 3 is aimed at determining the degree to which specific
subscales predict organizational commitment subscales and total organizational
commitment. The results indicate that only two of all the predictor variables, that
is, trust in supervisor and organization and promotions opportunities entered the
prediction model. The degree of prediction of the model is moderate as the two
predictor variables together accounted for 31% of the variance of affective
commitment. However, trust in supervisor and organization is the stronger
predictor as it accounted for 30% of the common variance of affective
commitment. This results support the inter-correlation results, which indicated
trust in supervisor and organization and promotion opportunities had the highest
correlations with affective commitment.
Multiple regression analysis results show weak predictions of continuance
commitment by job insecurity, information sharing and promotion opportunities.
Normative commitment was also weakly predicted by trust in supervisor
and organization, management by exception (active), job insecurity, promotion
opportunities, laissez faire leadership and transformational/transactional
leadership.
Although the structural equations model built by regressing HRM
practices, leadership style, and trust onto organizational commitment has a weak
fit with the data, the relationships between the variables cannot be ignored. The
results of these analyses seem to indicate that causal relationships among the
variables in the present study are not enough to explain the development of
organizational commitment.
UUnniivveerrssiittyy ooff PPrreettoorriiaa eettdd –– LLaakkaa--MMaatthheebbuullaa,, MM RR ((22000044))
179
5.3 CONTRIBUTIONS OF THE CURRENT STUDY
The current study adds to researchers efforts to understand the
relationship between organizational commitment and organizational factors such
as HRM practices, leadership style and trust. This study contributes a new
direction in the research on organizational commitment by opening up a debate
on the importance of HRM practices in the development of organizational
commitment. The fact that statistically significant correlations were only found
between affective commitment and HRM practices can assist with the
understanding of how HRM practices can be utilized in managing desirable types
of organizational commitment. The study also contributes to our understanding of
the importance of HRM practices in building trust.
The study shows that HRM practices that are perceived as indicative of an
organization’s commitment to its employees are positively associated with trust in
supervisor and organization, and affective commitment. HRM practices that are
concerned with the personal development of the employee such as
comprehensive training, promotion opportunities, performance and equitable
rewards and information sharing, were essential in the development of trust and
affective commitment in an academic setting.
From this study, it appears that demographic factors, both personal factors
and organizational factors do not have a statistically significant role in the
development of organizational commitment in academic settings. This is
important, as human resources managers in academic institutions should rather
focus on HRM practices and not employee variables in an attempt to build the
right type of organizational commitment.
5.4 IMPLICATIONS FOR MANAGEMENT
Empirical evidence appears to support the view that HRM practices,
leadership style and trust can influence the development of organizational
UUnniivveerrssiittyy ooff PPrreettoorriiaa eettdd –– LLaakkaa--MMaatthheebbuullaa,, MM RR ((22000044))
180
commitment, especially affective commitment. Organizations that require their
employees to develop organizational commitment should provide a supportive
work environment, which creates a mutually beneficial environment. This has
practical implications for employers. Organizations should demonstrate their
commitment to the employees by providing comprehensive training, sharing
information, provide for the development and growth of employees within the
organization and offer more than market related incentives.
Managers interested in fostering commitment among their employees can
gain by seeking guidance from the growing literature on “high commitment HRM”.
They should however select and adopt HRM practices that would contribute to
the perceptions of the organization’s commitment to its employees and indirectly
to the development of affective commitment. Organizations should not just adopt
any HRM practices, as they may not have the same impact in their kind of
industry. For example, job insecurity did not have any significant influence on the
organizational commitment of employees of academic institutions as it was
expected.
A managerial approach that is based on leadership behaviour that is
based on sharing information, demonstration of concern for employee welfare
and equitable rewards has significant implications for managing employee
behaviour. Open and accurate communication creates an impression that the
organization cares and values the employee as a partner (Whitener et al, 1998).
Therefore, providing explanation of managerial decisions that affect employee
welfare, the future of the organization and other labour issues, would facilitate the
development of trust as it reduces speculation on the part of the employee.
Higher education institutions need to reflect on their HRM practices and
the type of organizational commitment they induce. The transitional period
created by the mergers in the higher education sector should be used as an
opportunity to review the HRM practices and leadership styles and efforts should
be made to adopt those HRM practices that promote the personal development
and growth of employees.
UUnniivveerrssiittyy ooff PPrreettoorriiaa eettdd –– LLaakkaa--MMaatthheebbuullaa,, MM RR ((22000044))
181
5.5 DIRECTIONS FOR FUTURE RESEARCH
Although this study shows that certain HRM practices could influence
trust, leadership behaviour and organizational commitment, it still does not shed
light on the mechanisms through which this is accomplished. As the models
build to illustrate these relationships were not supported by the data, we could
attempt to explain the causal relationship between the variables. Future research
directions could include, among others:
• Longitudinal studies to establish the causal relationships
among the variables.
• To enhance external validity, future research efforts should
obtain a representative sample from more institutions.
• Replication of this study after the transformation of the South
African higher education landscape has been completed.
• Replication of the study using leadership measures that are
relevant to academic leadership.
• Future research is also needed to identify “side bet” factors
for employees of academic institutions, which could lead to continuance
commitment.
5.6 LIMITATIONS OF THE STUDY
The findings of this study should be viewed with a few limitations in mind.
Self-reported measures were used to measure the constructs. It is well known
that this might cause common method variance challenges. Another limitation
can be sampling bias. Most of the respondents were mainly from a single

UUnniivveerrssiittyy ooff PPrreettoorriiaa eettdd –– LLaakkaa--MMaatthheebbuullaa,, MM RR ((22000044))
182
institution with the other institutions in the study providing the remainder of the
sample. These findings may therefore not be generalizable to the other higher
education institutions in the sample and in the country.
The use of employees alone to measure organizational level variables
could have affected the validity of the responses. Employees might not have
been fully aware of some or all of the HRM practices within their institutions and
might have given inaccurate responses.
Despite this limitations this findings contribute to extend the literature on
the variables associated with the development of organizational commitment by
supporting the findings of previous researchers.
5.7 CONCLUSION
This study contributes to the growing literature on the influence of HRM
practices, leadership and trust on the development of organizational
commitment. It provides empirical evidence to support theoretical models that
link HRM practices with organizational commitment, HRM practices with trust in
supervisor and organization, and also links trust in supervisor with organizational
commitment. This study also identifies the HRM practices that are significantly
associated with affective commitment and trust. These include information
sharing, promotion opportunities, comprehensive training, performance, and
equitable rewards.
In addition, the study shows that at least some of the constructs contained
in the measuring instruments are not directly portable to the kind of sample on
which this study was done. The importance of re-validating measuring
instruments developed in one culture and to be used in a different country or
culture or even a different kind of sample is strongly emphasised by the
outcomes of the analyses done in this regard in the present study.
UUnniivveerrssiittyy ooff PPrreettoorriiaa eettdd –– LLaakkaa--MMaatthheebbuullaa,, MM RR ((22000044))
183
REFERENCES
Ahmed, S. (1999). The emerging measure of effectiveness for human resource
management. Journal of Management Development, 18(5/6), 543-556.
Allen, N.J. & Meyer, J.P. (1990). The measurement and variables associated
with affective, continuance and normative commitment to the organization.
Journal of Occupational Psychology, 63, 1-18.
Angel, H.L., & Perry, J.L. (1981). An empirical assessment of organizational
commitment and organizational effectiveness. Administrative Science
Quarterly, 26, 1-14.
Antonikas, J., Avolio, B.J., & Sivasubramaniam, N. (2003). Context and
leadership: an examination of the nine-factor full-range leadership theory
using the multifactor leadership questionnaire. The Leadership Quarterly,
14, 261-295.
Armstrong, M. (2000). The name has changed but has the game remained the
same? Employee Relations, 22(6), 576-593.
Arnold, K.A., Barling, J., & Kelloway, E.K. (2001). Transformational leadership or
the iron cage: Which predicts trust, commitment and team efficacy? The
Leadership and Organizational Development Journal. 22(17), 315-320.
Arthur, J.B. (1992). The link between business strategy and industrial relations
systems in American steel minimills. Industrial and Labor Relations
Review, 29, 143-174.
Arthur, J.B. (1994). Effects of human resources systems on manufacturing
performance and turnover. Academy of Management Journal, 37(3), 670-
687.
Aryee, S. & Heng, L.J. (1990). A note on the applicability of an organizational
commitment model. Work and Occupations, 17(2), 229-240.
Ashford, S.J., Lee, C. & Bobko, P. (1989). Content, causes, and consequences
of job insecurity: A theory based measure and substantive test. Academy
of Management Journal, 32, 803-829.

UUnniivveerrssiittyy ooff PPrreettoorriiaa eettdd –– LLaakkaa--MMaatthheebbuullaa,, MM RR ((22000044))
184
Avolio, B.J., Bass, B.M., & Jung, D.I. (1995). MLQ multifactor leadership
questionnaire: Technical Report. Redwood city, CA: Mindgarden.
Avolio, B.J., Bass, B.M., & Jung, D.I. (1999). Re-examining the components of
transformational and transactional leadership using the multifactor
leadership questionnaire. Journal of Occupational and Organizational
Psychology, 72(4), 441- 463.
Avolio, B.J., Waldman, D.A. & Yammarino, F.J. (1991). Leading in the 1990s: the
four Is of transformational leadership. Journal of European Industrial
Training, 15(4), 9-16.
Babbie, E. (1998). The practice of social research. Belmoth, MA: Wadsworth
Publishing.
Bansal, H.S., Mendelson, M.B. & Sharma, B. (2001). The impact of internal
marketing activities on external marketing outcomes. Journal of Quality
Management, 6(1), 61-76.
Barnes, P.C. (1998). HRM policies and competitive advantage. ACCA Student’s
Newsletter.
Baruch, Y. (1997). Evaluating quality and reputation of human resource
management. Personnel Review, 26(5), 377-394.
Baruch, Y. (1998). The rise and fall of organizational commitment. Human
Systems Management, 17(2), 135-144.
Bass, B.M. (1985). Leadership: good, better, best. Organizational Dynamics.
13(3), 26-40.
Bass, B.M. (1990a). From transactional to transformational leadership: learning
to share the vision. Organizational Dynamics, 18(3), 19-31.
Bass, B.M. (1990b). Bass and Stogdill’s handbook of leadership. New York, Free
Press.
Bass, B.M. (1997). Does the transactional-transformational leadership paradigm
transcend organizational and national boundaries? Journal of American
Psychologist, 52(2), 130-139.

UUnniivveerrssiittyy ooff PPrreettoorriiaa eettdd –– LLaakkaa--MMaatthheebbuullaa,, MM RR ((22000044))
185
Bass, B.M. (1999). Two decades of research and development in
transformational leadership. European Journal of Work and Organizational
Psychology, 8(1), 9-32.
Bass, B.M. & Avolio, B.J. (1990a). Transformational leadership development:
manual for the multifactor leadership questionnaire. Palo Alto, CA,
Consulting Psychologist Press.
Bass, B.M. & Avolio, B.J. (1990b). Developing transformational leadership: 1992
and beyond. Journal of European Industrial Training, 14(5), 21-27.
Bass, B.M. & Avolio, B.J. (1995). MLQ multifactor leadership questionnaire.
Second Edition, Sampler Set: Technical Report, Leader Form, Rater
Form, And Scoring Key for MLQ Form 5x-Short.
Bass, B.M., Waldman, D.A., Avolio, B.J., & Bebb, M. (1987). Transformational
leaders: the falling dominoes effect. Group and Organizational Studies,
13(2), 109-113.
Beck, K. & Wilson, C. (2001). Have we studied, should we study, and can we
study the development of commitment? Methodological issues and the
developmental study of work-related commitment. Human Resource
Management Review, 11, 257-278.
Becker, H.S. (1960). Notes on the concept of commitment. American Journal of
Sociology, 66, 32-40.
Becker, T.E. (1992). Foci and bases of commitment: are they distinctions worth
making? Academy of Management Journal, 35(5), 232-244.
Becker, T.E., Billings, R.S., Eveleth, D.M., & Gilbert, N.L. (1996). Foci and bases
of employee commitment: implications for job performance. Academy of
Management Journal, 39(2), 464- 483.
Becker, T.E., Randall, D.M., & Reigel, C.D. (1995). The multidimensional view of
commitment and the theory of reasoned action: a comparative evaluation.
Journal of Management, 21(4), 616-639.
Benkhoff, B. (1997). Disentangling organizational commitment. Personnel
Review, 26, 114-131.

UUnniivveerrssiittyy ooff PPrreettoorriiaa eettdd –– LLaakkaa--MMaatthheebbuullaa,, MM RR ((22000044))
186
Bennis, W. & Townsend, R. (1995). Reinventing leadership. New York: William
Morrow and Company.
Bennis, W. (1959). Leadership theory and administrative behaviour: the problem
of authority. Administrative Science Quarterly, 4(1), 259-260.
Bennis, W. & Goldsmith, J. (1994). Learning to lead: A workbook on Becoming a
Leader. Addison Wesley,. Reading.
Bennis, W. and Nanus, B. (1985). Leaders. New York, NY: Harper and Row.
Bess, J.L. & Goldman, P. (2001). Leadership ambiguity in universities, k-12
schools, and the limits of contemporary leadership theory. Leadership
Quarterly, 12, 419-450.
Billingsley, B.S. & Cross, L.H. (1992). Predictors of commitment, job satisfaction,
and intent, to stay in teaching: a comparison of general and special
educators. Journal of Special Education, 25(4), 453-472.
Borchers, A.S. & Teahan, L. (2000). Organizational commitment of part-time and
distance faculty. Proceedings of the Association of Information Systems.
Atlanta. Retrieved on March 18, 2002 from
http://www2.kettering.edu/~aborcher/articles/orgcommit472ELP.doc.
Boselie, P., Hesselink, M., Pauwe, J., & Van Der Weile, T. (2001). Employee
perception on commitment oriented work systems: effects on trust and
perceived job security. ERIM Report Series Research In Management,
Retrieved on March 20, 2002 from
http://www.eur.nl/webdoc/doc/erim/erims200101213152802.pdf.
Brockner, J., Siegel, P.A., Daly, J.P., Tyler, T. & Martin, C. (1997). When trust
matters: the moderating effect of outcome favourability. Administrative
Science Quarterly, 42, 558-583.
Brown, F.W. & Moshavi, D. (2002). Herding academic cats: Faculty reactions to
transformational and contingent reward leadership by department chairs.
Journal of Leadership Studies, 8(3), 79-93.
Bryman, A. (1992). Charisma and leadership in organizations. London, Sage
Publications.

UUnniivveerrssiittyy ooff PPrreettoorriiaa eettdd –– LLaakkaa--MMaatthheebbuullaa,, MM RR ((22000044))
187
Buchko, A. (1993). The effects of employee ownership on employee attitudes: an
integrated causal model and path. Journal of Management Studies, 30(4),
633-658.
Burns, J.M. (1978). Leadership. New York, Harper and Row.
Caldwell, D.F., Chatman, J.A, & O’Reilly, C.A. (1990). Building organizational
commitment: A multi-firm study. Journal of Occupational Psychology, 63,
245-261.
Carnevale, D.G. & Wechsler, B. (1992). Trust in the public sector: individual and
organizational determinants. Administration and Society, 23(4), 471-494.
Celep, C. (1992). Teacher’s organizational commitment in educational
organizations. National Forum Journals. Retrieved on August 7, 2002,
from http://www.nationalforum.com/17celep.htm.
Chieffo, A.M. (1991). Factors contributing to job satisfactions and organizational
commitment of college leadership teams. Community College Review,
19(12), 15-25.
Chiok Foong Loke, J. (2001). Leadership behaviours: Effects on job satisfaction,
productivity and organizational commitment. Journal of Nursing
Management, 9, 191-204.
Chiu, W.C.K. & Ng, C.W. (1999). Women friendly HRM and organizational
commitment: a study among women and men of organizations in Hong
Kong. Journal of Occupational and Organizational Psychology, 72(4), 485-
503.
Colbert, A.E. & Kwon, I.G. (2000). Factors related to the organizational
commitment of college and university auditors. Journal of Management
Issues, 11(4), 484-502.
Conger, J.A. (1999). Charismatic and transformational leadership in
organizations: An insider’s perspective on these developing streams of
research. Leadership Quarterly, 10(2), 145-189.
Cook, J., & Wall, T. (1980). New work attitude measures of trust, organizational
commitment and personal need non-fulfillment. Journal of Occupational
Psychology, 53, 39-52.

UUnniivveerrssiittyy ooff PPrreettoorriiaa eettdd –– LLaakkaa--MMaatthheebbuullaa,, MM RR ((22000044))
188
Costigan, R.D., Ilter, S.S. & Berman, J.J. (1998). A multi-dimensional study of
trust in organizations. Journal of Managerial Issues, 10(3), 303-317.
Daley, D.M. & Vasu, M.L. (1998). Fostering organizational trust in North Carolina.
Administration and Society, 30(1), 62-85.
Deluga, R.J. (1990). The effects of transformational, transactional, and laissez
faire leadership characteristics on subordinate influencing behaviour.
Basic & Applied Social Psychology, 11(2), 191-203.
Deluga, R.J. (1994). Supervisor trust building, leader-member exchange, and
organizational citizenship behaviour. Journal of Occupational and
Organizational Psychology, 67(4), 315-326.
Den Hartog, D.N., Van Muijen, J.J. & Koopman, P.L. (1997). Transactional
versus transformational leadership: an analysis of the MLQ. Journal of
Occupational and Organizational Psychology, 70, 19-34.
Deutsch, M. (1958). Trust and suspicion. Journal of Conflict Resolution, 2, 265-
279.
Dirks, K.T. (1999). The effects of interpersonal trust on work group performance.
Journal of Apllied Psychology, 84(3), 445-455.
Dirks, K.T. (2000). Trust in leadership and team performance: evidence from
NCAA basketball. Journal of Applied Psychology, 85, 1004-1012.
Dirks, K. T. & Ferrin, D. L. (2001). The Role of Trust in Organizational Settings.
Organization Science: A Journal of the Institute of Management Sciences,
12(4), 450 - 467.
Dirks, K.T. & Ferrin, D.L. (2002). Trust in leadership: meta-analytic findings and
implications for research and practice. Journal of Applied Psychology,
84(4), 611-628.
Dirks, K.T. & Skarliski, D. (2002) Trust in leaders: Existing research and
emerging issues. To Appear in “Trust within Organizations”, Ed, Kramer,
R. and Cook, K. Russel. Sage Foundation.
Driscoll, J. W. (1978). Trust and participation in organizational decision making
as predictors of satisfaction. Academy of Management Journal, 21(1), 44-
56.

UUnniivveerrssiittyy ooff PPrreettoorriiaa eettdd –– LLaakkaa--MMaatthheebbuullaa,, MM RR ((22000044))
189
Eztioni, A. (1961). A Comparative Analysis of Complex Organizations. New York,
Free Press.
Fairholm, M.R. & Fairholm, G. (2000). Leadership amid the constraints of trust.
Leadership and Organizational Development Journal, 2(2), 102-109.
Ferres, N., (2002). The development and validation of the Workplace Trust
Survey (WTS): Combining quantitative and qualitative methodologies.
Masters of Applied Psychology Thesis, The University of Newcastle,
Unpublished Dissertation.
Ferris, G.R., Hochwater, W.A., Buckley, M.R., Harrel-Cook, G., & Frink, D.D.
(1999). Human resources management: Some new directions. Journal of
Management, 25(3), 385-410.
Fletcher, C. & Williams, R.W. (1996). Performance management, job satisfaction,
and organizational commitment. British Journal of Management, 7(2), 169-
179.
Franzblau, A. (1958). A Primer of Statistics for Non-Statisticians, Brace & World,
Harcourt.
Frohlich, M.T. (2002). Techniques for improving response rates in OM survey
research. Journal of Operations Management, 20, 530-562.
Ganesan, S. (1994). Determinants of long-term orientation in buyer-seller
relationships. Journal of Marketing, 58(2), 1-19.
Gardner, J.W. (1990) On Leadership. Free Press, New York.
Gibson, C.B. & Marcoulides, G.A (1995). The invariance of leadership styles
across four countries. Journal of Managerial Issues, 7(2), 176-192.
Gilbert, J.A. & Ivancevich, J.M. (1999). A re-examination of organizational
commitment. Journal of Social Behaviour and Personality, 14(3), 385-397.
Gilbert, J.A. & Li-Ping Tang, T. (1998). An examination of organizational trust
antecedents. Public Personnel Management, 27(3), 321-339.
Goulet, L.R. & Frank, M.L. (2002). Organizational commitment across three
sectors: public, non-profit, and for profit. Public Personnel Management,
31(2), 201-210.

UUnniivveerrssiittyy ooff PPrreettoorriiaa eettdd –– LLaakkaa--MMaatthheebbuullaa,, MM RR ((22000044))
190
Graetner, K.N. & Nollen, S.D. (1992). Turnover intentions and desire among
executives. Human Relations, 45, 447-465.
Grusky, O. (1966). Career mobility and organizational commitment.
Administrative Science Quarterly, 10(4) 488-503.
Guarrero, C.A. (1998). The leadership challenge. Security Management, 42(10),
27-30.
Guest, D. (1987). Human resource management and industrial relations. Journal
of Management Studies, 24(5), 503-521.
Guest, D. (1989). Personnel and HRM: Can you tell the difference? Personnel
Management, 48-51.
Guest, D., Peccei R. and Thomas, A. (1993). The impact of employee
involvement on organizational commitment and “them and us” attitudes.
Industrial Relations Journal, 24(3), 191-200.
Guzley, R.M. (2001). Organizational climate and communication climate:
Predictors of commitment to the organization. Management
Communication Quarterly, 5(4), 379-402.
Hallier, J. & Lyon, P. (1996). Job insecurity and employee commitment:
Manager’s reactions to the threat and outcomes of redundancy selection.
British Journal of Management, 7, 107 – 123.
Hawkins, W.D. (1998). Predictors of affective organizational commitment among
high school principals. PhD Dissertation. Retrieved on April 23, 2002 from
Http://scholar.lib.ub.edu/theses/delayed/etd-32298-1310/etd-html.
Hinkin, T.R. (1995). A review of scale development practices in the study of
organizations. Journal of Management, 21(5), 967-988.
Horner, M. (1997). Leadership theory: Past, present and future. Team
Performance Management, 3(4), 270 -287.
Hosking, D. M. (1988). Organizing, leadership, and skilful process. Journal of
Management Studies, 25, 147-166.
Hosmer, L.T. (1995). Trust: The connecting link between organizational theory
and philosophical ethics. Academy of Management Review, 20(2), 379-
404.

UUnniivveerrssiittyy ooff PPrreettoorriiaa eettdd –– LLaakkaa--MMaatthheebbuullaa,, MM RR ((22000044))
191
Howard, L.W. & Foster, S.T. (1999). The influence of human resource practices
on empowerment and employee perceptions of management commitment
to quality. Journal of Quality Management, 4(1), p5-22.
Howell, J.M. & Avolio, B.J. (1992). The ethics of charismatic leadership:
submission or liberation? Academy of Management Executive, 6(2), 43-
56.
Hoy, W.K., Sabo, D., & Barnes, K. (1996). Organizational health and faculty trust:
A view from the middle level. Research in Middle Level Education
Quarterly, 21-39.
Hoy, W.K., Tarter, C.J., & Witkoskie, L. (1992). Faculty trust in colleagues:
Linking the principal with school effectiveness. Journal of Research and
Development in Education, 26, 38-45.
Hoy, W.K., Smith, P.A., & Sweetland, S.R. (2002). The development of the
organizational climate index for high schools: Its measure and relationship
to faculty trust. High School Journal, 86(2), p38-49.
Hrebiniak, L.G. & Alutto, J.A. (1972). Personal and role-related factors in the
development of organizational commitment. Administrative Science
Quarterly,
Hunt, S.D. & Morgan, R.M. (1994). Organizational commitment: One of many
commitments or key mediating constructs? Academy of Management
Journal, 37(6), 1568-1587.
Hupcey, J.E., Penrod, J., Morse, J.M. & Mitcham, C. (2001). An exploration and
advancement of the concept of trust. Journal of Advanced Nursing, 36(2),
282-293.
Huselid, M.A. (1995). The impact of human resource management practices on
turnover, productivity, and corporate financial performance. Academy of
Management Journal, 38(3), 635-672.
Iles, P., Mabey, C. & Robertson, I. (1990). HRM practices and employee
commitment: Possibilities, pitfalls and paradoxes. British Journal of
Management, 1, 147 – 157.

UUnniivveerrssiittyy ooff PPrreettoorriiaa eettdd –– LLaakkaa--MMaatthheebbuullaa,, MM RR ((22000044))
192
Iverson, R.D. & Buttigieg, D.M. (1999). Affective, normative and continuance
commitment: can the “right kind” of commitment be managed? Journal of
Management Studies, 36(3), 307-350.
Irving, G.P., Coleman, D.F., & Cooper, C.L. (1997). Further assessment of a
three-component model of OC: Generalizability and differences across
occupations. Journal of Applied Psychology, 82, 444-452.
Jacobs, T. O., & Jacques, E. (1990). Military executive leadership. In K.E. Clark
and B. B. Clark (eds.), Measures of Leadership. West Orange, NJ:
Leadership Library of America, 281-295
Jacques, E. & Clement, S.D. (1994). Executive Leadership: A practical Guide to
Managing Complexity. Blackwell, Cambridge.
Jaros, S.J., Jermier, J.M., Koehler, J.W. & Sincich, T. (1993). Effects of
continuance, affective, and moral commitment on the withdrawal process:
an evaluation. Academy of Management Journal, 36(5), 951-995.
Johns, H.E. & Moser, H.R. (1989). From trait to transformation: the evolution of
leadership theories. Education, 110(1), 115-1
Kaldergberg, D.O., Becker, B.W. & Zvonkovic, A. (1995). Work and commitment
among young professionals: A study of male and female dentists. Human
Relations, 48 (11) 1355-1377.
Kalleberg, A.L. & Mastekaasa, A. (1994). Firm internal labour markets and
organizational commitment in Norway and the United States. Acta
Sociologica, 37, 269-286.
Kanter, R.M. (1968). Commitment and social organization: A study of
commitment mechanisms in utopian communities. American Sociological
Review, 33, 449-517.
Kelman, H.C. (1958). Compliance, identification, and internalisation: three
processes of attitude change. Journal of Conflict Resolution, 2, 51-60.
Kent, A. & Chelladurai, P. (2001). Perceived transformational leadership,
organizational commitment, and citizenship behaviour: a case study in
intercollegiate athletics. Journal of Sport Management, 15, 135-159.
Kerfoot, K. (1998). Creating trust. Dermatology Nursing, 10(1), 59-60.
UUnniivveerrssiittyy ooff PPrreettoorriiaa eettdd –– LLaakkaa--MMaatthheebbuullaa,, MM RR ((22000044))
193
Kerlinger, F.N., & Lee, H. B. (2000). Foundations of Behavioural Research. 4th
Ed. New York: Harcourt Publishers.
Ketchand, A. A. & Strawser, J.R. (2001). Multiple dimensions of organizational
commitment: implications for future accounting research. Behavioural
Research Accounting, 13, 221-250.
Kinicki, A.J., Carson, K.P & Bohlander, G.W. (1992). Relationship between an
organization's actual human resource efforts and employee attitudes.
Group and Organization Management, 17(2), 135-152.
Koh, W.L., Steers, R.M., & Telborg, J.R. (1995). The effects of transformational
leadership on teacher attitudes and student performance in Singapore.
Journal of Organizational Behaviour, 16, 261-271.
Kouzes, J.M. & Posner, B.Z. (1987). The leadership challenge: how to get
extraordinary things done in organizations. First Edition. The Jossey-Bass
Management Series. Jossey: Bass, CA, USA.
Kramer, R., & Tyler, T. (Eds), (1996) Trust in organizations, Sage, Thousand
Oaks, CA.
Kramer, R.M. (1999). Trust and distrust in organizations: Emerging perspectives,
enduring questions. Annual Review of Psychology, 50, 569- 598.
Kushman, J.W. (1992). The organizational dynamics of teacher workplace
commitment: a study of urban elementary and middle schools.
Educational Administration Quarterly, 28(1), 5-42.
Legge, K. (1989). Human resources management: A critical analysis. In: Storey,
J (Ed) New perspectives in human resource management, Routledge,
London.
Legge, K. (1995). Human resources management: Rhetorics and Realities,
Macmillan, London.
Leithwood, K. (1994). Leadership for school restructuring. Educational
Administration Quarterly, 30(4), 498-518.
Leithwood, K., & Jantzi, D. (1997). Explaining variation in teachers’ perceptions
of principal’s leadership: a replication. Journal of Educational
Administration, 35(4), 312-331.
UUnniivveerrssiittyy ooff PPrreettoorriiaa eettdd –– LLaakkaa--MMaatthheebbuullaa,, MM RR ((22000044))
194
Leithwood, K. & Jantzi, D. (1999a). The relative effects of principal and teacher
sources of leadership on student engagement with school. Educational
Administration Quarterly, 35(4), 679-707
Leithwood, K. & Jantzi, D. (1999b). The effects of transformational leadership on
organizational conditions and student engagement with school.
Educational Administration Quarterly, 38(2), 112-129.
Leithwood, K. & Jantzi, D. (1999c). Transformational school leadership effects: a
replication. School Effectiveness and School Improvement, 10(4), 451-
479.
Leithwood, K., & Jantzi, D. (2000). The effects of transformational leadership on
organizational conditions and student engagement with school. Journal of
Educational Administration, 32(2), 112-129.
.Leithwood, K. & Jantzi, D. (2002). The effects of transformational leadership on
teacher’s commitment to change in Hong Kong. Journal of Educational
Administration, 40(4), 368-389.
Lewicki, R.J. & Bunker, B.B. (1996). Developing and maintaining trust in work
relationships. In Kramer, R. & Tyler, T. (Eds.) Trust in organizations:
Fronteirs of theory and research (pp114-135). Newbury Park, CA: Sage
Publications.
Liou, K-T. & Nyhan, R. (1994). Dimensions of organizational commitment in the
public sector: An empirical assessment. Public Administration Quarterly,
18(1), 99-118.
Luthans, K. (1998). Using HRM to compete in the 21st century. Management
Quarterly, 38(4), 17-22.
Macduffie, J.P. (1995). Human resources bundles and manufacturing
performance: Organizational logic and flexible production systems in the
world auto industry. Industrial and Labour Relations Review, 48, 197-221.
Mathieu, J.E. & Zajac, D.M. (1990). A review and meta-analysis of the
antecedents, correlates, and consequences of organizational commitment.
Psychological Bulletin, 108, 171-194.
UUnniivveerrssiittyy ooff PPrreettoorriiaa eettdd –– LLaakkaa--MMaatthheebbuullaa,, MM RR ((22000044))
195
Mayer, R.C., Davis, J.H & Schoorman, F.D. (1995). An integrative model of
organizational trust. Academy of Management Review, 20(3), 709-734.
Mayer, R.C. & Schoorman, F.D. (1992). Predicting participation and production
outcomes through a two-dimensional model of organizational commitment.
Academy of Management Journal, 35(3), 671-684.
Mayfield, J. & Mayfield, M. (2002). Leader communication strategies critical paths
to improving employee commitment. American Business Review, 20(2),
89-94.
Mcallister, D. J. (1995). Affect- and cognition-based trust as foundations for
interpersonal cooperation in organizations. Academy of Management
Journal, 38, 24-59.
Mccauley, D. P. & Kuhnert, K. W. (1992). A theoretical review and empirical
investigation of employee trust in management. Public Administration
Quarterly, 16(2), 265-282.
McElroy J.C. (2001). Managing workplace commitment by putting people first.
Human Resource Management Review, 11, 327-335.
McGunnigle, P.J. & Jameson, S.M. (2000). HRM in UK hotels: A focus on
commitment. Employee Relations, 22(4), 403-422.
Meyer, J.P & Allen, N.J. (1984). Testing the “side-bet theory” of organizational
commitment: Some methodological considerations. Journal of Applied
Psychology, 69, 372-378.
Meyer, J.P & Allen, N.J. (1991). A three-component conceptualization of
organizational commitment. Human Resource Management Review, 1(1),
61-89.
Meyer, J.P & Allen, N.J. (1993). Commitment to organization and occupations:
Extension of a three-component model. Journal of Applied Psychology,
78(4), 538-551.
Meyer, J.P. & Allen, N.J. (1997). Commitment in the workplace. Thousand Oaks,
CA: Sage Publications.

UUnniivveerrssiittyy ooff PPrreettoorriiaa eettdd –– LLaakkaa--MMaatthheebbuullaa,, MM RR ((22000044))
196
Meyer, J.P., Allen, N.J. & Smith, A. (1993). Commitment to organizations and
occupations: Extension and test of a three-component conceptualization.
Journal of Applied Psychology, 78, 538-55
Meyer, J.P. & Herscovitch, L. (2001). Commitment in the workplace: Toward a
general model. Human Resources Management Review, 11, 299-326.
Meyer, J.P & Smith, C.A. (2000). HRM practices and organizational commitment: test
of a mediation model. Canadian Journal of Administrative Sciences, 17(4), 319-
332.
Meyer, J.P., Stanley, D.J., Hescovitch, L. & Topolnytsky, L. (2002). Affective,
continuance, and normative commitment to the organization: A meta-analysis
of antecedents, correlates, and consequences. Journal of Vocational Behavior,
61(1), 20-52.
Mishra, A.K. (1996). Organizational responses to crisis: The centrality of trust. In
Kramer, R.M. & Tyler, T. (Eds). Trust in organizations: Frontiers of theory
and research, 261-287. Thousand Oaks: CA, Sage.
Mishra, J., & Morrissey, M. A. (1990). Trust in employee/employer relationships:
A survey of West Michigan managers. Public Personnel Management, 19,
443-485.
Morgan, R.M. & Hunt, S.D. (1994). The commitment-trust theory of relationship
marketing. Journal of Marketing, 58(3), 24-38.
Mohr, J.J. & Spekman, R.E. (1994). Characteristics of partnership success:
Partnership attributes, communication behaviour and conflict resolution
techniques. Strategic Management Journal, 57, 135-152.
Moorman, C., Zaltman, G. & Deshpade, R. (1992) Relationships between
providers and users of market research: The dynamics of trust within and
between organizations. Journal of Marketing Research, 29(3), 314- 328.
Morrow, P. (1983). Concept redundancy in organizational research: The case of
work commitment. Academy of Management Review, 8, 486-500.
Mowday, R.T. (1998). Reflections on the study and relevance of organizational
commitment. Human Resource Management Review, 8(4), 387-401.

UUnniivveerrssiittyy ooff PPrreettoorriiaa eettdd –– LLaakkaa--MMaatthheebbuullaa,, MM RR ((22000044))
197
Mowday, R.T., Steers, R.M. & Porter, L.W. (1979). The measurement of
organizational commitment. Journal of Vocational Behaviour, 14, 224-247.
Ngo, H.Y & Tsang, A.W. (1998). Employment practices and organizational
commitment: differential effect for men and women? International Journal
of Organizational Analysis, 6(3), 251-267.
Nijhof, W.J., De Jong, M.J., & Beukhof, G. (1998). Employee commitment in
changing organizations: an exploration. Journal of European Industrial
Training, 22(6), 243-248.
Nirenberg, J. (2001). Leadership: A practitioner’s perspective on the literature.
Singapore Management Review, 23(1), 1-33.
O’Driscoll, M. P. & Randall, D.M. (1999). Perceived organizational support,
satisfaction with rewards, and employee job involvement and
organizational commitment. Applied Psychology: An International Review,
48(2), 197 -209.
O’Leary-Kelly, S.W. & Vorkuka, R.J. (1998). The empirical assessment of
construct validity. Journal of Operations Management, 16, 387 -405.
Oliver, N. (1990). Rewards, investments, alternatives and organizational
commitment: empirical evidence and theoretical development. Journal of
Occupational Psychology, 63, 19-31.
O’Reilly, C. & Chatman, J. (1986). Organizational commitment and
psychological attachment: the effects of compliance, identification, and
internalization on prosocial behaviour. Journal of Applied Psychology, 71,
492 - 499.
O’Reilly, C., Chatman, J. & Caldwell, D.F. (1991). People and organizational
culture: a profile comparison approach to assessing person-organization
fit. Academy of Management Journal, 34, 487-516.
Ogshabemi, T. (2001). How satisfied are academics with the
behaviour/supervision of their line managers? The International Journal of
Educational Management, 15(6), 283-291
Othman, R.B. & Poon, J.M.L. (2000). What shapes HRM? A multivariate
examination. Employee Relations, 22(5), 467-484.
UUnniivveerrssiittyy ooff PPrreettoorriiaa eettdd –– LLaakkaa--MMaatthheebbuullaa,, MM RR ((22000044))
198
Park, H. Y. & Ofori-Dankwa, J. (1994). Organizational and environmental
determinants of functional and dysfunctional turnover. Human Relations,
47(3), 353-366
Pelton, L. E.; Strutton, D. & Rawwas, M. Y.A (1994). The relationship between
psychological climate and faculty-administrator trust in departments of
marketing and management. Marketing Education Review, 4(2), 53-61.
Pfeffer, J. (1994). Competitive advantage through people. Boston, Harvard
Business School Press.
Pfeffer, J. (1995). Producing sustainable competitive advantage through the
effective management of people. Academy of Management Executive, 9,
55-72.
Pfeffer, J. & Viega, J.F. (1999). Putting people first for organizational success.
Academy of Management Executive, 13, 37-48
Pfeffer, J. (1998). The Human equation, Boston, Harvard Business School Press.
Pillai R., Schriesheim, C.A., & Williams, E.S. (1999). Fairness perceptions and
trust as mediators for transformational and transactional leadership: a two-
sample study. Journal of Management, 25(6), 897-933.
Podsakoff, P.M., Mackenzie, S.B., & Bommer, W.H., R. (1996). Transformational
leader behaviours as determinants of employee satisfaction, commitment,
trust, and organizational citizenship behaviours. Journal of Management,
22, 259-298.
Podsakoff, P.M., Mackenzie,S.B., Moorman, R.H. & Fetter, R. (1990).
Transformational leader behaviours and their effects on follower’s trust in
leader satisfaction, and organizational citizenship behaviour. Leadership
Quarterly, 1, 107-142.
Popper, M., Mayseless, O. & Castelnovo, O. (2000). Transformational leadership
and attachment. Leadership Quarterly, 11(2), 267-289.
Postmes, T., Tanis, M., & De Wit, B. (2001). Communication and commitment in
organizations: a social identity approach. Group Process and Intergroup
Relations, 4(3), 227-246.

UUnniivveerrssiittyy ooff PPrreettoorriiaa eettdd –– LLaakkaa--MMaatthheebbuullaa,, MM RR ((22000044))
199
Pounder, J.S. (2001). “New leadership” and university organizational
effectiveness: Exploring the relationship. Leadership and Organization
Development Journal, 22(6), 281-290.
Putti, J.M., Aryee, S. & Phau, J. (1990). Communication relationship satisfaction
and organizational commitment. Group and Organization Studies, 15(1),
44-52.
Raju, P.M. & Srivastava, R. C. (1994). Factors contributing to Commitment to the
teaching profession. International Journal of Educational Management,
8(5), 7-13.
Randall, D.M. & Cote, J.A. (1991). Interrelationships of work commitment
constructs. Work and Occupation, 18, 194-211.
Randall, D.M. & O’Driscoll, M.P. (1997). Affective versus calculative commitment:
Human resource implications. Journal of Social Psychology, 137(5), 606-
620.
Reichheld, F.R. (1996). The Loyalty Effect. Harvard Business School Press,
Boston.
Reichers, A.E. (1985). A review and reconceptualization of organizational
commitment. Academy of Management Review, 10, 465-476.
Richards, B., Akroyd, D., & O’Brien, T. (1993). The ability of work related factors
to predict the organizational commitment of health occupations education
teachers. Journal of Health Occupations Education, 8(2), 16-33.
Richards, B., O’Brien, T., & Akroyd, D. (2000). Predicting the organizational
commitment of Marketing education and Health education teachers by
work related rewards. Digital Library and Archives. Retrieved on April 24,
2001 from http://borg.lib.vt.edu/ejournals/JITE/v32n1/Richards.html.
Rogers, R.W. (2000). Commitment–based employment relationships and high
performance work systems: A theory driven research strategy to bring the
traditional concepts in line with empirical research. Retrieved on February
20, 2001 from http://www.fba.mus.edu/sg/fba/mscphd/0027.pdf.
Romzek, B.S. (1990). Employee investment and commitment: The ties that bind.
Public Administration Review, 50, 374-382.

UUnniivveerrssiittyy ooff PPrreettoorriiaa eettdd –– LLaakkaa--MMaatthheebbuullaa,, MM RR ((22000044))
200
Roth, P.L., & BeVier, C.A. (1998). Response rates in HRM/OB survey research:
Norms and correlates, 1990-1994. Journal of Management, 24(1), 97-117.
Roth, P.L. & Switzer, F.S. (III). (1995). A Monte Carlo analysis of missing data
techniques in a HRM setting. Journal of Management, 21(5), 1003-1023.
Rotter, J.B. (1967). A New Scale for the Measurement of Interpersonal Trust.
Journal of Personality, 35, 651-65.
Rousseau, D.M., Sitkin, S.B., Burt, R.S., & Camerer, C. (1998). Not so different
after all: A cross-discipline view of trust. Academy of Management
Review, 23(3), 393-405.
Rowden, R.W. (2000). The relationship between charismatic leadership
behaviours and organizational commitment. The Leadership and
Organizational Development Journal, 21(1), 30-35.
Rowley, J. (1997). Academic leaders: made or born? Industrial and Commercial
Training, 29(3), 78-84.
Rungtusanatham, M.J., Choi, T.Y., Hollongworth, Z.W., & Froza, C. (2003).
Survey research in operations management: historical analyses. Journal
of Operations Management, 21, 475-488.
Sashittal, H.C., Berman, J. & Ilter, S. (1998). Impact of trust on performance
evaluations. Mid-Atlantic Journal of Business, 34(2), 163-184.
Scholl, R.W. (1981). Differentiating commitment from expectancy as a
motivational force. Academy of Management Review, 6,589-599.
Schriesheim, C.A. & Eisenbach, R.G. (1995). An exploratory and confirmatory
factor-analytic investigation of item wording effects on the obtained factor
structures of survey questionnaire measures. Journal of Management,
21(6), 1177-1193.
Shepperd, J.L. & Mathews, B.P. (2000). Employee commitment: academic vs.
practitioner perspectives. Employee Relations, 22(6), Retrieved on May 5,
2001 from Emerald database.
Siegall, M. & Worth, C. (2001). The impacts of trust and control on faculty
reactions to merit pay. Personnel Review, 30(6), 646-656.
UUnniivveerrssiittyy ooff PPrreettoorriiaa eettdd –– LLaakkaa--MMaatthheebbuullaa,, MM RR ((22000044))
201
Sitkin, S.B, and Roth, N.L. (1993). Explaining the limited effectiveness of
legalistic remedies for trust/distrust. Organization Science, 4(3), 367-392.
Snell, S. & Dean, J. (1992). Integrated manufacturing and human resource
management: A human capital perspective. Academy of Management
Journal, 35, 467-504.
Storey, J. (1989), New Perspectives on Human Resource Management,
Routledge, London.
Storey, J. (1992). Development in the Management of Human Resource: An
Analytical Review, Blackwell, Oxford.
Storey, J. (1995a). Is HRM catching on? International Journal of Manpower,
16(4), 3-12.
Storey, J. (1995b). Human resource management: Still marching on, or marching
out? Storey, J, In: Human Resource Management: A Critical Text,
Routledge, London.
Stum, D.L. (1999). Maslow revisited: Building the employee commitment
pyramid. Strategy and Leadership, 29(4), 4-9.
Suliman, A. M. & Isles, P.A. (2000a). Is continuance commitment beneficial to
organizations? Commitment–performance relationship: A new look.
Journal of Managerial Psychology, 15(5), 407-426.
Suliman, A. M. & Isles, P.A. (2000b). The multi-dimensional nature of
organizational commitment in a non-western context. Journal of
Management Development, 19(1), 71-82.
Tan, H.H. & Tan, C.S.F. (2000). Towards the differentiation of trust in supervisor
and trust in organization. Genetic, Social and General Psychology
Monographs, 126(2), 241-260.
Tao, M., Takagi, H., Ishida, M., & Masuda, K. (1998). A study of variables
associated with organizational commitment. Japanese Psychological
Research, 40(4), 198-205.
Tarter, C.J., Sabo, D., & Hoy, W.K. (1995). Middle school climate, faculty trust
and effectiveness: a path analysis. Journal of Research and Development
in Education, 29, 41-49.
UUnniivveerrssiittyy ooff PPrreettoorriiaa eettdd –– LLaakkaa--MMaatthheebbuullaa,, MM RR ((22000044))
202
Taylor, P.J. & Pierce, J.L. (1999). Effects of introducing a performance
management system on employee’s subsequent attitudes and effort.
Public Personnel Management, 28(3), 423- 452.
Tejeda, M.J., Scandura, T.A., & Pillai, R. (2001). The MLQ revisited:
Psychometric properties and recommendations. Leadership Quarterly,
12(1), 31-52.
Tepper, B.J. & Percy, P.M. (1994). Structural validity of the multifactor leadership
questionnaire. Educational and Psychological Measurement, 54(3), 734-
745.
Tepstra, D.E. (1994). HRM: A key to competitiveness. Management Decision,
32(9), 10-14.
Thornhill, A., Lewis, P., & Saunders, M.N.K. (1996). The role of employee
communication in achieving commitment and quality in higher education.
Quality Assurance in Education, 4(1). Retrieved on May 15, 2001, from
Emerald database.
Trevor, C.O., Gerhart, B., & Boudreau, J.W. (1997). Voluntary turnover and job
performance: Curvilinearity and the moderating influences of salary growth
and promotions. Journal of Applied Psychology, 82(1), 44 -61.
Trombetta, J.J. & Rogers, D.P. (1988) Communication climate, job satisfaction,
and organizational commitment: The effect of information adequacy,
communication openness and decision participation. Management
Communication Quarterly, 1(4), 494-514.
Tschannen-Moran, M. & Hoy, W.K. (1998). Trust in schools: a conceptual and
empirical analysis. Journal of Educational Administration, 36(4), 334-352.
Tsui, A.S., Pearce, J.L., Porter, L.W., & Tripoli, A.M. (1997). Alternative
approaches to the employee-organization relationship: does investment in
employees pay off? Academy of Management Journal, 40, 1089-1121.
Tyler, T. R. & Degoey, P. (1996). Trust in organizational authorities: the influence
of motive attributions on willingness to accept decisions. In: Kramer, R. M.
(Ed); & Tyler, T. R. (Ed); 1996. Trust in Organizations: Frontiers of Theory
and Research, 331-356.
UUnniivveerrssiittyy ooff PPrreettoorriiaa eettdd –– LLaakkaa--MMaatthheebbuullaa,, MM RR ((22000044))
203
Ugboro, I.O. (2003). Influence of managerial trust on survivors’ perceptions of job
security and organizational commitment in a post restructuring and
downsizing environment. Journal of Behavioural and Applied
Management, 4(3), 230- 254.
Van Seters, D.A. & Field, R.H.G. (1989). The evolution of leadership theory.
Journal of OCM, 3(3), 29-45.
Wahn, J.C. (1998). Sex differences in the continuance component of
organizational commitment. Group and Organization Management, 23(3),
256-266.
Wan, T. W. D., Ong, C.H. & Kok, C.F. V. (2000). Strategic HRM and
organizational performance in Singapore. Retrieved on August 11, 2002,
from www.fba.nus.edu.sg/fba/mscphd/index00.html.
Weiner, Y. (1982). Commitment in organizations: A normative view. Academy of
Management Review, 7, 418-428.
Whitener, E.M. (1997). The impact of human resource activities on employee
trust. Human Resource Management Review, 7(4), 389-425.
Whitener, E.M. (2001). Do “high commitment” human resources practices affect
employee commitment? A cross-level analysis using hierarchical linear
modelling. Journal of Management, 27(5), 515-535.
Whitener, E.M., Brodt, S.E., Korsgaard, A. & Wener, J.M. (1998). Managers as
initiators of trust: an exchange relationship framework for understanding
managerial trustworthy behaviour. Academy of Management Review,
23(3), 513- 531.
Wolverton, M., Montez, J., Guillory, R. and Gmelch, W.H. (2001) Deans,
Affective commitment, and optimising the work environment so they stay.
Retrieved on August 09, 2003 from
www.eriche.org/ASHEpapers/Search/Wolverton%20et%al.affective%20Co
mmitment.pdf.
Williams, M.L. & MacDermid, S.M. (1994). Linkages between employee benefits
and attitudinal and behavioural outcomes: A research review and agenda.
Human Resource Management Review, 4(2), 131-160.

UUnniivveerrssiittyy ooff PPrreettoorriiaa eettdd –– LLaakkaa--MMaatthheebbuullaa,, MM RR ((22000044))
204
Yammarino, F.C. & Bass, B.M. (1990). Transformational leadership and multiple
level analyses. Human Relations, 43, 975-995.
Yammarino, F.C., Spangler, W.D. & Bass, B.M. (1993). Transformational
leadership and performance: A longitudinal investigation. Leadership
Quarterly, 4, 81-102.
Yammarino, F.C., Spangler, W.D. & Dubinsky, A.J. (1998). Transformational and
contingent reward leadership: individual, dyad, and group level analysis.
Leadership Quarterly, 9(1), 27- 54.
Young, B.S. & Worchel, S. (1998). organizational commitment among public
service employees. Public Personnel Management, 27(3), 339-349.
Yousef, D.A. (1998). Satisfaction with job security as a predictor of organizational
commitment and job performance in a multicultural environment. Journal
of Manpower, 19(3), 184-194.
Yu, H., Leithwood, K., & Jantzi, D. (2002). The effects of transformational
leadership on teacher’s commitment to change in Hong Kong. Journal of
Educational Administration, 40(4), 368-389.
Yukl, G, (1989). Managerial leadership: A review of theory and research. Journal
of Management, 15(2), 251-289.
Yukl, G. (1999). An evaluative essay on current conceptions of effective
leadership. European Journal of Work and Organizational Psychology,
8(1), 33- 48.
Yukl, G. & Van Fleet, D. D. (1992.) Theory and research on leadership in
organizations. In: Dunnette, Marvin D. (Ed); Hough, Leaetta M. (Ed);
Handbook of industrial and organizational psychology, 3 (2nd Ed.), pp147-
197. Palo Alto, Ca: Consulting Psychologists.
Zand, D.E. (1972). Trust and managerial problem solving. Administrative Science
Quarterly, 17, 229-239.
Zangaro, G.A. (2001). Organizational commitment: A concept analysis. Nursing
Forum, 36(2), 14-23.


![The Relationship between Organizational Citizenship ...7)3/Version-4/E0703042739.pdfThe Relationship between Organizational Citizenship Behavior and Organizational Factors [Yavuz Demirel1][Iman](https://img.pdfslide.net/doc/110x75/5e4a3e3faaa78a2d26192043/the-relationship-between-organizational-citizenship-73version-4-the-relationship.jpg)