Embed Size (px)
Citation preview

~ t
H~,~R ES OI 313
Modelling the response of auditory midbrain neurons in the grassfrog to temporally structured monaural stimuli
Ivo H.M~ van S t o k k u m
In a p~.vioes ~ Wan .Stc~r&muu and ~ ~ . Re~,o ~tL 7|-S6. t ~ • mod~ ~as preseme~ to de~r~b~ t ~ pmcessi~nf~ of
The mc~nm~ms ~ ~ ~ for ~mpo~ c h ~ - . ~ r ~ o~ ~o~nd ~ ~ . ~ ~ ~
ttdrd order model ~ u r o ~ Variation of the lwameu~ of ~he ~ s ~ d a l ~ y ~ ~ nmt~r el" ~ ln~ter~ ~ have been ~ from e i ~ n e ~ fib~e~ ~ ~ m~e~ ~a~o~ and t~-~s ~ , ~ a r i ~ r ~ r o ~ ~ i~hibitioa. V,,ith a ~ stt ot ~ t ~ ou t~ t ~ th~ m o ~ m ~ ~o e ~ t ~ ~ sad ~ l y ~ s , tm~
A n m ~ ; A u d i t ~ ¢ y n ~ D o r ~ ~ m t d e u s ; N e e r ~ ~ T e m ~ k c t ~ i r y : T o z a s ~
Since the pioneeriJ~g work of Pot ter {|96~;) ~h~ a.d~'.ov~ mid, rain of anurans has been the s u b ~ of muc~ auditory u:sea,-'~h (for reviews ~ e Fri~sch
eL. 1988). P , , n ~ use ~ ~ . ~ i f , ~ , ~ for i n ~ r ~ ~ , ~ , in the g r ~ Ram t ~ ~ , these ~ have a
have a d m ~ of 12 ms and a pulse n~etition rate ~ depending on tunperature (Van Odde~ et ,eL. 1~I'/; W ~ l k ~ and i k z o s ~ 1982) b c t ~ 20 and 40 H~ The dis~im~
¢~ara~er of the n a ~ ~ l s h~s ted msny i n c i - Sors into a study of the ~ of fia¢ c ~ r i s ~ ~ ~ (for t~4cw ~ Wa~kowi~
se~c'.h~ ,eurons. 1. ~ r ~ Biblkov
~th~, a f ~ ~ but fired contin, o , ~ when ~ p ~ tone was replaced by a ~ t~in ~;th •
d ~ t i o n of 8 m~ and a PRR of 20 H~ A f ~ . l ~ i n ~ t i ~ of ~ neeroas in ~ e ~ r w ~ showed tha t ~ a ~ a n t P R R of 27
Watko~utk (1984) ~# ~ NVIIL DMN, ~ ~ They ~ ~ ~ ~ to ~qim
of 10 ms ~ . ,sith a tram deration of ~00 ms • ~ va~.aS between 5 and IO0 ~ D ~ d ~

232
pulse train was divided by the number of pulses in a study by Van Stokkum (1989: p. 14). The result- ing number of spikes per stimulus pulse as func- tion of PRR was taken as a measure to classify the responses. A response was classified as selective if the response above or below a certain cut-off PRR was less than 50% of the maximum response. In the lowest three stations of the auditory pathway, ~he ~ I I , DM ~r and SON, two response types are present: non-selective and low-pass. The per- centage of low-pa~s responses increases from about 20~ in the NVIII to about 75% in DMN and SON. The cut-off PRRs of these iow-pass re- sponses were between 10 arid 60 Hz, a range which encompasses the PRRs of natural cabs. In the TS 12% of the units showed a non-selective response, and 56% showed a low-pass response. Furthermore three new response types emerged in the TS, 6% of the neurons responded only to the highest PRRs (I-dgh-pass), 8% responded exclu- sively to a small range of PRP~ (band-pass) and 18~ showed the opposite behavior (band-suppres- sion or bimodal).
With another class of stimuli, amplitude mod- ulated sounds, both the rate aspect of the response and the synchronization aspect have been studied in the NVill and TS (Rose and Capranica, 1983, 1984, I985; Epping and Eggermont, i986b). With respect to rate the responses were classified into the above mentioned five categories. The synchro- nization index showed a non-sdective or low-pass behaviour as function of AMF. N'¢III fibres syn- chronized their firings to the envelope of the am- plitude modulator. This synchronization capabil- ity was retained for AMFs above t00 Hz (Rose and Capranica, 1985). In contrast, the firings of 38% of the TS units were not significantly syn- chronized to the envetc~ (EFPing and Egger- mont, 1986b). In the other TS units synchroniza- tion to the envelope was a low-pass function of AMF) with lower cut-off AMFs than found in the NVIII (Rose and Caprani~ 1985).
An explanation for these different types of responses to temporally s tmctur~ ~ can be found in the integra~¢e properties of neurons. The cable properties of neurons, especially of tho3r dendrites, cause temporal integration of inletS (Rail, 1977), NVIII h~es have integration times smaller than I ms (Dunia and Narim, 1989)
ing them to synchronize their firings to stimulus envelopes with AMFs greater man 100 Hz. Like- wise, DMN neurons have integration times of 1-5 ms (Bibikov and Kalinkina, 1983), which still en- ables them to pass on the synclh-ony code, But in the TS Bibikov (1974, 1977, 1978) found integra- tion times ranging from 1 to 100 ms. These in- tegration times were determined from the time coarse of the probability of spike generation in: respo~e to a tone just above threshold (see also Van Stokkum, 1989, p. 12-13). TS umts with long integration times loose their synchronization capa- bility, but may develop selectivity for PRR by temporal integration of consecutive inputs. The hypothesis that temporal integration is responsible for the new types of temporal selectivity in the TS will be tested quan',itatively with help of a model. Another hypothesis is that local circuits in the TS are responsible for tke development of temporal selectivity. This second hypothesis will be investi- gated by recording simultaneously from pairs of single units, and looking for the presence of neural interaction.
In a previous paper (Van Stokkum and Gielen, 1989) a model was developed for NVHI and DMN neurons. This model for first and second order auditory neurons is now extended to produce the responses of third order neurons. In Ramdae the main ascending auditory inputs to the "IS come from the ipsilateral SON and from the ipsi- and contralateral DMN (Wilc~ynsky, 1988). In view of this TS neuxons can be considered as third or fourth order auditory neurons. The known tern, poral selectivities of SON neurons deviate only slightly from those of DMN neurons. This justifies the simplification to model TS neurons as third order neurons, thereby reducing the number of degrtes of freedom for the modeller. Care was taken ~ t:eep the characteristics of fia'st and sec. ond order model neurons in line with data from the literature and with those used in the previous model (Van Stoldmm and Gieleu, 1989).
To chamc~rize TS neurons a broad ensemble of stimuli was used to explore the selectivity for carrier frequency, PRR, AMF and ~ shape. The main goal of this paper was to des~ibe the setectivities of some typical TS neurons, and to
their responses to a set of stimuli with the responses of a modal ~ r o n . Matching the
responses of the model neuron to the neurophysio- logical data enabled us to find a reliable set of parameters for the model. Similarities between the selectivities of the real and model neuron indicate the plan_sibility of the model for the temporal processing in the TS. It will be shown that spatio- temporal integration of second order inputs repro- duces the new types of temporal selectivity found in the "IS.
Methods
Animal preparation and recording procedure
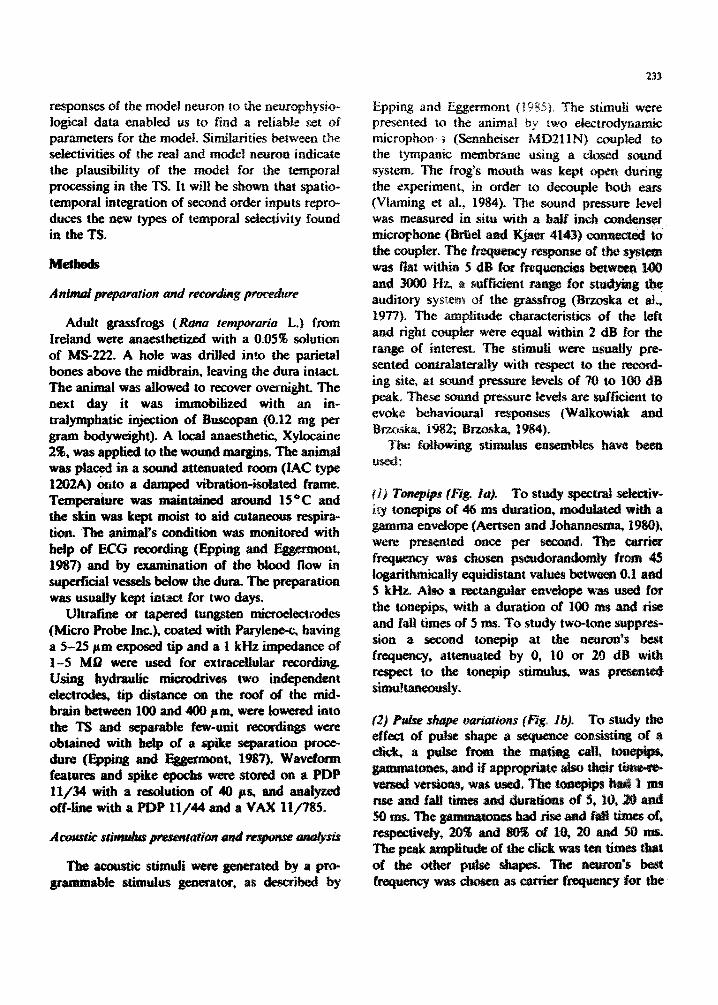
Adult grassfrogs (Rana temporaria L.) from Ireland were anaesthetized with a 0.05% solution of MS-222. A hole was drilled into the parietal hones above the midbrain, leaving the dura intacL The animal was allowed to recover overnighL The next day it was immobilized with an in- tralymphatic injection of Buscopan (0.12 rag per gram bodyweight). A local anaesthetic, Xylocaine 2%, was applied to the wound margins. The animal was placed in a sound attenuated room (IAC type 1202A) onto a damped vibration-isolated frarne~ Temperaiure was maintained around 15°C and the skin was kept moist to aid cutaneous respira- tion. The animal's condition was mordtored with help of ECG recording (Epping and Eggernmnt, 1987) and by examirmtion of the blood flow in superficial vessels below the dura. The preparation was usually kept iataet for two days.
Ultrafme or tapered tungsten microelectrodes (Micro Probe Inc.), coated with Parylene-c, having a 5-25/ tm exposed tip and a 1 kHz impedance of 1-5 MQ were used for extracellalar recording. Using hydraulic microdrives two independent electrodes, tip distance on the roof of the mid- brain between 100 and 400 pin, were lowered into the TS and separable few-unit recordings were obtained with help of a spike separation proce- dure ~ and ~ t , 1987). Waveform features and spike epochs were stored on a PDP 11/34 ~ t h a resolution of 40 ,~ts, and analyzed off-line with a PDP 11/44 and a VAX 11:O85.
Acoustic stimulus presemation and response analym
The acoustic stimuli mere generated by a pro- grammable stimulus generator, as described ~y
233
Epping and Eggermont (I985). The stimuli were presented to the animal by two electrodynarrfic microphon ; (Senn.heiser MD211N) coupled to the tympanic membrane using a closed sound system. The frog's mouth was kept open during the experiment, in order to decouple both ears (Vtaming et al., 1984). The sound pressure level was measured in situ with a half inch c o n d c n ~ microphone (Bffml and Kjaer 4143)oman~ed 'to the coupk~r. The frequency response ,of ~ system was flat within 5 dB for frequencies between 100 and 3000 Hz~ a sufficient range for studyiag t h e auditory system of the grassfrog (Brzoska et al , 197"0. The amplitude characteristics of the left and right coupler were equal within 2 dB for the range of interest. The stimuli were usually pre- sented contralateraliy with respect to the record- ing site, at sound pressure levels of 70 to 100 dB peak. These sound pressure levels are sufficient to evoke behavioural r~sponses (Walkowiak and B~c~ka. 1982; Brzoska, 1984).
~Hm following stimulus ensembles have been use, d:
(J) Tonepips (Fig. la). To study spectral selectiv- ity tonepips of 46 ms duration, modulated with a gamma envelope (Aertsen and Johannesma, 1980), were presented once per second, The carrier frequency was chosen pseudorandomly from 45 logarithmically equidistant values between 0.1 and 5 kHz. Also a rectangular envelope was used for the tonepil~ with a duration of 100 ms and rise and fall times of 5 ms. To study two-tone suppres- sion a second tonepip at the neuron's best frequency, attenuated by 0, 10 or 20 dB with respect to the tonepip stimulus, was presented simu!taneously.
(2) Pulse shape variations (Fig. lb). To study the effect of pulse shape a sequeace con~sting of a crick, a pulse from the m a t ~ call t o n e ~ $ , gamwmtones, and if appropriate also their time-re. versed versioas, was ttsecL The tonepitn h ~ 1 ms rise and fall times and duratioas of 5, 10, ~ and 50 tn~ The gammatones had rise and fall times o f , respeoively, 20~ and 80~ of 10, 20 and 50 ms. The peak amplitude of the click was tea times of the other pulse shalx~. The aearon's best frequency was cF~en as carrier frequency for t h e

23t,
, , I I I i I
o - - > tcm$) 21~
0 - -> t(m$) 1 ~ 0
Fig. 1. Stimulus waveforms and envelopes. (a) two gammatones of 46 ms duration and a 100 ms tonepip: (b) dick, normal and time-reversed pulse from the mating call, envelopes of tonepips of 5 and 10 ms duration, normal and time-reversed gamma- tones of 20 ms duration: (c) envelope of two AM tonebursts: (d) two periodic click trains: (e) segment from random click
ensemble: (f) mating call, recorded at 15 * C.
tonepips and garmmatones. Onset interval of the pulse shapes was 1 s.
(3) Sinusaidally amplitude modulated tone bursts (Fig. lc). Tone bursts of 500 ms duration with 1130 ms overall rise and fall times were presented every 3 s. The neuron's best frequency was chosen as carrier. The modulation depth was 16 dB, cor- responding to 84%. The AMFs were varied pseu- dorandomly between 7.8 and 250 Hz, In addition an unmodulated tone burst was presented (Epping and Egg ermont, 1986b),
(4) Spectrotemporal stimulus. Amplitude mod- ulated sound bursts with different carriers were used to study the interdependency of spectral and temporal selectivity. Onset interval of the 500 ms duration sound burst was 2 ~ One spectrotem- poral stimulus consisted of combinations of four
carriers with three modulators (100% modulation depth), another stimulus contained combinations of six carriers with five modulators (84% modula- tion depth, Fig. lc).
(5) Periodic click trains (Fig. ld). Trains of 10 equidistantly spaced dicks, with onset intervals of 3 s. The interdick intervals of the trains were varied pseudorandomly between 128 and 4 ms, corresponding with logarithn-Jcally equidistant PRRs of 7.8 to 250 Hz. The duration of the condensation click was 0.7 ms, and its amplitude spectrum was flat within 5 dB for the range of interest (Epping and Eggermont, 1986a).
(6) Random clicks (Fig. le). Stimulus ensemble consisting of clicks with an average rate of 16/s. "[he interdick intervals are drawn independently from a negative exponential distribution with a minimum interval of 1 ms. The interval distribu- tion corresponds to a Poisson process with a dead-time of 1 ms (Epping and Eggermont, 1986a).
(7) Mating call ensemble. The basic sequence consisted of 10 s silence, followed by three origi- nal mating calls (Fig. If). After this the envelope of the origine.i mating call served as amplitude modulator for carrier frequencies of 201,557, 1067 and 1542 Hz. Then, while keeping the number of pulses constant, the interpulse intervals of the original mating call were multipfied by 0.5, 1, 2 and 4, corresponding with PRRs of 72, 36, 18 and 9 Hz. Finally the original mating call was pre- sented again followed by its time-reversed version. Intervals between the calls were about 2.5 s. This basic sequence, which had a duration of 50 s, was first presented in silence. Thereafter a pink noise background, whose amplitude was increased step- wise, was added ~e the basic sequence. The peak ratios between voca~,.aions and noise (SNR) were consecutively 6, ~!~ and - 6 dB. After the basic sequence with the highest noise level a 50 s period of silence was added (Eggermont and Epping, 1986).
To check the reproducibility of the responses and to collect adequate data all stimuli were re- peated at least three times. The response to the random clicks was analyzed by crosscorrelating the stimulus Cricks (z,) with the neural response

(z2), resulting in a crosscoincidence histogram (CCH). The formula for bin m of the CCH reads:
1 t "T , f f m + ~ ) A _ CCH,2(m ) = - - j ~ atj, , a ,
TA o {,n- ~a
(I)
n, Here z t ( t ) = ~ 8( t - t~.j) represents the events at
j=l times ti. j of point process zl, T is the duration of the experiment and A is the binwidth of the crosscoincidence histogram.
The responses to the other stimuli are presented in the figures as reordered eventdisplays along with spike rate histograms. Thereby the actual response is reordered systematically according to a stimulus parameter. In this paper spike rate is defined as the average number of action potentials per stimulus presentation.
The presence of neural interaction was investi- gated by erosscorrelation of simultaneously re- corded spike trains (Epping and Eggermont, 1987; Melssen and Epping, 1987). Neural synchrony re- sulted in a peak or trough in the simultaneous crosscoincidence histogram (Eq. 1, with z I and z 2 the responses of the two neurons). The contribu- tion of a common stimulus influence to this syn- chrony was estimated by the nonsimultaneous crosscoincidence histogram (NCH), also called shift predictor (Perkel et al., 1967). The nonsimul- taneous crosscoincidence histogram results from crosscorrelation of one unit's spike train with the spike tcain of the other unit shifted circularly over the length L of a stimulus sequence (F..q. 2). Hereby it was verified that the responses of the neurons were periodically stationary, i.e. that the response probability remained identical for subse- quent stimulus sequences.
L NCHI2(m) = CCH|2( m + -~ ) (2)
A difference between the simultaneous and non- simultaneous crosscoincidence histogram indicates that the neural synchrony is not merely caused by stimulus influences, but that neural interaction also contributes.
235
The model
As a starting point a simplified version of the model for the peripheral auditory system (Van Stokkum and Gielen, 1989) is taken, The model's components are shortly described below and are shown in Fig. 2. A cascade consisting of a linear middle ear filter (Fig. 2A, impulse response in Eq, 3), a linear band-pass filter (Fig. 2B, impulse response in Eq. 4), and a static aonlinearity (Fig, 2C, Eq. 5) produces a hairceil potential ~. The middle ear filter, which was derived from Aertsen et al. (1986), is described by the resonance frequency ~o I and decay rate T:
h(t) = 2~e-" s in(~l t)O(t) (3)
with O ( t ) = l if t > 0 , and O(t)=O if t~O. The band-pass filter impulse response ~( t ) is char- acterized by a centre frequency % and by a time constant fl, which determines the sharpness of the filter.
L ( t ) = 2 f l [ -2 te - ' / ~ ' sin(%t)O(t) (4)
Parameter r ° of the mechano-electrical transduc- tion nondinearity (Eq. 5, Fig. 2C) is related to the half-saturation sound pressure level (Crawford and Fettiplace, 1981).
u(r) = r--f---O(r) (5) r + r °
The haircell potential u provides the input to an adaptation component which was adopted from Eggermont (1985), and which is described by an inactivation rate 3, and a recovery rate # (see Van Stokkum and Gielen, 1989):
v= ( u + b ) O ( u + b ) (6)
db ¥ = - x v - (7 )
The differential equation for b corresponds to that describing a first-order low-pass filter. Note that omission of the rectifier (Fig. 2F) would leave us with a high-pass filter. Low-pass [fltering by the dendrites of the NVIII neuron (Fig. 2G, impulse

236
response in Eq. 8) produces the generator poten- tial w of the first order model neuron.
t(t) (8)
Action potentials (events) are generated sto- chastically with help of a generator funct ion g (w) , known in point process literature (e.g. Cox and lsham, 1980) as the intensity function. The prob- ability o f event generat ion in a bin with width At is (see Van S tokkum and Gielen, 1989):
e [ z N ( , ) = 11 = 1 - (9)
Here N ( t ) is the count ing process, which repre- sents the number of events up to t ime t, and A N ( t ) = N ( t + A t ) -- N( t ) . The argument o f the generator funct ion depends in two ways on the events generated in the past. Firstly, after an event has been generated the probabi l i ty per unit of time to generate an event, g(w) , is zero for an absolute refractory period %b,. Secondly, to model relative refractoriness a negative feedback is sup- plied to the event generator. This feedback is given by the impulse response c( t ) , which starts after the end of %b~:
c( t ) = - R e - ( t - " ~ ' / ' ~ ) O ( t - ran ~ ) (]o)
The refractory mechanism is illustrated in Figs. 2E and 2t, with %b~ = 1 ms and eR = 2 ms. W h e n eR is much larger than %b~ the negative feedback produces adapta t ion of the model neuron (see also Bibikov and Ivanitskii, 1985). For the generator funct ion g(w) a half-linear funct ion is chosen:
g(w)=r(w-m)O(w-m) (11)
W h e n the genera tor potential w is less than m, the threshold parameter , g ( w ) is zero. Parameter 1, determines the slope of g(w) . In Figs. 2H, K the probabi l i ty o f event generat ion according to Eqs. 9 and 11 is drawn for two diffem.nt values of z,.
Spatiotemporal integration o f inputs It is assumed that lower order neurons con-
verge upon a higher order neuron. This conver- gence o f inputs is modelled as a l inear summat ion o f the input point processes, which are then low-
m t dd Le ear mechan i ca [ t r a n s d u c t i on F, [ t e r t u n i n g
I °I
pos t ~synap t i c l ow-pass e v e n t a d a p t a t i on f" i I t e r gener a t , on
x ] ~ e s s
1 ow-pass event f J [ter g e n e r a t i on
p a p l l [ a N V I I I OIIN TS Fig. 2. Model for the processing of sound by the papilla, NVIII, DMN and TS of the grassfrog. The stimulus waveform is band-pass filtered by the middle ear (Fig. 2A), and filtered and transduced into a haircell potential (Figs. 2B, C). The synapse between the haircell and the dendrite of the NVIII fibre comprises of a short-term adaptation mechanism (Figs. 2D, F) and a low-pass filter (Fig. 2G). From the generator potential w of the NVIII fibre action potentials are generated (Fig. 2H), which form the point process x. Absolute and reletive refractory mechanisms are incorporated in the negative feedback loop (Fig. 2E). Outputs from lower order neurons (xi ..... xi ..... x.) converge upon a higher order neuron, where they add linearly and are convoluted with an EPSP shape (Fig. 2J). From the generator potential y of the higher order neuron action potentials are generated in the same way as explained above. In Figs. 2A, B, D, E, (3, I and J impulse responds are drawn on a timebase of 5 ms. Figs. 2C and F represent the instantaneous nonlinearities of, respectively, Eqs. 5 and 6. Figs. 2H, K show probabilities of event generation (Eqs. 9, 11) as function of the generator potentials w, y. The lower flow diagram symbolizes the connec:tions used in the simulations of this p a p e r , qPne generator potential w is used to generate events in four NVIII units. Four DMN units receive input from these four NNII1 units. Finally the four DMN units converge upon the third order model neuron, which represents a "IS neuron. One EPSP shape is used between NVlll and DMN. and another EI~P shape is used between DMN and
"IS. Further explanation in text.

pass filtered to arrive at compound EPSPs. In formula (Johannesma and Van den Boogaard~ 1985):
n
y ( t ) = ~=ifdse,(s)xi(t-s) with
e i ( t ) = We-t /*s (1 - e - ' / * ' ) O ( t ) (13)
Here x~(t) = ~, 8(t - t,j) represents the events at j = l
times t,.j of lower order neuron i. In Fig. 23 different EPSP shapes e,(t) are drawn. In the lower part of Fig. 2 a schematic diagram for a third order neuron is illustrated. The generator potential w provides ir, put to four N V I I I neurons, which differ in threshold and absolute refractory period. Spat iotemporal integration of these four N V I I I inputs produces a generator potential y for four D M N neurons with different thresholds, Fi- nally spat iotemporal integration of these four D M N inputs produces a generator potential y for a TS neuron. Each model neuron box consists of an event generator and a negative feedback pro- vided by the refractory mechanisms.
TABLE I
MODEL PARAMETERS
237
Implementation o f the model The model was programmed in For t ran 77 on a
VAX 11/785 computer . The seven stimuli were sampled and provided the input to the model. The sample interval was 0.1 ms for stimuli 1-3 , and 0.2 ms for stimuli 4 -7 . The number of stimulus presentations usually differs between real and model neuron. Because of limited compute r capac- ity the duration of the mating call stimulus (250 s) was shortened m 120 s by reducing the intervals between the calls to 1.4 s, The t ime-constant for recovery from adaptat ion ( # - l ) w a s limited to I s, in order to minimize forward masking of consecu- tive responses to the mating call variations.
A summary of the parameters used in the simu- lations of this paper is given in Table I, The degrees of freedom are: the tuning characteristics, the stimulus ampli tude relative to r °, the degree of spatiotemporal integration (EPSP shape) and, most important , the parameters which determine the event generation and refractory properties.
Outputs of the model are the generator poten- tials w and y oL respectively, the first and l'dgher order neuron, and the time-series x and z, which mimic the occurrences of action potentials in, respectively, a first or higher order neuron. The generator potentials help us to understand the
Parameters Eq. Related to Value
7, 601 3 middle -ear filter ¢~i, ~i 4 tuning characteristics r ° 5 transduction saturation A - t , /L - t 7 short-term adaptation ~o 2 8 dendritic low-pass filter %~, R, ~'a 10 refractory properties
m, v 11 event generation
n 12 a m o u n t o f convergence W 13 EPSP height ¢a. ~u 13 EPSP shape
time delay
1.297 (ms)- 1 2~r-0.876 kHz a variable, 1 ms 1
10 ms, 1000 nt~ 1 ( m s ) - ~ b
NVIII: 3-6 ms, 2, 1 ms DMN: 6 ms, 0.015, 400 ms TS: variable NVIII: 0.0001-0.001, 100 (ms)- I DMN: variable, 40 (ms)- I "IS: wdable 4 0.2 NVlll --¢ DMN: variable. 0 ms DMN --* "l'S: variable NVIII -* DMN: 2 ms DMN --. TS: variable
a Derived from Aertsen et aL (1986), p. 21, 25. b Crawford and Fettiplace (198OL p. 91.

238
action of the several nonlinearities incorporated in the model. The time-series z, or averages thereof in the form of histograms, can directly be com- pared to experimental data obtained in higher order neurons.
Results
D a ~ base
Recordings were made from 161 auditory mid- brain neurons in 30 grassfrogs. Stimuli 1, 2 and 3 were presented to almost all units. At least five different stimuli were presented to 54 units. Fif- teen units were fully characterized. A full char- acterization requires the presentation of all seven stimulus ensembles and comprises investigation of the different kinds of selectivities at several in- tensities.
In Table II a summary of the rate responses to the click train, pulse shape and mating call stimuli is given. The different response types as de- termined with the crick trains have already been explained in the Introduction. A response was classitied as selective if the response decreased by at least 50% relative to the maximum response. The PRR evoking a 50~ response was termed the cut-off PRR.
TABLE 11
SUMMARY OF RATE RESPONSES TO PULSE SHAPE VARIATIONS (HORIZONTAL) AND PERIODIC CLICK TRAINS (VERTICAL)
Integration effect no total
no yes response
Non-selective 9 ( - - - ) 9 Low-pass 10 ( - ) 10 High-pass 2 9 ( + ) I 1 Band-pass 8 ( + - ) 5 ( + + + ) 13 Bimodal 1 1 ( + ) 2 No response 3 6 ( + + ) 2 ( + ) 11
Total 25 24 7 56
When the response was restricted to pulse shapes exceeding a minimum duration, a temporal integration effect was consid- ered to be present. Fourteen units with a particular rate response type with respect to PRR in the mating carl ensemble are indicated between parentheses: + : high-pass, - : non-selective. Further explamRion in text.
Some units responded only to pulse shapes exceeding a minimum duration, an example is shown in Figs. 5a, b. Usually this was accompa- nied by a larger response to the time-reversed versus the normal pulse shapes, see e.g. the re- sponse to the time-reversed gammatones of 20 and 50 ms in Fig. 5b. This type of response to pulse shapes is interpreted as evidence for the presence of temporal integration. Twenty-five units did not, and twenty-four units did show a temporal integration effect. Out of the neurons without a visible integration effect three showed a prefer- ence for pulse shapes of short duration and one for short rise times.
Eight of the 11 units which did not respond to the click trains were strongly inhibited by frequen- cies around 600 Hz. The two units which showed a bimodal response both showed an inhibition fol- lowed by excitation response type as determined with the random cricks (type III of Epping and Eggermont, 1986a). The distribution of the re- sponse types with the crick trains agreed with the findings of Epping and Eggermont (1986a). Neu- rons which showed clear signs of integration ef- fects (column two in Table II) showed a high-pass, band-pass or no response to the click trains. How- ever, nearly all units without visible integration effects (column one) showed a non-selective or low-pass response to the click trains. Units which did not respond to the pulse shapes (column three) showed a band-pass or no response to the crick trains. The neurons which preferred the higher PRR variations of the mating call (indicated by +) are all contained in columns two and three. Because only four PRR-variations of the mating call were tested no detailed classification was made.
Rows one and two have been lumped and also rows three, four ann five in order to perform a X z statistical test. The selectivity for pulse shapes and for crick trains were not independent (X2- - 36.5, df =4, P < 0.05~). Thi,: strengthen~ Lhe hypothe- sis that temporal integration effects are responsi- ble for the band-pass and high-pass response char- acterisfics, which appear for the first time in the TS.
About 40% of the data were obtained while simultaneously recording from two or three units. Table III summariz~ the inferences made from

FABLE 111
SUMMARY OF UNIT PAIR ANALYSIS
Recorded on
1 electrode 2 electrodes Total
No synchrony 1 2 3 5ynchrony 11 18 29 Common input 3 2 5
:rosscorrelations of 32 pairs of units. The great majority of these, 29 pairs, showed signs of neural ;ynchrony, visible as a peak or trough in the ;imultaneous crosscoincidence histogram. A clear ~lifference between the simultaneous and non- ~imultaneous crosscoincidence histogram was seen in only five of these 29 pairs. Most probably the ~ifferences have to be ascribed to neural common input. No clear differences were observed between mi t pair recordings made from one or two dec_ Irodes. Thus in agreement with a larger study by Epping and Eggermont (1987) neural interaction ~eems to play a minor role in the auditory mid- )rain of immobilized anurans. Therefore the hy- pothesis that local circuits are responsible for tem- poral selectivity was abandoned (however, see Discussion). In the following a model will be flaborated which predicts responses of TS units From convergent input from lower order neurons, fisregarding interactions between TS units.
Modelling two typical TS units
It will be shown how the model produces a figh-pass response t o the crick train stimulus by ~aeans of temporal integration. Then the complex 3f selectivities found for a "IS unit showing tem- poral integration and a high-pass response to the :rick trains will be compared with the model new ron's selectivities.
In Fig. 3 the response of the first and second artier model neuron to the crick trains is shown. rhe second order model neuron receives four in- puts (Fig. 2). The absolute refractory periods of the NVIII inputs vary linearly between 3 and 6 ms, and their thresholds vary linearly between 9.001 and 0.0001. The NVl l l input with the highest threshold and the longest %b~ i s illustrated in Figs. 3a, b. The first and second order neuron
239
both show rate responses of a low-pass type with a cut-off PRR of 200 Hz (Figs. 3b, d). This is caused mainly by the absolute refractory period of 6 ms which interferes with the highest PRRs. Note that there is a one to one correspondence between stimulus and response up to a PRR of 100 Hz.
As a next step an EPSP (Eq. 13) with a fall time-constant ~'a of 30 ms and a rise time of 24 ms (% = 60 ms) is chosen ~3 model the temporal integration. These time constants were chosen order t o fit the response of neuron 322, 3, 0 (F ig . 5). In Fig. 4a the spatiotemporal three.ration per . formed by the third order model neuron is visible in the generator potential, averaged over the en-
N V I I I event.s ×
250 ~:
125
N
Ee2 5 t~
0-31 2 A
156 . . . .
7 8
b i~
c I)tlt4 events Z 2501
d 10,0
125 " e ~ N
O~
l !
156
0 --> t(mS) ~i~I~ rate
Fig. 3. Recorded eventdisplays together with rate h i ~ $ of responses of first and second order model aeutom ~o d',e periodic click trains. Stimulus i ~ e y : 22 dB relative to e 0. Model parameters: tuning: centre frequency 0.4 ~ f in ocde¢ eveat generation: m 0.00L %,, 6 n~ The scc~md order umt receives Lqput fi~m four units as in (a), with m varying lineaHy between 0.0O01 and 0.001 and %~ varying linearly between 3 and 6 ms. Further model p a r a s : EPSP shape: fd 3 ms; second erder event generation: m 0.33. A delay of 2 ms was
inoorpotated.

240
a TS generatorpotent~ol <y> 250
' 2 5
5 62 ~ 6 ~ m . , - - - - . . . . . . .
" V-- , --., -- -
Is~ K~,-~-- _~- I
d TS events z
25t~ ~ " i 1 ,
1 2 5
r~
! I
1 5 6
7 8 0
b 8E+2 c 0 811
a ~ e a ~eok
e 1 0 . 4 9
t ~L.___.L__A., I J ~ ~ t - - > t [ m $ ) 6 0 0 r a t e - - > y
Fig. 4. Simulation of a "IS neuron, which receives input from four DMN neurons as in Figs. 3c, d. Outputs y, the generator potential, and z, the events, as a function of PRR. The time-course of the ensemble averaged generator potential (y(t)) (a), its area (b) and the average and standard deviation of the peak of y(t) (c) are depicted. Inputs are four umts, with m varying linearly between 0.27 and 0.33. The m-value of 0.33 was used in Figs. 3c, d. EPSP parameters: ¢u 60 ms, ¢d 30 ms. Parameters for the TS event generation: ~, 2 (ms)-1 m 0.21. Refractory parameters: r,,b, 10 ms, R 0.6, rs 2 ms. A delay of
10 ms was incorporated in order to fit the latency.
semble of five stimulus presentations. The nega- tive feedback provided by the refractory mecha- nisms has been excluded from Figs. 4a-c. Fig. 4b shows the average area of the generator potential as a function of PRR. The solid line in Fig. 4c corresponds with the average peak of the genera- tor potential, and the deviations from the solid line correspond with the standard deviation of this peak, A high-pass character is dear ly visible in Fig. 4c. The probability of event generation func- tion (Eqs. 9, 11) in Fig. 4f, which for comparison is drawn to the scale of Fig. 4c, is now used to generate the response shown in Figs. 4d and 4e. Because of the high threshold a single click pro- duces no response, and temporal integration is necessary to reach threshold. Note that in contrast
to Fig. 3 the synchronization to the individual stimulus clicks is lost.
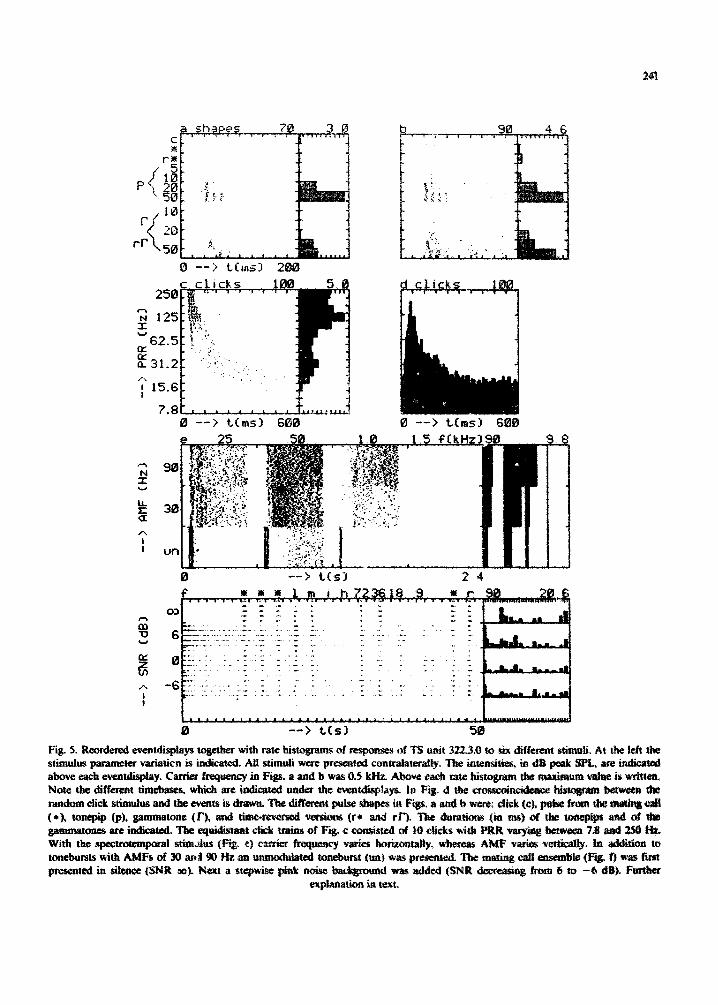
The responses of unit 322,3,0 and of the model neuron to six stimuli are compared in Figs. 5 and 6. Because unit 322,3,0 responds to carrier fre- quencies up to 1.0 kHz (Fig. 5e) it receives exci- tatory input originating from the amphibian papilla. This is modelled with a band-pass filter (Eq. 2) tuned to 0.4 kHz, the unit 's best frequency. Threshold of this unit was 50 dB peak S P L At intensities of 70 and 90 dB the unit showed practi- cally no response to pulse shapes with a duration shorter than 20 ms (Figs. 5a, b}. This is very well reproduced by the model neuroa (Figs. 6a, b). The responses to the click trains, Figs. 5c and 6c, show a high-pass character and a decline of latency with increasing PRR. Quantitatively however, the model neuron's response is stronger for PRRs between 40 and 100 Hz. The crosscoincidence histograms between the clicks and the events (Figs. 5d and 6d) both show a broad peak, whose width is somewhat smaller for the model neuron. The greatest deviation between data and simulation is found with the spectrotemporal stimulus (Figs. 5e and 6e). Unit 322,3,0 responds well to the onset of unmodulated tones, and this onset response is followed by a rebound in case of the 0.5 kHz carrier. This pause response pattern might be caused by inhibition, which was not included in the model. Furthermore the rate response of Fig. 5e shows a high-pass character with respect to AMF. This is modelled with a modest degree of coincidence detection on the DMN level, in a previous paper (Van Stokkum and Gielen, 1989) it was demonstrated that part of the DMN units respond selectively to fast intensity changes. These fast intensity changes synchrorfize the NVIII in- puts, and convergence of these inputs upon a DMN unit, usir~g a short integration time, pro- duces a peaked generator potential. In contrast, an unmodulated tone produces a flatter generator potential, because the input firings will gradually become distributed in time, due to their refractory properties. The thresholds of the DMN units of this model produced a modest high-pass response with respect to A M F (not shown). This modest high-pass response is preserved on the TS level (Fig. 6e). Finally in Figs. 5f and 6f the response to the mating call ensemble is depicted. Without
2 5 0
1 2 5 " r
" 6 2 . 5 n,.
o - 3 1 . 2
? ~s.a !
7 .8
N
I.I. r "
A ! !
! !
_ ~ 9 0
0 --> tZms3 200
0 - -> tCms) E~OIB 0 --> terns) G,~KO
90
30
uo
0 - -> t ( s ) 4
t i
L~
0 - -> tCs) 51~
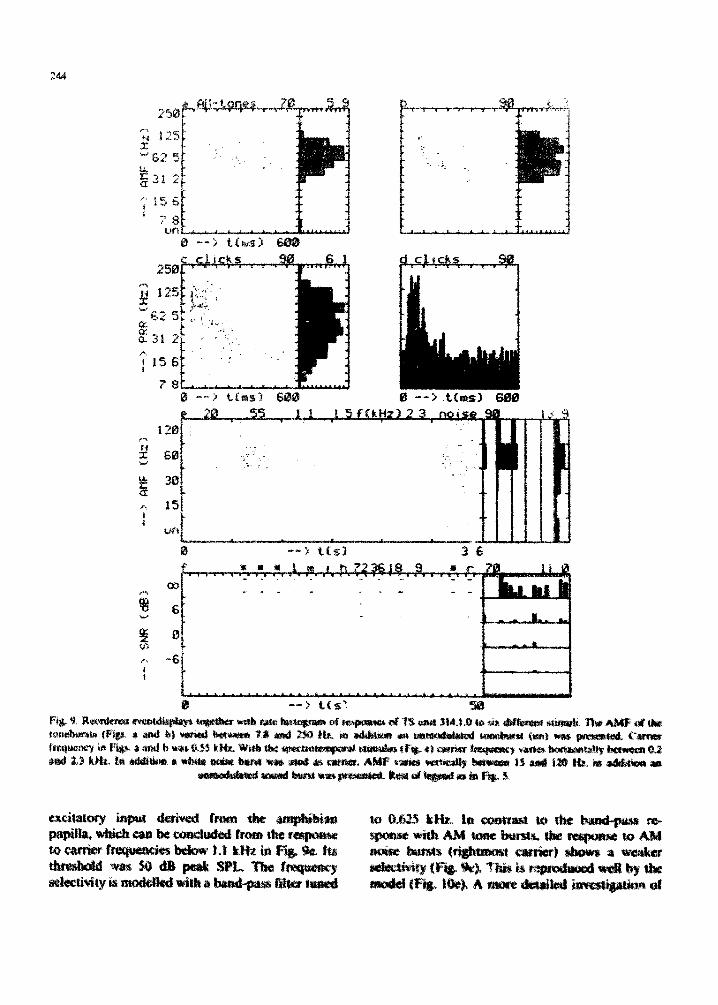
Fig. 5. Reordered evemdisplays together with rate histograms of ~ of TS unit 322.3,0 to six different ~ f i ~ At the left the stimulus parameter vatiatic~ is indicated. All stimuli were presented contrala~redly, The intensities, in dB peak SPL axe indicated above each eventdisplay. Carder frequency in FiBs. a and b was 0.5 kl4z. Above each rate histogram the w m value i~ wrJttett Note the different timebas~ which are indicated under the eventdis~!ays. In Fis~ d the ~ d e r , c~ hi~o~ram ~ random click stimulus and the events is drawn. The different pulse shapes in Figs~ a and b were: click (c). ptdse front the f r u t ~ eall (*), tonepip (p)~ gammatone (U), and time-reversed versim~s (r* and rF), The duratiotts (in ms) of Ore ~ p s and of the 8anu~tones are indicated. The equidistant ~ trains of Wtg~ c consisted of 10 cIidcs ,with PRR varying :bet,~ee~ 7.8 and 250 I ~ Wiutt the spectrotemporai s ~ e s (W~ c) c~frier frequency varies holizontaUy~ whereas AMF varies vertically~ |n addition to tonebmsts with AMFs of 30 a~4 90 Hz ,an unnu)dulated tone.burst (tin)'was presented. The mating caU ensemble (Fig, 0 was tim presented in silence (SNR 0v). Next a stepwise pink noise background was added (SNR ~ n 8 from 6 to - 6 dB~ Fur£ner
explanation in text.

242
0 --> tCms) 200
25
N 12 I
~62.
1 1 5 !
7 0 --> tCms) 6 0 0
1 0
"" 9 0 ...................................................................... " * J r " . . . . . . . . . . . . . . . . . . . . . . . . . . . . . . . . . . . . . . . . . . . . . . . . . . . . . . . . . . . . . . . . .
b , . "s -
| . . . . . . . . . . . . . . . . . . . . . . . . . . . .
I un . . . . . . . . . . . . . . . . . . . . . . . . . . . . . . . . . .
0 - - > tCs) F m m u I m i h 7236 H3 9
r~ Z _- . . . . . . . . . . . . .
t i - 6
0 --> t C m s ) 6 0 0
2~4
0 - - > t C s 3 3 0 Fi~. 6. Reordered ev~ntdLsplays together with rate histograms of ~e model TS neerc~a of FiS~ 4 in response to the stimufi o f F ~ S.
Fi 8. 6c is equal to FiBs. 4d-e. All stimuli ~ete ~ t e d at the relative intensities of Ft~ 5o
noise (SNR ~ ) both unit 322,3,0 and the model neuron do not respond to the 9 and 18 Hz PRR variation, which implies a high-pass response with respect to PRR. in comparison with Fig. 5f the model neuron is less frequency selective: it re- sponds weakly to the carrier frequency variations of 1067 and 1542 Hz (i and h). Unit 322.3,0
adapts to the n o ~ which is visible in the first 10 s of Fig. 5f. Thereafter, the response to the mating calls remains distinct up to the highest noise level. In contrast the model neuron's response to the calls is masked by the n~ponse to the noise for the highest two noise levels.
Now the same model is applied to a unit which

~-~ NVIII e ~ e m t ~ 250 I - - r - - c - ~-w--r----r-
~1 125 !
.~G2 5
~31 2 t
78
] 2 4
C ~ ~vent~ d 3!
N
~31 2 !
1 5 6
F~ 7. Remdeted eveaulisplays toSeth~ ' ~ r ~ ~ m ~ of n~onses of first and second order model neerom to AM Ionebt~ts. Stimulus ~ : ~ t ~ 12 d~ t e l ~ e w r ~. ~ f ~ 0.$5 k14~ Mod,'A I ~ : ~ : centre frequeacy 0,625 kH7_ All other pamnmers as in V~..,
m 0£~.
did not respond to the pulse shape stimulus and which showed a band-pass ~ to both the click trains and the AM tone bursts. To model a band-pass ~ to the AM tone bu~.s the degree of coincidence ~ o n on the DMN level is increased by s h o o ~ the ~ S P and slightly increasing the thres lm~. The effcc~ of this is pictured in Fig. 7. The rate response of the NVII! unit shows ~ non-selective character (Fig. 71)), Note tim[ the t ~ to the five ~ t a t i o ~ o l e a ~ AM tone burst ate alisned very ~ for AMFs around 62.5 Hz (Fig. ~ag ~ that t ~ absolute refractory periods o f the N V I I | inputs varied between 3 and 6 ms, and ~ t ~ d s varied ~ 0.001 arat 0.OB01. T o ~ e t h ~ with the rc la t i~ ~rag- locy ~ these dif-
f=re~ce~ lirt~t @,e ab~li,y of the. NVII| ~r)puL~ ~o respond simuhaneo~ly with the V)w~.~ aad hig~e<st AMFs, This result., in a DMN ge~erato¢ potential peak histogram wilh a band-pass chma~o~er (not shown here, see Fi~ 8 in Van S~okk~m arid G~len, 1989), t~cause o~ its high threshold the DMN ~ait produces a batb.~-p~s resp(m~,e ~ t h tes~c~ AMF (Figs~ 7c~ d), Temporal iate~atio~ of the foul: DMN inputs produces the ~e~"~erat~-pot~- tin! ~arac~eri~ti~ of F ~ , 8~-e~ Both ~ aver-
show a b ~ d - ~ el~r~er, T ~ p r o b i t y of
a high l l t , ~ and produces a d ~ bawJ-pas~ response (F't~s. 8d and eL
Now the rcspon~ of unit 3l&l,O to six stimuli
10), Unit 314,1,0 did not ~ to tmn~duiated torte b~arsts (i~.~ 9e). Like m~it 322,3.0 it reoeive~
T
: J
!'~i i
i m [i ~ i~
250
125
a. 31 2
I5G !
?B 0 - - > t6m$) GO~ 0 - , - > . t ( m $ 3 6 ~ !
,2.i .... . . . . '"
U~ ~ . . . . . . . .
0 --')~ t(s) 3 g
-6
i) - - > t (s ' .
exci|a|or~ inpu! derived from |h~ ~ ~ p~i~ which can be ~ ~ from tl~ zo ~ f req~ics ~low ).I k~ in Fq~ 9e~ It~ d ~ wa~ ~ dB p , ~ SPL Tb~ f ~
io 0~ kH~ In o~ua~ to d~ bawcl.p~ ~. ~th AM ~ i~c,~-t~ the ~ ~ AM ~rsts (r~h~mc~ c~rier) ~.~ a w~ka

the AMF selectivity, using a C~Ltr~et ~requeacy of 0.55 kHz, is shown in Figs. 9a, b ~nd lO~ b. At intensitie~ differing by 20 dB a clear selectivity for AMFs between 31 and 125 Hz is visible. Note th~z the rate response to the AM t . ~ b~s~ wJ~h a carrier frequency of 0.55 kHz and an AMF of 60 Hz (Fig, 9e) is ~',~c¢ as large as the m.axi~,n
effect caused by the r q ~ a t ~ pre~n~a~on ot ~55 kHz AM tone bursts, d~pi~e the onsez interca| of 3 s. At the highest intensity the model's response deviates in that d~e AMF selectivity is no kruger absolute~ ~ re~spo~ is ,d~ble to the knver higher AMirs, "Fne ~ to the crick trains in
^1 ! I
- - > t ( ms.~
0
N Z
A
! | |
- - > LCm$)
0
0 --> t[~)
" i ........
I ' i
• ] . . . . . . . t
- - > t ~ $ } 3 6
[
-qG

246
both cases shows a band-pass character (Figs. 9c and 10c). Unit 314,1,0 adapted totally after 90 s of the random click stimulus, which the model neu- ron did not (not shown). The :rosscoincidence histograms (Figs. 9d and 10d) both show a broad peak, which is somewhat broader for the model neuron. Finally the responses to the mating call ensemble (Figs. 9f and 10f) agree with respect to the PRR variations in that no response is visible to the 9 Hz PRR variation. The frequency selectiv- ity of the model agreed well at 90 dB peak SPL (compare Figs. 9e and 10e), but differed for the mating calls at 70 dB peak SPL, where unit 314,1,0 responded weakly to the carrier frequency varia- tion of 201 Hz (I). Both unit 314,1,0 and the model neuron practically do not respond to the noise, which is visible in the first second of the reordered eventdisplays. The response of unit 314,1,0 is completely masked by the noise, except for the 72 Hz PRR variation. In contrast the response of the model neuron persists up to the highest noise level, which reminds us of the re- sponse of unit 322,3,0 in Fig. 5f.
Thus, from Figs. 3 to 10 it is concluded that a change of only a few parameters, notably the EPSP shapes between first and second, and be- tween second and third order neurons, in concor- dance with the adjustmea3t of the pulse generating properlies, produces two model neurons which reflect most of tF~ properties of two qualitati,-ely different auditory midbrain units.
Discussion
Modelling
The model of the anuran auditory peripher¢ (Van Stokkum and Gielen, 1989) has been ex- tended to model the monaural properties of audi- tory n~idbrain neurons. Ufing a single para.xaeter set the response of the model to a set of spectrally and temporally structured ~ corresponded with the response c h m - a c t ~ of two typical TS n e u r o ~ Vm~ation of only a few pa~_n~rs , n o ~ bly the ~ shapes, ~ characteristics cor- rcsponcling with those of another TS ner~aron whose responsez were qualitativdy different. Together with the results of the previous paper it is tort- eluded that variation of the parameters of this
monaural model reproduces most of the response characteristics found with NVIll fibres, DMN neurons and TS neurons without inhibition (see the discussion below).
Mechanisms
The different model stages, which correspond with different stations along fi~,~ auditory path- way, perform different operations on the stimulus envelope. To begin with, in the NNIII a variety of short-term adaptation patterns exists (Megela and Capranica. 1981). In the DMN a group of units is selective for fast intensity changes, fike the onsets of the mating call pulses (Hall and Fens, 1988; Van Stokkum, 1987). This was modelled with a coincidence detection mechanism, which detected svnchrony of converging fast adapting NVIII in- puts. In the "IS a group of units possesses long integration times, which enables them to develop selectivity for pulse duration and PRR (this study). Using tonepips Bibikov (1977) found that 45~ of the TS neurons have integration times in the range be/ween 10 and I01) ms. This sample of 45~ corresponds well with column two of Table !I, which comprises the group of TS neurons that sho-~ed a n integration effect with the pulse shape stimulus. Adding to this group the neurons which do not respond to pure tones (columns three of table il, unit 314,1,0) it is found that over half of the TS units possess integration times larger than 10 ms.
Examining the l~uronal morphology of the TS, Fens (1983) observed a variety of soma shapes and dendritic lengths ranging from less than 100 ttm to over 350 tam. Inputs arriving at large den- drites give rise to a long duration EPSP at the event generation ~ite of the neuron (Rail, 1977). lntraceiAular recordings from neunms in the optic rectum of the gra~frog (Matsumoto et al~ 1986) h~ve shown that EPSP time constants of more than i0 mrs are pr~.~;-n~ All this evidence supports the h~yd~esis that temporal integration is re- ~:n'~'ble for the temporal selectivities that appear for the first ~ in the TS. Differences in neuro- nal morphology may provide the diffea-~! integra, tire properties. Next to the adaptation and ~ a l integration of inputs the event 8eneration h cn~a l . A nonlinearity, the ~ : ~ d

mechanism of Eq. 1 I, was necessary to produce the temporal selectiviti~ on the DMN and TS level.
Parameter variation
The significance of the parameters of Table I will be discussed in eormectiom with the various responses in Table II. A first group of parameters (y, %, fl~, ~of r °, J~, p, ~2) is responsible for the NVIII generator potential w. Variation of we and ~, produces different spectral selectivities. Varia- tion of the adaptation parameters A and p pro- duces the different types of short-term adaptation :found in the NVIII by Megela and Capranica (1981). The neuronal refractory (%b,, R, ¢e) and event generation (v, m) properties have to be adjusted to produce reahsuc resporkse properties. Thereby "tab ~ was chosen equal to the neuron's smallest interspike interval. The threshold m was responsible for the response selectivity derived from the generator potential.
Different fhing patterns of NVill inputs are a prerequisite for coincidence detection on the DMN level These differences are caused by differences in threshold m and in absolute refractory period %b,, and by the relative refractory ~ m (R, • a)- The second prerequisite for the czfin~flemze detection is spatio~mporal integration. At least two inputs are necessary. The effect of reducing the decay time ¢a from 3 to 1 ms was demon- straLed in this paper (Fig. 7. compare Figs, 6 and 10).
The larger *a and % of the third order nearon, the more temporal integration~ A n ~ r o n with small *d and % will show a non-selective or Iow- pa~ response pattern with respect to PRR (rows 1 and 2 of Table 11), These responses ~H be corn. parable to those shown in Figs. 3¢, d. it was
in Figs. 3-6 that th,. combination of mod~ erate coincidence detection on the DMN level (*,t = 3 ms) with temporal integration on the TS level p r o d t a ~ a high-pass ~ with respect to PRR (row 3 in Table II). Increasument of t~h¢ coincidence detection on the DMN level (c a ~ I ms) in c-mnbinatlon with temporal integratkm pro- duced a band-tins ~ with respect to PRR (row 4 in Table Ii, F~s. 7-10). The majvrity of the units with a bimodal or no ~ to the
247
click trains showed signs of inhibition (see the discussion below).
Adaptation
Next to the adaptation in the NVII1 it was assumed that there is also adaptation in the Mgher order neurons of the model. To model this a negative feedback was suppl/ed to the DMN new ron~ with a time constant of 400 ms. This im- proved the correspondence betw~n data and model simulations. Because of meihodologica| problems the recovery time constam/~ was limited to I000 ms. Non-stationarities involving longer time constants were found with the complete adaptation of unit 314,1,0 to the random click stimulus in 90 s and the adaptation to the noise of unit 322,3,0 in the f~st 10 s of Fig 5f. These non-statiormrities may he related to long-term adaptation or to habituation. Megela and Capranica (1983) found that NVIII fibres do not habituate to repeated stimuli, x~ereas in the TS habituation was observed with stimulus repetition rates larger tkan one per second, lh-esumably habituation is related to inhibitory processes, which were not included in the model.
Neural interaction
Epping and Eggermom (1987) investigated aeu* rai interaction in (he gra~frog's TS. in a sample of 264 trait pairl they found !ha~ 60% of the pairs showed neural syn~Atrony~ ~ in 77~ of cases was caused by stimulus influenc¢~ The re- mamLng 23~ showed signs of two s o ~ of neural interaction: excitation (4%) and c c ~ n i n ~ t (19~). In the srcm11~ sam#e of th/s paper ~ of the unit pairs showed aeufa] syachrony, which in 83% of the cases w ~ caused by the stimulus~ This confirms the suggest/on of Epping and ~ o n t that their 60% neural s-fnchrony was a lowerboamL because part of the unit pairs had not been with the more effective ~ y s t r i a t e d st/malL
There are two m a ~ . short~minss of the cross- c ~ l a t k m ~ First, whea spontanem~ a ~ tivity is imv, as is the case in the T$, inld~lion ah r~a uadetectable (Metssen aad ~ 1987)~ Sccoml, ~-'~iking intemcu~ which have heca

248
revealed in the grassfrog's optic tectum by Matsumoto et al. (1986), remain undetected. In view of the lack of information about inhibitory processes and non-spiking interneurons, no con- clusion can be drawn about the importance of local circuits in the TS for the processing of tem- poral characteristics of sound.
Inhibition
In this paper inhibition was not included in the model. Inhibition has been demonstrated in the temporal domain by Bibikov (1981) who used random clicks and described a group of units receiving inhibitory input followed by excitatory input (type III of Epping and Eggermont, 1986a).
In the spectral domain Fuzessery and Fens (1982) demonstrated abundant two-tone inhibi- tion. A neuron with high best-frequency which was inhibited by low and mid frequencies was simulated by extending the model with an inhibi- tory branch which started with a band-pass filter tuned to the best inhibitory frequehcy. This model neuron showed two-tone inhibition.
A problem with modelling inhibition is to de- rive the temporal properties of the inhibitory branch. Experiments using temporally structured two-tone stimuli are necessary to enable more systematic modelling.
Temperature dependence
Brenowitz e,~ al. (1985) and Rose et aL (t985) have shown that the AMF selectivity of auditory midbrain units is temperature dependent. For one unit they found that the preferred AMF shifted from 15 to 25 Hz when the temperature was increased by 8 °C. The model offers an explana- tion for this when the temperature dependence of the EPSP is taken into account, it is known that the Qi0 of the membrane conductance (passive) is about 1,3 (Jack et al., i983; p. 231; Mrose and CbJu, 1979), Thus a higher temperature will in- crease the membrane conductance and shorten the EPSP. A shorter EPSP between NVIII and DMN incre~ases the preference for fast intensity changes. w'hi~ are found with higher AMFs. A shorter EPSP between DMN and TS leads to less tem- poral integration, and causes a preference for
stimuli with a shorter periodicity, corresponding with higher PRRs and AMFs.
Identification and localization
So far only the processing of monaural stimuli was considered. Experiments using temporally structured binaural stimuli (Melssen and Van Stokkum, 1988) suggested that identification and localization of sound are coupled processes which make use of common mechanisms. So it would be worthwhile to extend the model to binaural stimuli in order to achieve a more complete picture of the information processing in the anuran auditory brain stem.
Acknowledgements
This investigation was supported by the Netherlands Organization for Scientific Research (NWO). Koos Braks skilfully prepared the animals. The experiments were conducted in close cooper- ation with Willem Melssen, who is also thanked for software assistance. Nikolai Bibikov, Willem Epping, Stan Gielen, Peter Johannesma, Willem Melssen, Henk van den Boogaard and two anony- mous reviewers are thanked for helpful discus- sions and critical reading of the text.
References
Acrtscn, A.M.HJ. amt Johannesma, P.I.M. (1980) Spcctro- temporal ro~eptive fields of auditory n~urons in the grass- frog. I. Characterization of tonal and natural stimuli, Biol. Cybern. 38, 223-234.
Aert,~t, A.M.HJ,. Vlaming, M.S.M.G., Eggermont. JJ. and Johan~ma, P,I.M. (1966) Directional hearing in tile Krass- frog (Rana temporar/a L): !1. Acoustics and modelling of the auditory periphery. Hear: Res. 21.17-40.
Bibikov. N.G, (1971a) The reaction of ~ngle neurons in lhe auditory syslem of the flog Rana ri~bun~ tO pulsed tonal slimufi. J, Evol, Biochem. PhysioL 7, 178-185.
lh~bikov~ N,G, (1971b) Responses of auditory ne~mms m the midbrain of the frog. Proc, Vlhh inL Congr~ AcousL BudapcsL pp. 549-552,
BFuikov, N.G, (1974) Encoding the stimulus envelope in pe- ripheral and central regions of the acoustic system of the frog, Accstica 31,301-305,
Bibilkov. N.G. 0975) Evaltmtion of the dynmm-cs of syratptic poleatials from the evoked impalse activity of the neer-~

Bibikov, N.G. (1977) The classification of the neurons i~ the auditory system on the basis of the functio~ of the expected rate probability. Akust. Zh. 23. 346-355.
Bibikov, N.G. (1978) Dynamics of the expected ra~e prob- ability in auditory system nebrons for different intensities of tonal stimuli. Aknst. Zh. 24, 816-825.
Bibikov, N.G. (1980) The reaction of the torus semicircul~uis units of Rana temporaria tO the signals simulating the mating call temporal characteristics. Z(xql. Zh. 5% 577-586.
Bibikov, N.G. (1981) Cross-correlation analysis of the activity of the auditory neurones on exposure to sound clicks. Biophysics 26, 346-352.
Bibikov, N.G. and Kulinkina, TN. (1983) Properties of the acoustic r~urons of the dorsal medullary nucleus in Rnna r/d/buada. J. Evol. Biochem. Physiol. 18, 346-352.
Bibikov, N.G. and Ivanitskfi, G.A. (1985) Modelling sponta- neous pulsation and short-term adaptation in the fibres of the auditory nerve. Biophysics 30, 152-156.
Brenowitz, E.A., Rose, G. and Capranica` R.R. (1985) Neural correlates of temperature coupling in vocal communication system of the gray treefrog (Hy/a ~rsicolor). Brain Res. 359, 364-367.
Brzoska` J. (1984) The electrodermal response and other he- havioural responses of the grass frog to natural and syn- thetic calls. ZooL .lb. Physiol. 88, 179-192.
Brzoska, J., Walkowiak, W. and Schneider, H. (1977) Acoustic communication in the grass frog (Rana t. temporaria L): calls, auditory thresholds and behavioural responses. J. Comp. Physiol. 118, 173-186.
Cox, D.R. and lsham, V. (1980) Point processes. Chapman and HaIL London.
Crawford, A.C. and Fettiplace, R. (1980) The frequency selec- tivity of auditory nerve fibres and hair cells in the cochlea of the turtle. J. Physiol. 306, 79-125.
Crawford, A.C. and Fettiplace, IL (1981) Non-linearities in the responses of turtle hair cells. J. Physiol. 315, 317-338.
Dunia, IL and Narins, P.M. (1989) Temporal resolution in frog auditory-nerve fibers. J. AcousL Sue. Arm 85, 1630-1638.
F.88eenmm, J3. (1985) Peripheral auditory adaptation and fatigue: A model oriented review. Hear. Res, 18, 57-71.
EggnrmonL JJ. and F_.pping, WJ.M. (1986) Sensitivity of neu- rons in the auditory midbrain of the grassfrog to tempotul characteristics of sound. !il. Stimulation with natural and synthetic mating cells. Hear. geg 24, 255-26&
EsgemumL JJ. and Eppins, WJ,M. (1987)Coincideuce ,detec- tion in auditory neurons: A possible mechanism to enhance stimulus sp¢ciKeity in the gramfrog. Hem'. Res` 30, 219-230,
F4~rtg, WJ.M. and Eggermont, JJ. (1985) Single unit char- acteristics in the auditory raidbraLn of the immobiF~ed grasdrog. Hear. Res~ Ig, 223-243.
Epping, WJ.M. and Esgemmnt. Jd. (1986a) Sensitivity of n~mons in fire auditory midbrain of the gr&ssfrog to tem-
characteristics of soead~ 1. Stiwmladoa with acoustic clicks. Hear. Res. 24, 37-54.
Eppi~g, WJ.M. and EmgermonL JJ. (1996b) S¢o~titivity of aeurans in the audit,'a~y midbrain of the grassfrog to t~a- pora| dtaracla~g~ of sound. [L Stim~tlatioa with ampli- tude modulated sound° Hear~ Res. 24~ 55-72.
249
Epping, W.J.M. and EggermonL J.J. (1987) Coherent neural activity in d,e auditory midbrain of the grassfrog. J. Ne'aro- physiol. 57, 1aa54-1483.
Feng, A.S. (1983) Morphology of neurons in the torus semicir- cularis of the northern leopard frog, Rana pipiens pipiens. J. Morphol. 175. 253-269.
Feng, A.S. (1986) Afferent and efferent innervation patterns of the cochlear nucleus (dorsal medullary nucleus) of the leopard frog. Brain Res. 367, 183-191.
Fritzsch,. B., Ryan, MJ., Wilczynski, W., Hetherington~ T.E. and Wulkowiak, W. (F_xlg) (1988) The Evolution of the Amphibian Auditory System. Wiiey, New York.
Fuzessery, ZM. and Feng, AS. (1982) Frequency selectivity in the ~n~mn ~,uditory midbr~in: Single enil responses to single and multiple tone stimulation, J. Comp. Physiol. 146, 471-484.
Fuze~ry, Z.M. and Feng, A.S. (1983) Frequency selectivity in the anuran medulla: excitatory and inhibitory tuning prop- erties of single neurons in the dorsal medullary and super- ior olivary nuclei. J. Comp. Physiol. 150, 107-119.
Hall, J.C. and Feng, A.S. (1988) Influence of envelope rise time on neural ~ t s e s in the auditory system of anurans` Hear. Res. 36, 261-276.
Jack, JJ.B., Noble, D. and Tsien, R.W. (1983) Electric current flow in excitable celis. Clarendon Press, Oxford.
Johannesma, P.LM. (1971) Dynamical aspects of the transmis- sion of stochastic neural signals, In: E. Broda, A. Locker, H. Springer-Lederer (Eds.), First European Biophysics Congress, Vetlag dex Wiene~ Medizinischen Akademie, Vienna, pp. 329-333.
Johannesma. P.I.M. and Van den Bogaard, H.F.P. (1985) Sto- chastic formulation of neural interaction. Acta Appli¢. Math. 4, 2OI-224.
MaLsun~to, N., Schwipp¢~ W.W. and EwerL J,-P. (1986) intraceltulat activity of morphologically identified neurons of the grass frog's optic tectut~ in respoztse to moving configerational stimuli. J. Comp. Neurophys~. A 1~9, 721-739.
Megd& A,L and Capranic& R.R. (1981) Response patlerns to tone bersts in peripheral auditory system of anurans. J. NeurophysioL 46, 465-478.
Megela, A.L and Capranica, R.IL (1983) A neural and F.e.hav- ioral study of auditory habituation m the bullfrog, Ratm catesbeiana, J. Comp, Physiol~ 151, 423--434.
Melssea, WJ. a~-gl Epping, WJ.M. (1987) Delect/on and esti- mation of neural connectivity based on crossoorrelatioct analysis. Biol, Cyb~'n. 57, 403-414.
Melsse~ WJ. and Van Stokkum, LH.M. (1988) Sei~livity for interaural time-diffexenee and amplitude-modulation frequency in the auditory raldbrain of the grassffos, In: H, Dmfhuls~ J.W. Horst and HiP. Wit (Eds.) Basic Issues in Hearing. Academic l~ess, Lo-ndo~ pp. 279-284.
Mtose. H.E. and Chiu, S.Y. f1979) is the steady stale inactiva- tion curve for the sodium chaanet temperatm~e dcpendea~t? Biophys, J. 2.5. 193a.
PerkeL D.H~ Ger~ein. G .L and Moore, G,P. (1967) NeutoMi spike trains and stochast~ poim processes, il. Sim~la- I~Cats spike ~ I~ophys. J. 7, 419--440,

250
Potter, H.D. (1965) Patterns of acoustically evoked discharges of neurons in the meseneephalon of the b~llfrog. J. Nearo~ physiol. 28~ 1155-1184,
Rail, W. (1977) Core conductor theory and cable properties of neurones. In: Handbook of Physiology, Sect. 1: The nervous system Vol. l: Cellular biology of neurons, Part 1, Ameri- can Physiological Society, Bethesda ML, pp. 39-97.
Rose, G.J. and Capranica, R.R. (1983) Temporal selectivity in the central auditory system of the leopard frog. Science 219, 1087-1089.
Rose, GJ . and Capranica, R.R. (1984) Processing amplitude- modulated sounds by the auditory midbrain of two species of toads: matched temporal filters. J. Co rap. Physiol. A 154, 211-219.
Rose, G.J. and Capranica, R.L, (1985) Sensitivity to amplitude modulated sounds in the anuran auditory nervous system. J. Neurophysiol. 53, 446-465.
Rose, G.J., Brenowitz, E.A. and Capranica, R.R. (1985) Species specificity and temperature dependency of temporal processing by the auditory midbrain of two species of treefrogs. J. Comp. Physiol. A 157, 763-769.
Schneider-Lowitz, B. (1983) Neuronaler Verarbeittmg einfacher und komplexer Schallsignale in der Peripherie und den unteren Stationen der Httrbahn des Grassfrosches (Rana t. temporaria L.). Thesis, Bonn, F.ILG.
Van den Boogaard, H.F.P. (1988) System identification based on point processes and correlation densities. II. The refrac- tory neuron model. Math. Biosci. 91, 35-65.
Van Gelder, JJ. , Evers, P.M.G. and Maagnus, G.J.M. (1978) Calling and associated behaviour of the common frog. Rana temporaria, during breeding activity. J. Anita. Ecol. 47, 667-676.
Van Stokkum, I.H.M. (1987) Sensitivity of neurons in the dorsal medullary nucleus of the grassfrog to spectral and temporal characteristics of sound. Hear. Res. 2% 223-235.
Van Stokkum, I.H.M. (1989) Analysis of auditory brainstem neurons in the grassfrog" Thesis, Univ. of Nijmegen.
Van Stol6:um, I.H.M. and Gielen, C.C.A.M. (1989) A model for the peripheral auditory system of the grassfrog" Hear. IRes. 41, 71-86.
Viaming, M.S.M.G., Aertsen, A.M.H.J. and Epping" W.J.M. (1984) Directional hearing in the grassfrog (Rana tem- poraria L.): I. Mechanical vibrations of the tympanic mem- brane. Hear. Res. 14, 191-201.
Walkowiak, W. (1984) Neuronal correlates to the recogrdtion of'pulsed sound signals in the grass frog. J. Comp. Physiol. A 155, 57-66.
Walkowiak, W. (1988) Central temporal encoding, in: B. Fritsch et ai. (Eds.), The Evolution of the Amphibian Auditory System, Wiley, New York, pp. 275-294.
Walkowiak, W. and Brzoska, J. (1982) Significance of spectral and temporal call parameters in the auditory communica- tion of male grass frogs. Behav. Ecol. Sociobiol. 11,247-252.
Wilczynski, W. (1988) Brainstem auditory pathways in anuran amphibians. In: B. Fritzsch et al. (Eds.), The Evolution of the Amphibian Auditory System, Wiley, New YorK, pp, 209-231.
Zakon, H.H. and Wilczynski, W. (1988) The physiology of the anuran eighth nerve. In: B. Fritzsch et al. (Eds.), The Evolution of the Amphibian Auditory System, Wiley, New York, pp. 125-155.