Embed Size (px)
Citation preview

Modified RMR to determine rock mass quality, study case of diversion tunnel in Meninting Dam, West Nusa Tenggara, Indonesia
Brilyan Jati Wijaya1,2, I Wayan Warmada1*, and I Gde Budi Indrawan1 1 Departement of Geological Engineering, Gadjah Mada University, Yogyakarta, Indonesia 2 Regional Infrastructure Development Agency, Ministry of Public Works and Housing, Indonesia
Abstract. The Meninting Dam under construction on Lombok Island, West Nusa Tenggara, Indonesia, requires a good planning to build a diversion tunnel to support its development and mobilization. The diversion tunnel is planned to be built through rocks with medium to poor rock mass quality. The planning stage involves various parameters, i.e., the rock mass classification, using either the RMR or GSI method. Converting values from one method to another makes planning work easier. However, the constraints found were the limitations of the observational data, such as discontinuity conditions. The objective of this article is to discuss the alternative depiction of discontinuity conditions in rock mass using RMR method. An alternative equation was developed to obtain a prediction model for determining the RMR value, based on GSI data. The evaluation showed that the mathematical models developed in this research had a small gap of error compared to other values. The models then can be used to predict RMR value based on GSI data and vice versa, with a higher degree of accuracy and precision according to the actual rock surface conditions, especially in the construction site of diversion tunnel at Meninting Dam.
1 Introduction
The construction of a dam is intended to optimize water resource utilization and to reduce flood disasters in rural areas. When building a dam, there is a stage to divert river or water flow. The deflection of that water flow is aimed to create dry conditions for constructing the main dam and support the mobilization of heavy equipment and building materials.
In conducting diversion of the river, BWS Nusa Tenggara I, as the stakeholder, utilizes a diversion tunnel. The diversion tunnel at the Meninting Dam is being built through rock units of pyroclastic breccias and lapilli tuff as shown on the geological regional map by Mangga et al [1]. Wiyasri [2] in 2020 stated that rock mass quality in that site had fair to poor rock mass quality as shown in Fig.2. The rock mass quality at the construction site had been determined using RMR method. Comparable values need to be calculated to describe and to ensure the rock mass quality, since RMR could not provide some results for complex computation i.e., failure criterion [3]. One of the methods which can be used to determine rock mass quality is GSI method. GSI offers simplicity in determining rock mass quality, as it based on qualitative observation. But problems were found when correlating RMR and GSI, some sub parameters which used in RMR were reduced in GSI, and they made the degree of accuracy and precision _______________________________________ *Corresponding author: [email protected]
declined. Thus, a model needs to be developed to close the gap and to make the correlation model more reliable.
1.1 RMR
Rock Mass Rating (RMR) is a method used to classify the quality of rock mass. RMR89 was first developed by Bieniawski [4] in 1973-1989 and continues to be developed until the recent years. RMR is a method to determine rock mass quality by combining qualitative and quantitative observations. In RMR89, there are 5 parameters used to determine the quality of rock mass, as shown on Table 1, they are the number of unconfined compressive strength, the amount of Rock Quality Designation (RQD), spacing of discontinuities, discontinuities condition, and the presence of groundwater, each of them then categorized into R1, R2, R3, R4, and R5.
The condition of the discontinuities (then called R4) consists of several sub-parameters, including the length of the discontinuities (persistence), the aperture of the discontinuities, the condition of the gap filling material, the degree of roughness, and weathering. Then RMR89 value is summarized from each rating of R1 to R5. In its development, RMR89 also adopts R6, where this parameter describes the effect of discontinuities orientation. The weight of the parameter R6 is from to below zero, considering that the discontinuities orientation tends to disserve the rock mass quality.
© The Authors, published by EDP Sciences. This is an open access article distributed under the terms of the Creative Commons Attribution License 4.0
(http://creativecommons.org/licenses/by/4.0/).
E3S Web of Conferences 325, 02001 (2021) https://doi.org/10.1051/e3sconf/202132502001ICST 2021

Table 1. A set of parameters of RMR89.
No Parameter Range Values
1
Strength of intact rock material
Point load strength index (MPa) > 10 4 - 10 2 - 4 1 - 2
For this low range, uniaxial compressive test is preferred
UCS (Mpa) > 250 100 - 250 50 - 100 25 - 50 5-25 1-5 <1
Rating 15 12 7 4 2 1 0
2 RQD (%) 90 - 100 75 - 90 50 - 75 25 - 50 < 25
Rating 20 17 13 8 3
3 Spacing of discontinuities > 2 m 0.6 - 2 m 200 - 600 mm <60 mm
Rating 20 15 10 8 5
4 Condition of Discontinuities
Persistence < 1 m 1 - 3 m 3 - 10 m 10 - 20 m > 20 m
Rating 6 4 2 1 0
Aperture None < 0.1 mm 0.1 - 1 mm 1 - 5 mm > 5 mm
Rating 6 5 4 1 0
Degree of Roughness Very rough Rough Slightly rough Smooth Very smooth
Rating 6 5 3 2 0
Infilling None Hard < 5 mm Hard > 5 mm Soft < 5
mm Soft > 5 mm
Rating 6 4 2 2 0 Degree of Weathering Fresh Slightly
weathered Moderately weathered
Highly weathered
Completely weathered
Rating 6 5 3 1 0
5 Groundwater
Inflow per 10 m tunnel length None < 10 10 - 25 25 - 125 > 125
Ratio: joint water pressure/major principal stress
0 < 0.1 0.1 - 0.2 0.2 - 0.5 > 0.5
General conditions
Completely dry Damp Wet Dripping Flowing
Rating 15 10 7 4 0
1.2 GSI
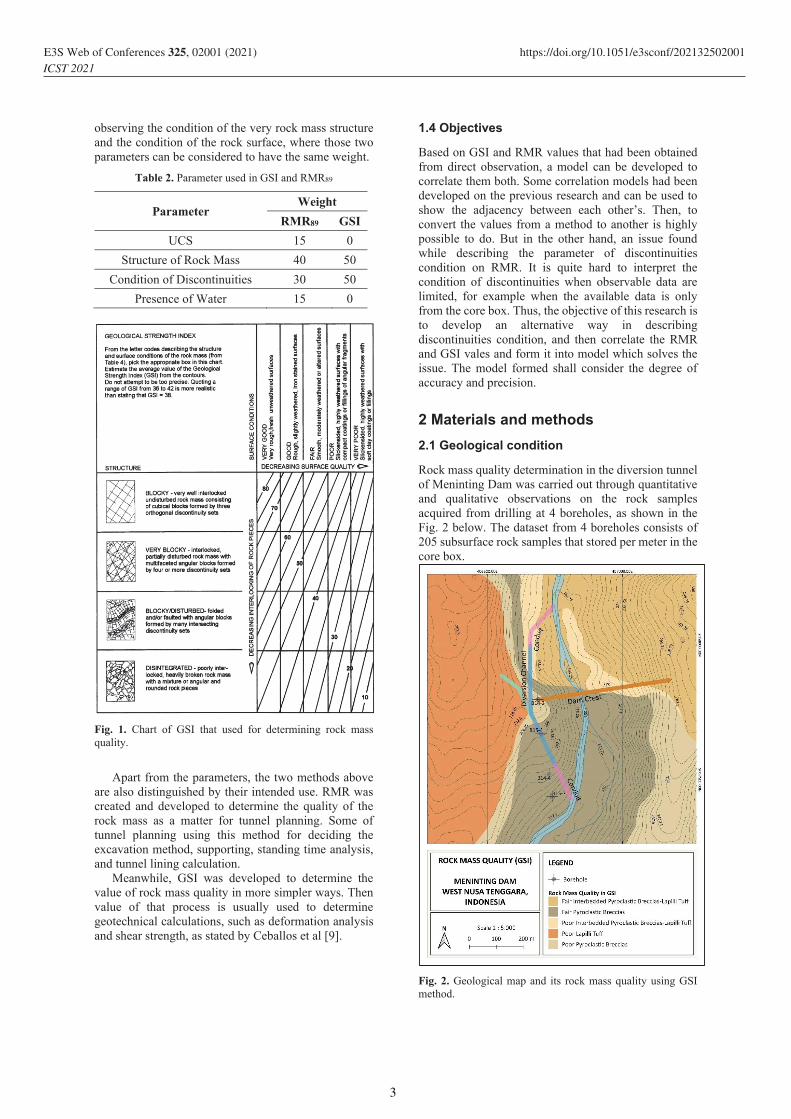
In the rock mechanics, Hoek-Brown failure criterion often utilized to determine rock mass deformation. The Hoek-Brown [3] failure criterion uses several input parameters which some can be obtained from RMR. However, the values of those parameters derived from RMR observations did not work well on rock with very poor quality, since then Hoek [5] stated that minimum value of RMR89 is 23.Thus, in the following years Hoek and Brown [6] developed a rock mass quality classification method called GSI. GSI (Geological Strength Index) is a method to determine rock mass quality based on visual observations and it is qualitative, as stated by Sonmez and Ulusay [7]. Fig. 1 shows the chart used to interpret rock mass quality. In principle, the determination of rock mass quality using GSI
method is carried out by observing the surface and the structural conditions on the rock surface, as stated by Sonmez and Ulusay [8].
Before correlating GSI and RMR89, a conceptual comparison of the use of both methods is carried out as follows.
1.3 Parameters
Ceballos et al [9] compared the parameters used in classifying rock mass quality, both in RMR89 and GSI as shown in the Table 2 below. In RMR89, there are 5 parameters in minimal that used to determine the rock mass quality (excluding orientation of discontinuities). Each parameter in the RMR has its own weight, with a total value of 100. Meanwhile in GSI, the determination of rock mass quality is worked qualitatively by
2
E3S Web of Conferences 325, 02001 (2021) https://doi.org/10.1051/e3sconf/202132502001ICST 2021
observing the condition of the very rock mass structure and the condition of the rock surface, where those two parameters can be considered to have the same weight.
Table 2. Parameter used in GSI and RMR89
Parameter Weight
RMR89 GSI UCS 15 0
Structure of Rock Mass 40 50 Condition of Discontinuities 30 50
Presence of Water 15 0
Fig. 1. Chart of GSI that used for determining rock mass quality.
Apart from the parameters, the two methods above are also distinguished by their intended use. RMR was created and developed to determine the quality of the rock mass as a matter for tunnel planning. Some of tunnel planning using this method for deciding the excavation method, supporting, standing time analysis, and tunnel lining calculation.
Meanwhile, GSI was developed to determine the value of rock mass quality in more simpler ways. Then value of that process is usually used to determine geotechnical calculations, such as deformation analysis and shear strength, as stated by Ceballos et al [9].
1.4 Objectives
Based on GSI and RMR values that had been obtained from direct observation, a model can be developed to correlate them both. Some correlation models had been developed on the previous research and can be used to show the adjacency between each other’s. Then, to convert the values from a method to another is highly possible to do. But in the other hand, an issue found while describing the parameter of discontinuities condition on RMR. It is quite hard to interpret the condition of discontinuities when observable data are limited, for example when the available data is only from the core box. Thus, the objective of this research is to develop an alternative way in describing discontinuities condition, and then correlate the RMR and GSI vales and form it into model which solves the issue. The model formed shall consider the degree of accuracy and precision.
2 Materials and methods 2.1 Geological condition
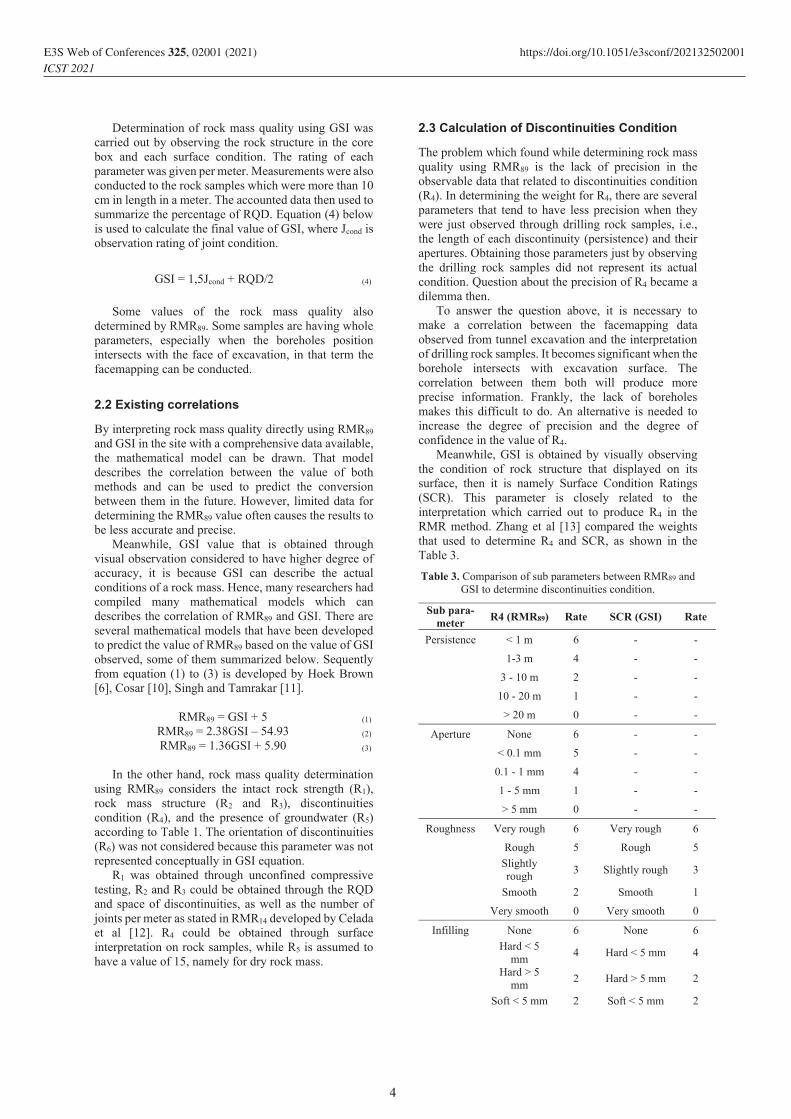
Rock mass quality determination in the diversion tunnel of Meninting Dam was carried out through quantitative and qualitative observations on the rock samples acquired from drilling at 4 boreholes, as shown in the Fig. 2 below. The dataset from 4 boreholes consists of 205 subsurface rock samples that stored per meter in the core box.
Fig. 2. Geological map and its rock mass quality using GSI method.
3
E3S Web of Conferences 325, 02001 (2021) https://doi.org/10.1051/e3sconf/202132502001ICST 2021
Determination of rock mass quality using GSI was carried out by observing the rock structure in the core box and each surface condition. The rating of each parameter was given per meter. Measurements were also conducted to the rock samples which were more than 10 cm in length in a meter. The accounted data then used to summarize the percentage of RQD. Equation (4) below is used to calculate the final value of GSI, where Jcond is observation rating of joint condition.
Some values of the rock mass quality also
determined by RMR89. Some samples are having whole parameters, especially when the boreholes position intersects with the face of excavation, in that term the facemapping can be conducted.
2.2 Existing correlations
By interpreting rock mass quality directly using RMR89 and GSI in the site with a comprehensive data available, the mathematical model can be drawn. That model describes the correlation between the value of both methods and can be used to predict the conversion between them in the future. However, limited data for determining the RMR89 value often causes the results to be less accurate and precise.
Meanwhile, GSI value that is obtained through visual observation considered to have higher degree of accuracy, it is because GSI can describe the actual conditions of a rock mass. Hence, many researchers had compiled many mathematical models which can describes the correlation of RMR89 and GSI. There are several mathematical models that have been developed to predict the value of RMR89 based on the value of GSI observed, some of them summarized below. Sequently from equation (1) to (3) is developed by Hoek Brown [6], Cosar [10], Singh and Tamrakar [11].
RMR89 = GSI + 5 (1)
RMR89 = 2.38GSI – 54.93 (2) RMR89 = 1.36GSI + 5.90 (3)
In the other hand, rock mass quality determination
using RMR89 considers the intact rock strength (R1), rock mass structure (R2 and R3), discontinuities condition (R4), and the presence of groundwater (R5) according to Table 1. The orientation of discontinuities (R6) was not considered because this parameter was not represented conceptually in GSI equation.
R1 was obtained through unconfined compressive testing, R2 and R3 could be obtained through the RQD and space of discontinuities, as well as the number of joints per meter as stated in RMR14 developed by Celada et al [12]. R4 could be obtained through surface interpretation on rock samples, while R5 is assumed to have a value of 15, namely for dry rock mass.
2.3 Calculation of Discontinuities Condition
The problem which found while determining rock mass quality using RMR89 is the lack of precision in the observable data that related to discontinuities condition (R4). In determining the weight for R4, there are several parameters that tend to have less precision when they were just observed through drilling rock samples, i.e., the length of each discontinuity (persistence) and their apertures. Obtaining those parameters just by observing the drilling rock samples did not represent its actual condition. Question about the precision of R4 became a dilemma then.
To answer the question above, it is necessary to make a correlation between the facemapping data observed from tunnel excavation and the interpretation of drilling rock samples. It becomes significant when the borehole intersects with excavation surface. The correlation between them both will produce more precise information. Frankly, the lack of boreholes makes this difficult to do. An alternative is needed to increase the degree of precision and the degree of confidence in the value of R4.
Meanwhile, GSI is obtained by visually observing the condition of rock structure that displayed on its surface, then it is namely Surface Condition Ratings (SCR). This parameter is closely related to the interpretation which carried out to produce R4 in the RMR method. Zhang et al [13] compared the weights that used to determine R4 and SCR, as shown in the Table 3.
Table 3. Comparison of sub parameters between RMR89 and GSI to determine discontinuities condition.
Sub para-meter R4 (RMR89) Rate SCR (GSI) Rate
Persistence < 1 m 6 - -
1-3 m 4 - -
3 - 10 m 2 - -
10 - 20 m 1 - -
> 20 m 0 - -
Aperture None 6 - -
< 0.1 mm 5 - -
0.1 - 1 mm 4 - -
1 - 5 mm 1 - -
> 5 mm 0 - -
Roughness Very rough 6 Very rough 6
Rough 5 Rough 5
Slightly rough 3 Slightly rough 3
Smooth 2 Smooth 1
Very smooth 0 Very smooth 0
Infilling None 6 None 6
Hard < 5 mm 4 Hard < 5 mm 4
Hard > 5 mm 2 Hard > 5 mm 2
Soft < 5 mm 2 Soft < 5 mm 2
GSI = 1,5Jcond + RQD/2 (4)
4
E3S Web of Conferences 325, 02001 (2021) https://doi.org/10.1051/e3sconf/202132502001ICST 2021

Sub para-meter R4 (RMR89) Rate SCR (GSI) Rate
Soft > 5 mm 0 Soft > 5 mm 0 Weather-
ing Unweathered 6 Unweathered 6
Slightly weathered 5 Slightly
weathered 5
Moderately weathered 3 Moderately
weathered 3
Highly weathered 1 Highly
weathered 1
Completely weathered 0 Completely
weathered 0
Based on the comparison in the Table 3, a
mathematical model shall be generated. The first method in this research is to find an equation that able to predict the value of R4 using SCR value. In this work, there are several data that already have R4 value, and they are considered having a good precision. That dataset then being correlated with SCR value at the very similar locations. Correlating those data using mathematical method is adopted to generate the trendline and the equation. The result of the correlation is shown in the next chapter.
2.4 Calculation of modified RMR and RMR89
The second method in this research is finding the value of RMR. In this paper, RMR is divided into two, they are RMR89, which is based on observation data, and modified RMR, (then called RMRm). The RMRm is the RMR that calculated differently using modified R4 that derived from the SCR according to the previous chapter. From that modification, the equation which going to be used to summarize RMRm is changed into the one below.
RMRm = R1 + R2 + R3 + modified R4 + R5 (5)
3 Results and Discussion This chapter shows some results, i.e., the value of discontinuities conditions, the value of RMRm and RMR89, and discusses about the degree of accuracy and its precision.
3.1 The Generated Models
Based on Fig. 3 below, the trendline is formed from those scattered points. The points are the data of R4 and SCR that were obtained from observation. A mathematical model can be generated as in the equation (6) below. Then this equation can be used to describe and calculate the value of discontinuities condition, when all the data that we have is Surface Condition Ratings (SCR) that was observed using GSI method. Then, the equation for RMRm is substituted into equation (7).
R4 = 1.0951SCR + 10.328 (6)
RMRm = R1 + R2 + R3 + 1.0952SCR + 10.328 + R5
(7)
Fig. 3. Correlation between R4 (on RMR89) and SCR (on GSI).
After conducting some tests on that mathematical model, the data generated by the equation is presented in Fig. 4. The figure below displays some trendlines that drawn from the scattered of observation data using RMR89 and RMRm. Both lines then visually compared to several trendlines from the equations that have been mentioned by other researchers, as shown in equation (1), (2), and (3).
In accordance with the distribution of data that observed using RMR89 and RMRm, it shows that there are variances ranging from 0-5 points. The differences come bolder on data with comprehensive information, especially mention to their persistence and aperture. Values of the observed data using RMR89 with comprehensive information available give a significantly different position on chart, while the observed data without comprehensive information available tend to be close to the value of RMRm.
From the information above, the relative position of observation data from RMR89, RMRm, and their trendlines mean that they have a correlation. Mathematical models then be derived as shown in the equation (8) and (9) below.
RMR89 = 0.334GSI + 38.78 (8)
RMRm = 0.3497GSI + 37.971 (9)
5
E3S Web of Conferences 325, 02001 (2021) https://doi.org/10.1051/e3sconf/202132502001ICST 2021

Fig. 4. Scattered data from observation using RMR89 and RMRm
3.2 Evaluation of the Precision and Accuracy
Adjacency between RMR89 based on observation, RMRm based on observation, and the prediction generated from both equation model (8) and (9) are presented in Fig. 5. There is a significant difference in values between RMR89 based on observation and RMRm based on observation, while the predicted data have small differences in value.
Fig. 5. Precision of observation data and predicted data, both using RMR89 and RMRm
To ensure the degree of accuracy of both
mathematical model (8) and (9), the MSE and RMSE ought to be calculated. The calculation is done by determining the relative comparison between the predicted values (both generated from RMR89 and RMRm) and the RMR89 data based on observation.
RMR89 dataset that were obtained from observation are assumed to be the correct ones and being absolute.
Table 4. MSE and RMSE.
Eq. MSE RMSE
Hoek-Brown (1997) 126,867 11,263
Cosar (2004) 1515,903 38,934
Singh and Tamrakar (2013) 1223,221 34,974
RMR89 14,164 3,763
RMRm 14,232 3,772
Table 4 above shows the degree of accuracy between the equation (8) and (9). Both mathematical models of RMR89 and RMRm are having the good accuracy, which is indicated by a small value in the RMSE. RMSE from those mathematical models, is also close to equation that developed by Hoek and Brown [3]. Fig. 6 below also shows the relationship between the error of the values generated by the RMR89 and RMRm mathematical models, the narrow gap between them means that both equations have similar accuracy.
Fig. 6. Gap of error between RMR89 and RMRm.
4 Conclusions
This study explains the correlation among some methods to determine rock mass quality. The methods used in this study are GSI, RMR89, and RMRm, where RMRm is the RMR89 developed by Bienawski [4] with changes in R4 parameter. The modified R4 is calculated according to the weighting score of SCR (on the GSI). Through a series of experiments, the following conclusions are drawn below. 1. Based on 205 datasets of drilling rock samples and
facemapping data, a series of observations can be conducted to determine rock quality based on the GSI and RMR89 method.
2. Due to limited information for compiling R4 according to the rules developed by Bienawski [4], it can be solved by using an alternative equation to describe the discontinuities condition. R4 = 1.0951SCR + 10.328 can be applied, where SCR is the condition of discontinuities observed using the GSI’s term. So that RMRm = R1 + R2 + R3 +
6
E3S Web of Conferences 325, 02001 (2021) https://doi.org/10.1051/e3sconf/202132502001ICST 2021

1.0951SCR + 10.328 + R5 is stated, and the values can be computed.
3. Based on the scatter chart of data that been observed using RMR89 and RMRm, trendlines and mathematical models are derived. Both equations are RMR89 = 0.334GSI + 38.78 and RMRm = 0.3497GSI + 37.971, and they can be implemented to predict RMR value based on GSI data.
4. Two mathematical models above, can be applied to imply the correlation between RMR and GSI based on rock mass in the construction site of diversion tunnel of Meninting Dam. The RMR89 mathematical model will work effectively if comprehensive information about persistence, aperture, roughness, infilling, and weathering are available. Meanwhile, the mathematical model of RMRm can be an alternative equation when information about discontinuities condition is not thoroughly available.
5. Based on the evaluation of precision and accuracy, it can be stated that both mathematical models are having small gaps of error to each other as well as adjacency to RMR89 based on data observation and equation of RMR89 developed by Hoek and Brown [6].
6. In the near future, conversion from GSI to RMR, or vice versa, can be conducted with higher degree of accuracy. Those data then can be used for determining the excavation method, supporting, and the study of rock mass deformation precisely, especially in Meninting Dam.
The first author would like to thank to Ministry of Public Works and Housing for the full support of research funding through 2020 Super Specialist Scholarship Program, and the support from BWS Nusa Tenggara I for the permit to conduct this research are gratefully acknowledged.
References
1. S.A. Mangga, et al. Peta Geologi Regional Lembar Pulau Lombok, Nusa Tenggara Barat Skala 1:250.000 (2010)
2. Y. Wiyasri, Evaluasi Kondisi Geologi Teknik untuk Perencanaan Terowongan Saluran Penngelak Bendungan Meninting Lombok Barat. Master thesis. Gadjah Mada University, Indonesia (2020)
3. E. Hoek., E.T. Brown, J. Heuristics 16 (2), 167–188. (1988)
4. Z.T. Bieniawski, Engineering Rock Mass Classifications: A Complete Manual for Engineers and Geologists in Mining, Civil and Petroleum Engineering (John. Wiley & Sons, New York 1989)
5. E. Hoek, Strength of rock and rock masses. ISRM News J. 2 (2), 4–16 (1994)
6. E. Hoek, E.T. Brown, Int. J. Rock Mech. Min. Sci. Geomech. Abstr. 34, 1165–1186 (1997)
7. H. Sonmez, R. Ulusay, Int. J. Rock Mech. Min. Sci. 36 (6), 743–760 (1999)
8. H. Sonmez, R. Ulusay, Yerbilimleri 26, 77–99 (2002)
9. F. Ceballos et al, Relationship between RMRb and GSI based on in situ data, in ISRM European Rock Mechanics Symposium,Vigo (2014)
10. S. Coşar, Application of Rock Mass Classification Systems for Future Support Design of the Dim Tunnel Near Alanya. PhD thesis. Middle East Technical University, Turkey (2004)
11. J.L. Singh, N.K. Tamrakar, Bull. Dept. Geol. 16, 29–42 (2013)
12. B. Celada, I. Tardáguila, P. Varona, A. Rodríguez, Z.T. Bieniawski, Innovating tunnel design by an improved experience based RMR system, in World Tunnel Congress. Proceedings, Foz do Iguaçu, Brazil, 1–9 (2014)
13. Q. Zhang et al, Tunn. Undergr. Sp. Tech. 83, 73-81 (2019)
7
E3S Web of Conferences 325, 02001 (2021) https://doi.org/10.1051/e3sconf/202132502001ICST 2021