Embed Size (px)
Citation preview
Management Science-II Prof. R.Madumathi
Indian Institute of Technology Madras
MODULE 2 Budget
• Budgets are important tools of profit planning, are similar to the broader
system of planning in an organization.
• Planning involves the specification of the objectives that the organization
will pursue and the fundamental policies that will enable the organization
to achieve the predetermined goals.
Budgeting Process The Planning/ Budgeting process involves four stages. They are:
• objective determination stage
• goal determination stages
• strategy formulation stage
• budget preparation stage
Objective Determination Stage
The first stage is setting the ‘Objectives’ which are defined as the
‘broad and long- range desired state or position in the future’.
They are motivational or directional in nature and are expressed in
Qualitative terms.
Goal Determination Stage The second stage is specifying the goals.
Management Science-II Prof. R.Madumathi
Indian Institute of Technology Madras
The term goal represents targets, specific in quantitative terms to be
achieved in a specific period of time. The timing of introducing new
products, purchase of new plant and machinery and expected rate
of return are examples of time and quantity oriented goals.
Strategy Formulation Stage The next step involves laying down the strategies. Strategies denote specific methods or courses of action to achieve the goals, for instance, promotion of sales through price reduction or aggressive advertisement and so on.
Management Science-II Prof. R.Madumathi
Indian Institute of Technology Madras
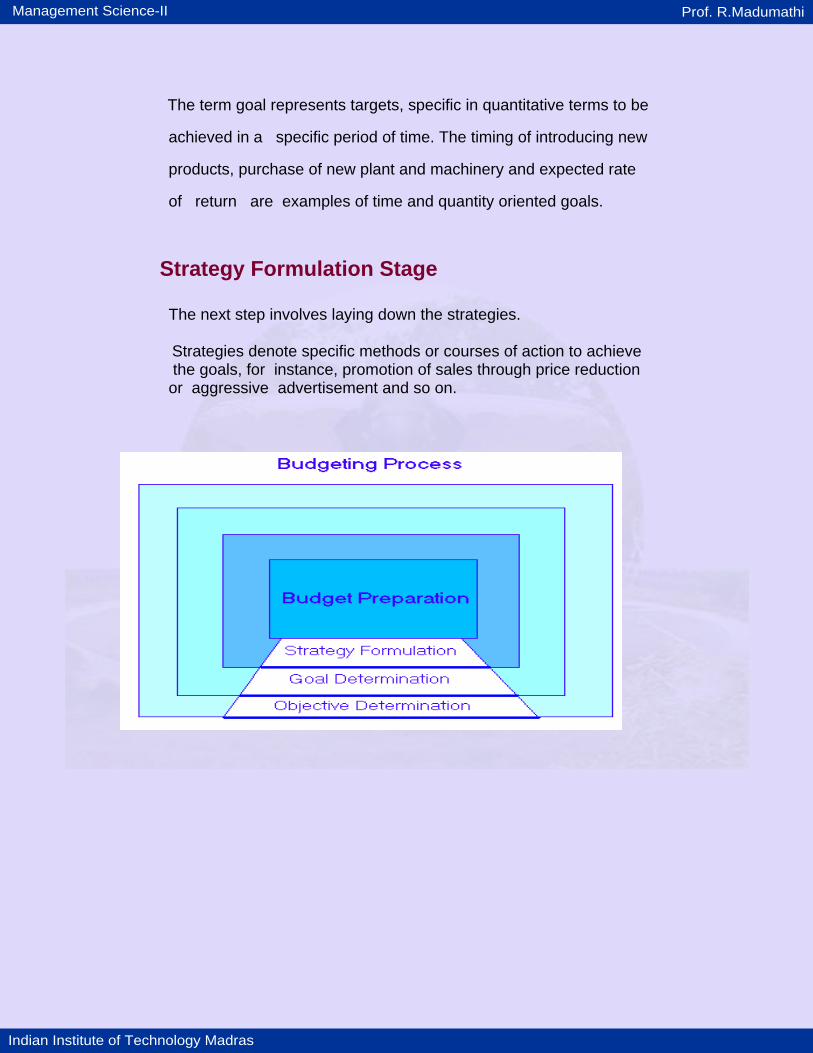
Budget Responsibilities
Types Of Budget
• Sales Budget
• Production Budget
• Purchase Budget
• Expenditure Budgets
• Cash Budget
• Master Budget
• Zero Base Budget
• Flexible Budget
Management Science-II Prof. R.Madumathi
Indian Institute of Technology Madras
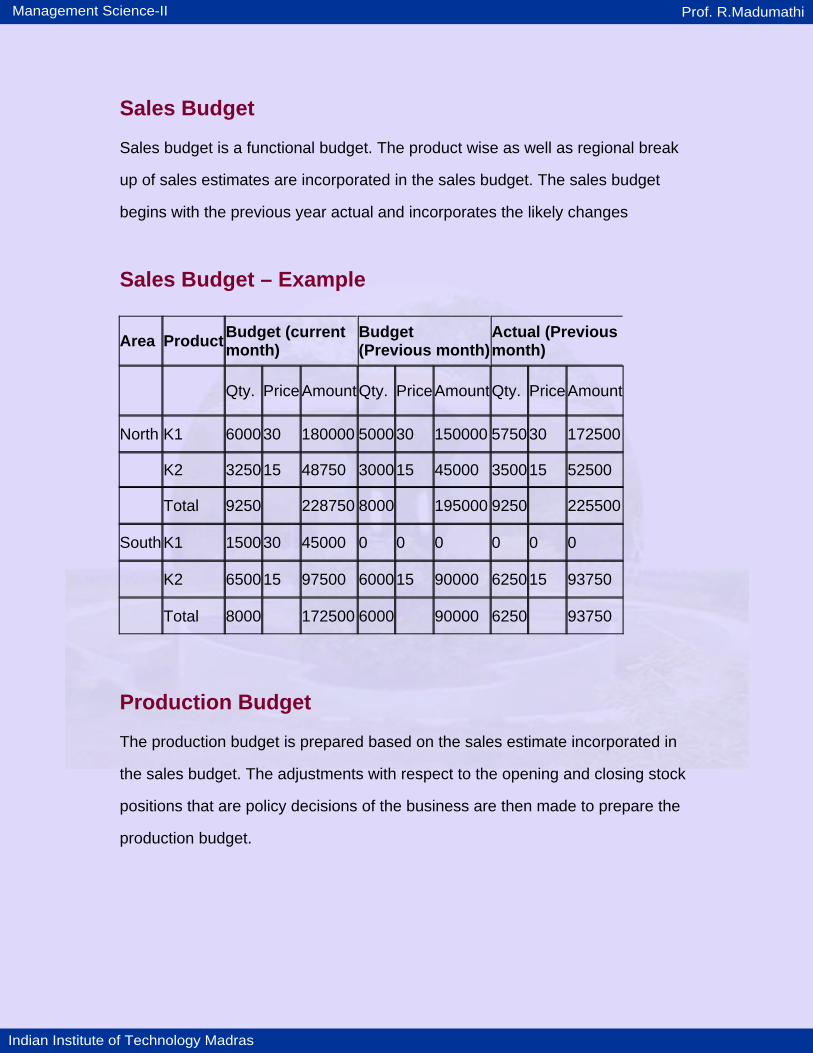
Sales Budget Sales budget is a functional budget. The product wise as well as regional break
up of sales estimates are incorporated in the sales budget. The sales budget
begins with the previous year actual and incorporates the likely changes
Sales Budget – Example Area Product Budget (current
month) Budget (Previous month)
Actual (Previous month)
Qty. Price AmountQty. PriceAmountQty. PriceAmount
North K1 6000 30 180000 500030 150000 575030 172500
K2 3250 15 48750 300015 45000 350015 52500
Total 9250 228750 8000 195000 9250 225500
South K1 1500 30 45000 0 0 0 0 0 0
K2 6500 15 97500 600015 90000 625015 93750
Total 8000 172500 6000 90000 6250 93750
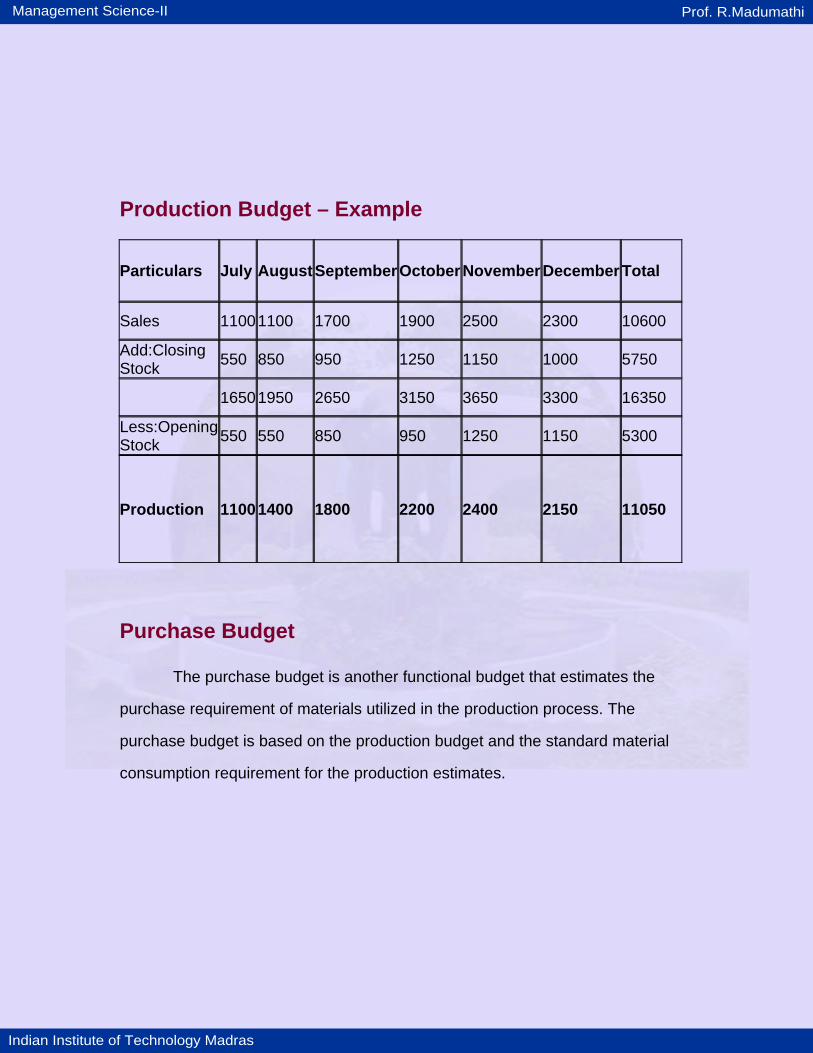
Production Budget The production budget is prepared based on the sales estimate incorporated in
the sales budget. The adjustments with respect to the opening and closing stock
positions that are policy decisions of the business are then made to prepare the
production budget.
Management Science-II Prof. R.Madumathi
Indian Institute of Technology Madras
Production Budget – Example
Particulars July August SeptemberOctoberNovemberDecember Total
Sales 1100 1100 1700 1900 2500 2300 10600
Add:Closing Stock 550 850 950 1250 1150 1000 5750
1650 1950 2650 3150 3650 3300 16350
Less:OpeningStock
550 550 850 950 1250 1150 5300
Production 1100 1400 1800 2200 2400 2150 11050
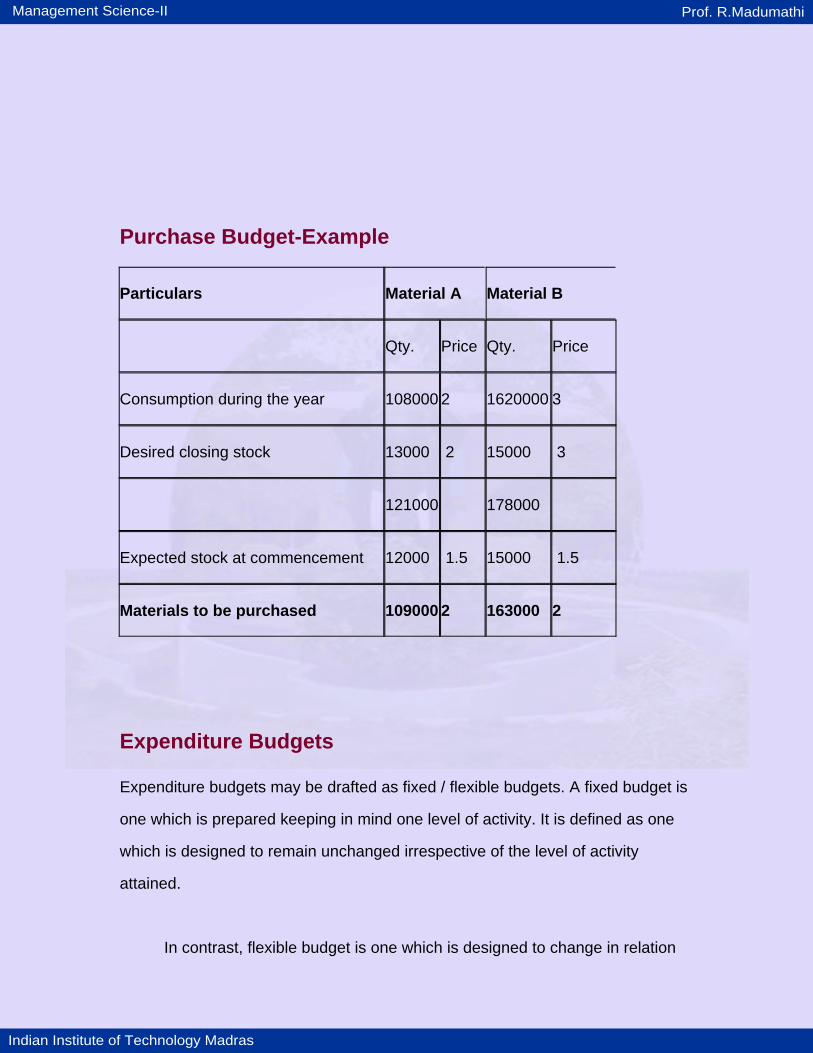
Purchase Budget The purchase budget is another functional budget that estimates the
purchase requirement of materials utilized in the production process. The
purchase budget is based on the production budget and the standard material
consumption requirement for the production estimates.
Management Science-II Prof. R.Madumathi
Indian Institute of Technology Madras
Purchase Budget-Example
Particulars Material A Material B
Qty. Price Qty. Price
Consumption during the year 108000 2 1620000 3
Desired closing stock 13000 2 15000 3
121000 178000
Expected stock at commencement 12000 1.5 15000 1.5
Materials to be purchased 109000 2 163000 2
Expenditure Budgets Expenditure budgets may be drafted as fixed / flexible budgets. A fixed budget is
one which is prepared keeping in mind one level of activity. It is defined as one
which is designed to remain unchanged irrespective of the level of activity
attained.
In contrast, flexible budget is one which is designed to change in relation
Management Science-II Prof. R.Madumathi
Indian Institute of Technology Madras
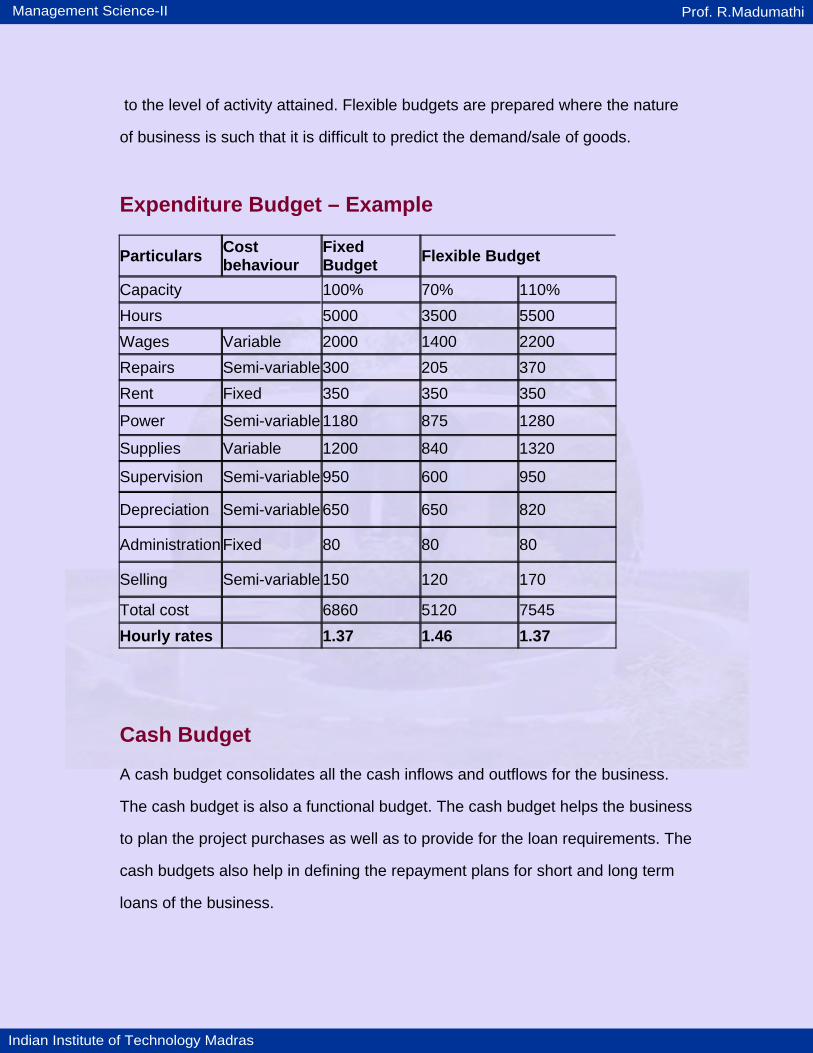
to the level of activity attained. Flexible budgets are prepared where the nature
of business is such that it is difficult to predict the demand/sale of goods.
Expenditure Budget – Example
Particulars Cost behaviour
Fixed Budget Flexible Budget
Capacity 100% 70% 110% Hours 5000 3500 5500 Wages Variable 2000 1400 2200 Repairs Semi-variable 300 205 370 Rent Fixed 350 350 350
Power Semi-variable 1180 875 1280
Supplies Variable 1200 840 1320
Supervision Semi-variable 950 600 950
Depreciation Semi-variable 650 650 820
Administration Fixed 80 80 80
Selling Semi-variable 150 120 170
Total cost 6860 5120 7545 Hourly rates 1.37 1.46 1.37 Cash Budget A cash budget consolidates all the cash inflows and outflows for the business.
The cash budget is also a functional budget. The cash budget helps the business
to plan the project purchases as well as to provide for the loan requirements. The
cash budgets also help in defining the repayment plans for short and long term
loans of the business.
Management Science-II Prof. R.Madumathi
Indian Institute of Technology Madras
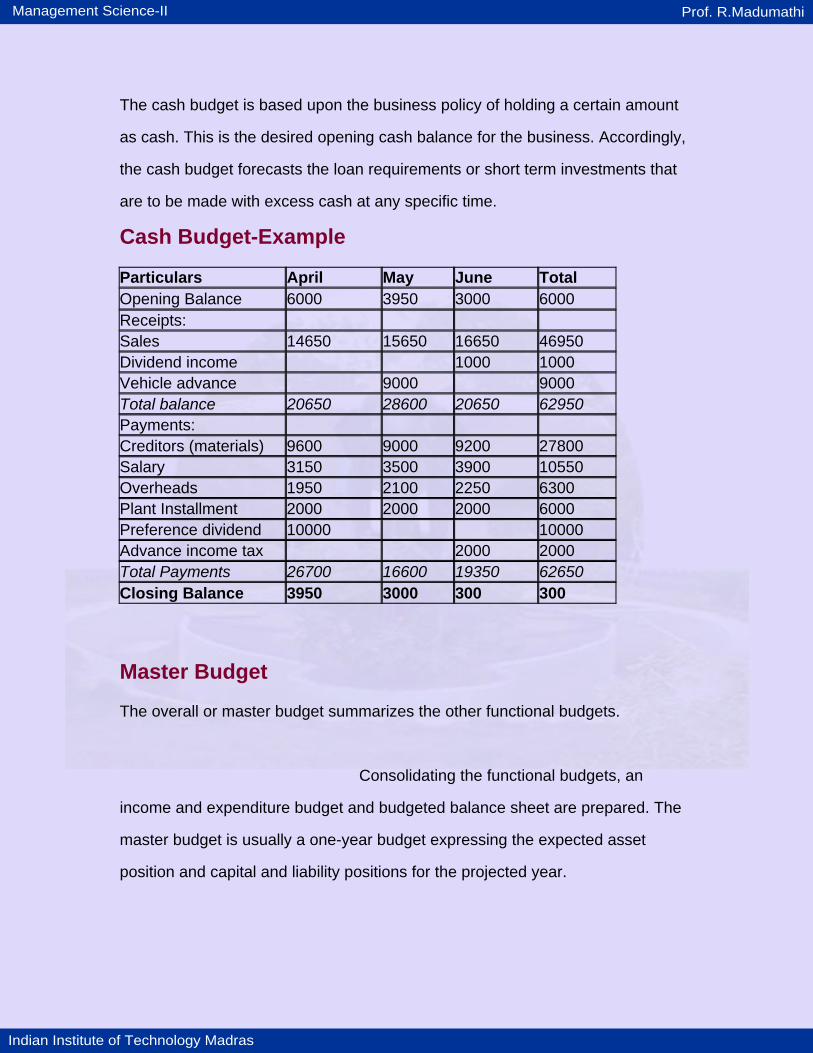
The cash budget is based upon the business policy of holding a certain amount
as cash. This is the desired opening cash balance for the business. Accordingly,
the cash budget forecasts the loan requirements or short term investments that
are to be made with excess cash at any specific time.
Cash Budget-Example Particulars April May June Total Opening Balance 6000 3950 3000 6000 Receipts: Sales 14650 15650 16650 46950 Dividend income 1000 1000 Vehicle advance 9000 9000 Total balance 20650 28600 20650 62950 Payments: Creditors (materials) 9600 9000 9200 27800 Salary 3150 3500 3900 10550 Overheads 1950 2100 2250 6300 Plant Installment 2000 2000 2000 6000 Preference dividend 10000 10000 Advance income tax 2000 2000 Total Payments 26700 16600 19350 62650 Closing Balance 3950 3000 300 300 Master Budget The overall or master budget summarizes the other functional budgets.
Consolidating the functional budgets, an
income and expenditure budget and budgeted balance sheet are prepared. The
master budget is usually a one-year budget expressing the expected asset
position and capital and liability positions for the projected year.
Management Science-II Prof. R.Madumathi
Indian Institute of Technology Madras
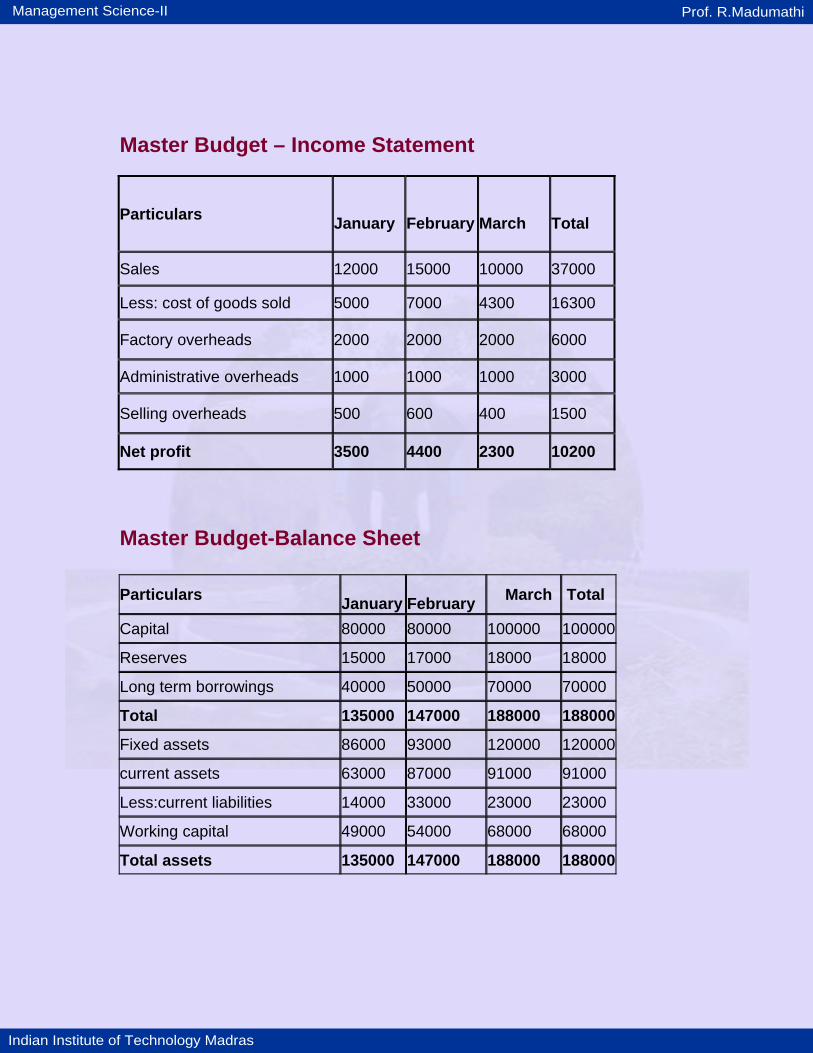
Master Budget – Income Statement
Particulars January
February
March
Total
Sales 12000 15000 10000 37000
Less: cost of goods sold 5000 7000 4300 16300
Factory overheads 2000 2000 2000 6000
Administrative overheads 1000 1000 1000 3000
Selling overheads 500 600 400 1500
Net profit 3500 4400 2300 10200
Master Budget-Balance Sheet Particulars
January February March Total
Capital 80000 80000 100000 100000
Reserves 15000 17000 18000 18000
Long term borrowings 40000 50000 70000 70000
Total 135000 147000 188000 188000
Fixed assets 86000 93000 120000 120000
current assets 63000 87000 91000 91000
Less:current liabilities 14000 33000 23000 23000
Working capital 49000 54000 68000 68000
Total assets 135000 147000 188000 188000
Management Science-II Prof. R.Madumathi
Indian Institute of Technology Madras
Zero Base Budget
An illustration of a long term budget is the Zero base budget. Zero Base
Budgeting process looks at requirements/ plans anew each year irrespective of
project continuity. These are necessarily long term project budgets.
Variance Analysis A Variance results from the comparison of the actual with the budgets /
standards / forecasts.
Budget A budget is a comprehensive financial plan giving the quantitative details for
achieving the financial & operational goals on an organization.
Standards Standards are expected cost to be incurred under normal efficient operating
conditions.
Forecasts Forecasts are projected data arrived at using historical data patterns of
quantitative indicators.
Management Science-II Prof. R.Madumathi
Indian Institute of Technology Madras
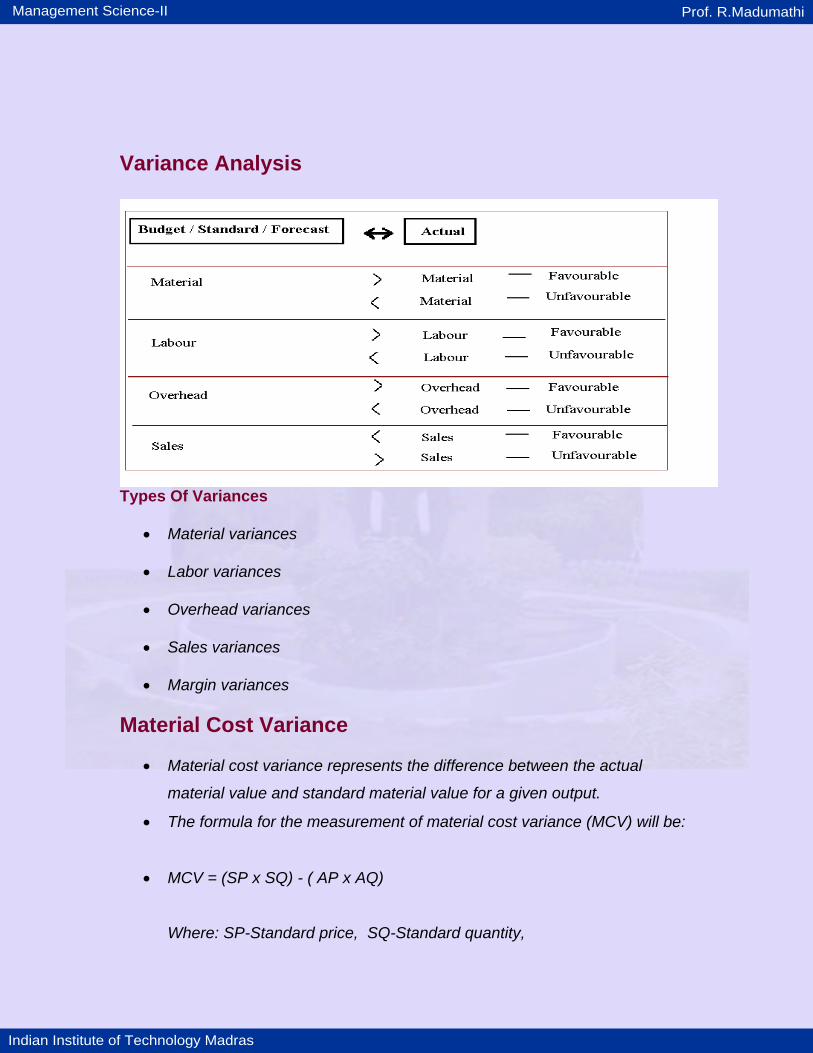
Variance Analysis
Types Of Variances
• Material variances
• Labor variances
• Overhead variances
• Sales variances
• Margin variances Material Cost Variance
• Material cost variance represents the difference between the actual
material value and standard material value for a given output.
• The formula for the measurement of material cost variance (MCV) will be:
• MCV = (SP x SQ) - ( AP x AQ)
Where: SP-Standard price, SQ-Standard quantity,
Management Science-II Prof. R.Madumathi
Indian Institute of Technology Madras
• AP-Actual price, AQ-Actual quantity.
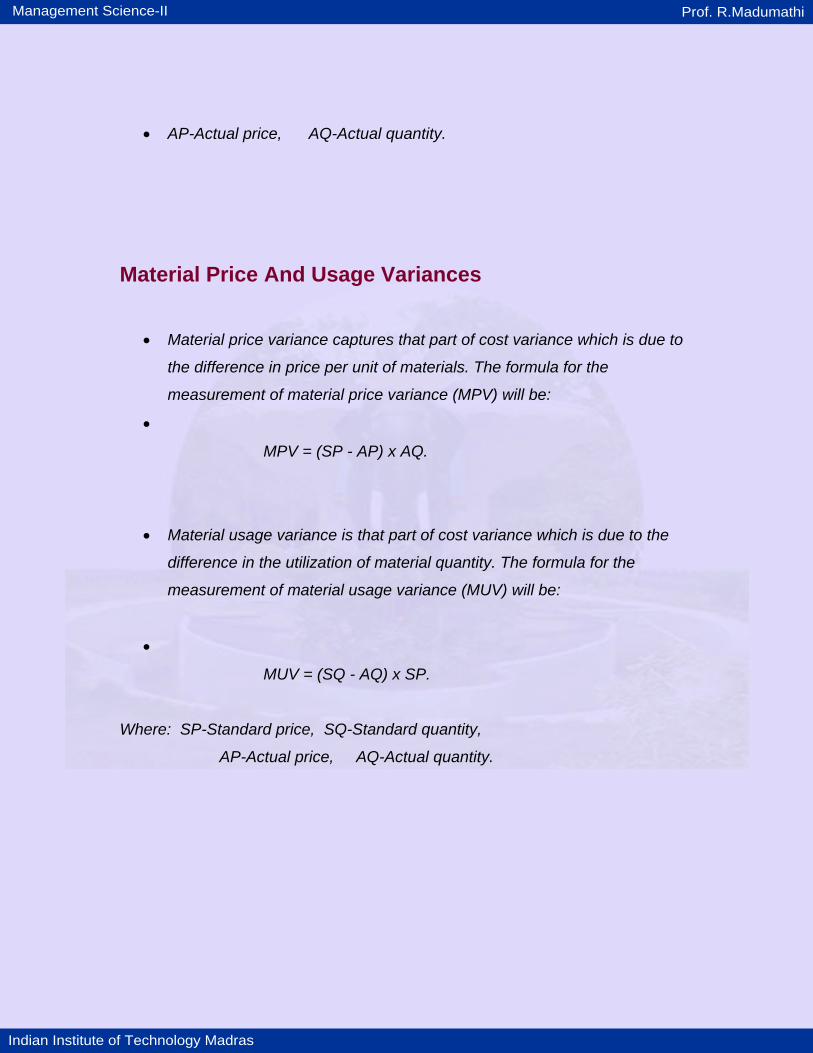
Material Price And Usage Variances
• Material price variance captures that part of cost variance which is due to
the difference in price per unit of materials. The formula for the
measurement of material price variance (MPV) will be:
•
MPV = (SP - AP) x AQ.
• Material usage variance is that part of cost variance which is due to the
difference in the utilization of material quantity. The formula for the
measurement of material usage variance (MUV) will be:
•
MUV = (SQ - AQ) x SP.
Where: SP-Standard price, SQ-Standard quantity,
AP-Actual price, AQ-Actual quantity.
Management Science-II Prof. R.Madumathi
Indian Institute of Technology Madras
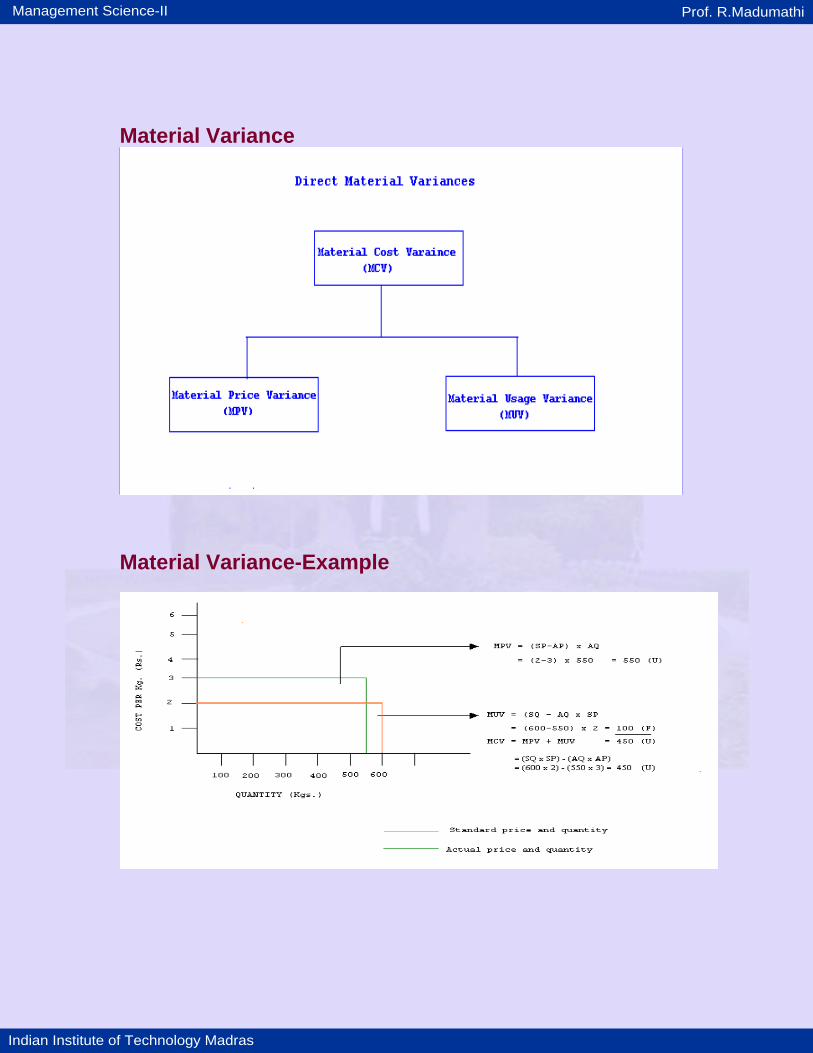
Material Variance
Material Variance-Example
Management Science-II Prof. R.Madumathi
Indian Institute of Technology Madras
Labor Variance Labor cost variance represents the difference between the actual labor cost paid
and standard labor cost for a given output.
The formula for the measurement of labor cost variance (LCV) will be:
LCV = (SR x SH) - ( AR x AH)
Where: SR-Standard rate, SH-Standard hours,
AR-Actual rate, AH-Actual hours.
Labor Rate And Efficiency Variances Labor rate variance captures that part of cost variance which is due to the
difference in wage rate of labor. The formula for the measurement of labor rate
variance (LRV) will be:
LRV = (SR - AR) x AH.
Labor efficiency variance measures that part of cost variance which is due to the
difference in the efficient performance of labor. The formula for the measurement
of labor efficiency variance (LEV) will be:
LEV = (SH - AH) x SR.
Where: SR-Standard rate, SH-Standard hours,
AR-Actual rate, AH-Actual hours.
Management Science-II Prof. R.Madumathi
Indian Institute of Technology Madras
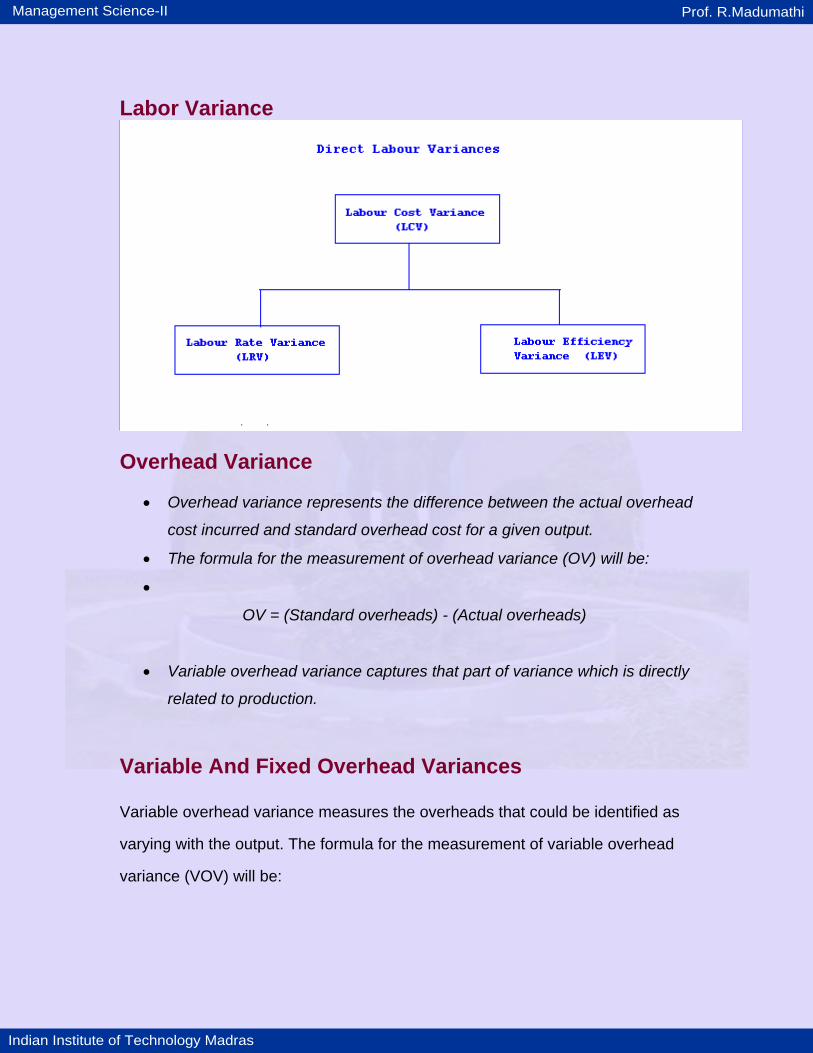
Labor Variance
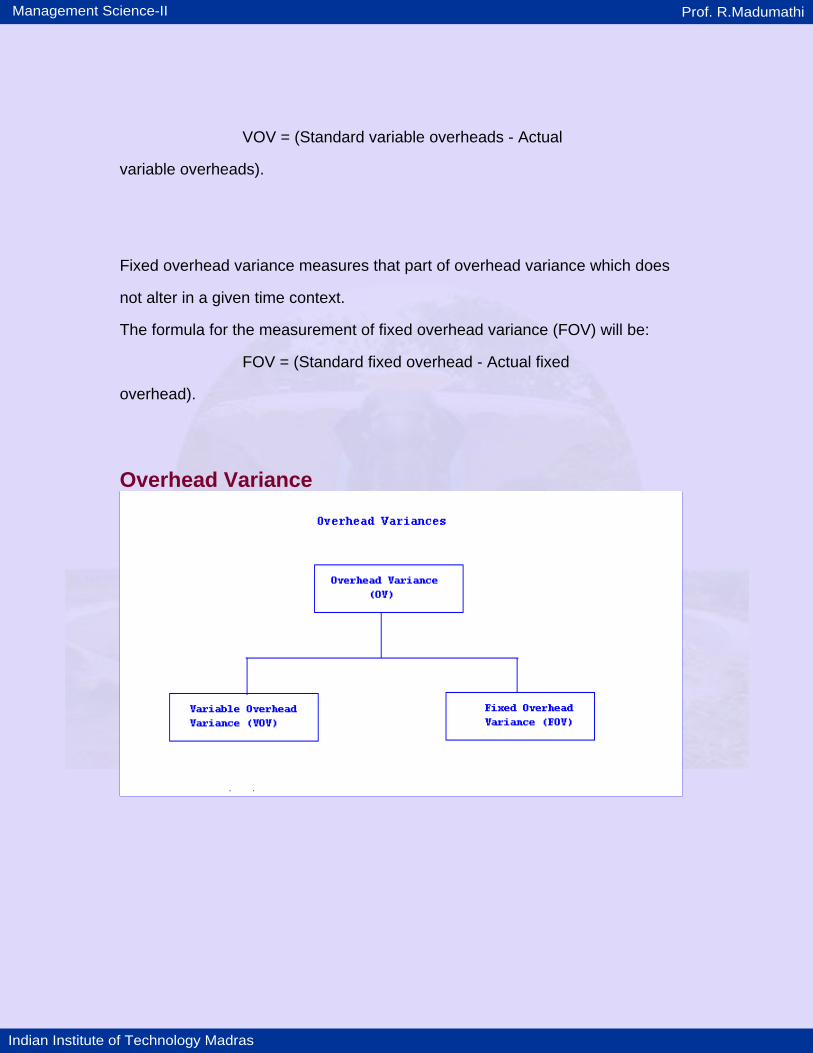
Overhead Variance
• Overhead variance represents the difference between the actual overhead
cost incurred and standard overhead cost for a given output.
• The formula for the measurement of overhead variance (OV) will be:
•
OV = (Standard overheads) - (Actual overheads)
• Variable overhead variance captures that part of variance which is directly
related to production.
Variable And Fixed Overhead Variances Variable overhead variance measures the overheads that could be identified as
varying with the output. The formula for the measurement of variable overhead
variance (VOV) will be:
Management Science-II Prof. R.Madumathi
Indian Institute of Technology Madras
VOV = (Standard variable overheads - Actual
variable overheads).
Fixed overhead variance measures that part of overhead variance which does
not alter in a given time context.
The formula for the measurement of fixed overhead variance (FOV) will be:
FOV = (Standard fixed overhead - Actual fixed
overhead).
Overhead Variance
Management Science-II Prof. R.Madumathi
Indian Institute of Technology Madras
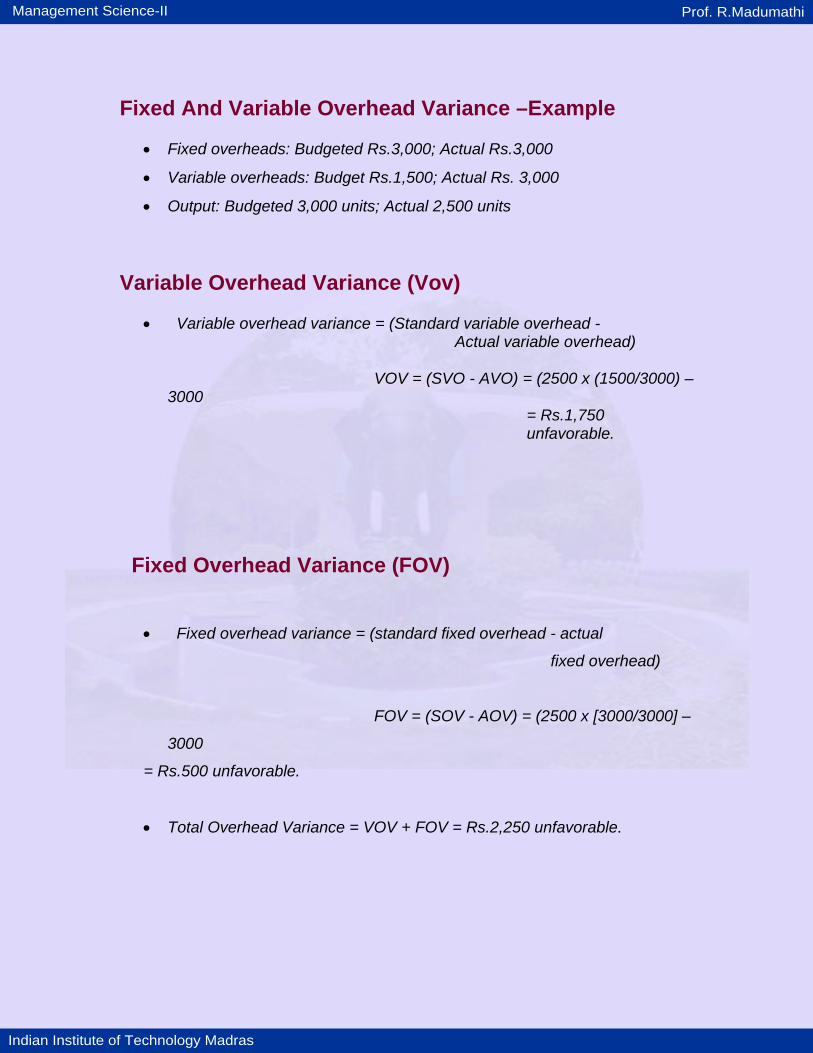
Fixed And Variable Overhead Variance –Example
• Fixed overheads: Budgeted Rs.3,000; Actual Rs.3,000
• Variable overheads: Budget Rs.1,500; Actual Rs. 3,000
• Output: Budgeted 3,000 units; Actual 2,500 units
Variable Overhead Variance (Vov)
• Variable overhead variance = (Standard variable overhead - Actual variable overhead) VOV = (SVO - AVO) = (2500 x (1500/3000) – 3000
= Rs.1,750 unfavorable.
Fixed Overhead Variance (FOV)
• Fixed overhead variance = (standard fixed overhead - actual
fixed overhead)
FOV = (SOV - AOV) = (2500 x [3000/3000] –
3000
= Rs.500 unfavorable.
• Total Overhead Variance = VOV + FOV = Rs.2,250 unfavorable.
Management Science-II Prof. R.Madumathi
Indian Institute of Technology Madras
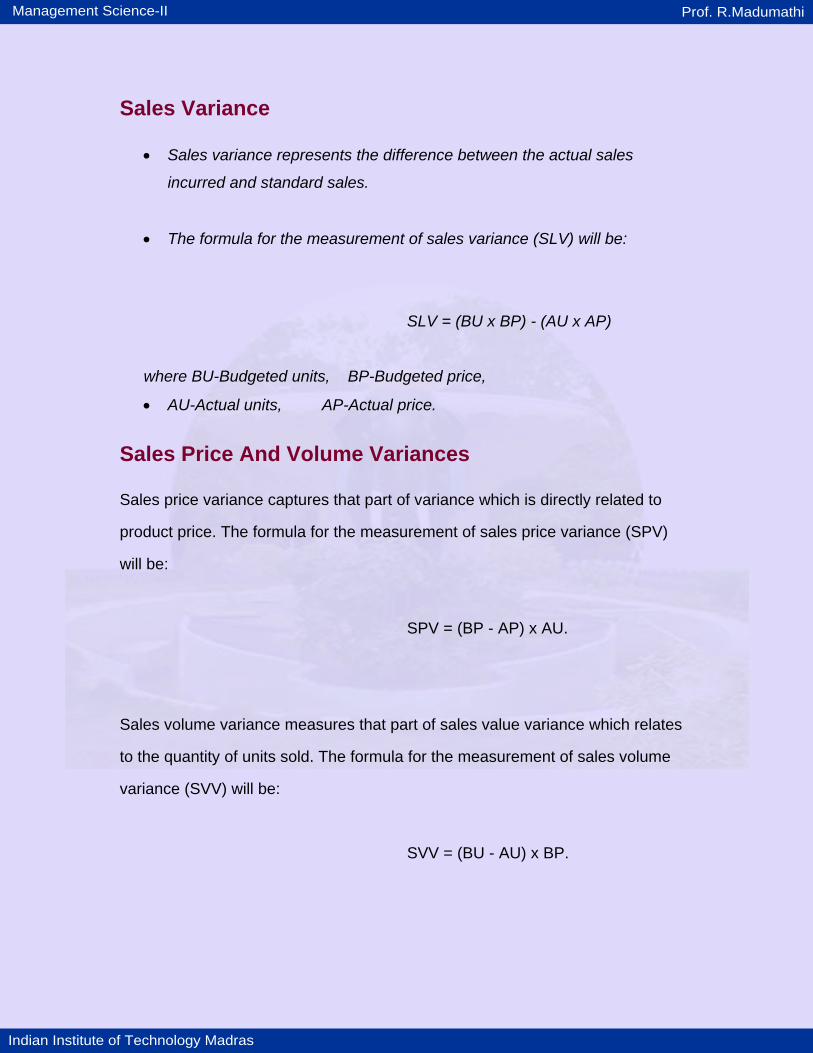
Sales Variance
• Sales variance represents the difference between the actual sales
incurred and standard sales.
• The formula for the measurement of sales variance (SLV) will be:
SLV = (BU x BP) - (AU x AP)
where BU-Budgeted units, BP-Budgeted price,
• AU-Actual units, AP-Actual price.
Sales Price And Volume Variances Sales price variance captures that part of variance which is directly related to
product price. The formula for the measurement of sales price variance (SPV)
will be:
SPV = (BP - AP) x AU.
Sales volume variance measures that part of sales value variance which relates
to the quantity of units sold. The formula for the measurement of sales volume
variance (SVV) will be:
SVV = (BU - AU) x BP.
Management Science-II Prof. R.Madumathi
Indian Institute of Technology Madras
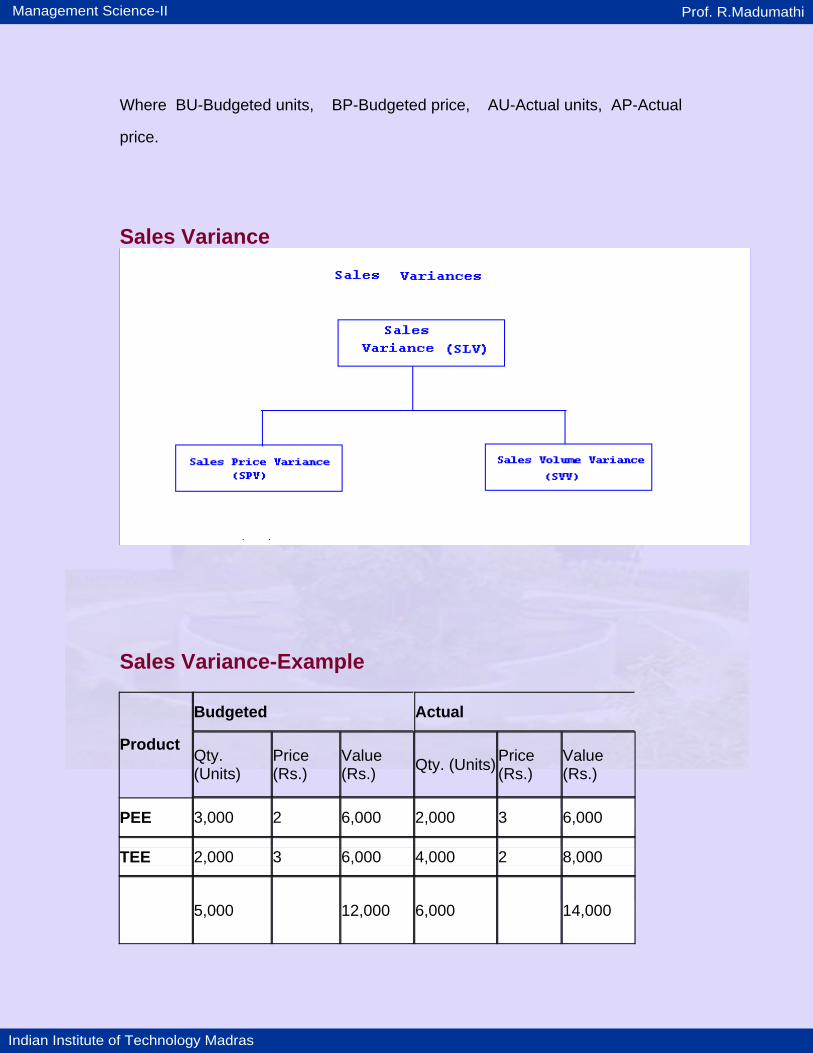
Where BU-Budgeted units, BP-Budgeted price, AU-Actual units, AP-Actual
price.
Sales Variance
Sales Variance-Example
Budgeted Actual
Product Qty. (Units)
Price (Rs.)
Value (Rs.) Qty. (Units) Price
(Rs.) Value (Rs.)
PEE 3,000 2 6,000 2,000 3 6,000
TEE 2,000 3 6,000 4,000 2 8,000
5,000 12,000 6,000 14,000
Management Science-II Prof. R.Madumathi
Indian Institute of Technology Madras
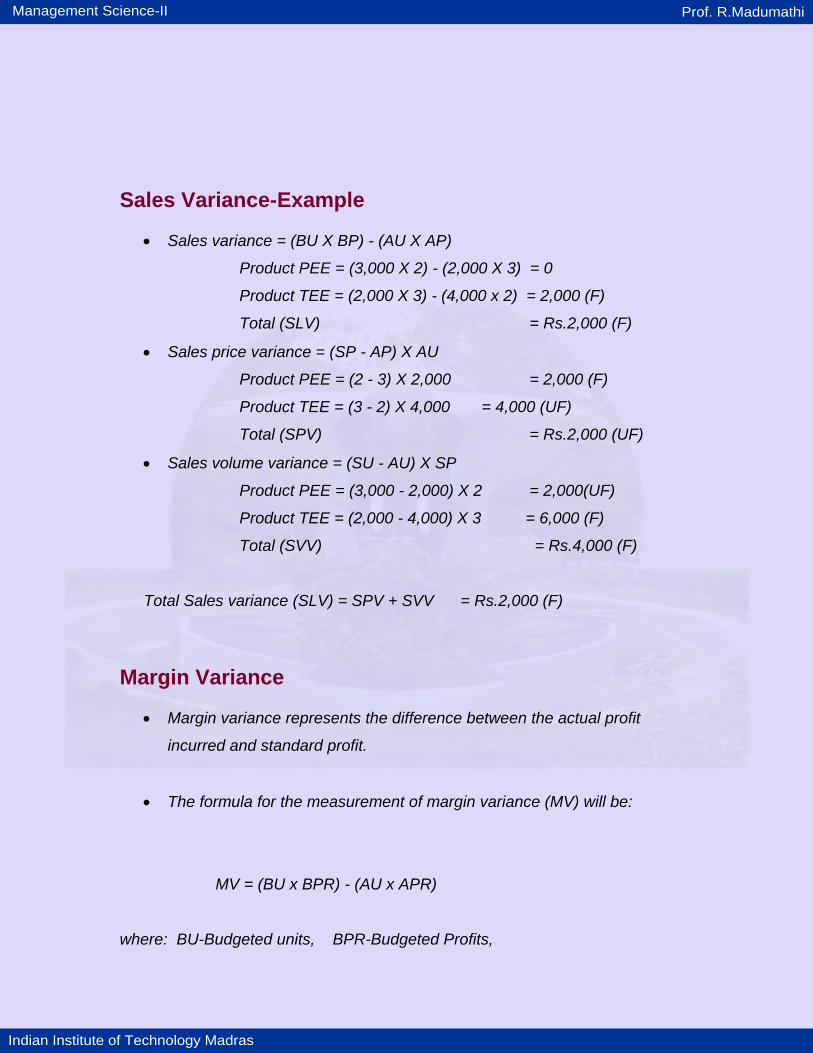
Sales Variance-Example
• Sales variance = (BU X BP) - (AU X AP)
Product PEE = (3,000 X 2) - (2,000 X 3) = 0
Product TEE = (2,000 X 3) - (4,000 x 2) = 2,000 (F)
Total (SLV) = Rs.2,000 (F)
• Sales price variance = (SP - AP) X AU
Product PEE = (2 - 3) X 2,000 = 2,000 (F)
Product TEE = (3 - 2) X 4,000 = 4,000 (UF)
Total (SPV) = Rs.2,000 (UF)
• Sales volume variance = (SU - AU) X SP
Product PEE = (3,000 - 2,000) X 2 = 2,000(UF)
Product TEE = (2,000 - 4,000) X 3 = 6,000 (F)
Total (SVV) = Rs.4,000 (F)
Total Sales variance (SLV) = SPV + SVV = Rs.2,000 (F)
Margin Variance
• Margin variance represents the difference between the actual profit
incurred and standard profit.
• The formula for the measurement of margin variance (MV) will be:
MV = (BU x BPR) - (AU x APR)
where: BU-Budgeted units, BPR-Budgeted Profits,
Management Science-II Prof. R.Madumathi
Indian Institute of Technology Madras
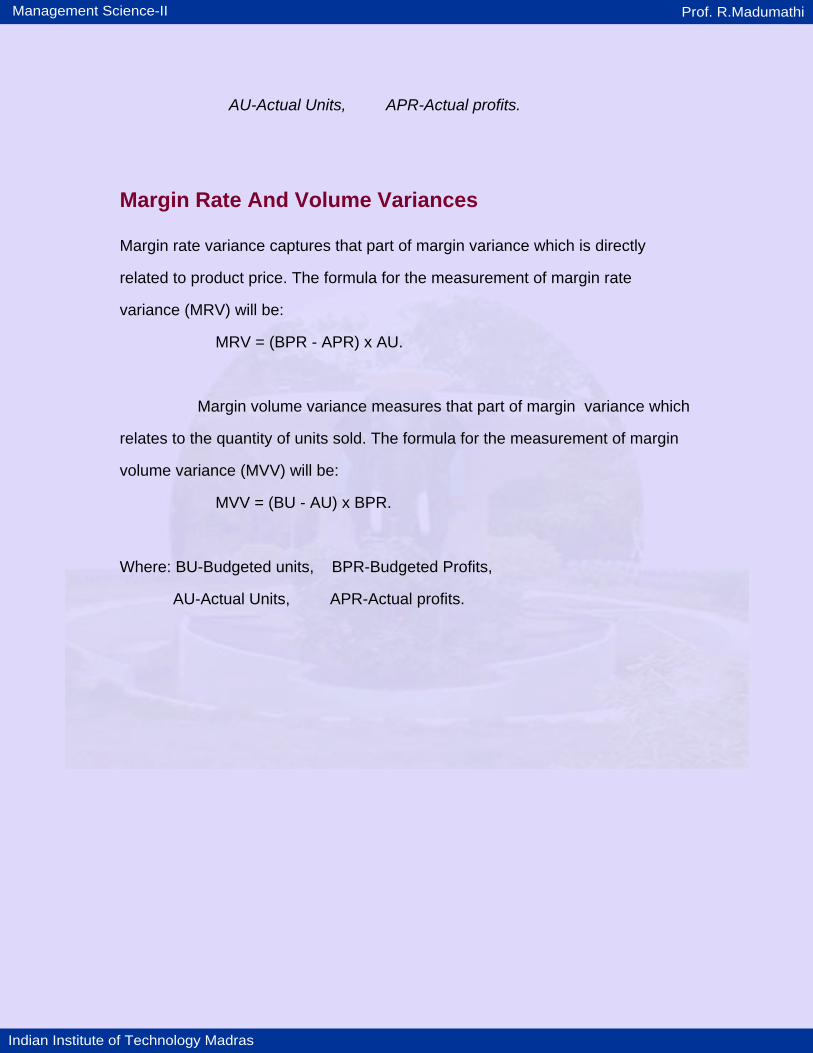
AU-Actual Units, APR-Actual profits.
Margin Rate And Volume Variances Margin rate variance captures that part of margin variance which is directly
related to product price. The formula for the measurement of margin rate
variance (MRV) will be:
MRV = (BPR - APR) x AU.
Margin volume variance measures that part of margin variance which
relates to the quantity of units sold. The formula for the measurement of margin
volume variance (MVV) will be:
MVV = (BU - AU) x BPR.
Where: BU-Budgeted units, BPR-Budgeted Profits,
AU-Actual Units, APR-Actual profits.
Management Science-II Prof. R.Madumathi
Indian Institute of Technology Madras
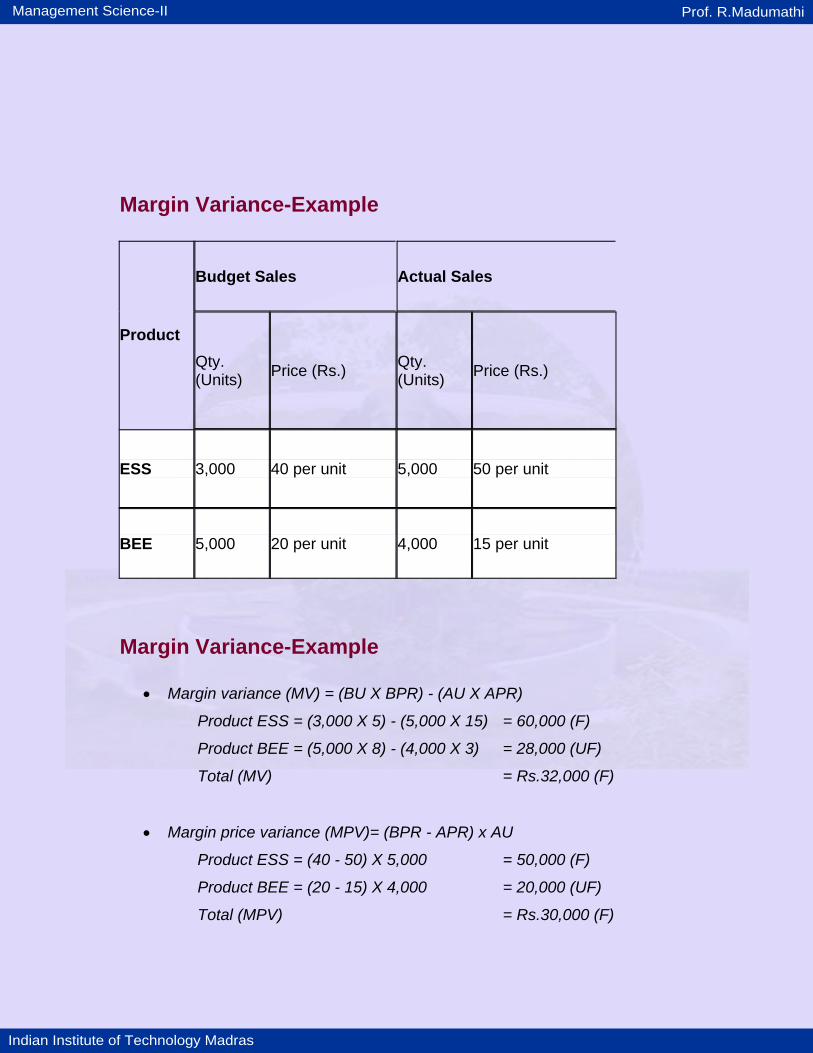
Margin Variance-Example
Budget Sales Actual Sales
Product Qty. (Units) Price (Rs.) Qty.
(Units) Price (Rs.)
ESS 3,000 40 per unit 5,000 50 per unit
BEE 5,000 20 per unit 4,000 15 per unit
Margin Variance-Example
• Margin variance (MV) = (BU X BPR) - (AU X APR)
Product ESS = (3,000 X 5) - (5,000 X 15) = 60,000 (F)
Product BEE = (5,000 X 8) - (4,000 X 3) = 28,000 (UF)
Total (MV) = Rs.32,000 (F)
• Margin price variance (MPV)= (BPR - APR) x AU
Product ESS = (40 - 50) X 5,000 = 50,000 (F)
Product BEE = (20 - 15) X 4,000 = 20,000 (UF)
Total (MPV) = Rs.30,000 (F)
Management Science-II Prof. R.Madumathi
Indian Institute of Technology Madras
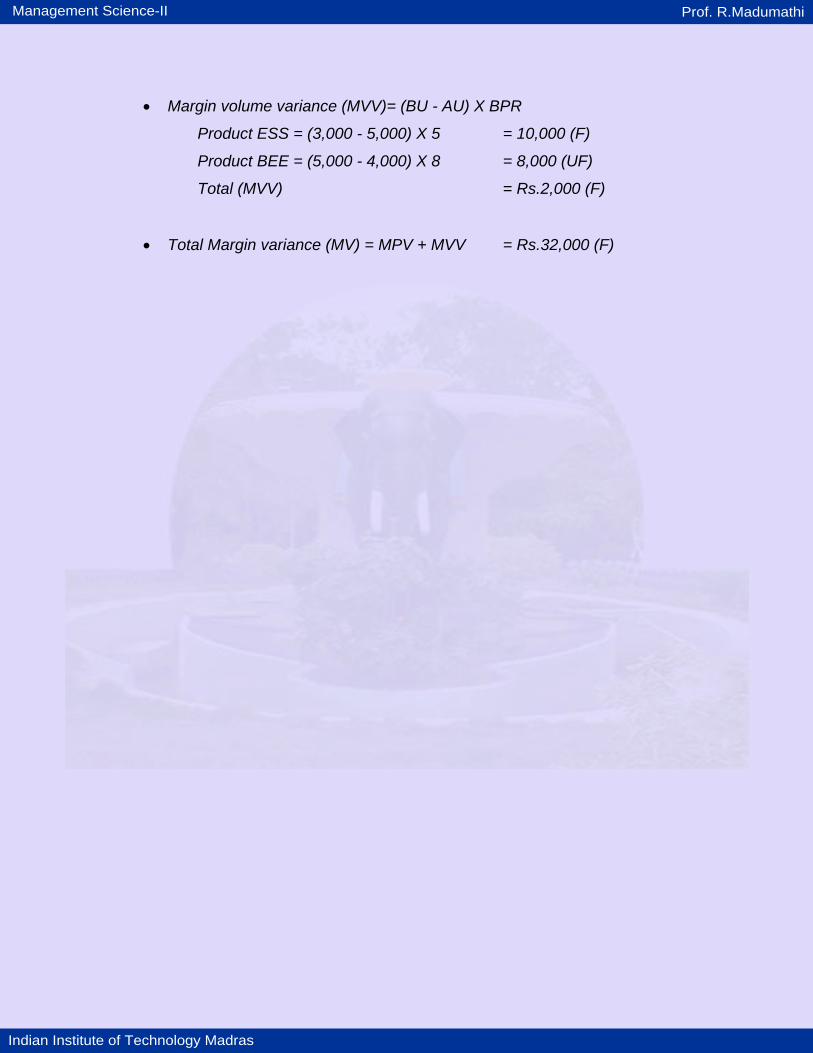
• Margin volume variance (MVV)= (BU - AU) X BPR
Product ESS = (3,000 - 5,000) X 5 = 10,000 (F)
Product BEE = (5,000 - 4,000) X 8 = 8,000 (UF)
Total (MVV) = Rs.2,000 (F)
• Total Margin variance (MV) = MPV + MVV = Rs.32,000 (F)