Embed Size (px)
Citation preview
Module 9 – Summative Assessment Food and Climate Change
1
Module 9 -‐ Summative Assessment Part 1: Exploring the National Climate Change Viewer What are the predictions for future climate scenarios in the continental US? The National Climate Change Viewer (NCCV) allows you to explore future climate predictions for different parts of the US. The maps displayed in the NCCV help you see how future climate, as predicted by climate models, is expected to differ from the observed climate for the last fifty years. The NCCV will assist you in determining how climate change is expected to affect different regions of the United States, which will be very useful for your Capstone Project. The NCCV maps the projected change in different climate variables comparing the average of the projected 2050-2074 values with the average of 1950-2005. In others words, the map is showing the expected difference between the latter half of the 21st century’s climate with the latter half of the 20th century’s climate. Getting started:
-‐ Go to https://www2.usgs.gov/climate_landuse/clu_rd/nccv/viewer.asp -‐ On this website you can look at predictions of future changes in some climate variables for the
entire US, or for states, watersheds and counties. The climate variables you can explore include: 1. Maximum or minimum temperature 2. Precipitation 3. Runoff 4. Snow (amount of water in the snowpack) 5. Soil Storage (water stored in the soil column) 6. Evaporative deficit (how much water could evaporate compared to how much water is
actually available)
Exploring the National Map -‐ You can also select the time period over which the variable is averaged, either annual mean or
monthly averages. -‐ And, you can also choose which climate model to apply. Leave the model choice as “Mean
Model”. -‐ First, explore the national map of the continental United States for each variable (listed above)
for the annual mean time period. • Note that each map compares average values from 1950-2005 with projected average
values for 2050-2074. • The climate scenario used is a high emissions scenario (RCP8.5), which assumes that
greenhouse gas emissions continue to rise through the 21st century.
Module 9 – Summative Assessment Food and Climate Change
2
For the first part of this assignment, leave the settings as shown in the figure below:
Interpreting the NCCV Maps The legend at the bottom of the map above shows us that the darker red values indicate that the second half of the 21st century (2050-2074) is anticipated to experience maximum temperatures about 10 to 24oF warmer on average than the average maximum temperatures of the 1950-2005 time period.
Use this menu to change which variable is plotted
Module 9 – Summative Assessment Food and Climate Change
3
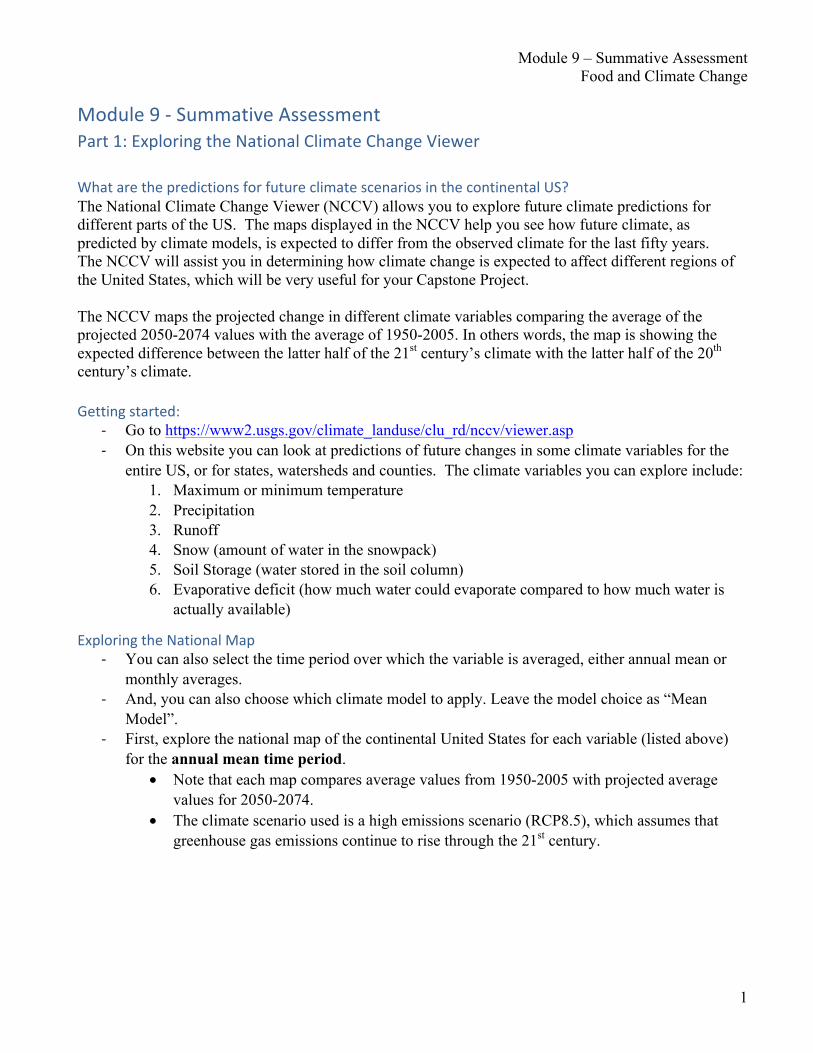
Interpreting the graphs below the map Click on the Climograph/Histogram tab
-‐ The graph on the left shows the monthly values of the selected climate variables for the two time periods. In the example below, you can see that the maximum temperature is expected to be higher in every month in the 2050-2074 time period when compared to the 1950-2005 time period.
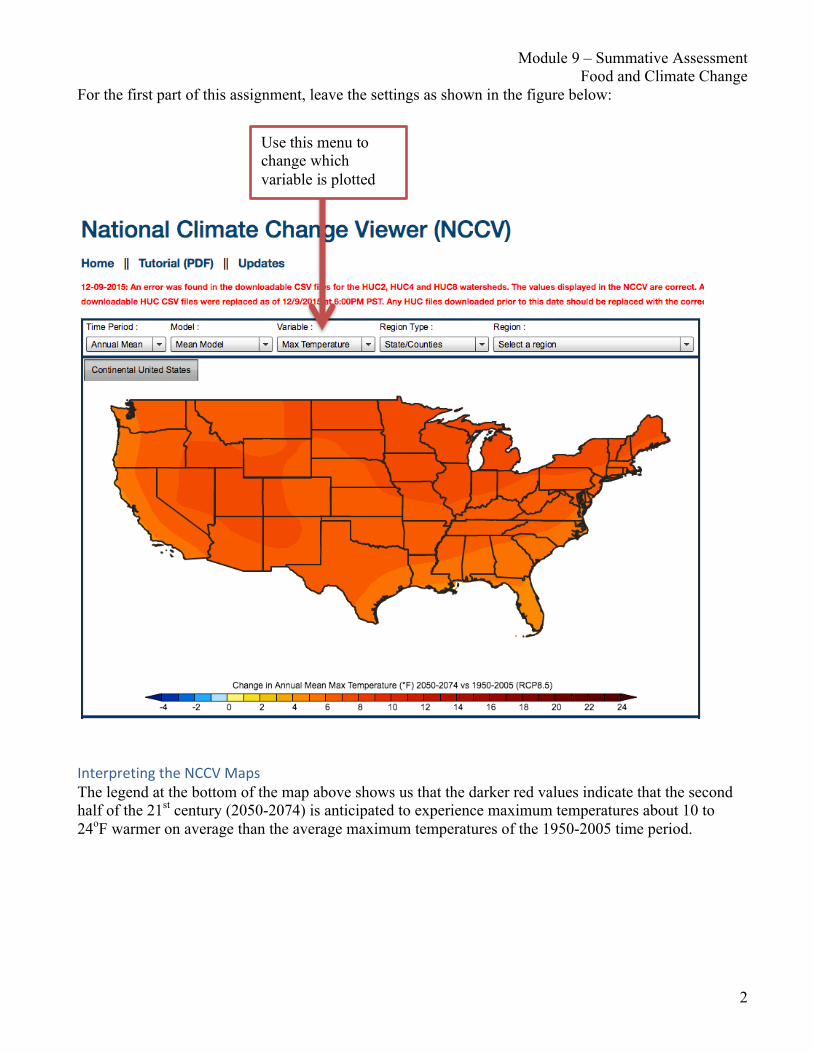
Click on the Time Series tab
-‐ The graph displayed shows the observed historical maximum temperature data through 2005. The red line is the future projection of maximum temperature through 2100 using a high emission scenario, and the blue line is a low emission scenario model. Emissions scenarios are models of future CO2 emissions.
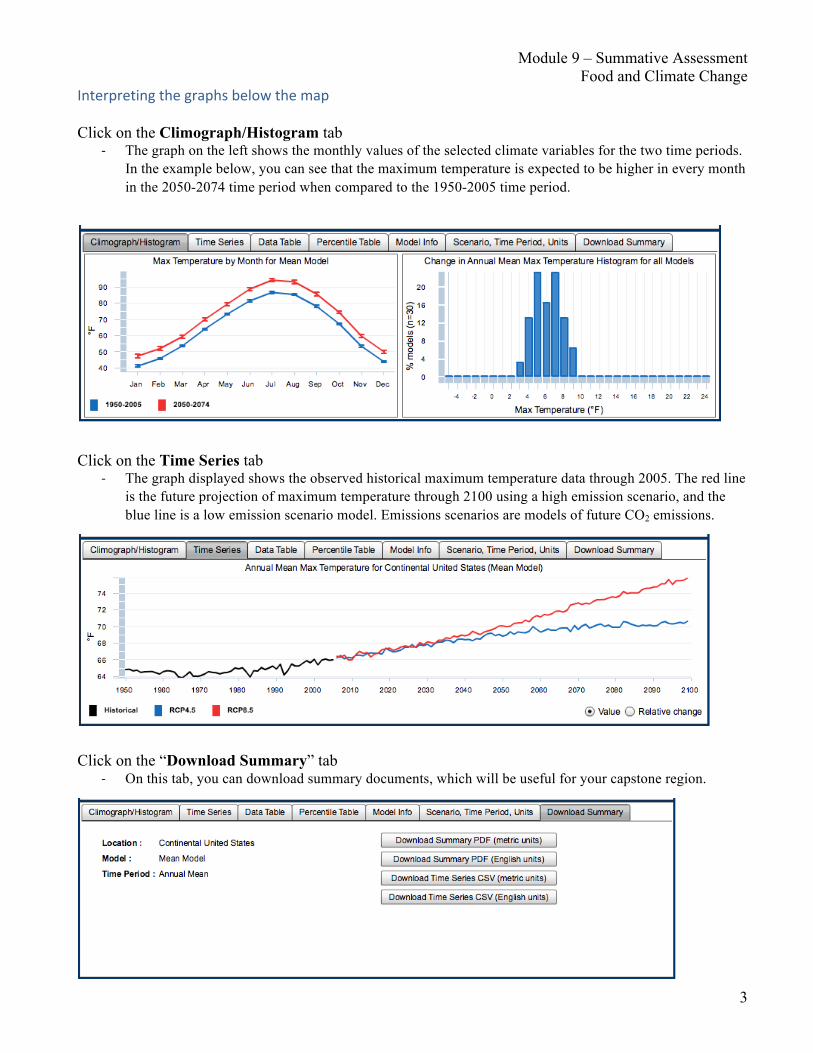
Click on the “Download Summary” tab
-‐ On this tab, you can download summary documents, which will be useful for your capstone region.

Module 9 – Summative Assessment Food and Climate Change
4
Answer the following questions using the national map of the continental U.S. 1. Look at the maps for Max Temperature and Min Temperature. Which parts of the continental US
are expected to experience greater warming in the future (greater difference from average 1950-2005 to 2050-2074 temperatures)? Which areas will experience the least warming? What is the range of expected change in annual min and max temperatures for the continental US?
2. Change the climate variable plotted to Precipitation. In general, describe the expected changes in annual
mean precipitation across the US. Which regions are expected to be drier and which wetter? How great is the magnitude of the expected change?
3. Change the climate variable plotted to Runoff. Runoff is precipitation that makes it to streams and rivers.
Which parts of the US are expected to experience lower runoff? Higher runoff? Look at the graph on the left under Climograph/Histogram. Which months of the year are expected to experience higher runoff? Lower runoff?
4. Change the climate variable in the map to Snow. In the northeastern US and the western US, are any areas
expected to see increases in snowpack? (NOTE: The southern US falls in the zero change in snowpack category because they don’t get any snow and that is not expected to change.)
Module 9 – Summative Assessment Food and Climate Change
5
5. Change the mapped climate variable to be Soil Storage. Which regions of the US are expected to experiences
the most widespread and largest decreases in soil moisture storage?
Exploring monthly variability: The graphs at the bottom of the map under the “Climograph/Histogram” tab show the changes in each climate variable’s monthly average. (You can also change the map to display the different monthly averages for comparison.)
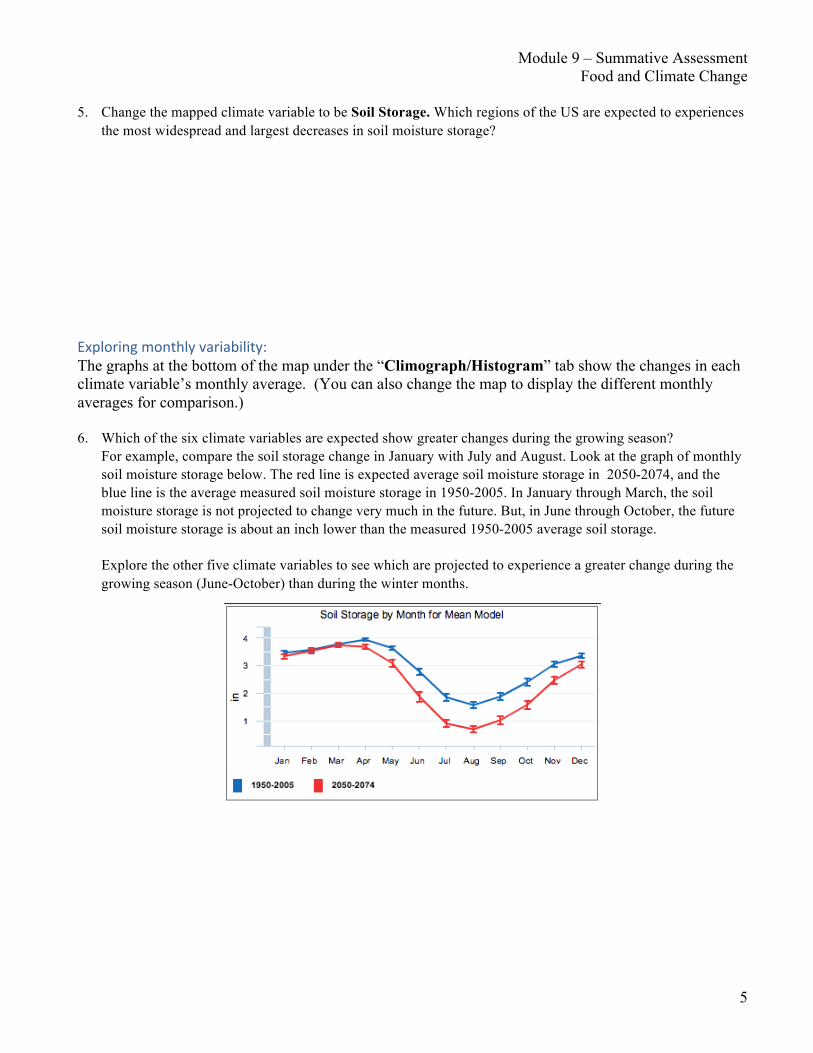
6. Which of the six climate variables are expected show greater changes during the growing season?
For example, compare the soil storage change in January with July and August. Look at the graph of monthly soil moisture storage below. The red line is expected average soil moisture storage in 2050-2074, and the blue line is the average measured soil moisture storage in 1950-2005. In January through March, the soil moisture storage is not projected to change very much in the future. But, in June through October, the future soil moisture storage is about an inch lower than the measured 1950-2005 average soil storage. Explore the other five climate variables to see which are projected to experience a greater change during the growing season (June-October) than during the winter months.
Module 9 – Summative Assessment Food and Climate Change
6
Part 2: Exploring climate predictions for your capstone region In this part of the summative assessment, you will use the National Climate Change Viewer (or a similar global viewer for regions outside of the USA) to explore predicted climate change impacts on your capstone region.
• For regions in the USA, use the National Climate Change viewer (NCCV) that you used in the previous section of this assignment. https://www2.usgs.gov/climate_landuse/clu_rd/nccv/viewer.asp
• For regions outside of the USA, go to the CMIP5 Global Climate Change Viewer (GCCV)
http://regclim.coas.oregonstate.edu/visualization/gccv/cmip5-global-climate-change-viewer/index.html. The only variables available for many countries are temperature and precipitation.
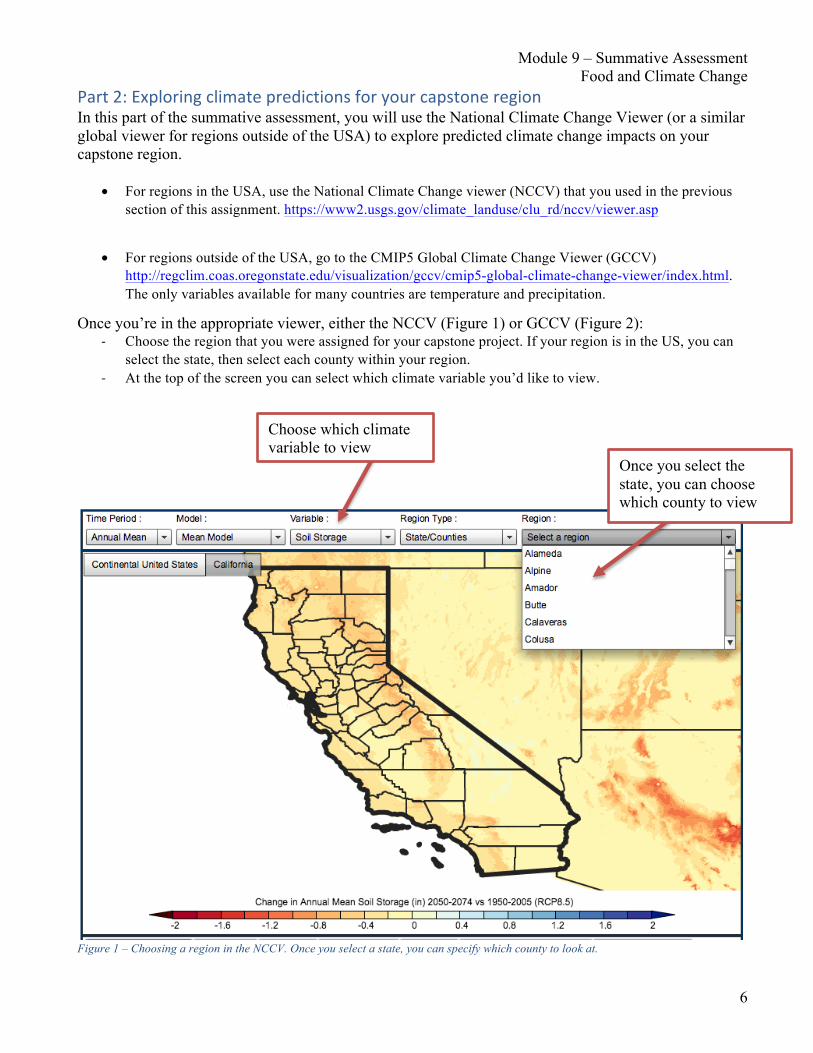
Once you’re in the appropriate viewer, either the NCCV (Figure 1) or GCCV (Figure 2): -‐ Choose the region that you were assigned for your capstone project. If your region is in the US, you can
select the state, then select each county within your region. -‐ At the top of the screen you can select which climate variable you’d like to view.
Figure 1 – Choosing a region in the NCCV. Once you select a state, you can specify which county to look at.
Once you select the state, you can choose which county to view
Choose which climate variable to view
Module 9 – Summative Assessment Food and Climate Change
7
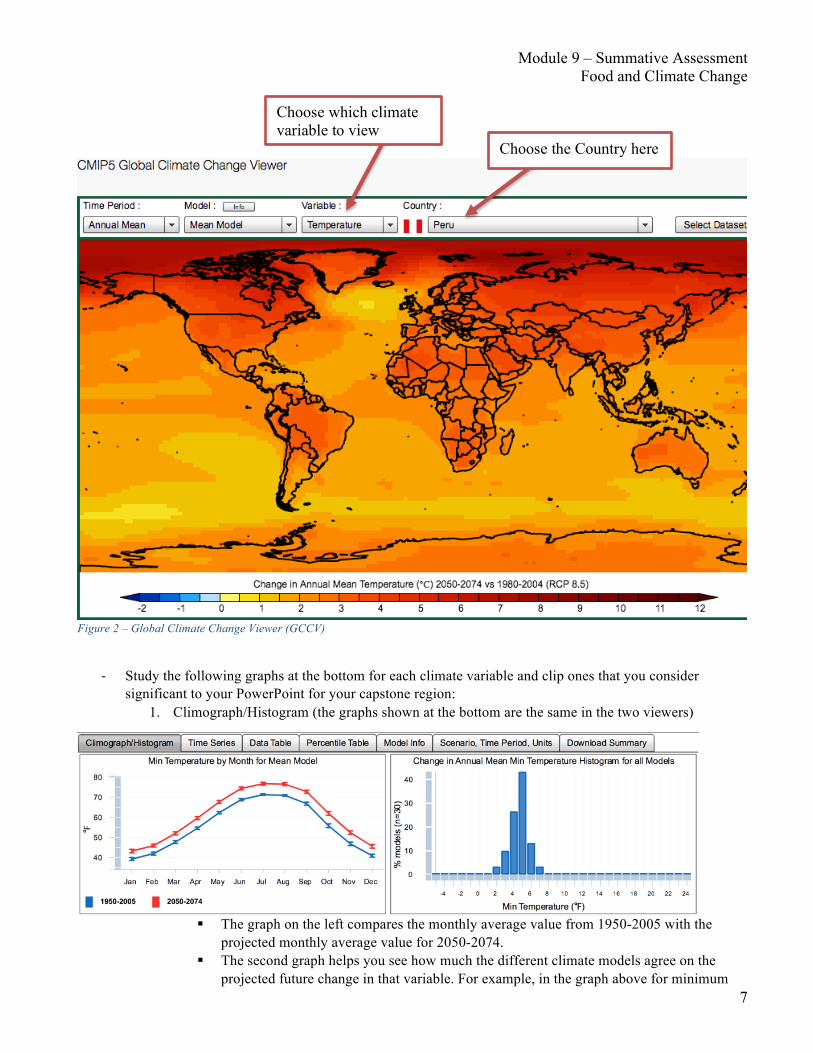
Figure 2 – Global Climate Change Viewer (GCCV)
-‐ Study the following graphs at the bottom for each climate variable and clip ones that you consider
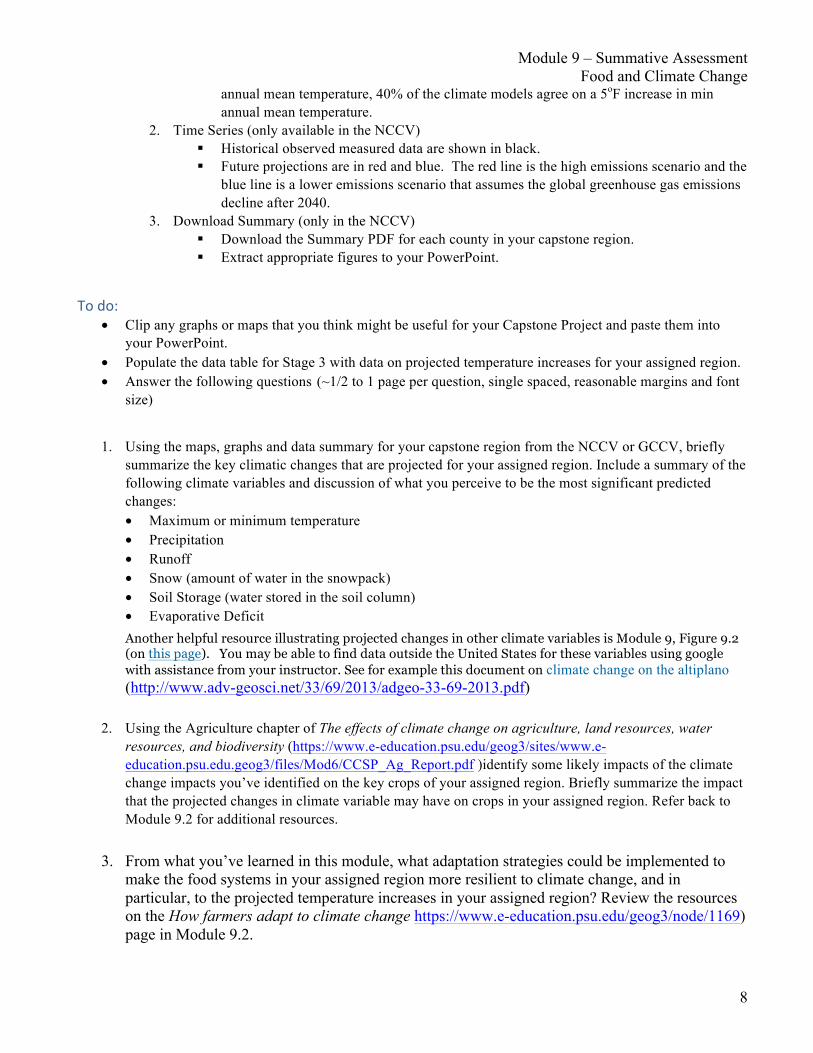
significant to your PowerPoint for your capstone region: 1. Climograph/Histogram (the graphs shown at the bottom are the same in the two viewers)
§ The graph on the left compares the monthly average value from 1950-2005 with the
projected monthly average value for 2050-2074. § The second graph helps you see how much the different climate models agree on the
projected future change in that variable. For example, in the graph above for minimum
Choose the Country here
Choose which climate variable to view
Module 9 – Summative Assessment Food and Climate Change
8
annual mean temperature, 40% of the climate models agree on a 5oF increase in min annual mean temperature.
2. Time Series (only available in the NCCV) § Historical observed measured data are shown in black. § Future projections are in red and blue. The red line is the high emissions scenario and the
blue line is a lower emissions scenario that assumes the global greenhouse gas emissions decline after 2040.
3. Download Summary (only in the NCCV) § Download the Summary PDF for each county in your capstone region. § Extract appropriate figures to your PowerPoint.
To do: • Clip any graphs or maps that you think might be useful for your Capstone Project and paste them into
your PowerPoint. • Populate the data table for Stage 3 with data on projected temperature increases for your assigned region. • Answer the following questions (~1/2 to 1 page per question, single spaced, reasonable margins and font
size)
1. Using the maps, graphs and data summary for your capstone region from the NCCV or GCCV, briefly
summarize the key climatic changes that are projected for your assigned region. Include a summary of the following climate variables and discussion of what you perceive to be the most significant predicted changes: • Maximum or minimum temperature • Precipitation • Runoff • Snow (amount of water in the snowpack) • Soil Storage (water stored in the soil column) • Evaporative Deficit Another helpful resource illustrating projected changes in other climate variables is Module 9, Figure 9.2 (on this page). You may be able to find data outside the United States for these variables using google with assistance from your instructor. See for example this document on climate change on the altiplano (http://www.adv-geosci.net/33/69/2013/adgeo-33-69-2013.pdf)
2. Using the Agriculture chapter of The effects of climate change on agriculture, land resources, water
resources, and biodiversity (https://www.e-education.psu.edu/geog3/sites/www.e-education.psu.edu.geog3/files/Mod6/CCSP_Ag_Report.pdf )identify some likely impacts of the climate change impacts you’ve identified on the key crops of your assigned region. Briefly summarize the impact that the projected changes in climate variable may have on crops in your assigned region. Refer back to Module 9.2 for additional resources.
3. From what you’ve learned in this module, what adaptation strategies could be implemented to make the food systems in your assigned region more resilient to climate change, and in particular, to the projected temperature increases in your assigned region? Review the resources on the How farmers adapt to climate change https://www.e-education.psu.edu/geog3/node/1169) page in Module 9.2.


![Histogram [Www.nikonians.org]](https://img.pdfslide.net/doc/110x75/577cd8911a28ab9e78a17d60/histogram-wwwnikoniansorg.jpg)