Embed Size (px)
Citation preview

© Crown copyright 2007 Page 1
MOGREPS short-range ensemble forecasting and
the PREVIEW Windstorms Project
Ken MylneThanks to all those who have contributed to both projects.

© Crown copyright 2007 Page 2
Outline
MOGREPSSystem outlineProduct examplesVerification
PREVIEW WindstormsThe same!
© Crown copyright 2007 Page 3
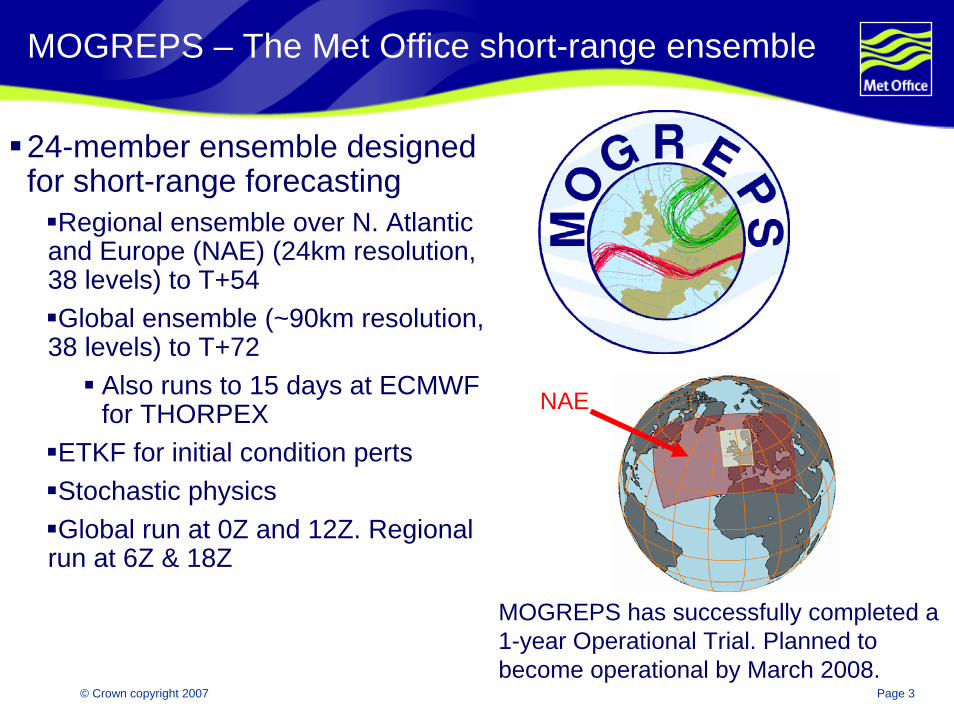
MOGREPS – The Met Office short-range ensemble
NAE
MOGREPS has successfully completed a 1-year Operational Trial. Planned to become operational by March 2008.
24-member ensemble designed for short-range forecasting
Regional ensemble over N. Atlantic and Europe (NAE) (24km resolution, 38 levels) to T+54 Global ensemble (~90km resolution,
38 levels) to T+72Also runs to 15 days at ECMWF for THORPEX
ETKF for initial condition pertsStochastic physicsGlobal run at 0Z and 12Z. Regional
run at 6Z & 18Z

© Crown copyright 2007 Page 4
MOGREPS System diagram
Global Analysis
Global ETKF with localisation
Global MOGREPS Forecast
NAE Analysis
Boundary conditions for NAE MOGREPS
NAE ETKF
Global Hi-res forecast
NAE MOGREPS Forecast
NAE Hi-res forecast
MOGREPS Post-Processing System
Chart Products
Site-specific Database (FSSSI)
Global MOGREPS 15-day f/c (run at ECMWF)

© Crown copyright 2007 Page 5
Example MOGREPS 33h Rainfall forecast

© Crown copyright 2007 Page 6
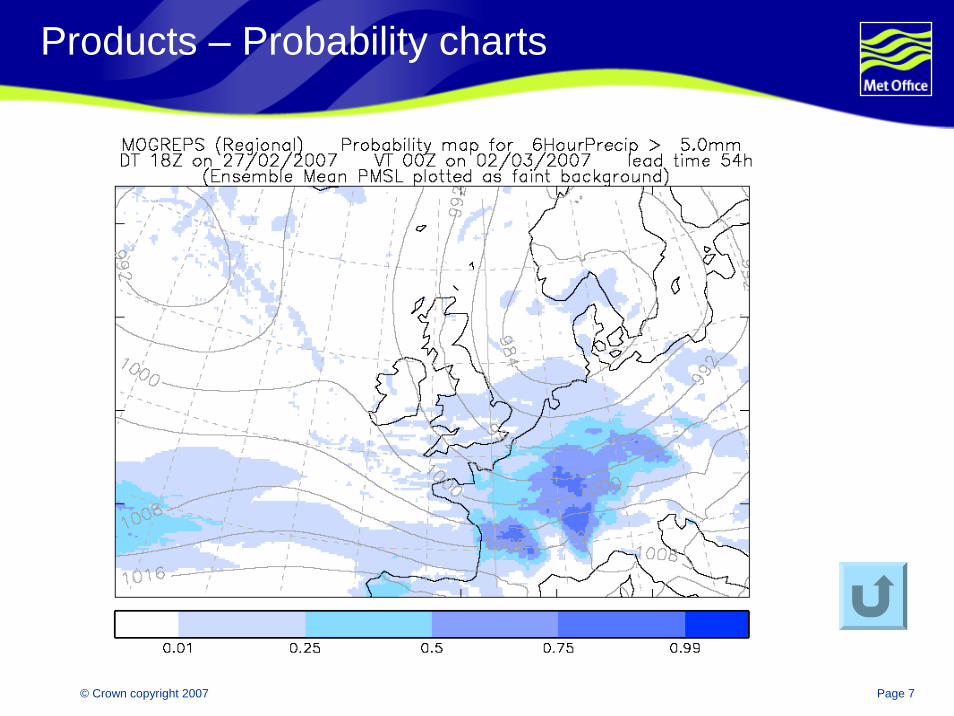
Products – Probability charts
© Crown copyright 2007 Page 7
Products – Probability charts

© Crown copyright 2007 Page 8
MOGREPS Site-specific forecasts
Fan chart – can mix MOGREPS and ECMWF data
Kalman filter MOS is being implemented for MOGREPS forecasts

© Crown copyright 2007 Page 9
Hurricane Katrina

© Crown copyright 2007 Page 10
Frontal wave
Diminutive wave Barotropic low
Cyclone database & New Year’s Eve storm
Tracking scheme uses a combination of forward and backward tracking. It uses extrapolation and 500hPa steering wind to estimate positions, and matches features based on separation distance, type and thickness
0 3 4 5 6
2-d Front Frontal wavecyclone Frontalfracture T-bone Mature cyclone
1
Diminutivefrontal wave
2
Frontal wave
Control analysis 0Z 30/12/06
Interactive clickable maps allow the user to select a feature in the control analysis...

© Crown copyright 2007 Page 11
Cyclone database: 31/12/2006 example
Clicking on a feature brings up feature-specific tracks from each ensemble memberand matching plumes of intensity measures to identify the potential for high-impact weather
ECMWF-EPS
MOGREPS-15
This storm tracked across Scotland, with gusts up to
100mph, leading to the high-profile cancellation
of New Year’s Evecelebrations and loss of power to 1000s of homes
Analysis 00Z 01/01/2007
UK

© Crown copyright 2007 Page 12
Cyclone database: Spaghetti plot of objective fronts
The cyclone database objectively identifies fronts and cyclonic features in the extra-tropics

© Crown copyright 2007 Page 13
THORPEX Multimodel products: Probability plot
Probability of mean sea level pressure > 1020hPa (with contours from the ensemble mean)T+204
PMSL > 1020 hPa

© Crown copyright 2007 Page 14
Storm surge Ensemble – contract for EA
Surge elevation Mean and spread
Probability of Surge elevation > 1.0m

© Crown copyright 2007 Page 15
9th Nov 2007 – Biggest North Sea surge since 1953
Cromer (Norfolk)
12h ending 0600 (T+24)
Probability of water level exceeding danger level

© Crown copyright 2007 Page 16
9th Nov 2007 – Biggest North Sea surge since 1953
Lowestoft
12h ending 0600 (T+24)
Probability of water level exceeding danger level

© Crown copyright 2007 Page 17
9th Nov 2007 – Biggest North Sea surge since 1953
Felixstowe
12h ending 0600 (T+24)
Probability of water level exceeding danger level

© Crown copyright 2007 Page 18
9th Nov 2007 – Biggest North Sea surge since 1953
Felixstowe
12h ending 1200 (T+30)
Probability of water level exceeding danger level

© Crown copyright 2007 Page 19
9th Nov 2007 – Biggest North Sea surge since 1953
Sheerness (Thames Estuary)
12h ending 1200 (T+30)
Probability of water level exceeding danger level

© Crown copyright 2007 Page 20
9th Nov 2007 – Biggest North Sea surge since 1953
Dover
12h ending 1200 (T+30)
Probability of water level exceeding danger level

© Crown copyright 2007 Page 21
MOGREPS Verification

© Crown copyright 2007 Page 22
Reliability diagram for surface temperature
Reliabilitydiagram for Temp>10C
79 sites UK & Europe
6 Nov 2006 –28 Feb 2007

© Crown copyright 2007 Page 23
6hr precip > 0.3mm against gridded analysis
•Reliability and sharpness diagram for T+36 forecast.
•6h precip > 0.3mm
•Verification against Nimrod Analysis over the UK at 1.0 degree resolution.

© Crown copyright 2007 Page 24
•Reliability and sharpness diagram for T+36 forecast.
•6h precip > 5mm
•Verification against Nimrod Analysis over the UK at 1.0 degree resolution.
6hr precip 5mm against gridded analysis
© Crown copyright 2007 Page 25
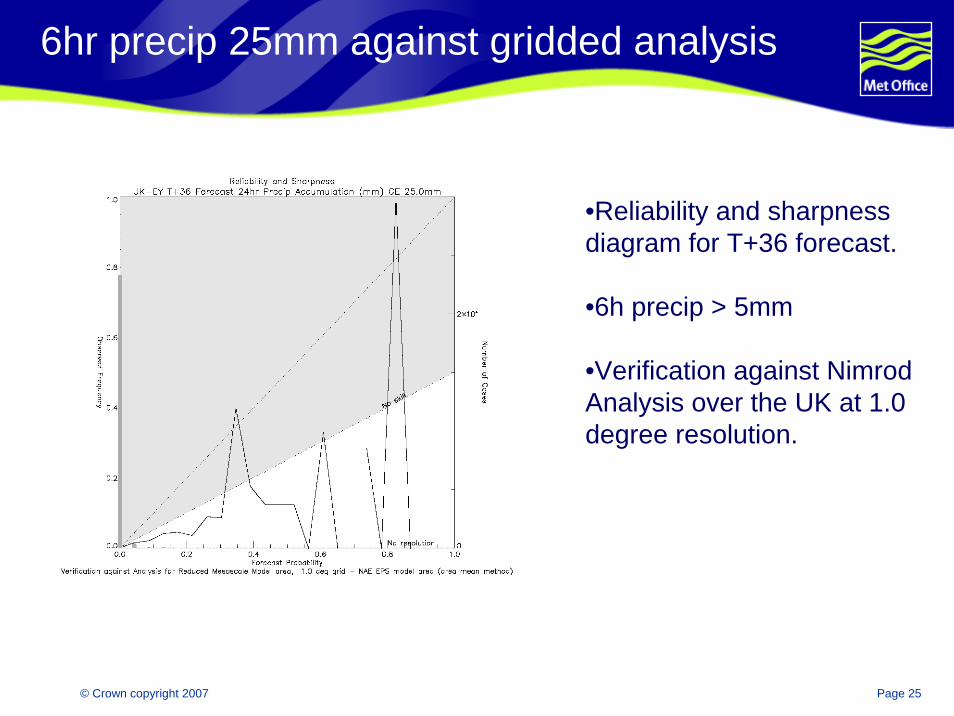
•Reliability and sharpness diagram for T+36 forecast.
•6h precip > 5mm
•Verification against Nimrod Analysis over the UK at 1.0 degree resolution.
6hr precip 25mm against gridded analysis

© Crown copyright 2007 Page 26
Wind speed at least gale force 8
•Reliability and sharpness diagram for T+36 forecast.
•10m Wind > F8
•Verification against surface obs over UK and Europe.•1 Jan 06 – 28 Feb 07

© Crown copyright 2007 Page 27
Wind speed at least severe gale force 9
•Reliability and sharpness diagram for T+36 forecast.
•10m Wind > F9
•Verification against surface obs over UK and Europe.•1 Jan 06 – 28 Feb 07

© Crown copyright 2007 Page 28
Wind speed at least storm force 10
•Reliability and sharpness diagram for T+36 forecast.
•10m Wind > F10
•Verification against surface obs over UK and Europe.•1 Jan 06 – 28 Feb 07

© Crown copyright 2007 Page 29
Spread-skill relationship – wind speed
Spread-skill for wind-speed binned into equal population bins by spread
Skill corrected for observation error
Blue – MOGREPS Pink – No SkillGreen – Perfect
Grad = 0.93
Grad = 0.05
Grad = 0.59
0
1
2
3
4
5
0 1 2 3 4 5
Average Standard Deviation (ms-1)
RM
SE
(ms-1
)
MOGREPSNo SkillPerfect Spread
Grad = 0.60
Grad = -0.05
Grad = 0.98
0.0
0.5
1.0
1.5
2.0
2.5
3.0
3.5
0.0 0.5 1.0 1.5 2.0 2.5 3.0 3.5
Average Standard Deviation (ms-1)
RM
SE
(ms-1
)
MOGREPSNo SkillPerfect Spread
DJF
JJA

EURORISK PREVIEW WindstormsOverview

© Crown copyright 2007 Page 31
Overview - Windstorms
Windstorms cause a large percentage of the weather-related damage each year
The windstorms service offers a regularly updated forecast of wind strengths and directions and puts it into context of wind storms events of the past 40 years.
Visual overview of the chance of windstorms at sites across Europe using latest multi-model high resolution ensemble forecasts.
Historical analysis gives users information on the strength and direction of previous windstorm events at each site.

© Crown copyright 2007 Page 32
Overview – the plan
Database (Met Office UK)
Ensemble ForecastsPEACE (MeteoFrance)
SRNWP-PEPS (DWD)
LAMEPS (Met.no)
ECMWF EPS (ECMWF)
MOGREPS ( Met Office UK)
COSMO-LEPS
Kalman Filter
Wind Gust Calculation(Meteo-France)
Windstorm Forecast Products
Website(Met Office UK)
Hazard Mapping Data(SMHI)
Windstorm Risk Mapping Products

© Crown copyright 2007 Page 33
Overview – Ensembles
Medium-Range Ensembles used for Days 3-5
(i) ECMWF EPS
(ii) COSMO-LEPS

© Crown copyright 2007 Page 34
Overview – Ensembles
Short-Range Ensembles used for Days 1-2
(i) MOGREPS NAE
(ii) MOGREPS Global
(iii) PEACE
(iv) LAMEPS
(v) COSMO-LEPS
(vi) SRNWP-PEPS

© Crown copyright 2007 Page 35
COSMO-LEPS
1-5 days ahead.
run at ECMWF by ARPA-SIMTwo versions of COSMO-LEPS
The standard version 16-member ensemble 10km grid spacing over southern part of Europe.
A second version is run specifically in support of Windstorms to cover the north-western part of Europe,
only 10 members.
© Crown copyright 2007 Page 36
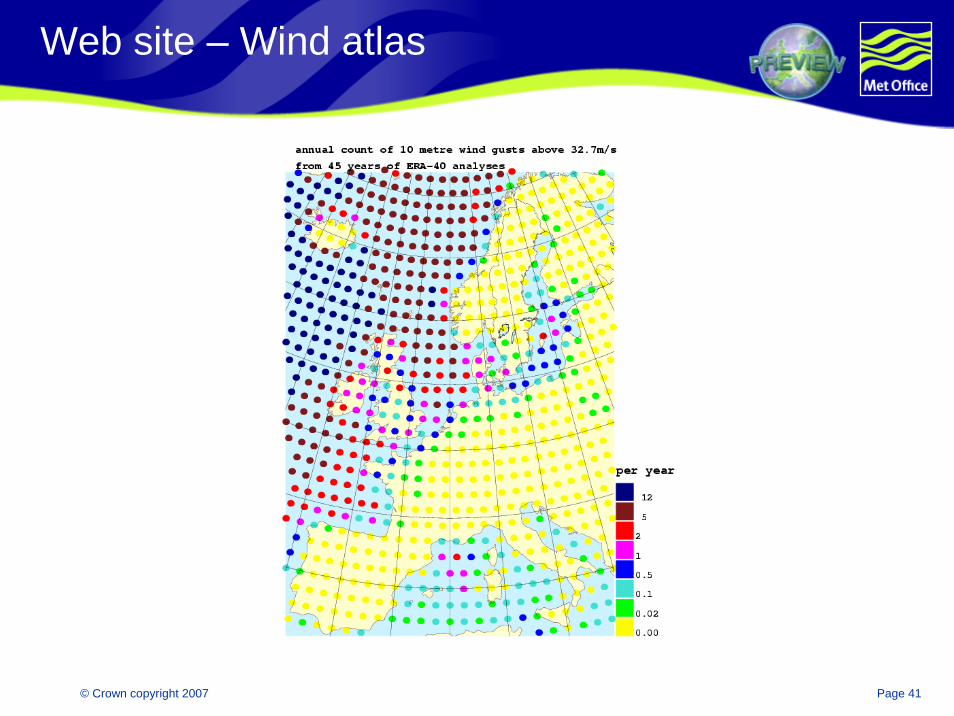
Overview – Climate data
Windstorms service includes an analysis of historical wind events from ERA-40 done by SMHI
Spans 1958-2002 (2006) Statistics and return periods estimated
LimitationsExtreme windspeeds underestimated due to resolution of ERA-40Significant events missed due to 6-hour resolution

© Crown copyright 2007 Page 37
Web site
http://www.preview-windstorms.eu/

© Crown copyright 2007 Page 38
Web site – Traffic lights

© Crown copyright 2007 Page 39
Web site - Meteograms

© Crown copyright 2007 Page 40
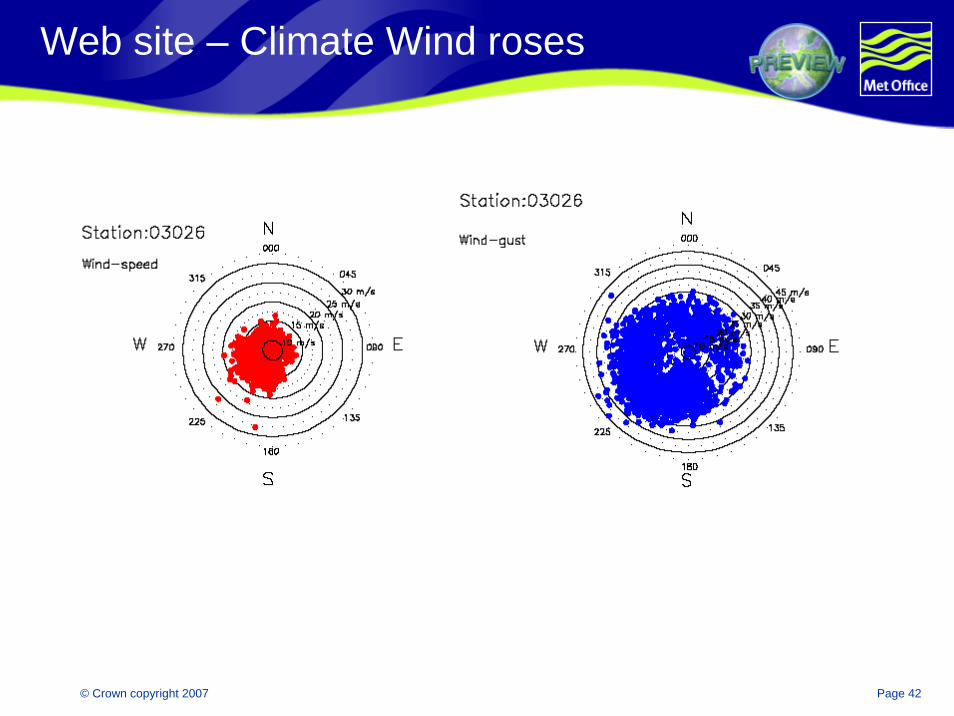
Web site – wind roses
© Crown copyright 2007 Page 41
Web site – Wind atlas
© Crown copyright 2007 Page 42
Web site – Climate Wind roses
© Crown copyright 2007 Page 43
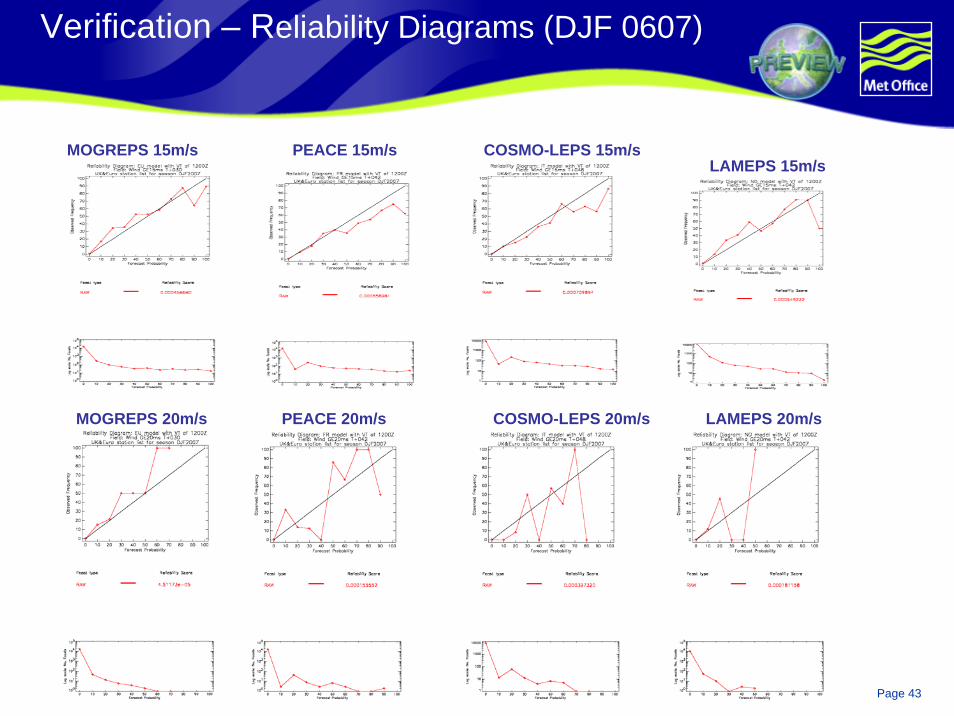
Verification – Reliability Diagrams (DJF 0607)
MOGREPS 15m/sLAMEPS 15m/s
COSMO-LEPS 20m/s
COSMO-LEPS 15m/s
PEACE 20m/sMOGREPS 20m/s
PEACE 15m/s
LAMEPS 20m/s
© Crown copyright 2007 Page 44
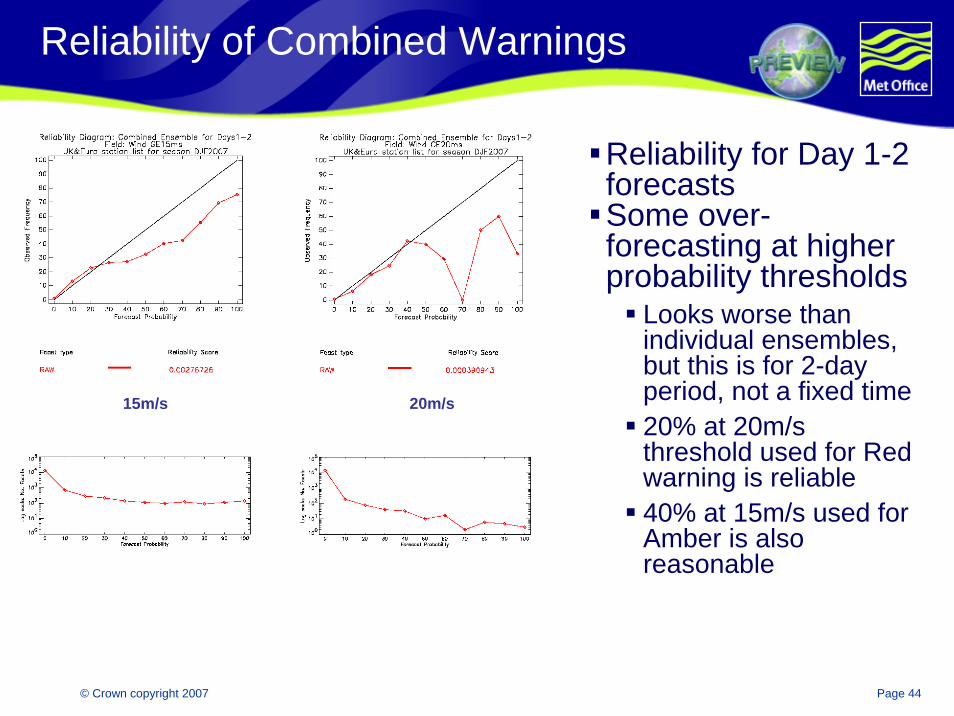
Reliability of Combined Warnings
Reliability for Day 1-2 forecastsSome over-forecasting at higher probability thresholds
Looks worse than individual ensembles, but this is for 2-day period, not a fixed time20% at 20m/s threshold used for Red warning is reliable40% at 15m/s used for Amber is also reasonable
20m/s15m/s

© Crown copyright 2007 Page 45
Reliability of Combined Warnings Days 3-5
Reliability for Day 3-5 forecastsSome over-forecasting at higher probability thresholds
Similar to day 1-2 forecasts20% at 20m/s threshold used for Red warning is reliable40% at 15m/s used for Amber is also reasonable
20m/s15m/s
© Crown copyright 2007 Page 46
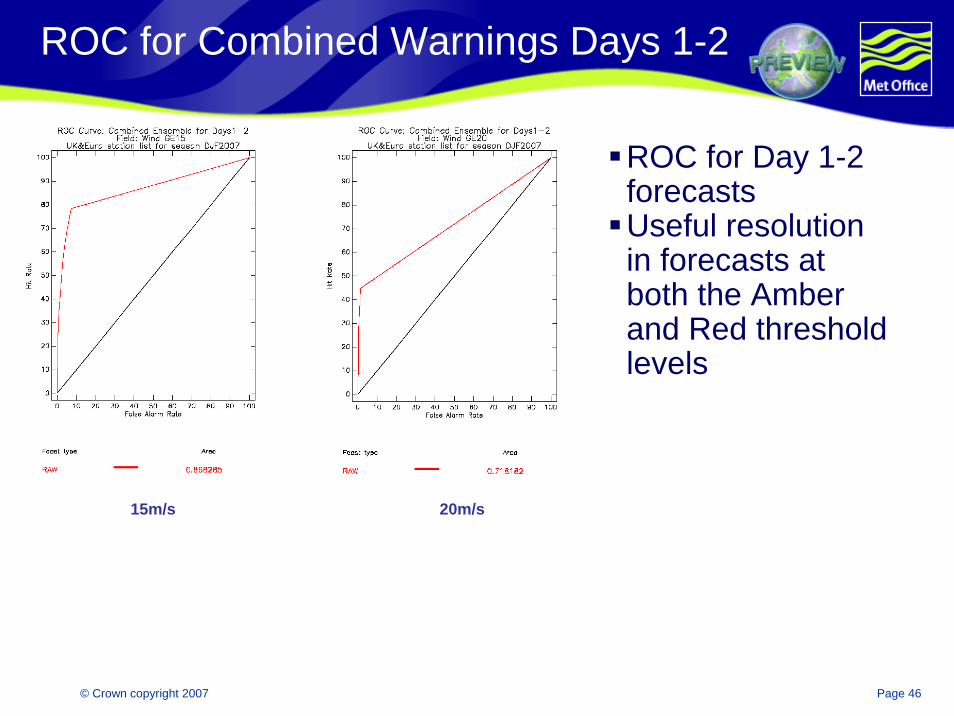
ROC for Combined Warnings Days 1-2
ROC for Day 1-2 forecastsUseful resolution in forecasts at both the Amber and Red threshold levels
20m/s15m/s

© Crown copyright 2007 Page 47
ROC for Combined Warnings Days 3-5
ROC for Day 3-5 forecastsUseful resolution in forecasts at both the Amber and Red threshold levels
20m/s15m/s

© Crown copyright 2007 Page 48
Questions & AnswersAcknowledgements
WindstormsCaroline WoolcockPer KallbergPat Mackenzie & Marion RickettsAndrea MontaniJean NicolauMarit JensenMichael DenhardRob DarvellGraeme Loudon Leif Sandahland many others!
MOGREPSNeill BowlerCaroline WoolcockSarah BeareTim LeggAlberto ArribasAnette Van Der WalRob DarvellKelvyn RobertsonHelen TitleyChristine JohnsonJonathan FlowerdewMarie DandoDavid Goddard & Ian Andersonand many others!
http://www.preview-windstorms.eu/Username/password: Contact [email protected]
© Crown copyright 2007 Page 49
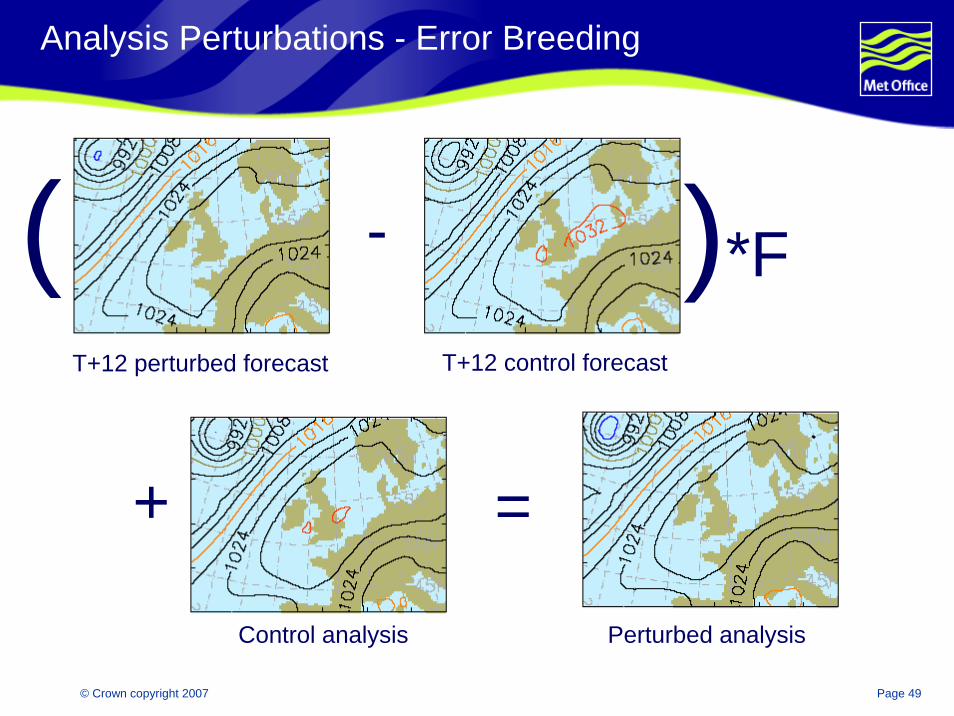
Analysis Perturbations - Error Breeding
-( )*F
+ =
T+12 perturbed forecast T+12 control forecast
Control analysis Perturbed analysis

© Crown copyright 2007 Page 50
Ensemble Transform Kalman Filter (ETKF)
T+12 perturbed forecast
T+12 ensemble mean forecast
( - ) + =
( - ) + =
( - ) + =
( - ) + =
( - ) + =Transform matrix
Control analysis
Perturbed analysis
0.9 Pert 1-0.1 Pert 2-0.1 Pert 3-0.1 Pert 4-0.1 Pert 5