Embed Size (px)
Citation preview
MOL GROUP
INVESTOR PRESENTATIONFebruary 2018
2
PRESENTATION MANUAL
LINKS ( )ARE AVAILABLE THROUGHOUT THE PRESENTATION THAT DIRECT YOU TO MORE
INFORMATION ON THE SELECTED TOPIC.
A NAVIGATION BAR ON THE TOP OF EACH SLIDE IS ALSO AVAILABLE, WITH THE
FOLLOWING BUTTONS:
HOME: GO TO THE SUMMARY SLIDE
HELP: GO TO PRESENTATION MANUAL
BACK: GO TO PREVIOUS SLIDE
FORWARD: GO TO THE NEXT SLIDE
RETURN: GO TO LAST SLIDE VIEWED
3
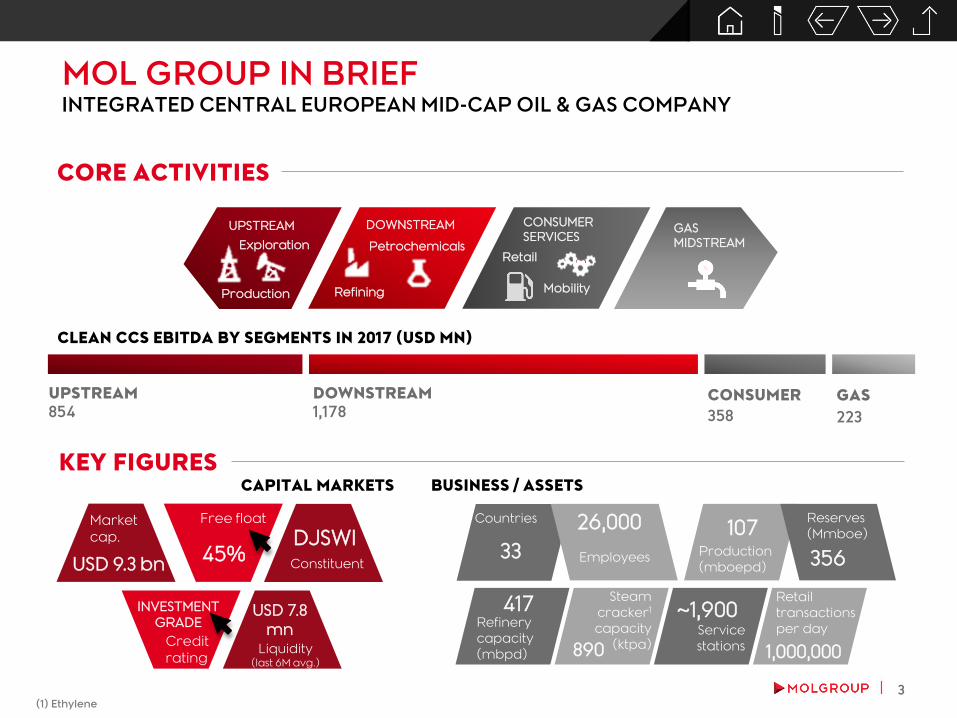
358
Constituent
DJSWI
MOL GROUP IN BRIEFINTEGRATED CENTRAL EUROPEAN MID-CAP OIL & GAS COMPANY
CORE ACTIVITIES
UPSTREAM
Market
cap.
USD 9.3 bn
INVESTMENT
GRADE
Credit
rating Liquidity
(last 6M avg.)
USD 7.8
mn
KEY FIGURES
Countries
33 Employees
26,000
Production
(mboepd)
107Reserves
(Mmboe)
356
Refinery
capacity
(mbpd)
417Service
stations
~1,900Retail
transactions
per day
1,000,000
CLEAN CCS EBITDA BY SEGMENTS IN 2017 (USD MN)
UPSTREAM
854
DOWNSTREAM
1,178GAS
223
CONSUMER
CAPITAL MARKETS BUSINESS / ASSETS
890
Steam
cracker1
capacity
(ktpa)
GAS
MIDSTREAM
(1) Ethylene
45%
Free float
DOWNSTREAM
Refining
Petrochemicals
CONSUMER
SERVICES
Retail
Mobility
Exploration
Production

4
MOL GROUP GEOGRAPHYCEE-BASED INTEGRATED OPERATIONS AND INTERNATIONAL UPSTREAM
UPSTREAM DOWNSTREAM CONSUMER SERVICES
RUSSIA
KAZAKHSTAN
PAKISTAN
OMAN
ANGOLA
IRAQ
EGYPTSYRIA
(IN FORCE MAJEURE)
NORWAY
UK
CZECH REP.
SLOVENIA
SERBIA
BOSNIA
SLOVAKIA
HUNGARY
CROATIA
ROMANIA
HQ

5
EXPLORATION AND PRODUCTION
Q4 2017 RECAP
THE MOL GROUP EQUITY STORY
AGENDA
DOWNSTREAM
CONSUMER SERVICES
FINANCIALS, GOVERNANCE AND OTHERS
SUPPORTING SLIDES
(LINK TO Q4 & FY 2017 RESULTS)
THE MOL GROUP
EQUITY STORY
7
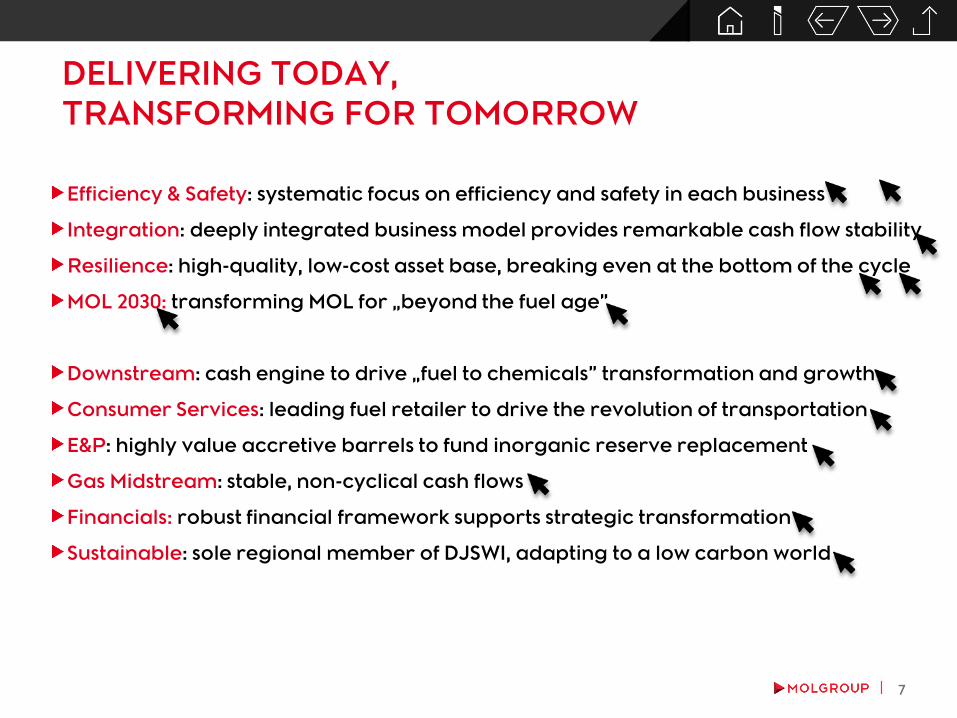
DELIVERING TODAY,
TRANSFORMING FOR TOMORROW
Efficiency & Safety: systematic focus on efficiency and safety in each business
Integration: deeply integrated business model provides remarkable cash flow stability
Resilience: high-quality, low-cost asset base, breaking even at the bottom of the cycle
MOL 2030: transforming MOL for „beyond the fuel age”
Downstream: cash engine to drive „fuel to chemicals” transformation and growth
Consumer Services: leading fuel retailer to drive the revolution of transportation
E&P: highly value accretive barrels to fund inorganic reserve replacement
Gas Midstream: stable, non-cyclical cash flows
Financials: robust financial framework supports strategic transformation
Sustainable: sole regional member of DJSWI, adapting to a low carbon world
8
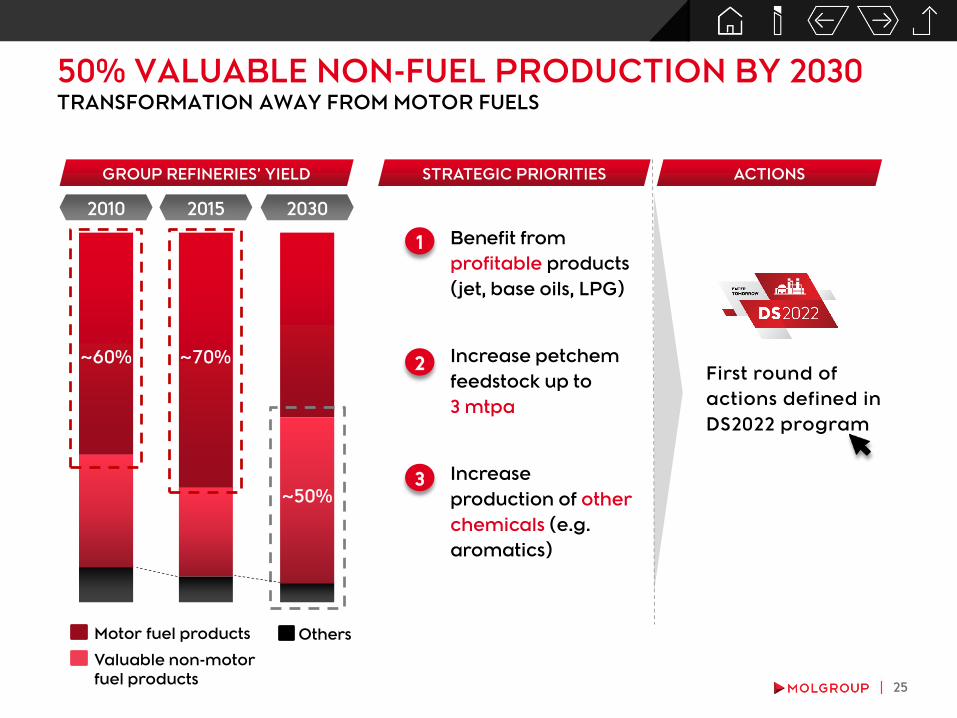
Enhancing flexibility in refining by reducing motor fuel yield from 70%+ to 50%
by 2030 mostly through increasing feedstock transfer to chemicals
Investing USD 4.5bn by 2030 to grow in chemicals by moving deeper along the
value chain
DS2022: the first milestone in the transformational journey
DOWNSTREAM: CASH ENGINE TO DRIVE „FUEL TO
CHEMICALS” TRANSFORMATION AND GROWTH
High-quality, low-cost asset base
Market leading position in Central Europe with long-standing customer relations
Strong captive markets and a deeply integrated refining-chemicals-distribution
value chain
Proven efficiency track record: almost USD 1bn EBITDA uplift since 2011
Outstanding margin capture with double-digit unit EBITDA (USD/bbl)
DELIVERING TODAY
TRANSFORMING FOR TOMORROW
9
CONSUMER SERVICES: LEADING FUEL RETAILER
TO DRIVE THE REVOLUTION OF TRANSPORTATION
Leading CEE fuel retailer with ~1,900 sites, market leader in 4 countries
Exploiting the fuel market potential in CEE
Non-fuel increasingly a growth driver due to new store concept: Fresh Corner
DELIVERING TODAY
TRANSFORMING FOR TOMORROW
MOL 2030: transforming fuel retailing into a consumer services hub and
pioneering the transportation revolution in CEE
Digital: for a personalized and convenient customer experience
Beyond non-fuel: mobility services
By 2021: growing EBITDA to USD 450mn with rising share of non-fuel
10
MOL 2030: transforming to a sustainable international Upstream portfolio
Targeting 100% reserve replacement
Existing barrels deliver USD 2bn+ FCF in 2017-21, which can comfortably fund
inorganic reserve replacement
Existing 2P reserves generate substantial value and FCF even below USD 50/bbl oil price
Exploration & Production adjusted to be fit and to prosper at the bottom of the cycle
Proven capabilities to operate mature, onshore assets in a cost-efficient way
Production likely to decline beyond 2020 if no reserves are added inorganically
E&P: HIGHLY VALUE ACCRETIVE BARRELS TO FUND
INORGANIC RESERVE REPLACEMENT
DELIVERING TODAY
TRANSFORMING FOR TOMORROW
11
GAS MIDSTREAM: STABLE, NON-CYCLICAL CASH FLOW
Stable FCF generation in domestic transmission
Profitable international transit business spanning 6 regional countries
Recent years saw significant pipeline and trade infrastructure developments as well
as efficiency improvements
DELIVERING TODAY
TRANSFORMING FOR TOMORROW
European gas market trends (increasing liquidity and interconnectedness) to bring
opportunities and upside

12
MOL 2030 financial framework: existing assets generate sufficient free cash flow to
fund transformational/strategic capex and rising dividends
MOL 2030 works with or without INA; good asset fit, but with declining importance
2017: a year of very strong EBITDA and free cash flow delivery
USD 2.0-2.2bn annual Clean CCS EBITDA under normalized assumptions
Existing assets require around USD 1.0-1.1bn „sustain” capex annually
Simplified FCF (EBITDA less „sustain” capex) comfortably covers all cash outflow
Robust balance sheet with ample financial headroom
Credit metrics to be commensurate with investment grade credit rating
Steadily growing cash dividend per share
ROBUST FINANCIAL FRAMEWORK SUPPORTS
STRATEGIC TRANSFORMATION
DELIVERING TODAY
TRANSFORMING FOR TOMORROW
13
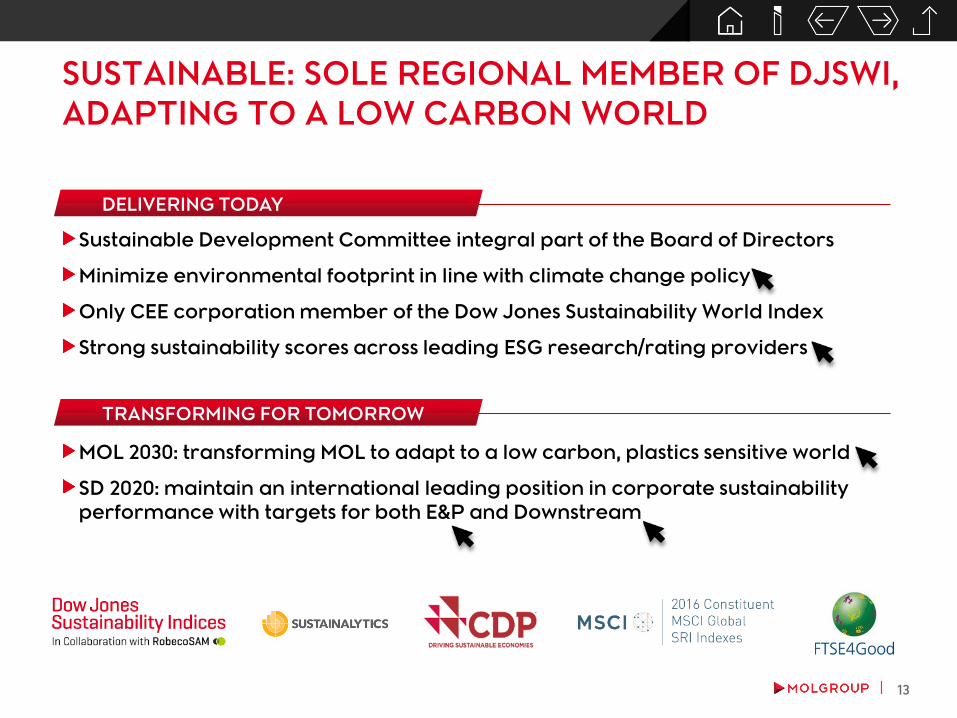
SUSTAINABLE: SOLE REGIONAL MEMBER OF DJSWI,
ADAPTING TO A LOW CARBON WORLD
Sustainable Development Committee integral part of the Board of Directors
Minimize environmental footprint in line with climate change policy
Only CEE corporation member of the Dow Jones Sustainability World Index
Strong sustainability scores across leading ESG research/rating providers
DELIVERING TODAY
TRANSFORMING FOR TOMORROW
MOL 2030: transforming MOL to adapt to a low carbon, plastics sensitive world
SD 2020: maintain an international leading position in corporate sustainability
performance with targets for both E&P and Downstream
14
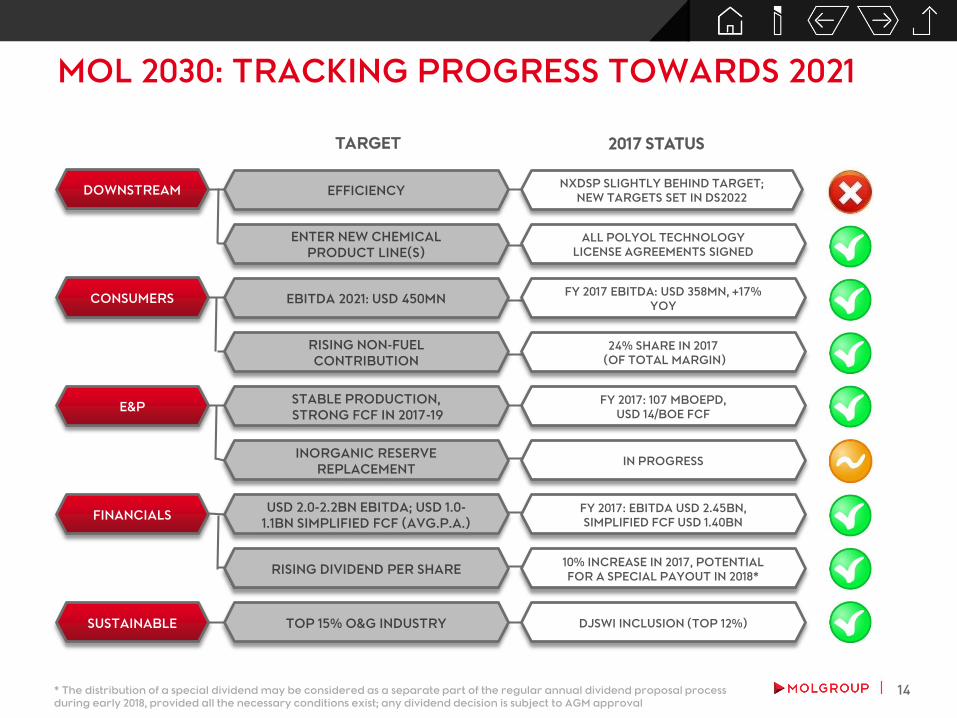
MOL 2030: TRACKING PROGRESS TOWARDS 2021
FINANCIALS
SUSTAINABLE
ENTER NEW CHEMICAL
PRODUCT LINE(S)
USD 2.0-2.2BN EBITDA; USD 1.0-
1.1BN SIMPLIFIED FCF (AVG.P.A.)
TOP 15% O&G INDUSTRY
DOWNSTREAM EFFICIENCY
ALL POLYOL TECHNOLOGY
LICENSE AGREEMENTS SIGNED
FY 2017: EBITDA USD 2.45BN,
SIMPLIFIED FCF USD 1.40BN
DJSWI INCLUSION (TOP 12%)
NXDSP SLIGHTLY BEHIND TARGET;
NEW TARGETS SET IN DS2022
TARGET 2017 STATUS
RISING DIVIDEND PER SHARE10% INCREASE IN 2017, POTENTIAL
FOR A SPECIAL PAYOUT IN 2018*
E&PSTABLE PRODUCTION,
STRONG FCF IN 2017-19
FY 2017: 107 MBOEPD,
USD 14/BOE FCF
INORGANIC RESERVE
REPLACEMENT IN PROGRESS
CONSUMERS EBITDA 2021: USD 450MNFY 2017 EBITDA: USD 358MN, +17%
YOY
RISING NON-FUEL
CONTRIBUTION
24% SHARE IN 2017
(OF TOTAL MARGIN)
* The distribution of a special dividend may be considered as a separate part of the regular annual dividend proposal process
during early 2018, provided all the necessary conditions exist; any dividend decision is subject to AGM approval

DOWNSTREAM
16
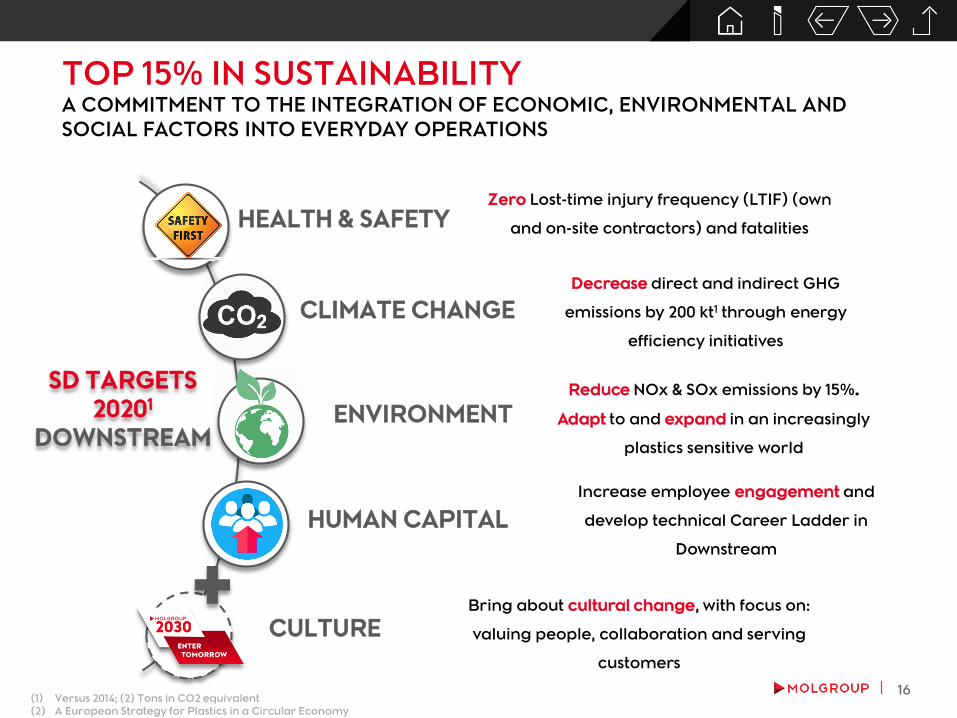
TOP 15% IN SUSTAINABILITYA COMMITMENT TO THE INTEGRATION OF ECONOMIC, ENVIRONMENTAL AND
SOCIAL FACTORS INTO EVERYDAY OPERATIONS
HEALTH & SAFETY
ENVIRONMENT
CLIMATE CHANGE
HUMAN CAPITAL
CULTURE
Zero Lost-time injury frequency (LTIF) (own
and on-site contractors) and fatalities
Decrease direct and indirect GHG
emissions by 200 kt1 through energy
efficiency initiatives
Increase employee engagement and
develop technical Career Ladder in
Downstream
Reduce NOx & SOx emissions by 15%.
Adapt to and expand in an increasingly
plastics sensitive world
Bring about cultural change, with focus on:
valuing people, collaboration and serving
customers
SD TARGETS
20201
DOWNSTREAM
(1) Versus 2014; (2) Tons in CO2 equivalent
(2) A European Strategy for Plastics in a Circular Economy
17
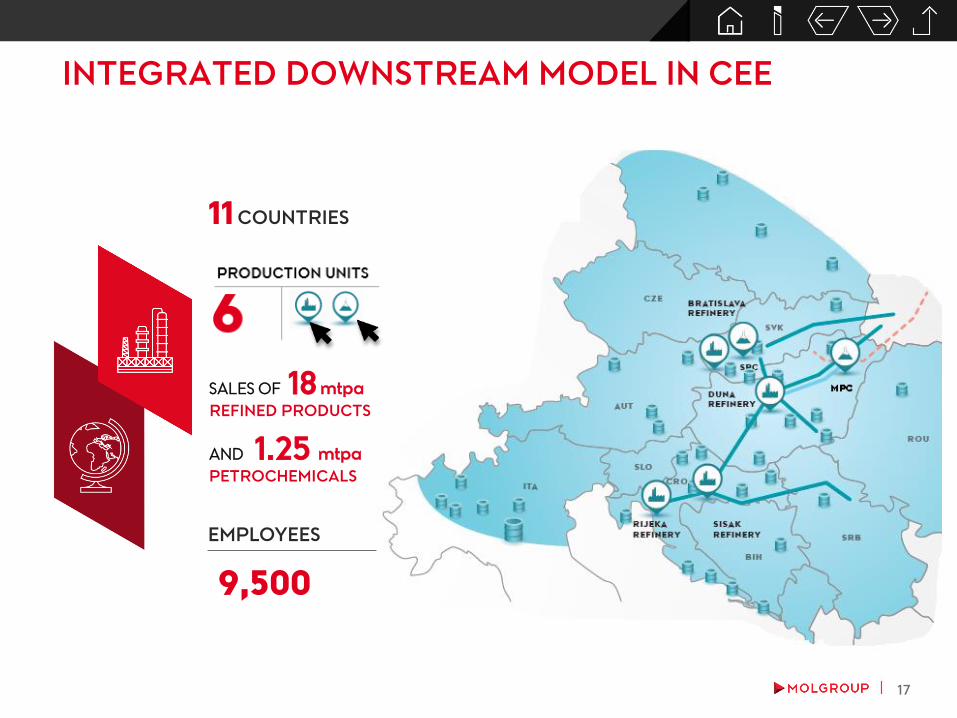
INTEGRATED DOWNSTREAM MODEL IN CEE
11COUNTRIES
SALES OF 18 mtpa
REFINED PRODUCTS
AND 1.25 mtpa
PETROCHEMICALS
9,500
EMPLOYEES

18
0
20
40
60
80
100
120
H12012
H22012
H12013
H22013
H12014
H22014
H12015
H22015
H12016
H22016
H12017
USD
/t
Range MOL Group Average MOL + SN
HIGH QUALITY CORE REFINING ASSETSCOMPLEX REFINERIES WITH VERY HIGH WHITE PRODUCT YIELD
(1) Peer group consists of OMV, PKN, Lotos, Neste, Tupras, Galp, Motor Oil, Hellenic Petroleum, NIS
(2) Unit EBITDA range is based on volume sold and includes ELPE, Lotos, OMV, PKN, Tupras
0
2
4
6
8
10
12
14
16
#1
#2
#3
Bra
tisl
ava
#4
#5
#6
Dan
ub
e#
7#
8#
9#
10
#1
1R
ijeka
#1
2#
13
#1
4#
15
#1
6#
17
#1
8#
19
#2
0#
21
Sisa
k#
22
NC
I
6.1 Mtpa
8.1 Mtpa
4.5 Mtpa2.2 Mtpa
REFINERY NELSON COMPLEXITY OF PEERS1
11.510.6
9.1
6.1
GROUP REFINERY YIELD, 2017 (%)
9.1%
7.7%
6.2%
47.8%
18.8%
7.7%2.7%
Own use & loss
Other products
Fuel oil & bitumen
Middle distillates
Motor gasoline
Naphta
LPG
High complexity provides high motor fuel
yields, including substantial middle
distillate (diesel) output – in line with CEE
market demand…
… and material petchem feedstock,
enhancing integration
CLEAN CCS-BASED DS UNIT EBITDA2 (USD/T)
19
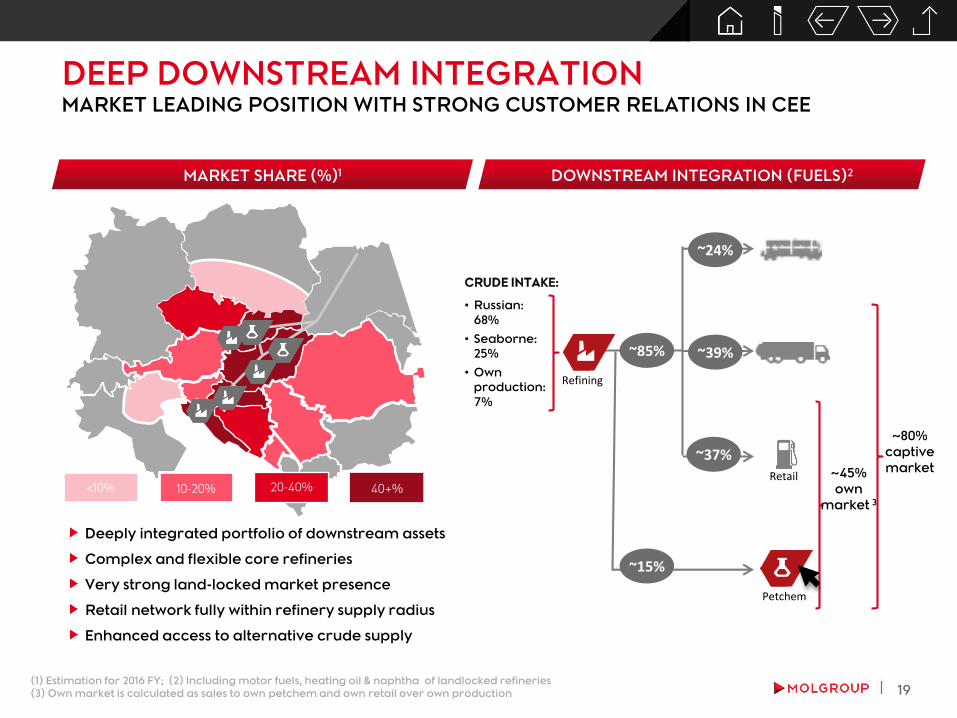
DEEP DOWNSTREAM INTEGRATIONMARKET LEADING POSITION WITH STRONG CUSTOMER RELATIONS IN CEE
MARKET SHARE (%)1 DOWNSTREAM INTEGRATION (FUELS)2
Deeply integrated portfolio of downstream assets
Complex and flexible core refineries
Very strong land-locked market presence
Retail network fully within refinery supply radius
Enhanced access to alternative crude supply
(1) Estimation for 2016 FY; (2) Including motor fuels, heating oil & naphtha of landlocked refineries
(3) Own market is calculated as sales to own petchem and own retail over own production
<10% 10-20% 20-40% 40+%
~15%
~37%
~39%
~24%
~85%
~80%
captive
market~45%
own
market 3
Refining
Petchem
Retail
CRUDE INTAKE:
• Russian:
68%
• Seaborne:
25%
• Own
production:
7%
20
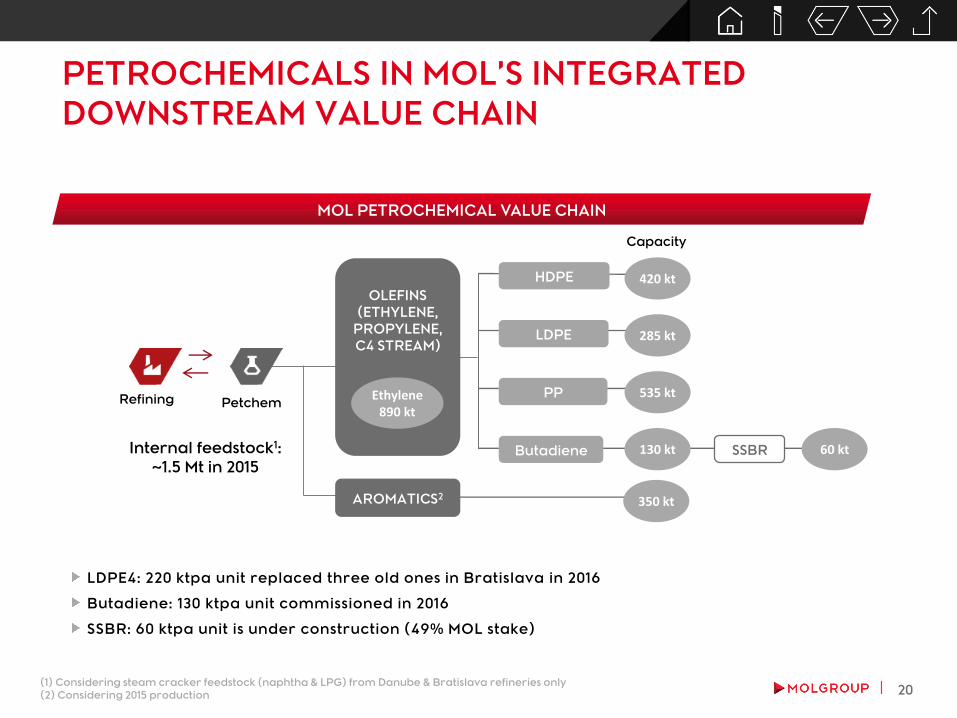
PETROCHEMICALS IN MOL’S INTEGRATED
DOWNSTREAM VALUE CHAIN
MOL PETROCHEMICAL VALUE CHAIN
Refining Petchem535 kt
420 ktHDPE
LDPE
PP
350 kt
Internal feedstock1:
~1.5 Mt in 2015Butadiene SSBR 60 kt
(1) Considering steam cracker feedstock (naphtha & LPG) from Danube & Bratislava refineries only
(2) Considering 2015 production
LDPE4: 220 ktpa unit replaced three old ones in Bratislava in 2016
Butadiene: 130 ktpa unit commissioned in 2016
SSBR: 60 ktpa unit is under construction (49% MOL stake)
OLEFINS
(ETHYLENE,
PROPYLENE,
C4 STREAM)
AROMATICS2
285 kt
130 kt
Capacity
Ethylene890 kt

21
• MOL Group ref.: USD 4.5/bbl
• Petchem: EUR 450/t
• MOL Group
refining:
USD 6.5/bbl
• Petchem:
EUR 504/t
DOWNSTREAM: OUTSTANDING MARGIN CAPTURE CREATES AMPLE HEADROOM TO ABSORB EXTERNAL SHOCKS
6.4
4.1
10.4
R&M
margin
2017
EBITDA
Petchem
margin
10.4
2.4
8.0
Simpl. FCF
4.0
Sustain
CAPEX
Normalized
EBITDA
Macro
normalization
2017 EBITDA
AS-IS: 2017 MARGIN,
EBITDA (USD/BBL)EBITDA, CAPEX AND FCF IN MID-CYCLE MACRO (USD/BBL)
Outstanding margin capture...
FACT SENSITIVITY
...creates sufficient headroom (c. USD 6/bbl) to stay FCF
positive even at the very bottom of the cycle (e.g. at USD
1/bbl ref. margin, EUR 100/t petchem margin)
PUBLISHED MARGINS
SOURCES
OF
FLEXIBILITY
PUBLISHED MARGINS
22
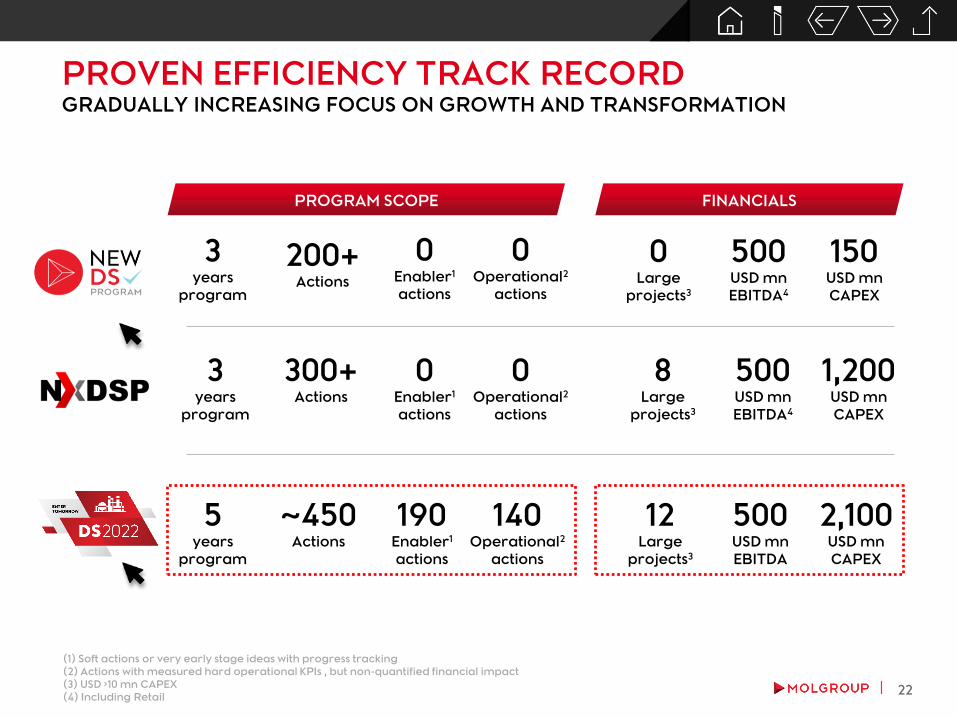
PROVEN EFFICIENCY TRACK RECORDGRADUALLY INCREASING FOCUS ON GROWTH AND TRANSFORMATION
3years
program
5years
program
300+Actions
~450Actions
0Enabler1
actions
190Enabler1
actions
8Large
projects3
12Large
projects3
1,200USD mn
CAPEX
500USD mn
EBITDA4
2,100USD mn
CAPEX
500USD mn
EBITDA
0Operational2
actions
140Operational2
actions
(1) Soft actions or very early stage ideas with progress tracking
(2) Actions with measured hard operational KPIs , but non-quantified financial impact
(3) USD ›10 mn CAPEX
(4) Including Retail
3years
program
200+Actions
0Enabler1
actions
0Operational2
actions
0Large
projects3
150USD mn
CAPEX
500USD mn
EBITDA4
PROGRAM SCOPE FINANCIALS
23
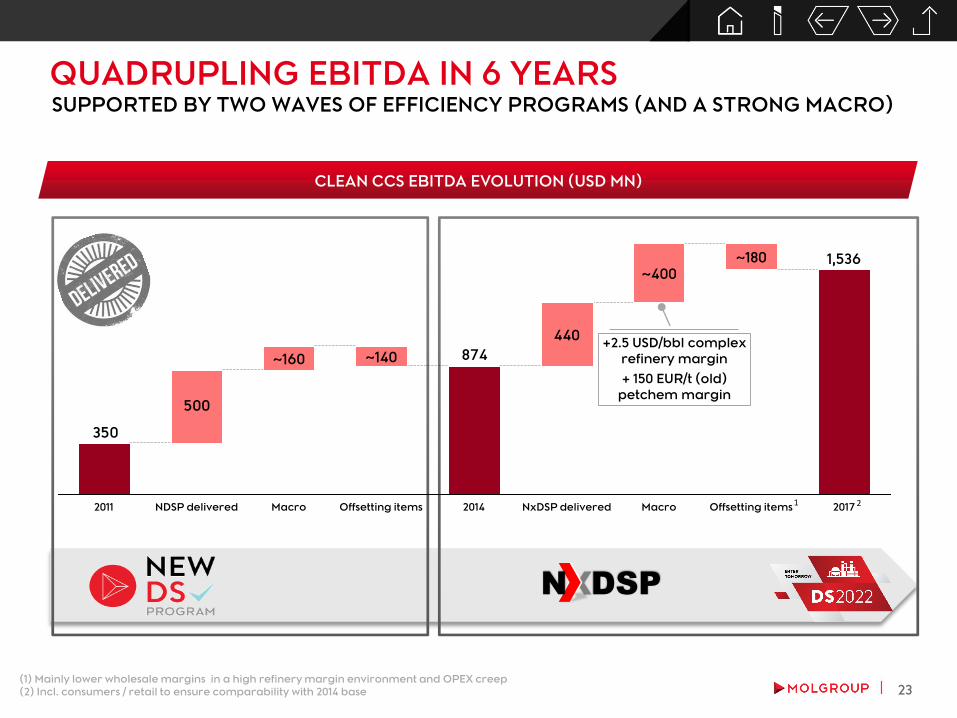
QUADRUPLING EBITDA IN 6 YEARSSUPPORTED BY TWO WAVES OF EFFICIENCY PROGRAMS (AND A STRONG MACRO)
CLEAN CCS EBITDA EVOLUTION (USD MN)
DSPN
874
500
350
1,536
Offsetting items
~180
Macro
~400
NxDSP deliveredNDSP delivered2011 2017Offsetting items
440
2014Macro
~160 ~140
2
(1) Mainly lower wholesale margins in a high refinery margin environment and OPEX creep
(2) Incl. consumers / retail to ensure comparability with 2014 base
+2.5 USD/bbl complex
refinery margin
+ 150 EUR/t (old)
petchem margin
1

24
MOL 2030
TRANSFORMING TO „BEYOND THE FUEL AGE”FOSSIL FUEL DOMINANCE TO DIMINISH BY 2030, BUT DEMAND STILL SUBSTANTIAL
Fossil fuel demand likely to decline by
2030, but will still remain material
Alternative fuels and (petro)chemical
markets likely to grow
Increasing demand for sustainable
plastics solutions
TRANSFORM…
ASSUMPTIONS
…FUEL TO CHEMICALS
Increase share of non-motor
fuel products
Extend the chemicals value
chain
Integration of plastics recycling
…RETAIL TO CONSUMER SERVICES
To provide a broad range of
products and services for
people „on the move”
CHEMICALS
AIR TRANSPORT
TRUCKS
PASSENGER CARS
OIL-BASED FUEL
CONSUMPTION
25
Motor fuel products
GROUP REFINERIES’ YIELD
2010 2015 2030
50+%
~60% ~70%
~50%
Benefit from
profitable products
(jet, base oils, LPG)
Increase petchem
feedstock up to
3 mtpa
Increase
production of other
chemicals (e.g.
aromatics)
1
2
3
First round of
actions defined in
DS2022 program
STRATEGIC PRIORITIES ACTIONS
50% VALUABLE NON-FUEL PRODUCTION BY 2030TRANSFORMATION AWAY FROM MOTOR FUELS
Valuable non-motor
fuel products
Others
26
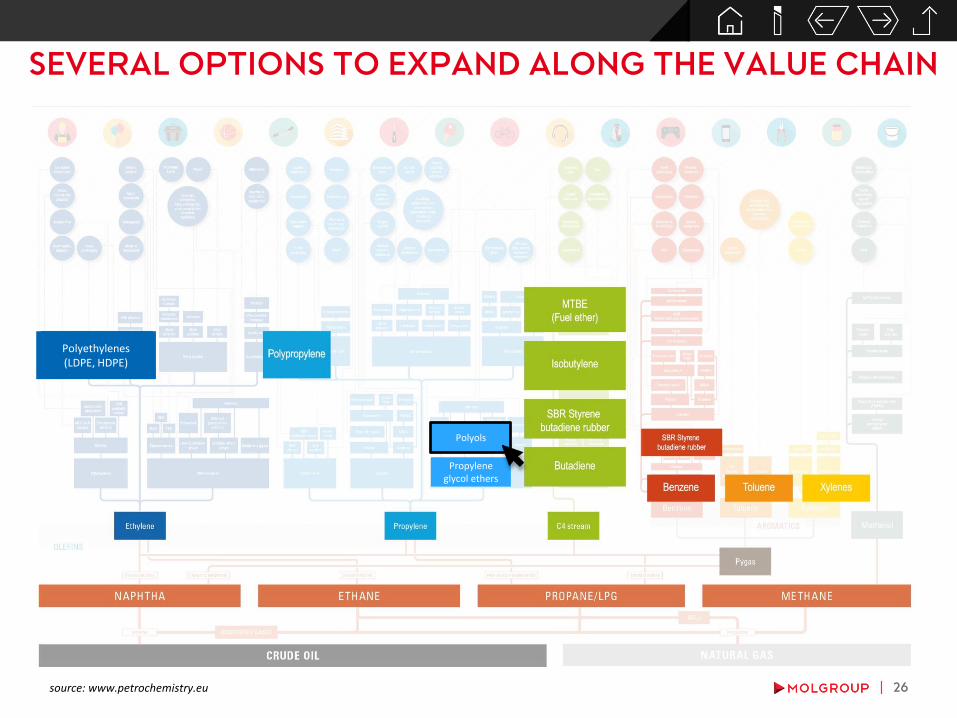
SEVERAL OPTIONS TO EXPAND ALONG THE VALUE CHAIN
source: www.petrochemistry.eu
Polyethylenes(LDPE, HDPE)
Polyols
Propylene glycol ethers
27
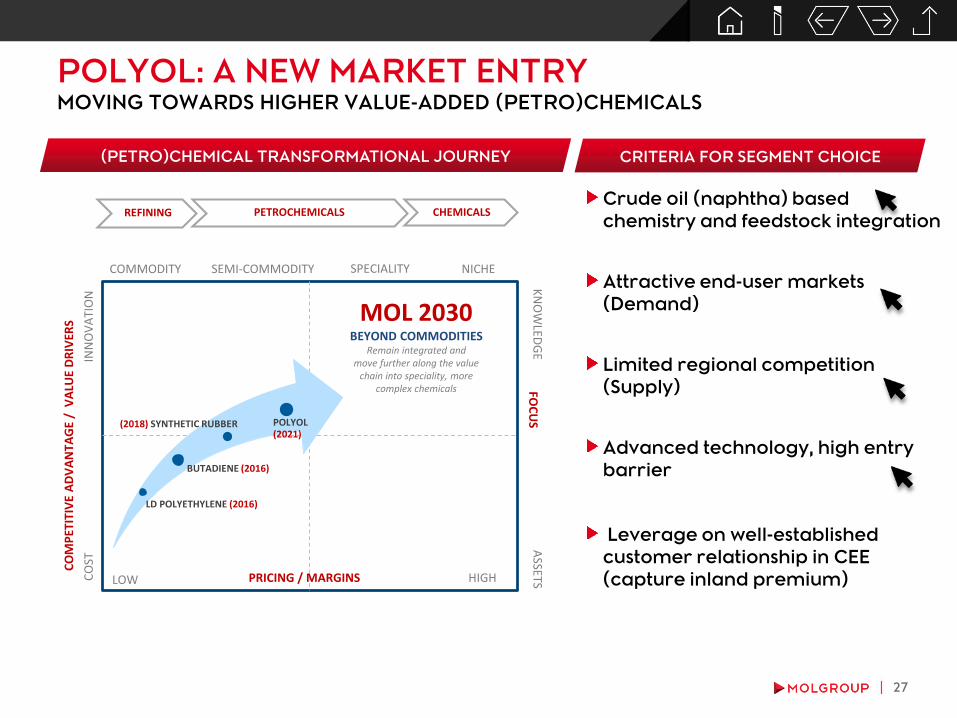
MOVING TOWARDS HIGHER VALUE-ADDED (PETRO)CHEMICALS
POLYOL: A NEW MARKET ENTRY
(PETRO)CHEMICAL TRANSFORMATIONAL JOURNEY CRITERIA FOR SEGMENT CHOICE
CO
ST
HIGHLOW
INN
OV
ATI
ON
LD POLYETHYLENE (2016)
BUTADIENE (2016)
(2018) SYNTHETIC RUBBER POLYOL (2021)
FOC
US
CO
MP
ETIT
IVE
AD
VA
NTA
GE
/ V
ALU
E D
RIV
ERS
PRICING / MARGINS
MOL 2030BEYOND COMMODITIES
Remain integrated and move further along the value
chain into speciality, more complex chemicals
ASSETS
KN
OW
LEDG
E
REFINING PETROCHEMICALS CHEMICALS
NICHECOMMODITY SPECIALITYSEMI-COMMODITY
Crude oil (naphtha) based
chemistry and feedstock integration
Attractive end-user markets
(Demand)
Limited regional competition
(Supply)
Advanced technology, high entry
barrier
Leverage on well-established
customer relationship in CEE
(capture inland premium)

28
NAPHTHA-BASED PROPYLENE CHEMISTRY
SPECIALISATIONDIVERSIFICATION
organic development
MOL GROUP
current coverage
naphtha
benzene
propylene
toluene
nitro-
benzene
propylene
-oxide
nitro-
toluene
MDI/PMDI
polyols
TDI
Polyurethanes
(PUR)
REFININGOLEFIN
PRODUCERSCHEMICAL COMPANIES
PUR FORMULATORS
„SYSTEM HOUSES”
(R&D, technical
service, some
production)
END-
USERS
Petchem feedstock Basic chemicals Intermediates / pre-polymers Polymers
ENTERING THE POLYURETHANES VALUE CHAIN
29
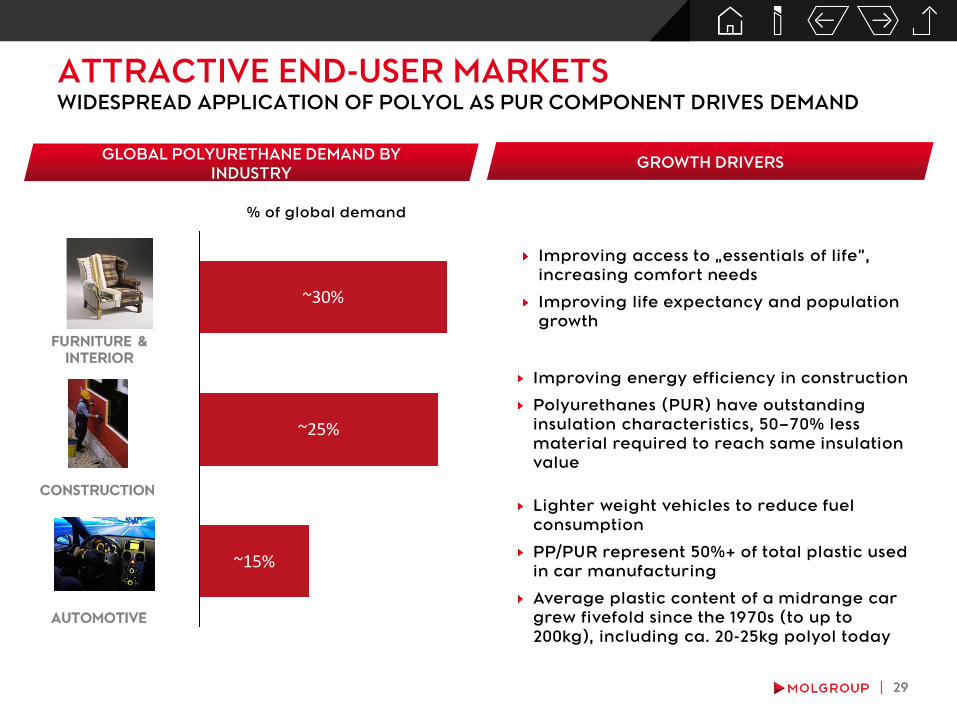
ATTRACTIVE END-USER MARKETS
AUTOMOTIVE
FURNITURE &
INTERIOR
GLOBAL POLYURETHANE DEMAND BY
INDUSTRY
CONSTRUCTION
GROWTH DRIVERS
Improving access to „essentials of life”,
increasing comfort needs
Improving life expectancy and population
growth
% of global demand
~25%
~15%
~30%
Improving energy efficiency in construction
Polyurethanes (PUR) have outstanding
insulation characteristics, 50–70% less
material required to reach same insulation
value
Lighter weight vehicles to reduce fuel
consumption
PP/PUR represent 50%+ of total plastic used
in car manufacturing
Average plastic content of a midrange car
grew fivefold since the 1970s (to up to
200kg), including ca. 20-25kg polyol today
WIDESPREAD APPLICATION OF POLYOL AS PUR COMPONENT DRIVES DEMAND
30
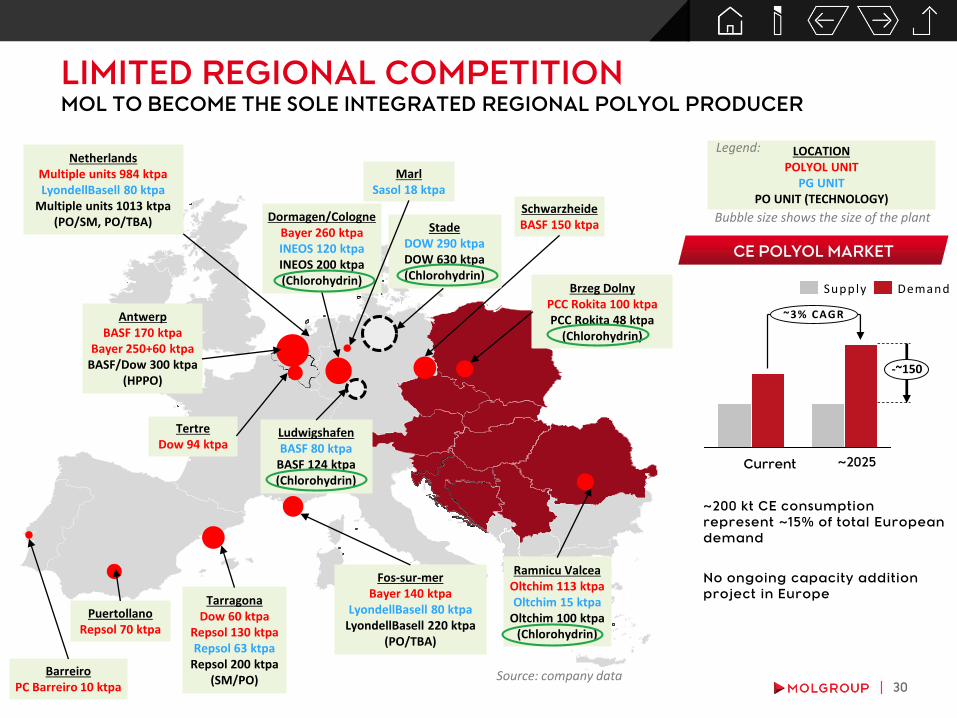
LIMITED REGIONAL COMPETITIONMOL TO BECOME THE SOLE INTEGRATED REGIONAL POLYOL PRODUCER
AntwerpBASF 170 ktpa
Bayer 250+60 ktpaBASF/Dow 300 ktpa
(HPPO)
TertreDow 94 ktpa
Fos-sur-merBayer 140 ktpa
LyondellBasell 80 ktpaLyondellBasell 220 ktpa
(PO/TBA)
SchwarzheideBASF 150 ktpa
Dormagen/CologneBayer 260 ktpaINEOS 120 ktpaINEOS 200 ktpa(Chlorohydrin)
TarragonaDow 60 ktpa
Repsol 130 ktpaRepsol 63 ktpa
Repsol 200 ktpa(SM/PO)
PuertollanoRepsol 70 ktpa
Brzeg DolnyPCC Rokita 100 ktpaPCC Rokita 48 ktpa
(Chlorohydrin)
Ramnicu ValceaOltchim 113 ktpaOltchim 15 ktpa
Oltchim 100 ktpa(Chlorohydrin)
BarreiroPC Barreiro 10 ktpa
LudwigshafenBASF 80 ktpa
BASF 124 ktpa(Chlorohydrin)
StadeDOW 290 ktpaDOW 630 ktpa(Chlorohydrin)
Bubble size shows the size of the plant
NetherlandsMultiple units 984 ktpaLyondellBasell 80 ktpa
Multiple units 1013 ktpa (PO/SM, PO/TBA)
LOCATIONPOLYOL UNIT
PG UNITPO UNIT (TECHNOLOGY)
Legend:
MarlSasol 18 ktpa
-~150
~3% CAGR
DemandSupply
Current ~2025
CE POLYOL MARKET
~200 kt CE consumption
represent ~15% of total European
demand
No ongoing capacity addition
project in Europe
Source: company data
31
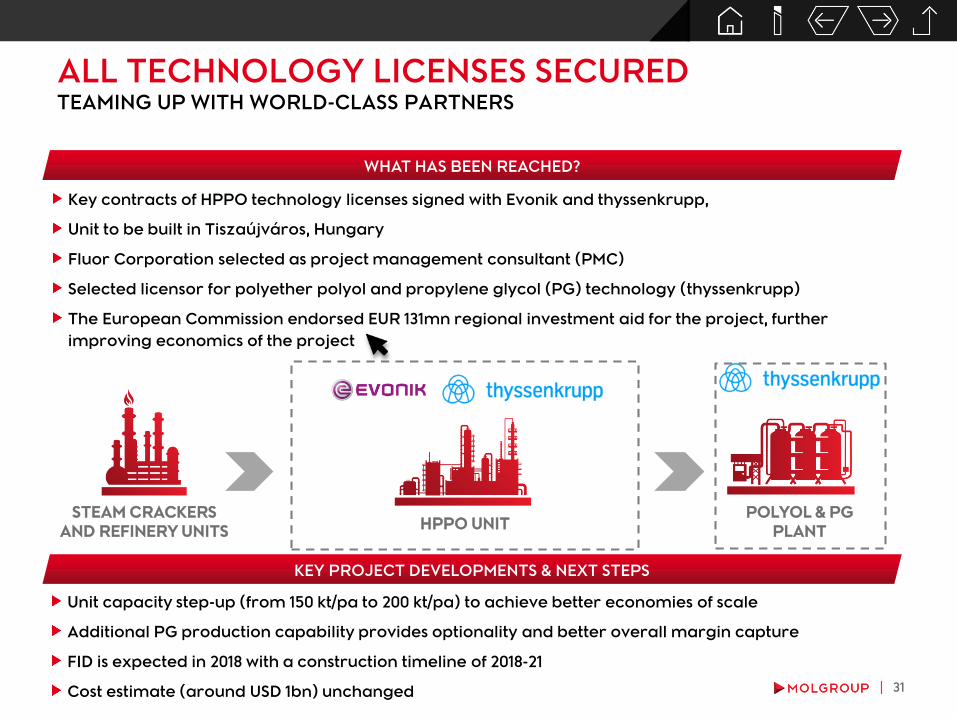
TEAMING UP WITH WORLD-CLASS PARTNERS
Key contracts of HPPO technology licenses signed with Evonik and thyssenkrupp,
Unit to be built in Tiszaújváros, Hungary
Fluor Corporation selected as project management consultant (PMC)
Selected licensor for polyether polyol and propylene glycol (PG) technology (thyssenkrupp)
The European Commission endorsed EUR 131mn regional investment aid for the project, further
improving economics of the project
WHAT HAS BEEN REACHED?
KEY PROJECT DEVELOPMENTS & NEXT STEPS
Unit capacity step-up (from 150 kt/pa to 200 kt/pa) to achieve better economies of scale
Additional PG production capability provides optionality and better overall margin capture
FID is expected in 2018 with a construction timeline of 2018-21
Cost estimate (around USD 1bn) unchanged
STEAM CRACKERS
AND REFINERY UNITS
POLYOL & PG
PLANTHPPO UNIT
ALL TECHNOLOGY LICENSES SECURED
32
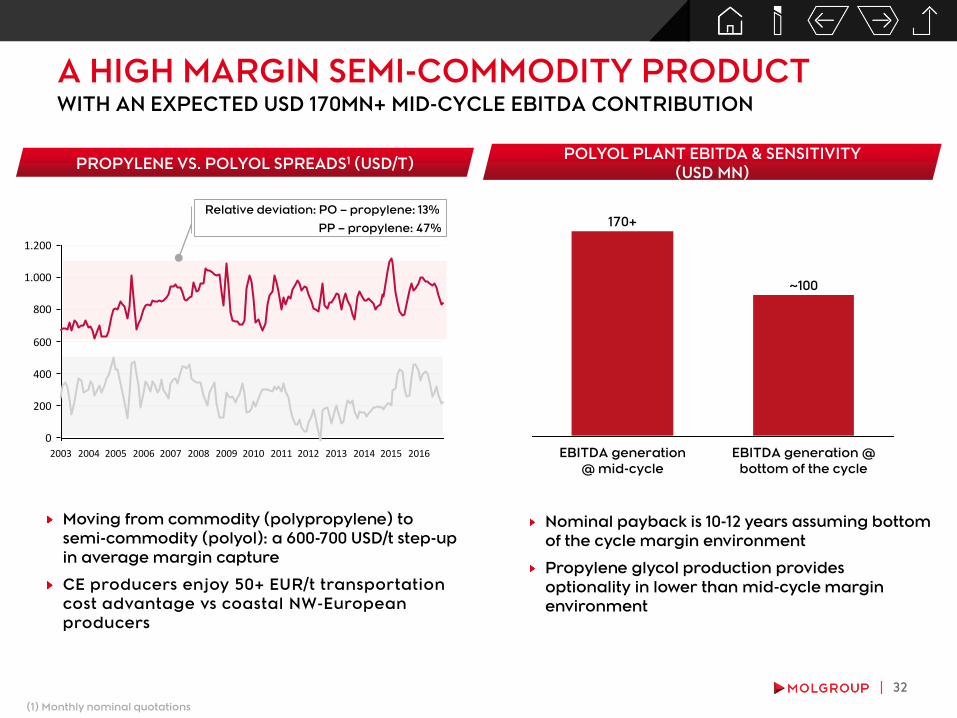
A HIGH MARGIN SEMI-COMMODITY PRODUCT
PROPYLENE VS. POLYOL SPREADS1 (USD/T)
WITH AN EXPECTED USD 170MN+ MID-CYCLE EBITDA CONTRIBUTION
Moving from commodity (polypropylene) to
semi-commodity (polyol): a 600-700 USD/t step-up
in average margin capture
CE producers enjoy 50+ EUR/t transportation
cost advantage vs coastal NW-European
producers
(1) Monthly nominal quotations
600
400
200
0
1.200
1.000
800
2015201420132009 2010 2011 20122003 2004 2005 2006 2007 2008 2016
Relative deviation: PO – propylene: 13%
PP – propylene: 47%
POLYOL PLANT EBITDA & SENSITIVITY
(USD MN)
Nominal payback is 10-12 years assuming bottom
of the cycle margin environment
Propylene glycol production provides
optionality in lower than mid-cycle margin
environment
EBITDA generation
@ mid-cycle
170+
EBITDA generation @
bottom of the cycle
~100
33
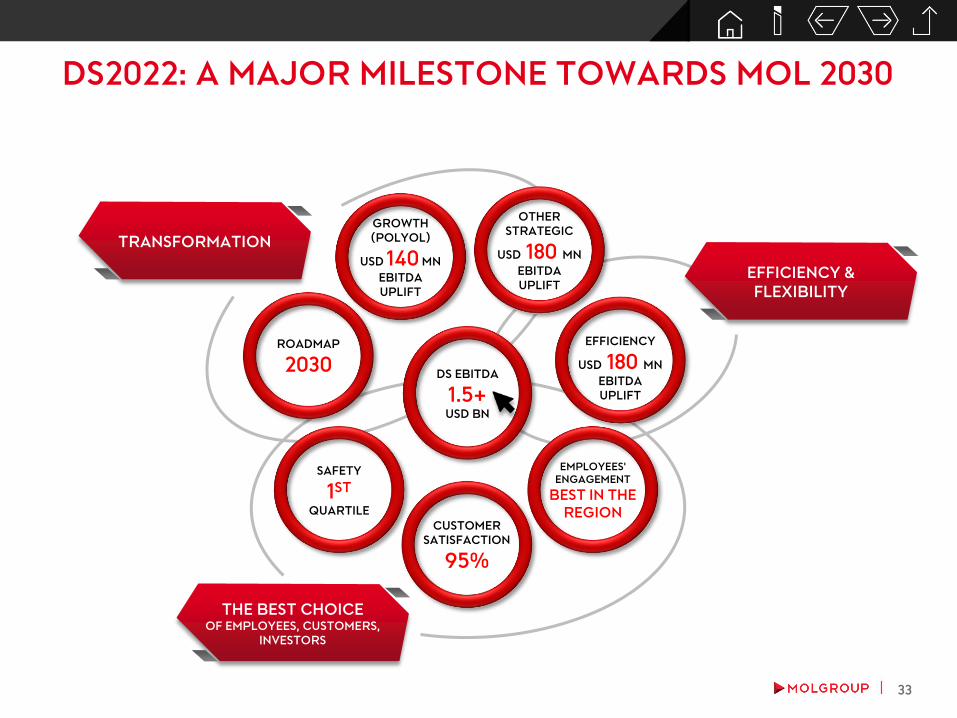
DS2022: A MAJOR MILESTONE TOWARDS MOL 2030
EMPLOYEES'
ENGAGEMENT
BEST IN THE
REGION
DS EBITDA
1.5+USD BN
OTHER
STRATEGIC
USD 180 MN
EBITDA
UPLIFT
ROADMAP
2030
EFFICIENCY &
FLEXIBILITY
THE BEST CHOICE OF EMPLOYEES, CUSTOMERS,
INVESTORS
GROWTH
(POLYOL)
USD 140 MN
EBITDA
UPLIFT
SAFETY
1ST
QUARTILE
EFFICIENCY
USD 180 MN
EBITDA
UPLIFT
TRANSFORMATION
CUSTOMER
SATISFACTION
95%

34
USD 500MN INCREMENTAL EBITDA BY 2022FROM TRANSFORMATIONAL PROJECTS AND EFFICIENCY (USD 2.1BN TOTAL CAPEX)
INCREMENTAL EBITDA CONTRIBUTION (USD MN) CAPEX SPENDING (USD MN)
Polyol plant will reach full capacity in 2023 with an estimated USD 170mn yearly EBITDA contribution
Other strategic projects
Include INA Delayed Coker, which accounts for 50%+ of capex
Steam crackers debottlenecking projects are in early phase of discussion, hence not included yet in
DS2022. These projects may add to DS2022 scope in the coming years.
Efficiency: Partly reversing the effect of offsetting items seen in 2016-17; targeting improvement in asset
availability and market position and strong focus on energy efficiency
DS2022 aims for continuation of superior margin delivery, which fully offsets macro normalization
2022
135
Total
180
500
140
180
2021
175
2020
40
2019
50
2018
100
Efficiency
Growth (Polyol)
Other strategic
25
2022
2,100
900
180
Total2021
1,020
170
2020
690
2019
830
2018
270
2017
115
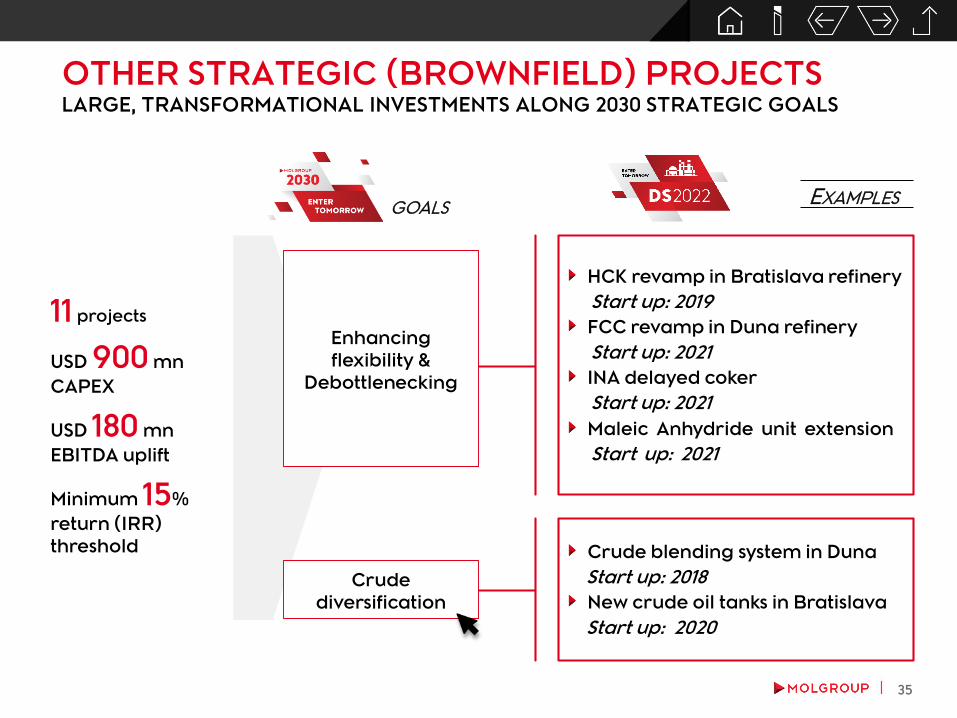
35
11 projects
USD 900 mn
CAPEX
USD 180 mn
EBITDA uplift
Minimum 15%
return (IRR)
threshold Crude blending system in Duna
Start up: 2018
New crude oil tanks in Bratislava
Start up: 2020
Crude
diversification
GOALSEXAMPLES
HCK revamp in Bratislava refinery
Start up: 2019
FCC revamp in Duna refinery
Start up: 2021
INA delayed coker
Start up: 2021
Maleic Anhydride unit extension
Start up: 2021
Enhancing
flexibility &
Debottlenecking
LARGE, TRANSFORMATIONAL INVESTMENTS ALONG 2030 STRATEGIC GOALS
OTHER STRATEGIC (BROWNFIELD) PROJECTS
36
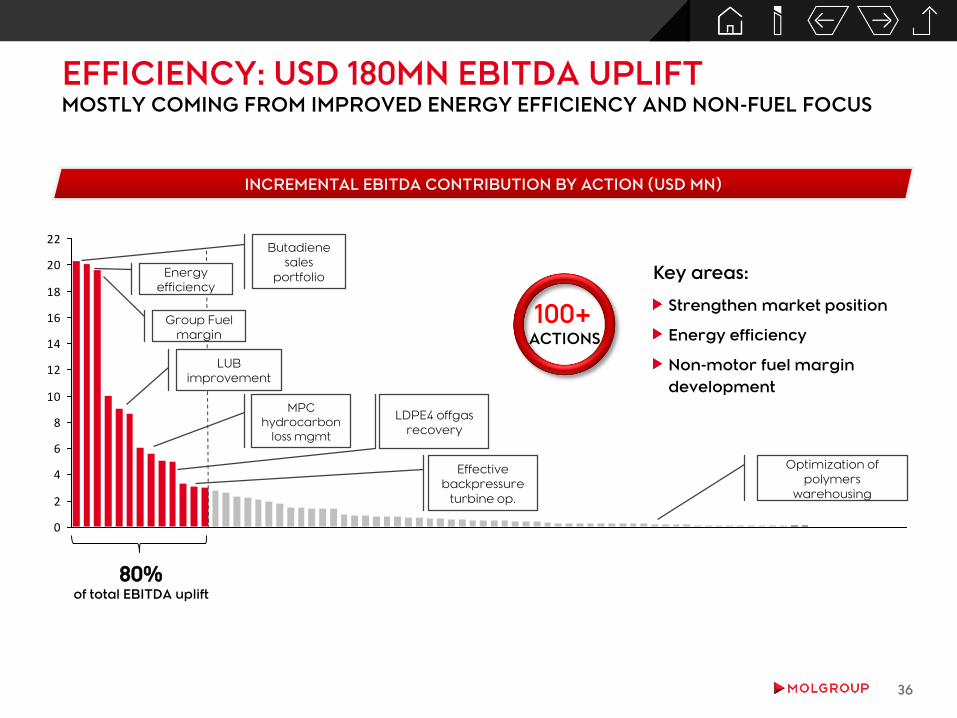
0
2
4
6
8
10
12
14
16
18
20
22
Key areas:
Strengthen market position
Energy efficiency
Non-motor fuel margin
development
80%of total EBITDA uplift
INCREMENTAL EBITDA CONTRIBUTION BY ACTION (USD MN)
Energy
efficiency
Butadiene
sales
portfolio
LUB
improvement
Optimization of
polymers
warehousing
Group Fuel
margin
100+ACTIONS
MPC
hydrocarbon
loss mgmt
LDPE4 offgas
recovery
Effective
backpressure
turbine op.
MOSTLY COMING FROM IMPROVED ENERGY EFFICIENCY AND NON-FUEL FOCUS
EFFICIENCY: USD 180MN EBITDA UPLIFT

37
CRUDE DIVERSIFICATION
ADRIATIC PIPELINE ACCESS ESTABLISHED
ENHANCING FEEDSTOCK FLEXIBILITY
Majority of the crude intake remains Ural, however, the number
of tested crudes in the complex refineries is on the rise
Targeting further increasing seaborne crude oil supply to 33%
with widening crude basket to reach 50 types by 2021
Following the successful rehabilitation and expansion of the
Friendship 1 pipeline, seaborne crude oil delivery to Slovnaft was
launched in 2016
Opportunistic approach based on continuous optimization -
capturing benefits of fluctuating crude spreads
38
15 17
25~25
2012 2013 2014 2015 2016 2017 2018E
Increased
pipeline
capacity:
6Mtpa = SN
Increased
pipeline capacity:
14Mtpa = MOL+SN
Number of purchased cargos* through
Adria pipeline for landlocked refineries
* One cargo is equivalent of 80kt crude; (1) Group level, including INA
TARGETING 33% SEABORNE SUPPLY BY 2021
CRUDE DIVERSIFICATION1
2017 2021
25%
75%
Seaborne
33%
REB
2011
97%
3%

CONSUMER
SERVICES
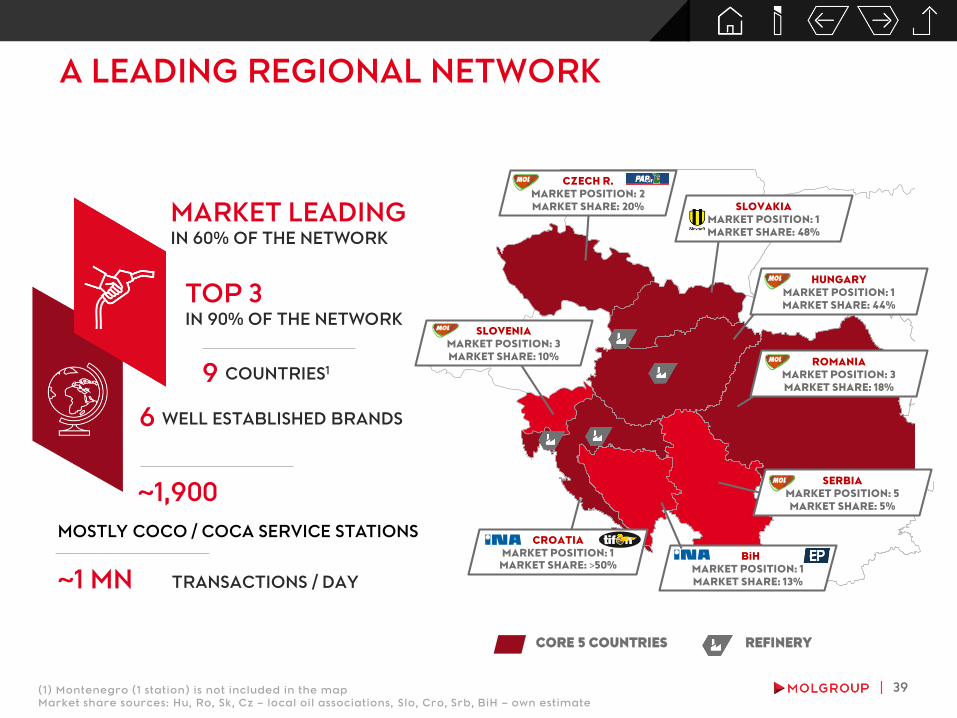
39
A LEADING REGIONAL NETWORK
MARKET LEADING IN 60% OF THE NETWORK
CORE 5 COUNTRIES REFINERY
TOP 3IN 90% OF THE NETWORK
CZECH R.
MARKET POSITION: 2
MARKET SHARE: 20% SLOVAKIA
MARKET POSITION: 1
MARKET SHARE: 48%
BiH
MARKET POSITION: 1
MARKET SHARE: 13%
CROATIA
MARKET POSITION: 1
MARKET SHARE: >50%
SLOVENIA
MARKET POSITION: 3
MARKET SHARE: 10%
~1,900
WELL ESTABLISHED BRANDS
COUNTRIES1
MOSTLY COCO / COCA SERVICE STATIONS
6
9
(1) Montenegro (1 station) is not included in the map
Market share sources: Hu, Ro, Sk, Cz – local oil associations, Slo, Cro, Srb, BiH – own estimate
HUNGARY
MARKET POSITION: 1
MARKET SHARE: 44%
ROMANIA
MARKET POSITION: 3
MARKET SHARE: 18%
SERBIA
MARKET POSITION: 5
MARKET SHARE: 5%
~1 MN TRANSACTIONS / DAY

40
20212016
Exploiting the fuel potential: growing
fuel sales and taking advantage of
market upside throughout the CEE
Non-fuel increasingly a growth
driver: Optimize/customize store
format and improve services
through non-fuel concept roll-out
Go online and digital: for a
personalized and convenient
customer experience
Beyond non-fuel: Create new
mobility services platform including
e-mobility, car-sharing, fleet
management
2021 STRATEGIC PRIORITIESEXPLOIT POTENTIAL IN FUEL, ACCELERATE SHIFT TOWARDS NON-FUEL
MARGIN DEVELOPMENT
Non-fuel FuelNew services
2
3
1
GROWTH STRATEGY TO 2021
1
32
4
4
EBITDA to increase to USD 450mn by 2021

41
EXPLOITING THE FUEL POTENTIALFUEL SALES ON THE RISE MOSTLY DRIVEN BY RISING CEE FUEL CONSUMPTION
Fuel remains the main EBITDA contributor
providing 75% of total gross margin
Rising fuel consumption and constantly
optimized network drive rise in throughput
Fleet card sales a massive captive customer
base in CEE and a good base for the
consumer services transformation
COMMENTS
CEE1 MOTOR FUEL DEMAND (2008 = 100%) FUEL THROUGHPUT PER SITE (MN L/SITE)
0.98
0.96
1.00
0.94
1.06
1.04
1.08
1.02
0.84
0.88
0.86
0.92
0.90
2009 2011
+17%
2017 YTD
20162012 2013 2014 20152008 2010 2017
2.84
2.52
20152013
3.03
+20%
FLEET CARD SALES vs TOTAL (2017, %)
3230
25
30
44
GroupRomaniaHungary CroatiaSlovakia
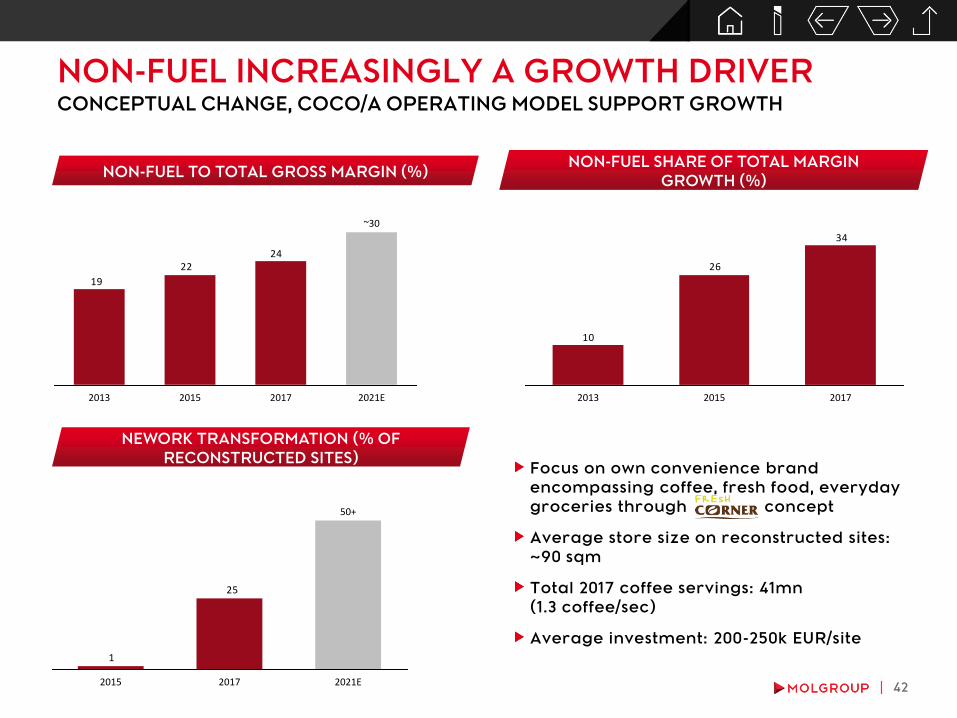
42
NON-FUEL INCREASINGLY A GROWTH DRIVERCONCEPTUAL CHANGE, COCO/A OPERATING MODEL SUPPORT GROWTH
NEWORK TRANSFORMATION (% OF
RECONSTRUCTED SITES)
NON-FUEL TO TOTAL GROSS MARGIN (%)
Focus on own convenience brand
encompassing coffee, fresh food, everyday
groceries through concept
Average store size on reconstructed sites:
~90 sqm
Total 2017 coffee servings: 41mn
(1.3 coffee/sec)
Average investment: 200-250k EUR/site
NON-FUEL SHARE OF TOTAL MARGIN
GROWTH (%)
26
10
34
201720152013
24 22
19
2021E
~30
201720152013
25
1
2015
50+
2017 2021E
43
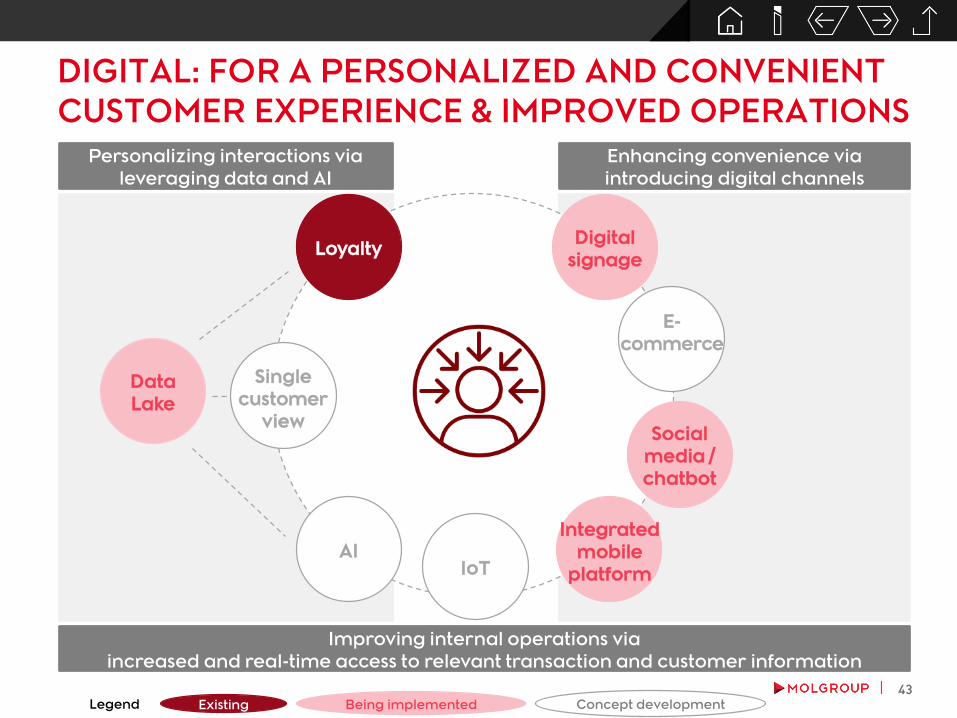
DIGITAL: FOR A PERSONALIZED AND CONVENIENT
CUSTOMER EXPERIENCE & IMPROVED OPERATIONS
Existing Being implemented Concept development
Digital
signage
AI
Loyalty
IoT
Social
media /
chatbot
Data
Lake
Enhancing convenience via
introducing digital channels
Personalizing interactions via
leveraging data and AI
E-
commerce
Integrated
mobile
platform
Single
customer
view
Legend
Improving internal operations via
increased and real-time access to relevant transaction and customer information

44
BEYOND NON-FUEL: MOBILITY SERVICES
Fleet
managementE-mobility
Car
sharingLeading
mobility
solutions
BUILDING BLOCKS OF DEVELOPING MOBILITY SOLUTIONS
Scalable CAPEX in mobility
related activities, below EUR
100mn by 2021
EBITDA break-even targeted
within 2 years following
concept roll-out
MOL LIMO: Innovative car-
sharing platform in Budapest
launched in Jan 2018 with 300
(o/w 100 EV) cars
10k+ users in first two weeks
MOL is part of a
45% EU funded
consortium aiming
at installing 250+ EV
chargers in the CEE
Own fleet management
platform commissioned in
H2 2017 with ~1000 cars
45
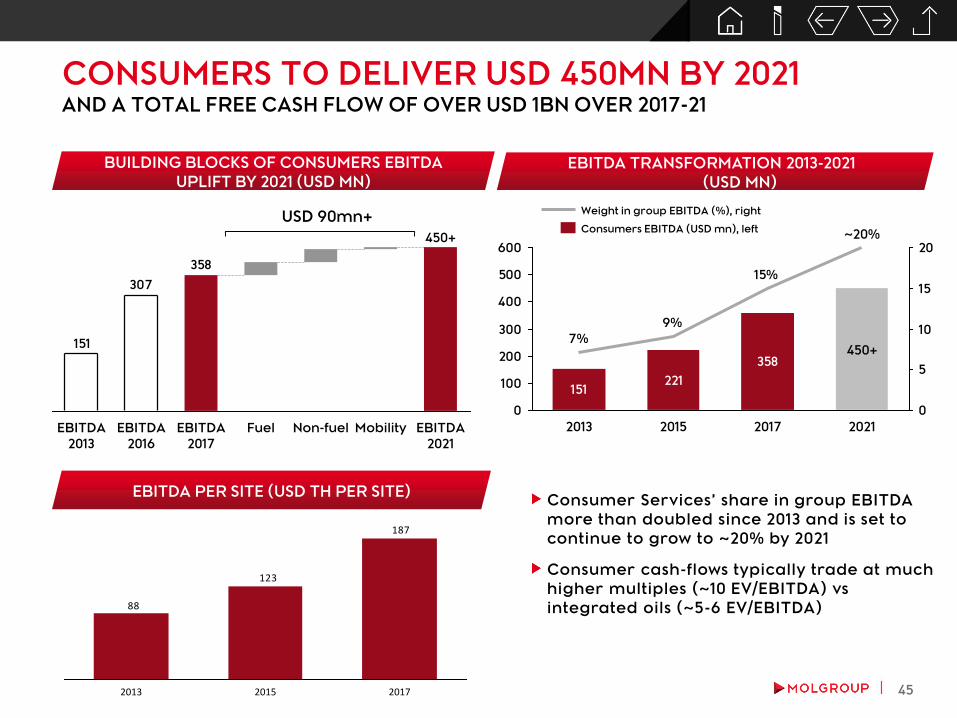
CONSUMERS TO DELIVER USD 450MN BY 2021AND A TOTAL FREE CASH FLOW OF OVER USD 1BN OVER 2017-21
BUILDING BLOCKS OF CONSUMERS EBITDA
UPLIFT BY 2021 (USD MN)
358
307
151
EBITDA
2021
450+
MobilityNon-fuelFuelEBITDA
2017
EBITDA
2016
EBITDA
2013
USD 90mn+
151221
358
15%
9%
7%
0
100
200
300
400
500
600
0
5
10
15
20
2021
450+
~20%
201720152013
EBITDA TRANSFORMATION 2013-2021
(USD MN)
Consumers EBITDA (USD mn), left
Weight in group EBITDA (%), right
EBITDA PER SITE (USD TH PER SITE)
187
123
88
201720152013
Consumer Services’ share in group EBITDA
more than doubled since 2013 and is set to
continue to grow to ~20% by 2021
Consumer cash-flows typically trade at much
higher multiples (~10 EV/EBITDA) vs
integrated oils (~5-6 EV/EBITDA)
EXPLORATION
AND PRODUCTION
47
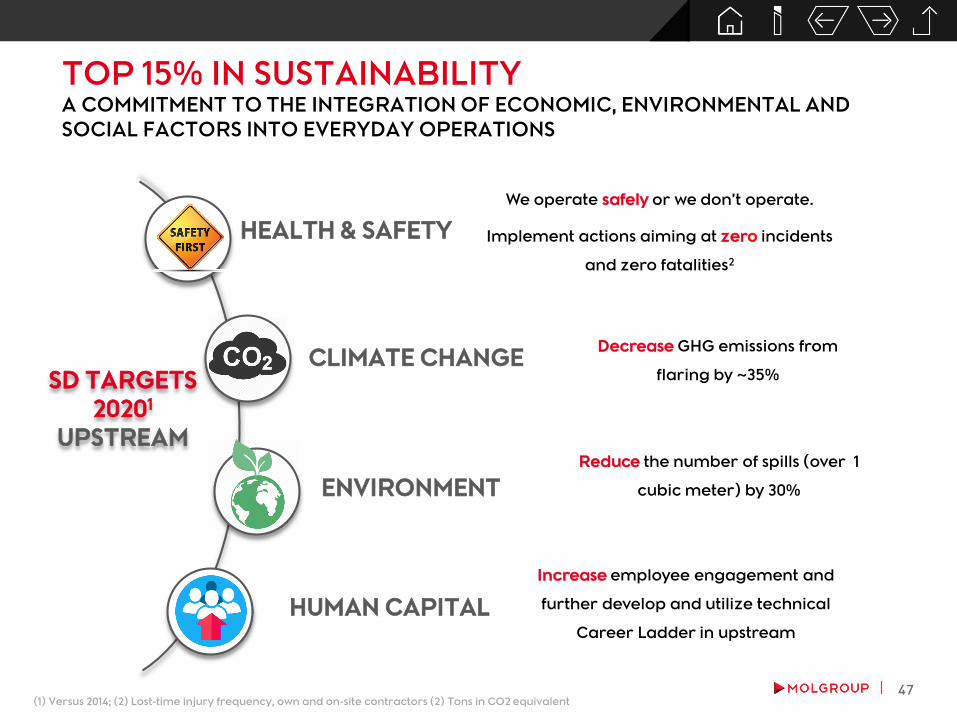
TOP 15% IN SUSTAINABILITYA COMMITMENT TO THE INTEGRATION OF ECONOMIC, ENVIRONMENTAL AND
SOCIAL FACTORS INTO EVERYDAY OPERATIONS
HEALTH & SAFETY
ENVIRONMENT
CLIMATE CHANGE
HUMAN CAPITAL
We operate safely or we don’t operate.
Implement actions aiming at zero incidents
and zero fatalities2
SD TARGETS
20201
UPSTREAM
(1) Versus 2014; (2) Lost-time injury frequency, own and on-site contractors (2) Tons in CO2 equivalent
Reduce the number of spills (over 1
cubic meter) by 30%
Decrease GHG emissions from
flaring by ~35%
Increase employee engagement and
further develop and utilize technical
Career Ladder in upstream
48
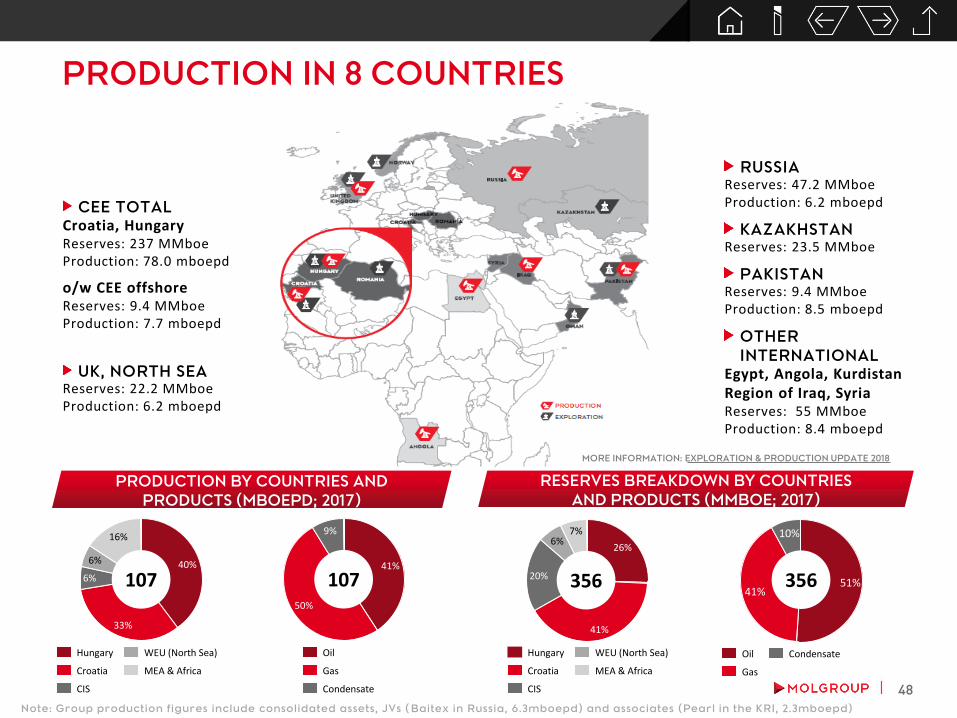
PRODUCTION IN 8 COUNTRIES
CEE TOTAL
Croatia, HungaryReserves: 237 MMboeProduction: 78.0 mboepd
o/w CEE offshoreReserves: 9.4 MMboeProduction: 7.7 mboepd
UK, NORTH SEAReserves: 22.2 MMboeProduction: 6.2 mboepd
RUSSIAReserves: 47.2 MMboeProduction: 6.2 mboepd
KAZAKHSTANReserves: 23.5 MMboe
PAKISTANReserves: 9.4 MMboeProduction: 8.5 mboepd
OTHER
INTERNATIONAL
Egypt, Angola, Kurdistan Region of Iraq, SyriaReserves: 55 MMboeProduction: 8.4 mboepd
PRODUCTION BY COUNTRIES AND
PRODUCTS (MBOEPD; 2017)
RESERVES BREAKDOWN BY COUNTRIES
AND PRODUCTS (MMBOE; 2017)
9%
50%
41%
Condensate
Gas
Oil
33%
40%
6%
6%
16%
MEA & Africa
WEU (North Sea)
CIS
Croatia
Hungary
10%
41%51%
Condensate
Gas
Oil
26%
20%
6%
41%
7%
107 107 356 356
MEA & Africa
CIS
WEU (North Sea)
Croatia
Hungary
Note: Group production figures include consolidated assets, JVs ( Baitex in Russia, 6.3mboepd) and associates (Pearl in the KRI, 2.3mboepd)
MORE INFORMATION: EXPLORATION & PRODUCTION UPDATE 2018
49
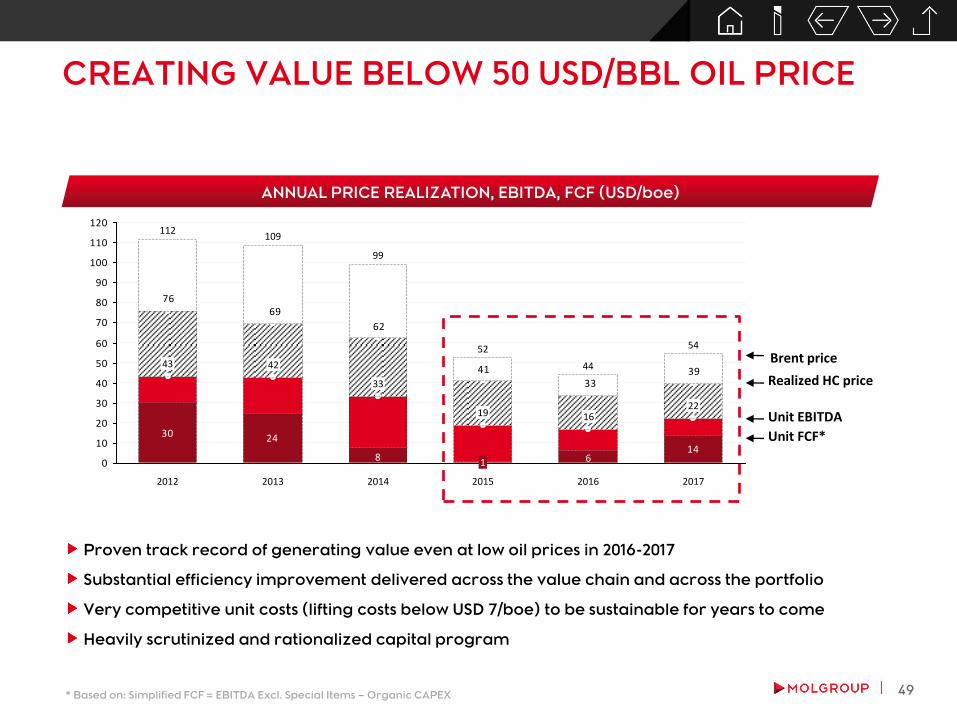
CREATING VALUE BELOW 50 USD/BBL OIL PRICE
ANNUAL PRICE REALIZATION, EBITDA, FCF (USD/boe)
Unit EBITDA
Brent price
Realized HC price
Unit FCF*
Proven track record of generating value even at low oil prices in 2016-2017
Substantial efficiency improvement delivered across the value chain and across the portfolio
Very competitive unit costs (lifting costs below USD 7/boe) to be sustainable for years to come
Heavily scrutinized and rationalized capital program
* Based on: Simplified FCF = EBITDA Excl. Special Items – Organic CAPEX
30 2414
8 6
3933
41
62
6976
0
10
20
30
40
50
60
70
80
90
100
110
120
2017
33
99
2014
1
19
52
2015
16
44
22
20162013
109
42
2012
112
43
54

50
E&P ADJUSTED TO BE FITAND TO PROSPER AT THE BOTTOM OF THE CYCLE
+6%
2017
70
2016
71
2015
66
~-20%
20172016
-7%
20172016
G&A EXPENSES (USD MN) AVERAGE WELL COST
IN HUNGARY (USD/M)CEE ONSHORE PRODUCTION
(MBOEPD)
9
8
7
6
Q4Q3Q2Q1Q4Q3Q2Q1Q4Q3Q2Q1Q4Q3Q2Q1Q4Q3Q2Q1
GROUP DIRECT UNIT OPEX1 (USD/BOE)
OPERATIONAL EFFICIENCY, PRODUCTION OPTIMIZATION IN FOCUS
2014 2015 2016 2017 2018
(1) Incl. JVs and associates
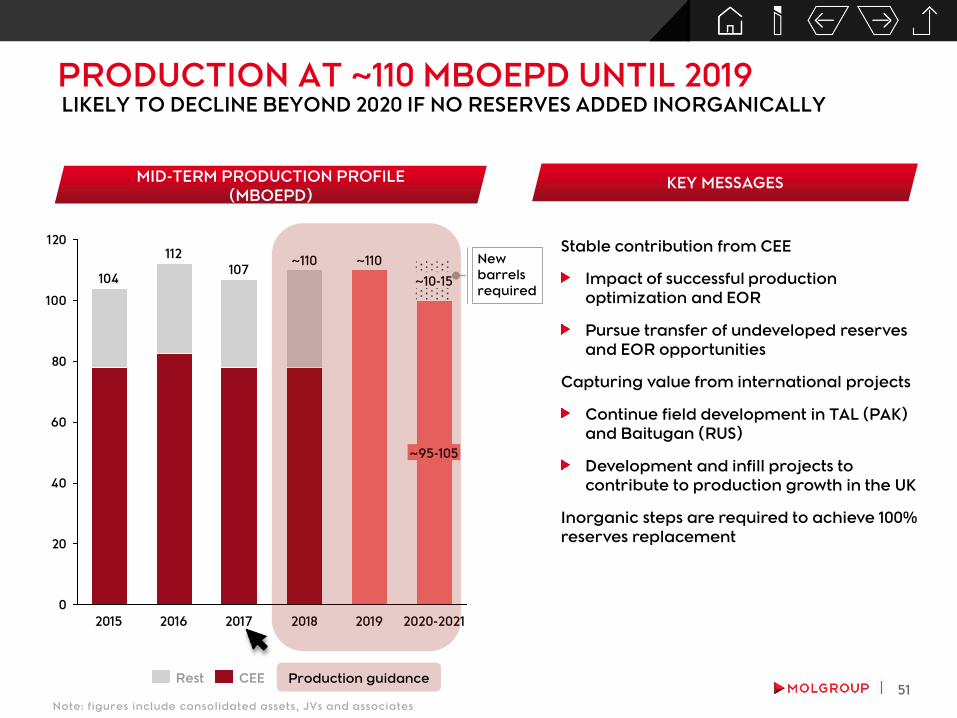
51
LIKELY TO DECLINE BEYOND 2020 IF NO RESERVES ADDED INORGANICALLY
MID-TERM PRODUCTION PROFILE
(MBOEPD)
0
20
40
60
80
100
120
107
112
2015
104
~95-105
~10-15
2019
~110
2018
~110
20172016 2020-2021
Rest CEE
Stable contribution from CEE
Impact of successful production
optimization and EOR
Pursue transfer of undeveloped reserves
and EOR opportunities
Capturing value from international projects
Continue field development in TAL (PAK)
and Baitugan (RUS)
Development and infill projects to
contribute to production growth in the UK
Inorganic steps are required to achieve 100%
reserves replacement
New
barrels
required
KEY MESSAGES
PRODUCTION AT ~110 MBOEPD UNTIL 2019
Production guidance
Note: figures include consolidated assets, JVs and associates
52
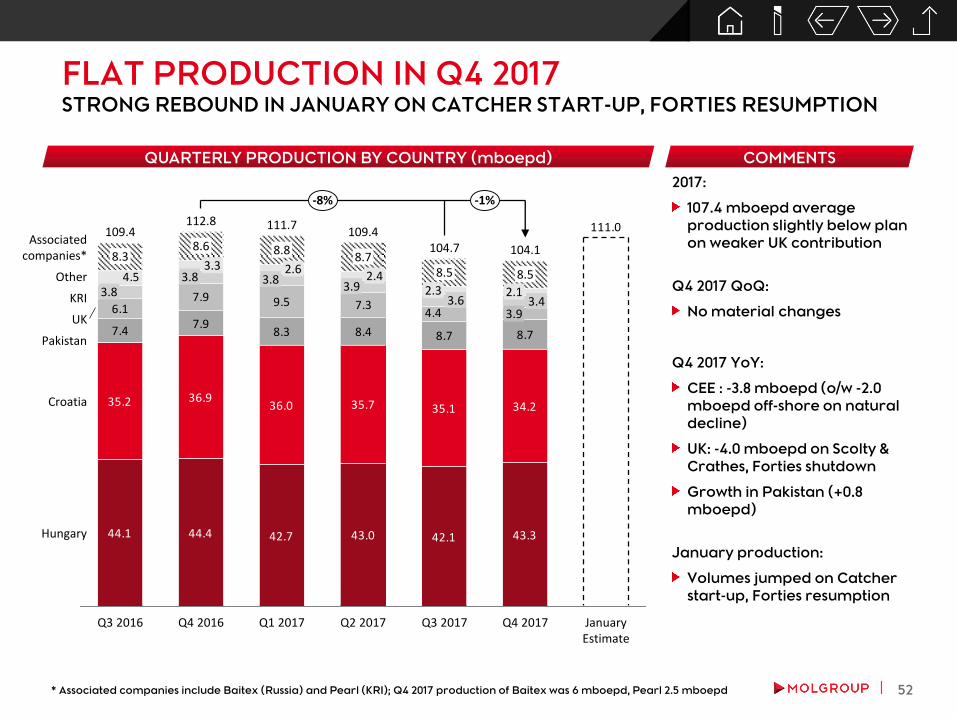
FLAT PRODUCTION IN Q4 2017STRONG REBOUND IN JANUARY ON CATCHER START-UP, FORTIES RESUMPTION
44.1 44.4 42.7 43.0 42.1 43.3
35.2 36.936.0 35.7 35.1 34.2
7.47.9
8.3 8.4 8.7 8.7
6.17.9 9.5 7.3
4.4
4.5
111.0
2.13.4
3.9
Q3 2017Q4 2016
112.8
8.6
3.33.8
104.7Associated
companies*
8.5
2.33.6
Q2 2017
109.4
8.7
2.4
-1%
January Estimate
Hungary
Croatia
Pakistan
UK
KRI
Other
-8%
104.1
8.5
Q4 2017Q3 2016
109.4
8.3
3.8 3.9
Q1 2017
111.7
8.8
2.63.8
QUARTERLY PRODUCTION BY COUNTRY (mboepd) COMMENTS
2017:
107.4 mboepd average
production slightly below plan
on weaker UK contribution
Q4 2017 QoQ:
No material changes
Q4 2017 YoY:
CEE : -3.8 mboepd (o/w -2.0
mboepd off-shore on natural
decline)
UK: -4.0 mboepd on Scolty &
Crathes, Forties shutdown
Growth in Pakistan (+0.8
mboepd)
January production:
Volumes jumped on Catcher
start-up, Forties resumption
* Associated companies include Baitex (Russia) and Pearl (KRI); Q4 2017 production of Baitex was 6 mboepd, Pearl 2.5 mboepd
53
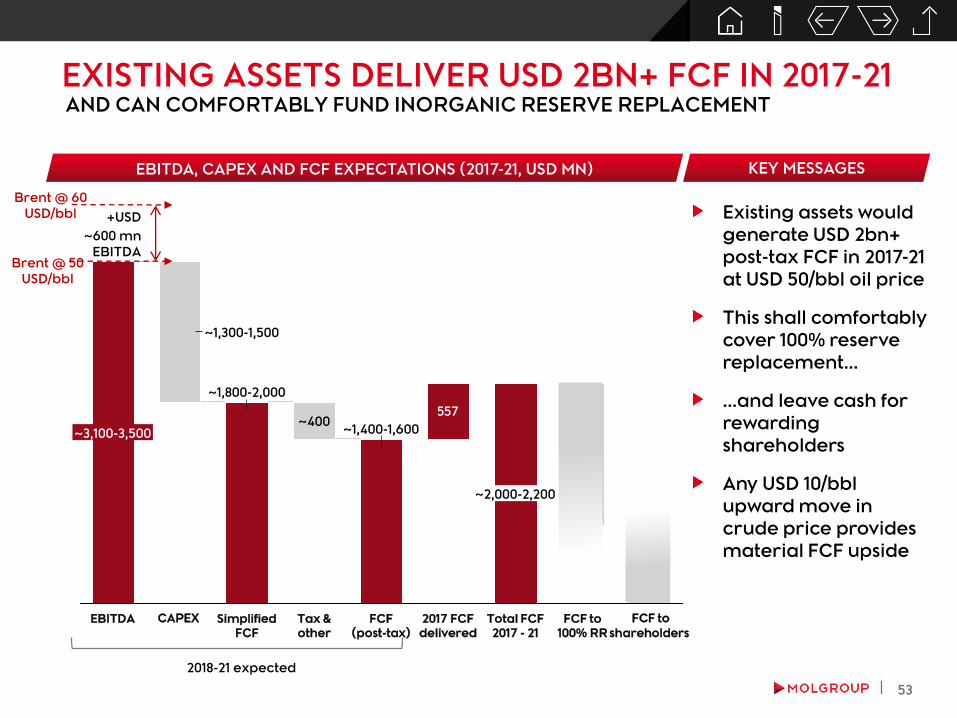
AND CAN COMFORTABLY FUND INORGANIC RESERVE REPLACEMENT
EBITDA, CAPEX AND FCF EXPECTATIONS (2017-21, USD MN)
EXISTING ASSETS DELIVER USD 2BN+ FCF IN 2017-21
Existing assets would
generate USD 2bn+
post-tax FCF in 2017-21
at USD 50/bbl oil price
This shall comfortably
cover 100% reserve
replacement...
...and leave cash for
rewarding
shareholders
Any USD 10/bbl
upward move in
crude price provides
material FCF upside
KEY MESSAGES
+USD
~600 mn
EBITDA
557
FCF to
100% RR
FCF to
shareholders
FCF
(post-tax)
~1,400-1,600
Tax &
other
~400
Simplified
FCF
~1,800-2,000
CAPEX
~1,300-1,500
EBITDA
~3,100-3,500
2017 FCF
delivered
Total FCF
2017 - 21
~2,000-2,200
Brent @ 50
USD/bbl
Brent @ 60
USD/bbl
2018-21 expected
54
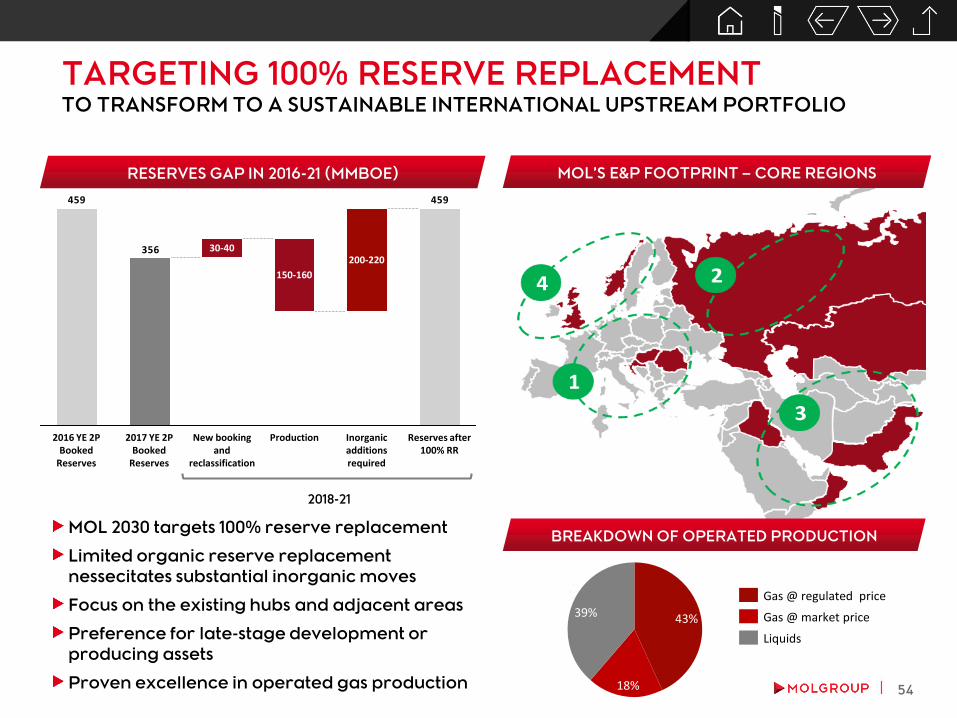
TARGETING 100% RESERVE REPLACEMENTTO TRANSFORM TO A SUSTAINABLE INTERNATIONAL UPSTREAM PORTFOLIO
RESERVES GAP IN 2016-21 (MMBOE)
MOL 2030 targets 100% reserve replacement
Limited organic reserve replacement
nessecitates substantial inorganic moves
Focus on the existing hubs and adjacent areas
Preference for late-stage development or
producing assets
Proven excellence in operated gas production
MOL’S E&P FOOTPRINT – CORE REGIONS
459
356
459
Reserves after 100% RR
Inorganic additions required
200-220
Production
150-160
New booking and
reclassification
30-40
2017 YE 2P Booked
Reserves
2016 YE 2P Booked
Reserves
2018-21
18%
39% 43%
Gas @ regulated price
Liquids
Gas @ market price
BREAKDOWN OF OPERATED PRODUCTION

FINANCIALS,
GOVERNANCE AND
OTHERS
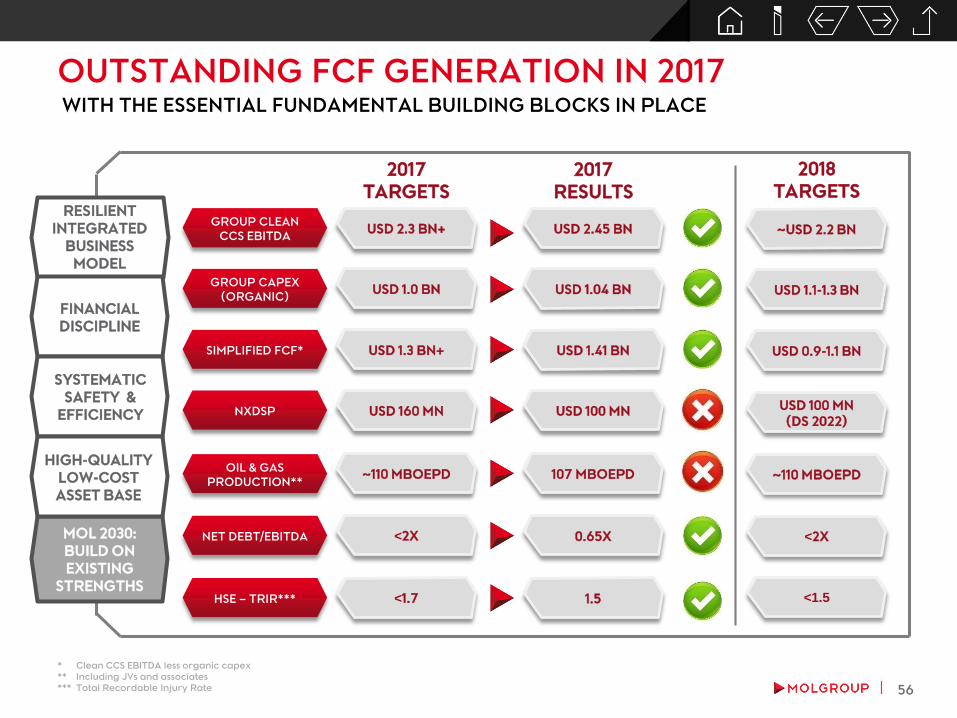
56
GROUP CLEAN
CCS EBITDA
WITH THE ESSENTIAL FUNDAMENTAL BUILDING BLOCKS IN PLACE
OUTSTANDING FCF GENERATION IN 2017
2017
TARGETS
USD 2.3 BN+
GROUP CAPEX
(ORGANIC)
SIMPLIFIED FCF*
NXDSP
USD 1.0 BN
USD 1.3 BN+
USD 160 MN
2017
RESULTS
USD 2.45 BN
USD 1.04 BN
USD 1.41 BN
USD 100 MN
~110 MBOEPD 107 MBOEPD
NET DEBT/EBITDA <2X 0.65X
HSE – TRIR*** <1.7 1.5
2018
TARGETS
~USD 2.2 BN
USD 1.1-1.3 BN
USD 0.9-1.1 BN
~110 MBOEPD
<2X
<1.5
HIGH-QUALITY
LOW-COST
ASSET BASE
SYSTEMATIC
SAFETY &
EFFICIENCY
FINANCIAL
DISCIPLINE
RESILIENT
INTEGRATED
BUSINESS
MODEL
OIL & GAS
PRODUCTION**
MOL 2030:
BUILD ON
EXISTING
STRENGTHS
* Clean CCS EBITDA less organic capex
** Including JVs and associates
*** Total Recordable Injury Rate
USD 100 MN
(DS 2022)
57
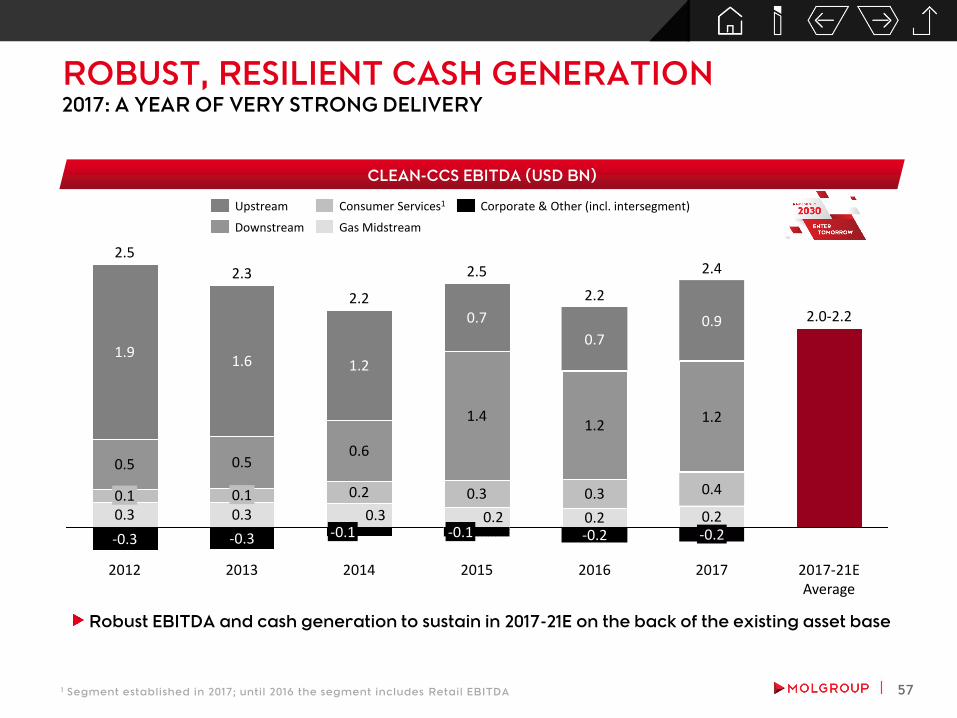
ROBUST, RESILIENT CASH GENERATION2017: A YEAR OF VERY STRONG DELIVERY
2.4
2016
2.2
-0.20.2
0.3
1.2
0.7
2015
2.5
-0.10.2
0.3
1.4
0.7
2014
2.2
-0.10.3
0.2
0.6
1.2
2013
2.3
-0.3
0.30.1
0.5
1.6
2012
2.5
0.30.1
0.5
1.9
2017-21E Average
2.0-2.2
-0.3
2017
-0.20.2
0.9
1.2
0.4
Corporate & Other (incl. intersegment)
Gas Midstream
Consumer Services1
Downstream
Upstream
CLEAN-CCS EBITDA (USD BN)
Robust EBITDA and cash generation to sustain in 2017-21E on the back of the existing asset base
1 Segment established in 2017; until 2016 the segment includes Retail EBITDA
58
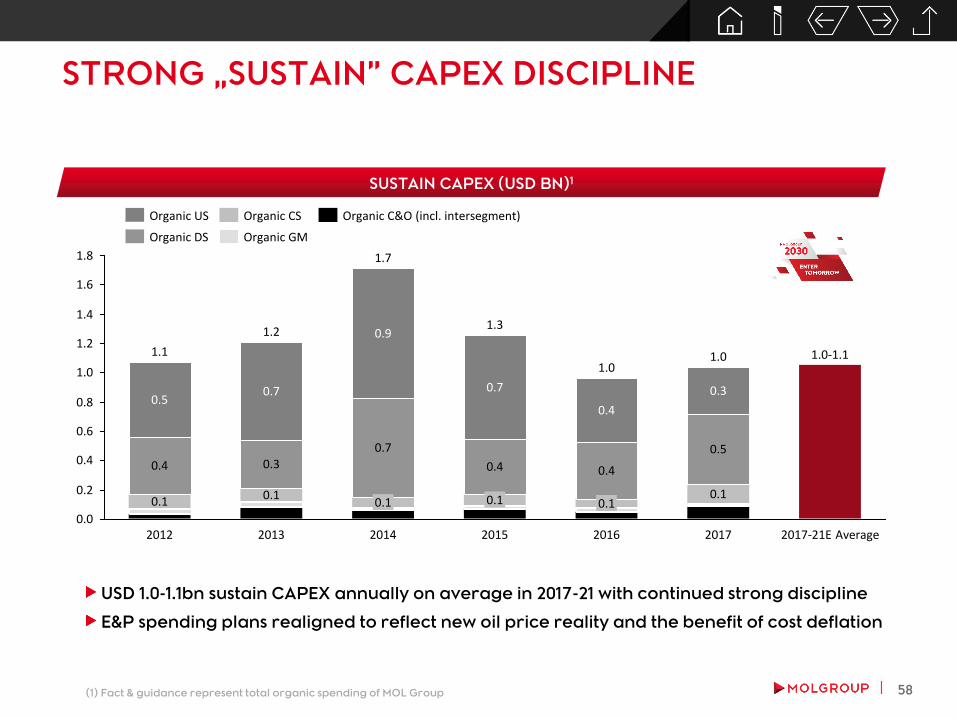
STRONG „SUSTAIN” CAPEX DISCIPLINE
USD 1.0-1.1bn sustain CAPEX annually on average in 2017-21 with continued strong discipline
E&P spending plans realigned to reflect new oil price reality and the benefit of cost deflation
0.0
0.4
1.0
0.2
1.8
0.6
0.8
1.2
1.4
1.6
2016
1.0
0.1
0.4
0.4
2015
1.3
0.1
0.4
0.7
2014
1.7
0.1
0.7
0.9
2013
1.2
0.1
0.30.5
2012
1.1
0.1
0.4
0.50.7 0.3
2017-21E Average
1.0-1.1
2017
1.0
0.1
Organic C&O (incl. intersegment)
Organic GM
Organic CS
Organic DS
Organic US
SUSTAIN CAPEX (USD BN)1
(1) Fact & guidance represent total organic spending of MOL Group

59
SUBSTANTIAL SIMPLIFIED FREE CASH FLOWSACROSS THE CYCLE AND ACROSS ALL BUSINESS SEGMENTS
SIMPLIFIED FREE CASH FLOW1 (USD BN)
(1) Simplified Free Cash Flow = Clean CCS EBITDA – Organic CAPEX (excluding transformational spending)
1.0
0.0
0.4
-0.2
-0.4
0.2
0.6
0.8
1.2
1.4
1.6
1.8
0.2
0.2
0.8
0.2
2015
1.2
-0.2
0.2
0.2
1.0
0.0
2014
0.5 0.7
0.2
0.2
0.0
0.3
2013
1.1
-0.3
0.2
0.1
0.2
0.9
2012
1.5
-0.3
0.2 0.2
0.1
1.3
0.5
-0.2
0.2
2017-21E Average
-0.2
1.0-1.1
2017
1.4
2016
1.2
-0.2
0.0
Consumer Services C&O (incl. intersegment)Upstream
Downstream Gas Midstream
Simplified FCF (EBITDA less „sustain” capex) comfortably covers all cash outflow
60
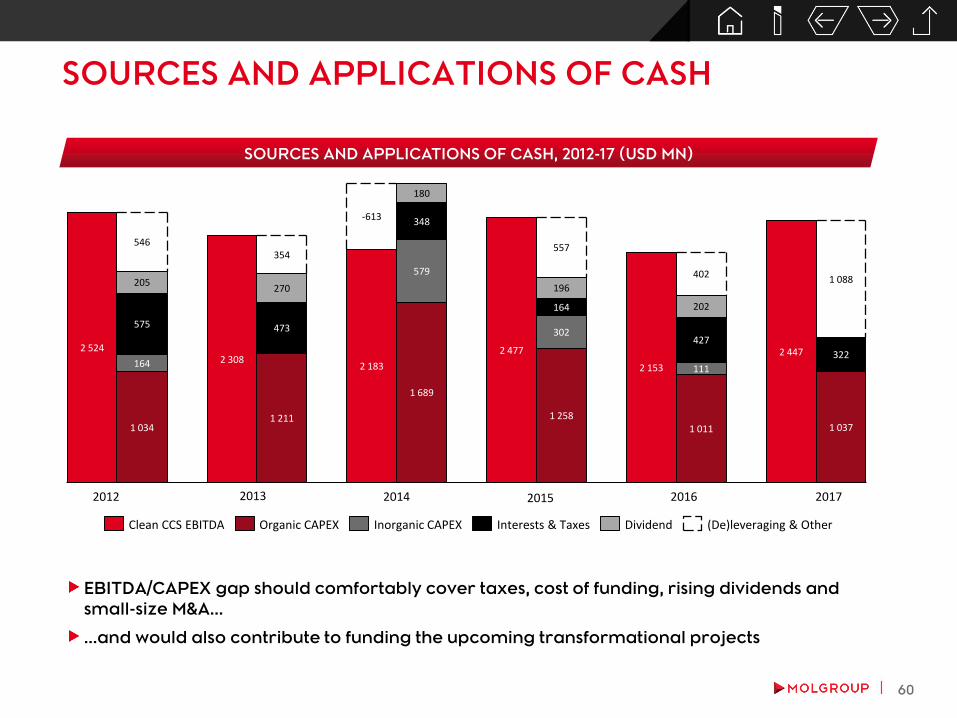
SOURCES AND APPLICATIONS OF CASH
EBITDA/CAPEX gap should comfortably cover taxes, cost of funding, rising dividends and
small-size M&A...
...and would also contribute to funding the upcoming transformational projects
402
202
111
1 011
2 153
180
1 037
1 088
3222 4472 477
1 258
302
164
196
557
348
579
1 689
-613
2 183
354
427473
1 211
2 308
546
205
575
164
1 034
2 524
270
(De)leveraging & OtherDividendInterests & TaxesInorganic CAPEXOrganic CAPEXClean CCS EBITDA
SOURCES AND APPLICATIONS OF CASH, 2012-17 (USD MN)
20152012 2013 2014 2016 2017

61
ROBUST BALANCE SHEET, AMPLE HEADROOMREMAIN A PRIORITY IN „MOL 2030”
Net debt/EBITDA to be in 1.0-2.0x tolerance
range on a forward-looking basis under
„normal” circumstances (covenant
threshold at significantly higher levels)
Credit metrics to remain commensurate
with investment grade credit rating
Higher/lower leverage may be tolerated
temporarily and/or for strategic reasons,
but would trigger action plan to bring it
back to target range
Maintaining strong liquidity and
comfortable financial headroom remain
priority
NET DEBT TO EBITDA (X) MOL 2030
AVAILABLE LIQUIDITY (31.12.2017)
5.0
4.0
3.0
2.0
1.0
0.0
USD
bn
Total available liquidity
USD 4.4bn
Cash
0.8
Marketable securities
0.1
Undrawn facilities
3.5
0.97
0.74
1.31
0.79
1.381.44
1.721.66
1.96
0.65
2.5
2.0
1.5
1.0
0.5
201320122011201020092008 2017201620152014
62
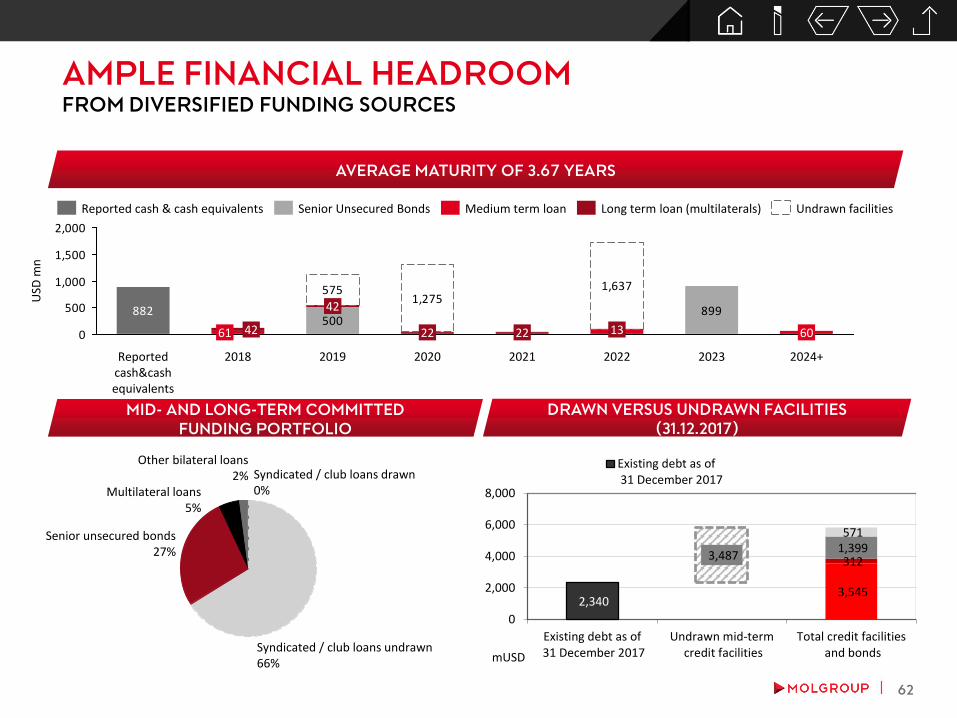
AMPLE FINANCIAL HEADROOMFROM DIVERSIFIED FUNDING SOURCES
MID- AND LONG-TERM COMMITTED
FUNDING PORTFOLIO
AVERAGE MATURITY OF 3.67 YEARS
DRAWN VERSUS UNDRAWN FACILITIES
(31.12.2017)
5751,275
1,637
882 899500
0
500
1,000
1,500
2,000
2024+2022 2023
601361 22
2021
USD
mn
2018
42
2019
42
22
Reported cash&cash equivalents
2020
Senior Unsecured Bonds Medium term loan Long term loan (multilaterals)Reported cash & cash equivalents Undrawn facilities
Syndicated / club loans undrawn66%
Syndicated / club loans drawn0%
Other bilateral loans2%
Senior unsecured bonds27%
Multilateral loans5%
2,340
3,487
3,545
312 1,399 571
0
2,000
4,000
6,000
8,000
Existing debt as of 31 December 2017
Undrawn mid-term credit facilities
Total credit facilities and bondsmUSD
Existing debt as of 31 December 2017
63
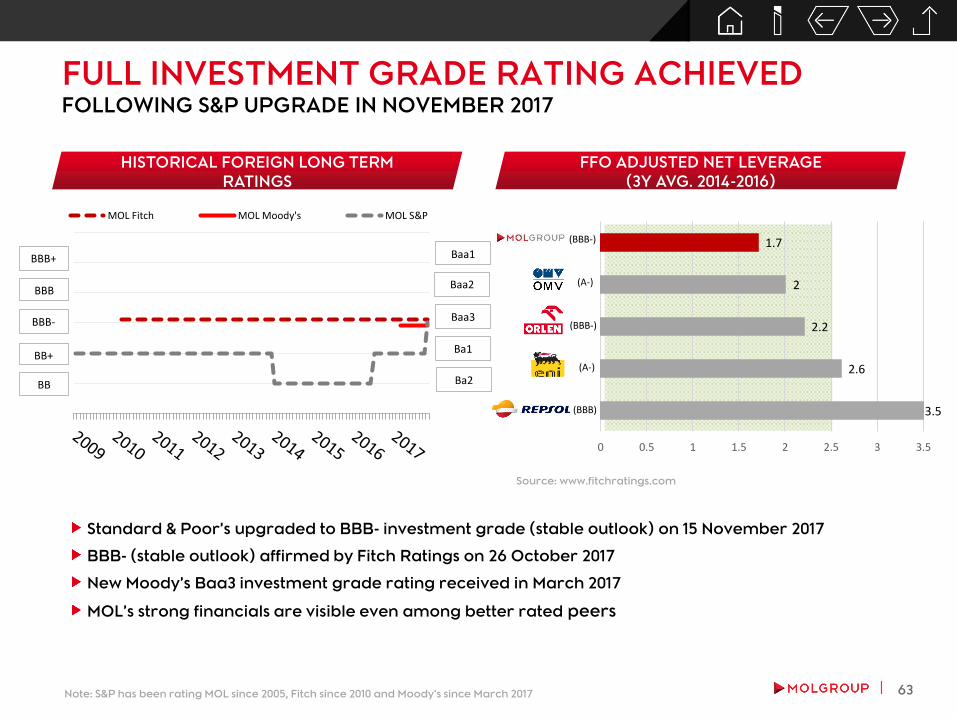
FULL INVESTMENT GRADE RATING ACHIEVEDFOLLOWING S&P UPGRADE IN NOVEMBER 2017
HISTORICAL FOREIGN LONG TERM
RATINGS
FFO ADJUSTED NET LEVERAGE
(3Y AVG. 2014-2016)
Note: S&P has been rating MOL since 2005, Fitch since 2010 and Moody’s since March 2017
Standard & Poor’s upgraded to BBB- investment grade (stable outlook) on 15 November 2017
BBB- (stable outlook) affirmed by Fitch Ratings on 26 October 2017
New Moody’s Baa3 investment grade rating received in March 2017
MOL’s strong financials are visible even among better rated peers
BBB+
BBB
BBB-
BB+
BB3.5
2.6
2.2
2
1.7
0 0.5 1 1.5 2 2.5 3 3.5
(BBB)
(BBB-)
(A-)
(BBB-)
(A-)
Source: www.fitchratings.com
MOL Fitch MOL Moody's MOL S&P
BBB+
BBB
BBB-
BB+
BB
Baa1
Baa2
Baa3
Ba1
Ba2
64
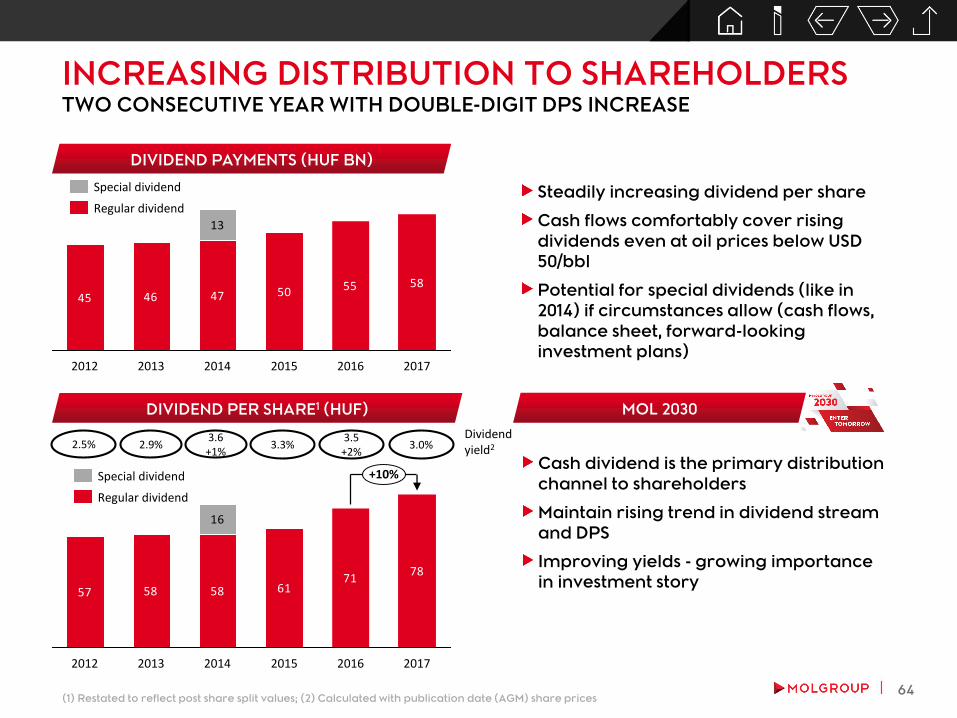
INCREASING DISTRIBUTION TO SHAREHOLDERS TWO CONSECUTIVE YEAR WITH DOUBLE-DIGIT DPS INCREASE
Cash dividend is the primary distribution
channel to shareholders
Maintain rising trend in dividend stream
and DPS
Improving yields - growing importance
in investment story
45 46 47 50 55 58
13
201720162015201420132012
Regular dividend
Special dividend
DIVIDEND PAYMENTS (HUF BN)
DIVIDEND PER SHARE1 (HUF)
(1) Restated to reflect post share split values; (2) Calculated with publication date (AGM) share prices
57 58 58 6171
78
16
2016
+10%
20172015201420132012
Regular dividend
Special dividend
2.5% 2.9%3.6
+1%3.3%
3.5+2%
Dividend yield2
MOL 2030
Steadily increasing dividend per share
Cash flows comfortably cover rising
dividends even at oil prices below USD
50/bbl
Potential for special dividends (like in
2014) if circumstances allow (cash flows,
balance sheet, forward-looking
investment plans)
3.0%
65
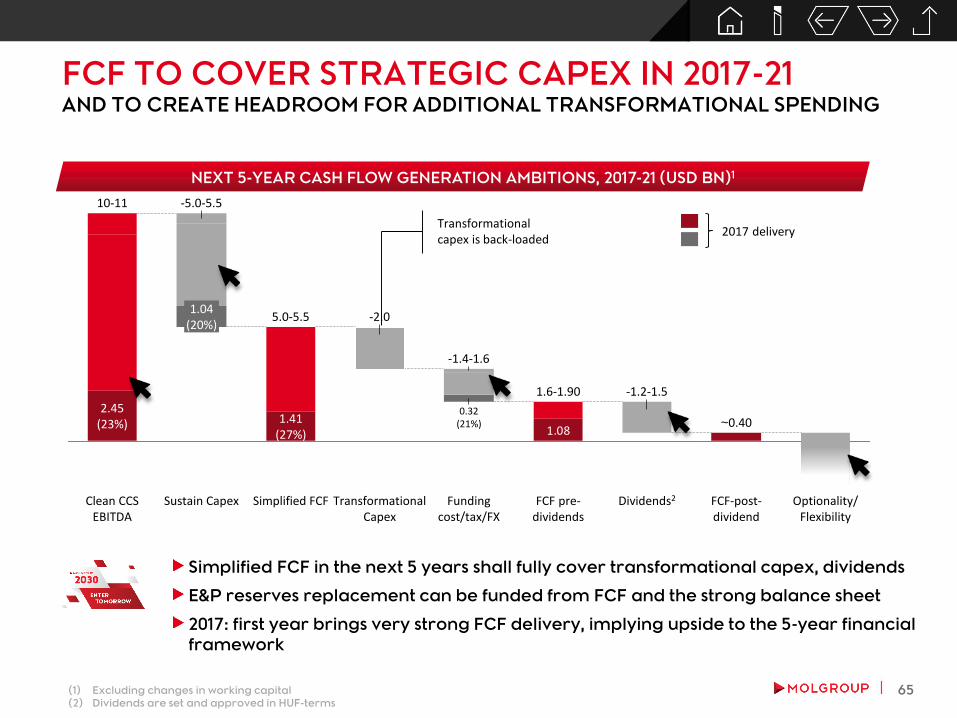
FCF TO COVER STRATEGIC CAPEX IN 2017-21AND TO CREATE HEADROOM FOR ADDITIONAL TRANSFORMATIONAL SPENDING
Simplified FCF in the next 5 years shall fully cover transformational capex, dividends
E&P reserves replacement can be funded from FCF and the strong balance sheet
2017: first year brings very strong FCF delivery, implying upside to the 5-year financial
framework
1.08
Clean CCS EBITDA
10-11 -5.0-5.5
1.04(20%)
2.45(23%)
Simplified FCF
1.41(27%)
Sustain Capex
-2.0
-1.4-1.6
5.0-5.5
Transformational Capex
Dividends2FCF pre-dividends
Funding cost/tax/FX
FCF-post-dividend
Optionality/Flexibility
1.6-1.90
0.32(21%)
-1.2-1.5
~0.40
NEXT 5-YEAR CASH FLOW GENERATION AMBITIONS, 2017-21 (USD BN)1
(1) Excluding changes in working capital
(2) Dividends are set and approved in HUF-terms
2017 deliveryTransformationalcapex is back-loaded
66
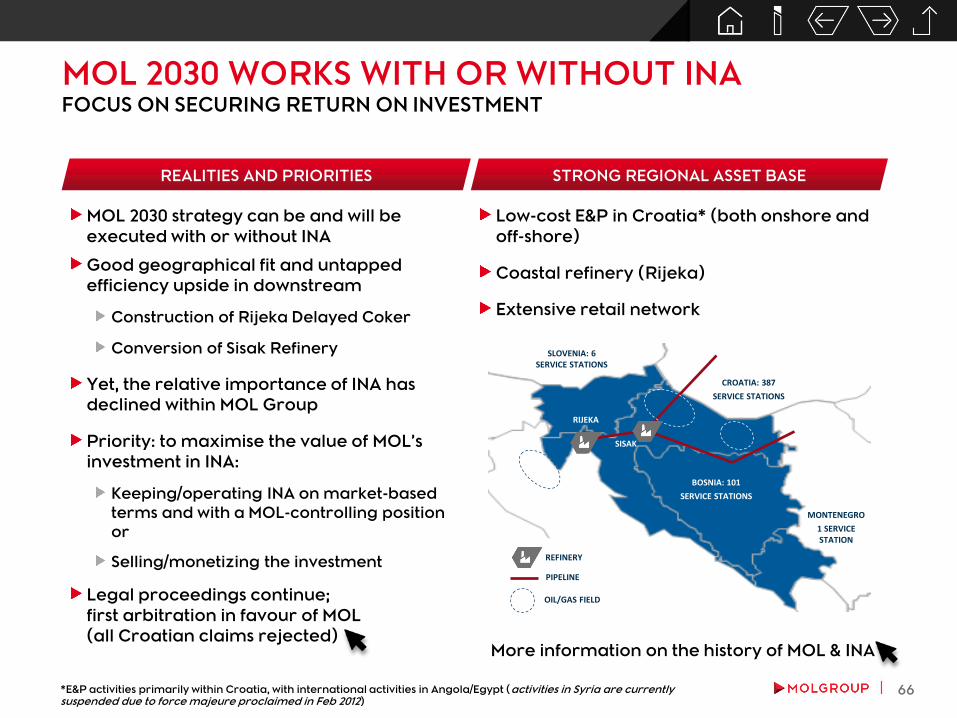
MOL 2030 WORKS WITH OR WITHOUT INAFOCUS ON SECURING RETURN ON INVESTMENT
REALITIES AND PRIORITIES STRONG REGIONAL ASSET BASE
MOL 2030 strategy can be and will be
executed with or without INA
Good geographical fit and untapped
efficiency upside in downstream
Construction of Rijeka Delayed Coker
Conversion of Sisak Refinery
Yet, the relative importance of INA has
declined within MOL Group
Priority: to maximise the value of MOL’s
investment in INA:
Keeping/operating INA on market-based
terms and with a MOL-controlling position
or
Selling/monetizing the investment
Legal proceedings continue;
first arbitration in favour of MOL
(all Croatian claims rejected)
RIJEKA
SISAK
Low-cost E&P in Croatia* (both onshore and
off-shore)
Coastal refinery (Rijeka)
Extensive retail network
*E&P activities primarily within Croatia, with international activities in Angola/Egypt (activities in Syria are currently suspended due to force majeure proclaimed in Feb 2012)
MONTENEGRO
1 SERVICE STATION
BOSNIA: 101
SERVICE STATIONS
SLOVENIA: 6 SERVICE STATIONS
CROATIA: 387
SERVICE STATIONS
REFINERY
PIPELINE
OIL/GAS FIELD
More information on the history of MOL & INA

THE HISTORY OF INA & MOL, 2003-2018
STORYLINE
2003 2004 2005 2006 2007 2008 2009 2010 2011 2012 2013 2014 2015 2016 2017 2018
OW
NER
SHIP
LEG
AL
PR
OC
EED
ING
S
MOL ACQUIRES A 25% STAKE IN INA PLUS 1 SHARE
(USD 505 MN)
1ST SHAREHOLDER RIGHTS AGREEMENT (SHA): MOL ALLOWED TO NOMINATE TWO MEMBERS TO THE SUPERVISORY BOARD, THE CFO AND A
VP TO THE MANAGEMENT BOARD
MOL AND THE GOVT OF CROATIA SIGN THE GAS MASTER AGREEMENT (GMA) AND AN
AMENDMENT TO THE FIRST SHAREHOLDERS AGREEMENT (FASHA) BY WHICH MOL GAINS
FULL MANAGEMENT CONTROL ON INA.
MOL GROUP INCREASES STAKE IN INA TO 47.1%
(USD 1.18 BN)
1ST AMENDMENT
MOL GROUP ACQUIRES AN ADDITIONAL 2% STAKE IN INA
(USD 131 MN)
UNDER THE FASHA, MOL DELEGATES FIVE OUT OF NINE MEMBERS TO THE
SUPERVISORY BOARD AND THREE OUT OF SIX MEMBERS TO THE MANAGEMENT BOARD, INCLUDING THE PRESIDENT
(WITH THE TIE-BREAKING VOTE).
MOL GROUP HOLDS 49.1% IN INA AS OF FEBRUARY
2018 (USD 1.8 BN)
RU
LLIN
GS
HUNGARIAN PROSECUTION LAUNCHES INVESTIGATION ON SUSPICION OF BRIBERY IN CONNECTION WITH FASHA
2003 2004 2005 2006 2007 2008 2009 2010 2011 2012 2013 2014 2015 2016 2017 2018
HUNGARIAN PROSECUTION DECLARES THAT THE CRIMINAL ACCUSTATION RAISED BY CROATIA ON SUSPICION OF BRIBERY IS UNFOUNDED. INVESTIGATION ENDS.
A BUDAPEST COURT REJECTS CROATIA'S REQUEST FOR EXTRADITION OF MOL CHAIRMAN/CEO
CROATIA ISSUES EUROPEAN ARREST WARRANT (EAW) FOR MOL CHAIRMAN/CEO. CROATIA REQUESTS INTERPOL TO PLACE A RED
NOTICE FOR THE ARREST OF MOL CHAIR/CEO. INTERPOL ACCEPTS.
INTERPOL CANCELS RED NOTICE BUT EAW STILL
STANDS
MOL FILES A REQUEST FOR ARBITRATION WITH THE INTERNATIONAL CENTRE FOR SETTLEMENT OF INVESTMENT DISPUTES TO START ARBITRATION PROCEEDINGS VS THE GOVT OF CROATIA FOR BREACHING CONTRACTUAL OBLIGATIONS UNDER THE
FASHA/GMA. NO RULING AS OF 31.10.2017
CROATIA GOVT LAUNCHES ARBITRATION UNDER UNCITRAL RULES SEEKING NULLIFICATION OF THE 2009 FASHA/GMA,
CLAIMING THAT MOL UNLAWFULLY OBTAINED MANAGEMENT RIGHTS
UNCITRAL REJECTS ALL OF CROATIA’S CLAIMS AIMING AT
NULLIFYING THE 2009 FASHA/GMA. ALLEGATIONS OF
BRIBERY, BREACHING THE 2003 SHA AND NOT ACTING
WITHIN CROATIAN COMPANY LAW ARE ALL DISMISSED. SWISS SUPREME COURT
CONFIRMS RULING.MOL IS CLEARED.
THE CONSTITUTIONAL COURT OF CROATIA REVOKES TWO PREVIOUS LOWER INSTANCE RULLINGS AND ORDERED FOR RETRIAL
CROATIA BEGINS INVESTIGATION OF EX-PM IVO SANADER FOR ALLEGEDLY BEING OFFERED A €10MN BRIBE BY MOL FOR SECURING MANAGEMENT RIGHTS IN INA. THE INVESTIGATION ALSO TARGETS MOL CHARIMAN/CEO.
CROATIAN REGULAR (1st and 2nd inst.) COURTS FIND THE EX. PM GUILTY OF ACCEPTING THE ALLEDGED BRIBE
AUSTRIA AND GERMANY SUSPEND
EAW ON MOL CHAIRMAN/CEO
CROATIAN BRIBERY INVESTIGATION INTO EX CROATIA PM AND MOL CHAIRMAN/CEO ARREST WARRANT FOR MOL CHAIRMAN/CEO ICSID ARBITRATION UNCITRAL ARBITRATIONHUNGARIAN BRIBERY INVESTIGATION INTO MOL CHAIRMAN/CEO
SHA
REH
OLD
ER
AG
REE
MEN
TS
68
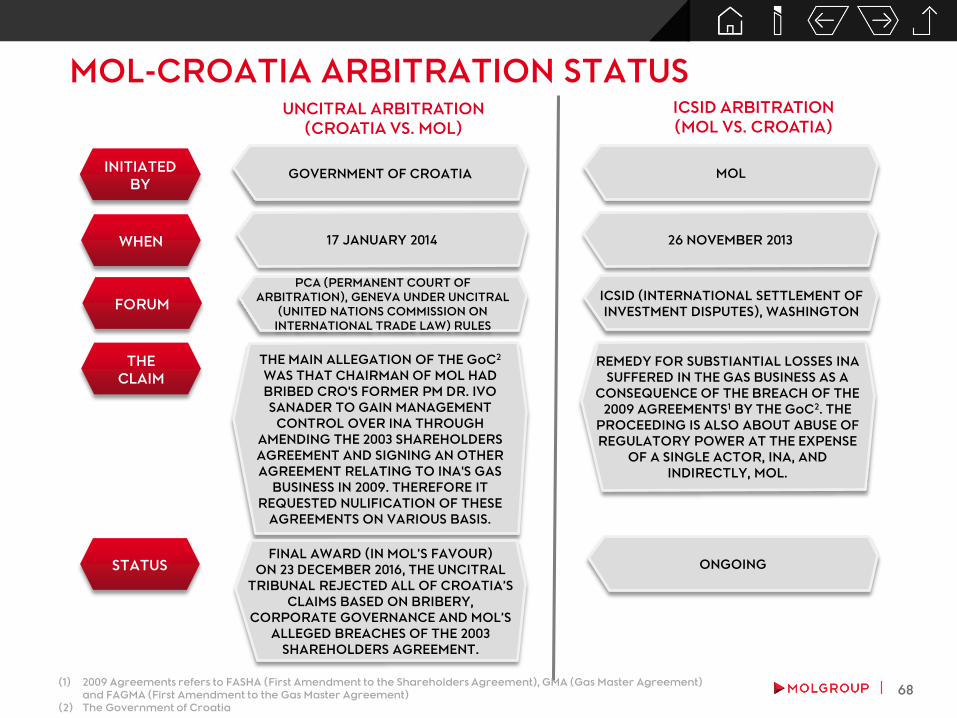
MOL-CROATIA ARBITRATION STATUSICSID ARBITRATION
(MOL VS. CROATIA)
WHEN
UNCITRAL ARBITRATION
(CROATIA VS. MOL)
INITIATED
BY
FORUM
THE
CLAIM
STATUS
GOVERNMENT OF CROATIA
17 JANUARY 2014
PCA (PERMANENT COURT OF
ARBITRATION), GENEVA UNDER UNCITRAL
(UNITED NATIONS COMMISSION ON
INTERNATIONAL TRADE LAW) RULES
(1) 2009 Agreements refers to FASHA (First Amendment to the Shareholders Agreement), GMA (Gas Master Agreement)
and FAGMA (First Amendment to the Gas Master Agreement)
(2) The Government of Croatia
REMEDY FOR SUBSTIANTIAL LOSSES INA
SUFFERED IN THE GAS BUSINESS AS A
CONSEQUENCE OF THE BREACH OF THE
2009 AGREEMENTS1 BY THE GoC2. THE
PROCEEDING IS ALSO ABOUT ABUSE OF
REGULATORY POWER AT THE EXPENSE
OF A SINGLE ACTOR, INA, AND
INDIRECTLY, MOL.
THE MAIN ALLEGATION OF THE GoC2
WAS THAT CHAIRMAN OF MOL HAD
BRIBED CRO'S FORMER PM DR. IVO
SANADER TO GAIN MANAGEMENT
CONTROL OVER INA THROUGH
AMENDING THE 2003 SHAREHOLDERS
AGREEMENT AND SIGNING AN OTHER
AGREEMENT RELATING TO INA'S GAS
BUSINESS IN 2009. THEREFORE IT
REQUESTED NULIFICATION OF THESE
AGREEMENTS ON VARIOUS BASIS.
MOL
26 NOVEMBER 2013
ICSID (INTERNATIONAL SETTLEMENT OF
INVESTMENT DISPUTES), WASHINGTON
FINAL AWARD (IN MOL’S FAVOUR)
ON 23 DECEMBER 2016, THE UNCITRAL
TRIBUNAL REJECTED ALL OF CROATIA’S
CLAIMS BASED ON BRIBERY,
CORPORATE GOVERNANCE AND MOL’S
ALLEGED BREACHES OF THE 2003
SHAREHOLDERS AGREEMENT.
ONGOING
69
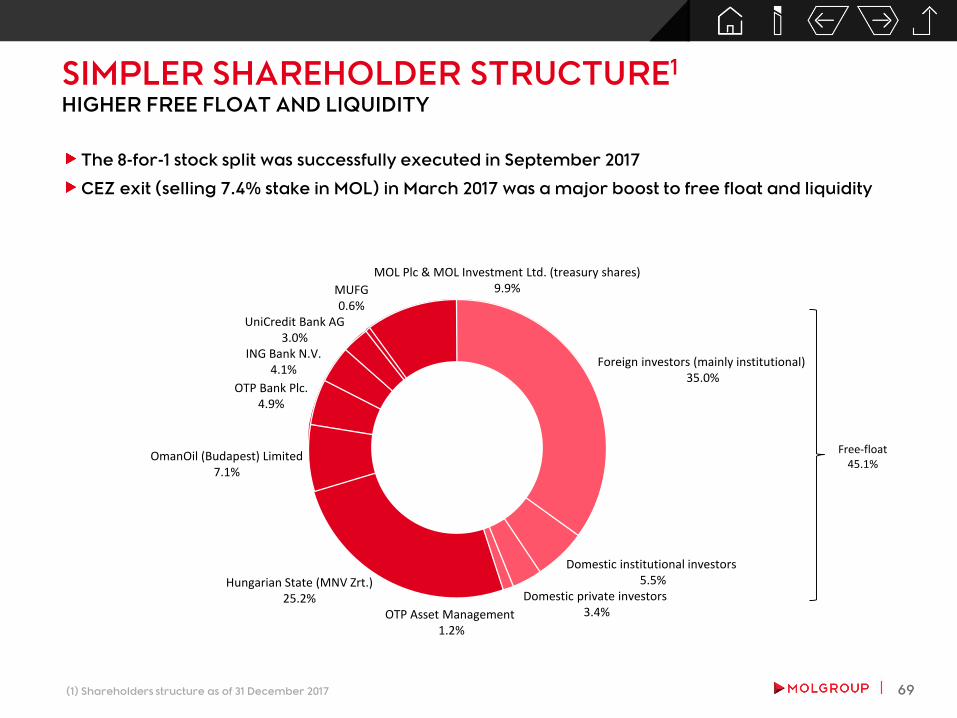
SIMPLER SHAREHOLDER STRUCTURE1
HIGHER FREE FLOAT AND LIQUIDITY
The 8-for-1 stock split was successfully executed in September 2017
CEZ exit (selling 7.4% stake in MOL) in March 2017 was a major boost to free float and liquidity
ING Bank N.V.4.1%
OmanOil (Budapest) Limited7.1%
UniCredit Bank AG3.0%
MOL Plc & MOL Investment Ltd. (treasury shares)9.9%
Foreign investors (mainly institutional)35.0%
OTP Asset Management1.2%
Domestic institutional investors5.5%
OTP Bank Plc.4.9%
Domestic private investors3.4%
MUFG0.6%
Hungarian State (MNV Zrt.)25.2%
(1) Shareholders structure as of 31 December 2017
Free-float 45.1%
70
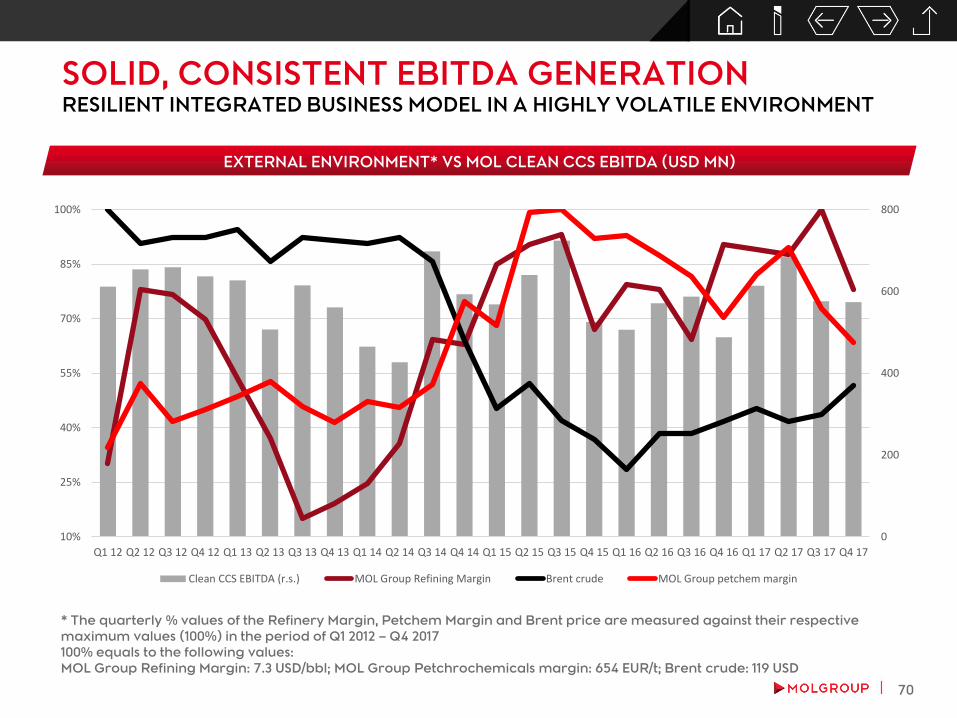
SOLID, CONSISTENT EBITDA GENERATIONRESILIENT INTEGRATED BUSINESS MODEL IN A HIGHLY VOLATILE ENVIRONMENT
EXTERNAL ENVIRONMENT* VS MOL CLEAN CCS EBITDA (USD MN)
* The quarterly % values of the Refinery Margin, Petchem Margin and Brent price are measured against their respective
maximum values (100%) in the period of Q1 2012 – Q4 2017
100% equals to the following values:
MOL Group Refining Margin: 7.3 USD/bbl; MOL Group Petchrochemicals margin: 654 EUR/t; Brent crude: 119 USD
0
200
400
600
800
10%
25%
40%
55%
70%
85%
100%
Q1 12 Q2 12 Q3 12 Q4 12 Q1 13 Q2 13 Q3 13 Q4 13 Q1 14 Q2 14 Q3 14 Q4 14 Q1 15 Q2 15 Q3 15 Q4 15 Q1 16 Q2 16 Q3 16 Q4 16 Q1 17 Q2 17 Q3 17 Q4 17
Clean CCS EBITDA (r.s.) MOL Group Refining Margin Brent crude MOL Group petchem margin
71
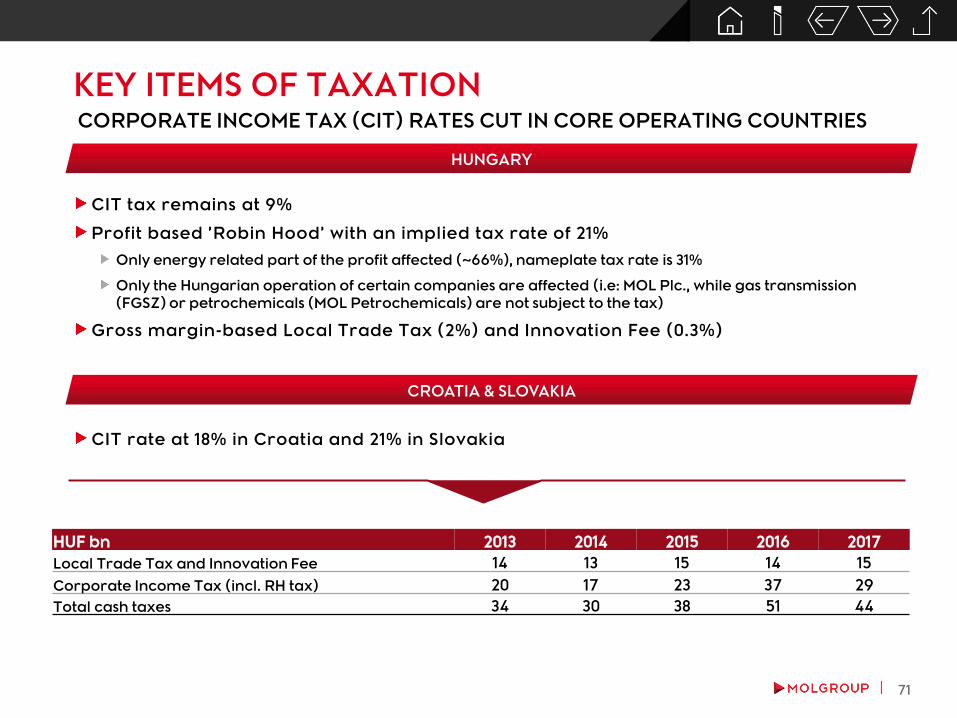
KEY ITEMS OF TAXATION
CIT rate at 18% in Croatia and 21% in Slovakia
HUNGARY
CROATIA & SLOVAKIA
CIT tax remains at 9%
Profit based ’Robin Hood’ with an implied tax rate of 21%
Only energy related part of the profit affected (~66%), nameplate tax rate is 31%
Only the Hungarian operation of certain companies are affected (i.e: MOL Plc., while gas transmission
(FGSZ) or petrochemicals (MOL Petrochemicals) are not subject to the tax)
Gross margin-based Local Trade Tax (2%) and Innovation Fee (0.3%)
HUF bn 2013 2014 2015 2016 2017
Local Trade Tax and Innovation Fee 14 13 15 14 15
Corporate Income Tax (incl. RH tax) 20 17 23 37 29
Total cash taxes 34 30 38 51 44
CORPORATE INCOME TAX (CIT) RATES CUT IN CORE OPERATING COUNTRIES
72
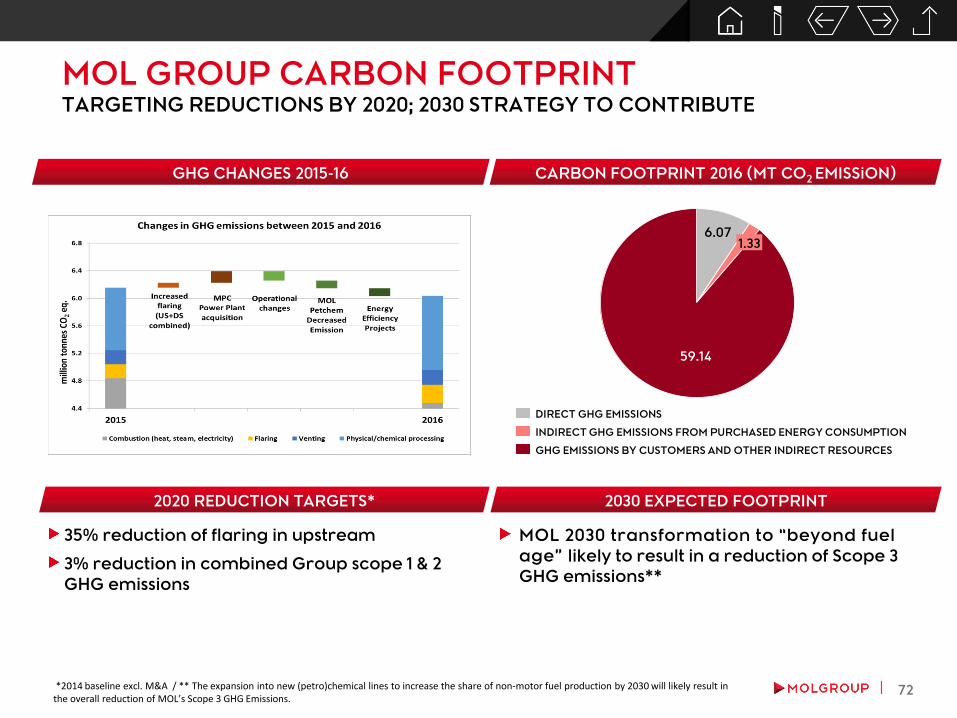
MOL GROUP CARBON FOOTPRINTTARGETING REDUCTIONS BY 2020; 2030 STRATEGY TO CONTRIBUTE
GHG CHANGES 2015-16 CARBON FOOTPRINT 2016 (MT CO2 EMISSiON)
*2014 baseline excl. M&A / ** The expansion into new (petro)chemical lines to increase the share of non-motor fuel production by 2030 will likely result in the overall reduction of MOL’s Scope 3 GHG Emissions.
6.07
59.14
1.33
DIRECT GHG EMISSIONS
GHG EMISSIONS BY CUSTOMERS AND OTHER INDIRECT RESOURCES
INDIRECT GHG EMISSIONS FROM PURCHASED ENERGY CONSUMPTION
35% reduction of flaring in upstream
3% reduction in combined Group scope 1 & 2
GHG emissions
2020 REDUCTION TARGETS*
MOL 2030 transformation to “beyond fuel
age” likely to result in a reduction of Scope 3
GHG emissions**
2030 EXPECTED FOOTPRINT
73
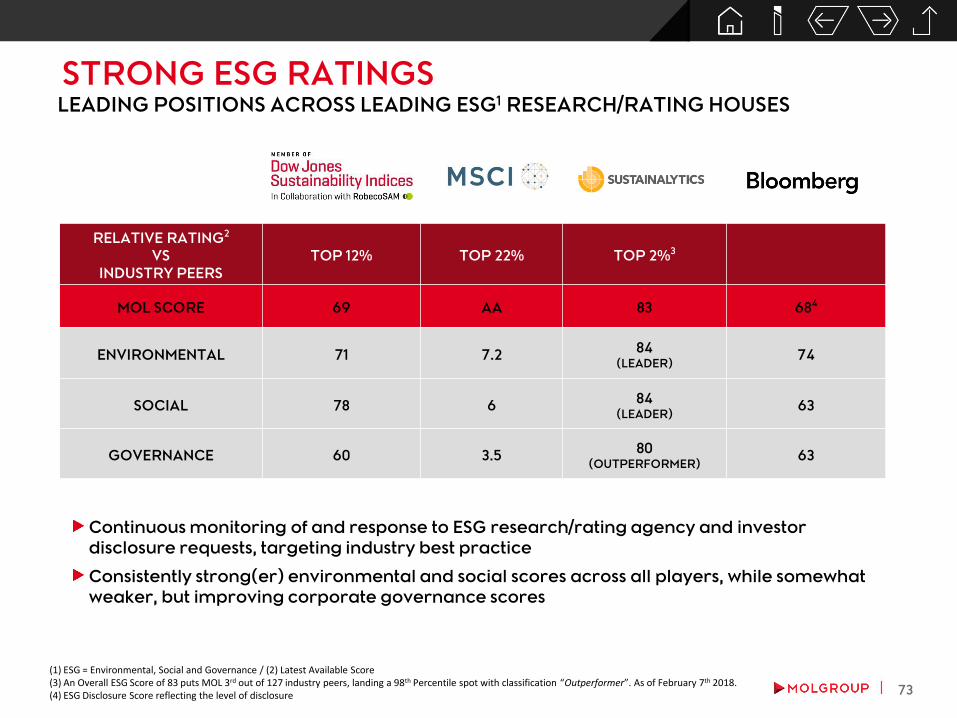
STRONG ESG RATINGS LEADING POSITIONS ACROSS LEADING ESG1 RESEARCH/RATING HOUSES
RELATIVE RATING2
VS
INDUSTRY PEERS
TOP 12% TOP 22% TOP 2%3
MOL SCORE 69 AA 83 684
ENVIRONMENTAL 71 7.284
(LEADER)74
SOCIAL 78 684
(LEADER)63
GOVERNANCE 60 3.580
(OUTPERFORMER)63
Continuous monitoring of and response to ESG research/rating agency and investor
disclosure requests, targeting industry best practice
Consistently strong(er) environmental and social scores across all players, while somewhat
weaker, but improving corporate governance scores
(1) ESG = Environmental, Social and Governance / (2) Latest Available Score (3) An Overall ESG Score of 83 puts MOL 3rd out of 127 industry peers, landing a 98th Percentile spot with classification “Outperformer”. As of February 7th 2018.(4) ESG Disclosure Score reflecting the level of disclosure
74
5.0%
18.4%
10.4%
46.8%
10.4%
9.0%
Complexrefinerymargin
(MOL+SN)
5.5%19.4%
8.7%
45.6%
10.9%
9.9%
MOLGroup
refinerymargin
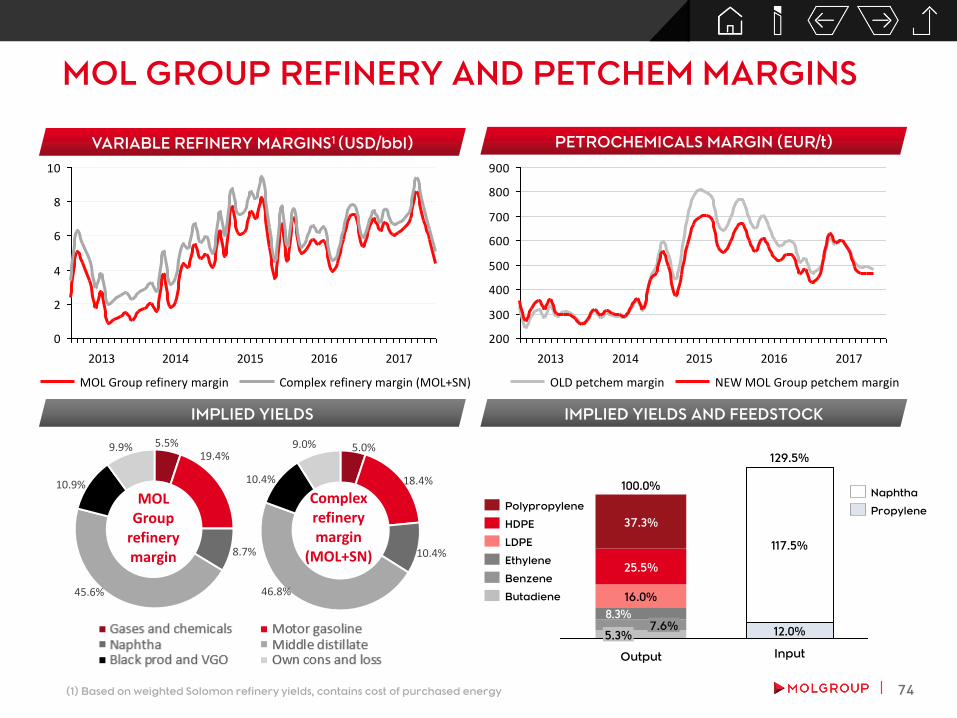
MOL GROUP REFINERY AND PETCHEM MARGINS
IMPLIED YIELDS
0
2
4
6
8
10
20172016201520142013
VARIABLE REFINERY MARGINS1 (USD/bbl)
(1) Based on weighted Solomon refinery yields, contains cost of purchased energy
PETROCHEMICALS MARGIN (EUR/t)
200
300
400
500
600
700
800
900
20172016201520142013
NEW MOL Group petchem marginOLD petchem margin
IMPLIED YIELDS AND FEEDSTOCK
8.3%
Output
100.0%
5.3%7.6%
16.0%
25.5%
37.3%
Polypropylene
Butadiene
Benzene
Ethylene
LDPE
HDPE
Input
129.5%
12.0%
117.5%
Propylene
Naphtha
MOL Group refinery margin Complex refinery margin (MOL+SN)
75
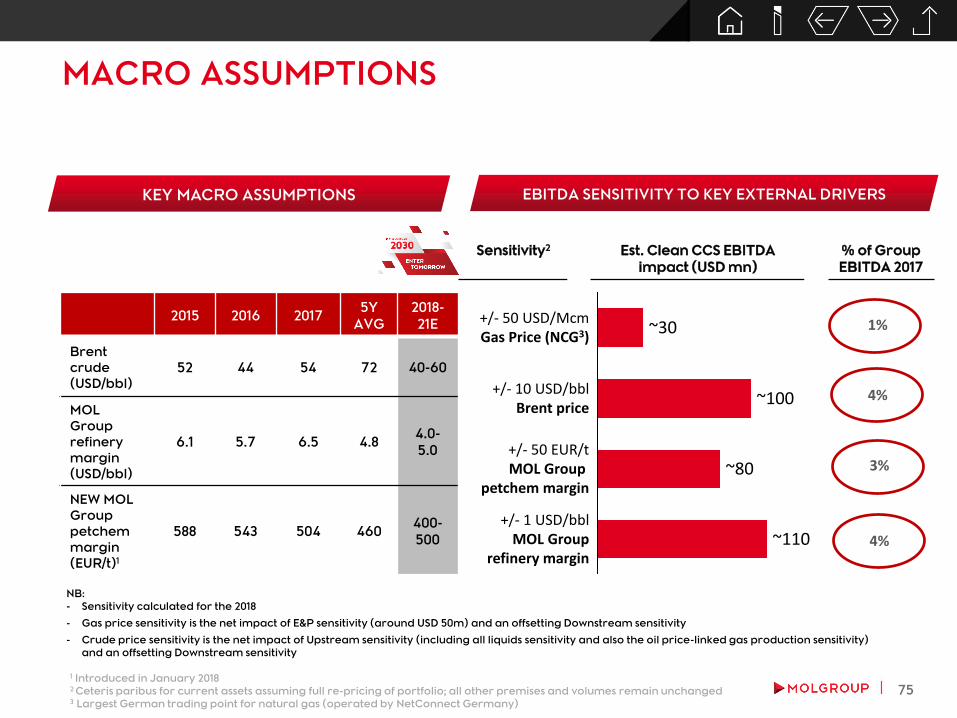
MACRO ASSUMPTIONS
+/- 50 USD/McmGas Price (NCG3)
+/- 1 USD/bblMOL Group
refinery margin
+/- 50 EUR/tMOL Group
petchem margin
~110
~100
~80
+/- 10 USD/bblBrent price
~30
Sensitivity2 Est. Clean CCS EBITDA
impact (USD mn)
% of Group
EBITDA 2017
1 Introduced in January 20182 Ceteris paribus for current assets assuming full re-pricing of portfolio; all other premises and volumes remain unchanged3 Largest German trading point for natural gas (operated by NetConnect Germany)
1%
4%
3%
4%
2015 2016 20175Y
AVG
2018-
21E
Brent
crude
(USD/bbl)
52 44 54 72 40-60
MOL
Group
refinery
margin
(USD/bbl)
6.1 5.7 6.5 4.84.0-
5.0
NEW MOL
Group
petchem
margin
(EUR/t)1
588 543 504 460400-
500
KEY MACRO ASSUMPTIONS
NB:
- Sensitivity calculated for the 2018
- Gas price sensitivity is the net impact of E&P sensitivity (around USD 50m) and an offsetting Downstream sensitivity
- Crude price sensitivity is the net impact of Upstream sensitivity (including all liquids sensitivity and also the oil price-linked gas production sensitivity)
and an offsetting Downstream sensitivity
EBITDA SENSITIVITY TO KEY EXTERNAL DRIVERS

76
37% 32%OtherExecutive
BoardMembers
35%
30%
35%
TOP MANAGEMENT INCENTIVE SCHEMESFOR MOL GROUP EB MEMBERS, MORE THAN 2/3 OF TOTAL REMUNERATION IS
VARIABLE AND PERFORMANCE DRIVEN
REMUNERATION MIX
Base Salary Short Term Incentives Long Term Incentives
SHORT-TERM INCENTIVES
Bonus opportunity between 0.85x and 1x of annual base salary, depending on the level
Payout linked to yearly performance based on financial, operational and individual measures, including but not limited to:
Group Level target: Clean CCS EBITDA, CAPEX utilization, TRIR
Divisional targets: Clean CCS EBITDA, CAPEX utilization, OPEX, non-financial targets etc.
LONG-TERM INCENTIVES
Long-term incentive (LTI) scheme consists of two elements: Absolute share value based (previous stock option plan) and Relative
market index based (previously Performance Share Plan) plans
LTI payout is linked to long-term share price performance, both nominal and relative
Absolute share value plan: a plan with 2 year lock-up period in which shares are granted on a past strike price. Any payout being
the difference between strike price and actual spot price
Relative index based plan: measures MOL share price vs CETOP and DJ Emerging Market Titans Oil&Gas 30 Index over 3 years
Benchmark choice: MOL competes regionally (CEE) for investor flows, as well as with the global emerging market O&G sector
Purpose: Incentivize and reward executives for providing competitive returns to shareholders relative to the regional and
global O&G markets
As of 2017, target amounts and actual payout for both LTI pillars will be based on physical MOL shares in order to further
strengthen the alignment between the interest of our shareholders and MOL management.
48%
26%
26%
ChairmanCEO
44%
28%
28%
GroupCEO
Other EB members
77
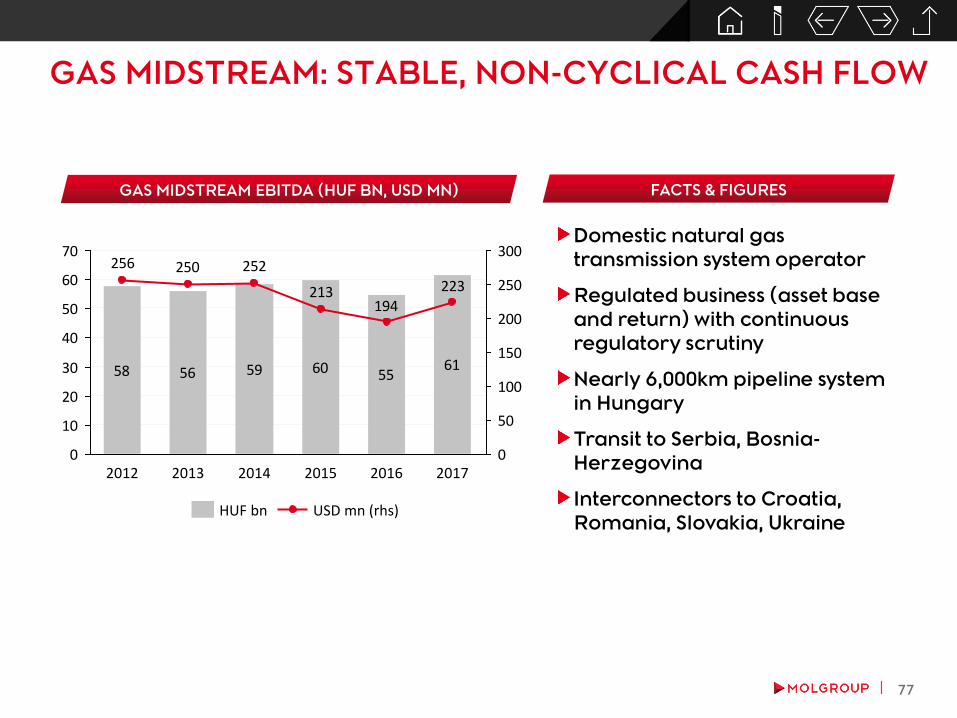
GAS MIDSTREAM: STABLE, NON-CYCLICAL CASH FLOW
58 56 59 60 5561
223194
213
252250256
0
10
20
30
40
50
60
70
0
50
100
150
200
250
300
201720162015201420132012
GAS MIDSTREAM EBITDA (HUF BN, USD MN)
USD mn (rhs)HUF bn
Domestic natural gas
transmission system operator
Regulated business (asset base
and return) with continuous
regulatory scrutiny
Nearly 6,000km pipeline system
in Hungary
Transit to Serbia, Bosnia-
Herzegovina
Interconnectors to Croatia,
Romania, Slovakia, Ukraine
FACTS & FIGURES

78
DISCLAIMER
"This presentation and the associated slides and discussion contain forward-looking statements. These statements
are naturally subject to uncertainty and changes in circumstances. Those forward-looking statements may include,
but are not limited to, those regarding capital employed, capital expenditure, cash flows, costs, savings, debt,
demand, depreciation, disposals, dividends, earnings, efficiency, gearing, growth, improvements, investments,
margins, performance, prices, production, productivity, profits, reserves, returns, sales, share buy backs, special
and exceptional items, strategy, synergies, tax rates, trends, value, volumes, and the effects of MOL merger and
acquisition activities. These forward-looking statements are subject to risks, uncertainties and other factors, which
could cause actual results to differ materially from those expressed or implied by these forward-looking
statements. These risks, uncertainties and other factors include, but are not limited to developments in government
regulations, foreign exchange rates, crude oil and gas prices, crack spreads, political stability, economic growth
and the completion of ongoing transactions. Many of these factors are beyond the Company's ability to control or
predict. Given these and other uncertainties, you are cautioned not to place undue reliance on any of the forward-
looking statements contained herein or otherwise. The Company does not undertake any obligation to release
publicly any revisions to these forward-looking statements (which speak only as of the date hereof) to reflect events
or circumstances after the date hereof or to reflect the occurrence of unanticipated events, except as maybe
required under applicable securities laws.
Statements and data contained in this presentation and the associated slides and discussions, which relate to the
performance of MOL in this and future years, represent plans, targets or projections."
MORE INFO AT www.molgroup.infoCONTACT:Phone: +36 1 464 1395E-mail: [email protected]