Embed Size (px)
Citation preview
©20
15N
atu
re A
mer
ica,
Inc.
All
rig
hts
res
erve
d.
a r t i c l e s
nature medicine advance online publication �
Gastric cancer (GC) is the fourth-most-common cancer globally and the second-leading cause of cancer deaths1. It accounts for 989,600 cases annually, with East Asia accounting for more than half of those cases1. Current approach to GC management largely consists of endo-scopic detection followed by gastrectomy and chemotherapy (CT) or chemo-radiotherapy (CRT) in a neoadjuvant or adjuvant setting. However, recurrence rates for GC patients classified as stages II–IV (American Joint Committee on Cancers; AJCC2) range from 25% to 40% in an adjuvant setting3–6, with metastatic cases not amenable to re-resection.
One of the key reasons for observed heterogeneity in response to treatments is a one-size-fits-all approach to treatment. Insufficient attention is paid to the underlying molecular mechanisms driving differences in cancer aggressiveness and treatment outcomes. Recent research in GC has shown that it is a heterogeneous disease. The pres-ence of molecular heterogeneity has been shown through the existence of subtypes that have been described on the basis of anatomic site7,
histopathology and anatomic site8, gene expression9–13, gene amplification10,14, DNA methylation10,15–17, numerous cancer- relevant aberrations10,14,18–20 and oncogenic pathways10,21,22. The subtypes are associated with prognosis or clinical outcomes in a limited number of cases9,12–15,17,21,22. However, some of these studies were done in small cohorts9,13, whereas others12,14,15,17,21,22 reported subtypes based on several genetic and epigenetic processes, thus making it difficult to decide which basis to adopt for subtyping. Limited work has been done to create a consensus with respect to different ways of subtyping and their clinical relevance for widespread use in preclinical research, the development of anti-cancer agents or patient selection in clinical trials.
We, the Asian Cancer Research Group (ACRG), previously per-formed whole-genome sequencing of n = 49 GC tumors, in which we identified recurrent somatic mutations23. Here we report on additional n = 251 primary tumors with gene expression profiling, genome-wide copy number microarrays and targeted gene sequencing.
1Department of Genetics and Pharmacogenomics, Merck Research Laboratories, Merck Sharpe & Dohme, Boston, Massachusetts, USA. 2Department of Medicine, Division of Hematology-Oncology, Samsung Medical Center, Sungkyunkwan University School of Medicine, Seoul, Korea. 3Department of Pathology and Translational Genomics, Samsung Medical Center, Sungkyunkwan University School of Medicine, Seoul, Korea. 4Lilly Research Labs, Eli Lilly & Co, Indianapolis, Indiana, USA. 5BGI Tech Solutions, Hong Kong, China. 6Shanghai Biocorp, Shanghai, China. 7Department of Surgery, Gastric Cancer Center, Samsung Medical Center, Sungkyunkwan University School of Medicine, Seoul, Korea. 8Biostatistics and Clinical Epidemiology, Samsung Medical Center, Sungkyunkwan University School of Medicine, Seoul, Korea. 9Program in Cancer and Stem Cell Biology, Duke-National University of Singapore (NUS) Graduate Medical School, Singapore. 10Genome Institute of Singapore, Singapore. 11Present addresses: Novartis Institute for Biomedical Research, Boston, Massachusetts, USA (K.Y.); Pfizer, San Diego, California, USA (J.H.); M2Gen, Tampa, Florida, USA (H.D.). 12These authors contributed equally to this article. Correspondence should be addressed to A.L. ([email protected]), S.K. ([email protected]) and A.A. ([email protected]).
Received 14 January; accepted 27 March; published online 20 April 2015; doi:10.1038/nm.3850
Molecular analysis of gastric cancer identifies subtypes associated with distinct clinical outcomesRazvan Cristescu1,12, Jeeyun Lee2,12, Michael Nebozhyn1,12, Kyoung-Mee Kim3,12, Jason C Ting4, Swee Seong Wong4, Jiangang Liu4, Yong Gang Yue4, Jian Wang4, Kun Yu4,11, Xiang S Ye4, In-Gu Do3, Shawn Liu5, Lara Gong5, Jake Fu6, Jason Gang Jin6, Min Gew Choi7, Tae Sung Sohn7, Joon Ho Lee7, Jae Moon Bae7, Seung Tae Kim2, Se Hoon Park2, Insuk Sohn8, Sin-Ho Jung8, Patrick Tan9,10, Ronghua Chen1, James Hardwick1,11, Won Ki Kang2, Mark Ayers1, Dai Hongyue1,11, Christoph Reinhard4, Andrey Loboda1, Sung Kim7 & Amit Aggarwal4
Gastric cancer, a leading cause of cancer-related deaths, is a heterogeneous disease. We aim to establish clinically relevant molecular subtypes that would encompass this heterogeneity and provide useful clinical information. We use gene expression data to describe four molecular subtypes linked to distinct patterns of molecular alterations, disease progression and prognosis. The mesenchymal-like type includes diffuse-subtype tumors with the worst prognosis, the tendency to occur at an earlier age and the highest recurrence frequency (63%) of the four subtypes. Microsatellite-unstable tumors are hyper-mutated intestinal-subtype tumors occurring in the antrum; these have the best overall prognosis and the lowest frequency of recurrence (22%) of the four subtypes. The tumor protein 53 (TP53)-active and TP53-inactive types include patients with intermediate prognosis and recurrence rates (with respect to the other two subtypes), with the TP53-active group showing better prognosis. We describe key molecular alterations in each of the four subtypes using targeted sequencing and genome-wide copy number microarrays. We validate these subtypes in independent cohorts in order to provide a consistent and unified framework for further clinical and preclinical translational research.
©20
15N
atu
re A
mer
ica,
Inc.
All
rig
hts
res
erve
d.
a r t i c l e s
� advance online publication nature medicine
We use expression data to define four distinct GC molecular subtypes. These subtypes are associated with distinct genomic alterations, sur-vival outcome and recurrence patterns after surgery. We validate the GC subtypes and their prognostic significance in different GC cohorts, thereby providing a molecular subtyping framework that can be used in preclinical, clinical and translational studies in GC.
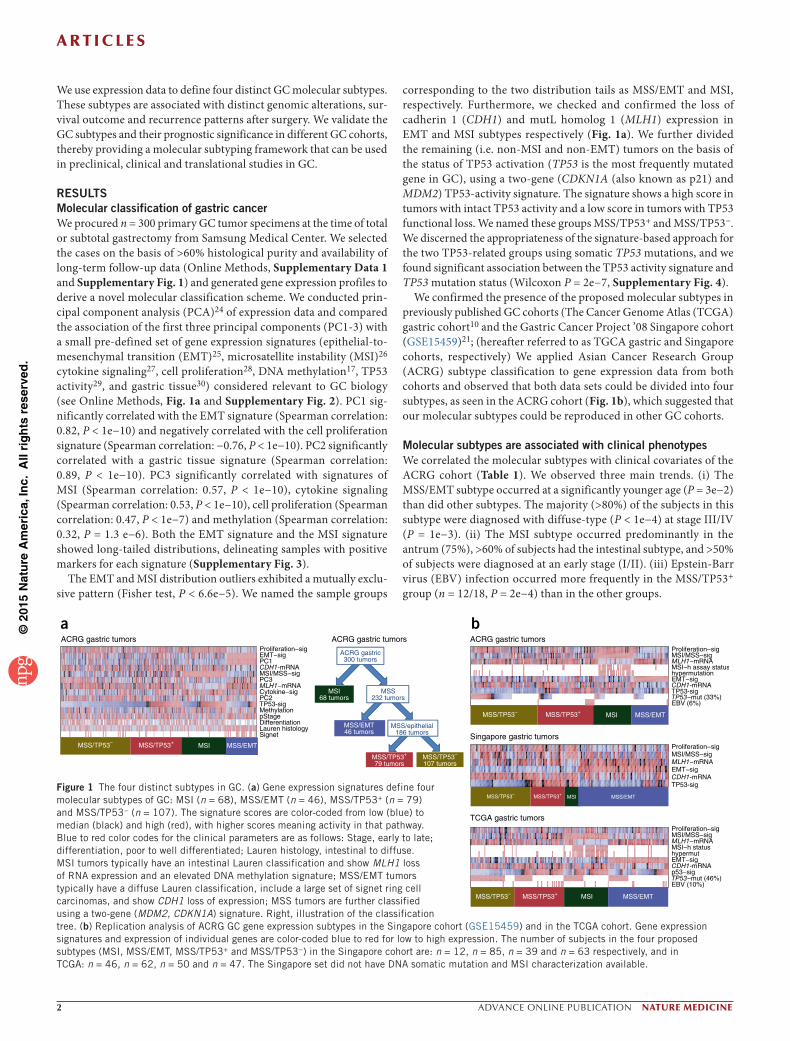
RESULTSMolecular classification of gastric cancerWe procured n = 300 primary GC tumor specimens at the time of total or subtotal gastrectomy from Samsung Medical Center. We selected the cases on the basis of >60% histological purity and availability of long-term follow-up data (Online Methods, Supplementary Data 1 and Supplementary Fig. 1) and generated gene expression profiles to derive a novel molecular classification scheme. We conducted prin-cipal component analysis (PCA)24 of expression data and compared the association of the first three principal components (PC1-3) with a small pre-defined set of gene expression signatures (epithelial-to-mesenchymal transition (EMT)25, microsatellite instability (MSI)26 cytokine signaling27, cell proliferation28, DNA methylation17, TP53 activity29, and gastric tissue30) considered relevant to GC biology (see Online Methods, Fig. 1a and Supplementary Fig. 2). PC1 sig-nificantly correlated with the EMT signature (Spearman correlation: 0.82, P < 1e−10) and negatively correlated with the cell proliferation signature (Spearman correlation: −0.76, P < 1e−10). PC2 significantly correlated with a gastric tissue signature (Spearman correlation: 0.89, P < 1e−10). PC3 significantly correlated with signatures of MSI (Spearman correlation: 0.57, P < 1e−10), cytokine signaling (Spearman correlation: 0.53, P < 1e−10), cell proliferation (Spearman correlation: 0.47, P < 1e−7) and methylation (Spearman correlation: 0.32, P = 1.3 e−6). Both the EMT signature and the MSI signature showed long-tailed distributions, delineating samples with positive markers for each signature (Supplementary Fig. 3).
The EMT and MSI distribution outliers exhibited a mutually exclu-sive pattern (Fisher test, P < 6.6e−5). We named the sample groups
corresponding to the two distribution tails as MSS/EMT and MSI, respectively. Furthermore, we checked and confirmed the loss of cadherin 1 (CDH1) and mutL homolog 1 (MLH1) expression in EMT and MSI subtypes respectively (Fig. 1a). We further divided the remaining (i.e. non-MSI and non-EMT) tumors on the basis of the status of TP53 activation (TP53 is the most frequently mutated gene in GC), using a two-gene (CDKN1A (also known as p21) and MDM2) TP53-activity signature. The signature shows a high score in tumors with intact TP53 activity and a low score in tumors with TP53 functional loss. We named these groups MSS/TP53+ and MSS/TP53−. We discerned the appropriateness of the signature-based approach for the two TP53-related groups using somatic TP53 mutations, and we found significant association between the TP53 activity signature and TP53 mutation status (Wilcoxon P = 2e−7, Supplementary Fig. 4).
We confirmed the presence of the proposed molecular subtypes in previously published GC cohorts (The Cancer Genome Atlas (TCGA) gastric cohort10 and the Gastric Cancer Project ’08 Singapore cohort (GSE15459)21; (hereafter referred to as TGCA gastric and Singapore cohorts, respectively) We applied Asian Cancer Research Group (ACRG) subtype classification to gene expression data from both cohorts and observed that both data sets could be divided into four subtypes, as seen in the ACRG cohort (Fig. 1b), which suggested that our molecular subtypes could be reproduced in other GC cohorts.
Molecular subtypes are associated with clinical phenotypesWe correlated the molecular subtypes with clinical covariates of the ACRG cohort (Table 1). We observed three main trends. (i) The MSS/EMT subtype occurred at a significantly younger age (P = 3e−2) than did other subtypes. The majority (>80%) of the subjects in this subtype were diagnosed with diffuse-type (P < 1e−4) at stage III/IV (P = 1e−3). (ii) The MSI subtype occurred predominantly in the antrum (75%), >60% of subjects had the intestinal subtype, and >50% of subjects were diagnosed at an early stage (I/II). (iii) Epstein-Barr virus (EBV) infection occurred more frequently in the MSS/TP53+ group (n = 12/18, P = 2e−4) than in the other groups.
ACRG gastric300 tumors
MSI68 tumors
MSS232 tumors
MSS/EMT46 tumors
MSS/epithelial186 tumors
MSS/TP53+
79 tumorsMSS/TP53–
107 tumors
ACRG gastric tumors
aProliferation−sigEMT−sigPC1CDH1-mRNAMSI/MSS−sigPC3MLH1−mRNACytokine−sigPC2TP53-sigMethylationpStageDifferentiationLauren histologySignet
MSS/TP53– MSS/TP53+ MSI MSS/EMT
ACRG gastric tumors ACRG gastric tumorsProliferation−sigMSI/MSS−sigMLH1−mRNAMSI−h assay statushypermutationEMT−sigCDH1-mRNATP53-sigTP53−mut (33%)EBV (6%)
MSS/TP53– MSS/TP53+ MSI MSS/EMT
Proliferation−sigMSI/MSS−sigMLH1−mRNAEMT−sigCDH1-mRNATP53-sig
Singapore gastric tumors
b
Proliferation−sigMSI/MSS−sigMLH1−mRNAMSI−h statushypermutEMT−sigCDH1-mRNAp53−sigTP53−mut (46%)EBV (10%)
TCGA gastric tumors
MSS/TP53– MSS/TP53+ MSI MSS/EMT
MSS/TP53– MSS/TP53+ MSI MSS/EMT
Figure 1 The four distinct subtypes in GC. (a) Gene expression signatures define four molecular subtypes of GC: MSI (n = 68), MSS/EMT (n = 46), MSS/TP53+ (n = 79) and MSS/TP53− (n = 107). The signature scores are color-coded from low (blue) to median (black) and high (red), with higher scores meaning activity in that pathway. Blue to red color codes for the clinical parameters are as follows: Stage, early to late; differentiation, poor to well differentiated; Lauren histology, intestinal to diffuse. MSI tumors typically have an intestinal Lauren classification and show MLH1 loss of RNA expression and an elevated DNA methylation signature; MSS/EMT tumors typically have a diffuse Lauren classification, include a large set of signet ring cell carcinomas, and show CDH1 loss of expression; MSS tumors are further classified using a two-gene (MDM2, CDKN1A) signature. Right, illustration of the classification tree. (b) Replication analysis of ACRG GC gene expression subtypes in the Singapore cohort (GSE15459) and in the TCGA cohort. Gene expression signatures and expression of individual genes are color-coded blue to red for low to high expression. The number of subjects in the four proposed subtypes (MSI, MSS/EMT, MSS/TP53+ and MSS/TP53−) in the Singapore cohort are: n = 12, n = 85, n = 39 and n = 63 respectively, and in TCGA: n = 46, n = 62, n = 50 and n = 47. The Singapore set did not have DNA somatic mutation and MSI characterization available.
©20
15N
atu
re A
mer
ica,
Inc.
All
rig
hts
res
erve
d.
a r t i c l e s
nature medicine advance online publication �
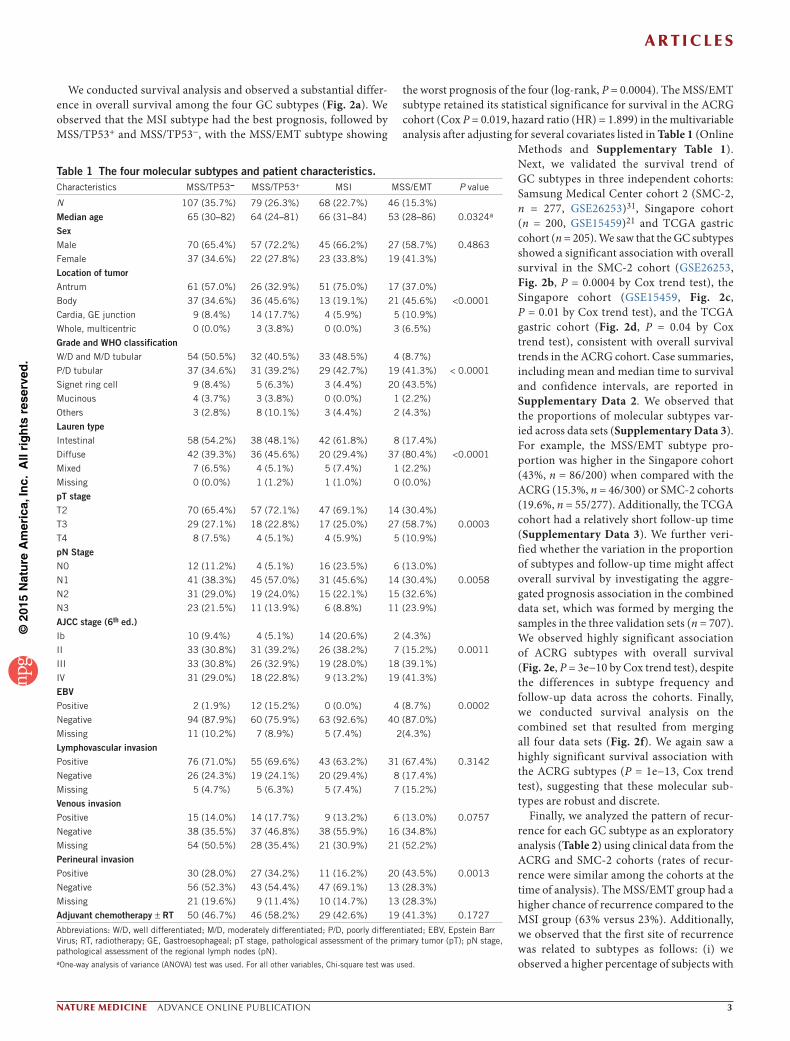
We conducted survival analysis and observed a substantial differ-ence in overall survival among the four GC subtypes (Fig. 2a). We observed that the MSI subtype had the best prognosis, followed by MSS/TP53+ and MSS/TP53−, with the MSS/EMT subtype showing
the worst prognosis of the four (log-rank, P = 0.0004). The MSS/EMT subtype retained its statistical significance for survival in the ACRG cohort (Cox P = 0.019, hazard ratio (HR) = 1.899) in the multivariable analysis after adjusting for several covariates listed in Table 1 (Online
Methods and Supplementary Table 1). Next, we validated the survival trend of GC subtypes in three independent cohorts: Samsung Medical Center cohort 2 (SMC-2, n = 277, GSE26253)31, Singapore cohort (n = 200, GSE15459)21 and TCGA gastric cohort (n = 205). We saw that the GC subtypes showed a significant association with overall survival in the SMC-2 cohort (GSE26253, Fig. 2b, P = 0.0004 by Cox trend test), the Singapore cohort (GSE15459, Fig. 2c, P = 0.01 by Cox trend test), and the TCGA gastric cohort (Fig. 2d, P = 0.04 by Cox trend test), consistent with overall survival trends in the ACRG cohort. Case summaries, including mean and median time to survival and confidence intervals, are reported in Supplementary Data 2. We observed that the proportions of molecular subtypes var-ied across data sets (Supplementary Data 3). For example, the MSS/EMT subtype pro-portion was higher in the Singapore cohort (43%, n = 86/200) when compared with the ACRG (15.3%, n = 46/300) or SMC-2 cohorts (19.6%, n = 55/277). Additionally, the TCGA cohort had a relatively short follow-up time (Supplementary Data 3). We further veri-fied whether the variation in the proportion of subtypes and follow-up time might affect overall survival by investigating the aggre-gated prognosis association in the combined data set, which was formed by merging the samples in the three validation sets (n = 707). We observed highly significant association of ACRG subtypes with overall survival (Fig. 2e, P = 3e−10 by Cox trend test), despite the differences in subtype frequency and follow-up data across the cohorts. Finally, we conducted survival analysis on the combined set that resulted from merging all four data sets (Fig. 2f). We again saw a highly significant survival association with the ACRG subtypes (P = 1e−13, Cox trend test), suggesting that these molecular sub-types are robust and discrete.
Finally, we analyzed the pattern of recur-rence for each GC subtype as an exploratory analysis (Table 2) using clinical data from the ACRG and SMC-2 cohorts (rates of recur-rence were similar among the cohorts at the time of analysis). The MSS/EMT group had a higher chance of recurrence compared to the MSI group (63% versus 23%). Additionally, we observed that the first site of recurrence was related to subtypes as follows: (i) we observed a higher percentage of subjects with
Table 1 The four molecular subtypes and patient characteristics.Characteristics MSS/TP53− MSS/TP53+ MSI MSS/EMT P value
N 107 (35.7%) 79 (26.3%) 68 (22.7%) 46 (15.3%)
Median age 65 (30–82) 64 (24–81) 66 (31–84) 53 (28–86) 0.0324a
SexMale 70 (65.4%) 57 (72.2%) 45 (66.2%) 27 (58.7%) 0.4863
Female 37 (34.6%) 22 (27.8%) 23 (33.8%) 19 (41.3%)
Location of tumorAntrum 61 (57.0%) 26 (32.9%) 51 (75.0%) 17 (37.0%)
Body 37 (34.6%) 36 (45.6%) 13 (19.1%) 21 (45.6%) <0.0001
Cardia, GE junction 9 (8.4%) 14 (17.7%) 4 (5.9%) 5 (10.9%)
Whole, multicentric 0 (0.0%) 3 (3.8%) 0 (0.0%) 3 (6.5%)
Grade and WHO classificationW/D and M/D tubular 54 (50.5%) 32 (40.5%) 33 (48.5%) 4 (8.7%)
P/D tubular 37 (34.6%) 31 (39.2%) 29 (42.7%) 19 (41.3%) < 0.0001
Signet ring cell 9 (8.4%) 5 (6.3%) 3 (4.4%) 20 (43.5%)
Mucinous 4 (3.7%) 3 (3.8%) 0 (0.0%) 1 (2.2%)
Others 3 (2.8%) 8 (10.1%) 3 (4.4%) 2 (4.3%)
Lauren typeIntestinal 58 (54.2%) 38 (48.1%) 42 (61.8%) 8 (17.4%)
Diffuse 42 (39.3%) 36 (45.6%) 20 (29.4%) 37 (80.4%) <0.0001
Mixed 7 (6.5%) 4 (5.1%) 5 (7.4%) 1 (2.2%)
Missing 0 (0.0%) 1 (1.2%) 1 (1.0%) 0 (0.0%)
pT stageT2 70 (65.4%) 57 (72.1%) 47 (69.1%) 14 (30.4%)
T3 29 (27.1%) 18 (22.8%) 17 (25.0%) 27 (58.7%) 0.0003
T4 8 (7.5%) 4 (5.1%) 4 (5.9%) 5 (10.9%)
pN StageN0 12 (11.2%) 4 (5.1%) 16 (23.5%) 6 (13.0%)
N1 41 (38.3%) 45 (57.0%) 31 (45.6%) 14 (30.4%) 0.0058
N2 31 (29.0%) 19 (24.0%) 15 (22.1%) 15 (32.6%)
N3 23 (21.5%) 11 (13.9%) 6 (8.8%) 11 (23.9%)
AJCC stage (6th ed.)Ib 10 (9.4%) 4 (5.1%) 14 (20.6%) 2 (4.3%)
II 33 (30.8%) 31 (39.2%) 26 (38.2%) 7 (15.2%) 0.0011
III 33 (30.8%) 26 (32.9%) 19 (28.0%) 18 (39.1%)
IV 31 (29.0%) 18 (22.8%) 9 (13.2%) 19 (41.3%)
EBVPositive 2 (1.9%) 12 (15.2%) 0 (0.0%) 4 (8.7%) 0.0002
Negative 94 (87.9%) 60 (75.9%) 63 (92.6%) 40 (87.0%)
Missing 11 (10.2%) 7 (8.9%) 5 (7.4%) 2(4.3%)
Lymphovascular invasionPositive 76 (71.0%) 55 (69.6%) 43 (63.2%) 31 (67.4%) 0.3142
Negative 26 (24.3%) 19 (24.1%) 20 (29.4%) 8 (17.4%)
Missing 5 (4.7%) 5 (6.3%) 5 (7.4%) 7 (15.2%)
Venous invasionPositive 15 (14.0%) 14 (17.7%) 9 (13.2%) 6 (13.0%) 0.0757
Negative 38 (35.5%) 37 (46.8%) 38 (55.9%) 16 (34.8%)
Missing 54 (50.5%) 28 (35.4%) 21 (30.9%) 21 (52.2%)
Perineural invasionPositive 30 (28.0%) 27 (34.2%) 11 (16.2%) 20 (43.5%) 0.0013
Negative 56 (52.3%) 43 (54.4%) 47 (69.1%) 13 (28.3%)
Missing 21 (19.6%) 9 (11.4%) 10 (14.7%) 13 (28.3%)
Adjuvant chemotherapy ± RT 50 (46.7%) 46 (58.2%) 29 (42.6%) 19 (41.3%) 0.1727
Abbreviations: W/D, well differentiated; M/D, moderately differentiated; P/D, poorly differentiated; EBV, Epstein Barr Virus; RT, radiotherapy; GE, Gastroesophageal; pT stage, pathological assessment of the primary tumor (pT); pN stage, pathological assessment of the regional lymph nodes (pN).aOne-way analysis of variance (ANOVA) test was used. For all other variables, Chi-square test was used.
©20
15N
atu
re A
mer
ica,
Inc.
All
rig
hts
res
erve
d.
a r t i c l e s
� advance online publication nature medicine
peritoneal seeding in the MSS/EMT GC subtype (64%, n = 41/64) versus all other subtypes (23%, n = 39/172); (ii) we found a higher percentage of liver-limited metastasis in the MSI (23%, n = 6/26) and MSS/TP53− subtypes (21%, n = 18/85) versus the MSS/EMT (4.6%, n = 3/64) and MSS/TP53+ (8%, n = 5/61) subtypes, further reinforcing the clinical relevance of this classification.
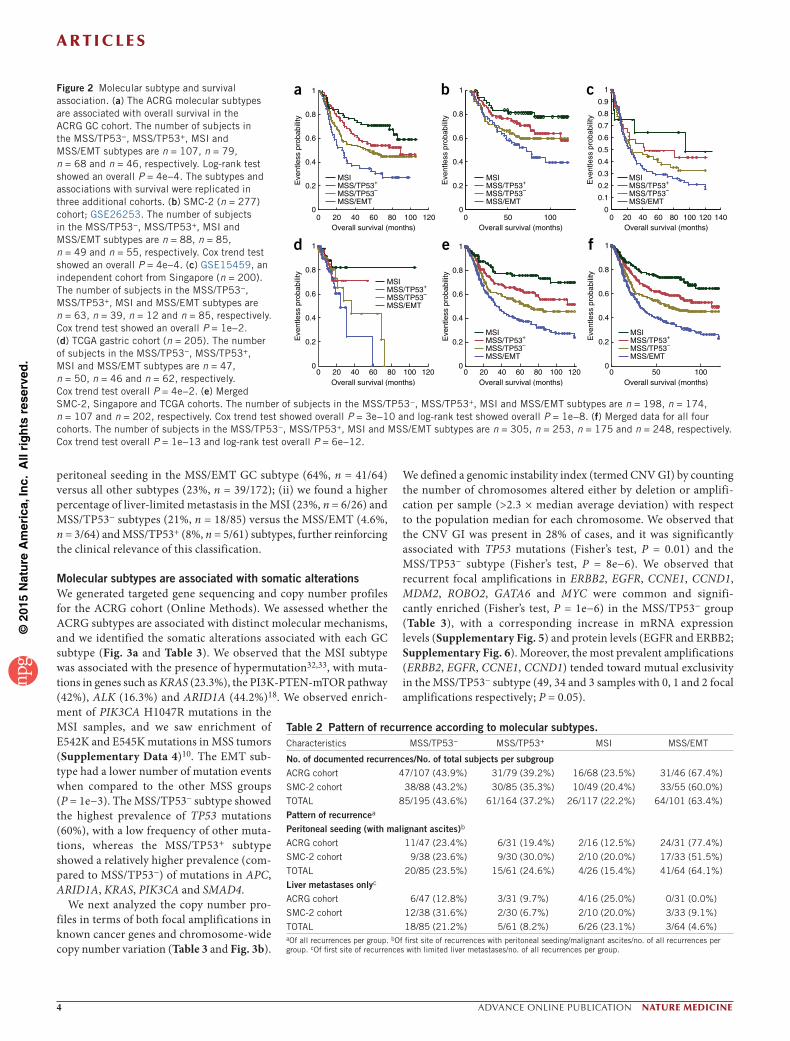
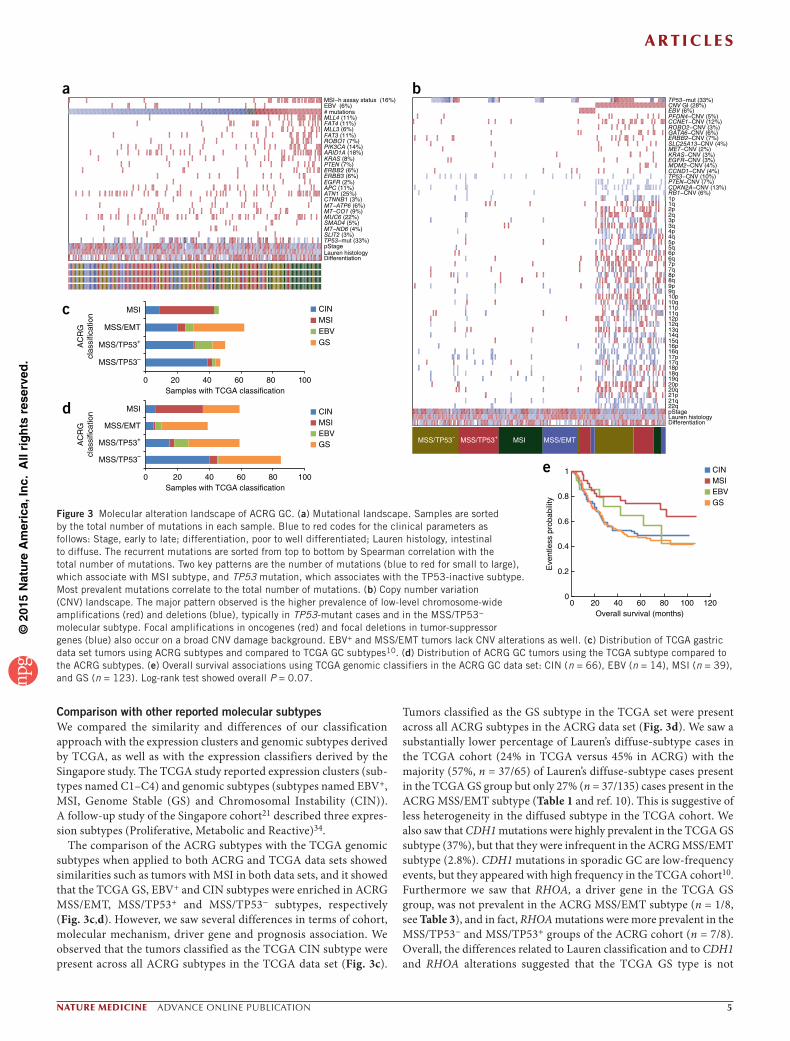
Molecular subtypes are associated with somatic alterationsWe generated targeted gene sequencing and copy number profiles for the ACRG cohort (Online Methods). We assessed whether the ACRG subtypes are associated with distinct molecular mechanisms, and we identified the somatic alterations associated with each GC subtype (Fig. 3a and Table 3). We observed that the MSI subtype was associated with the presence of hypermutation32,33, with muta-tions in genes such as KRAS (23.3%), the PI3K-PTEN-mTOR pathway (42%), ALK (16.3%) and ARID1A (44.2%)18. We observed enrich-ment of PIK3CA H1047R mutations in the MSI samples, and we saw enrichment of E542K and E545K mutations in MSS tumors (Supplementary Data 4)10. The EMT sub-type had a lower number of mutation events when compared to the other MSS groups (P = 1e−3). The MSS/TP53− subtype showed the highest prevalence of TP53 mutations (60%), with a low frequency of other muta-tions, whereas the MSS/TP53+ subtype showed a relatively higher prevalence (com-pared to MSS/TP53−) of mutations in APC, ARID1A, KRAS, PIK3CA and SMAD4.
We next analyzed the copy number pro-files in terms of both focal amplifications in known cancer genes and chromosome-wide copy number variation (Table 3 and Fig. 3b).
We defined a genomic instability index (termed CNV GI) by counting the number of chromosomes altered either by deletion or amplifi-cation per sample (>2.3 × median average deviation) with respect to the population median for each chromosome. We observed that the CNV GI was present in 28% of cases, and it was significantly associated with TP53 mutations (Fisher’s test, P = 0.01) and the MSS/TP53− subtype (Fisher’s test, P = 8e−6). We observed that recurrent focal amplifications in ERBB2, EGFR, CCNE1, CCND1, MDM2, ROBO2, GATA6 and MYC were common and signifi-cantly enriched (Fisher’s test, P = 1e−6) in the MSS/TP53− group (Table 3), with a corresponding increase in mRNA expression levels (Supplementary Fig. 5) and protein levels (EGFR and ERBB2; Supplementary Fig. 6). Moreover, the most prevalent amplifications (ERBB2, EGFR, CCNE1, CCND1) tended toward mutual exclusivity in the MSS/TP53− subtype (49, 34 and 3 samples with 0, 1 and 2 focal amplifications respectively; P = 0.05).
a
0 20 40 60 80 100 1200
0.2
0.4
0.6
0.8
1
Overall survival (months)
Eve
ntle
ss p
roba
bilit
y
d
0 20 40 60 80 100 1200
0.2
0.4
0.6
0.8
1
Overall survival (months)
Eve
ntle
ss p
roba
bilit
y
MSS/TP53–MSS/TP53+
MSS/EMT
MSI
MSS/TP53–MSS/TP53+
MSS/EMT
MSI
b
0 50 1000
0.2
0.4
0.6
0.8
1
Overall survival (months)
Eve
ntle
ss p
roba
bilit
y
e
0 20 40 60 80 100 1200
0.2
0.4
0.6
0.8
1
Overall survival (months)
Eve
ntle
ss p
roba
bilit
y
MSS/TP53–MSS/TP53+
MSS/EMT
MSI
MSS/TP53–MSS/TP53+
MSS/EMT
MSI
c
0 20 40 60 80 100 120 1400
0.1
0.2
0.3
0.4
0.5
0.6
0.7
0.8
0.9
1
Overall survival (months)
Eve
ntle
ss p
roba
bilit
y
0 50 1000
0.2
0.4
0.6
0.8
1
Overall survival (months)
Eve
ntle
ss p
roba
bilit
y
f
MSS/TP53–MSS/TP53+
MSS/EMT
MSI
MSS/TP53–MSS/TP53+
MSS/EMT
MSI
Figure 2 Molecular subtype and survival association. (a) The ACRG molecular subtypes are associated with overall survival in the ACRG GC cohort. The number of subjects in the MSS/TP53−, MSS/TP53+, MSI and MSS/EMT subtypes are n = 107, n = 79, n = 68 and n = 46, respectively. Log-rank test showed an overall P = 4e−4. The subtypes and associations with survival were replicated in three additional cohorts. (b) SMC-2 (n = 277) cohort; GSE26253. The number of subjects in the MSS/TP53−, MSS/TP53+, MSI and MSS/EMT subtypes are n = 88, n = 85, n = 49 and n = 55, respectively. Cox trend test showed an overall P = 4e−4. (c) GSE15459, an independent cohort from Singapore (n = 200). The number of subjects in the MSS/TP53−, MSS/TP53+, MSI and MSS/EMT subtypes are n = 63, n = 39, n = 12 and n = 85, respectively. Cox trend test showed an overall P = 1e−2. (d) TCGA gastric cohort (n = 205). The number of subjects in the MSS/TP53−, MSS/TP53+, MSI and MSS/EMT subtypes are n = 47, n = 50, n = 46 and n = 62, respectively. Cox trend test overall P = 4e−2. (e) Merged SMC-2, Singapore and TCGA cohorts. The number of subjects in the MSS/TP53−, MSS/TP53+, MSI and MSS/EMT subtypes are n = 198, n = 174, n = 107 and n = 202, respectively. Cox trend test showed overall P = 3e−10 and log-rank test showed overall P = 1e−8. (f) Merged data for all four cohorts. The number of subjects in the MSS/TP53−, MSS/TP53+, MSI and MSS/EMT subtypes are n = 305, n = 253, n = 175 and n = 248, respectively. Cox trend test overall P = 1e−13 and log-rank test overall P = 6e−12.
Table 2 Pattern of recurrence according to molecular subtypes.Characteristics MSS/TP53− MSS/TP53+ MSI MSS/EMT
No. of documented recurrences/No. of total subjects per subgroupACRG cohort 47/107 (43.9%) 31/79 (39.2%) 16/68 (23.5%) 31/46 (67.4%)
SMC-2 cohort 38/88 (43.2%) 30/85 (35.3%) 10/49 (20.4%) 33/55 (60.0%)
TOTAL 85/195 (43.6%) 61/164 (37.2%) 26/117 (22.2%) 64/101 (63.4%)
Pattern of recurrencea
Peritoneal seeding (with malignant ascites)b
ACRG cohort 11/47 (23.4%) 6/31 (19.4%) 2/16 (12.5%) 24/31 (77.4%)
SMC-2 cohort 9/38 (23.6%) 9/30 (30.0%) 2/10 (20.0%) 17/33 (51.5%)
TOTAL 20/85 (23.5%) 15/61 (24.6%) 4/26 (15.4%) 41/64 (64.1%)
Liver metastases onlyc
ACRG cohort 6/47 (12.8%) 3/31 (9.7%) 4/16 (25.0%) 0/31 (0.0%)
SMC-2 cohort 12/38 (31.6%) 2/30 (6.7%) 2/10 (20.0%) 3/33 (9.1%)
TOTAL 18/85 (21.2%) 5/61 (8.2%) 6/26 (23.1%) 3/64 (4.6%)aOf all recurrences per group. bOf first site of recurrences with peritoneal seeding/malignant ascites/no. of all recurrences per group. cOf first site of recurrences with limited liver metastases/no. of all recurrences per group.
©20
15N
atu
re A
mer
ica,
Inc.
All
rig
hts
res
erve
d.
a r t i c l e s
nature medicine advance online publication �
Comparison with other reported molecular subtypesWe compared the similarity and differences of our classification approach with the expression clusters and genomic subtypes derived by TCGA, as well as with the expression classifiers derived by the Singapore study. The TCGA study reported expression clusters (sub-types named C1–C4) and genomic subtypes (subtypes named EBV+, MSI, Genome Stable (GS) and Chromosomal Instability (CIN)). A follow-up study of the Singapore cohort21 described three expres-sion subtypes (Proliferative, Metabolic and Reactive)34.
The comparison of the ACRG subtypes with the TCGA genomic subtypes when applied to both ACRG and TCGA data sets showed similarities such as tumors with MSI in both data sets, and it showed that the TCGA GS, EBV+ and CIN subtypes were enriched in ACRG MSS/EMT, MSS/TP53+ and MSS/TP53− subtypes, respectively (Fig. 3c,d). However, we saw several differences in terms of cohort, molecular mechanism, driver gene and prognosis association. We observed that the tumors classified as the TCGA CIN subtype were present across all ACRG subtypes in the TCGA data set (Fig. 3c).
Tumors classified as the GS subtype in the TCGA set were present across all ACRG subtypes in the ACRG data set (Fig. 3d). We saw a substantially lower percentage of Lauren’s diffuse-subtype cases in the TCGA cohort (24% in TCGA versus 45% in ACRG) with the majority (57%, n = 37/65) of Lauren’s diffuse-subtype cases present in the TCGA GS group but only 27% (n = 37/135) cases present in the ACRG MSS/EMT subtype (Table 1 and ref. 10). This is suggestive of less heterogeneity in the diffused subtype in the TCGA cohort. We also saw that CDH1 mutations were highly prevalent in the TCGA GS subtype (37%), but that they were infrequent in the ACRG MSS/EMT subtype (2.8%). CDH1 mutations in sporadic GC are low-frequency events, but they appeared with high frequency in the TCGA cohort10. Furthermore we saw that RHOA, a driver gene in the TCGA GS group, was not prevalent in the ACRG MSS/EMT subtype (n = 1/8, see Table 3), and in fact, RHOA mutations were more prevalent in the MSS/TP53− and MSS/TP53+ groups of the ACRG cohort (n = 7/8). Overall, the differences related to Lauren classification and to CDH1 and RHOA alterations suggested that the TCGA GS type is not
MSI−h assay status (16%)EBV (6%)# mutationsMLL4 (11%)FAT4 (11%)MLL3 (6%)FAT3 (11%)ROBO1 (7%)PIK3CA (14%)ARID1A (18%)KRAS (8%)PTEN (7%)ERBB2 (6%)ERBB3 (6%)EGFR (2%)APC (11%)ATN1 (25%)CTNNB1 (3%)MT−ATP6 (6%)MT−CO1 (9%)MUC6 (22%)SMAD4 (5%)MT−ND6 (4%)SLIT2 (3%)TP53−mut (33%)pStageLauren histologyDifferentiation
TP53−mut (33%)CNV GI (28%)EBV (6%)PFDN4−CNV (5%)CCNE1−CNV (12%)ROBO2−CNV (3%)GATA6−CNV (6%)ERBB2−CNV (7%)SLC25A13−CNV (4%)MET−CNV (2%)KRAS−CNV (3%)EGFR−CNV (3%)MDM2−CNV (4%)CCND1−CNV (4%)TP53−CNV (10%)PTEN−CNV (7%)CDKN2A−CNV (13%)RB1−CNV (6%)1p1q2p2q3p3q4p4q5p5q6p6q7p7q8p8q9p9q10p10q11p11q12p12q13q14q15q16p16q17p17q18p18q19q20p20q21p21q22qpStageLauren histologyDifferentiation
MSS/TP53– MSS/TP53+ MSS/EMTMSI
a b
d
e
0 20 40 60 80 100 1200
0.2
0.4
0.6
0.8
1
Overall survival (months)
Eve
ntle
ss p
roba
bilit
y
CINMSIEBVGS
c
MSS/TP53–
MSS/TP53+
MSS/EMT
MSI CINMSIEBVGS
Samples with TCGA classification
AC
RG
clas
sific
atio
n
0 20 40 60 80 100
MSS/TP53–
MSS/TP53+
MSS/EMT
MSI CINMSIEBVGS
Samples with TCGA classification
AC
RG
clas
sific
atio
n
0 20 40 60 80 100
−−−−−−−−−−−−−−−−−−−−−−−−−−−−−−−−−−−−−−−−−−−−−−−−−−−−−−−−−−−−−−−−−−−−−−−−−−−−−−−−−−−−−−−−−−−−−−−−−−−−−−−−−−−−−−−−−−−−−−−−−−−−−−−−−−−−−−−−−−−−−−−−−−−−−−−−−−−−−−−−−−−−−−−−−−−−−−−−−−−−−−−−−−−−−−−−−−−−−−−−−−−−−−−−−−−−−−−−−−−−−−−−−−−−−−−−−−−−−−−−−−−−−−−−−−−−−−−−−−−−−−−−−−−−−−−−−−−−−−−−−−−−−−−−−−−−−−−−−−−−−−−−−−−−−−−−−−−−−−−−−−−−−−−−−−−−−−−−−−−−−−−−−−−−−−−−−−−−−−−−−−−−−−−−−−−−−−−−−−−−−−−−−−−−−−−−−−−−−−−−−−−−−−−−−−−−−−−−−−−−−−−−−−−−−−−−−−−−−−−−−−−−−−−−−−−−−−−−−−−−−−−−−−−−−−−−−−−−−−−−−−−−−−−−−−−−−−−−−−−−−−−−−−−−−−−−−−−−−−−−−−−−−−−−−−−−−−−−−−−−−−−−−−−−−−−−−−−−−−−−−−−−−−−−−−−−−−−−−−−−−−−−−−−−−−−−−−−−−−−−−−−−−−−−−−−−−−−−−−−−−−−−−−−−−−−−−−−−−−−−−−−−−−−−−−−−−−−−−−−−−−−−−−−−−−−−−−−−−−−−−−−−−−−−−−−−−−−−−−−−−−−−−−−−−−−−−−−−−−−−−−−−−−−−−−−−−−−−−−−−−−−−−−−−−−−−−−−−
Figure 3 Molecular alteration landscape of ACRG GC. (a) Mutational landscape. Samples are sorted by the total number of mutations in each sample. Blue to red codes for the clinical parameters as follows: Stage, early to late; differentiation, poor to well differentiated; Lauren histology, intestinal to diffuse. The recurrent mutations are sorted from top to bottom by Spearman correlation with the total number of mutations. Two key patterns are the number of mutations (blue to red for small to large), which associate with MSI subtype, and TP53 mutation, which associates with the TP53-inactive subtype. Most prevalent mutations correlate to the total number of mutations. (b) Copy number variation (CNV) landscape. The major pattern observed is the higher prevalence of low-level chromosome-wide amplifications (red) and deletions (blue), typically in TP53-mutant cases and in the MSS/TP53− molecular subtype. Focal amplifications in oncogenes (red) and focal deletions in tumor-suppressor genes (blue) also occur on a broad CNV damage background. EBV+ and MSS/EMT tumors lack CNV alterations as well. (c) Distribution of TCGA gastric data set tumors using ACRG subtypes and compared to TCGA GC subtypes10. (d) Distribution of ACRG GC tumors using the TCGA subtype compared to the ACRG subtypes. (e) Overall survival associations using TCGA genomic classifiers in the ACRG GC data set: CIN (n = 66), EBV (n = 14), MSI (n = 39), and GS (n = 123). Log-rank test showed overall P = 0.07.
©20
15N
atu
re A
mer
ica,
Inc.
All
rig
hts
res
erve
d.
a r t i c l e s
� advance online publication nature medicine
equivalent to the ACRG MSS/EMT subtype. Next we looked at the MSS/TP53+ subtype and EBV in both cohorts. We saw that the EBV+ cases represent a small proportion of samples in the MSS/TP53+ sub-type with n = 12/18 EBV+ tumors present in n = 79 tumors in the MSS/TP53+ group (Fig. 3d,c), suggesting that these two subtypes are probably different. Finally, we classified ACRG tumors using the TCGA genomic scheme and saw a much weaker association with the prognosis trend (n = 242 samples with information on EBV, MSI, CIN and GS; Fig. 3e), compared with the original prognosis trends (Fig. 2). We saw that CIN and GS show no difference in prognosis in the ACRG cohort, with the MSI group consistently showing better prognosis across the two classification systems.
Further comparison of expression subtypes from the ACRG, Singapore and TCGA cohorts (Supplementary Fig. 7) showed high similarity between the Singapore and TCGA expression subtypes, except for the cytokine or TCGA C2 cluster, which was missing from the expression subtypes from the Singapore classification. No equivalent subtype that corresponded to the ACRG MSS/TP53+ or MSS/TP53− groups was present in either the TCGA or Singapore cohorts. Our overall analysis suggested that the ACRG classification scheme is unique.
Association between GC pathogens and subtypesWe observed EBV infection in 6.5% (n = 18/275) and Helicobacter pylori infection in 42.5% (n = 55/127) of cases, respectively in the ACRG cohort. The EBV+ GCs lacked either copy number variation (CNV GI) or hypermutation, and they occurred more frequently (n = 12/18 of EBV+) in the MSS/TP53+ subtype (Fig. 2c), suggesting a distinct tumorigenic profile for these tumors. We saw significant
enrichment of PIK3CA mutations (40% ver-sus 6%, P = 5e−3) and ARID1A mutations (47% versus 10%, P = 5e−3) within EBV+ GC compared to MSS subtypes10. We also identi-fied significant association of EBV infection with cytokine signature (receiver operating characteristic (ROC)–area under the curve (AUC) = 0.86, P = 1e−3), consistent with reports of increased immune infiltrate in virally driven cancers35. We did not observe any significant association of molecular subtypes with H. pylori infection (P = 0.3). We observed that the co-infection is not significantly associated with ACRG subtypes in tumors for which infection status informa-tion is available for both pathogens.
DISCUSSIONMolecular signatures associated with dis-tinct clinical outcomes have been deline-ated in various solid tumors, thereby laying the groundwork for improved clinical management through the development of personalized medicine36–40. Several mole-cular characterization studies have been conducted in GC7–22. However, a consensus on clinically relevant subtypes that encom-passes molecular heterogeneity and that can be used in preclinical and clinical research has not been reported. Here we report the molecular classification of GC linked
not only to distinct patterns of genomic alterations, but also to recurrence pattern and prognosis across multiple GC cohorts.
The exclusivity between MSI and CIN was previously described in solid tumors as well as in pan-cancer analysis of TCGA tumors41,42. Our subtype classification draws from that stratification approach and supplements it by incorporating two key molecular mechanisms related to TP53 activity and EMT to further stratify GC patients. We show applicability of ACRG subtypes in three additional GC cohorts and their consistent and significant association with survival despite the various sources of heterogeneity and cohort differences. We believe this is a consequence of (i) using TP53 activity signature as well as the molecular differences between two highly prolifera-tive subtypes (MSI and MSS/TP53−) which have distinct molecu-lar mechanisms and survival outcomes—notably, whereas the TP53 signature is associated with survival in the MSS non-EMT subtype, neither TP53 mutation status nor tumor proliferation signature alone significantly predicts survival (data not shown); (ii) defining EMT as a separate subtype which showed the worst prognosis; (iii) using gene expression–based classification, as RNA is more likely to reflect the cellular phenotypes; and (iv) taking advantage of detailed clinical and follow-up data in conjunction with genomic data.
Our study has potentially important clinical implications in GC. First, molecular screening and therapeutic development according to the GC molecular classifications should be considered, especially when newer targeted agents are being developed. Currently, the anti-tumor efficacy of a molecularly targeted agent is tested in all GC types as a whole regardless of molecular subtypes both in preclinical and clinical trials. As an example, PIK3CA mutations appear in different GC subtypes, but with varying prognosis and inhibitors
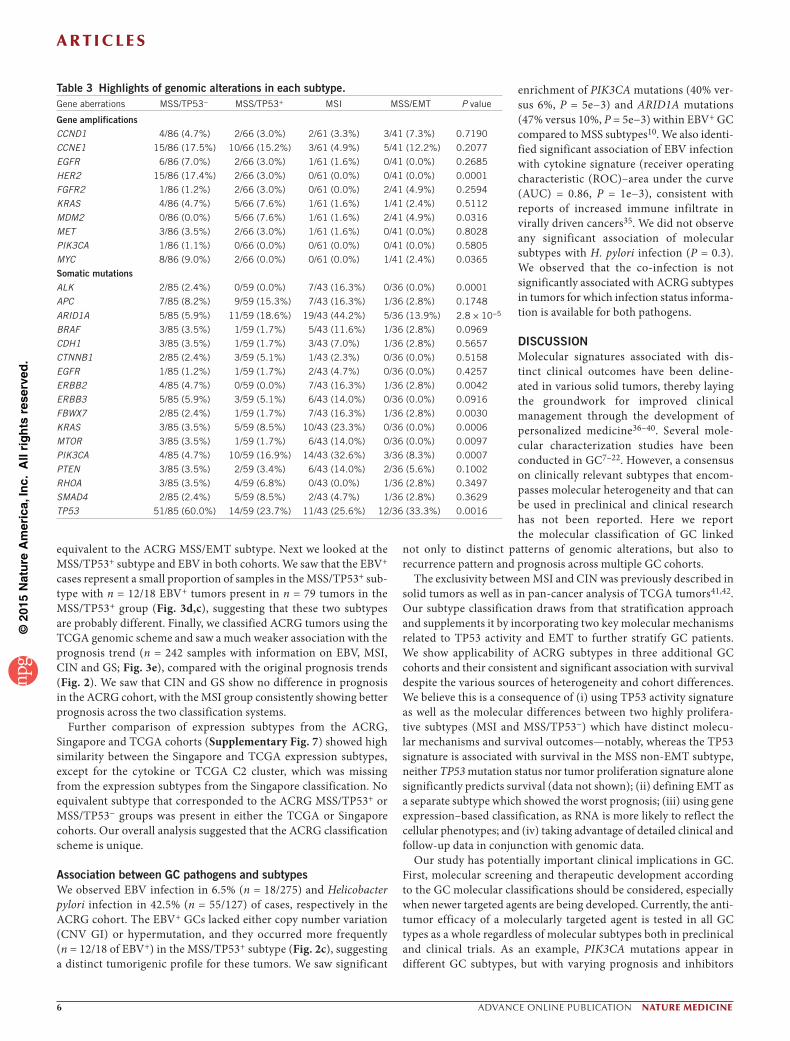
Table 3 Highlights of genomic alterations in each subtype.Gene aberrations MSS/TP53− MSS/TP53+ MSI MSS/EMT P value
Gene amplificationsCCND1 4/86 (4.7%) 2/66 (3.0%) 2/61 (3.3%) 3/41 (7.3%) 0.7190
CCNE1 15/86 (17.5%) 10/66 (15.2%) 3/61 (4.9%) 5/41 (12.2%) 0.2077
EGFR 6/86 (7.0%) 2/66 (3.0%) 1/61 (1.6%) 0/41 (0.0%) 0.2685
HER2 15/86 (17.4%) 2/66 (3.0%) 0/61 (0.0%) 0/41 (0.0%) 0.0001
FGFR2 1/86 (1.2%) 2/66 (3.0%) 0/61 (0.0%) 2/41 (4.9%) 0.2594
KRAS 4/86 (4.7%) 5/66 (7.6%) 1/61 (1.6%) 1/41 (2.4%) 0.5112
MDM2 0/86 (0.0%) 5/66 (7.6%) 1/61 (1.6%) 2/41 (4.9%) 0.0316
MET 3/86 (3.5%) 2/66 (3.0%) 1/61 (1.6%) 0/41 (0.0%) 0.8028
PIK3CA 1/86 (1.1%) 0/66 (0.0%) 0/61 (0.0%) 0/41 (0.0%) 0.5805
MYC 8/86 (9.0%) 2/66 (0.0%) 0/61 (0.0%) 1/41 (2.4%) 0.0365
Somatic mutationsALK 2/85 (2.4%) 0/59 (0.0%) 7/43 (16.3%) 0/36 (0.0%) 0.0001
APC 7/85 (8.2%) 9/59 (15.3%) 7/43 (16.3%) 1/36 (2.8%) 0.1748
ARID1A 5/85 (5.9%) 11/59 (18.6%) 19/43 (44.2%) 5/36 (13.9%) 2.8 × 10⁻⁵
BRAF 3/85 (3.5%) 1/59 (1.7%) 5/43 (11.6%) 1/36 (2.8%) 0.0969
CDH1 3/85 (3.5%) 1/59 (1.7%) 3/43 (7.0%) 1/36 (2.8%) 0.5657
CTNNB1 2/85 (2.4%) 3/59 (5.1%) 1/43 (2.3%) 0/36 (0.0%) 0.5158
EGFR 1/85 (1.2%) 1/59 (1.7%) 2/43 (4.7%) 0/36 (0.0%) 0.4257
ERBB2 4/85 (4.7%) 0/59 (0.0%) 7/43 (16.3%) 1/36 (2.8%) 0.0042
ERBB3 5/85 (5.9%) 3/59 (5.1%) 6/43 (14.0%) 0/36 (0.0%) 0.0916
FBWX7 2/85 (2.4%) 1/59 (1.7%) 7/43 (16.3%) 1/36 (2.8%) 0.0030
KRAS 3/85 (3.5%) 5/59 (8.5%) 10/43 (23.3%) 0/36 (0.0%) 0.0006
MTOR 3/85 (3.5%) 1/59 (1.7%) 6/43 (14.0%) 0/36 (0.0%) 0.0097
PIK3CA 4/85 (4.7%) 10/59 (16.9%) 14/43 (32.6%) 3/36 (8.3%) 0.0007
PTEN 3/85 (3.5%) 2/59 (3.4%) 6/43 (14.0%) 2/36 (5.6%) 0.1002
RHOA 3/85 (3.5%) 4/59 (6.8%) 0/43 (0.0%) 1/36 (2.8%) 0.3497
SMAD4 2/85 (2.4%) 5/59 (8.5%) 2/43 (4.7%) 1/36 (2.8%) 0.3629
TP53 51/85 (60.0%) 14/59 (23.7%) 11/43 (25.6%) 12/36 (33.3%) 0.0016
©20
15N
atu
re A
mer
ica,
Inc.
All
rig
hts
res
erve
d.
a r t i c l e s
nature medicine advance online publication �
targeting PIK3CA, one may need to consider the underlying subtypes to interpret the responses. Second, molecular alterations relevant to molecular treatments are associated with our subtype stratification. Specifically, gene amplifications are enriched in the MSS/TP53− subtype, for which approved therapies exist (trastuzumab, Receptor tyrosine-protein kinase erbB-2 (HER2-targeting agent)43 or have ongoing clinical investigations (for example, nimotuzumab, epider-mal growth factor receptor (EGFR)-targeting agent). Other rational treatment options could be CDK4/6 inhibitors for CCND1 ampli-fications, CDK2 inhibitors for CCNE1 amplifications, and MDM2 inhibitors for MDM2 amplifications. Given the mutual exclusivity of these alterations and their uniform molecular background, these could potentially translate into a durable response. Third, diffuse-type GCs are typically referred to as poorly differentiated and EMT-like adenocarcinomas. However, only a subset of diffuse-subtype cases consistently show poor prognosis and hallmarks of EMT. This group may require more aggressive clinical management and a bet-ter understanding of underlying pathogenesis. Fourth, cancer cell lines are important tools in translating the findings. We examined the presence of GC subtypes in gastro-esophageal cell lines from the Cancer Cell Line Encyclopedia project (CCLE)44, and we saw under-representation of the MSS/TP53+ subtype (Supplementary Fig. 8). The paucity of the TP53-active subtype in cell line model systems warrants further investigation into developing more clinically relevant models of GC to fill this translational gap. Finally, our subtyping could potentially be applicable to other gastrointestinal cancer types such as colorectal cancer. Our preliminary work in colorectal cancer has shown the presence of subtypes (Supplementary Fig. 9), but much more needs to be done to study their presence and clinical relevance across other tumor types.
One of the foreseeable hurdles for the use of molecular signa-tures in practice is cost. We believe that multiplexed assays such as Mammaprint or PAM50 can be developed and applied in GC. Alternatively immunohistochemistry and RNA-in situ hybridization techniques could be used. The MSI group can be identified using MLH1 immunohistochemical analysis or the Pentaplex assay, and the MSS/EMT group can be identified using VIM, ZEB1 or CDH1 expression (ROC–AUC = 0.9, 0.97, 0.86 respectively). The remaining samples can be divided into MSS/TP53-related groups by an assay using MDM2 and CDKN1A expression.
In summary, we provide a stratification framework that may aid in the discovery and development of rational treatment options for GC patients and thus provide them with more meaningful outcomes.
METHODSMethods and any associated references are available in the online version of the paper.
Accession codes. Data have been deposited into NCBI Gene Expression Omnibus (GEO): Gene expression microarrays (GSE62254) and SNP6 microarrays (GSE62717).
Note: Any Supplementary Information and Source Data files are available in the online version of the paper.
ACKNoWLeDGMeNTSThe Asian Cancer Research Group (ACRG, http://www.asiancancerresearchgroup.org/about_us.html) is a non-profit consortium of pharmaceutical industry and academic medical centers and genomics companies dedicated to accelerating research, and ultimately improving treatment for patients affected with the most commonly-diagnosed cancers in Asia. ACRG seeks to increase and improve the knowledge of cancers prevalent in Asia by generating comprehensive genomic
data sets and sharing them freely with the scientific community in order to accelerate drug discovery efforts. This study is primarily supported by the ACRG. Samsung Medical Center provided partial support through grant no. GF01140111 (K.-M.K. and J. Lee).
AuTHoR CoNTRIBuTIoNSJ. Lee, C.R., A.A. and S.K. conceptualized and planned the study. M.G.C., T.S.S., J.H.L., S.T.K., W.K.K., S.H.P. and J.M.B. contributed to collection of surgical samples and associated clinical information. K.-M.K. and I.-G.D. conducted the pathology assessment. A.A., K.-M.K., A.L. and J. Lee coordinated the data generation and led the data analysis. L.G. and S.L. generated the targeted sequencing data. S.S.W. analyzed the sequencing data. J.G.J. and J.F. generated the Affymetrix gene expression and Affymetrix SNP6 data. R. Cristescu, M.N., J.C.T., K.Y., J.W., Y.G.Y., J. Liu and A.L. processed, analyzed and participated in discussions related to the genomics data. I.S. and S.-H.J. conducted the statistical analysis of the clinical data. P.T., J.H., R. Chen, X.S.Y., M.A. and D.H. participated in discussions, provided critical scientific input, analysis suggestions and logistical support toward the project. R. Cristescu, J. Lee, M.N., K.-M.K. and A.A. wrote the manuscript.
CoMPeTING FINANCIAL INTeReSTSThe authors declare no competing financial interests.
Reprints and permissions information is available online at http://www.nature.com/reprints/index.html.
1. Jemal, A. et al. Global cancer statistics. CA Cancer J. Clin. 61, 69–90 (2011).2. Edge, S. et al. (eds.). AJCC Cancer Staging Manual (Springer, New York, 2010).3. Lee, J. et al. Phase III trial comparing capecitabine plus cisplatin versus capecitabine
plus cisplatin with concurrent capecitabine radiotherapy in completely resected gastric cancer with D2 lymph node dissection: the ARTIST trial. J. Clin. Oncol. 30, 268–273 (2012).
4. Kim, S. et al. An observational study suggesting clinical benefit for adjuvant postoperative chemoradiation in a population of over 500 cases after gastric resection with D2 nodal dissection for adenocarcinoma of the stomach. Int. J. Radiat. Oncol. Biol. Phys. 63, 1279–1285 (2005).
5. Bang, Y.J. et al. Adjuvant capecitabine and oxaliplatin for gastric cancer after D2 gastrectomy (CLASSIC): a phase 3 open-label, randomised controlled trial. Lancet 379, 315–321 (2012).
6. Macdonald, J.S. et al. Chemoradiotherapy after surgery compared with surgery alone for adenocarcinoma of the stomach or gastroesophageal junction. N. Engl. J. Med. 345, 725–730 (2001).
7. Wang, G. et al. Comparison of global gene expression of gastric cardia and noncardia cancers from a high-risk population in China. PLoS ONE 8, e63826 (2013).
8. Shah, M.A. et al. Molecular classification of gastric cancer: a new paradigm. Clin. Cancer Res. 17, 2693–2701 (2011).
9. Tay, S.T. et al. A combined comparative genomic hybridization and expression microarray analysis of gastric cancer reveals novel molecular subtypes. Cancer Res. 63, 3309–3316 (2003).
10. Cancer Genome Atlas Research Network. et al. Comprehensive molecular characterization of gastric adenocarcinoma. Nature 513, 202–209 (2014).
11. Chen, X. et al. Variation in gene expression patterns in human gastric cancers. Mol. Biol. Cell 14, 3208–3215 (2003).
12. Tan, I.B. et al. Intrinsic subtypes of gastric cancer, based on gene expression pattern, predict survival and respond differently to chemotherapy. Gastroenterology 141, 476–485 (2011).
13. Cho, J.Y. et al. Gene expression signature-based prognostic risk score in gastric cancer. Clin. Cancer Res. 17, 1850–1857 (2011).
14. Deng, N. et al. A comprehensive survey of genomic alterations in gastric cancer reveals systematic patterns of molecular exclusivity and co-occurrence among distinct therapeutic targets. Gut 61, 673–684 (2012).
15. An, C. et al. Prognostic significance of CpG island methylator phenotype and microsatellite instability in gastric carcinoma. Clin. Cancer Res. 11, 656–663 (2005).
16. Liu, Z. et al. Large-scale characterization of DNA methylation changes in human gastric carcinomas with and without metastasis. Clin. Cancer Res. 20, 4598–4612 (2014).
17. Zouridis, H. et al. Methylation subtypes and large-scale epigenetic alterations in gastric cancer. Sci. Transl. Med. 4, 156ra140 (2012).
18. Wang, K. et al. Whole-genome sequencing and comprehensive molecular profiling identify new driver mutations in gastric cancer. Nat. Genet. 46, 573–582 (2014).
19. Kakiuchi, M. et al. Recurrent gain-of-function mutations of RHOA in diffuse-type gastric carcinoma. Nat. Genet. 46, 583–587 (2014).
20. Liu, J. et al. Integrated exome and transcriptome sequencing reveals ZAK isoform usage in gastric cancer. Nat. Commun. 5, 3830 (2014).
21. Ooi, C.H. et al. Oncogenic pathway combinations predict clinical prognosis in gastric cancer. PLoS Genet. 5, e1000676 (2009).
©20
15N
atu
re A
mer
ica,
Inc.
All
rig
hts
res
erve
d.
a r t i c l e s
� advance online publication nature medicine
22. Wu, Y. et al. Comprehensive genomic meta-analysis identifies intra-tumoural stroma as a predictor of survival in patients with gastric cancer. Gut 62, 1100–1111 (2013).
23. Wong, S.S. et al. Genomic landscape and genetic heterogeneity in gastric adenocarcinoma revealed by whole-genome sequencing. Nat. Commun. 5, 5477 (2014).
24. Jolliffe, I. Principal Component Analysis (Wiley Online Library, 2002).25. Loboda, A. et al. EMT is the dominant program in human colon cancer. BMC Med.
Genomics 4, 9 (2011).26. CancerGenomeAtlasResearchNetwork. Comprehensive molecular characterization of
human colon and rectal cancer. Nature 487, 330–337 (2012).27. Coppola, D. et al. Unique ectopic lymph node-like structures present in
human primary colorectal carcinoma are identified by immune gene array profiling. Am. J. Pathol. 179, 37–45 (2011).
28. Dai, H. et al. A cell proliferation signature is a marker of extremely poor outcome in a subpopulation of breast cancer patients. Cancer Res. 65, 4059–4066 (2005).
29. Cancer Genome Atlas Research Network. et al. Comprehensive molecular portraits of human breast tumours. Nature 490, 61–70 (2012).
30. Benita, Y. et al. Gene enrichment profiles reveal T cell development, differentiation, and lineage-specific transcription factors including ZBTB25 as a novel NF-AT repressor. Blood 115, 5376–5384 (2010).
31. Lee, J. et al. Nanostring-based multigene assay to predict recurrence for gastric cancer patients after surgery. PLoS ONE 9, e90133 (2014).
32. Mori, Y. et al. Instabilotyping reveals unique mutational spectra in microsatellite-unstable gastric cancers. Cancer Res. 62, 3641–3645 (2002).
33. Mori, Y. et al. The impact of microsatellite instability on the molecular phenotype of colorectal tumors. Cancer Res. 63, 4577–4582 (2003).
34. Lei, Z. et al. Identification of molecular subtypes of gastric cancer with different responses to PI3-kinase inhibitors and 5-fluorouracil. Gastroenterology 145, 554–565 (2013).
35. Russell, S. et al. Immune cell infiltration patterns and survival in head and neck squamous cell carcinoma. Head Neck Oncol. 5, 24 (2013).
36. Sørlie, T. et al. Gene expression patterns of breast carcinomas distinguish tumor subclasses with clinical implications. Proc. Natl. Acad. Sci. USA 98, 10869–10874 (2001).
37. Higgins, M.J. & Baselga, J. Targeted therapies for breast cancer. J. Clin. Invest. 121, 3797–3803 (2011).
38. Roepman, P. et al. Colorectal cancer intrinsic subtypes predict chemotherapy benefit, deficient mismatch repair and epithelial-to-mesenchymal transition. Int. J. Cancer. 134, 552–562 (2014).
39. Salazar, R. et al. Gene expression signature to improve prognosis prediction of stage II and III colorectal cancer. J. Clin. Oncol. 29, 17–24 (2011).
40. Li, T., Kung, H.J., Mack, P.C. & Gandara, D.R. Genotyping and genomic profiling of non-small-cell lung cancer: implications for current and future therapies. J. Clin. Oncol. 31, 1039–1049 (2013).
41. Cancer Genome Atlas Research Network. Integrated genomic characterization of endometrial carcinoma. Nature 497, 67–73 (2013).
42. Ciriello, G. et al. Emerging landscape of oncogenic signatures across human cancers. Nat. Genet. 45, 1127–1133 (2013).
43. Bang, Y.J. et al. Trastuzumab in combination with chemotherapy versus chemotherapy alone for treatment of HER2-positive advanced gastric or gastro-oesophageal junction cancer (ToGA): a phase 3, open-label, randomised controlled trial. Lancet 376, 687–697 (2010).
44. Barretina, J. et al. The Cancer Cell Line Encyclopedia enables predictive modelling of anticancer drug sensitivity. Nature 483, 603–607 (2012).
©20
15N
atu
re A
mer
ica,
Inc.
All
rig
hts
res
erve
d.
nature medicinedoi:10.1038/nm.3850
ONLINE METHODSStudy design, tissue specimens and pathology. We designed this study as a disease landscape study with no pre-specified hypothesis. We profiled n = 300 tumors higher than any of the studies in public domain (April 2010) from any single group to enable biologically and clinically relevant subgroup detection. We generated genomics data described below comprising (i) whole-genome sequencing of n = 49 GC tumors and recurrent mutation information (published elsewhere23) that informed selection of genes for targeted re-sequencing done in this study; and (ii) gene expression, copy number profiling and targeted re-sequencing (Supplementary Fig. 1).
We procured n = 300 primary independent GC specimens at the time of total or subtotal gastrectomy at Samsung Medical Centre, Seoul, Korea, from 2004–2007 (all of the tissue specimens were at chemo-naïve state during primary resection of gastric cancer). We stored all the tissue samples at −80 °C. Samsung Medical Centre Institutional Review Board (IRB no. 2010-12-088) approved the protocol. We obtained informed consent according to the IRB protocol. We clinically annotated the tumors but de-linked them from personally identifiable information. This cohort has a median follow-up time of 86.4 months (range: 53.1–106.6 months). No subjects received neoadjuvant chemotherapy or chemo-radiation therapy. Ninety-eight subjects received post-operative chemotherapy or chemoradiation therapy (CRT) in this cohort. The post-operative surveil-lance program for recurrence is to follow up every 6 months until 5 years from the date of surgery.
We selected cases on the basis of the following criteria: histologically confirmed adenocarcinoma of the stomach; surgical resection of primary GC; age ≥18 years; and complete pathological, surgical, treatment, and follow-up data. Two expert gastrointestinal pathologists (K.-M.K., I.-G.D.) reviewed H&E-stained slides to select cases with estimated carcinoma content of at least 60%. We used primary GC tissues for the genomic analysis and reevaluated the pathologic diagnosis, histologic Lauren subtype, depth of invasion and lymphovascular invasion in all tumors.
For the tissue microarray, we reviewed all H&E-stained slides and carefully selected representative histological areas and marked them on the paraffin blocks. We took four primary GC tissue cores (diameter = 0.6 mm) from the rep-resentative areas of paraffin blocks using AccuMax (IsuAbxis, Seoul, Korea).
We performed MLH1 immunohistochemistry using the clone ES05 MLH1-specific antibody (1:100 dilution, Novocastra, UK) in formalin-fixed paraffin-embedded (FFPE) tissue sections. For further MSI analyses of MLH1-negative cases, we used five markers with mononucleotide repeats (BAT-25, BAT-26, NR-21, NR-24 and NR-27) as previously described45. We end-labeled each sense primer with one of the fluorescent markers FAM, HEX or NED. We performed Pentaplex PCR and ran the amplified PCR products on an Applied Biosystems PRISM 3130 automated genetic analyzer. We estimated allelic sizes using Genescan 2.1 software (Applied Biosystems, Foster City, CA). We considered the samples with allelic size variations in more than three microsatellites as MSI-high. Almost all MLH1-low cases were MSI-high (Supplementary Fig. 10).
We checked for the presence of EBVinfection as follows. We cut 3-µm-thick paraffin sections of the tissue microarrays and mounted them onto SuperFrost Plus slides (Thermo Scientific, Waltham, MA) for EBV in situ hybridization. We performed the entire in situ hybridization procedure on a fully automatic system (Leica BOND-MAX, Leica Biosystems, Newcastle, UK) with a Bond Ready-to-Use ISH EBER (EBV-encoded RNA) probe (Leica Biosystems, Newcastle, UK) according to the manufacturer’s instructions. We considered the cases with a strong signal within almost all tumor cell nuclei to be positive46.
We investigated ERBB2 (HER2) and EGFR overexpression by immuno-histochemistry. We conducted the investigation using PATHWAY anti-HER-2/neu (4B5) (Ventana Medical Systems, Tucson, AZ, USA; No dilution needed) and anti-NCL-L-EGFR-384 (Novocastra/Vision Biosystems, Newcastle, UK; 1/100 dilution) antibodies. We used the BenchMark XT automated slide-processing system (Ventana Medical Systems, Tucson, AZ) according to the manufacturer’s protocol and scored the gene status in accordance with the recently developed assessment guidelines47. Briefly, we deparaffinized and rehydrated 4-µm tissue sections and retrieved antigens for 40 min in a citrate buffer (pH 6.1) at 95 °C. We used DAB as the chromogen, and the sections were counterstained with hematoxylin.
We microscopically examined the presence of H. pylori in gastric biopsy specimens stained with H&E and toluidine blue.
Gene expression profiling. We extracted the RNA from 300 tumors according to the manufacturer’s protocol (Affymetrix Inc., Santa Clara, CA, USA). We used Affymetrix Human Genome U133plus 2.0 Array for gene expression profiling and processed the raw files using standard Affymetrix software, including RMA normalization.
Gene signature analysis. We used gene expression data to generate the subtypes, and we did not generate or use any additional whole-genome or whole-exome sequencing data. We performed principal component analysis (PCA) on the gene expression data set and then analyzed the association between the principal com-ponents and signatures relevant to cancer and GI tract biology. We calculated the gene expression signature scores using the average of log intensity (also known as the geometric average) of expression of genes in the signature. We compared the association of the first three principal components (PC 1–3) with several pre-defined published gene expression signatures relevant for cancer biology, including EMT signature25, MSI/MSS26, cytokine signature27, proliferation sig-nature28, gastric tissue signature30 and a TP53 signature29. All the detailed gene lists are provided in Supplementary Data 5.
Classification into molecular subtypes. We used the signatures of EMT, MSI and TP53 activity to define molecular subtypes. The distribution tails of MSI and EMT signatures exhibit a mutually exclusive pattern (Fisher’s test P = 6.6e−5, Supplementary Fig. 3) and thus identify the groups of samples in the MSI and EMT groups, respectively. In the remaining MSS samples, we used TP53 signature as stratifying score (with a threshold defined by the Youden index of the ROC curve associating the signature with TP53 mutation; Supplementary Fig. 4).
Copy number variation profile and targeted sequencing. We extracted the DNA from the tumor and peripheral blood mononuclear cells (PBMCs) using the QIAamp DNA Mini Kit according to the manufacturer’s protocol (Qiagen, Valencia, CA).
We assayed 277 tumor DNA samples and 14 matching normal DNA samples on Affymetrix Genome-Wide Human SNP 6.0 Arrays, according to the manufacturer’s instructions. All of the .CEL files produced from the SNP 6.0 arrays passed the quality control thresholds suggested by the manufacturer, indicating high DNA quality and assay executions. We conducted the PICNIC (Predicting Integer Copy Number in Cancer) analysis48. Six tumor .CEL files and one normal .CEL file failed to pass the PICNIC analysis (2.3%). Overall, we could generate segmented copy numbers for 271 tumor samples and 13 normal samples.
We defined a genomic instability index (termed CNV GI) by counting the number of chromosomes altered either by deletion or amplification per sample (>2.3 × median average deviation from the population median for each chromosome). Furthermore, we defined focal amplifications as alterations above the chromosome level (>1.2 copies), filtered by the correlation with gene expression (Spearman correlation > 0.2).
We acquired the target capture oligomers for targeted re-sequencing from Agilent for recurrent genes present in at least two samples from the whole-genome sequencing data (n = 49). The list of 384 recurrent genes and 13 additional genes of interest (KRAS, KIT, EGFR, PTEN, ROS1, PDGFRB, CAMK1D, ERCC6, MET, NRAS, CTNNB1, STK11, BRAF), are provided in Supplementary Data 4. We performed targeted sequencing on an Illumina Hiseq 2000, with a median depth of 100× (range: 40×–180×). We performed the alignment using BWA-mem v0.7.4 using the default parameters and GRCH37 as the reference genome. We used three callers to call the variants: (i) samtools mpileup v0.1.19, http://samtools.sourceforge.net/; (ii) freebayes v0.9.10, https://github.com/ekg/freebayes; and (iii) GATK lite v2.3, https://www.broadinstitute.org/gatk/download. We use variants that are called by at least one caller for both normal and tumor samples. We used the minimal mapping and base quality Phred-like score of Q13, with minimum variant read support of at least 3. We removed any tumor variants that were detected in the paired normal samples (we applied a cutoff of Q10 for the genotype quality score). We removed somatic
©20
15N
atu
re A
mer
ica,
Inc.
All
rig
hts
res
erve
d.
nature medicine doi:10.1038/nm.3850
variants found in ≥2 normal samples in this data set as well as reported germ-lines in public databases with at least three allele counts reported in the 1,000 Genomes, EVS, HapMap and Complete Genomics 69 genome databases or annotated as G5 in dbSNP (>5% minor allele frequency in more than one population).
Independent validation cohorts. We validated the four subtypes identified on the basis of gene signatures in our cohort using other independent GI tract cancer cohorts, namely the Samsung Medical Center Cohort-2 (SMC-2 independent internal cohort; n = 277; GEO database GSE26253)31, the Singapore cohort (n = 200; GEO database GSE15459)21, and the TCGA gastric tumor cohort (n = 291, with n = 205 reporting survival data)10. Additionally, for validation of the subtypes on other types of GI tract cancer, we used the TCGA colorectal cancer cohort26 (n = 179). We compiled the TCGA colorectal and gastric data sets from the TCGA portal (http://cancergenome.nih.gov) in August 2013 and August 2014, respectively. Survival data were not available for the TCGA colorectal cohort and thus were not included for the survival analysis. The SMC-2 cohort consisted of stage Ib–IV GC patients with curative gastrectomy and D2 lymph node dissection with postoperative adjuvant treatment31 (Supplementary Data 3). The Singapore cohort consisted of curatively resected stage II–IV GC patients with or without postoperative adjuvant treatment (Supplementary Data 3).
Clinical endpoints. We used overall survival as the primary endpoint. Overall survival is defined as the time from surgery to the date of death or to the last follow-up date. We defined the date of relapse as the date of documented recurrences by imaging, biopsy and cytology. We used the date of last follow up for cases with no recurrence at the time of the last follow up. We retrospec-tively reviewed the pattern of recurrence, all CT imaging and medical records. We defined significant peritoneal seeding according to our previous work49. We define the peritoneal nodules at CT without definite evidence of malignant ascites as non-significant peritoneal seeding.
Statistical analysis. We used PCA for unsupervised analysis of transcriptome data. Additionally, we used Pearson correlation to determine the association between principal components and predefined gene expression signatures. We used the following statistical tests: the Spearman correlation for pairs of continuous variables, ROC–AUC and Wilcoxon rank test for comparing a
continuous versus a binary variable, Fisher’s exact test for confusion matrices of binary variables and Chi-square for contingency tables of ordinal variables, Cox regression and log-rank test for survival analysis in the discovery set, and Cox regression trend for association with survival in validation sets. The survival rate followed a certain trend in the ACRG cohort (i.e., EMT < TP53− < TP53+ < MSI) for the four molecular subtypes. Thus, we used the trend test in the vali-dation cohorts rather than log-rank test. We assessed the proportional hazards assumption of the Cox model using the method proposed by Grambsch and Therneau50, and all data sets fulfilled it (P = 0.5, 0.2, 0.16, 0.34 for the ACRG, SMC-2, Singapore and TCGA gastric cohorts, respectively). We used 5% as the significance level for all tests.
We dichotomized the variables for multivariable cox regression; subtypes were grouped into MSS/TP53+, MSS/TP53− and MSI versus MSS/EMT; age into >62 versus ≥ 62 (median age is 62 years); sex into female versus male; location into non-antrum versus antrum; WHO classification into signet, partially differentiated and others versus well- and moderately differentiated; Lauren classification into diffuse versus intestinal; AJCC stage into Ib/II versus III/IV; EBV into negative versus positive; lymphovascular invasion into negative versus positive; and perineural invasion into negative versus positive.
We used the MATLAB package including the Statistics toolbox (Mathworks, Natick, MA, USA), the R package (v.2.15 http://www.r-project.org/) or MedCalc Statistical Software v.13.2.0 (MedCalc Software, Belgium; http://www.medcalc.org; 2014) for all statistical tests.
45. Suraweera, N. et al. Evaluation of tumor microsatellite instability using five quasimonomorphic mononucleotide repeats and pentaplex PCR. Gastroenterology 123, 1804–1811 (2002).
46. Song, H.J. et al. Host inflammatory response predicts survival of patients with Epstein-Barr virus-associated gastric carcinoma. Gastroenterology 139, 84–92 (2010).
47. Rüschoff, J. et al. HER2 testing in gastric cancer: a practical approach. Mod. Pathol. 25, 637–650 (2012).
48. Greenman, C.D. et al. PICNIC: an algorithm to predict absolute allelic copy number variation with microarray cancer data. Biostatistics 11, 164–175 (2010).
49. Lee, J. et al. Prognostic model to predict survival following first-line chemotherapy in patients with metastatic gastric adenocarcinoma. Ann. Oncol. 18, 886–891 (2007).
50. Grambsch, P.M. & Therneau, T.M. Proportional hazards tests and diagnostics based on weighted residuals. Biometrika 81, 515–526 (1994).