Embed Size (px)
Citation preview
Molecular basis of evolution.
Goal – to reconstruct the evolutionary history of all organisms in the form of phylogenetic trees.
Classical approach: phylogenetic trees were constructed based on the comparative morphology
and physiology.
Molecular phylogenetics: phylogenetic trees are constructed by comparing DNA/protein sequences
between organisms.
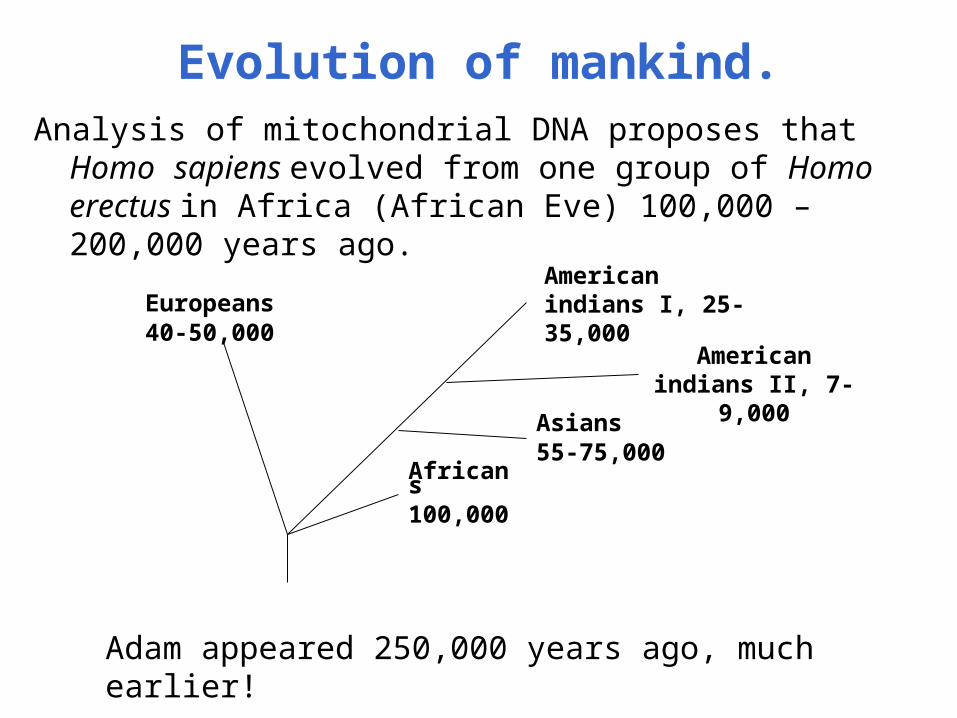
Evolution of mankind.Analysis of mitochondrial DNA proposes that Homo sapiens
evolved from one group of Homo erectus in Africa (African Eve) 100,000 – 200,000 years ago.
Africans100,000
Europeans40-50,000
Asians55-75,000
American indians II, 7-9,000
American indians I, 25-35,000
Adam appeared 250,000 years ago, much earlier!
Mechanisms of evolution.
- By mutations of genes. Mutations spread through the population via genetic drift and/or natural selection.
- By gene duplication and recombination.
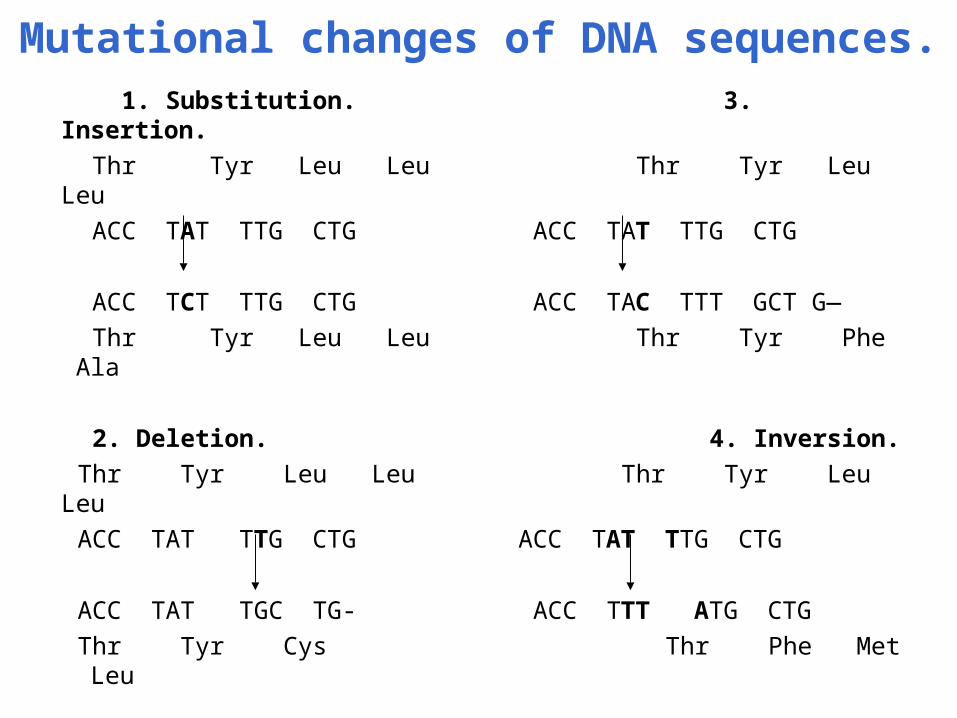
Mutational changes of DNA sequences.
1. Substitution. 3. Insertion.
Thr Tyr Leu Leu Thr Tyr Leu Leu
ACC TAT TTG CTG ACC TAT TTG CTG
ACC TCT TTG CTG ACC TAC TTT GCT G—
Thr Tyr Leu Leu Thr Tyr Phe Ala
2. Deletion. 4. Inversion.
Thr Tyr Leu Leu Thr Tyr Leu Leu
ACC TAT TTG CTG ACC TAT TTG CTG
ACC TAT TGC TG- ACC TTT ATG CTG
Thr Tyr Cys Thr Phe Met Leu
Synonymous and nonsynonymous nucleotide substitutions.
Synonymous substitutions in codons do not change the encoding amino acid, non-synonymous substitutions do.
ds/dn < 1 indicates positive natural selection.
ds, dn - # of synonymous substitutions per
non-synonymous site
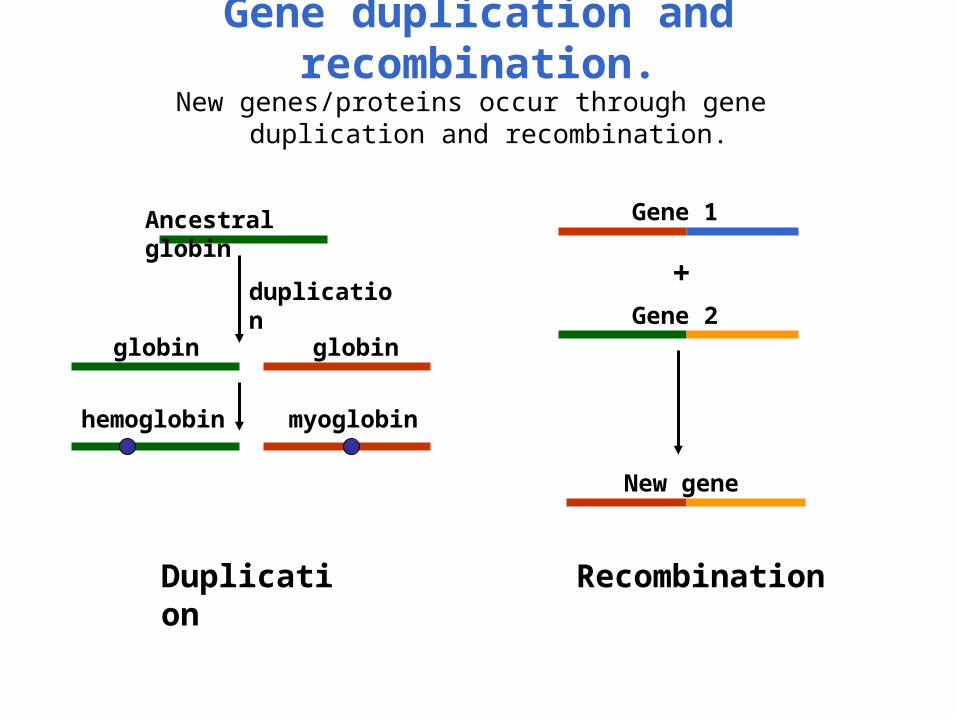
Gene duplication and recombination.New genes/proteins occur through gene duplication and
recombination.
Ancestral globin
duplication
globin globin
hemoglobin myoglobin
Duplication
+
Gene 1
Gene 2
New gene
Recombination
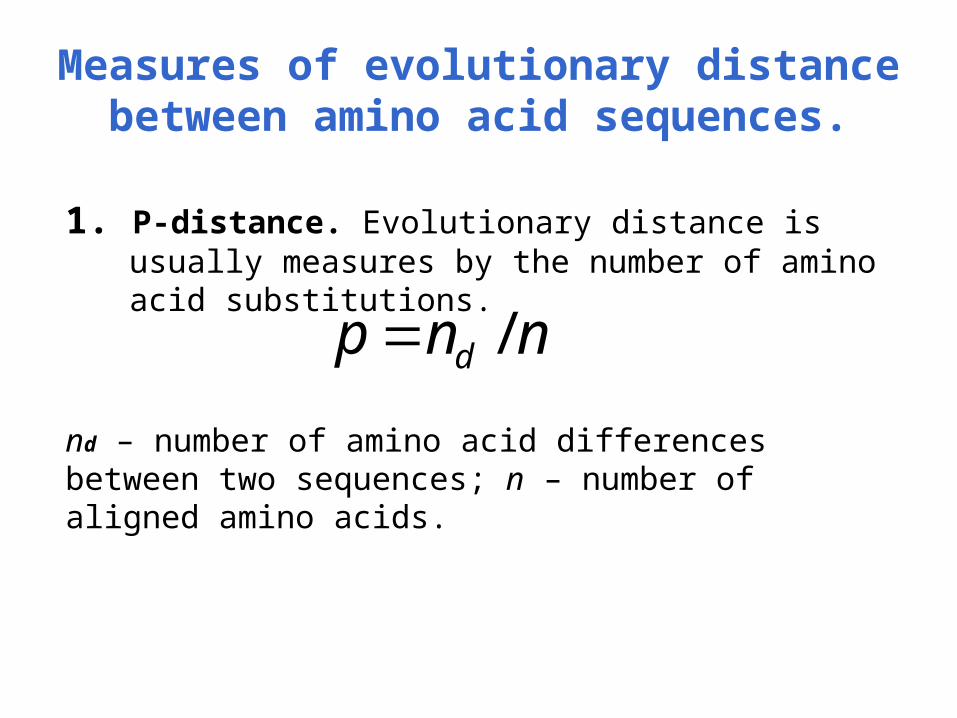
Measures of evolutionary distance between amino acid sequences.
1. P-distance. Evolutionary distance is usually measures by the number of amino acid substitutions.
nnp d /
nd – number of amino acid differences between two sequences; n – number of aligned amino acids.
Poisson correction for evolutionary distance.
2. PC-distance. Takes into account multiple substitutions and therefore is proportional to divergence time.
PC-distance can be expressed through the p-distance:
)1ln( pd
Another method to estimate evolutionary distances: amino acid substitution matrices.
3. Distance from amino acid substitution matrices. Substitutions occur more often between amino acids of similar properties.
- Dayhoff (1978) derived first matrices from multiple alignments of close homologs.
- The number of aa substitutions is measured in terms of accepted point mutations (PAM) – one aa substitution per 100 sites.
- Dayhoff-distance can be approximated by gamma-distance with a=2.25.
Fixation of mutations.
Not all mutations are spread through population. Fixation – when a mutation is incorporated into a genome of species.
Majority of mutations are neutral (Kimura), do not effect the fitness of organism.
Fixation rate depends on the size of population (N), fitness (s) and mutation rate (μ):
Nsr
Phylogenetic analysis.
- Phylogenetic trees are derived from multiple sequence alignments. Each column describes the evolution of one site.
- Each position/site in proteins/nucleic acids changes in evolution independently from each other.
- Insertions/deletions are usually ignored and trees are constructed only from the aligned regions.
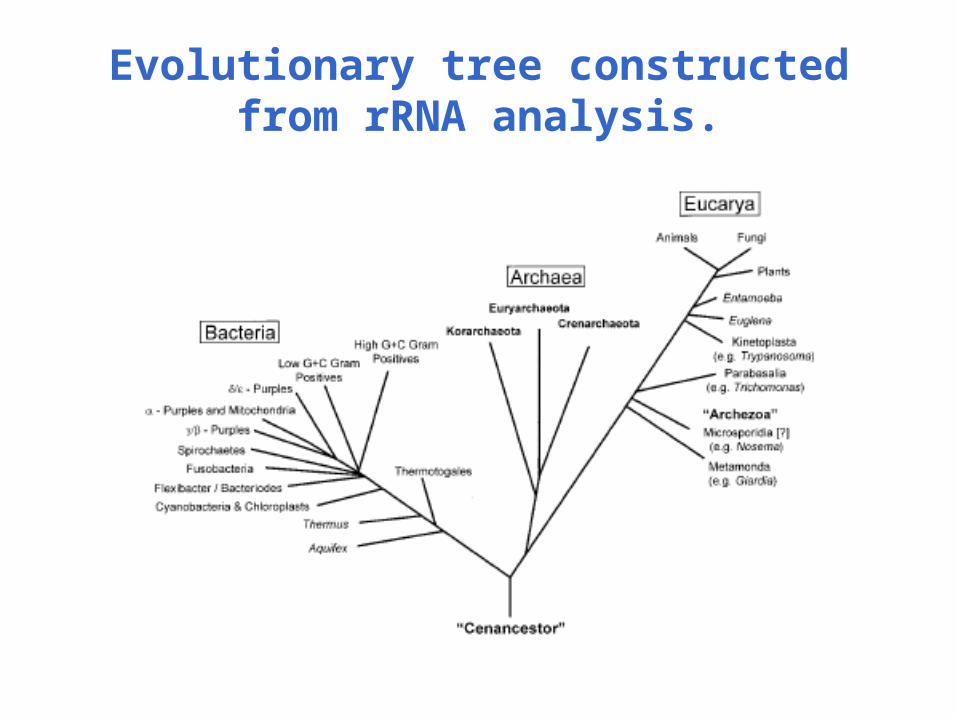
Evolutionary tree constructed from rRNA analysis.
The concept of evolutionary trees.
- Trees consist of nodes and branches, topology - branching pattern.
- The length of each branch represents the number of substitutions occurring between two nodes. If rate of evolution is constant, branches will have the same length (molecular clock hypothesis).
- The distance along the tree is calculated by summing up all intervening branch lengths.
- Trees can be binary or bifurcating.
- Trees can be rooted and unrooted. The root is placed by including a taxon which is known to branch off earlier than others.
Accuracies of phylogenetic trees.
Two types of errors:- Topological error- Branch length error
Bootstrap test:
Resampling of alignment columns with replacement; recalculating the tree; counting how many times this topology occurred – “bootstrap confidence value”. If it is close to 100% – reliable topology/interior branch.
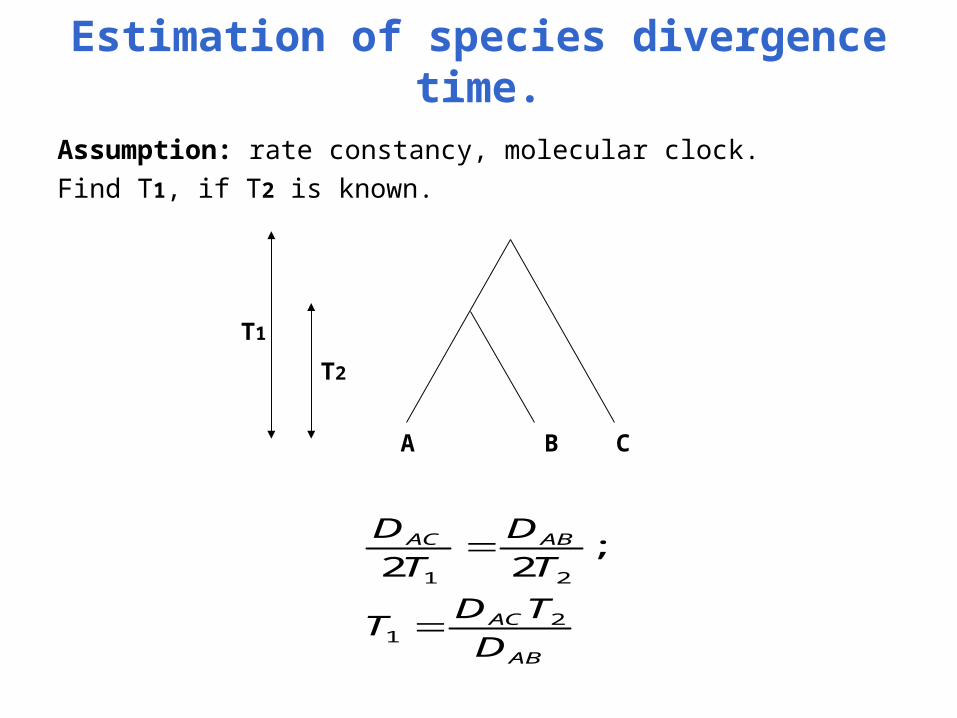
Estimation of species divergence time.
Assumption: rate constancy, molecular clock.
Find T1, if T2 is known.
A B C
T1
T2
AB
AC
ABAC
D
TDT
T
D
T
D
21
21
;22
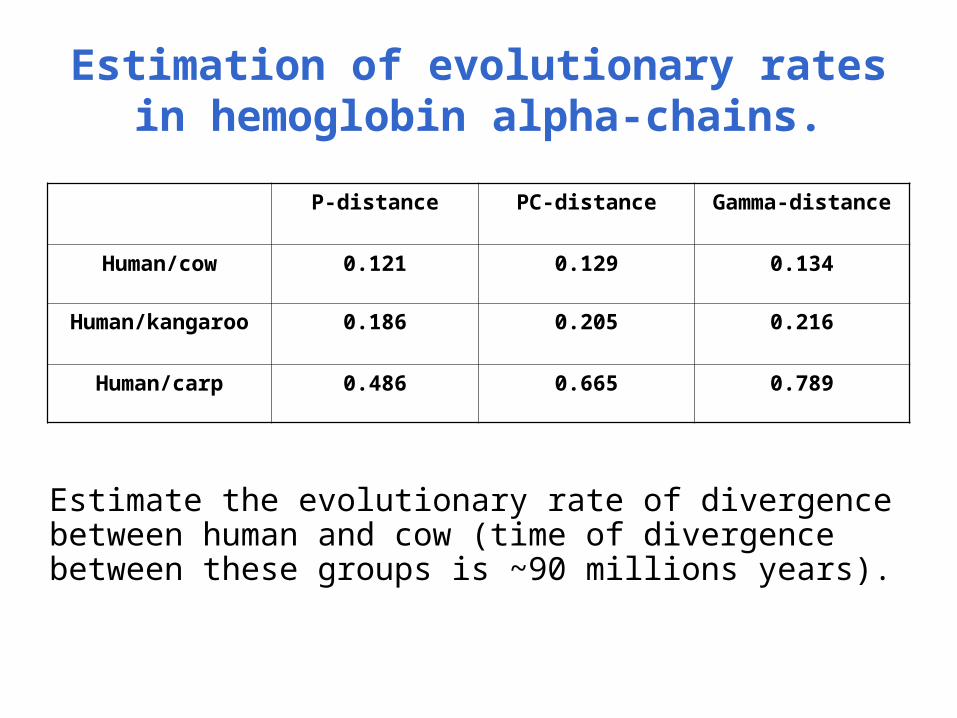
Estimation of evolutionary rates in hemoglobin alpha-chains.
P-distance PC-distance Gamma-distance
Human/cow 0.121 0.129 0.134
Human/kangaroo 0.186 0.205 0.216
Human/carp 0.486 0.665 0.789
Estimate the evolutionary rate of divergence between human and cow (time of divergence between these groups is ~90 millions years).
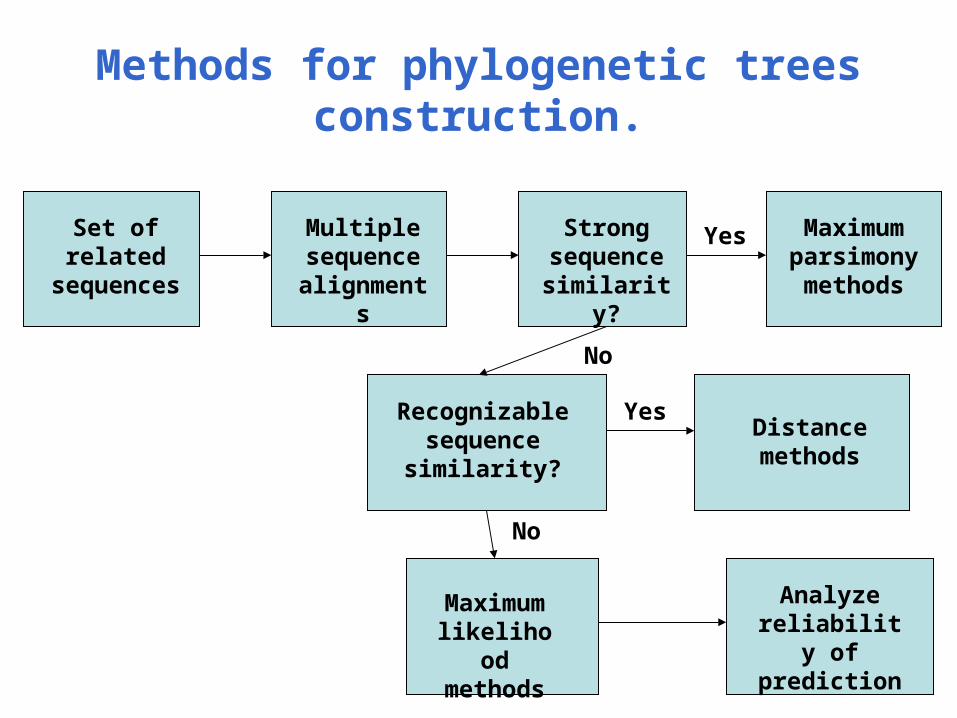
Methods for phylogenetic trees construction.
Set of related
sequences
Multiple sequence
alignments
Strong sequence similarity?
Maximum parsimony methods
Recognizable sequence similarity?
Distance methods
Maximum likelihood methods
Analyze reliability of prediction
Yes
No
Yes
No
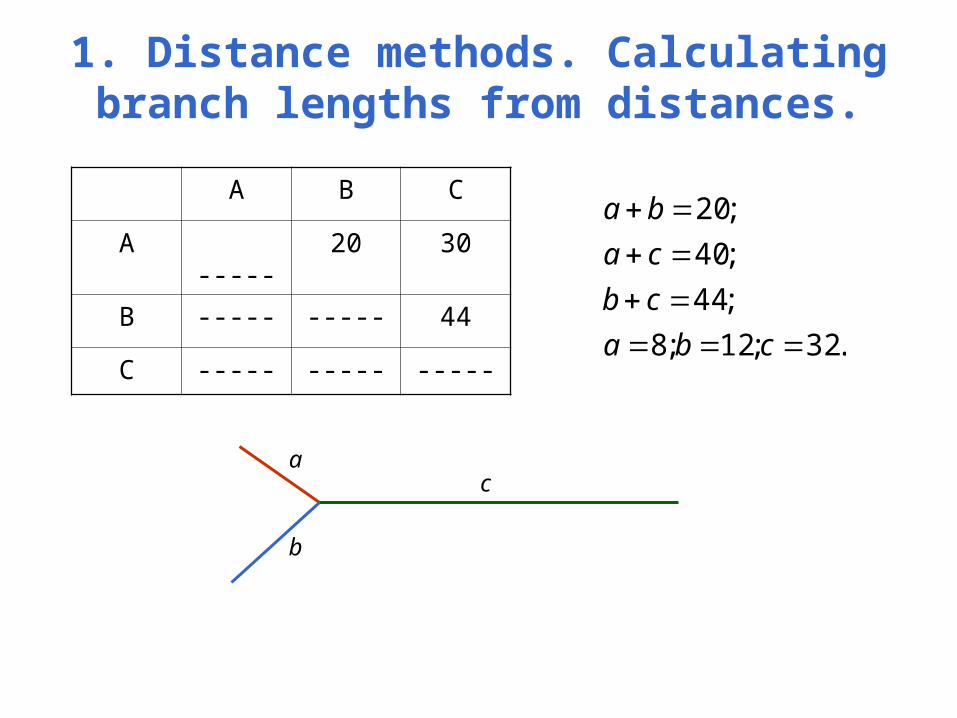
1. Distance methods. Calculating branch lengths from distances.
A B C
A ----- 20 30
B ----- ----- 44
C ----- ----- ----- .32;12;8
;44
;40
;20
cba
cb
ca
ba
a
b
c
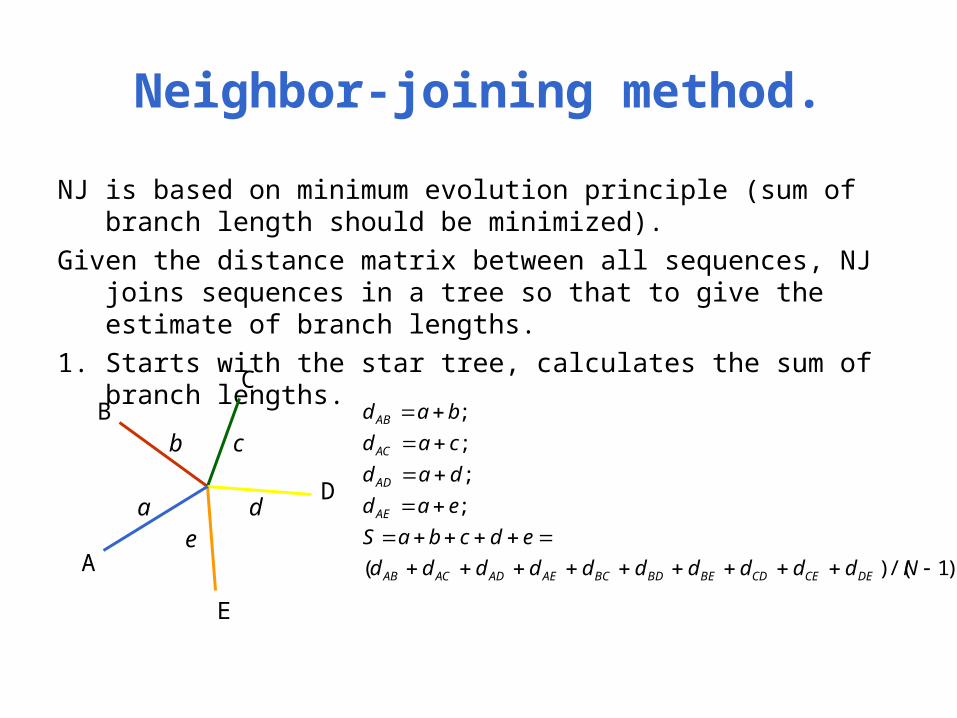
Neighbor-joining method.
NJ is based on minimum evolution principle (sum of branch length should be minimized).
Given the distance matrix between all sequences, NJ joins sequences in a tree so that to give the estimate of branch lengths.
1. Starts with the star tree, calculates the sum of branch lengths.
A
BC
D
E
a
b c
de
)1/()(
;
;
;
;
Ndddddddddd
edcbaS
ead
dad
cad
bad
DECECDBEBDBCAEADACAB
AE
AD
AC
AB
Neighbor-joining method.
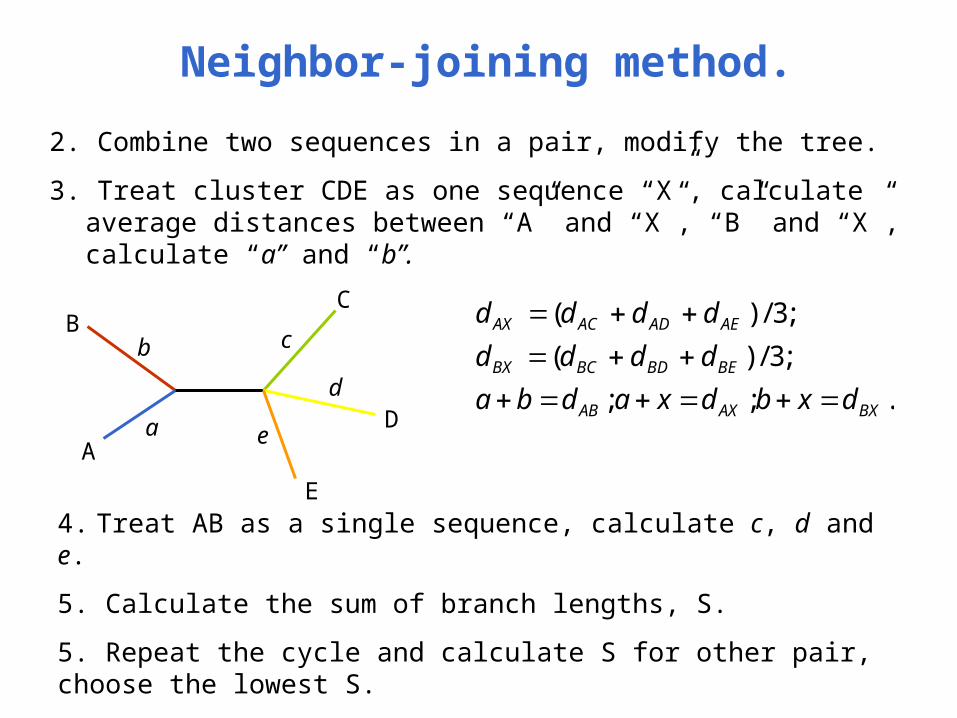
2. Combine two sequences in a pair, modify the tree.
3. Treat cluster CDE as one sequence “X”, calculate average distances between “A” and “X”, “B” and “X”, calculate “a” and “b”.
A
BC
D
E
a
b c
d
e
.;;
;3/)(
;3/)(
BXAXAB
BEBDBCBX
AEADACAX
dxbdxadba
dddd
dddd
4. Treat AB as a single sequence, calculate c, d and e.
5. Calculate the sum of branch lengths, S.
5. Repeat the cycle and calculate S for other pair, choose the lowest S.
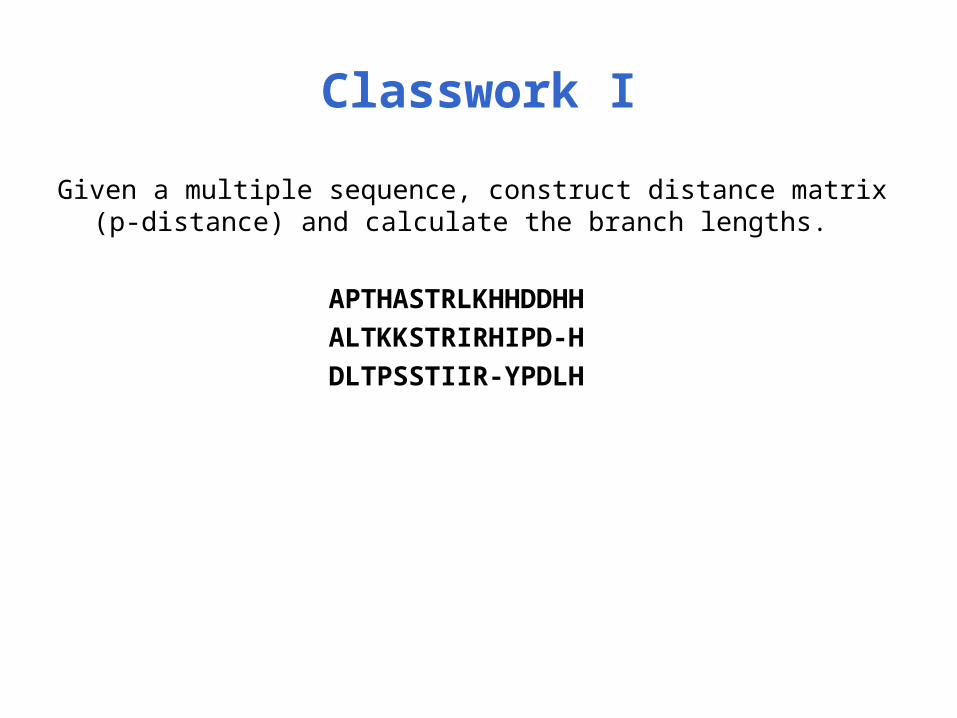
Classwork I
Given a multiple sequence, construct distance matrix (p-distance) and calculate the branch lengths.
APTHASTRLKHHDDHH
ALTKKSTRIRHIPD-H
DLTPSSTIIR-YPDLH

Classwork II: NJ tree using MEGA.
1. Go to CDD webpage and retrieve alignment of cd00157 in FASTA format.
2. Import this alignment into MEGA and convert it to MEGA format http://www.megasoftware.net/mega3/mega.html .
3. Construct NJ tree using different distance measures with bootstrap.
4. Analyze obtained trees.
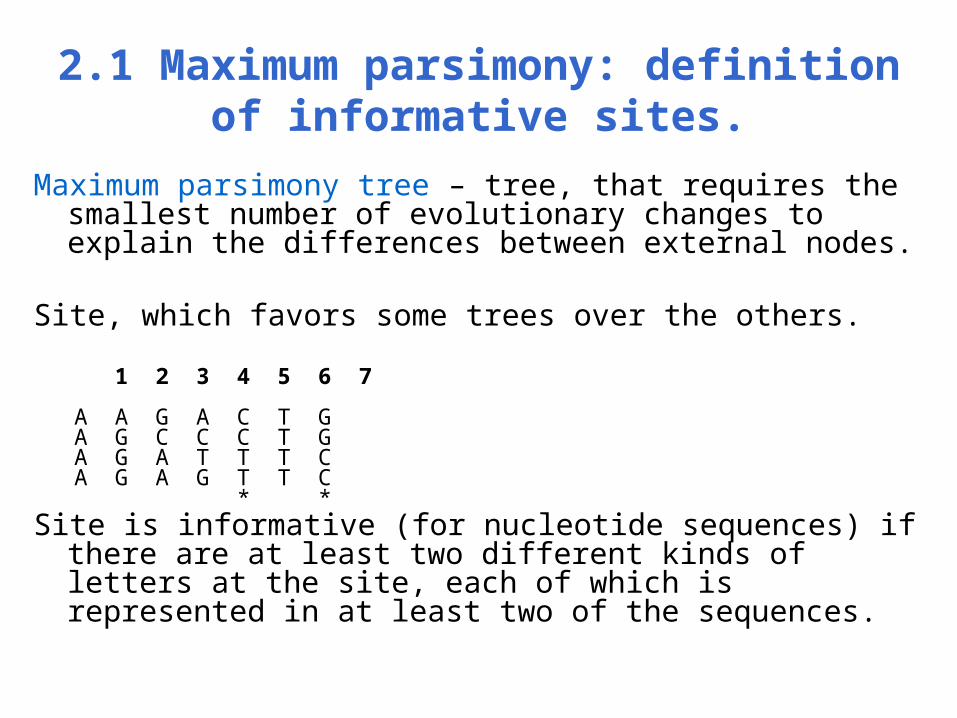
2.1 Maximum parsimony: definition of informative sites.
Maximum parsimony tree – tree, that requires the smallest number of evolutionary changes to explain the differences between external nodes.
Site, which favors some trees over the others.
1 2 3 4 5 6 7
A A G A C T G A G C C C T G A G A T T T C A G A G T T C * * Site is informative (for nucleotide sequences) if there are at
least two different kinds of letters at the site, each of which is represented in at least two of the sequences.
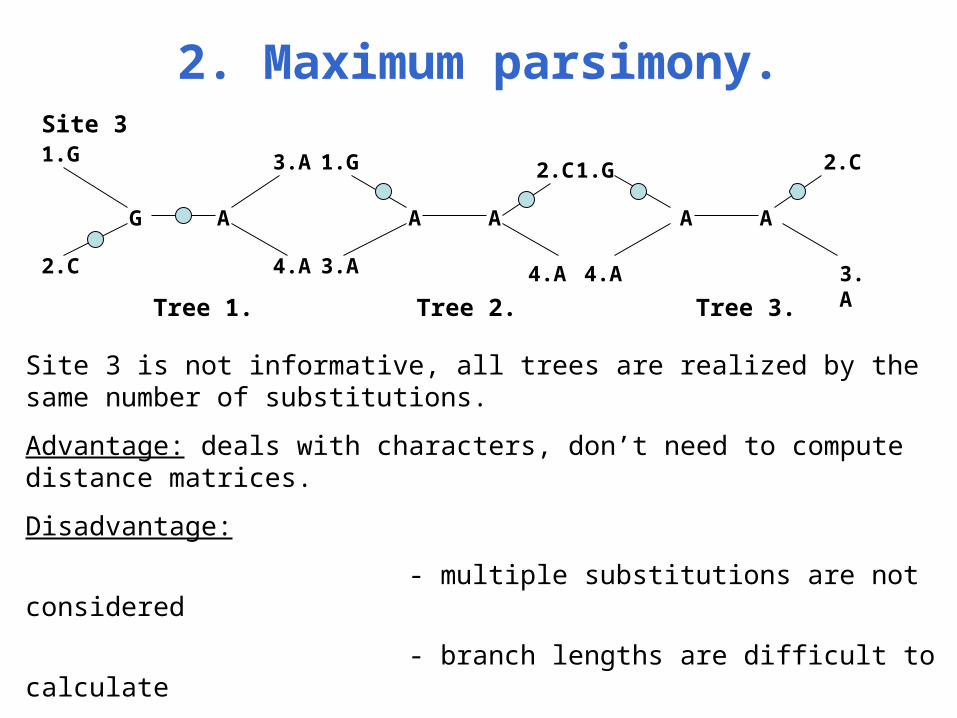
2. Maximum parsimony.
1.G
2.C
G A
3.A
4.A
A
1.G
3.A
A
2.C
4.A
1.G
4.A
A A
2.C
3.A
Tree 1. Tree 2. Tree 3.
Site 3
Site 3 is not informative, all trees are realized by the same number of substitutions.
Advantage: deals with characters, don’t need to compute distance matrices.
Disadvantage:
- multiple substitutions are not considered
- branch lengths are difficult to calculate
- slow
2.3 Maximum parsimony method.
1. Identify all informative sites in the alignment.
2. Calculate the minimum number of substitutions at each informative site.
3. Sum number of changes over all informative sites for each tree.
4. Choose tree with the smallest number of changes.
Maximum likelihood methods.
• Similarity with maximum parsimony:
- for each column of the alignment all possible trees are calculated
- trees with the least number of substitutions are more likely
• Advantage of maximum likelihood over maximum parsimony:
- takes into account different rates of substitution between different amino acids and/or different sites
- applicable to more diverse sequences
Classwork: maximum marsimony.
1. Search the NCBI Conserved Domain Database for pfam00127.
2. Construct maximum parsimony tree using MEGA3.
3. Analyze this tree and compare it with the phylogenetic tree from the research paper.