Embed Size (px)
Citation preview
Contents lists available at ScienceDirect
Molecular Phylogenetics and Evolution
journal homepage: www.elsevier.com/locate/ympev
High cryptic diversity of bitterling fish in the southern West Palearctic
Veronika Bartákováa,b, Josef Bryjaa,b, Radek Šandac, Yusuf Bektasd, Tihomir Stefanove,Lukáš Cholevaf,g, Carl Smitha,h,i, Martin Reicharda,⁎
a The Czech Academy of Sciences, Institute of Vertebrate Biology, Květná 8, 603 65 Brno, Czech RepublicbDepartment of Botany and Zoology, Faculty of Science, Masaryk University, Kotlářská 2, 611 37 Brno, Czech RepubliccNational Museum, Department of Zoology, Václavské nám. 68, 115 79 Prague 1, Czech RepublicdDepartment of Basic Sciences, Faculty of Fisheries, Recep Tayyip Erdogan University, 53100 Rize, TurkeyeNational Museum of Natural History, Bulgarian Academy of Sciences, 1 Tsar Osvoboditel Blv., 1000 Sofia, Bulgariaf The Czech Academy of Sciences, Institute of Animal Physiology and Genetics, Laboratory of Fish Genetics, Rumburská 89, 277 21 Liběchov, Czech Republicg Department of Biology and Ecology, Faculty of Science, University of Ostrava, Chittussiho 10, Ostrava 710 00, Czech RepublichDepartment of Ecology & Vertebrate Zoology, University of Łódź, Banacha 12/16, 90-237 Łódź, Polandi School of Biology and Bell-Pettigrew Museum of Natural History, University of St Andrews, St Andrews KY16 8LB, UK
A R T I C L E I N F O
Keywords:Balkan refugiumCyprinidaeMediterranean endemismPonto-Caspian regionGene flowGenetic drift
A B S T R A C T
South-east Europe, along with the adjacent region of south-west Asia, is an important biodiversity hotspot withhigh local endemism largely contributed by contemporary continental lineages that retreated to southern refugiaduring colder Quaternary periods. We investigated the genetic diversity of the European bitterling fish (Rhodeusamarus) species complex (Cyprinidae) across its range in the western Palearctic, but with a particular emphasisin the region of Balkan, Pontic and Caspian refugia. We genotyped 12 polymorphic microsatellite loci and apartial sequence of mitochondrial gene cytochrome b (CYTB) for a set of 1,038 individuals from 60 populations.We used mtDNA sequences to infer phylogenetic relationships and historical demography, and microsatellitemarkers to describe fine-scale genetic variability and structure. Our mtDNA analysis revealed six well-supportedlineages, with limited local co-occurrence. Two lineages are distributed throughout central and western Europe(lineages “A” and “B”), with two zones of secondary contact. Another two lineages were restricted to the Ponto-Aegean region of Greece (lineages “C” and “D”) and the final two lineages were restricted south of the Caucasusmountains (lineage “E” from the Black Sea watershed and lineage “F” from the Caspian watershed). A signal ofrecent expansion was revealed in the two widespread lineages and the Ponto-Aegean lineage “C”. The geo-graphic distribution of clusters detected by nuclear microsatellites corresponded well with mitochondriallineages and demonstrated finely sub-structured populations. A profound population structure suggested asignificant role of genetic drift in differentiation among lineages. Lineage divergence in the Ponto-Aegean andCaspian regions are substantial, supporting the validity of two described endemic species (Rhodeus meridionalisas lineage “D” and Rhodeus colchicus as lineage “E”) and invite taxonomic evaluation of the other two southernlineages (Thracean “C” and Caspian “F”).
1. Introduction
Contemporary species distributions and intraspecific diversity arelargely driven by Pleistocene climatic oscillations, with climatic dy-namics of the Holocene having major impacts on the species and in-traspecific diversity of many Palearctic taxa (Hewitt, 1999). In coldperiods, thermophilic species retreated to thermal refugia; in the westPalearctic they were primarily located in the Mediterranean peninsulas(Iberian, Apennine, Balkan) and Caspian-Caucasian region (Stewartet al., 2010). Some species retreated to smaller cryptic refugia at higher
latitudes (Stewart and Lister, 2001; Stewart et al., 2010) with shelteredtopography and suitable microclimates (Stewart and Lister, 2001). Thecontribution of disparate refugia to the current diversity of the Eur-opean biota was uneven, with an overrepresentation of lineages ex-panding from the Balkan refugium where the geography favoured dis-persal (Hewitt, 1999). The Ponto-Caspian refugia from the region alongthe Black Sea coast and on the north-western slopes of the CaucasusMountains (Adams and Faure, 1997), also supported re-colonisation ofEurope, but to a much lesser extent (Culling et al., 2006). These areasmay have been relatively fragmented, supporting genetically diverse
https://doi.org/10.1016/j.ympev.2018.12.025Received 22 August 2018; Received in revised form 24 October 2018; Accepted 20 December 2018
⁎ Corresponding author.E-mail address: [email protected] (M. Reichard).
Molecular Phylogenetics and Evolution 133 (2019) 1–11
Available online 23 December 20181055-7903/ © 2018 Elsevier Inc. All rights reserved.
T
populations, termed ‘refugia-within-refugia’ (Gómez and Lunt, 2007),rather than representing a single continuous refugium with large andinterconnected populations. A possible outcome is that these formerrefugial areas may represent hotspots of biodiversity as a consequenceof two different proximate mechanisms (Dufresnes et al., 2016); long-term persistence of large refugial populations or, alternatively, a set ofsmall, geographically isolated populations with limited gene flow.These two scenarios are predicted to bear unique genetic signatures. Inthe case of large continuous refugial populations with substantial ef-fective population sizes over successive glacial cycles, genetic diversityshould be high but homogenous across the refugium. In the case ofrefugia-within-refugia, in contrast, spatially restricted and highlystructured refugial distributions predict well-defined population geneticstructure within the greater refugium region, but with signals of po-pulation expansion and genetically rich populations in secondary con-tact zones.
South-east Europe and adjacent West Asia (northwestern MiddleEast: Asia Minor, Caucasian and Caspian regions) are important hot-spots of genetic diversity for a number of taxa (e.g. Kramp et al., 2009;Dufresnes et al., 2016; Jablonski et al., 2016) with many locally en-demic lineages (Geiger et al., 2014). A combination of the effects ofhistorical climate, topography and dramatic changes in sea level duringthe last 5 million years resulted in variable patterns of continental co-lonization from this refugium (e.g. Durand et al., 1999; Kotlík andBerrebi, 2007), which is reflected in the complex structure of the Balkanbiotic assemblage (Economidis and Banarescu, 1991). In particular, theAegean Sea was approximately 120m lower than it is today during thePlio-Pleistocene (Perissoratis and Conispoliatis, 2003), redisposingrivers, streams, wetlands, and their connections (Hewitt, 2000). Untilthe early Holocene (11,500 BP), the Black Sea basin was an extensivefreshwater lake (Degens and Ross, 1972), and likely to have supported,rather than limited, dispersal of freshwater taxa. A connection betweenthe Black and Caspian Seas established periodically during the Pleis-tocene, with termination of the last connection estimated at17,000–16,000 years BP (Reid and Orlova, 2002).
We investigated genetic diversity of bitterling fishes in the WestPalearctic (Rhodeus amarus species complex), with special attention onthe relative contribution of refugial populations to the current bitterlingdiversity in the region. Bitterling belong to a distinct subfamily of cy-prinid fishes (Cyprinidae: Acheilognathinae) (Chang et al., 2014) thatparasitize freshwater molluscs by ovipositing in their gill chambers(Smith et al., 2004). The global centre of distribution of bitterling is inEast Asia (China, Japan, Korea and adjacent countries) (Chang et al.,2014; Kawamura et al., 2014). One bitterling lineage colonized thewestern Palearctic (Bohlen et al., 2006; Chang et al., 2014) and threespecies of the genus Rhodeus have been formally named in region(Kottelat and Freyhof, 2007). In addition to widespread Rhodeus amarus(Bloch, 1782), Rhodeus colchicus Bogutskaya and Komlev, 2001 wasdescribed from the foothills of the western Caucasus on the basis ofosteological characters and confirmed as a separate lineage by mi-tochondrial genetic data (Bohlen et al., 2006; Zaki et al., 2008). Po-pulations in the River Vardar were described as Rhodeus sericeus mer-idionalis Karaman 1924 and were proposed as representing a validspecies, R. meridionalis, by Kottelat and Freyhof (2007) on the basis ofits genetic divergence. However, bitterling diversity in other areas ofthe West Palearctic distribution is poorly explored and their phyloge-netic relationships and intraspecific structure are unresolved, perhapsas a result of relatively rapid diversification, incomplete lineage sortingand/or gene flow among populations/species (Bohlen et al., 2006; Bryjaet al., 2010; Chang et al., 2014).
The natural distribution of bitterling in the West Palearctic covers alarge part of continental Europe, excepting the Iberian and ApenninePeninsulas, Fennoscandia, Denmark and the region east and north ofthe Dnieper basin (Kottelat and Freyhof, 2007). Recent introductionshave expanded its range to Great Britain, Denmark, Italy and severalbasins in European Russia (Kozhara et al., 2007; Bartáková et al.,
2018). Bitterling are thermophilic (Smith et al., 2004; Van Dammeet al., 2007) and former studies established that their populations sur-vived the Pleistocene glacial periods in refugia located in the Balkans,Black Sea region, lower Danube, and southern Caucasian region(Bohlen et al., 2006; Zaki et al., 2008; Bryja et al., 2010; Bektas et al.,2013). Some of these populations repeatedly expanded during warmerclimatic conditions and colonized large parts of Europe (Kozhara et al.,2007; Van Damme et al., 2007; Bryja et al., 2010). Populations from thelower Danube spread throughout the River Danube basin and colonisedmost of Central and West Europe, while a population from a putativerefugium in the northern Black Sea region colonized north-easternEurope (Bohlen et al., 2006; Bryja et al., 2010), with the area of sec-ondary contact in Central and West Europe (Bryja et al., 2010). Pre-liminary evidence suggested that other populations remained isolatedin their refugia and differentiated in allopatry (Bryja et al., 2010).
To investigate the patterns of genetic differentiation of the WestPalearctic bitterling species complex, we used dense and fine-scalesampling of bitterling populations in the region, with a particular focuson the Balkan region and other parts of the greater Mediterranean re-gion with the reported presence of bitterling populations. We specifi-cally concentrated on the analysis of (1) genetic differentiation amongbitterling lineages to describe their phylogenetic patterns, (2) geneticdiversity within the lineages and populations to understand their de-mographic history and (3) geographic aspects of the distribution ofparticular lineages to characterise past and recent connections betweenthe lineages and their contribution to the current expansion of thebitterling in the West Palearctic region.
2. Materials and methods
2.1. Sampling and DNA extraction
We analysed a total of 1038 fish from 60 sampling sites, with par-ticular attention to the bitterling distribution in the southern part of itsrange in the West Palearctic. Reference to zoogeographical regionsfollows terminology for freshwater fishes from Economidis andBanarescu (1991). On the basis of preliminary analysis of an individual-based Bayesian clustering procedure, implemented in the STRUCTUREsoftware, we pooled some populations for the final analyses. The pooledsamples came from adjacent sites within the same streams, with theexception of the IRAZ population that was composed of pooled samplesfrom several bitterling populations from the Caspian region (Azer-baijan, Iran) that lacked a precise geo-reference (Azerbaijan) and weretoo small for most population genetic analyses. All individuals in theIRAZ sample belonged to the same mitochondrial haplogroup. Fishwere collected between 2004 and 2015. Sampling sites, along withdetails on the number of analysed individuals and haplotype compo-sition are listed in Appendix A. DNA extraction was performed fromsmall fin clips taken from the caudal fin and stored in 96% ethanol,using the DNeasy Blood and Tissue Kit (Qiagen) following a standardprotocol. Extracted DNA was stored at −20 °C.
2.2. Genotyping
All bitterling individuals were genotyped at 12 microsatellite loci inthree multiplex PCR sets (Table B.1). Primer names and sequences weretaken from Dawson et al. (2003) and Reichard et al. (2008). A detailedgenotyping protocol is provided in Bartáková et al. (2018). The lengthof DNA fragments was analysed manually using GeneMapper v. 5.0(Applied Biosystems).
A partial sequence of mitochondrial gene cytochrome b (CYTB) wasamplified by primers Thr-H (5′-ACCTCCRATCTYCGGATTACA-3′) andGlu-L (5′-GAAGAACCACCGTTGTTATTCAA-3′) in a subset of in-dividuals (Appendix A) following the protocol of Bohlen et al. (2006)with conditions described in Bartáková et al. (2018). PCR productswere commercially Sanger-sequenced by Macrogen Europe. Sequence
V. Bartáková et al. Molecular Phylogenetics and Evolution 133 (2019) 1–11
2
editing was performed in SeqScape V.2.5 (Applied Biosystems) andaligned in BioEdit v.7.0.9.0 (Hall, 1999), producing a final alignment of914 bp. All sequences have been deposited in GenBank (accessionnumbers MH041650–MH041876).
2.3. Phylogenetic analysis and haplotype distribution based onmitochondrial DNA
The most appropriate substitution model for the CYTB dataset wasthe Generalised time-reversible model with a gamma-distributed ratevariation across sites (GTR+G), which was selected on the basis of BICin TOPALi v. 2.5 (Milne et al., 2009). Three unique sequences of Rho-deus sericeus (the sister lineage of the western Palearctic bitterlingcomplex (Chang et al., 2014)) from Lake Kenon (River Amur basin)were used as outgroups in all phylogenetic analyses. Phylogenetic re-lationships were inferred by maximum likelihood (ML) and Bayesian(BI) approaches. ML analysis was performed in RAxML 8.2.10(Stamatakis, 2014), applying the GTR+G model (option -m GTRGA-MMA). The robustness of the nodes was assessed by the default rapidbootstrap procedure with 1,000 replications (option -# 1000). Bayesiananalysis was performed by Markov Chain Monte Carlo (MCMC) simu-lation using MrBayes 3.2.6 (Ronquist and Huelsenbeck, 2003). Twoindependent analyses were initiated from random trees. Three heatedand one cold chain were run for 10 million generations per run, sam-pling every 1000 generations. For each run, 25% of trees were dis-carded as burn-in. Bayesian posterior probabilities were used to eval-uate branch support of the consensus tree. All phylogenetic analyseswere performed on Cipres Science Gateway webserver (Miller et al.,2010). The final trees were edited in FigTree v1.3.1 (http://tree.bio.ed.ac.uk/software/figtree).
To analyse the phylogeny in a time-calibrated framework, we esti-mated the relative time to the most recent common ancestor (TMRCA)for all unique sequences in BEAST v. 2.4.6 (Bouckaert et al., 2014). Toavoid unrealistic assumptions of a strict molecular clock, a relaxedmolecular clock model (uncorrelated lognormal) was used for theanalysis (Drummond et al., 2006). We performed two runs (10milliongenerations each) under the GTR+G model with parameters sampledevery 1000 iterations. We discarded the first 20% as burn-in, based onlikelihood stationarity visualized using Tracer 1.5 (Rambaut et al.,2018). The effective sample sizes (ESS) of all parameters sampled fromMCMC were>300. The resulting parameter and tree files from the tworuns were combined in LogCombiner 2.4.6 (Bouckaert et al., 2014) anda maximum clade credibility tree was calculated in TreeAnnotator 2.4.6(Bouckaert et al., 2014). Because there are no reliable tools for absolutecalibration of the Rhodeus molecular clock (no suitable fossils or well-dated biogeographic events), we used this analysis only for relativecomparison of divergence events.
The haplotypes and their frequencies were identified using DnaSP v.5.10.01 (Librado and Rozas, 2009). The relationships among haplo-types were also visualised as a median-joining (MJ) network in Network5.0.0.1 (Bandelt et al., 1999) using an equal transition/transversionratio. All sequences were geo-referenced and the distribution of thehaplogroups was inspected visually. The matrix of mean p-distanceswithin/between CYTB clades (using 101 unique haplotypes of 914 bp)was calculated in MEGA v. 6 (Tamura et al., 2013) and standard errorswere estimated with 1000 bootstraps.
2.4. Historical demography based on mtDNA variation
To analyse historical demography we identified six genetic lineages(see Appendix A for assignment to lineages) based on the phylogeneticanalyses, the haplotype network of mtDNA and the geographical dis-tribution of haplotypes. We used the reduced dataset of 208 sequences(914 bp) (Appendix A). We excluded three populations (RHI2, STR2,MER1) because they represented secondary contacts of differentiatedlineages and contained individuals with haplotypes from two lineages.
Diversity estimates for the six lineages; i.e. number of polymorphic sites(Np), number of haplotypes (Nh), haplotype diversity (Hd), nucleotidediversity (p), and average number of nucleotide differences (k) werecomputed in DnaSP 5.00.04 (Librado and Rozas, 2009).
To infer demographic histories, we estimated the neutrality indices(Tajima’s D and Fu’s Fs statistic) in DnaSP v. 5.10.01 (Librado andRozas, 2009). These indices are sensitive to population size change andreturn significantly negative values in the case of recent populationexpansion. As an additional test of demographic expansion, the dis-tribution of pairwise nucleotide differences in each lineage (mismatchdistribution; MD) was calculated in DnaSP. We used the sum of squaredeviations (SSD) between the observed and expected mismatch as a teststatistic for the validity of the estimated stepwise expansion model(Schneider and Excoffier, 1999). Parameter τ (the moment estimator oftime to the expansion) was estimated with DnaSP using the momentmethod of Rogers (1995) assuming the infinite sites model (IFM) and,additionally, in ARLEQUIN using the method of Schneider and Excoffier(1999) to relax the IFM assumption. Confidence intervals were obtainedby a parametric bootstrap approach based on 1000 replicates per-formed in ARLEQUIN. Under the assumption of the (sudden) demo-graphic expansion model the MD also permits estimation of the time ofonset of population expansion τ (τ=2 * t * μ; t=time in years,μ=mutation rate per locus of 914 bp). We converted the parameter τ,calculated from the mismatch distribution, to estimate the time sincethe expansion (t) using the equation t= τ/2μ, assuming the commonlyaccepted substitution rates of 0.76% per million years for CYTB in cy-prinid fishes (Zardoya and Doadrio, 1999) and an average generationtime of one year for the bitterling (Smith et al., 2004; Konečná andReichard, 2011).
We reconstructed historical population size dynamics of the mainlineages backward in time using the coalescent-based Bayesian skylineplot (BSP) in BEAST 2.4.6. (Drummond and Rambaut, 2007). Analyseswere run twice for each lineage and the model of sequence evolution foreach lineage was selected with the jModelTest (Posada, 2008) under theBIC criterion. The MCMC simulations were run with 50 million itera-tions with a sampling increment of 5000 and 25% burn-in. Results werechecked for convergence and stationarity of different runs in Tracer 1.6and the outputs from two runs were combined in the LogCombiner2.4.6 module. The BSPs were produced in Tracer 1.6.
2.5. Analysis of genetic variability and structure based on microsatellitedata
To analyse interpopulation and intrapopulation genetic variabilityon nuclear markers, the proportion of null alleles (NA) at each locusand population was estimated in FreeNA (Chapuis and Estoup 2007).The number of alleles (A), and observed (HO) and expected (HE) het-erozygosities were calculated in GENETIX. The rarefaction method inFSTAT 2.9.3.2 (Goudet, 2001) was used to calculate allelic richness(AR) for each population standardized for a minimum sample size of 7individuals. Deviations from Hardy-Weinberg equilibrium (HWE) weretested for each locus and population using the Markov chain method inthe software GENEPOP and the correction for multiple testing wasperformed using the false discovery rate (FDR) approach (Benjaminiand Hochberg, 1995) in QVALUE (Storey, 2002). For these analysespopulations with a low number (< 10) of sampled individuals were notused (see Table B.2). Analyses of intrapopulation variability werecomputed only from 10 microsatellite loci; locus Rser13 (D05) wasexcluded due to high polymorphism (110 alleles) and Rser09 (D12) wasexcluded given a high level of null alleles (mean of 5.64% per popu-lation). Genetic differentiation among study populations was quantifiedby FST (Weir and Cockerham, 1984) and their significance was tested by1000 permutations in GENETIX 4.05 (Belkhir et al., 1996–2004).
An individual-based Bayesian clustering procedure implemented inSTRUCTURE 2.3.4 (Hubisz et al., 2009) was used to detect the bestgenetic structure among sampled individuals (n= 1002 individuals
V. Bartáková et al. Molecular Phylogenetics and Evolution 133 (2019) 1–11
3
from 52 populations). The program was run with 20 independent si-mulations for each of K from 1 to 30, with 1 million iterations for eachsimulation, following a burn-in period of 100,000 iterations. Thecomputation was realised using an admixture ancestry model and cor-related allele frequencies model (with λ=1). The web-based softwareSTUCTURE HARVESTER (Earl and vonHoldt, 2012) was used for par-sing and summarizing output data from STRUCTURE. It reformatteddata for downstream programs and produced the likelihood of K; i.e. LnPr(X|K), for inferring the best number of real populations in the datasetsusing the method of Evanno et al. (2005). The results of 20 replicateruns for each K were combined using the Greedy algorithm of CLUMPP1.1.1 (Jakobsson and Rosenberg, 2007) and summary outputs for eachK were displayed using DISTRUCT v. 1.1 (Rosenberg, 2004).
2.6. Specific testing of isolation/gene flow
Based on the comparison of results from CYTB and microsatelliteanalyses, we specifically tested the origin of the MER1 population withrespect to possible gene flow between genetic groups “C” and “D” usingApproximate Bayesian Computation (ABC; Beaumont et al., 2002) im-plemented in DIYABC 2.0.4 (Cornuet et al., 2014). This analysis modelspopulation histories by combining population divergences, admixturesand population size fluctuations and compares alternative evolutionaryscenarios by estimating their relative support and quantifying para-meters for particular scenarios (Cornuet et al., 2014). Three “popula-tions” were generated according to the Bayesian assignment of theirgenetic structure and haplotype distribution. The populations MER1
(35 individuals) and MER3 (26 individuals) were formed exclusively bythose single population samples. The SSTR (i.e. “South Struma/Strymon”) population was composed of STR4, STR5 and STR6 popu-lation samples (total of 57 individuals). Effective population size,timing of events (merging, splitting or change in effective populationsize) and rates of admixture in the case of merging events, were used todescribe seven scenarios (Table B.3, Fig. C.1). The range of uniformpriors is provided in Table B.4. The generalized stepwise model wasused as a mutation model (GSM; Estoup et al., 2002). All microsatellitesused have regular motifs (motif lengths of 2 bp, except of a 4 bp motif inRser11) and all microsatellite mutation parameters were at defaultsettings. An average generation time of one year was used (Smith et al.,2004).
We simulated 1 million data sets per scenario. For each simulation,a set of summary statistics was computed to compare with the observeddataset for the best model selection. The relative posterior probability(95% credible intervals) of each scenario was determined using the 1%of simulated data sets closest to the observed data (Euclidean distances)and logistic regression was used to select the most likely evolutionaryscenario. The posterior parameter distributions were estimated from theclosest 1% of simulated data sets of the most likely model through alocal linear regression procedure (Cornuet et al., 2008). The assessmentof goodness-of-fit of the best model was checked by evaluating con-sistency of the observed data with the posterior predicted distributionof the model for the best scenario. We carried out model checking usingall summary statistics, including those that had not been used in theinitial ABC analyses for model selection (Cornuet et al., 2010).
1.00/95
0.96/66
0.73/50
1.00/100
1.00/87
0.96/66
1.00/99
1.00/98 0.68/-
-/-
1.00/100
1.00/100
A
E
C
D
G
F
B
colchicus
R. sericeus
meridionalis
b)a)
Danubian
Eastern
Thracean
Caspian
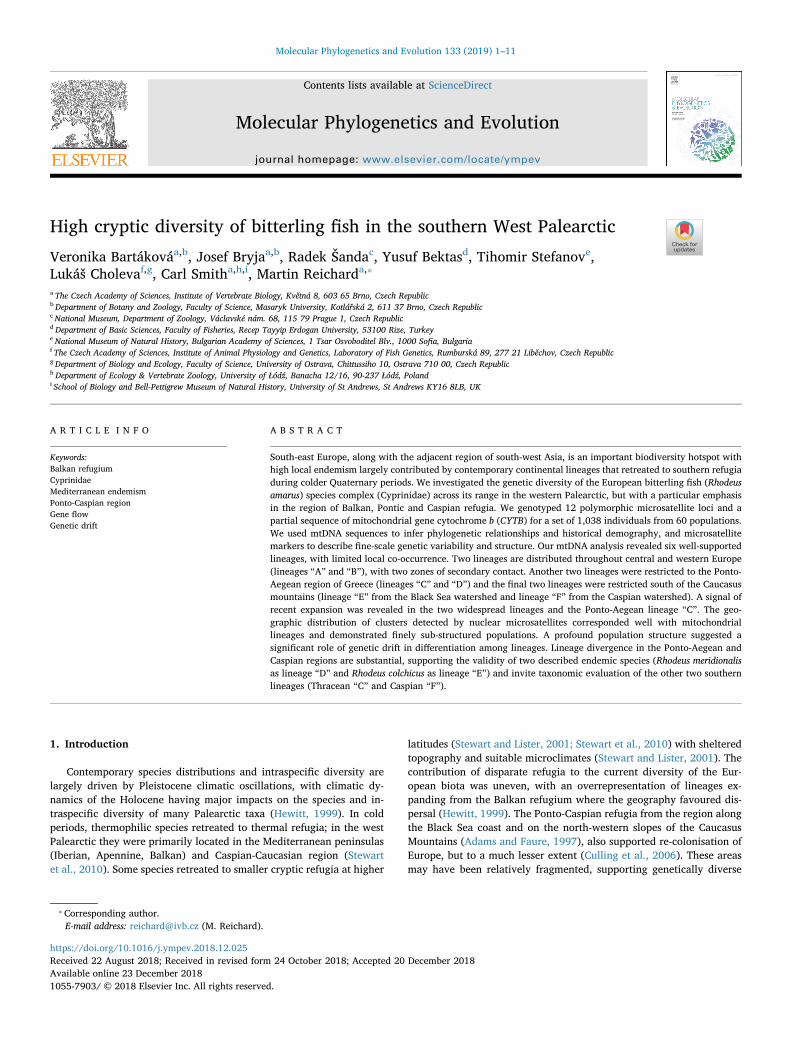
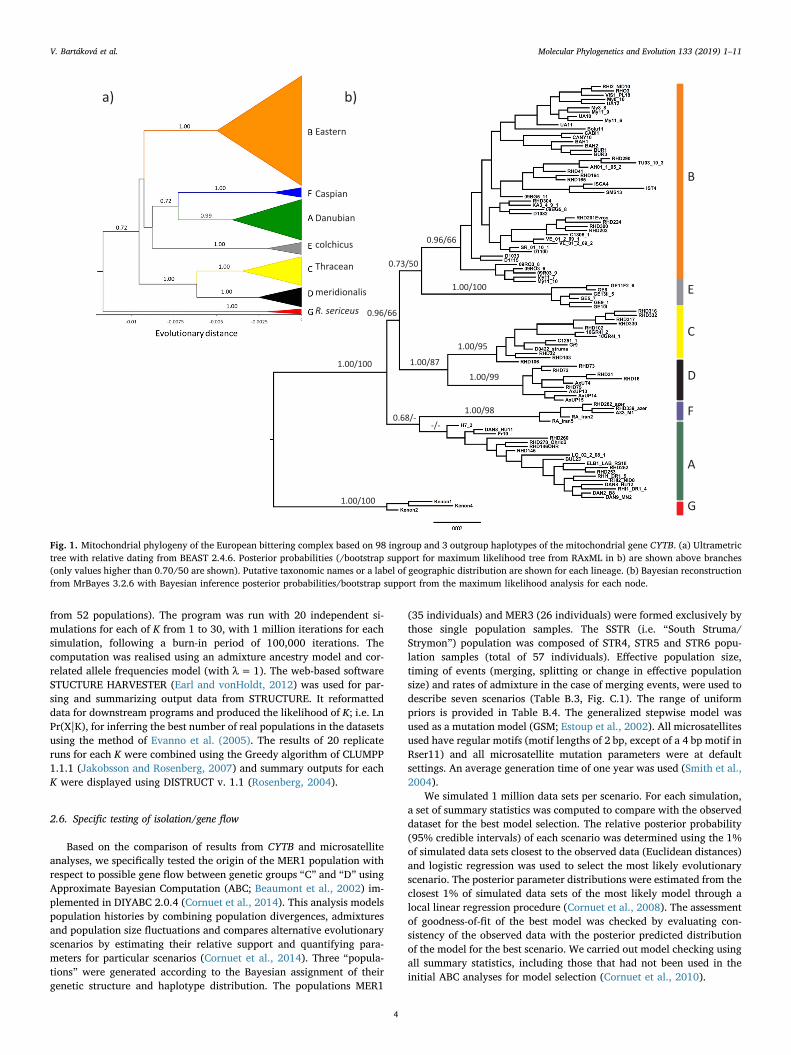
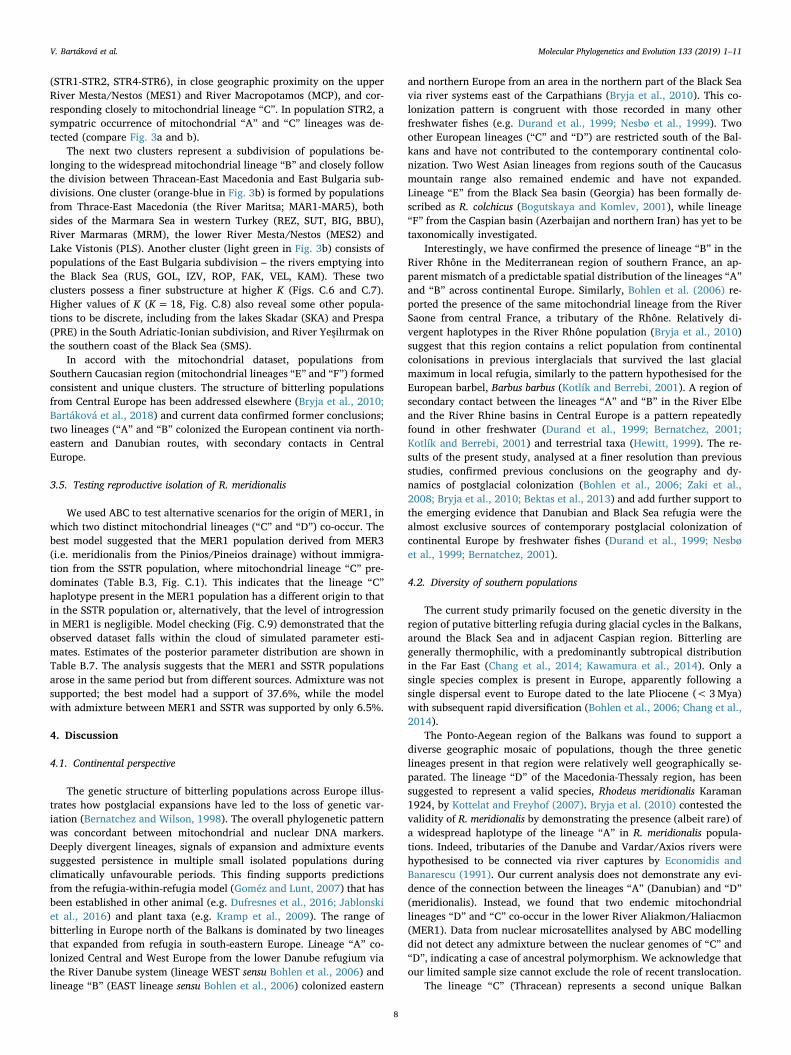
Fig. 1. Mitochondrial phylogeny of the European bittering complex based on 98 ingroup and 3 outgroup haplotypes of the mitochondrial gene CYTB. (a) Ultrametrictree with relative dating from BEAST 2.4.6. Posterior probabilities (/bootstrap support for maximum likelihood tree from RAxML in b) are shown above branches(only values higher than 0.70/50 are shown). Putative taxonomic names or a label of geographic distribution are shown for each lineage. (b) Bayesian reconstructionfrom MrBayes 3.2.6 with Bayesian inference posterior probabilities/bootstrap support from the maximum likelihood analysis for each node.
V. Bartáková et al. Molecular Phylogenetics and Evolution 133 (2019) 1–11
4
3. Results
Genotyping success of microsatellites was high (97.14%), resultingin multilocus genotypes of 1002 individuals from 52 populations. Allanalyses of genetic structure were based on a complete dataset of all 12loci. The analyses of intrapopulation genetic variability were performedusing a reduced dataset of 10 loci and 924 individuals from 38 popu-lations; excluding populations with<10 individuals (Appendix A).Analysis of mitochondrial variability was based on 227 CYTB sequences(914 bp; 101 haplotypes) from 57 sites (Appendix A).
3.1. Analysis of mitochondrial variability
Phylogenetic analysis of 101 unique CYTB sequences revealed ahighly structured tree of West Palaearctic bitterling (Figs. 1, C.2) withsix well-supported phylogenetic lineages, referred to as lineages “A”-“F”. However, relationships among these lineages were not well re-solved, except the sister position of lineages “C” and “D”. The topolo-gies of the trees differed between BEAST and MrBayes (Fig. 1a vs. b),suggesting a rapid radiation that produced the current diversity ofmitochondrial lineages. This view is further strengthened by similarestimates for the age of the first divergence within particular lineages(Fig. 1a).
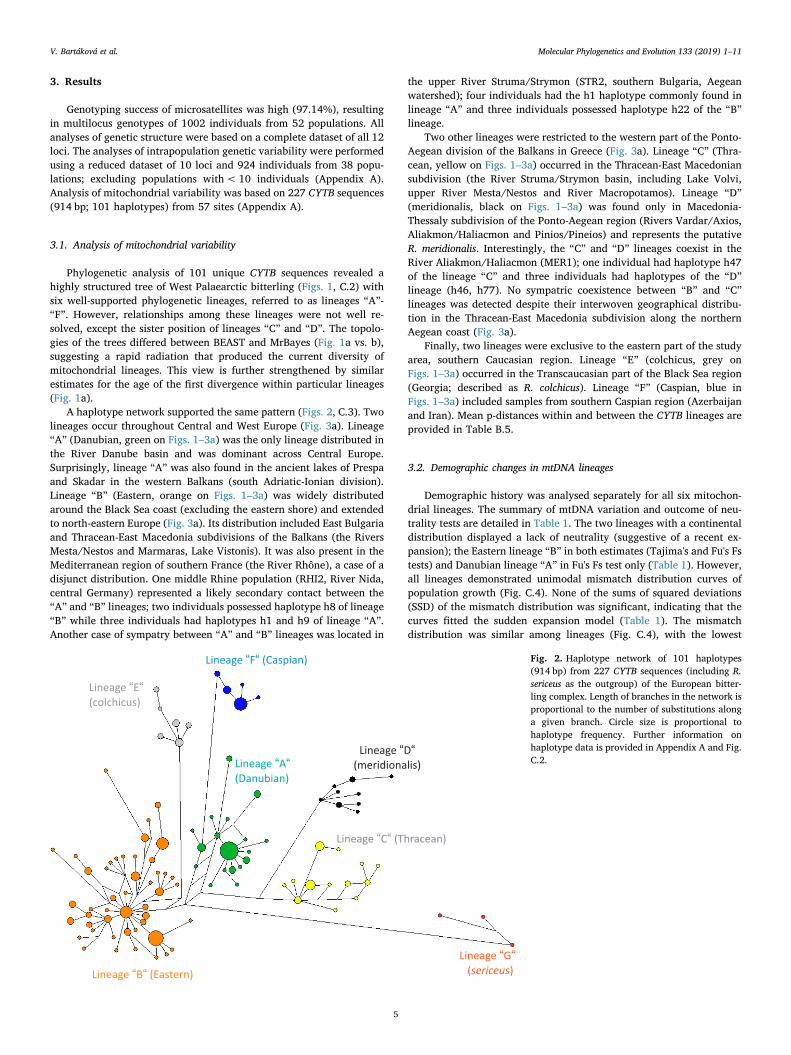
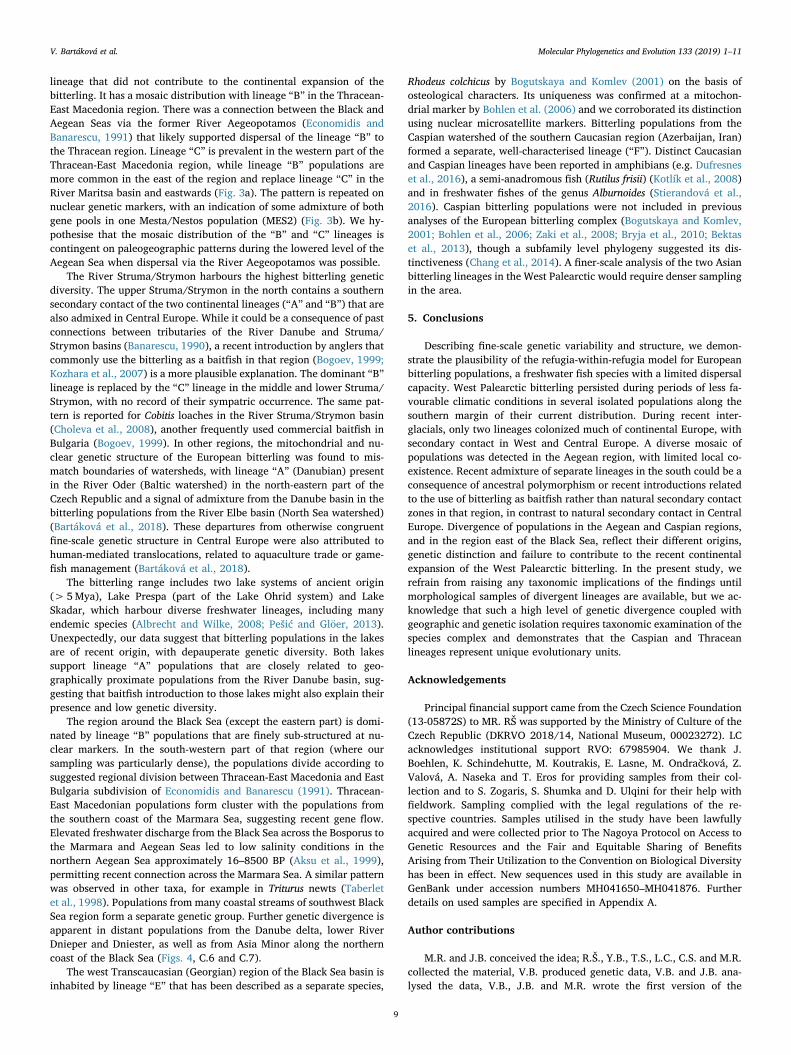
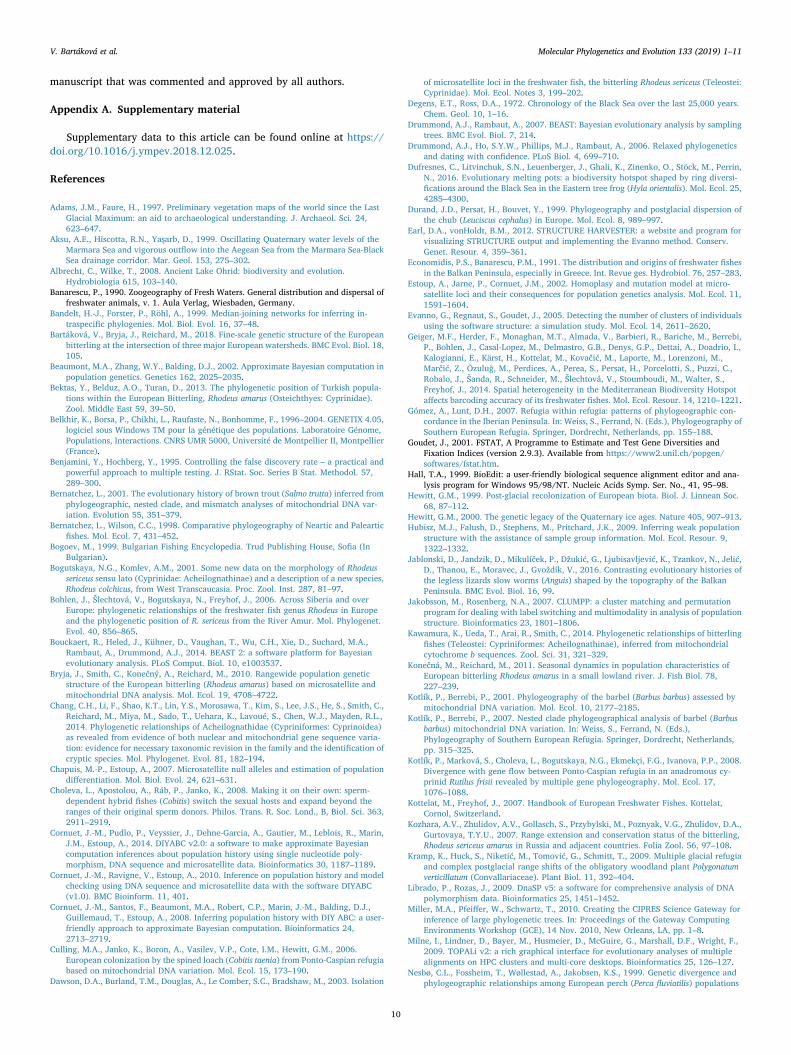
A haplotype network supported the same pattern (Figs. 2, C.3). Twolineages occur throughout Central and West Europe (Fig. 3a). Lineage“A” (Danubian, green on Figs. 1–3a) was the only lineage distributed inthe River Danube basin and was dominant across Central Europe.Surprisingly, lineage “A” was also found in the ancient lakes of Prespaand Skadar in the western Balkans (south Adriatic-Ionian division).Lineage “B” (Eastern, orange on Figs. 1–3a) was widely distributedaround the Black Sea coast (excluding the eastern shore) and extendedto north-eastern Europe (Fig. 3a). Its distribution included East Bulgariaand Thracean-East Macedonia subdivisions of the Balkans (the RiversMesta/Nestos and Marmaras, Lake Vistonis). It was also present in theMediterranean region of southern France (the River Rhône), a case of adisjunct distribution. One middle Rhine population (RHI2, River Nida,central Germany) represented a likely secondary contact between the“A” and “B” lineages; two individuals possessed haplotype h8 of lineage“B” while three individuals had haplotypes h1 and h9 of lineage “A”.Another case of sympatry between “A” and “B” lineages was located in
the upper River Struma/Strymon (STR2, southern Bulgaria, Aegeanwatershed); four individuals had the h1 haplotype commonly found inlineage “A” and three individuals possessed haplotype h22 of the “B”lineage.
Two other lineages were restricted to the western part of the Ponto-Aegean division of the Balkans in Greece (Fig. 3a). Lineage “C” (Thra-cean, yellow on Figs. 1–3a) occurred in the Thracean-East Macedoniansubdivision (the River Struma/Strymon basin, including Lake Volvi,upper River Mesta/Nestos and River Macropotamos). Lineage “D”(meridionalis, black on Figs. 1–3a) was found only in Macedonia-Thessaly subdivision of the Ponto-Aegean region (Rivers Vardar/Axios,Aliakmon/Haliacmon and Pinios/Pineios) and represents the putativeR. meridionalis. Interestingly, the “C” and “D” lineages coexist in theRiver Aliakmon/Haliacmon (MER1); one individual had haplotype h47of the lineage “C” and three individuals had haplotypes of the “D”lineage (h46, h77). No sympatric coexistence between “B” and “C”lineages was detected despite their interwoven geographical distribu-tion in the Thracean-East Macedonia subdivision along the northernAegean coast (Fig. 3a).
Finally, two lineages were exclusive to the eastern part of the studyarea, southern Caucasian region. Lineage “E” (colchicus, grey onFigs. 1–3a) occurred in the Transcaucasian part of the Black Sea region(Georgia; described as R. colchicus). Lineage “F” (Caspian, blue inFigs. 1–3a) included samples from southern Caspian region (Azerbaijanand Iran). Mean p-distances within and between the CYTB lineages areprovided in Table B.5.
3.2. Demographic changes in mtDNA lineages
Demographic history was analysed separately for all six mitochon-drial lineages. The summary of mtDNA variation and outcome of neu-trality tests are detailed in Table 1. The two lineages with a continentaldistribution displayed a lack of neutrality (suggestive of a recent ex-pansion); the Eastern lineage “B” in both estimates (Tajima's and Fu's Fstests) and Danubian lineage “A” in Fu's Fs test only (Table 1). However,all lineages demonstrated unimodal mismatch distribution curves ofpopulation growth (Fig. C.4). None of the sums of squared deviations(SSD) of the mismatch distribution was significant, indicating that thecurves fitted the sudden expansion model (Table 1). The mismatchdistribution was similar among lineages (Fig. C.4), with the lowest
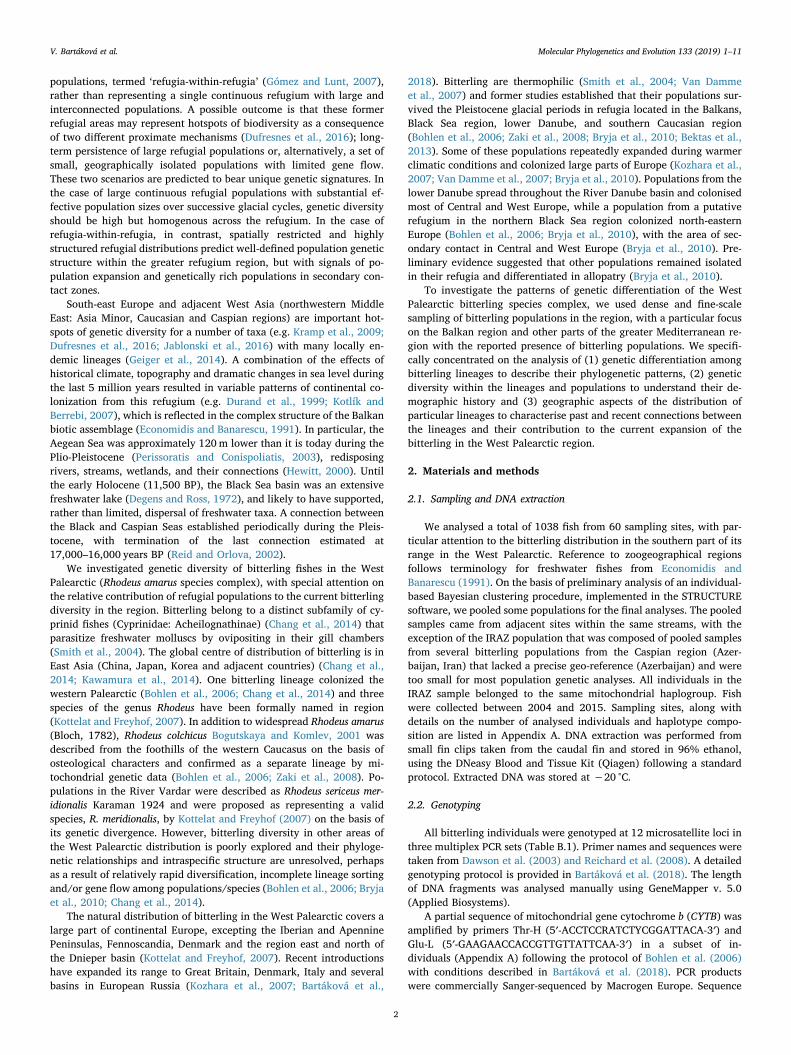
Fig. 2. Haplotype network of 101 haplotypes(914 bp) from 227 CYTB sequences (including R.sericeus as the outgroup) of the European bitter-ling complex. Length of branches in the network isproportional to the number of substitutions alonga given branch. Circle size is proportional tohaplotype frequency. Further information onhaplotype data is provided in Appendix A and Fig.C.2.
V. Bartáková et al. Molecular Phylogenetics and Evolution 133 (2019) 1–11
5
mean number of differences in the lineages “F” (Caspian) (0.865; ageexpansion parameter τ=0.984), “A” (Danubian) and “E” (colchicus)(1.879; τ=1.930) (Table 1), suggesting relatively recent demographicexpansions. Mean number of differences, τ values and estimated timingof the most important demographic expansion for each group indicaterelatively older expansions of the lineages “B” (Eastern) and “C”(Thracean) (Table 1). Based on BSP, population growth was detected inthe most widespread lineages (“A”, “B”, “C”) but no change in popu-lation size was detected in lineages “D”, “E” and “F” (Fig. C.5), inagreement with the neutrality test results (Table 1).
3.3. Intrapopulation variability – microsatellites
Expected (He) and observed (Ho) heterozygosity, allelic richness(AR), and tests of HWE for all 38 population samples are given in TableB.2. Significant departure from HWE was detected in 13 out of 38 po-pulations. After FDR correction, deviations from HWE were mostly
limited to a single locus, suggesting locally increased frequency of nullalleles. Only the population IRAZ showed deviance from HWE on sixloci and population STR2 on four loci. The deficit of heterozygotes inthe IRAZ population was likely due to pooling individuals from severallocalities (Wahlund effect and different allele frequencies in each po-pulation), and in the STR2 population it was possibly caused by ad-mixture of two genetic (mitochondrial) lineages and a subpopulationstructure. The range of AR was 2.23–6 (rarefaction estimate for thelowest sample size N=7). The populations with the highest geneticdiversity were from the lower reaches of large rivers of the Black Searegion – the Danube (DNB8; mitochondrial lineage “A”, DNB10; lineage“B”) and Dnieper and Dniester (DNP, DNS; lineage “B”), and the po-pulation from the River Pinios/Pineios (MER3, lineage “D”). In con-trast, the lowest AR was detected in the populations from small streamsin the European part of Turkey (REZ, SUT; western Black Sea wa-tershed; lineage “B”), the River Vistula in Poland (VIS, lineage “B”) andin Lake Skadar (SKA, lineage “A”).
(a) Mitochondrial DNA
(b) Nuclear DNA
Thracian-East Macedonia
South Adriatic Ionian division
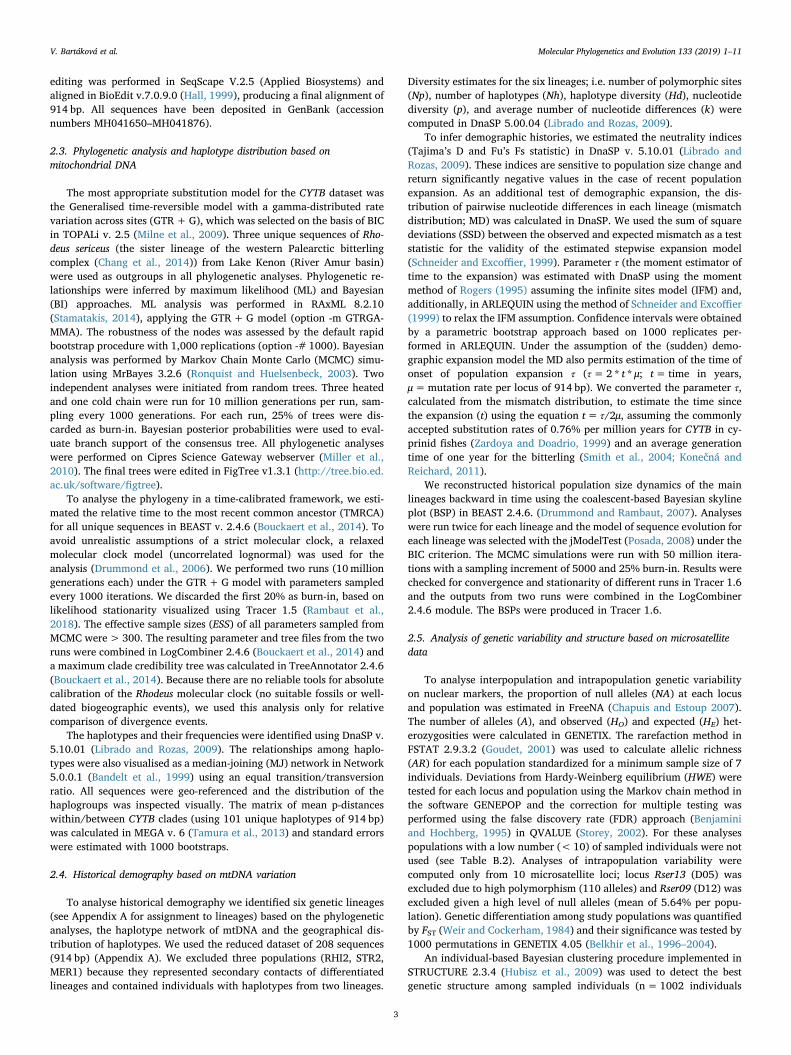
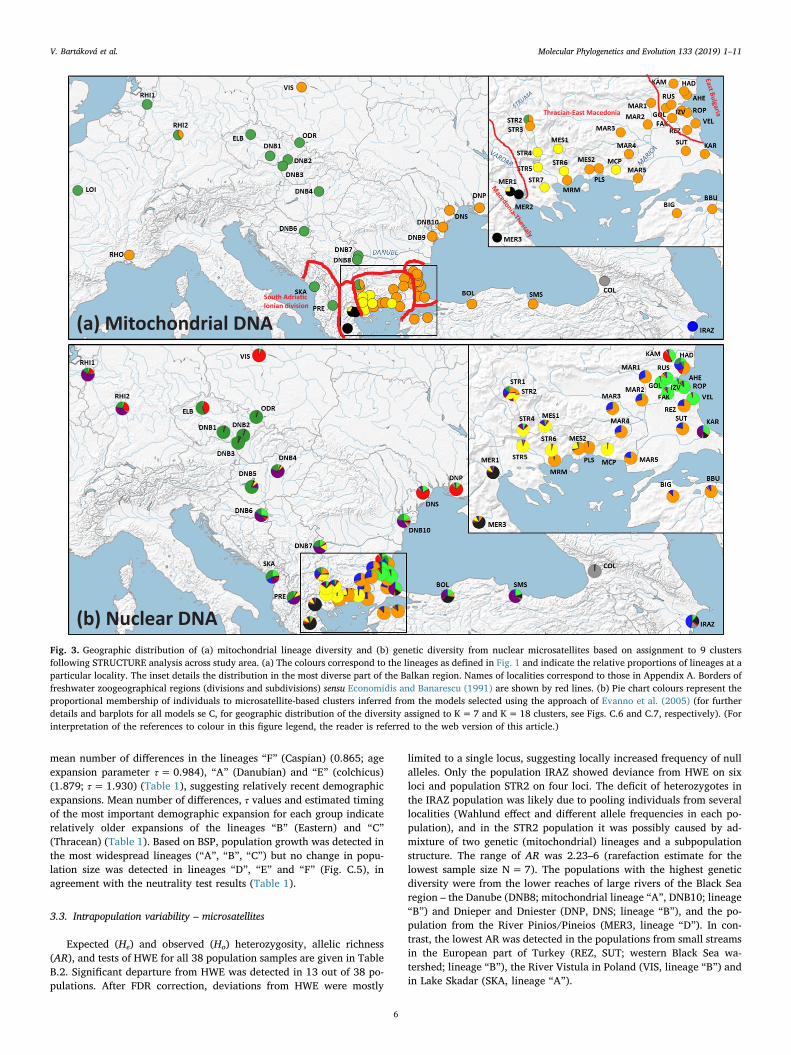
Fig. 3. Geographic distribution of (a) mitochondrial lineage diversity and (b) genetic diversity from nuclear microsatellites based on assignment to 9 clustersfollowing STRUCTURE analysis across study area. (a) The colours correspond to the lineages as defined in Fig. 1 and indicate the relative proportions of lineages at aparticular locality. The inset details the distribution in the most diverse part of the Balkan region. Names of localities correspond to those in Appendix A. Borders offreshwater zoogeographical regions (divisions and subdivisions) sensu Economidis and Banarescu (1991) are shown by red lines. (b) Pie chart colours represent theproportional membership of individuals to microsatellite-based clusters inferred from the models selected using the approach of Evanno et al. (2005) (for furtherdetails and barplots for all models se C, for geographic distribution of the diversity assigned to K=7 and K=18 clusters, see Figs. C.6 and C.7, respectively). (Forinterpretation of the references to colour in this figure legend, the reader is referred to the web version of this article.)
V. Bartáková et al. Molecular Phylogenetics and Evolution 133 (2019) 1–11
6
3.4. Genetic structure inferred from nuclear markers
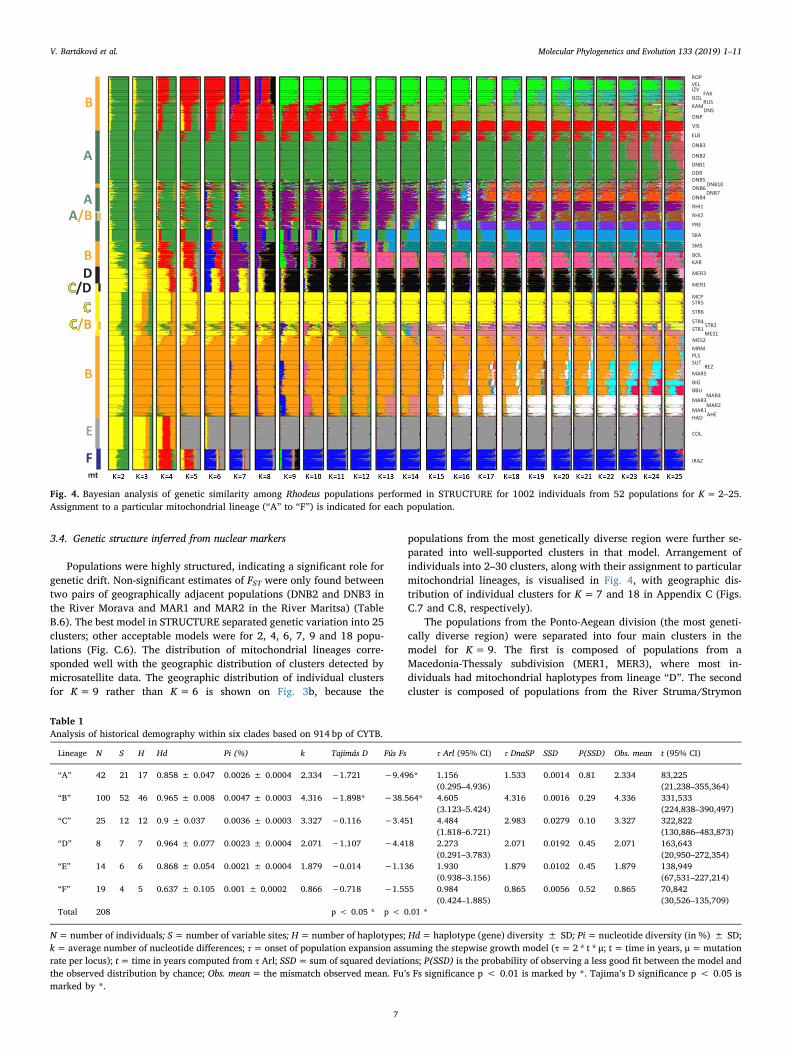
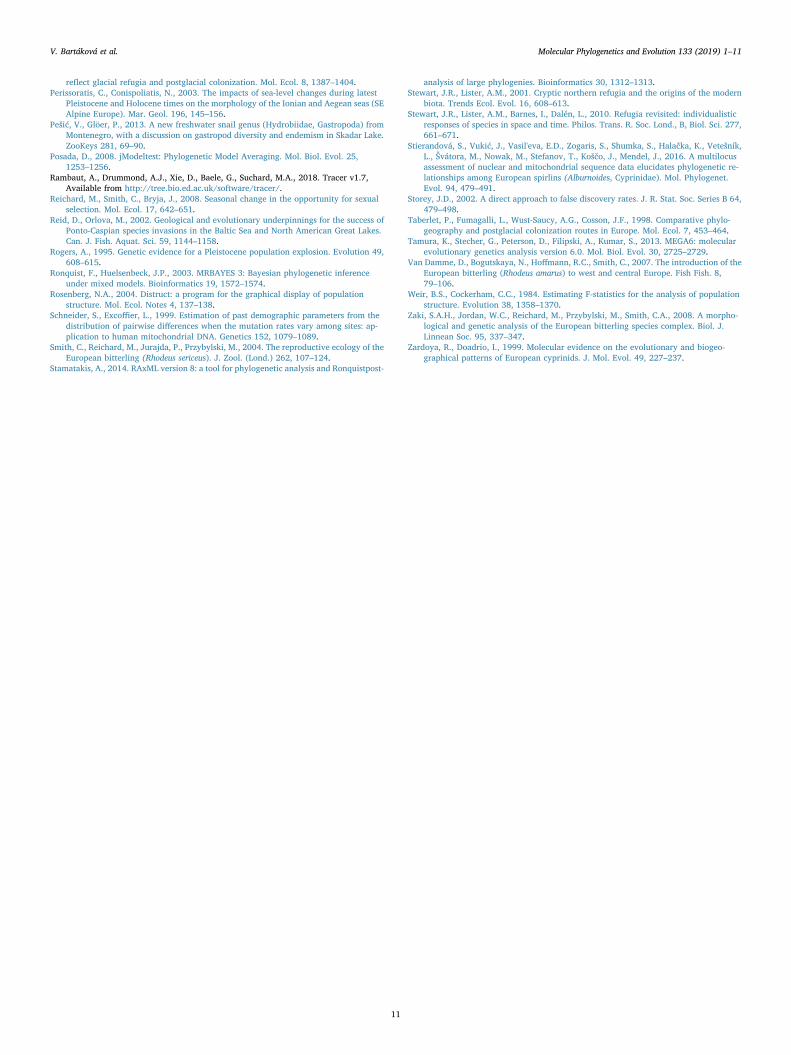
Populations were highly structured, indicating a significant role forgenetic drift. Non-significant estimates of FST were only found betweentwo pairs of geographically adjacent populations (DNB2 and DNB3 inthe River Morava and MAR1 and MAR2 in the River Maritsa) (TableB.6). The best model in STRUCTURE separated genetic variation into 25clusters; other acceptable models were for 2, 4, 6, 7, 9 and 18 popu-lations (Fig. C.6). The distribution of mitochondrial lineages corre-sponded well with the geographic distribution of clusters detected bymicrosatellite data. The geographic distribution of individual clustersfor K=9 rather than K=6 is shown on Fig. 3b, because the
populations from the most genetically diverse region were further se-parated into well-supported clusters in that model. Arrangement ofindividuals into 2–30 clusters, along with their assignment to particularmitochondrial lineages, is visualised in Fig. 4, with geographic dis-tribution of individual clusters for K=7 and 18 in Appendix C (Figs.C.7 and C.8, respectively).
The populations from the Ponto-Aegean division (the most geneti-cally diverse region) were separated into four main clusters in themodel for K=9. The first is composed of populations from aMacedonia-Thessaly subdivision (MER1, MER3), where most in-dividuals had mitochondrial haplotypes from lineage “D”. The secondcluster is composed of populations from the River Struma/Strymon
mt
ROP VEL IZV GOL
RUS KAM
DNS
VIS
ELB
DNP
DNB3
DNB2
DNB1 ODR DNB5
DNB10DNB6
DNB7 DNB4
RHI1
RHI2
PRE
SKA
SMS
BOL KAR
MER3
MER1
MCP STR5
STR6
STR4 STR2
STR1 MES1
MES2 MRM PLS SUT
REZ MAR5
BIG BBU
MAR4 MAR3
MAR2 MAR1
AHE HAD
COL
IRAZ
FAK
A
A A/B
D /D
E
F
B
B
B
/B
Fig. 4. Bayesian analysis of genetic similarity among Rhodeus populations performed in STRUCTURE for 1002 individuals from 52 populations for K=2–25.Assignment to a particular mitochondrial lineage (“A” to “F”) is indicated for each population.
Table 1Analysis of historical demography within six clades based on 914 bp of CYTB.
Lineage N S H Hd Pi (%) k Tajimás D Fús Fs τ Arl (95% CI) τ DnaSP SSD P(SSD) Obs. mean t (95% CI)
“A” 42 21 17 0.858 ± 0.047 0.0026 ± 0.0004 2.334 −1.721 −9.496* 1.156(0.295–4.936)
1.533 0.0014 0.81 2.334 83,225(21,238–355,364)
“B” 100 52 46 0.965 ± 0.008 0.0047 ± 0.0003 4.316 −1.898* −38.564* 4.605(3.123–5.424)
4.316 0.0016 0.29 4.336 331,533(224,838–390,497)
“C” 25 12 12 0.9 ± 0.037 0.0036 ± 0.0003 3.327 −0.116 −3.451 4.484(1.818–6.721)
2.983 0.0279 0.10 3.327 322,822(130,886–483,873)
“D” 8 7 7 0.964 ± 0.077 0.0023 ± 0.0004 2.071 −1.107 −4.418 2.273(0.291–3.783)
2.071 0.0192 0.45 2.071 163,643(20,950–272,354)
“E” 14 6 6 0.868 ± 0.054 0.0021 ± 0.0004 1.879 −0.014 −1.136 1.930(0.938–3.156)
1.879 0.0102 0.45 1.879 138,949(67,531–227,214)
“F” 19 4 5 0.637 ± 0.105 0.001 ± 0.0002 0.866 −0.718 −1.555 0.984(0.424–1.885)
0.865 0.0056 0.52 0.865 70,842(30,526–135,709)
Total 208 p < 0.05 * p < 0.01 *
N=number of individuals; S=number of variable sites; H=number of haplotypes; Hd=haplotype (gene) diversity ± SD; Pi=nucleotide diversity (in %) ± SD;k=average number of nucleotide differences; τ=onset of population expansion assuming the stepwise growth model (τ=2 * t * μ; t = time in years, μ=mutationrate per locus); t=time in years computed from τ Arl; SSD=sum of squared deviations; P(SSD) is the probability of observing a less good fit between the model andthe observed distribution by chance; Obs. mean= the mismatch observed mean. Fu’s Fs significance p < 0.01 is marked by *. Tajima’s D significance p < 0.05 ismarked by *.
V. Bartáková et al. Molecular Phylogenetics and Evolution 133 (2019) 1–11
7
(STR1-STR2, STR4-STR6), in close geographic proximity on the upperRiver Mesta/Nestos (MES1) and River Macropotamos (MCP), and cor-responding closely to mitochondrial lineage “C”. In population STR2, asympatric occurrence of mitochondrial “A” and “C” lineages was de-tected (compare Fig. 3a and b).
The next two clusters represent a subdivision of populations be-longing to the widespread mitochondrial lineage “B” and closely followthe division between Thracean-East Macedonia and East Bulgaria sub-divisions. One cluster (orange-blue in Fig. 3b) is formed by populationsfrom Thrace-East Macedonia (the River Maritsa; MAR1-MAR5), bothsides of the Marmara Sea in western Turkey (REZ, SUT, BIG, BBU),River Marmaras (MRM), the lower River Mesta/Nestos (MES2) andLake Vistonis (PLS). Another cluster (light green in Fig. 3b) consists ofpopulations of the East Bulgaria subdivision – the rivers emptying intothe Black Sea (RUS, GOL, IZV, ROP, FAK, VEL, KAM). These twoclusters possess a finer substructure at higher K (Figs. C.6 and C.7).Higher values of K (K=18, Fig. C.8) also reveal some other popula-tions to be discrete, including from the lakes Skadar (SKA) and Prespa(PRE) in the South Adriatic-Ionian subdivision, and River Yeşilırmak onthe southern coast of the Black Sea (SMS).
In accord with the mitochondrial dataset, populations fromSouthern Caucasian region (mitochondrial lineages “E” and “F”) formedconsistent and unique clusters. The structure of bitterling populationsfrom Central Europe has been addressed elsewhere (Bryja et al., 2010;Bartáková et al., 2018) and current data confirmed former conclusions;two lineages (“A” and “B” colonized the European continent via north-eastern and Danubian routes, with secondary contacts in CentralEurope.
3.5. Testing reproductive isolation of R. meridionalis
We used ABC to test alternative scenarios for the origin of MER1, inwhich two distinct mitochondrial lineages (“C” and “D”) co-occur. Thebest model suggested that the MER1 population derived from MER3(i.e. meridionalis from the Pinios/Pineios drainage) without immigra-tion from the SSTR population, where mitochondrial lineage “C” pre-dominates (Table B.3, Fig. C.1). This indicates that the lineage “C”haplotype present in the MER1 population has a different origin to thatin the SSTR population or, alternatively, that the level of introgressionin MER1 is negligible. Model checking (Fig. C.9) demonstrated that theobserved dataset falls within the cloud of simulated parameter esti-mates. Estimates of the posterior parameter distribution are shown inTable B.7. The analysis suggests that the MER1 and SSTR populationsarose in the same period but from different sources. Admixture was notsupported; the best model had a support of 37.6%, while the modelwith admixture between MER1 and SSTR was supported by only 6.5%.
4. Discussion
4.1. Continental perspective
The genetic structure of bitterling populations across Europe illus-trates how postglacial expansions have led to the loss of genetic var-iation (Bernatchez and Wilson, 1998). The overall phylogenetic patternwas concordant between mitochondrial and nuclear DNA markers.Deeply divergent lineages, signals of expansion and admixture eventssuggested persistence in multiple small isolated populations duringclimatically unfavourable periods. This finding supports predictionsfrom the refugia-within-refugia model (Goméz and Lunt, 2007) that hasbeen established in other animal (e.g. Dufresnes et al., 2016; Jablonskiet al., 2016) and plant taxa (e.g. Kramp et al., 2009). The range ofbitterling in Europe north of the Balkans is dominated by two lineagesthat expanded from refugia in south-eastern Europe. Lineage “A” co-lonized Central and West Europe from the lower Danube refugium viathe River Danube system (lineage WEST sensu Bohlen et al., 2006) andlineage “B” (EAST lineage sensu Bohlen et al., 2006) colonized eastern
and northern Europe from an area in the northern part of the Black Seavia river systems east of the Carpathians (Bryja et al., 2010). This co-lonization pattern is congruent with those recorded in many otherfreshwater fishes (e.g. Durand et al., 1999; Nesbø et al., 1999). Twoother European lineages (“C” and “D”) are restricted south of the Bal-kans and have not contributed to the contemporary continental colo-nization. Two West Asian lineages from regions south of the Caucasusmountain range also remained endemic and have not expanded.Lineage “E” from the Black Sea basin (Georgia) has been formally de-scribed as R. colchicus (Bogutskaya and Komlev, 2001), while lineage“F” from the Caspian basin (Azerbaijan and northern Iran) has yet to betaxonomically investigated.
Interestingly, we have confirmed the presence of lineage “B” in theRiver Rhône in the Mediterranean region of southern France, an ap-parent mismatch of a predictable spatial distribution of the lineages “A”and “B” across continental Europe. Similarly, Bohlen et al. (2006) re-ported the presence of the same mitochondrial lineage from the RiverSaone from central France, a tributary of the Rhône. Relatively di-vergent haplotypes in the River Rhône population (Bryja et al., 2010)suggest that this region contains a relict population from continentalcolonisations in previous interglacials that survived the last glacialmaximum in local refugia, similarly to the pattern hypothesised for theEuropean barbel, Barbus barbus (Kotlík and Berrebi, 2001). A region ofsecondary contact between the lineages “A” and “B” in the River Elbeand the River Rhine basins in Central Europe is a pattern repeatedlyfound in other freshwater (Durand et al., 1999; Bernatchez, 2001;Kotlík and Berrebi, 2001) and terrestrial taxa (Hewitt, 1999). The re-sults of the present study, analysed at a finer resolution than previousstudies, confirmed previous conclusions on the geography and dy-namics of postglacial colonization (Bohlen et al., 2006; Zaki et al.,2008; Bryja et al., 2010; Bektas et al., 2013) and add further support tothe emerging evidence that Danubian and Black Sea refugia were thealmost exclusive sources of contemporary postglacial colonization ofcontinental Europe by freshwater fishes (Durand et al., 1999; Nesbøet al., 1999; Bernatchez, 2001).
4.2. Diversity of southern populations
The current study primarily focused on the genetic diversity in theregion of putative bitterling refugia during glacial cycles in the Balkans,around the Black Sea and in adjacent Caspian region. Bitterling aregenerally thermophilic, with a predominantly subtropical distributionin the Far East (Chang et al., 2014; Kawamura et al., 2014). Only asingle species complex is present in Europe, apparently following asingle dispersal event to Europe dated to the late Pliocene (< 3Mya)with subsequent rapid diversification (Bohlen et al., 2006; Chang et al.,2014).
The Ponto-Aegean region of the Balkans was found to support adiverse geographic mosaic of populations, though the three geneticlineages present in that region were relatively well geographically se-parated. The lineage “D” of the Macedonia-Thessaly region, has beensuggested to represent a valid species, Rhodeus meridionalis Karaman1924, by Kottelat and Freyhof (2007). Bryja et al. (2010) contested thevalidity of R. meridionalis by demonstrating the presence (albeit rare) ofa widespread haplotype of the lineage “A” in R. meridionalis popula-tions. Indeed, tributaries of the Danube and Vardar/Axios rivers werehypothesised to be connected via river captures by Economidis andBanarescu (1991). Our current analysis does not demonstrate any evi-dence of the connection between the lineages “A” (Danubian) and “D”(meridionalis). Instead, we found that two endemic mitochondriallineages “D” and “C” co-occur in the lower River Aliakmon/Haliacmon(MER1). Data from nuclear microsatellites analysed by ABC modellingdid not detect any admixture between the nuclear genomes of “C” and“D”, indicating a case of ancestral polymorphism. We acknowledge thatour limited sample size cannot exclude the role of recent translocation.
The lineage “C” (Thracean) represents a second unique Balkan
V. Bartáková et al. Molecular Phylogenetics and Evolution 133 (2019) 1–11
8
lineage that did not contribute to the continental expansion of thebitterling. It has a mosaic distribution with lineage “B” in the Thracean-East Macedonia region. There was a connection between the Black andAegean Seas via the former River Aegeopotamos (Economidis andBanarescu, 1991) that likely supported dispersal of the lineage “B” tothe Thracean region. Lineage “C” is prevalent in the western part of theThracean-East Macedonia region, while lineage “B” populations aremore common in the east of the region and replace lineage “C” in theRiver Maritsa basin and eastwards (Fig. 3a). The pattern is repeated onnuclear genetic markers, with an indication of some admixture of bothgene pools in one Mesta/Nestos population (MES2) (Fig. 3b). We hy-pothesise that the mosaic distribution of the “B” and “C” lineages iscontingent on paleogeographic patterns during the lowered level of theAegean Sea when dispersal via the River Aegeopotamos was possible.
The River Struma/Strymon harbours the highest bitterling geneticdiversity. The upper Struma/Strymon in the north contains a southernsecondary contact of the two continental lineages (“A” and “B”) that arealso admixed in Central Europe. While it could be a consequence of pastconnections between tributaries of the River Danube and Struma/Strymon basins (Banarescu, 1990), a recent introduction by anglers thatcommonly use the bitterling as a baitfish in that region (Bogoev, 1999;Kozhara et al., 2007) is a more plausible explanation. The dominant “B”lineage is replaced by the “C” lineage in the middle and lower Struma/Strymon, with no record of their sympatric occurrence. The same pat-tern is reported for Cobitis loaches in the River Struma/Strymon basin(Choleva et al., 2008), another frequently used commercial baitfish inBulgaria (Bogoev, 1999). In other regions, the mitochondrial and nu-clear genetic structure of the European bitterling was found to mis-match boundaries of watersheds, with lineage “A” (Danubian) presentin the River Oder (Baltic watershed) in the north-eastern part of theCzech Republic and a signal of admixture from the Danube basin in thebitterling populations from the River Elbe basin (North Sea watershed)(Bartáková et al., 2018). These departures from otherwise congruentfine-scale genetic structure in Central Europe were also attributed tohuman-mediated translocations, related to aquaculture trade or game-fish management (Bartáková et al., 2018).
The bitterling range includes two lake systems of ancient origin(> 5Mya), Lake Prespa (part of the Lake Ohrid system) and LakeSkadar, which harbour diverse freshwater lineages, including manyendemic species (Albrecht and Wilke, 2008; Pešić and Glöer, 2013).Unexpectedly, our data suggest that bitterling populations in the lakesare of recent origin, with depauperate genetic diversity. Both lakessupport lineage “A” populations that are closely related to geo-graphically proximate populations from the River Danube basin, sug-gesting that baitfish introduction to those lakes might also explain theirpresence and low genetic diversity.
The region around the Black Sea (except the eastern part) is domi-nated by lineage “B” populations that are finely sub-structured at nu-clear markers. In the south-western part of that region (where oursampling was particularly dense), the populations divide according tosuggested regional division between Thracean-East Macedonia and EastBulgaria subdivision of Economidis and Banarescu (1991). Thracean-East Macedonian populations form cluster with the populations fromthe southern coast of the Marmara Sea, suggesting recent gene flow.Elevated freshwater discharge from the Black Sea across the Bosporus tothe Marmara and Aegean Seas led to low salinity conditions in thenorthern Aegean Sea approximately 16–8500 BP (Aksu et al., 1999),permitting recent connection across the Marmara Sea. A similar patternwas observed in other taxa, for example in Triturus newts (Taberletet al., 1998). Populations from many coastal streams of southwest BlackSea region form a separate genetic group. Further genetic divergence isapparent in distant populations from the Danube delta, lower RiverDnieper and Dniester, as well as from Asia Minor along the northerncoast of the Black Sea (Figs. 4, C.6 and C.7).
The west Transcaucasian (Georgian) region of the Black Sea basin isinhabited by lineage “E” that has been described as a separate species,
Rhodeus colchicus by Bogutskaya and Komlev (2001) on the basis ofosteological characters. Its uniqueness was confirmed at a mitochon-drial marker by Bohlen et al. (2006) and we corroborated its distinctionusing nuclear microsatellite markers. Bitterling populations from theCaspian watershed of the southern Caucasian region (Azerbaijan, Iran)formed a separate, well-characterised lineage (“F”). Distinct Caucasianand Caspian lineages have been reported in amphibians (e.g. Dufresneset al., 2016), a semi-anadromous fish (Rutilus frisii) (Kotlík et al., 2008)and in freshwater fishes of the genus Alburnoides (Stierandová et al.,2016). Caspian bitterling populations were not included in previousanalyses of the European bitterling complex (Bogutskaya and Komlev,2001; Bohlen et al., 2006; Zaki et al., 2008; Bryja et al., 2010; Bektaset al., 2013), though a subfamily level phylogeny suggested its dis-tinctiveness (Chang et al., 2014). A finer-scale analysis of the two Asianbitterling lineages in the West Palearctic would require denser samplingin the area.
5. Conclusions
Describing fine-scale genetic variability and structure, we demon-strate the plausibility of the refugia-within-refugia model for Europeanbitterling populations, a freshwater fish species with a limited dispersalcapacity. West Palearctic bitterling persisted during periods of less fa-vourable climatic conditions in several isolated populations along thesouthern margin of their current distribution. During recent inter-glacials, only two lineages colonized much of continental Europe, withsecondary contact in West and Central Europe. A diverse mosaic ofpopulations was detected in the Aegean region, with limited local co-existence. Recent admixture of separate lineages in the south could be aconsequence of ancestral polymorphism or recent introductions relatedto the use of bitterling as baitfish rather than natural secondary contactzones in that region, in contrast to natural secondary contact in CentralEurope. Divergence of populations in the Aegean and Caspian regions,and in the region east of the Black Sea, reflect their different origins,genetic distinction and failure to contribute to the recent continentalexpansion of the West Palearctic bitterling. In the present study, werefrain from raising any taxonomic implications of the findings untilmorphological samples of divergent lineages are available, but we ac-knowledge that such a high level of genetic divergence coupled withgeographic and genetic isolation requires taxonomic examination of thespecies complex and demonstrates that the Caspian and Thraceanlineages represent unique evolutionary units.
Acknowledgements
Principal financial support came from the Czech Science Foundation(13-05872S) to MR. RŠ was supported by the Ministry of Culture of theCzech Republic (DKRVO 2018/14, National Museum, 00023272). LCacknowledges institutional support RVO: 67985904. We thank J.Boehlen, K. Schindehutte, M. Koutrakis, E. Lasne, M. Ondračková, Z.Valová, A. Naseka and T. Eros for providing samples from their col-lection and to S. Zogaris, S. Shumka and D. Ulqini for their help withfieldwork. Sampling complied with the legal regulations of the re-spective countries. Samples utilised in the study have been lawfullyacquired and were collected prior to The Nagoya Protocol on Access toGenetic Resources and the Fair and Equitable Sharing of BenefitsArising from Their Utilization to the Convention on Biological Diversityhas been in effect. New sequences used in this study are available inGenBank under accession numbers MH041650–MH041876. Furtherdetails on used samples are specified in Appendix A.
Author contributions
M.R. and J.B. conceived the idea; R.Š., Y.B., T.S., L.C., C.S. and M.R.collected the material, V.B. produced genetic data, V.B. and J.B. ana-lysed the data, V.B., J.B. and M.R. wrote the first version of the
V. Bartáková et al. Molecular Phylogenetics and Evolution 133 (2019) 1–11
9
manuscript that was commented and approved by all authors.
Appendix A. Supplementary material
Supplementary data to this article can be found online at https://doi.org/10.1016/j.ympev.2018.12.025.
References
Adams, J.M., Faure, H., 1997. Preliminary vegetation maps of the world since the LastGlacial Maximum: an aid to archaeological understanding. J. Archaeol. Sci. 24,623–647.
Aksu, A.E., Hiscotta, R.N., Yaşarb, D., 1999. Oscillating Quaternary water levels of theMarmara Sea and vigorous outflow into the Aegean Sea from the Marmara Sea-BlackSea drainage corridor. Mar. Geol. 153, 275–302.
Albrecht, C., Wilke, T., 2008. Ancient Lake Ohrid: biodiversity and evolution.Hydrobiologia 615, 103–140.
Banarescu, P., 1990. Zoogeography of Fresh Waters. General distribution and dispersal offreshwater animals, v. 1. Aula Verlag, Wiesbaden, Germany.
Bandelt, H.-J., Forster, P., Röhl, A., 1999. Median-joining networks for inferring in-traspecific phylogenies. Mol. Biol. Evol. 16, 37–48.
Bartáková, V., Bryja, J., Reichard, M., 2018. Fine-scale genetic structure of the Europeanbitterling at the intersection of three major European watersheds. BMC Evol. Biol. 18,105.
Beaumont, M.A., Zhang, W.Y., Balding, D.J., 2002. Approximate Bayesian computation inpopulation genetics. Genetics 162, 2025–2035.
Bektas, Y., Belduz, A.O., Turan, D., 2013. The phylogenetic position of Turkish popula-tions within the European Bitterling, Rhodeus amarus (Osteichthyes: Cyprinidae).Zool. Middle East 59, 39–50.
Belkhir, K., Borsa, P., Chikhi, L., Raufaste, N., Bonhomme, F., 1996–2004. GENETIX 4.05,logiciel sous Windows TM pour la génétique des populations. Laboratoire Génome,Populations, Interactions. CNRS UMR 5000, Université de Montpellier II, Montpellier(France).
Benjamini, Y., Hochberg, Y., 1995. Controlling the false discovery rate – a practical andpowerful approach to multiple testing. J. RStat. Soc. Series B Stat. Methodol. 57,289–300.
Bernatchez, L., 2001. The evolutionary history of brown trout (Salmo trutta) inferred fromphylogeographic, nested clade, and mismatch analyses of mitochondrial DNA var-iation. Evolution 55, 351–379.
Bernatchez, L., Wilson, C.C., 1998. Comparative phylogeography of Neartic and Palearticfishes. Mol. Ecol. 7, 431–452.
Bogoev, M., 1999. Bulgarian Fishing Encyclopedia. Trud Publishing House, Sofia (InBulgarian).
Bogutskaya, N.G., Komlev, A.M., 2001. Some new data on the morphology of Rhodeussericeus sensu lato (Cyprinidae: Acheilognathinae) and a description of a new species,Rhodeus colchicus, from West Transcaucasia. Proc. Zool. Inst. 287, 81–97.
Bohlen, J., Šlechtová, V., Bogutskaya, N., Freyhof, J., 2006. Across Siberia and overEurope: phylogenetic relationships of the freshwater fish genus Rhodeus in Europeand the phylogenetic position of R. sericeus from the River Amur. Mol. Phylogenet.Evol. 40, 856–865.
Bouckaert, R., Heled, J., Kühner, D., Vaughan, T., Wu, C.H., Xie, D., Suchard, M.A.,Rambaut, A., Drummond, A.J., 2014. BEAST 2: a software platform for Bayesianevolutionary analysis. PLoS Comput. Biol. 10, e1003537.
Bryja, J., Smith, C., Konečný, A., Reichard, M., 2010. Rangewide population geneticstructure of the European bitterling (Rhodeus amarus) based on microsatellite andmitochondrial DNA analysis. Mol. Ecol. 19, 4708–4722.
Chang, C.H., Li, F., Shao, K.T., Lin, Y.S., Morosawa, T., Kim, S., Lee, J.S., He, S., Smith, C.,Reichard, M., Miya, M., Sado, T., Uehara, K., Lavoué, S., Chen, W.J., Mayden, R.L.,2014. Phylogenetic relationships of Acheilognathidae (Cypriniformes: Cyprinoidea)as revealed from evidence of both nuclear and mitochondrial gene sequence varia-tion: evidence for necessary taxonomic revision in the family and the identification ofcryptic species. Mol. Phylogenet. Evol. 81, 182–194.
Chapuis, M.-P., Estoup, A., 2007. Microsatellite null alleles and estimation of populationdifferentiation. Mol. Biol. Evol. 24, 621–631.
Choleva, L., Apostolou, A., Ráb, P., Janko, K., 2008. Making it on their own: sperm-dependent hybrid fishes (Cobitis) switch the sexual hosts and expand beyond theranges of their original sperm donors. Philos. Trans. R. Soc. Lond., B, Biol. Sci. 363,2911–2919.
Cornuet, J.-M., Pudlo, P., Veyssier, J., Dehne-Garcia, A., Gautier, M., Leblois, R., Marin,J.M., Estoup, A., 2014. DIYABC v2.0: a software to make approximate Bayesiancomputation inferences about population history using single nucleotide poly-morphism, DNA sequence and microsatellite data. Bioinformatics 30, 1187–1189.
Cornuet, J.-M., Ravigne, V., Estoup, A., 2010. Inference on population history and modelchecking using DNA sequence and microsatellite data with the software DIYABC(v1.0). BMC Bioinform. 11, 401.
Cornuet, J.-M., Santos, F., Beaumont, M.A., Robert, C.P., Marin, J.-M., Balding, D.J.,Guillemaud, T., Estoup, A., 2008. Inferring population history with DIY ABC: a user-friendly approach to approximate Bayesian computation. Bioinformatics 24,2713–2719.
Culling, M.A., Janko, K., Boron, A., Vasilev, V.P., Cote, I.M., Hewitt, G.M., 2006.European colonization by the spined loach (Cobitis taenia) from Ponto-Caspian refugiabased on mitochondrial DNA variation. Mol. Ecol. 15, 173–190.
Dawson, D.A., Burland, T.M., Douglas, A., Le Comber, S.C., Bradshaw, M., 2003. Isolation
of microsatellite loci in the freshwater fish, the bitterling Rhodeus sericeus (Teleostei:Cyprinidae). Mol. Ecol. Notes 3, 199–202.
Degens, E.T., Ross, D.A., 1972. Chronology of the Black Sea over the last 25,000 years.Chem. Geol. 10, 1–16.
Drummond, A.J., Rambaut, A., 2007. BEAST: Bayesian evolutionary analysis by samplingtrees. BMC Evol. Biol. 7, 214.
Drummond, A.J., Ho, S.Y.W., Phillips, M.J., Rambaut, A., 2006. Relaxed phylogeneticsand dating with confidence. PLoS Biol. 4, 699–710.
Dufresnes, C., Litvinchuk, S.N., Leuenberger, J., Ghali, K., Zinenko, O., Stöck, M., Perrin,N., 2016. Evolutionary melting pots: a biodiversity hotspot shaped by ring diversi-fications around the Black Sea in the Eastern tree frog (Hyla orientalis). Mol. Ecol. 25,4285–4300.
Durand, J.D., Persat, H., Bouvet, Y., 1999. Phylogeography and postglacial dispersion ofthe chub (Leuciscus cephalus) in Europe. Mol. Ecol. 8, 989–997.
Earl, D.A., vonHoldt, B.M., 2012. STRUCTURE HARVESTER: a website and program forvisualizing STRUCTURE output and implementing the Evanno method. Conserv.Genet. Resour. 4, 359–361.
Economidis, P.S., Banarescu, P.M., 1991. The distribution and origins of freshwater fishesin the Balkan Peninsula, especially in Greece. Int. Revue ges. Hydrobiol. 76, 257–283.
Estoup, A., Jarne, P., Cornuet, J.M., 2002. Homoplasy and mutation model at micro-satellite loci and their consequences for population genetics analysis. Mol. Ecol. 11,1591–1604.
Evanno, G., Regnaut, S., Goudet, J., 2005. Detecting the number of clusters of individualsusing the software structure: a simulation study. Mol. Ecol. 14, 2611–2620.
Geiger, M.F., Herder, F., Monaghan, M.T., Almada, V., Barbieri, R., Bariche, M., Berrebi,P., Bohlen, J., Casal-Lopez, M., Delmastro, G.B., Denys, G.P., Dettai, A., Doadrio, I.,Kalogianni, E., Kärst, H., Kottelat, M., Kovačić, M., Laporte, M., Lorenzoni, M.,Marčić, Z., Özuluğ, M., Perdices, A., Perea, S., Persat, H., Porcelotti, S., Puzzi, C.,Robalo, J., Šanda, R., Schneider, M., Šlechtová, V., Stoumboudi, M., Walter, S.,Freyhof, J., 2014. Spatial heterogeneity in the Mediterranean Biodiversity Hotspotaffects barcoding accuracy of its freshwater fishes. Mol. Ecol. Resour. 14, 1210–1221.
Gómez, A., Lunt, D.H., 2007. Refugia within refugia: patterns of phylogeographic con-cordance in the Iberian Peninsula. In: Weiss, S., Ferrand, N. (Eds.), Phylogeography ofSouthern European Refugia. Springer, Dordrecht, Netherlands, pp. 155–188.
Goudet, J., 2001. FSTAT, A Programme to Estimate and Test Gene Diversities andFixation Indices (version 2.9.3). Available from https://www2.unil.ch/popgen/softwares/fstat.htm.
Hall, T.A., 1999. BioEdit: a user-friendly biological sequence alignment editor and ana-lysis program for Windows 95/98/NT. Nucleic Acids Symp. Ser. No., 41, 95–98.
Hewitt, G.M., 1999. Post-glacial recolonization of European biota. Biol. J. Linnean Soc.68, 87–112.
Hewitt, G.M., 2000. The genetic legacy of the Quaternary ice ages. Nature 405, 907–913.Hubisz, M.J., Falush, D., Stephens, M., Pritchard, J.K., 2009. Inferring weak population
structure with the assistance of sample group information. Mol. Ecol. Resour. 9,1322–1332.
Jablonski, D., Jandzik, D., Mikulíček, P., Džukić, G., Ljubisavljević, K., Tzankov, N., Jelić,D., Thanou, E., Moravec, J., Gvoždík, V., 2016. Contrasting evolutionary histories ofthe legless lizards slow worms (Anguis) shaped by the topography of the BalkanPeninsula. BMC Evol. Biol. 16, 99.
Jakobsson, M., Rosenberg, N.A., 2007. CLUMPP: a cluster matching and permutationprogram for dealing with label switching and multimodality in analysis of populationstructure. Bioinformatics 23, 1801–1806.
Kawamura, K., Ueda, T., Arai, R., Smith, C., 2014. Phylogenetic relationships of bitterlingfishes (Teleostei: Cypriniformes: Acheilognathinae), inferred from mitochondrialcytochrome b sequences. Zool. Sci. 31, 321–329.
Konečná, M., Reichard, M., 2011. Seasonal dynamics in population characteristics ofEuropean bitterling Rhodeus amarus in a small lowland river. J. Fish Biol. 78,227–239.
Kotlík, P., Berrebi, P., 2001. Phylogeography of the barbel (Barbus barbus) assessed bymitochondrial DNA variation. Mol. Ecol. 10, 2177–2185.
Kotlík, P., Berrebi, P., 2007. Nested clade phylogeographical analysis of barbel (Barbusbarbus) mitochondrial DNA variation. In: Weiss, S., Ferrand, N. (Eds.),Phylogeography of Southern European Refugia. Springer, Dordrecht, Netherlands,pp. 315–325.
Kotlík, P., Marková, S., Choleva, L., Bogutskaya, N.G., Ekmekçi, F.G., Ivanova, P.P., 2008.Divergence with gene flow between Ponto-Caspian refugia in an anadromous cy-prinid Rutilus frisii revealed by multiple gene phylogeography. Mol. Ecol. 17,1076–1088.
Kottelat, M., Freyhof, J., 2007. Handbook of European Freshwater Fishes. Kottelat,Cornol, Switzerland.
Kozhara, A.V., Zhulidov, A.V., Gollasch, S., Przybylski, M., Poznyak, V.G., Zhulidov, D.A.,Gurtovaya, T.Y.U., 2007. Range extension and conservation status of the bitterling,Rhodeus sericeus amarus in Russia and adjacent countries. Folia Zool. 56, 97–108.
Kramp, K., Huck, S., Niketić, M., Tomović, G., Schmitt, T., 2009. Multiple glacial refugiaand complex postglacial range shifts of the obligatory woodland plant Polygonatumverticillatum (Convallariaceae). Plant Biol. 11, 392–404.
Librado, P., Rozas, J., 2009. DnaSP v5: a software for comprehensive analysis of DNApolymorphism data. Bioinformatics 25, 1451–1452.
Miller, M.A., Pfeiffer, W., Schwartz, T., 2010. Creating the CIPRES Science Gateway forinference of large phylogenetic trees. In: Proceedings of the Gateway ComputingEnvironments Workshop (GCE), 14 Nov. 2010, New Orleans, LA, pp. 1–8.
Milne, I., Lindner, D., Bayer, M., Husmeier, D., McGuire, G., Marshall, D.F., Wright, F.,2009. TOPALi v2: a rich graphical interface for evolutionary analyses of multiplealignments on HPC clusters and multi-core desktops. Bioinformatics 25, 126–127.
Nesbø, C.L., Fossheim, T., Wøllestad, A., Jakobsen, K.S., 1999. Genetic divergence andphylogeographic relationships among European perch (Perca fluviatilis) populations
V. Bartáková et al. Molecular Phylogenetics and Evolution 133 (2019) 1–11
10
reflect glacial refugia and postglacial colonization. Mol. Ecol. 8, 1387–1404.Perissoratis, C., Conispoliatis, N., 2003. The impacts of sea-level changes during latest
Pleistocene and Holocene times on the morphology of the Ionian and Aegean seas (SEAlpine Europe). Mar. Geol. 196, 145–156.
Pešić, V., Glöer, P., 2013. A new freshwater snail genus (Hydrobiidae, Gastropoda) fromMontenegro, with a discussion on gastropod diversity and endemism in Skadar Lake.ZooKeys 281, 69–90.
Posada, D., 2008. jModeltest: Phylogenetic Model Averaging. Mol. Biol. Evol. 25,1253–1256.
Rambaut, A., Drummond, A.J., Xie, D., Baele, G., Suchard, M.A., 2018. Tracer v1.7,Available from http://tree.bio.ed.ac.uk/software/tracer/.
Reichard, M., Smith, C., Bryja, J., 2008. Seasonal change in the opportunity for sexualselection. Mol. Ecol. 17, 642–651.
Reid, D., Orlova, M., 2002. Geological and evolutionary underpinnings for the success ofPonto-Caspian species invasions in the Baltic Sea and North American Great Lakes.Can. J. Fish. Aquat. Sci. 59, 1144–1158.
Rogers, A., 1995. Genetic evidence for a Pleistocene population explosion. Evolution 49,608–615.
Ronquist, F., Huelsenbeck, J.P., 2003. MRBAYES 3: Bayesian phylogenetic inferenceunder mixed models. Bioinformatics 19, 1572–1574.
Rosenberg, N.A., 2004. Distruct: a program for the graphical display of populationstructure. Mol. Ecol. Notes 4, 137–138.
Schneider, S., Excoffier, L., 1999. Estimation of past demographic parameters from thedistribution of pairwise differences when the mutation rates vary among sites: ap-plication to human mitochondrial DNA. Genetics 152, 1079–1089.
Smith, C., Reichard, M., Jurajda, P., Przybylski, M., 2004. The reproductive ecology of theEuropean bitterling (Rhodeus sericeus). J. Zool. (Lond.) 262, 107–124.
Stamatakis, A., 2014. RAxML version 8: a tool for phylogenetic analysis and Ronquistpost-
analysis of large phylogenies. Bioinformatics 30, 1312–1313.Stewart, J.R., Lister, A.M., 2001. Cryptic northern refugia and the origins of the modern
biota. Trends Ecol. Evol. 16, 608–613.Stewart, J.R., Lister, A.M., Barnes, I., Dalén, L., 2010. Refugia revisited: individualistic
responses of species in space and time. Philos. Trans. R. Soc. Lond., B, Biol. Sci. 277,661–671.
Stierandová, S., Vukić, J., Vasil'eva, E.D., Zogaris, S., Shumka, S., Halačka, K., Vetešník,L., Švátora, M., Nowak, M., Stefanov, T., Koščo, J., Mendel, J., 2016. A multilocusassessment of nuclear and mitochondrial sequence data elucidates phylogenetic re-lationships among European spirlins (Alburnoides, Cyprinidae). Mol. Phylogenet.Evol. 94, 479–491.
Storey, J.D., 2002. A direct approach to false discovery rates. J. R. Stat. Soc. Series B 64,479–498.
Taberlet, P., Fumagalli, L., Wust-Saucy, A.G., Cosson, J.F., 1998. Comparative phylo-geography and postglacial colonization routes in Europe. Mol. Ecol. 7, 453–464.
Tamura, K., Stecher, G., Peterson, D., Filipski, A., Kumar, S., 2013. MEGA6: molecularevolutionary genetics analysis version 6.0. Mol. Biol. Evol. 30, 2725–2729.
Van Damme, D., Bogutskaya, N., Hoffmann, R.C., Smith, C., 2007. The introduction of theEuropean bitterling (Rhodeus amarus) to west and central Europe. Fish Fish. 8,79–106.
Weir, B.S., Cockerham, C.C., 1984. Estimating F-statistics for the analysis of populationstructure. Evolution 38, 1358–1370.
Zaki, S.A.H., Jordan, W.C., Reichard, M., Przybylski, M., Smith, C.A., 2008. A morpho-logical and genetic analysis of the European bitterling species complex. Biol. J.Linnean Soc. 95, 337–347.
Zardoya, R., Doadrio, I., 1999. Molecular evidence on the evolutionary and biogeo-graphical patterns of European cyprinids. J. Mol. Evol. 49, 227–237.
V. Bartáková et al. Molecular Phylogenetics and Evolution 133 (2019) 1–11
11


![[MP] 02 - Phylogenetics - biologia.campusnet.unito.it · Molecular Phylogenetics Basis of Molecular Phylogenies Overview ¾Phylogenetics Definitions ¾Genetic Variation and Evolution](https://img.pdfslide.net/doc/110x75/5c6216d809d3f238158b4601/mp-02-phylogenetics-molecular-phylogenetics-basis-of-molecular-phylogenies.jpg)