Embed Size (px)
Citation preview
Molecule Specific Imaging of Freeze-Fractured, Frozen-HydratedModel Membrane Systems Using Mass Spectrometry
Donald M. Cannon, Jr., Michaeleen L. Pacholski, Nicholas Winograd,* andAndrew G. Ewing*
Contribution from the Department of Chemistry, The PennsylVania State UniVersity,152 DaVey Laboratory, UniVersity Park, PennsylVania 16802
ReceiVed June 18, 1999
Abstract: Imaging time-of-flight secondary ion mass spectrometry is used to chemically resolve the spatialdistribution of lipids in submicrometer sections of phospholipid membranes. The results show that it is possibleto unravel dynamical events such as chemical fluctuations associated with domain structure in cellularmembranes. In this work, a liposome model system has been used to capture the stages of membrane fusionbetween two merging bilayer systems. Fracturing criteria for preserving chemical distributions are shown tobe much more stringent than morphological electron cryomicroscopy studies. Images of membrane heterogeneity,induced via mixing various liposomes followed by fast freezing, demonstrate the necessary sample preparationgroundwork to investigate complex, heterogeneous membrane domains. Clear delineation of membrane structureprovides direct evidence that specific domains or “rafts” can exist. Moreover, low concentrations of eachphospholipid are distributed throughout newly fused liposomes despite the existence of distinct domains. Inthe liposome model, membrane structure ranges from specific domains to a fluid mosaic of the phospholipidsduring the fusion event. The availability of mass spectrometric imaging is proposed to facilitate the discoveryof functional rafts or substructure in cell membranes before, during, and after events including cell division,exocytosis, endocytosis, intracellular transport, infection of membrane-bound viruses, and receptor clustering.This technology holds the promise to define the biology of cell membranes at the molecular level.
Introduction
Biological membranes are essential in defining cellularboundaries and sustaining cellular functions such as maintainingand conserving biological energy and providing the means forintercellular communication.1,2 However, a lack of total under-standing concerning many aspects of the vast complexity ofmembranes still remains, especially at the molecular level.Although membranes maintain cellular definition, the consis-tency of the layers has been proposed as a fluid state wheremembrane components can freely diffuse.2 The simplicity ofthe “fluid mosaic model” has undergone an extensive evolution.3-9
It is reasonable to assume that the high level of diversity amonglipids (i.e., backbones, headgroups, fatty acid size, or degree ofunsaturation) is to allow membrane form to meet cellularfunction. Indeed, it has been shown that there is chemicalheterogeneity, not only across the bilayer3,4 but within a specificlayer as well.5-9
Membranes are now recognized to contain numerous domainswith restricted diffusion of their components in order to
influence cellular shape or to carry out a cellular function.Chemical domains such as these have been termed “rafts” inthe lipid membrane as they are thought to carry structures tospecific sites on the cell and, thus, are of fundamentalimportance to cell biology.9 Many cellular functions, such asfusion and fission, rely on membrane dynamics. Biologicalexamples of these membrane dynamics include exocytosis forfusion and endocytosis or mitosis for fission. Exocytosis andendocytosis are membrane processes involved in the interactionof the cell with its surroundings. It is now accepted that theuniqueness and diversity of cellular functions arise frommembrane fluidity as well as localized domains of confinedfluidity that further create heterogeneity within cellular mem-branes. However, it is still unclear whether chemical heteroge-neity between the two merging or diverging membranes drivesthese membrane processes.10
Because of the noncovalent structure of membranes, mosttools used in membrane investigations involve indirect analysismethods that either do not target individual cells or only givea topographical view with little or no chemical information.Earlier chemical composition studies have shown a higherpercentage of lipids with unsaturated fatty acid tail groupsassociated with axons versus the cell body, possibly forproviding a more disordered axonal membrane structure neces-sary for a large number of quick fusion processes.11 Studies of
(1) Biochemistry of Lipids, Lipoproteins and Membranes, New Compre-hensiVe Biochemistry;Vance, D. E., Vance, J. E., Eds.; Elsevier SciencePublishing Co., Inc: New York, 1991; Vol. 20.
(2) Singer, S. J.; Nicolson, G. L.Science1972, 175, 720-730.(3) Rothman, J. E.; Lenard, J.Science1977, 195, 743-753.(4) Fujimoto, K.; Umeda, M.; Fujimoo, T.J. Cell Sci. 1996, 109, 2453-
2460.(5) Glaser, M.Curr. Opin. Struct. Biol.1993, 3, 475-481.(6) Kobayashi, T.; Storrie, B.; Simons, K.; Dotti C. G.Nature 1992,
359, 647-650.(7) Nelson, W. J.Science1992, 258, 948-955.(8) Thompson, T. E.; Sankaram, M. B.; Biltonen, R. L.Comments Mol.
Cell Biophys. 1992, 8, 1-15.(9) Simons, K.; Ikonen, E.Nature1997, 387, 569-572.
(10) Knoll, G.; Plattner, H. InElectron Microscopy of SubcellularDynamics; Plattner, H., Ed.; CRC Press: Boca Raton, FL, 1989; Chapter6.
(11) Cullis, P. R.; Hope, M. J. InBiochemistry of Lipids, Lipoproteinsand Membranes, New ComprehensiVe Biochemistry; Vance, D. E., Vance,J. E., Eds.; Elsevier Science Publishing Co., Inc: New York, 1991; Vol.20, pp 1-41.
603J. Am. Chem. Soc.2000,122,603-610
10.1021/ja992078p CCC: $19.00 © 2000 American Chemical SocietyPublished on Web 01/15/2000

membrane dynamics with electron microscopy have used freeze-drying and cryoprotectant preparations that have shown aclearing of intramembrane proteins (IMPs) associated withexocytosis.10,12However, more recent fast-freezing preparationstudies have shown results more consistent with the physiologyof exocytosis and found no clearing of IMPs.12 Current methodsaimed at spatially localizing and imaging the chemical structureof cellular membranes at the single-cell level include patchclamp,13 fluorescence recovery after photobleaching,14 near-fieldoptical microscopy,15 and a combination of neutron diffractionand atomic force microscopy.16 Despite limitations of thesevarious techniques, these investigations have provided a vastamount of valuable knowledge about membrane domains andstrongly suggest involvement of lipid chemical heterogeneityin membrane dynamics. Our laboratories are interested indeveloping probes of native domain structure in cell membranes.Probes employed in fluorescence techniques have been knownto change domain structure induced in Langmuir-Blodgett (LB)model membranes.17,18 Thus, a method that does not requirephospholipid labeling appears to be necessary for the study ofdomain structure in membranes.
There have been substantial efforts by the secondary ion massspectrometry (SIMS) community concerning the chemicalimaging of biological systems.19,20 Briefly, SIMS involvesbombardment of a sample surface with a primary ion beamresulting in ejection (sputtering) of electrons and neutral orionized atoms and/or molecules from the surface.21 The second-ary ions are focused into a mass analyzer for a mass-to-chargespectrum of the surface species. Dynamic SIMS utilizes a high-flux primary ion beam (>1 × 10¹³ primary ions/cm2) to probemany layers into the solid, thus creating significant damage andlimiting the amount of molecular information. Dynamic SIMShas been used to probe the spatial distribution of atomic andsmall molecular fragment ions at or near biological surfaces.22-26
With technological advancements increasing the sensitivity ofmass analyzers, namely, the development of the time-of-flight(TOF) analyzer,27 an extremely surface sensitive analysis isobtained in the static SIMS regime.18,28-31 Static SIMS (<1013
primary ions/cm2, defined as sampling equal to or less than 1%of the first monolayer) probes the molecules at the top layer ofa relatively undisturbed surface. This maximizes the quality andquantity of molecular information obtained by significantlyreducing fragmentation of sputtered ions, while permittingspatial analysis of smaller membrane areas than have beenmeasured with other techniques.
Imaging static TOF-SIMS utilizes a 20-100-ns pulse of afocused ion beam probe with a size of approximately 200 nmto desorb surface molecules into the TOF analyzer.21,30-33 Byrastering the probe over the specimen and collecting massspectra at each position, molecule-specific images of particularmasses can be reconstructed. Static TOF-SIMS analyses ofmembrane systems have been successfully employed in ourlaboratories for preliminary experiments on LB films and singlecells.30,33 Early single-cell studies have demonstrated thecapability of this technique for molecular imaging of lipophilicdopants such as dimethyl sulfoxide and cocaine.30 However,no native membrane chemicals had yet been identified and onlylow-mass hydrocarbon fragments had been successfully imaged.It is likely that sample preparation issues had been responsiblefor this lack of chemical information. To test this hypothesis,we have employed multilamellar liposomes to systematicallyvary the techniques required for analysis of frozen-hydrated,freeze-fractured biological membranes31 and they are describedin more detail here. These systematic studies have led toprotocols that allow various membrane components to bedirectly detected. More recently, TOF-SIMS analyses of LBfilms and red blood cells have shown the ability of this techniqueto provide an orientation signature for lipid molecules that areexposed on the surface.33
Static imaging TOF-SIMS is a surface-sensitive probeperformed in an ultrahigh vacuum (UHV) environment (∼10-10
Torr). Direct molecule-specific imaging of single cells withTOF-SIMS requires development of sample preparation proto-cols based on proven electron cryomicroscopy methods12
adapted to optimize measurements of the top molecular layerof the sample.23,30,31,33,34Samples investigated by freeze-dryinghave documented analysis artifacts such as chemical migrationand reduction of cell size due to dehydration.23,34-36 Times forfreeze-drying are longer than many cellular processes, thereforerestricting the study of dynamic cellular events.12 Conversely,fast-freezing methods have shown fewer artifacts and have beenthe method of choice for recent electron microscopy studies.12
Liquid propane freezing37 allows an entire small sample to becompletely frozen in the millisecond time scale to preservechemical spatial integrity and to reduce ice crystal damage38 tobelow the resolution capabilities of TOF-SIMS. These fast-freezing times are sufficient to stop dynamic membrane events,
(12)Rapid Freezing, Freeze-Fracture, and Deep Etching; Severs, N.,Shotton, D.; Eds.; Wiley-Liss: New York, 1995.
(13) Harder, T.; Scheiffele, P.; Verkade, P.; Simons, K.J. Cell. Biol.1998, 141, 929-942.
(14) Schutz, G. J.; Schindler, H.; Schmidt, T.Biophys. J.1997, 73, 1073-1080.
(15) Hwang, J.; Gherber, L. A.; Margolis, L.; Edidin, M.Biophys J.1998,74, 2184-2190.
(16) Gliss C.; Clausen-Schaumann, H.; Gunther, R.; Odenbach, S.; Randl,O.; Bayer, T. M.Biophys J.1998, 74, 2443-2450.
(17) Leonard-Latour, M.; Morelis, R. M.; Coulet, P. R.Langmuir1996,12, 4797-4802.
(18) Leufgen, K. M.; Rulle, H.; Galla, H.-J.; Sieber, M.; Benninghoven,A. In Secondary Ion Mass Spectrometry (SIMS X);Benninghoven, A.,Hagenhoff, B., Werner, H. W., Eds.; Wiley: New York, 1995; pp 957-960.
(19)Biol. Cell 1992, 74 (1) (entire volume).(20) Todd P. J.; McMahon J. M.; Short R. T.; McCandlish C. A.Anal.
Chem.1997, 69, 529A-535A.(21) Winograd, N.Anal. Chem.1993, 65, 622A-629A.(22) Mantus, D. S.; Morrison, G. H.Mikrochim. Acta [Wien]1991, II ,
515-522.(23) Ausserer, W. A.; Chandra, S.; & Morrison, G. H.J. Microsc. 1989,
154 (Part 1), 39-57.(24) Smith, D. R.; Chandra, S.; Coderre, J. A.; Morrison, G. H.Cancer
Res.1996, 56, 4302-4306.(25) Levi-Setti, R.; Chabala, J. M.; Gavrilov. K.; Espinosa, R.; LeBeau,
M. M. Cell. Mol. Biol. 1996, 42, 301-324.(26) Lazof, D. B.; Goldsmith, J. G.; Suggs, C.; Rufty, T. W.; Linton, R.
W. J. Microsc.1994, 176, 99-109.(27) Chait, B. T.; Standing, K. G.Int. J. Mass Spectrom. Ion Phys.1981,
40, 185-193.(28) Briggs D.; Brown A.; Vickerman J. C.Handbook of Static Secondary
Ion Mass Spectrometry; John Wiley & Sons: New York, 1989.
(29) John, C. M.; Odom, R. W.Int. J. Mass Spectrom. Ion Processes1997, 161, 47-67.
(30) Colliver T. L.; Brummel C. L.; Pacholski M. L.; Swanek F. D.;Ewing A. G.; Winograd N.Anal. Chem.1997, 69, 2225-2231.
(31) Cannon, D. M., Jr.; Pacholski, M. L.; Ewing, A. G.; Winograd, N.In Secondary Ion Mass Spectrometry (SIMS XI); Gillen, G., Lareau, R.,Bennett, J., Stevie, F., Eds.: Wiley: New York, 1997; pp 489-492.
(32) Levi-Setti, R.; Hallegot, P.; Girod, C.; Chabala, J. M.; Li, J.; Sodonis,A.; Wolbach, W.Surf. Sci.1991, 246, 94-106.
(33) Pacholski, M. L.; Cannon, D. M., Jr.; Ewing A. G.; Winograd, N.J. Am. Chem. Soc.1999, 121, 4716-4717.
(34) Chandra, S.; Bernius, M. T.; Morrison, G. H.Anal. Chem.1986,58, 493-496.
(35) Edelmann, L.Scanning Microsc. 1994, (Suppl. 8), 67-81.(36) Kachar, B.; Serrano, J. A.; Pinto da Silva P.Cell Biol. Int. Rep.
1980, 4, 347-356.(37) Ryan, K. P.; Bald, W. B.; Neumann, K.; Simonsberger, P.; Purse,
D. H.; Nicholson, D. N.J. Microsc. 1990, 158 (3), 365-378.(38) Stephenson, J. L.J. Biophys. Biochem. Cytol. 1956, 2, 45-52.
604 J. Am. Chem. Soc., Vol. 122, No. 4, 2000 Cannon et al.

preserving a snapshot in time for analysis of the molecularspatial distribution.
In this paper, imaging static TOF-SIMS is utilized to directlymeasure the chemical and spatial distribution of lipid moleculeson the surface of single multilamellar, micrometer-size lipo-somes. Imaging is achieved by probing the inner portion of asample, frozen as a sandwich, that has been fractured in vacuoto preserve a clean fracture surface. The major goal of thefracturing event in TOF-SIMS imaging studies is simply toprovide a clean surface for analysis. This is in contrast toelectron microscopy studies that tailor the fracturing to occurin the median of a bilayer in order to examine internalcomponents. Fracturing is done at a precise temperature that ispressure dependent to equilibrate the condensation and sublima-tion fluxes of water. Freeze fracture at a precise temperaturepreserves the chemical integrity by eliminating both excess waterleaving the surface and the need for further surface treatmentsto remove water such as temperature12 or ion etching.34 We showthat molecule-specific TOF-SIMS imaging requires more strin-gent temperature control versus morphological imaging usingelectron cryomicroscopy. A 15°C temperature window issufficient to demonstrate fracturing extremes ranging from totalwater coverage to etching that disturbs the molecular spatialintegrity. Data from liposome model systems show that fusionof simple membranes involves several stages. These includeinitial contact, formation of specific domains with initialdistribution of a small portion of the phospholipids, and theneventually a final redistribution and equilibration of the lipidsto a homogeneous, fluid mosaic structure.
Experimental Section
TOF-SIMS Instrumentation. All analyses were performed on aKratos (Manchester, U.K.) Prism TOF-SIMS spectrometer equippedwith a gallium liquid metal ion gun (LMIG; FEI Co., Beaverton, OR)with a pulsed 25-kV, 500-pA beam focused 45° incident onto the sampleto a 200-nm spot (described in detail elsewhere39). A liquid nitrogen(LN2)-cooled stage (Kore Tech. Ltd., Cambridge, U.K.) was biased at(2.5 kV with an extraction lens, biased at-4.7 kV. The horizontaltime-of-flight path length was 4.5 m in length and equipped with areflectron and a microchannel plate detector (Gallileo Co., Sturbridge,MA). Mass resolution of this instrument was typically 4000 at 200m/z with a 50% transmission efficiency. Charge compensation wasaccomplished by pulsing an electron flood gun beam of 30-eV electronsfor 50 µs after each LMIG pulse. Imaging was accomplished byrastering the primary ion beam over the surface while collecting thecorresponding TOF spectra for each point to generate a pixel image ofselected ions. The area of TOF-SIMS analysis was correlated to a 400×microscope optical image, thus allowing the sample surface to beoptically surveyed before analysis. The instrument was also equippedwith a channeltron detector capable of recording scanning ion micro-graphs analogous to scanning electron micrographs. Ion micrographsincluded both sputtered particles and electrons and were taken afteranalysis since extensive beam damage is induced by a high-flux dc(nonpulsed) ion beam.
Liposome Sample Preparation. Phospholipid and cholesterolsamples were obtained from Sigma (St. Louis, MO) and Fluka(Ronkonkoma, NY) and used without further purification. Standardspectra were obtained by dissolving the compound in a volatile organicsolvent, placing a small aliquot (5µL) on a standard substrate (Si orAu), and allowing evaporation to dryness before insertion into vacuum.Multilamellar, micrometer-sized liposomes were formed by a rotaryevaporation technique.40 Briefly, a few milligrams of phospholipid/
cholesterol ( a∼1:1 molar ratio) were dissolved in an organic solvent,typically chloroform, and placed into a round-bottom evaporator flask.The flask was then rotated while a vacuum was drawn, creating aneven coating of the flask. Water (∼20 mL) was then added and swirledto resuspend the phospholipid/cholesterol coating into water-solublestructures such as multilamellar liposomes. Different phospholipids andcholesterol were used for liposomes of mixed compositions. Liposomeformation was verified by optical microscopy. A small drop (3-10µL) of liposome suspension is placed on a 5× 5 mm silicon wafer(Ted Pella Inc., Redding, CA). A smaller shard of Si was placed acrossthe diagonal, on top of the liposome suspension to form the samplesandwich (Figure 1). This sandwich was then immersed into liquidpropane for several seconds and then stored in LN2.
Liposome Mixing. Time-resolved analysis was accomplished by fastfreezing in liquid propane at given time intervals after the mixing step.Mixing simply involved taking two vials of separate liposome suspen-sions and mixing them into a third vial. Approximately 5µL of theresulting suspension was then quickly placed between two silicon piecesto be frozen as fast as 30 s after mixing.
Freeze-Fracture Instrumentation.The complete cold chain freeze-fracture method has been described in detail elsewhere30 and is brieflydescribed here. Samples were removed from the LN2 storage vesseland mounted onto a copper sample block with screws while under LN2.The load lock chamber was then vented to atmosphere pressure withdry nitrogen gas, allowing the vertical sample arm to be immersed intoa LN2 dewar below. The sample block was then placed onto the verticalsample arm under LN2. This sample arm was quickly raised into thechamber where vacuum base pressures of 10-7 Torr were achieved withtwo turbomolecular pumps (230 and 170 L/s, Pfeiffer VacuumTechnology, Inc., Nashua, NH), backed by a rough pump (EdwardsVacuum Technology, Inc., West Sussex, U.K.). A thermocouple wiremounted on the vertical sample arm directly behind the sample and anion pressure gauge were used to monitor the sample temperature andpressure, respectively. Once at a given temperature and pressure, a LN2-cooled knife was manipulated to quickly pry off the top shard of thesample sandwich. The LN2-cooled horizontal transfer arm was placedin the immediate vicinity to scavenge water from the fracturing process.Once the sample was fractured, the knife was withdrawn and the samplewas transferred to the horizontal transfer arm where it delivered thesample through a gate valve to the liquid nitrogen-cooled stage in theanalysis chamber.
Safety Considerations. Liquid propane was created for theseexperiments in an explosion proof hood by condensing propane gasfrom a cylinder while stirring with a magnetic stirrer into a plasticbeaker suspended in LN2.41 Propane gas is extremely flammable. Inaddition, liquid propane can condense molecular oxygen onto thesurface to form an extremely combustible mixture. Care was taken tostir the solution so as not to solidify the propane.
Results and Discussion
Molecule-Specific Mass Spectrometric Assignments.Phos-phatidylcholine (PC), phosphatidyl-N-monomethylethanolamine(PNME), and phosphatidyldimethylethanolamine (PDME) are
(39) Wood, M.; Zhou, Y.; Brummel, C. L.; Winograd, N.Anal. Chem.1994, 66, 2425-2432.
(40) Kates, M. InLaboratory Techniques in Biochemistry and MolecularBiology, 2nd ed.; Burdon, R. H., van Knippenberg, P. H., Eds.; ElsevierScience Publishing Co., Inc.: New York, 1996; Vol. 3. (41) Ryan, K. P.; Liddicoat, M. I.J. Microsc. 1987, 147 (3), 337-340.
Figure 1. Schematic of the sandwich sample preparation. A small drop(3-10 µL) of liposome suspension is placed on a 5× 5 mm siliconwafer. A smaller silicon shard is placed across the diagonal, on top ofthe suspension, to form the sample sandwich. This construct is thenrapidly frozen in liquid propane.
Freeze-Fractured, Frozen-Hydrated Model Membrane J. Am. Chem. Soc., Vol. 122, No. 4, 2000605
used as representative glycerophospholipids for imaging. Eachhas characteristic headgroups attached to a glycerol backbonethrough a phosphate linkage. Two fatty acid nonpolar tail groupsthat can have a variety of lengths as well as degrees of saturationare linked to the glycerol backbone via an ester linkage.Phosphorylated headgroups (i.e., PC headgroup 184m/z) andvarious tail groups (i.e., monoglyceride and diglyceride ions)have fragmentation patterns that have been reported with othermass spectrometry techniques.42,43 TOF-SIMS spectra of stan-dard lipid samples show characteristic ion fragments in the massspectrum as expected. This confirms that chemical differentiationcan be accomplished for relatively large molecules (600-900Da) differing by only one methyl group.
Cholesterol is a widely studied lipid membrane sterol that isfound in all eukaryoic cells. It is known to influence membranefluidity as well as to form domains of 2:1 phospholipid/cholesterol structures.44 TOF-SIMS spectra of cholesterolstandards show two intense characteristic peaks correspondingto a cholesterol molecular ion (M+, 386 m/z) and a fragmention that loses the hydroxyl group ([M- OH]+, 369 m/z).33
These largely intact fragments are sufficient for chemicaldifferentiation from the glycerophospholipids.
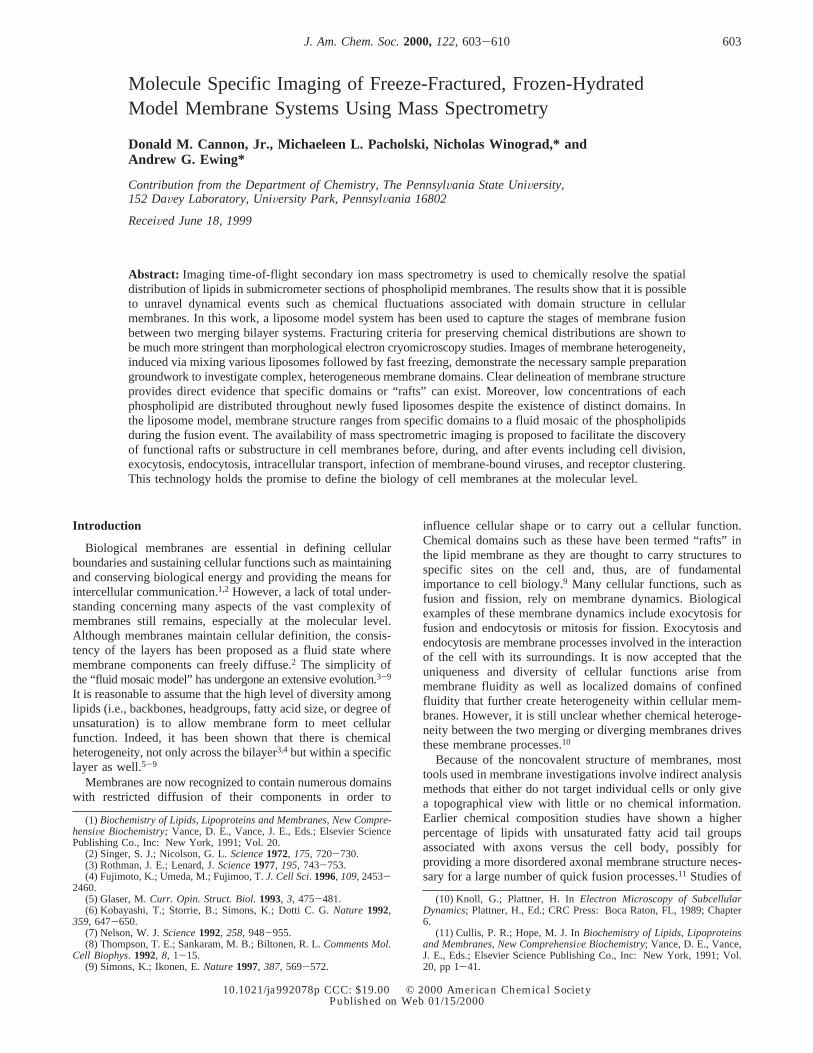
Freeze-Fracture Methodology.Sample temperature duringfracturing needs to be optimized to preserve the hydrated samplestate and to minimize interference from water deposition.12 Thecritical factor is the water sublimation temperature at a givenpressure. Average temperature and pressure profiles as a functionof time for the load lock system described above are shown inFigure 2. The sample enters the vacuum at LN2 temperatureand slowly increases over time due mainly to heat loss throughthe rod of the arm. As the temperature increases, the probabilityof significant sublimation also increases. Monitoring the pressureprofile provides a measurement related to the amount ofsublimation. The pressure profile shows the time required toachieve base pressures is on the order of tens of minutes andoccurs before the sample temperature is warm enough toexperience water sublimation. Later, the pressure shows anappreciable increase due to significant water sublimation as thesample temperature warms above-110 °C. To equilibrate thecondensation and sublimation fluxes, the optimal fracturingtemperature would be just before significant sublimation isobserved and is estimated from this graph to be in the range of-115 to-110 °C for these given pressures.
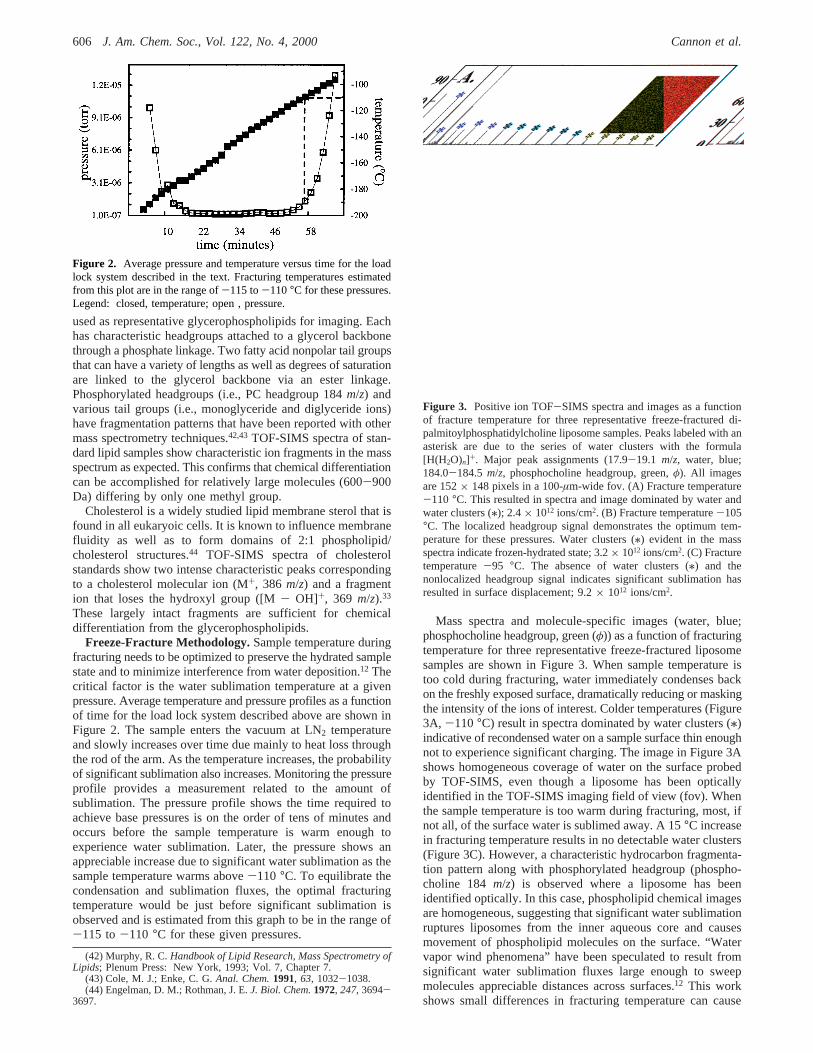
Mass spectra and molecule-specific images (water, blue;phosphocholine headgroup, green (φ)) as a function of fracturingtemperature for three representative freeze-fractured liposomesamples are shown in Figure 3. When sample temperature istoo cold during fracturing, water immediately condenses backon the freshly exposed surface, dramatically reducing or maskingthe intensity of the ions of interest. Colder temperatures (Figure3A, -110°C) result in spectra dominated by water clusters (/)indicative of recondensed water on a sample surface thin enoughnot to experience significant charging. The image in Figure 3Ashows homogeneous coverage of water on the surface probedby TOF-SIMS, even though a liposome has been opticallyidentified in the TOF-SIMS imaging field of view (fov). Whenthe sample temperature is too warm during fracturing, most, ifnot all, of the surface water is sublimed away. A 15°C increasein fracturing temperature results in no detectable water clusters(Figure 3C). However, a characteristic hydrocarbon fragmenta-tion pattern along with phosphorylated headgroup (phospho-choline 184 m/z) is observed where a liposome has beenidentified optically. In this case, phospholipid chemical imagesare homogeneous, suggesting that significant water sublimationruptures liposomes from the inner aqueous core and causesmovement of phospholipid molecules on the surface. “Watervapor wind phenomena” have been speculated to result fromsignificant water sublimation fluxes large enough to sweepmolecules appreciable distances across surfaces.12 This workshows small differences in fracturing temperature can cause
(42) Murphy, R. C.Handbook of Lipid Research, Mass Spectrometry ofLipids; Plenum Press: New York, 1993; Vol. 7, Chapter 7.
(43) Cole, M. J.; Enke, C. G.Anal. Chem.1991, 63, 1032-1038.(44) Engelman, D. M.; Rothman, J. E.J. Biol. Chem.1972, 247, 3694-
3697.
Figure 2. Average pressure and temperature versus time for the loadlock system described in the text. Fracturing temperatures estimatedfrom this plot are in the range of-115 to-110°C for these pressures.Legend: closed, temperature; open , pressure.
Figure 3. Positive ion TOF-SIMS spectra and images as a functionof fracture temperature for three representative freeze-fractured di-palmitoylphosphatidylcholine liposome samples. Peaks labeled with anasterisk are due to the series of water clusters with the formula[H(H2O)n]+. Major peak assignments (17.9-19.1 m/z, water, blue;184.0-184.5 m/z, phosphocholine headgroup, green,φ). All imagesare 152× 148 pixels in a 100-µm-wide fov. (A) Fracture temperature-110 °C. This resulted in spectra and image dominated by water andwater clusters (/); 2.4× 10¹² ions/cm2. (B) Fracture temperature-105°C. The localized headgroup signal demonstrates the optimum tem-perature for these pressures. Water clusters (/) evident in the massspectra indicate frozen-hydrated state; 3.2× 10¹² ions/cm2. (C) Fracturetemperature-95 °C. The absence of water clusters (/) and thenonlocalized headgroup signal indicates significant sublimation hasresulted in surface displacement; 9.2× 10¹² ions/cm2.
606 J. Am. Chem. Soc., Vol. 122, No. 4, 2000 Cannon et al.
uniform distributions from this water vapor wind phenomenonanalogous to artifacts observed in freeze-drying prepara-tions.23,34-36 As demonstrated in Figure 3B, the optimumtemperature for this pressure is approximately-105°C. Waterclusters are evident in the mass spectra along with characteristichydrocarbon fragments including the phosphorylated headgroup.Previous studies have suggested that this temperature is lowenough to prevent diffusion or migration of localized compoundsand high enough to prevent condensation of adventitious sourcesof water back onto the sample surface.30,31The molecule-specificimage of the headgroup fragment overlaid on water in Figure3B demonstrates the feasibility of imaging spatially localizedchemical structures in a frozen-hydrated membrane.
Studies utilizing electron microscopy still have not completelydetermined the effect of temperature on the fracturing processbut have recognized water fluxes to be a dominant force.12
Except during fracturing, residual water concentrations are keptminimal at ultrahigh vacuum pressures such that several hoursare required before appreciable TOF-SIMS interference fromwater condensation is observed at LN2 temperatures. Thisenables the sample temperature to be lowered back down toLN2 temperature after fracturing to minimize surface damageduring ion beam analysis and sublimation of surface compo-nents. The estimated fracturing temperature (Figure 2) is colderthan the optimal temperature demonstrated by TOF-SIMSspectra and images (Figure 3). To obtain localized molecule-specific TOF-SIMS images, fracturing is performed after a slightpressure rise in the fracturing chamber and is typically ac-companied by a subsecond transient pressure spike. Theseobservations suggest that the act of fracturing is violent in nature,thus creating high, localized partial pressures of water at thefracture surface. Small additional sublimation fluxes, past thatof equilibrated condensation and sublimation fluxes, are requiredto expeditiously move the localized water away from the fracturesurface to avoid condensation on the fracture surface. The goalof providing a clean, undisturbed fracture surface in vacuoinvolves equilibrating the condensation and sublimation fluxesat the sample surface justafter fracturing.
Fractured Surfaces.Scanning ion micrographs of the surfaceare a means to correlate surface morphology with chemicalmorphology. Ion micrographs depict surface morphology byutilizing the ion beam in a nonpulsed mode to create a highflux of sputtered ions and electrons that are subsequentlydetected by a channeltron detector. The high flux associatedwith this method destroys the chemical integrity of the surfacedue to high fragmentation and surface charging and thus mustbe done after TOF-SIMS analysis. Nevertheless, ion micro-graphs can track not only the surface morphology but also theconducting nature of the surface that the ion beam probes.Optically observing liposomes in ice does not indicate surfaceexposure. Therefore, ion micrographs are used to relate opticalimages to the corresponding TOF-SIMS images.
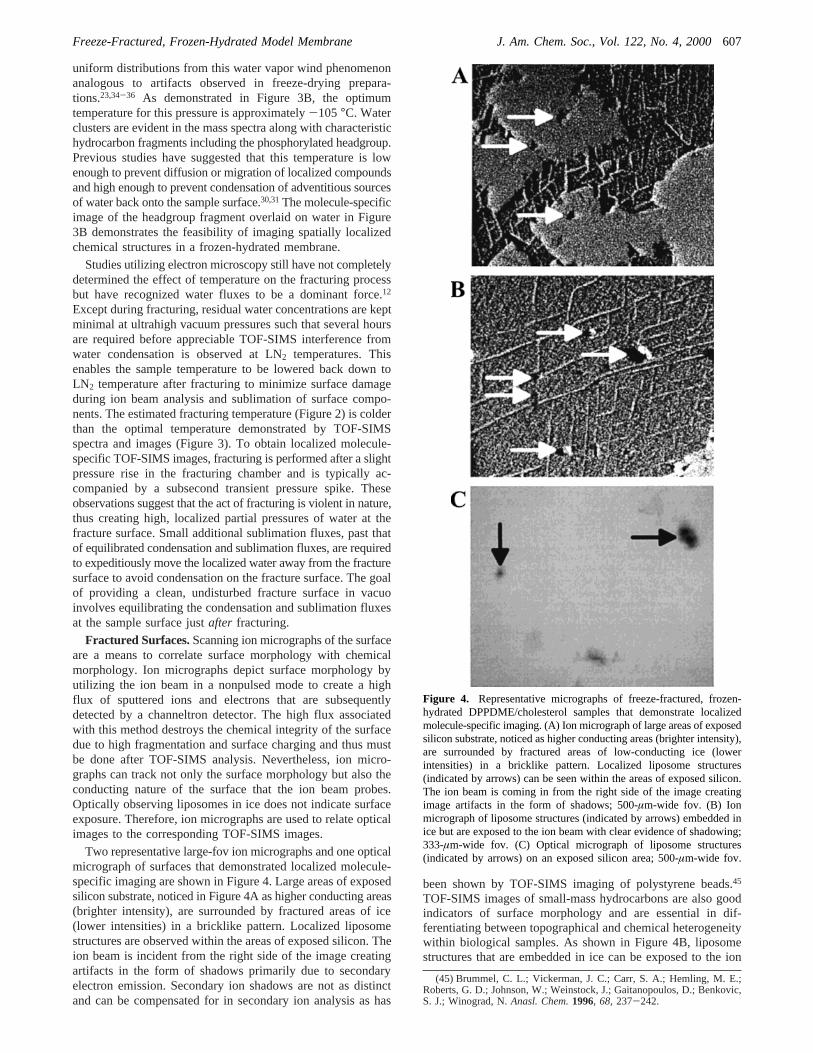
Two representative large-fov ion micrographs and one opticalmicrograph of surfaces that demonstrated localized molecule-specific imaging are shown in Figure 4. Large areas of exposedsilicon substrate, noticed in Figure 4A as higher conducting areas(brighter intensity), are surrounded by fractured areas of ice(lower intensities) in a bricklike pattern. Localized liposomestructures are observed within the areas of exposed silicon. Theion beam is incident from the right side of the image creatingartifacts in the form of shadows primarily due to secondaryelectron emission. Secondary ion shadows are not as distinctand can be compensated for in secondary ion analysis as has
been shown by TOF-SIMS imaging of polystyrene beads.45
TOF-SIMS images of small-mass hydrocarbons are also goodindicators of surface morphology and are essential in dif-ferentiating between topographical and chemical heterogeneitywithin biological samples. As shown in Figure 4B, liposomestructures that are embedded in ice can be exposed to the ion
(45) Brummel, C. L.; Vickerman, J. C.; Carr, S. A.; Hemling, M. E.;Roberts, G. D.; Johnson, W.; Weinstock, J.; Gaitanopoulos, D.; Benkovic,S. J.; Winograd, N.Anasl. Chem.1996, 68, 237-242.
Figure 4. Representative micrographs of freeze-fractured, frozen-hydrated DPPDME/cholesterol samples that demonstrate localizedmolecule-specific imaging. (A) Ion micrograph of large areas of exposedsilicon substrate, noticed as higher conducting areas (brighter intensity),are surrounded by fractured areas of low-conducting ice (lowerintensities) in a bricklike pattern. Localized liposome structures(indicated by arrows) can be seen within the areas of exposed silicon.The ion beam is coming in from the right side of the image creatingimage artifacts in the form of shadows; 500-µm-wide fov. (B) Ionmicrograph of liposome structures (indicated by arrows) embedded inice but are exposed to the ion beam with clear evidence of shadowing;333-µm-wide fov. (C) Optical micrograph of liposome structures(indicated by arrows) on an exposed silicon area; 500-µm-wide fov.
Freeze-Fractured, Frozen-Hydrated Model Membrane J. Am. Chem. Soc., Vol. 122, No. 4, 2000607
beam with clear evidence of shadowing. Liposomes on exposedsilicon and in ice both result in molecule-specific TOF-SIMSimage localization. However, due to charge dissipation factors,liposomes on the exposed silicon areas give higher TOF-SIMSintensities. It is important to note, the goal of fracturing in manyelectron microscopy studies is to split through the middle of amembrane bilayer. A representative optical micrograph ofliposome structures located in the exposed silicon parts anddemonstrates the ability to optically target structures of interestbefore TOF-SIMS analysis is shown in Figure 4C.
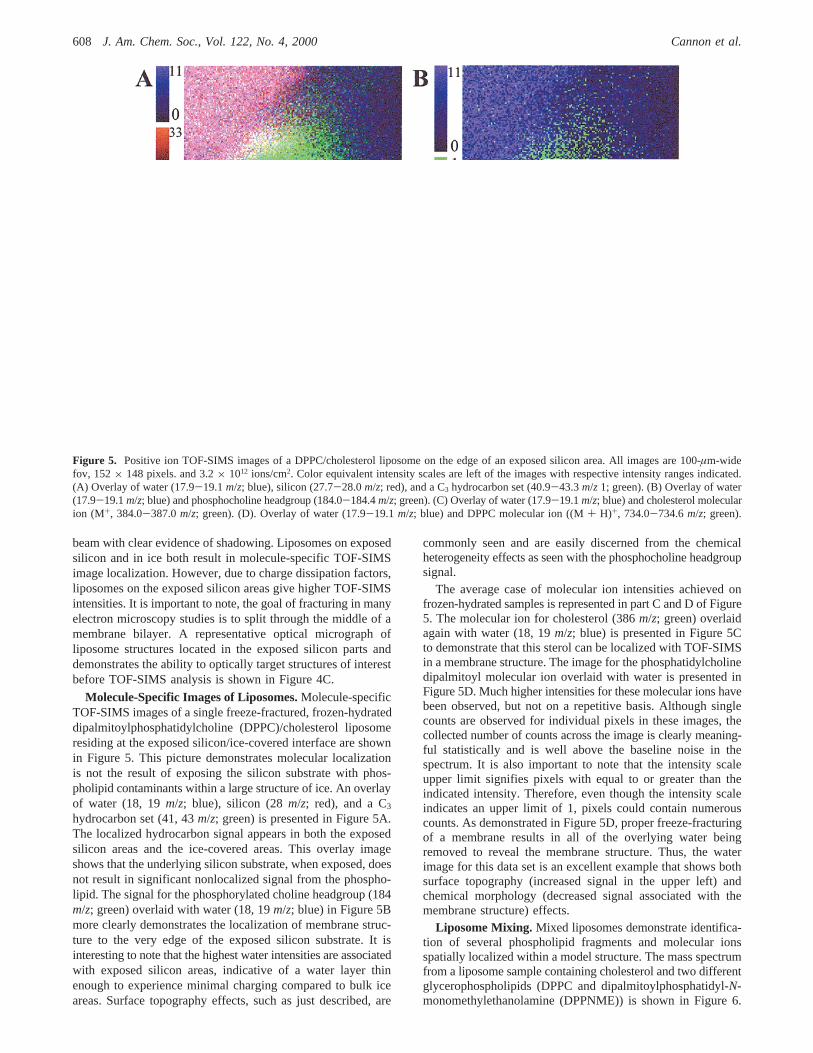
Molecule-Specific Images of Liposomes.Molecule-specificTOF-SIMS images of a single freeze-fractured, frozen-hydrateddipalmitoylphosphatidylcholine (DPPC)/cholesterol liposomeresiding at the exposed silicon/ice-covered interface are shownin Figure 5. This picture demonstrates molecular localizationis not the result of exposing the silicon substrate with phos-pholipid contaminants within a large structure of ice. An overlayof water (18, 19m/z; blue), silicon (28m/z; red), and a C3hydrocarbon set (41, 43m/z; green) is presented in Figure 5A.The localized hydrocarbon signal appears in both the exposedsilicon areas and the ice-covered areas. This overlay imageshows that the underlying silicon substrate, when exposed, doesnot result in significant nonlocalized signal from the phospho-lipid. The signal for the phosphorylated choline headgroup (184m/z; green) overlaid with water (18, 19m/z; blue) in Figure 5Bmore clearly demonstrates the localization of membrane struc-ture to the very edge of the exposed silicon substrate. It isinteresting to note that the highest water intensities are associatedwith exposed silicon areas, indicative of a water layer thinenough to experience minimal charging compared to bulk iceareas. Surface topography effects, such as just described, are
commonly seen and are easily discerned from the chemicalheterogeneity effects as seen with the phosphocholine headgroupsignal.
The average case of molecular ion intensities achieved onfrozen-hydrated samples is represented in part C and D of Figure5. The molecular ion for cholesterol (386m/z; green) overlaidagain with water (18, 19m/z; blue) is presented in Figure 5Cto demonstrate that this sterol can be localized with TOF-SIMSin a membrane structure. The image for the phosphatidylcholinedipalmitoyl molecular ion overlaid with water is presented inFigure 5D. Much higher intensities for these molecular ions havebeen observed, but not on a repetitive basis. Although singlecounts are observed for individual pixels in these images, thecollected number of counts across the image is clearly meaning-ful statistically and is well above the baseline noise in thespectrum. It is also important to note that the intensity scaleupper limit signifies pixels with equal to or greater than theindicated intensity. Therefore, even though the intensity scaleindicates an upper limit of 1, pixels could contain numerouscounts. As demonstrated in Figure 5D, proper freeze-fracturingof a membrane results in all of the overlying water beingremoved to reveal the membrane structure. Thus, the waterimage for this data set is an excellent example that shows bothsurface topography (increased signal in the upper left) andchemical morphology (decreased signal associated with themembrane structure) effects.
Liposome Mixing. Mixed liposomes demonstrate identifica-tion of several phospholipid fragments and molecular ionsspatially localized within a model structure. The mass spectrumfrom a liposome sample containing cholesterol and two differentglycerophospholipids (DPPC and dipalmitoylphosphatidyl-N-monomethylethanolamine (DPPNME)) is shown in Figure 6.
Figure 5. Positive ion TOF-SIMS images of a DPPC/cholesterol liposome on the edge of an exposed silicon area. All images are 100-µm-widefov, 152× 148 pixels. and 3.2× 10¹² ions/cm2. Color equivalent intensity scales are left of the images with respective intensity ranges indicated.(A) Overlay of water (17.9-19.1m/z; blue), silicon (27.7-28.0m/z; red), and a C3 hydrocarbon set (40.9-43.3m/z 1; green). (B) Overlay of water(17.9-19.1m/z; blue) and phosphocholine headgroup (184.0-184.4m/z; green). (C) Overlay of water (17.9-19.1m/z; blue) and cholesterol molecularion (M+, 384.0-387.0m/z; green). (D). Overlay of water (17.9-19.1m/z; blue) and DPPC molecular ion ((M+ H)+, 734.0-734.6m/z; green).
608 J. Am. Chem. Soc., Vol. 122, No. 4, 2000 Cannon et al.
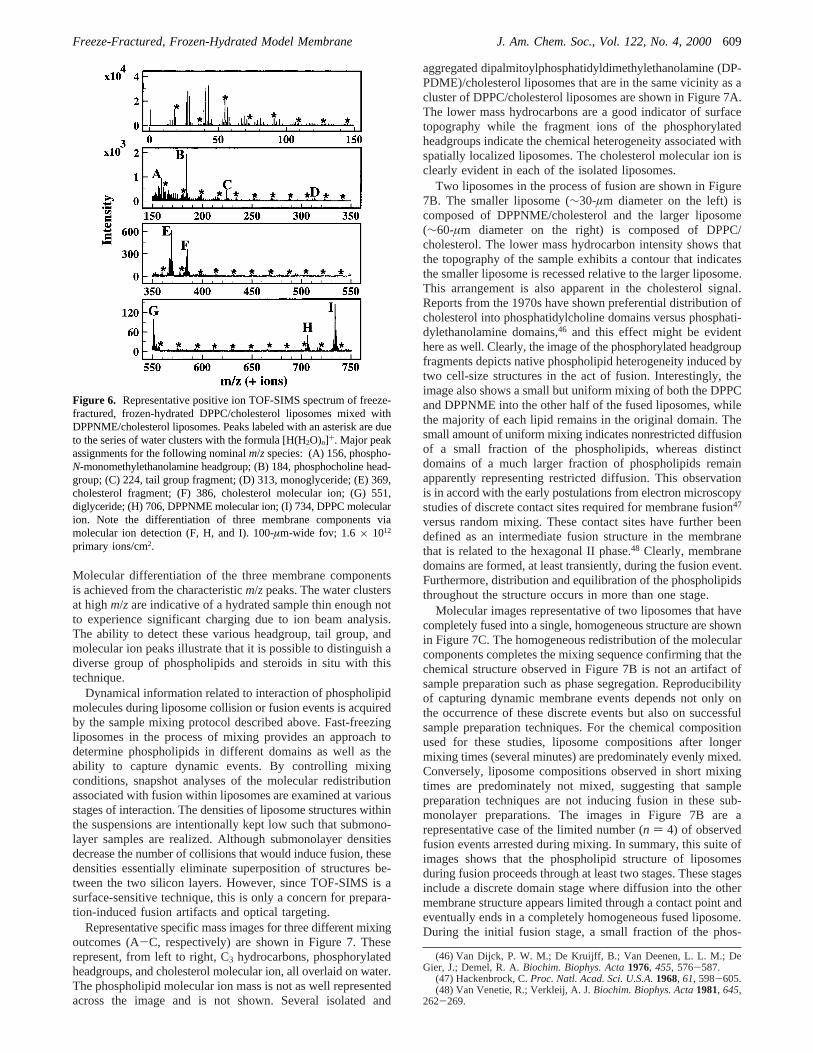
Molecular differentiation of the three membrane componentsis achieved from the characteristicm/zpeaks. The water clustersat highm/z are indicative of a hydrated sample thin enough notto experience significant charging due to ion beam analysis.The ability to detect these various headgroup, tail group, andmolecular ion peaks illustrate that it is possible to distinguish adiverse group of phospholipids and steroids in situ with thistechnique.
Dynamical information related to interaction of phospholipidmolecules during liposome collision or fusion events is acquiredby the sample mixing protocol described above. Fast-freezingliposomes in the process of mixing provides an approach todetermine phospholipids in different domains as well as theability to capture dynamic events. By controlling mixingconditions, snapshot analyses of the molecular redistributionassociated with fusion within liposomes are examined at variousstages of interaction. The densities of liposome structures withinthe suspensions are intentionally kept low such that submono-layer samples are realized. Although submonolayer densitiesdecrease the number of collisions that would induce fusion, thesedensities essentially eliminate superposition of structures be-tween the two silicon layers. However, since TOF-SIMS is asurface-sensitive technique, this is only a concern for prepara-tion-induced fusion artifacts and optical targeting.
Representative specific mass images for three different mixingoutcomes (A-C, respectively) are shown in Figure 7. Theserepresent, from left to right, C3 hydrocarbons, phosphorylatedheadgroups, and cholesterol molecular ion, all overlaid on water.The phospholipid molecular ion mass is not as well representedacross the image and is not shown. Several isolated and
aggregated dipalmitoylphosphatidyldimethylethanolamine (DP-PDME)/cholesterol liposomes that are in the same vicinity as acluster of DPPC/cholesterol liposomes are shown in Figure 7A.The lower mass hydrocarbons are a good indicator of surfacetopography while the fragment ions of the phosphorylatedheadgroups indicate the chemical heterogeneity associated withspatially localized liposomes. The cholesterol molecular ion isclearly evident in each of the isolated liposomes.
Two liposomes in the process of fusion are shown in Figure7B. The smaller liposome (∼30-µm diameter on the left) iscomposed of DPPNME/cholesterol and the larger liposome(∼60-µm diameter on the right) is composed of DPPC/cholesterol. The lower mass hydrocarbon intensity shows thatthe topography of the sample exhibits a contour that indicatesthe smaller liposome is recessed relative to the larger liposome.This arrangement is also apparent in the cholesterol signal.Reports from the 1970s have shown preferential distribution ofcholesterol into phosphatidylcholine domains versus phosphati-dylethanolamine domains,46 and this effect might be evidenthere as well. Clearly, the image of the phosphorylated headgroupfragments depicts native phospholipid heterogeneity induced bytwo cell-size structures in the act of fusion. Interestingly, theimage also shows a small but uniform mixing of both the DPPCand DPPNME into the other half of the fused liposomes, whilethe majority of each lipid remains in the original domain. Thesmall amount of uniform mixing indicates nonrestricted diffusionof a small fraction of the phospholipids, whereas distinctdomains of a much larger fraction of phospholipids remainapparently representing restricted diffusion. This observationis in accord with the early postulations from electron microscopystudies of discrete contact sites required for membrane fusion47
versus random mixing. These contact sites have further beendefined as an intermediate fusion structure in the membranethat is related to the hexagonal II phase.48 Clearly, membranedomains are formed, at least transiently, during the fusion event.Furthermore, distribution and equilibration of the phospholipidsthroughout the structure occurs in more than one stage.
Molecular images representative of two liposomes that havecompletely fused into a single, homogeneous structure are shownin Figure 7C. The homogeneous redistribution of the molecularcomponents completes the mixing sequence confirming that thechemical structure observed in Figure 7B is not an artifact ofsample preparation such as phase segregation. Reproducibilityof capturing dynamic membrane events depends not only onthe occurrence of these discrete events but also on successfulsample preparation techniques. For the chemical compositionused for these studies, liposome compositions after longermixing times (several minutes) are predominately evenly mixed.Conversely, liposome compositions observed in short mixingtimes are predominately not mixed, suggesting that samplepreparation techniques are not inducing fusion in these sub-monolayer preparations. The images in Figure 7B are arepresentative case of the limited number (n ) 4) of observedfusion events arrested during mixing. In summary, this suite ofimages shows that the phospholipid structure of liposomesduring fusion proceeds through at least two stages. These stagesinclude a discrete domain stage where diffusion into the othermembrane structure appears limited through a contact point andeventually ends in a completely homogeneous fused liposome.During the initial fusion stage, a small fraction of the phos-
(46) Van Dijck, P. W. M.; De Kruijff, B.; Van Deenen, L. L. M.; DeGier, J.; Demel, R. A.Biochim. Biophys. Acta1976, 455, 576-587.
(47) Hackenbrock, C.Proc. Natl. Acad. Sci. U.S.A.1968, 61, 598-605.(48) Van Venetie, R.; Verkleij, A. J.Biochim. Biophys. Acta1981, 645,
262-269.
Figure 6. Representative positive ion TOF-SIMS spectrum of freeze-fractured, frozen-hydrated DPPC/cholesterol liposomes mixed withDPPNME/cholesterol liposomes. Peaks labeled with an asterisk are dueto the series of water clusters with the formula [H(H2O)n]+. Major peakassignments for the following nominalm/zspecies: (A) 156, phospho-N-monomethylethanolamine headgroup; (B) 184, phosphocholine head-group; (C) 224, tail group fragment; (D) 313, monoglyceride; (E) 369,cholesterol fragment; (F) 386, cholesterol molecular ion; (G) 551,diglyceride; (H) 706, DPPNME molecular ion; (I) 734, DPPC molecularion. Note the differentiation of three membrane components viamolecular ion detection (F, H, and I). 100-µm-wide fov; 1.6× 10¹²
primary ions/cm2.
Freeze-Fractured, Frozen-Hydrated Model Membrane J. Am. Chem. Soc., Vol. 122, No. 4, 2000609

pholipids mix between surfaces. Despite this, the majority ofthe lipids remain in separate sections of the membrane. Thesesegregated domains appear to be similar to what is expectedfor membrane domains or “rafts” in cellular systems.
Conclusions
Development and optimization of freeze-fracture methodologyspecific to static TOF-SIMS molecular imaging of nativechemical species of cellular membranes is reported. Freeze-fractured, frozen-hydrated model membranes demonstrate thespecial consideration of fracturing criteria that is required formolecule-specific TOF-SIMS imaging. A 15°C temperaturewindow is large enough to include fracturing extremes rangingfrom total water coverage to etching that disturbs the molecularspatial integrity measured by TOF-SIMS analysis. The fast-freezing times used in this study provide a relatively artifactfree method of capturing membrane dynamics at discrete times
during an event. It is apparent from the data shown that fusionof simple membranes involves formation of specific domains,initial distribution of a small portion of the phospholipids, andfinal redistribution and equilibration of the lipids to a homo-geneous, fluid mosaic structure. The ability to image theheterogeneous molecular spatial distribution of membranescaptured during dynamic events represents a unique approachin our development of membrane bioanalytical chemistry.
Acknowledgment. The authors acknowledge the NationalInstitutes of Health, the National Science Foundation, and theClare Boothe Luce Foundation for their funding. Thanks alsogoes to Rosemary Walsh, Angela Cannon, and Ed Basgall atthe Pennsylvania State University for their help involving samplepreparation.
JA992078P
Figure 7. Positive ion TOF-SIMS images of freeze-fractured frozen-hydrated DPPC/cholesterol liposomes mixed with DPPDME/cholesterol orDPPNME/cholesterol liposomes. All images are overlaid with water (17.9-19.1 m/z; blue). Images, from left to right: C3 hydrocarbons (40.9-43.3m/z; yellow); phosphodimethylethanolamine headgroup (169.9-170.3m/z; red) for (A) and phospho-N-monomethylethanolamine headgroup(155.9-156.3m/z, red) for (B) and (C); phosphocholine headgroup (183.9-184.3m/z, yellow); and cholesterol (384.1-387.2m/z; yellow). Allimages are 152× 148 pixels. Color equivalent intensity scales are left of the images with respective intensity ranges indicated. (A) DPPC/cholesterolliposomes mixed with DPPDME/cholesterol liposomes and frozen within 30 s of mixing. Significant mixing does not yet occurred. 200-µm-widefov, 1.1× 10¹² primary ions/cm2. (B) DPPC/cholesterol liposomes mixed with DPPNME/cholesterol liposomes and frozen within 60 s of mixing.Membrane fusion before major redistribution results in the heterogeneous distribution of membrane components; 100-µm-wide fov, 1.8× 10¹³
primary ions/cm2. (C) DPPC/cholesterol liposomes mixed with DPPNME/cholesterol liposomes and frozen within 120 s of mixing. Membranefusion after major redistribution results in the homogeneous distribution of membrane components; 50-µm-wide fov, 6.5× 10¹² primary ions/cm2.
610 J. Am. Chem. Soc., Vol. 122, No. 4, 2000 Cannon et al.