Embed Size (px)
Citation preview
Momentum Investment
International Finance – Finance 663
Prepared by:
Derek Song
German Hurtado
Mustafa Jalil Qureshi
Rodrigo De La Maza
Fuqua School of Business, Duke University

Content1. Introduction
2. Why the Insurance Industry?
3. Methodology applied
4. Results and Analysis
5. Conclusions
Prepared by:Derek Song, German Hurtado, Mustafa Jalil Qureshi, Rodrigo De La Maza Momentum Investment - Finance 663
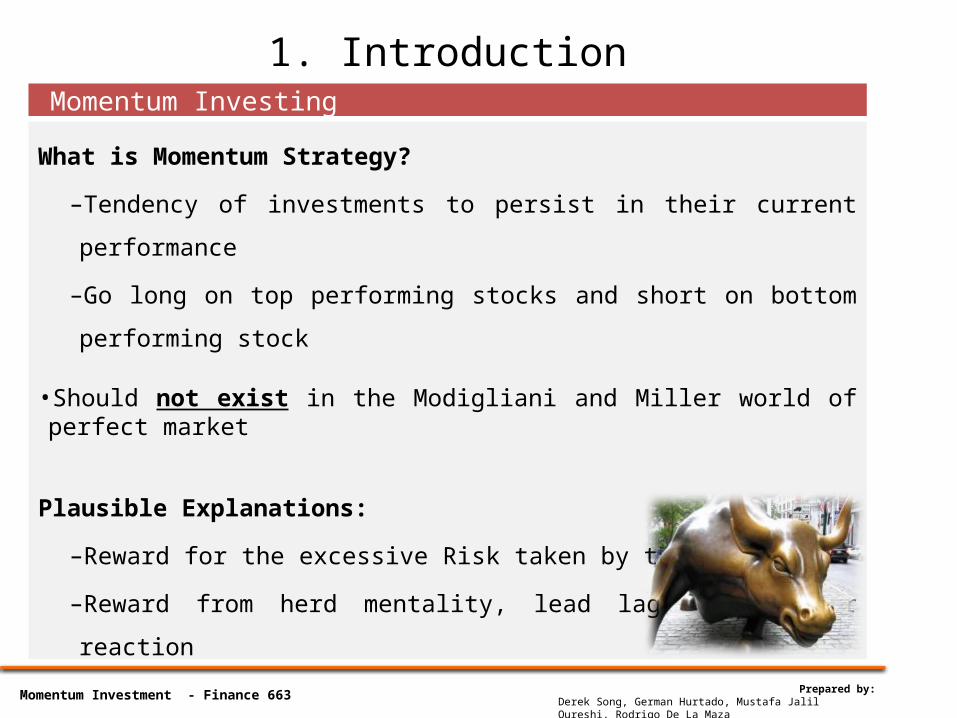
1. Introduction
What is Momentum Strategy?
–Tendency of investments to persist in their current performance
–Go long on top performing stocks and short on bottom performing stock
•Should not exist in the Modigliani and Miller world of perfect market
Plausible Explanations:
–Reward for the excessive Risk taken by the Investor
–Reward from herd mentality, lead lag, over under reaction
Momentum Investing
Prepared by:Derek Song, German Hurtado, Mustafa Jalil Qureshi, Rodrigo De La Maza Momentum Investment - Finance 663
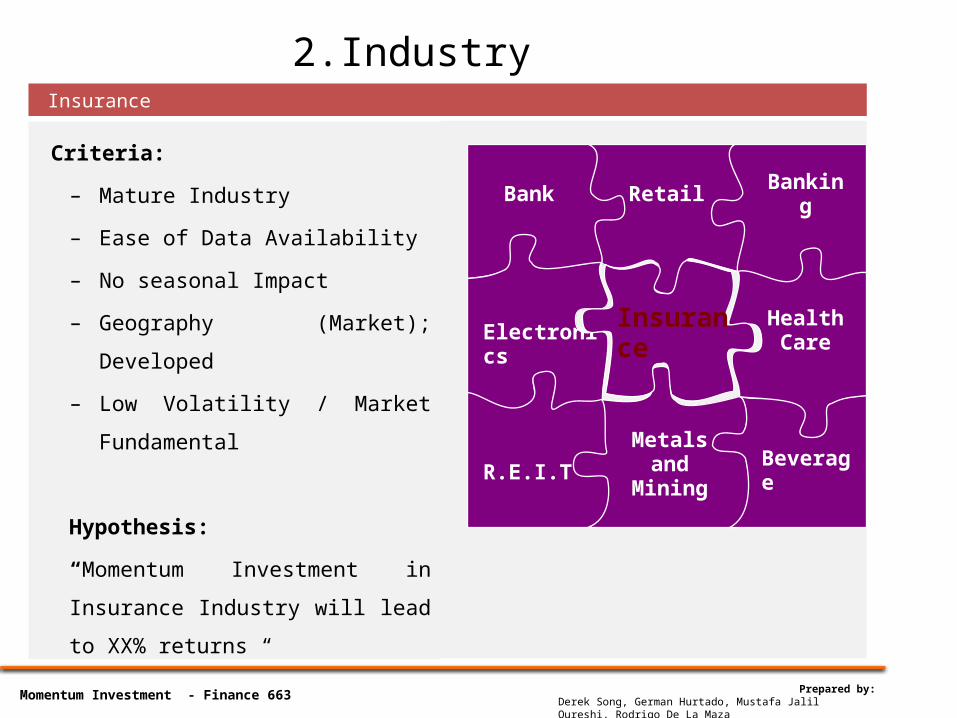
2.Industry
Criteria:
– Mature Industry
– Ease of Data Availability
– No seasonal Impact
– Geography (Market); Developed
– Low Volatility / Market Fundamental
Hypothesis:
“Momentum Investment in Insurance
Industry will lead to XX% returns “
Insurance
Prepared by:Derek Song, German Hurtado, Mustafa Jalil Qureshi, Rodrigo De La Maza Momentum Investment - Finance 663
Metals and
MiningBeverage
Health Care
BankingRetailBank
Electronics Insurance
R.E.I.T
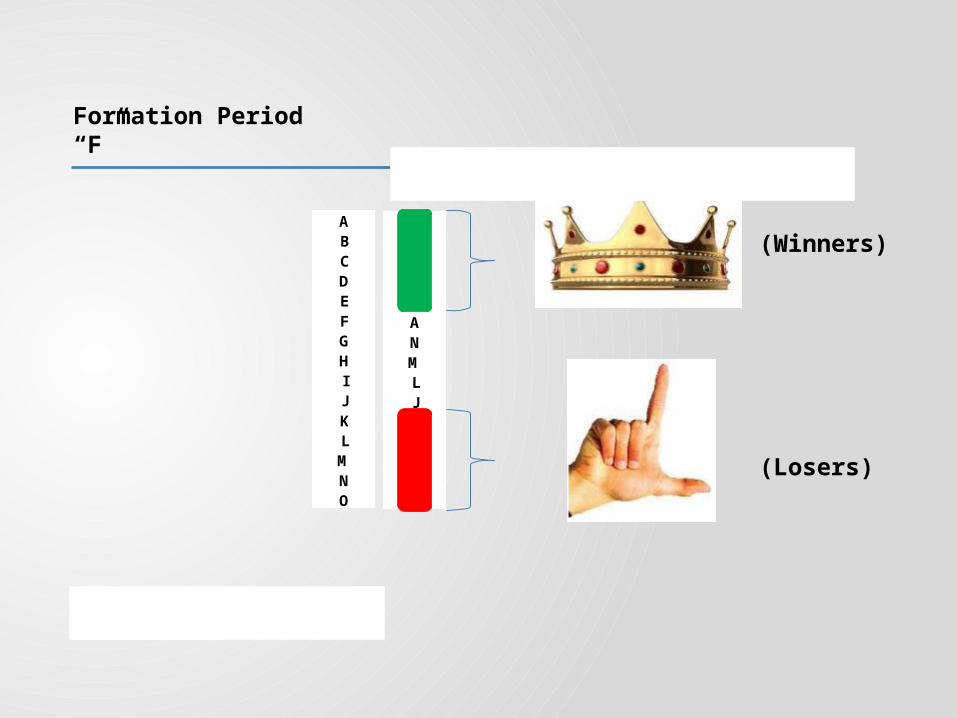
Formation Period “F”
ABCDEFGHIJKL
MNO
BEHKOANMLJIGFDC
(Winners)
(Losers)
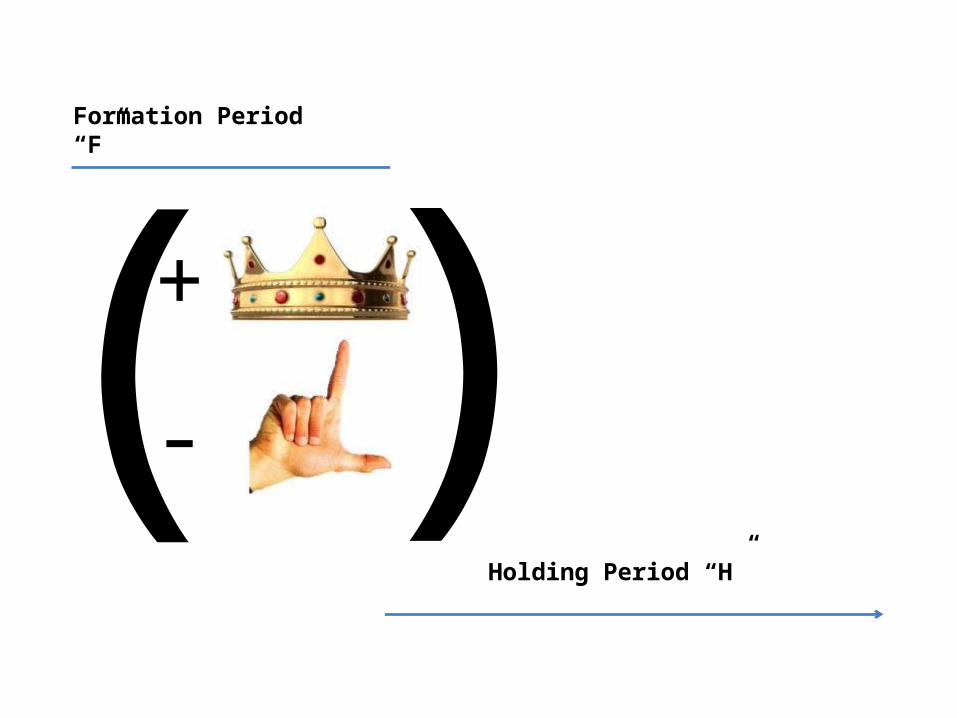
Formation Period “F”
Holding Period “H”
+
- )(
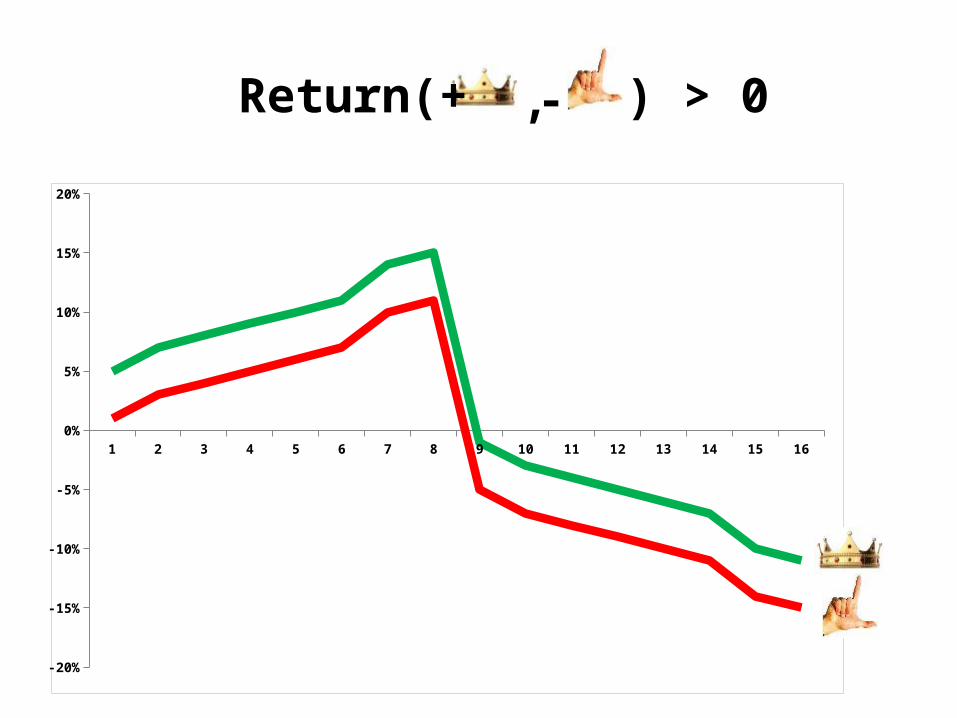
1 2 3 4 5 6 7 8 9 10 11 12 13 14 15 16
-20%
-15%
-10%
-5%
0%
5%
10%
15%
20%
Return(+ -, ) > 0
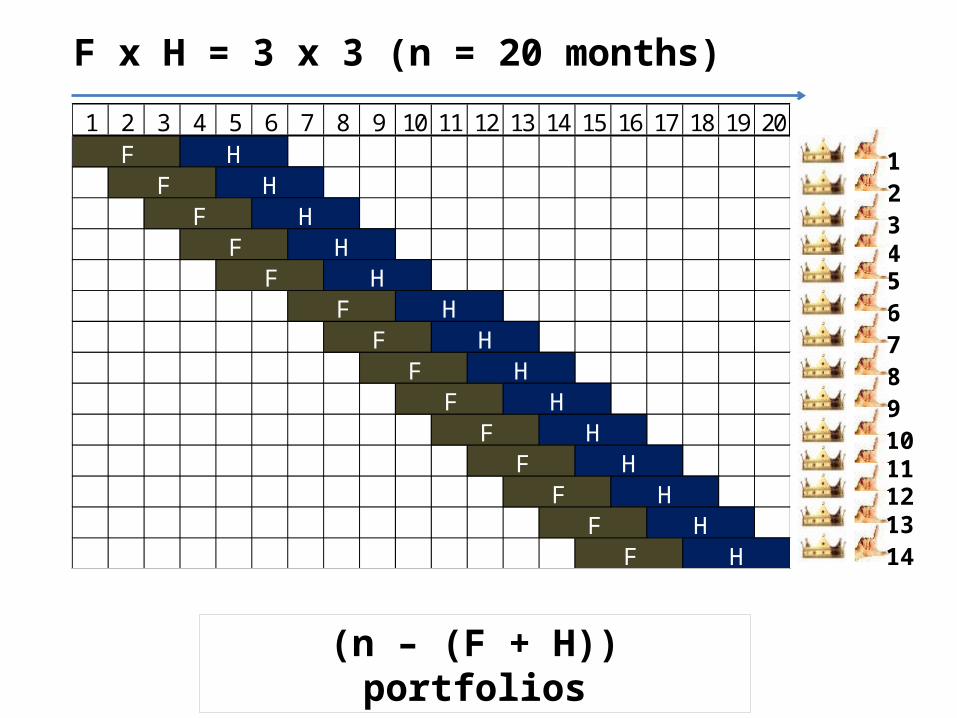
F x H = 3 x 3 (n = 20 months)
1 2 3 4 5 6 7 8 9 10 11 12 13 14 15 16 17 18 19 20
F HF H
F HF H
F H
F HF H
F H
F HF H
F H
F HF H
F H
1234567891011121314
(n – (F + H)) portfolios
1 2 3
1 2 3
1 2 3
1 2 3
1 2 3
1 2 3
1 2 3
1 2 3
1 2 3
1 2 3
1 2 3
1 2 3
1 2 3
1 2 3
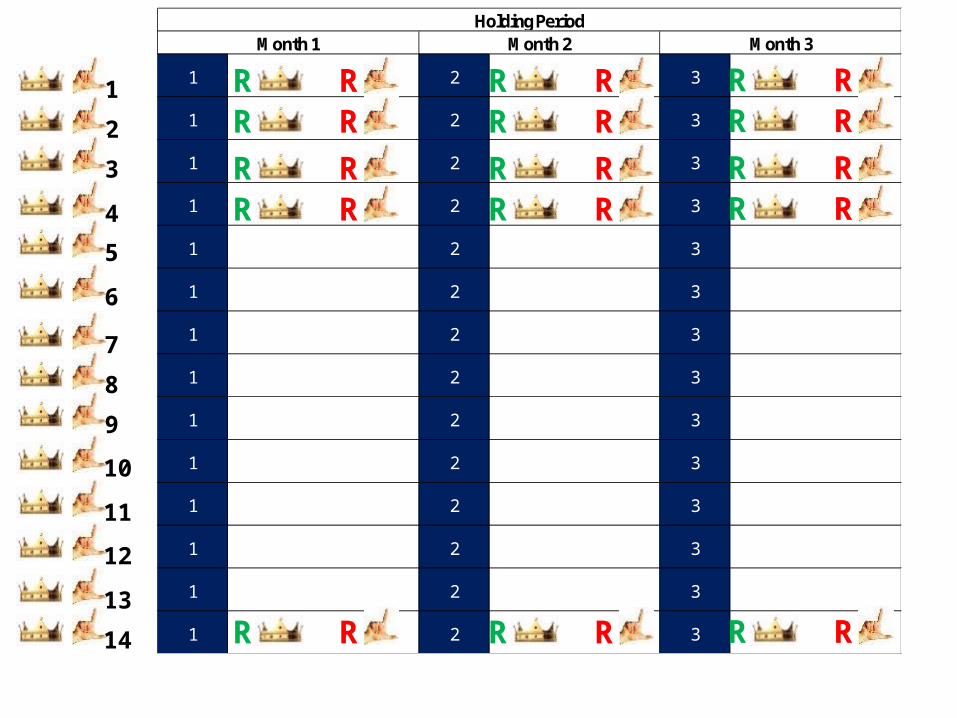
Month 1 Month 2 Month 3Holding Period
1
2
3
4
5
6
7
8
9
10
11
12
13
14
R R R R R RR R R R R RR R R R R RR R R R R R
R R R R R R
1 2 3
1 2 3
1 2 3
1 2 3
1 2 3
1 2 3
1 2 3
1 2 3
1 2 3
1 2 3
1 2 3
1 2 3
1 2 3
1 2 3
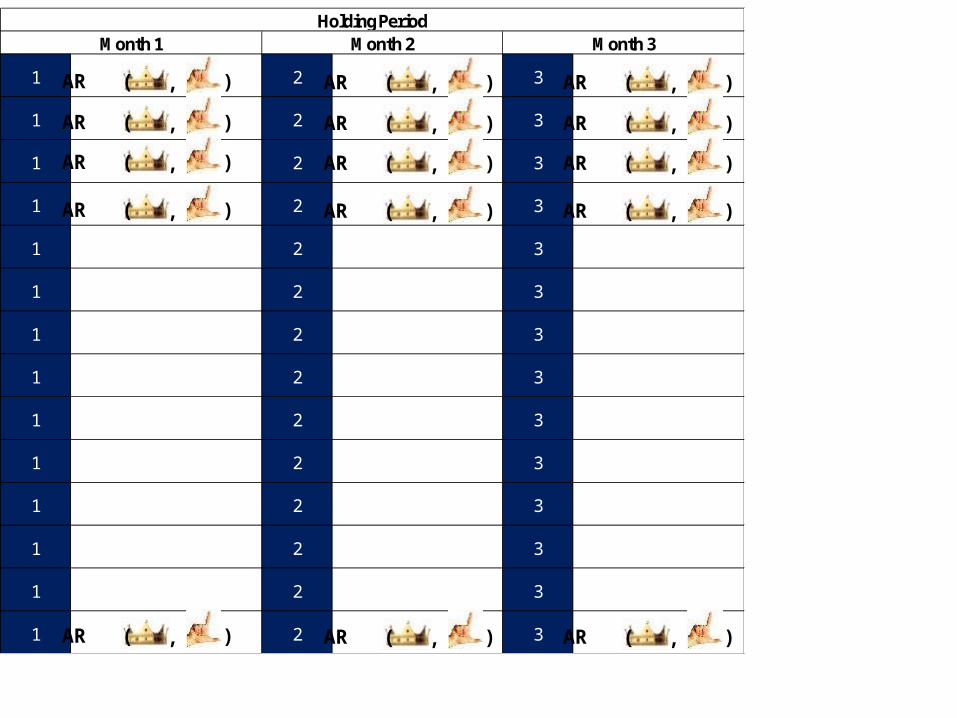
Month 1 Month 2 Month 3Holding Period
AR ( ), AR ( ), AR ( ),
AR ( ), AR ( ), AR ( ),
AR ( ), AR ( ), AR ( ),
AR ( ), AR ( ), AR ( ),
AR ( ), AR ( ), AR ( ),
1 2 3
1 2 3
1 2 3
1 2 3
1 2 3
1 2 3
1 2 3
1 2 3
1 2 3
1 2 3
1 2 3
1 2 3
1 2 3
1 2 3
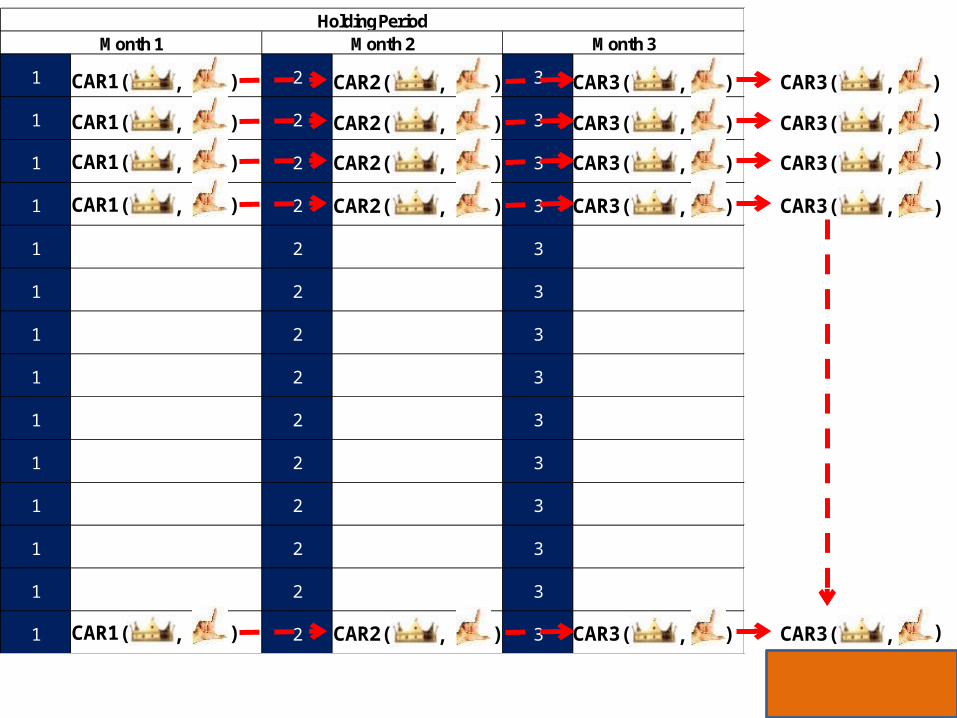
Month 1 Month 2 Month 3Holding Period
CAR1( ), CAR2( ), CAR3( ), CAR3( ),
CAR1( ), CAR2( ), CAR3( ), CAR3( ,
CAR1( ), CAR2( ), CAR3( ), CAR3( ,
CAR1( ), CAR2( ), CAR3( ), CAR3( ,
CAR1( ), CAR2( ), CAR3( ), CAR3( ,
)
)
)
)
MCAR3
1 2 3
1 2 3
1 2 3
1 2 3
1 2 3
1 2 3
1 2 3
1 2 3
1 2 3
1 2 3
1 2 3
1 2 3
1 2 3
1 2 3
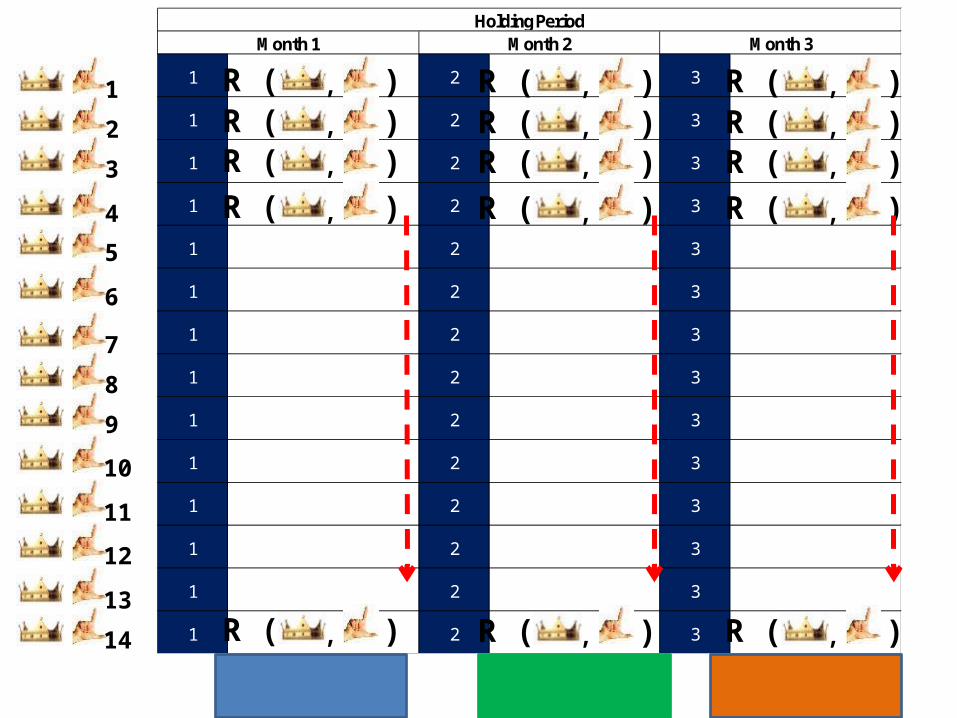
Month 1 Month 2 Month 3Holding Period
1
2
3
4
5
6
7
8
9
10
11
12
13
14
R ( ), R ( ), R ( ),
R ( ), R ( ), R ( ),
R ( ), R ( ), R ( ),
R ( ), R ( ), R ( ),
R ( ), R ( ), R ( ),
MAR1 MAR2 MAR3
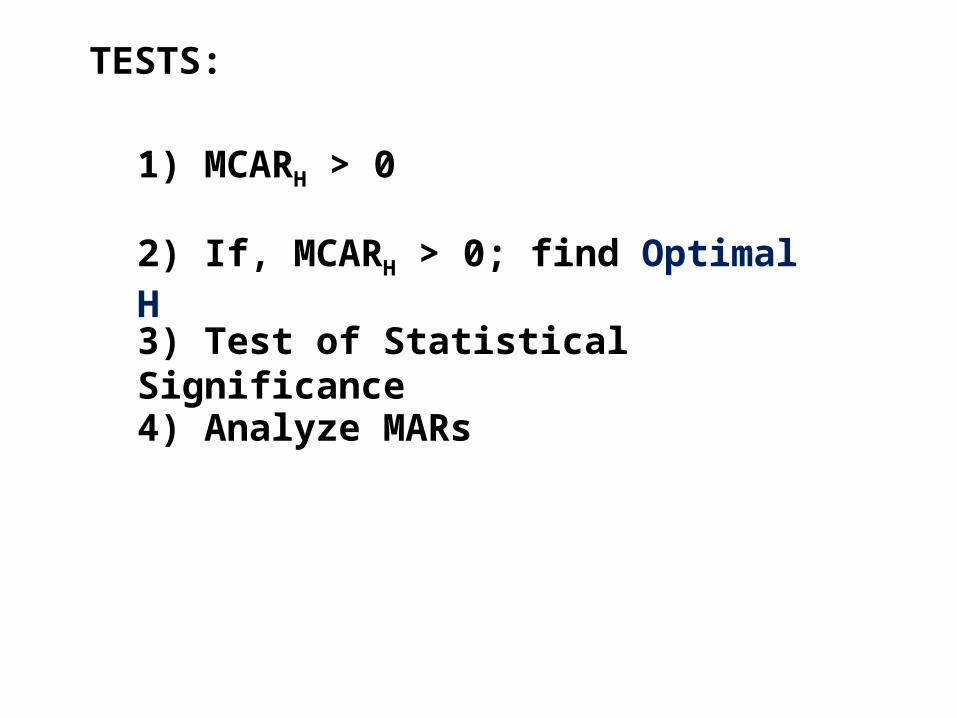
1) MCARH > 0
TESTS:
2) If, MCARH > 0; find Optimal H
3) Test of Statistical Significance
4) Analyze MARs
3. XXX
• XXX
• XXX
a.XXX
b.XXX
c. XXX
• XXX
Overview
Prepared by:Derek Song, German Hurtado, Mustafa Jalil Qureshi, Rodrigo De La Maza Momentum Investment - Finance 663
4. Results and Analysis
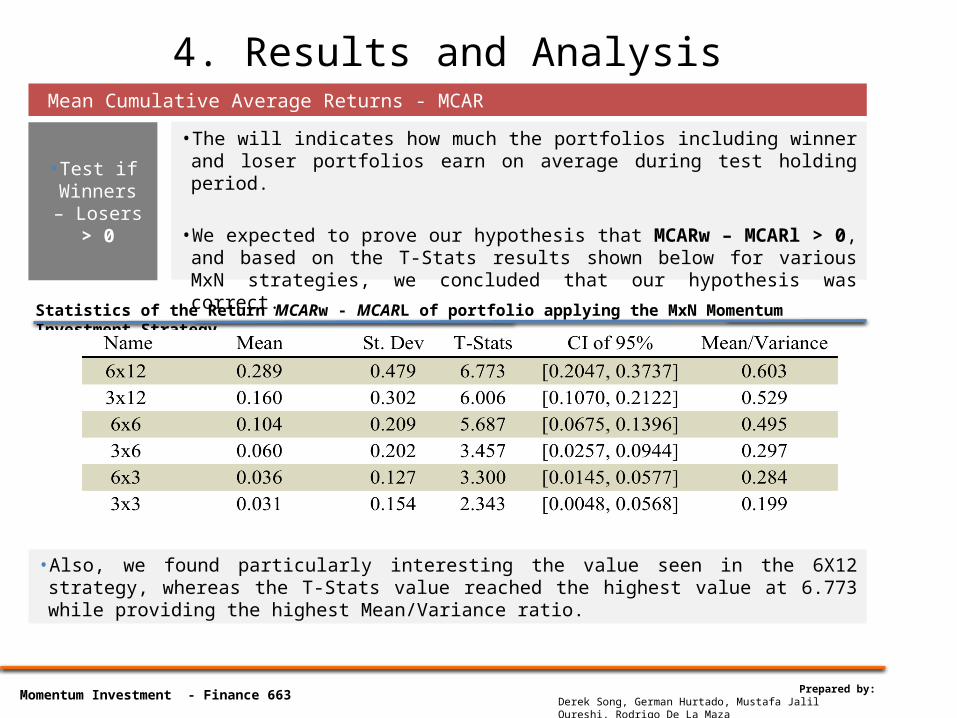
• The will indicates how much the portfolios including winner and loser portfolios earn on average during test holding period.
• We expected to prove our hypothesis that MCARw – MCARl > 0, and based on the T-Stats results shown below for various MxN strategies, we concluded that our hypothesis was correct.
Mean Cumulative Average Returns - MCAR
Prepared by:Derek Song, German Hurtado, Mustafa Jalil Qureshi, Rodrigo De La Maza Momentum Investment - Finance 663
• Test if Winners – Losers > 0
> 2
• Also, we found particularly interesting the value seen in the 6X12 strategy, whereas the T-Stats value reached the highest value at 6.773 while providing the highest Mean/Variance ratio.
Statistics of the Return MCARw - MCARL of portfolio applying the MxN Momentum Investment Strategy
4. Results and AnalysisMean Cumulative Average Returns - MCAR
Prepared by:Derek Song, German Hurtado, Mustafa Jalil Qureshi, Rodrigo De La Maza Momentum Investment - Finance 663
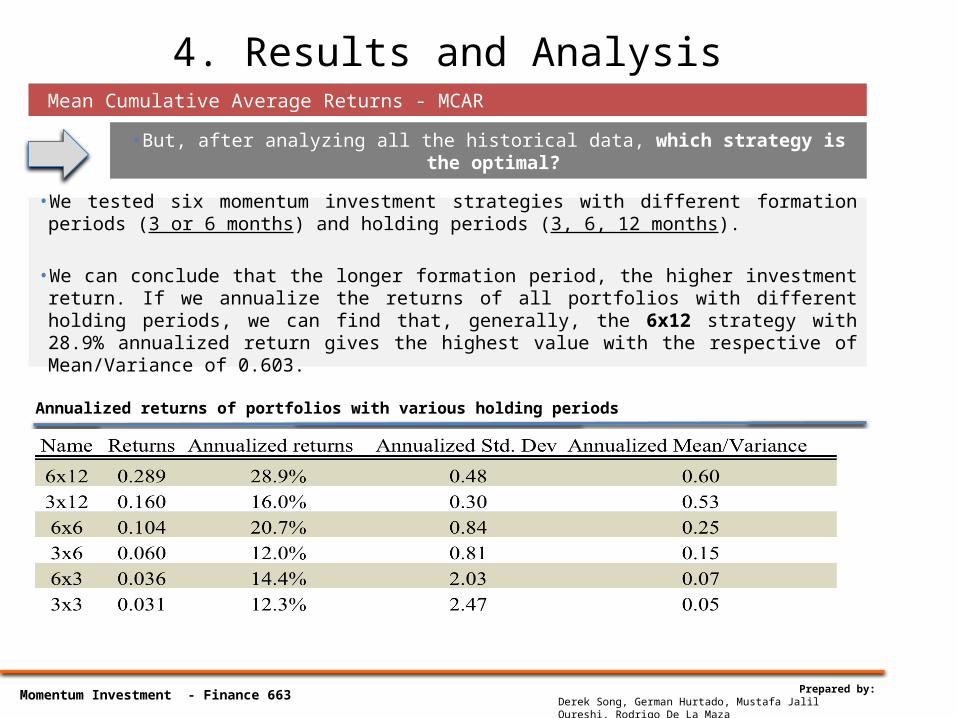
• But, after analyzing all the historical data, which strategy is the optimal?
• We tested six momentum investment strategies with different formation periods (3 or 6 months) and holding periods (3, 6, 12 months).
• We can conclude that the longer formation period, the higher investment return. If we annualize the returns of all portfolios with different holding periods, we can find that, generally, the 6x12 strategy with 28.9% annualized return gives the highest value with the respective of Mean/Variance of 0.603.
Annualized returns of portfolios with various holding periods
4. Results and AnalysisMean Cumulative Average Returns - MCAR
Prepared by:Derek Song, German Hurtado, Mustafa Jalil Qureshi, Rodrigo De La Maza Momentum Investment - Finance 663
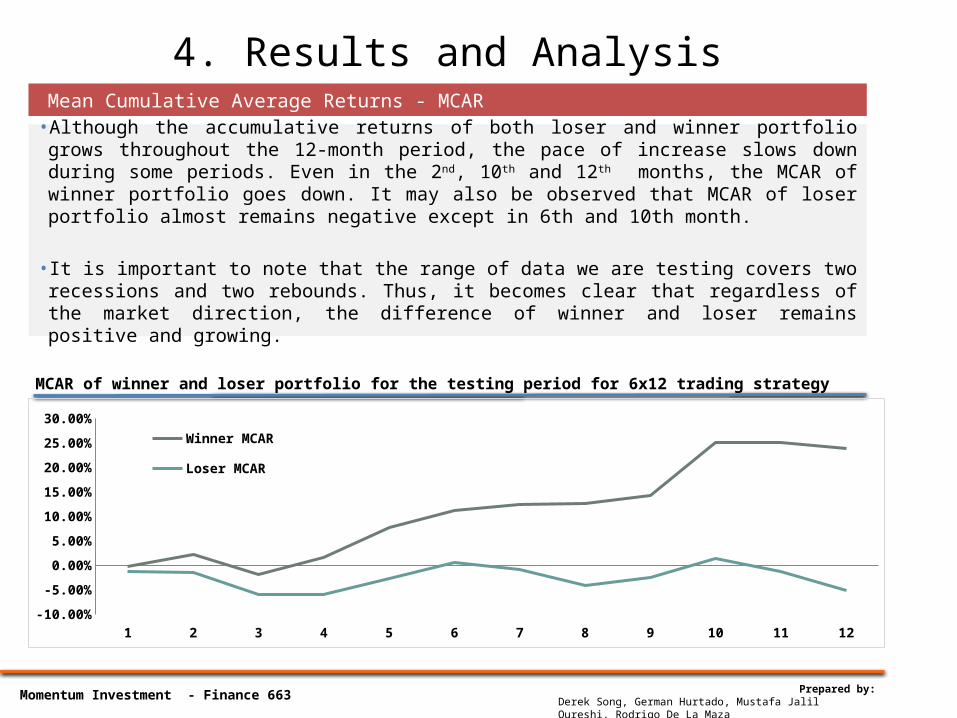
• Although the accumulative returns of both loser and winner portfolio grows throughout the 12-month period, the pace of increase slows down during some periods. Even in the 2nd, 10th and 12th months, the MCAR of winner portfolio goes down. It may also be observed that MCAR of loser portfolio almost remains negative except in 6th and 10th month.
• It is important to note that the range of data we are testing covers two recessions and two rebounds. Thus, it becomes clear that regardless of the market direction, the difference of winner and loser remains positive and growing.
MCAR of winner and loser portfolio for the testing period for 6x12 trading strategy
1 2 3 4 5 6 7 8 9 10 11 12-10.00%
-5.00%
0.00%
5.00%
10.00%
15.00%
20.00%
25.00%
30.00%
Winner MCAR
Loser MCAR
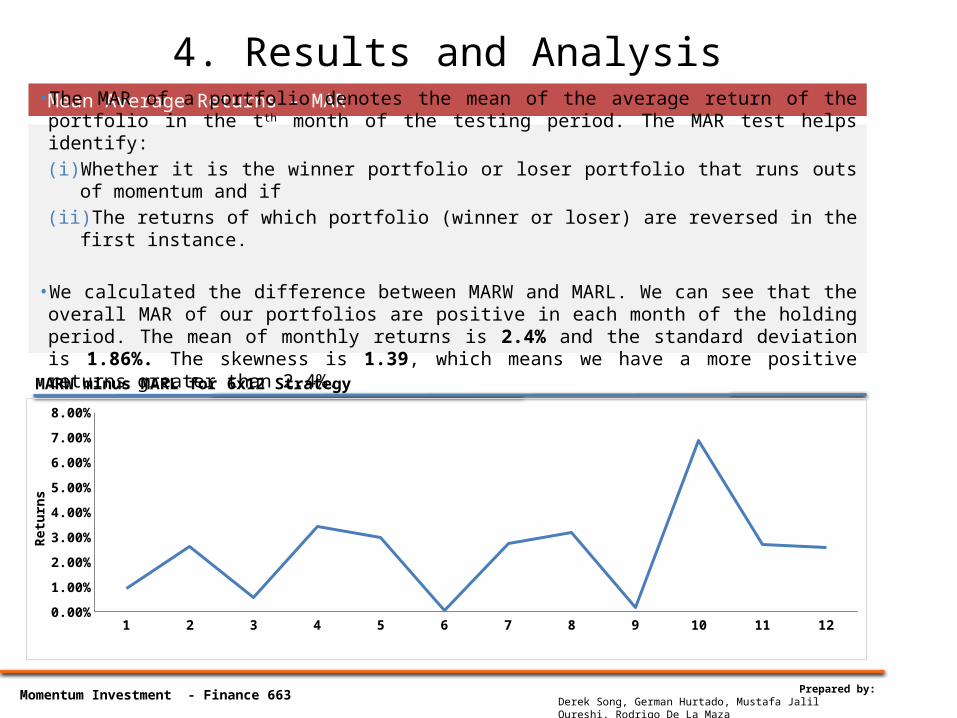
4. Results and AnalysisMean Average Returns - MAR
Prepared by:Derek Song, German Hurtado, Mustafa Jalil Qureshi, Rodrigo De La Maza Momentum Investment - Finance 663
• The MAR of a portfolio denotes the mean of the average return of the portfolio in the t th month of the testing period. The MAR test helps identify:
(i) Whether it is the winner portfolio or loser portfolio that runs outs of momentum and if
(ii) The returns of which portfolio (winner or loser) are reversed in the first instance.
• We calculated the difference between MARW and MARL. We can see that the overall MAR of our portfolios are positive in each month of the holding period. The mean of monthly returns is 2.4% and the standard deviation is 1.86%. The skewness is 1.39, which means we have a more positive returns greater than 2.4%.
MARW minus MARL for 6x12 Strategy
1 2 3 4 5 6 7 8 9 10 11 120.00%
1.00%
2.00%
3.00%
4.00%
5.00%
6.00%
7.00%
8.00%
Ret
urn
s
Conclusions
• We validated the hypothesis about Momentum Investment: Assets that perform well over a 3 to 12 month period tend to continue to perform well into the future.
• Momentum profits provide fund managers with an excellent opportunity to create beta-neutral, superior-return portfolios.
• The insurance industry in the U.S is a pretty good investment target in order to
implement this long-short momentum investment strategy. The average accumulative return during 12-months using this trading strategy is about 28.92%.- This figure is better than the return obtained using a passive investment strategy
investing index or ETF.- The optimal formation period in this industry during 2001 – 2012 is 6 months and
holding period is 12 months.
• Finally, we also showed that Momentum Investment may work well in case markets are positive or negative trending.
Prepared by:Derek Song, German Hurtado, Mustafa Jalil Qureshi, Rodrigo De La Maza Momentum Investment - Finance 663


![Gibran Jalil Gibran[1]](https://img.pdfslide.net/doc/110x75/54bf49b24a795947778b457f/gibran-jalil-gibran1.jpg)