Embed Size (px)
Citation preview


Risk

Hacks

Automation

Monitoring and Troubleshooting
Peter Hoosepacket loss hater, facebook
One Engineer’s RantSolutions, lessons learned and what not to do
Brendan Cleary, Lance Dryden, Francisco Hidalgo, Peter Hoose, Ernesto Ovcharenko, Petr Lapukhov, Jose Leitao, James Paussa, Jimmy Williams, Nathan Bronson

Myths
• Automation fixes everything
• We’ve fixed everything
• Doesn’t apply

Microbursts
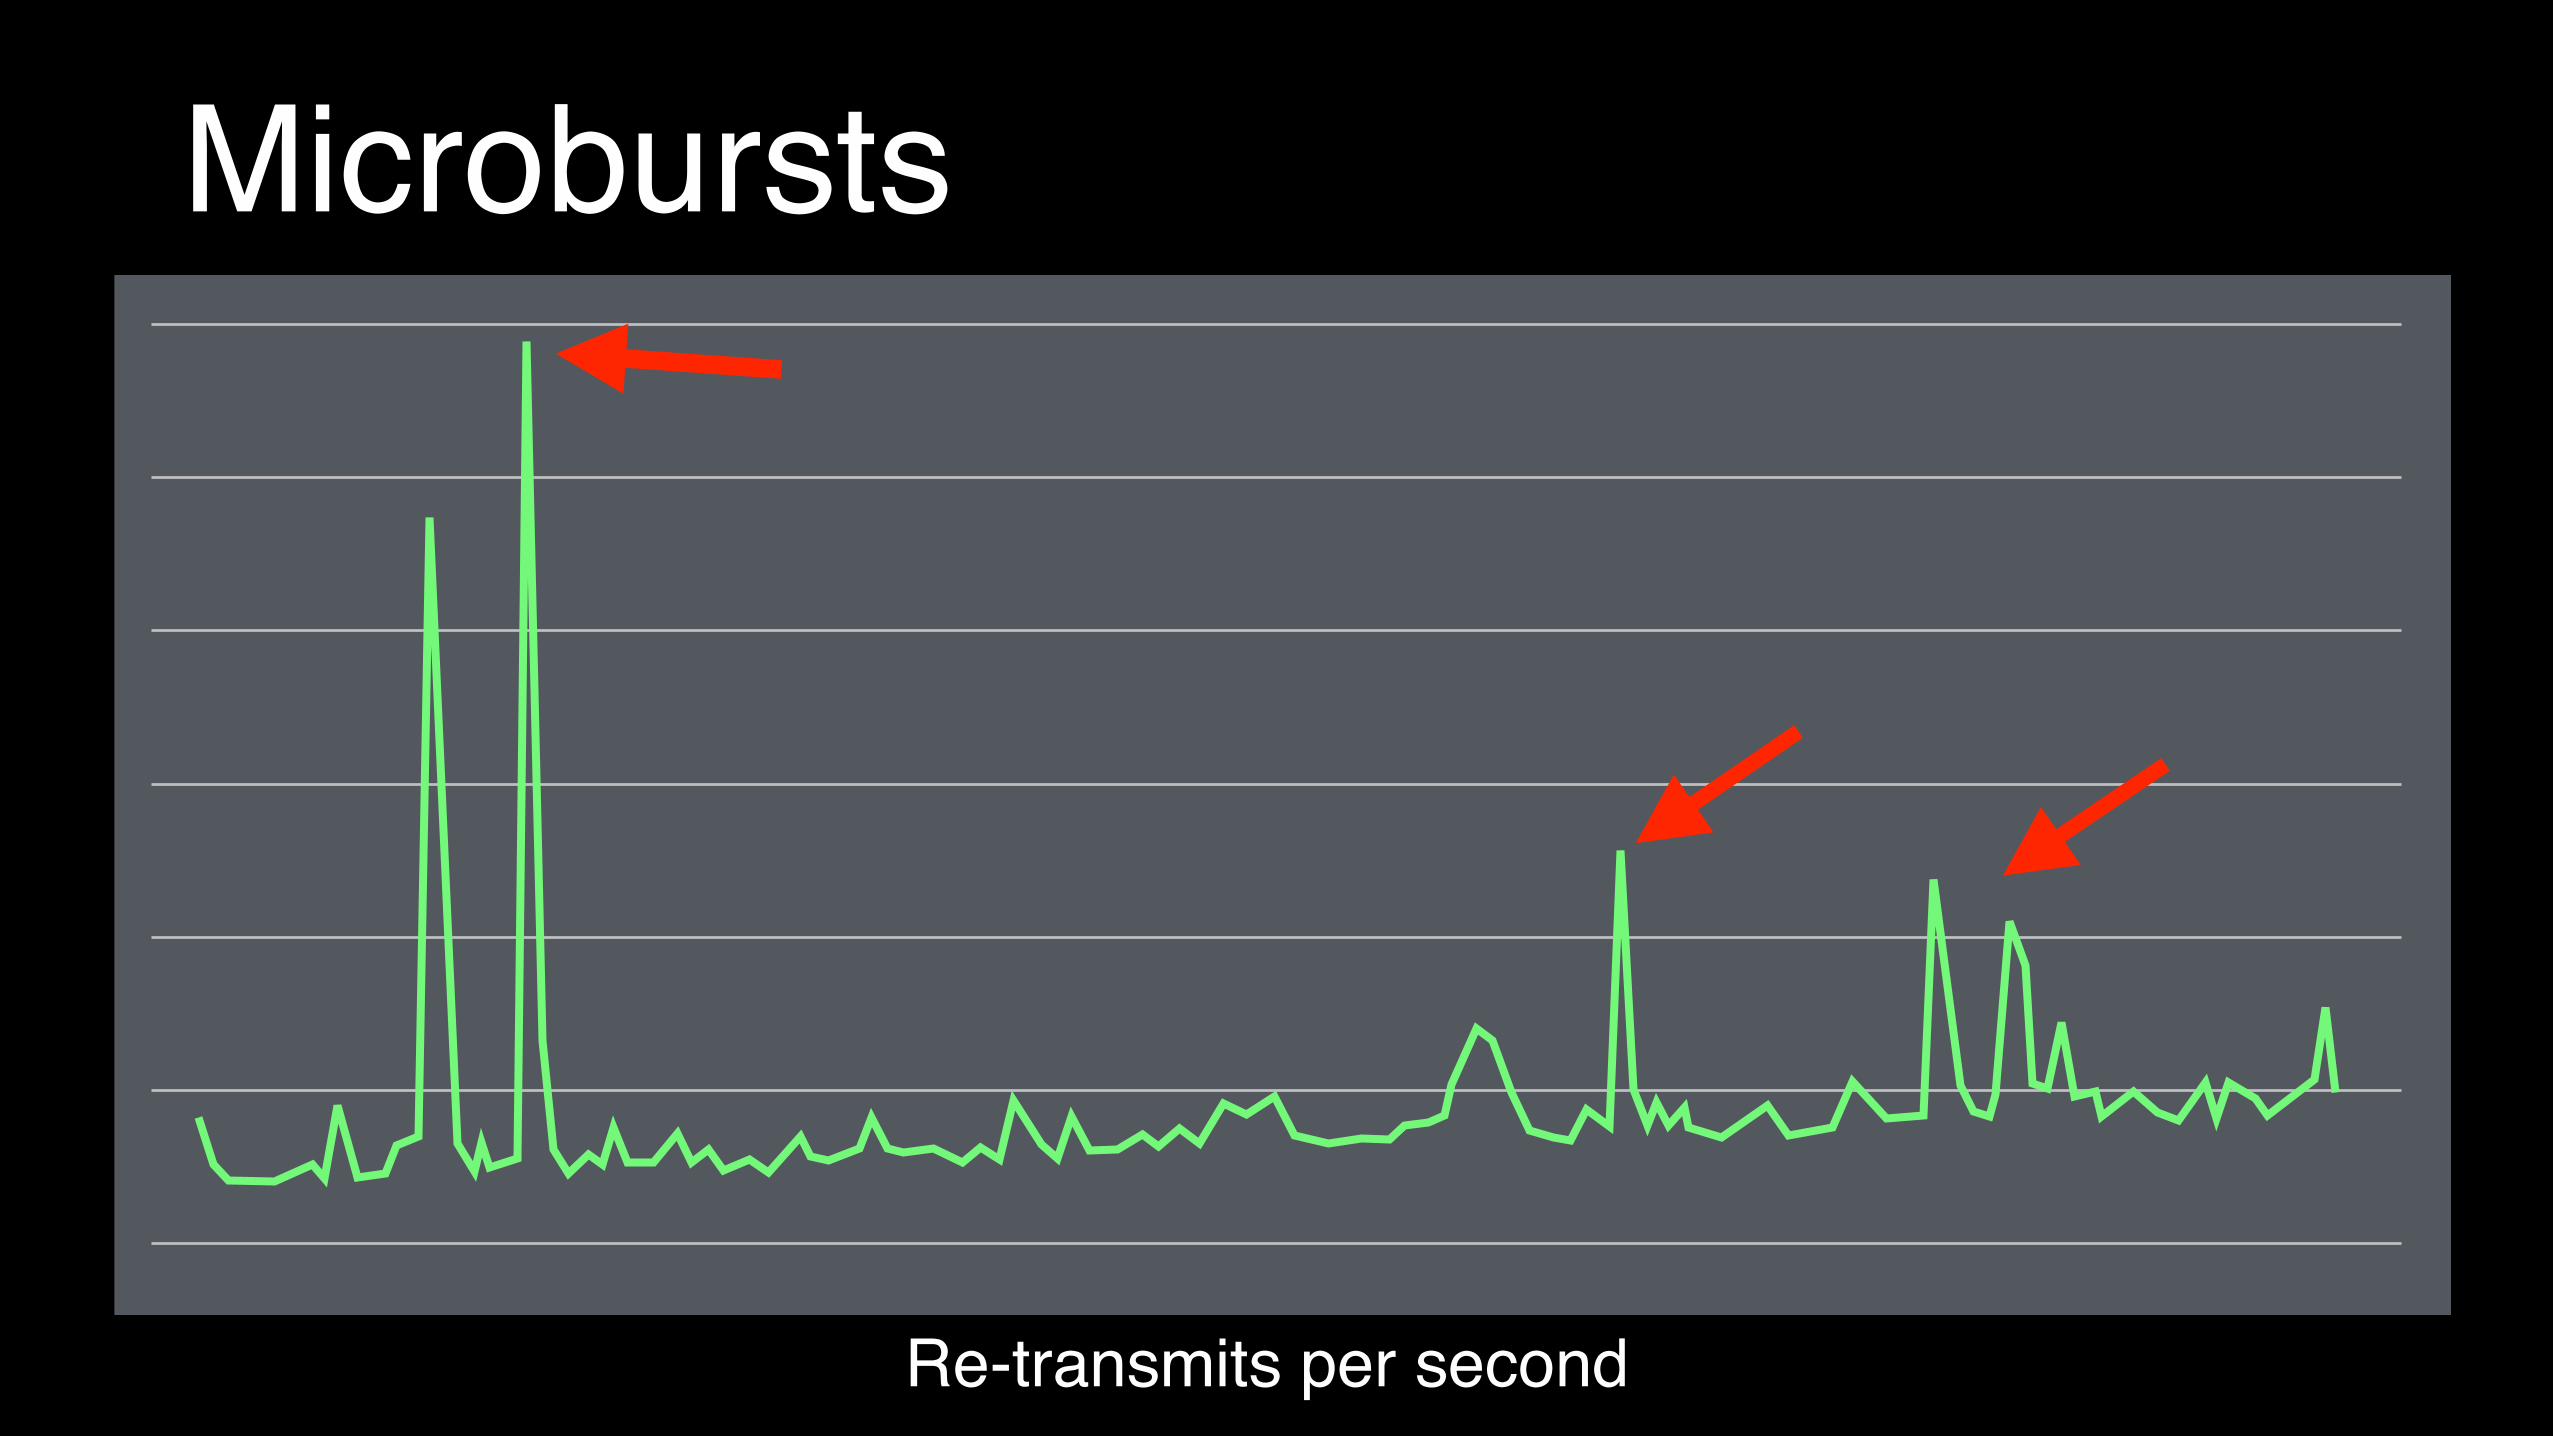
Microbursts
Re-transmits per second
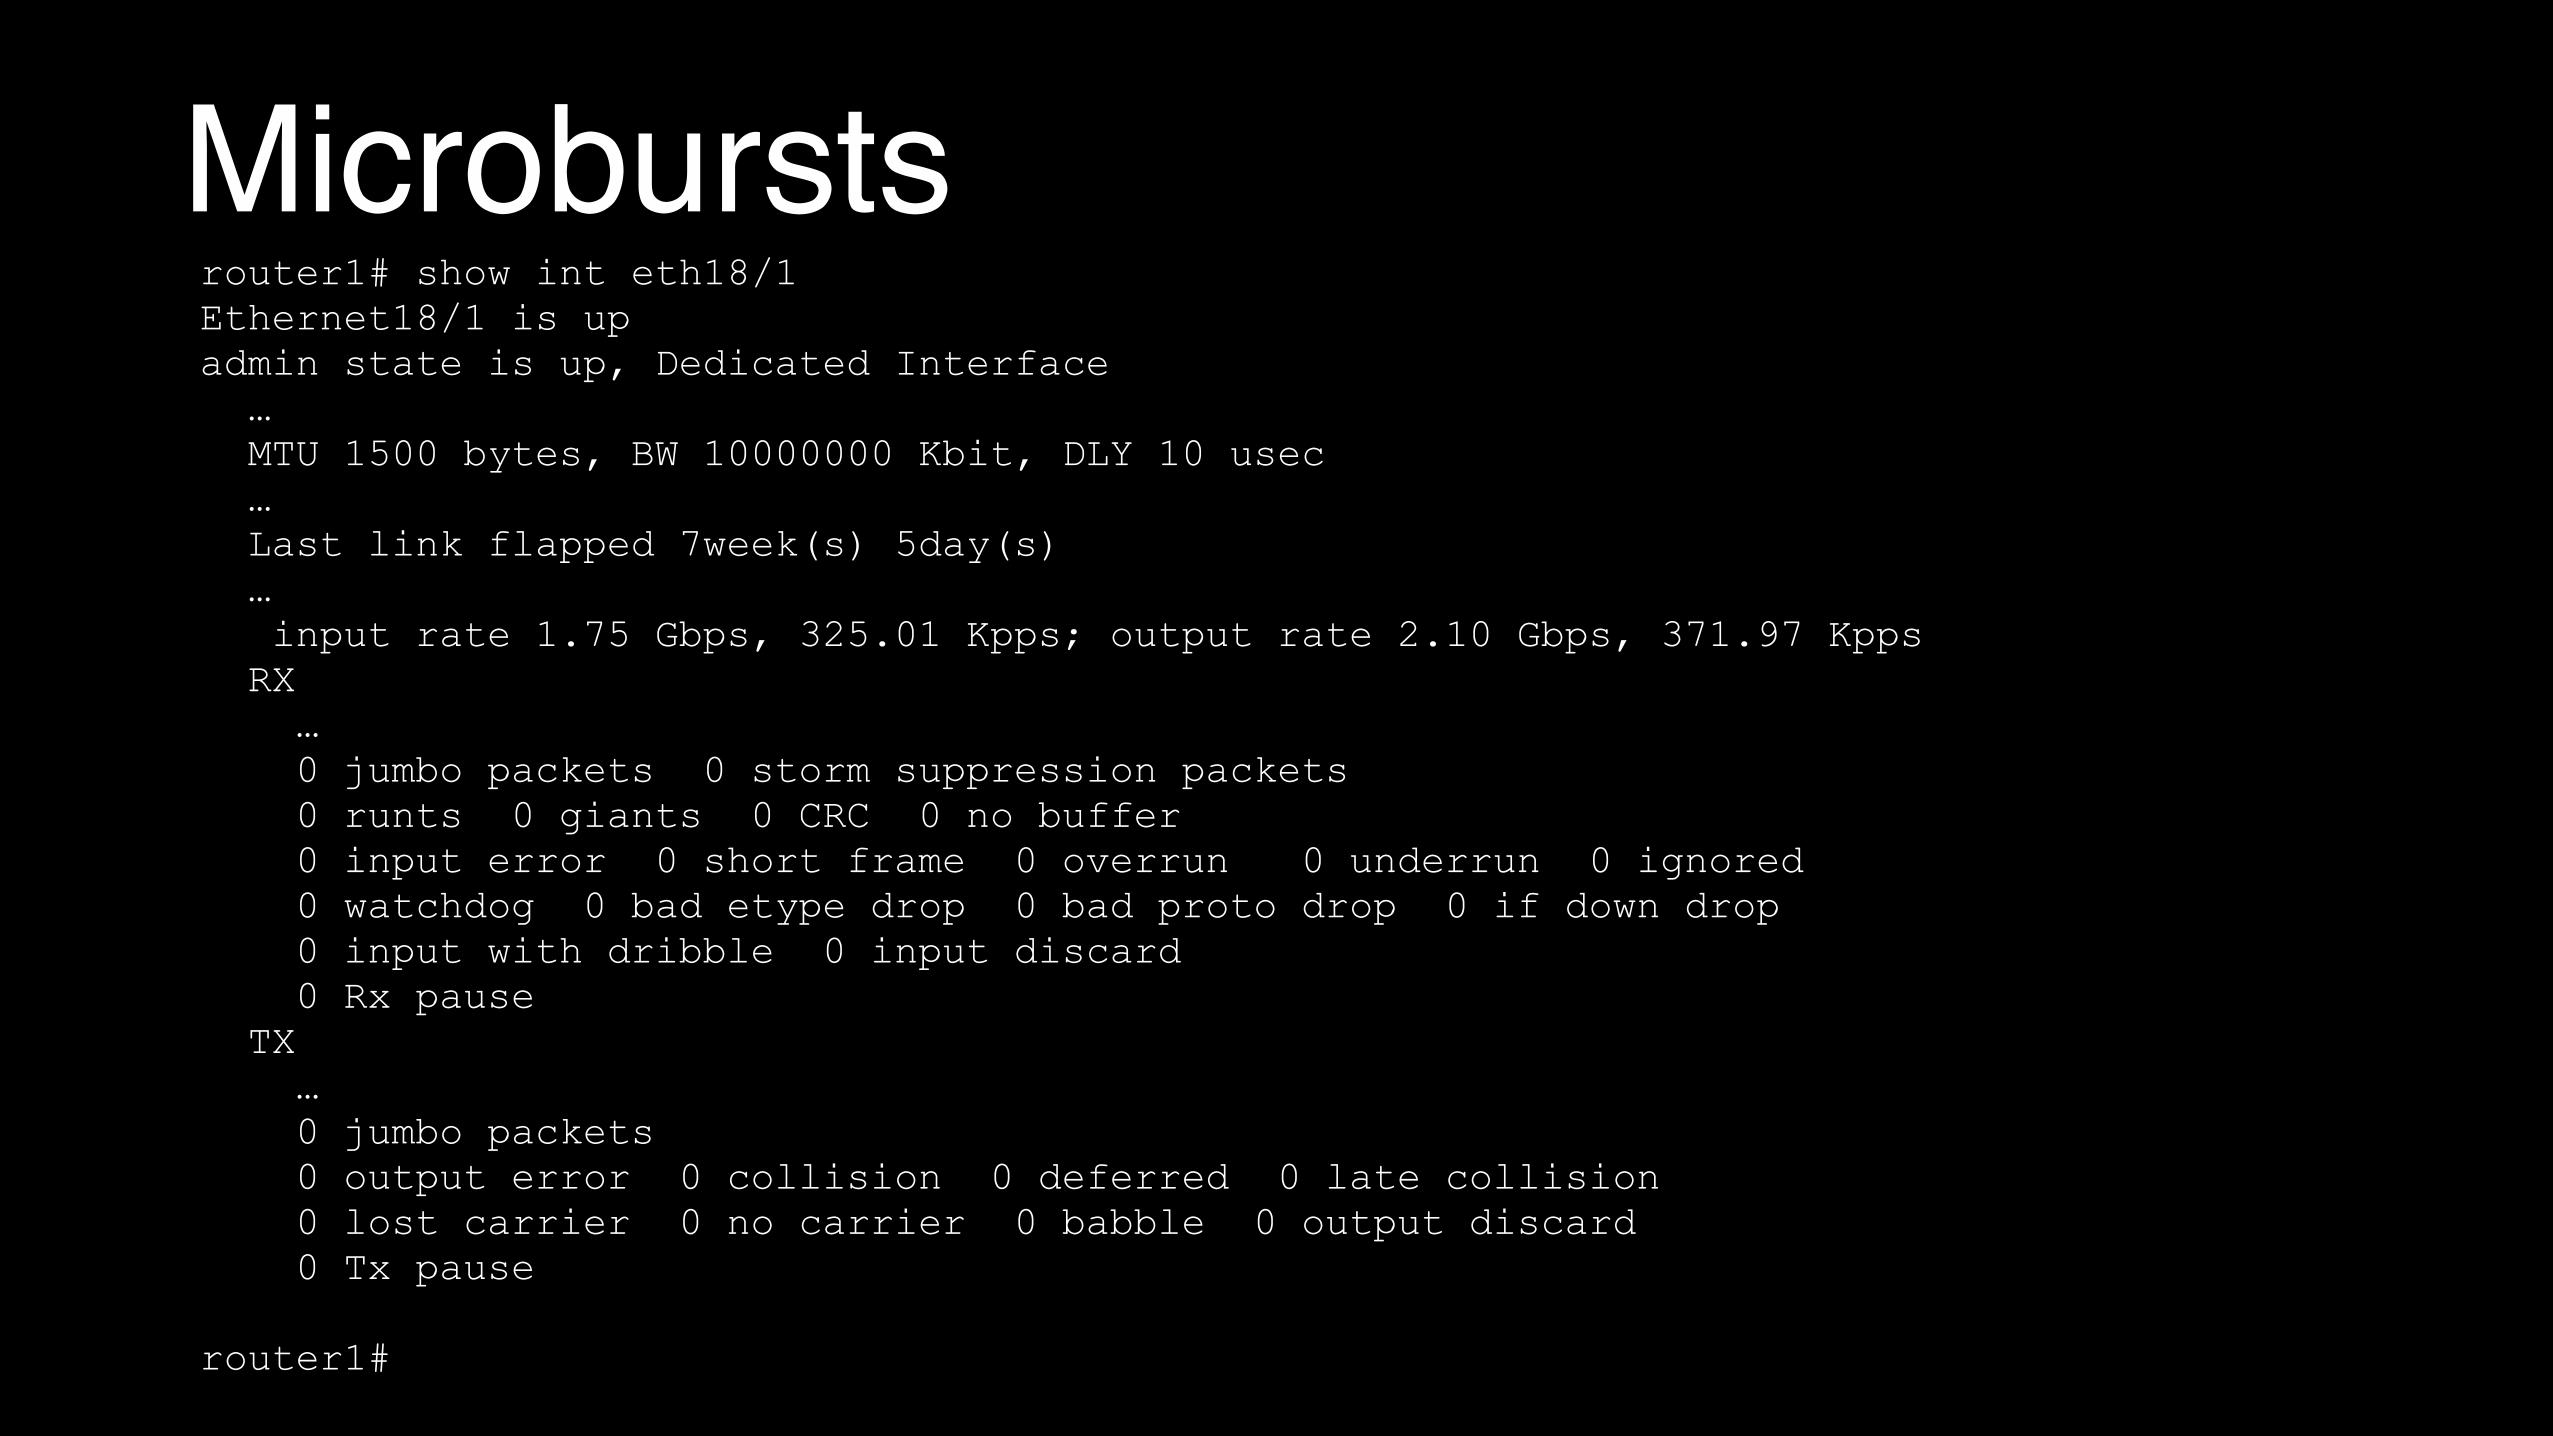
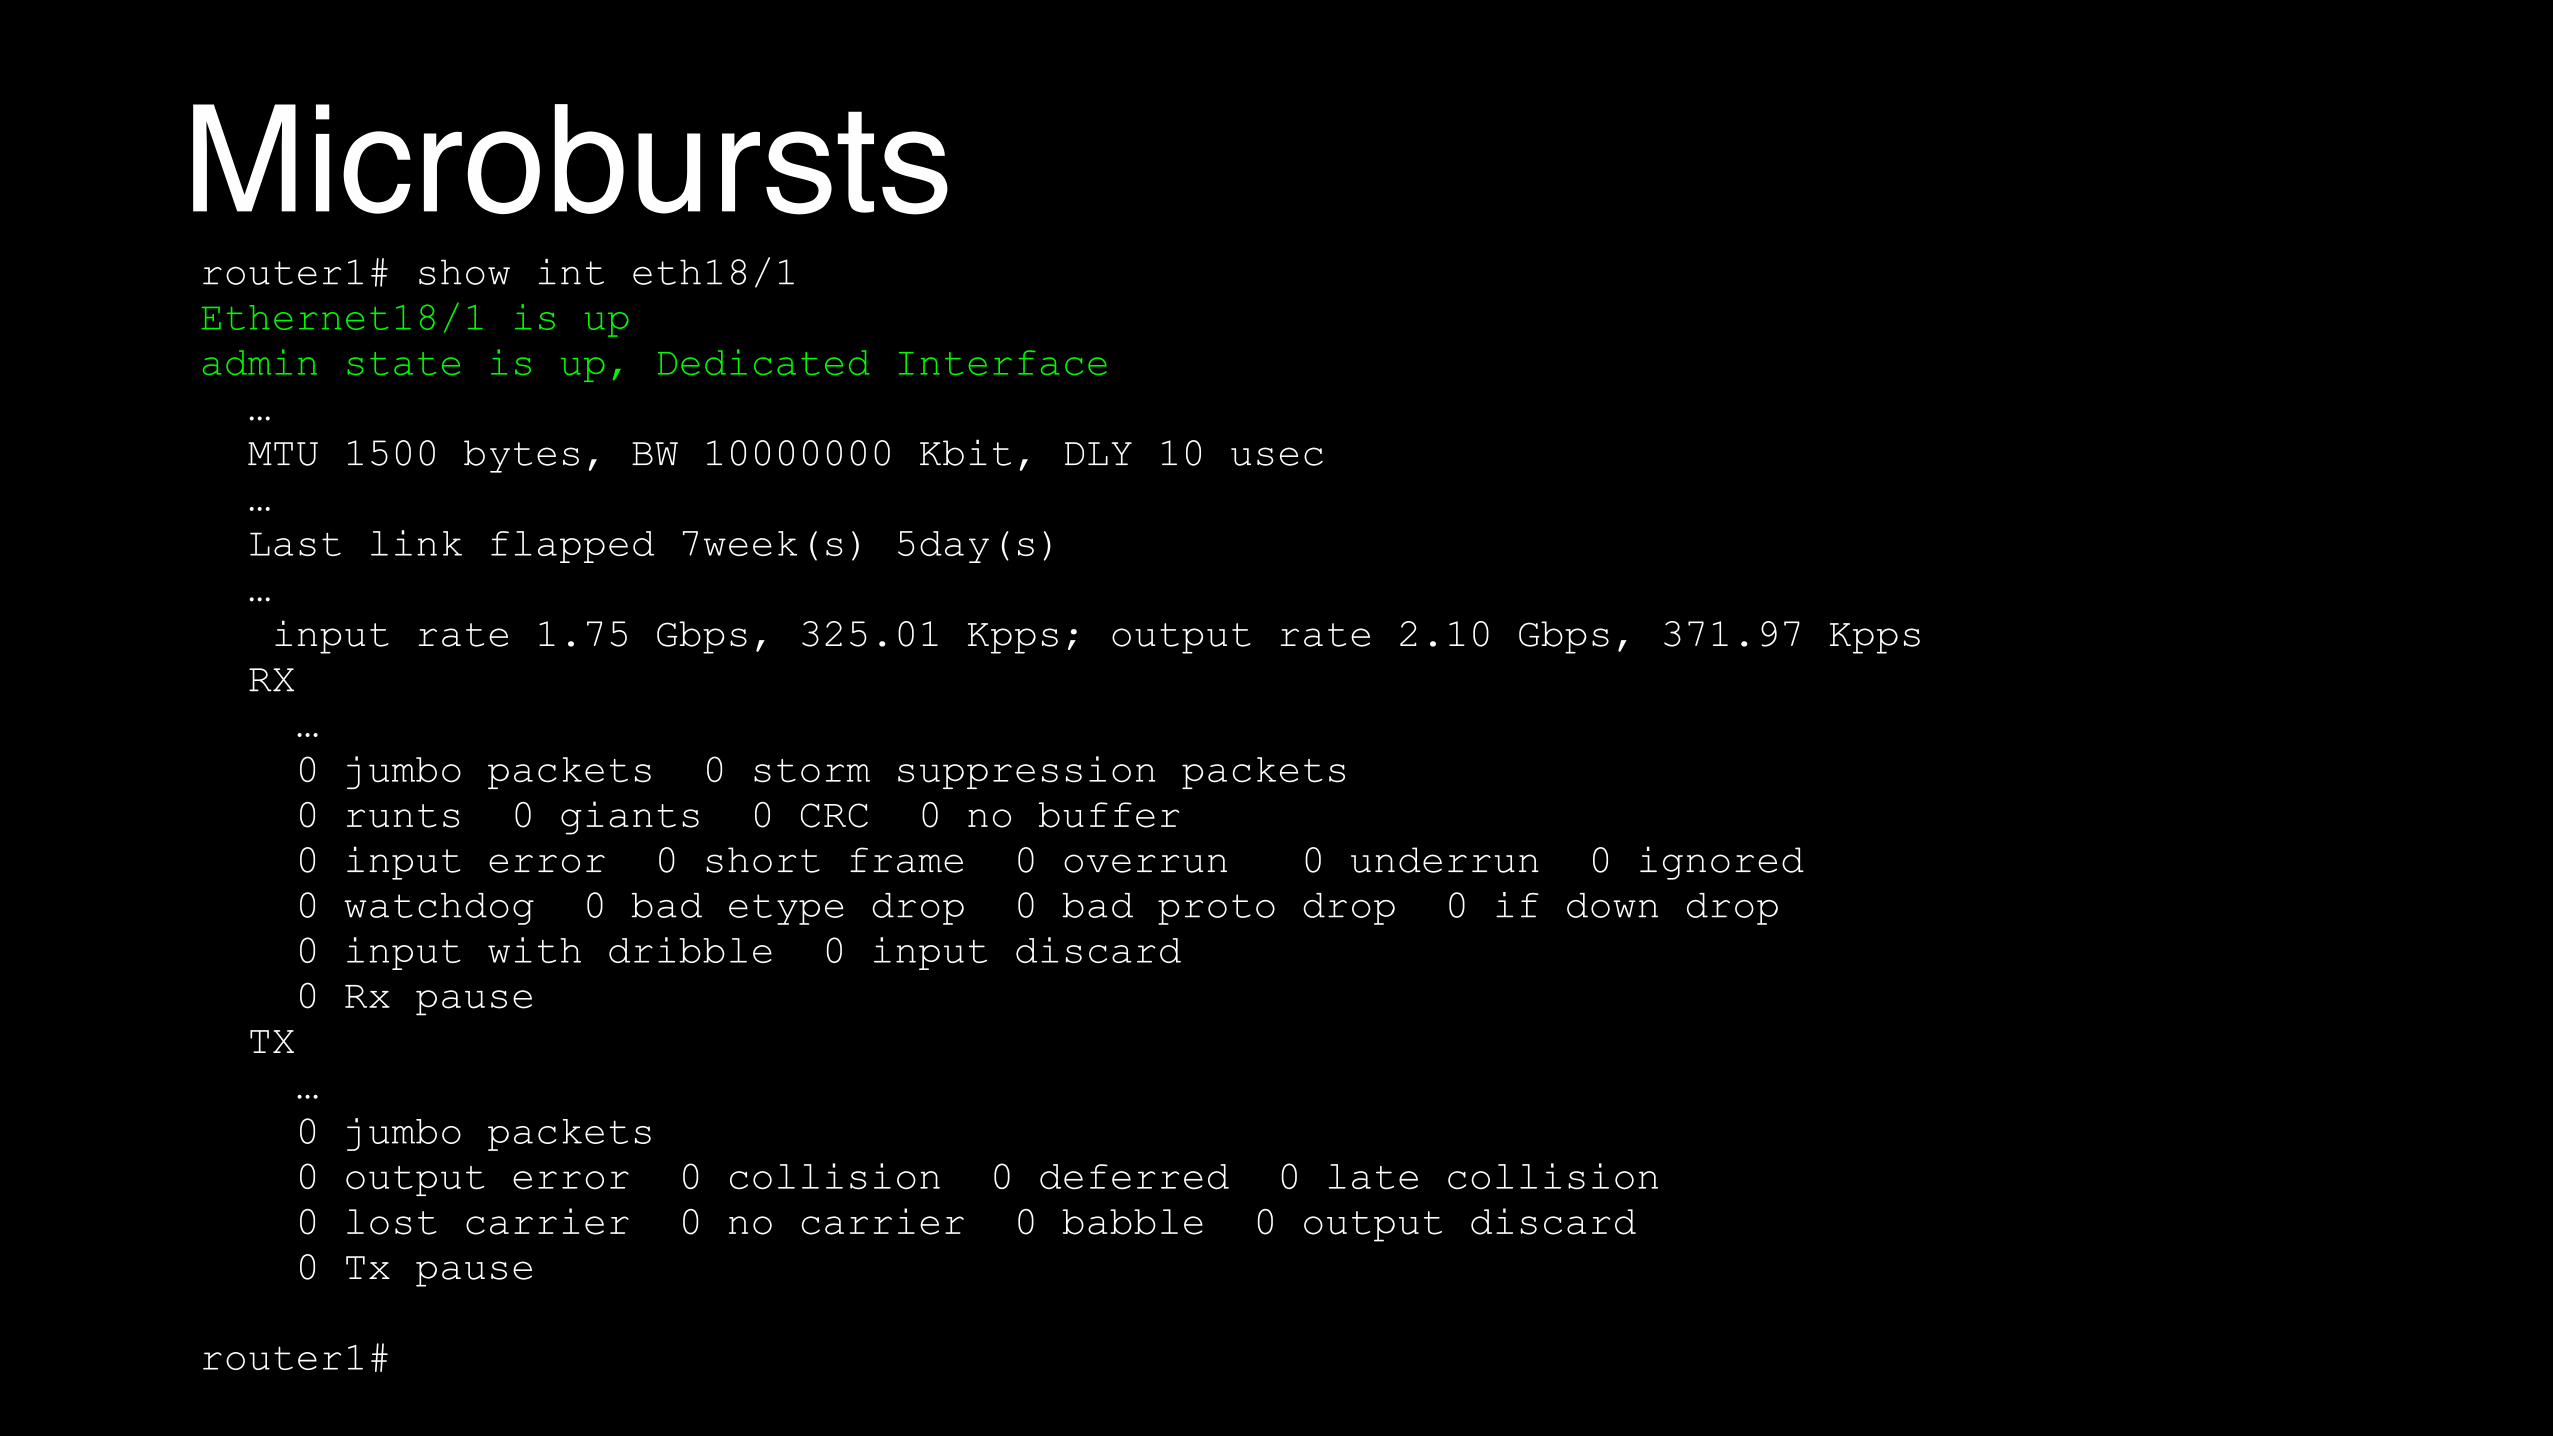
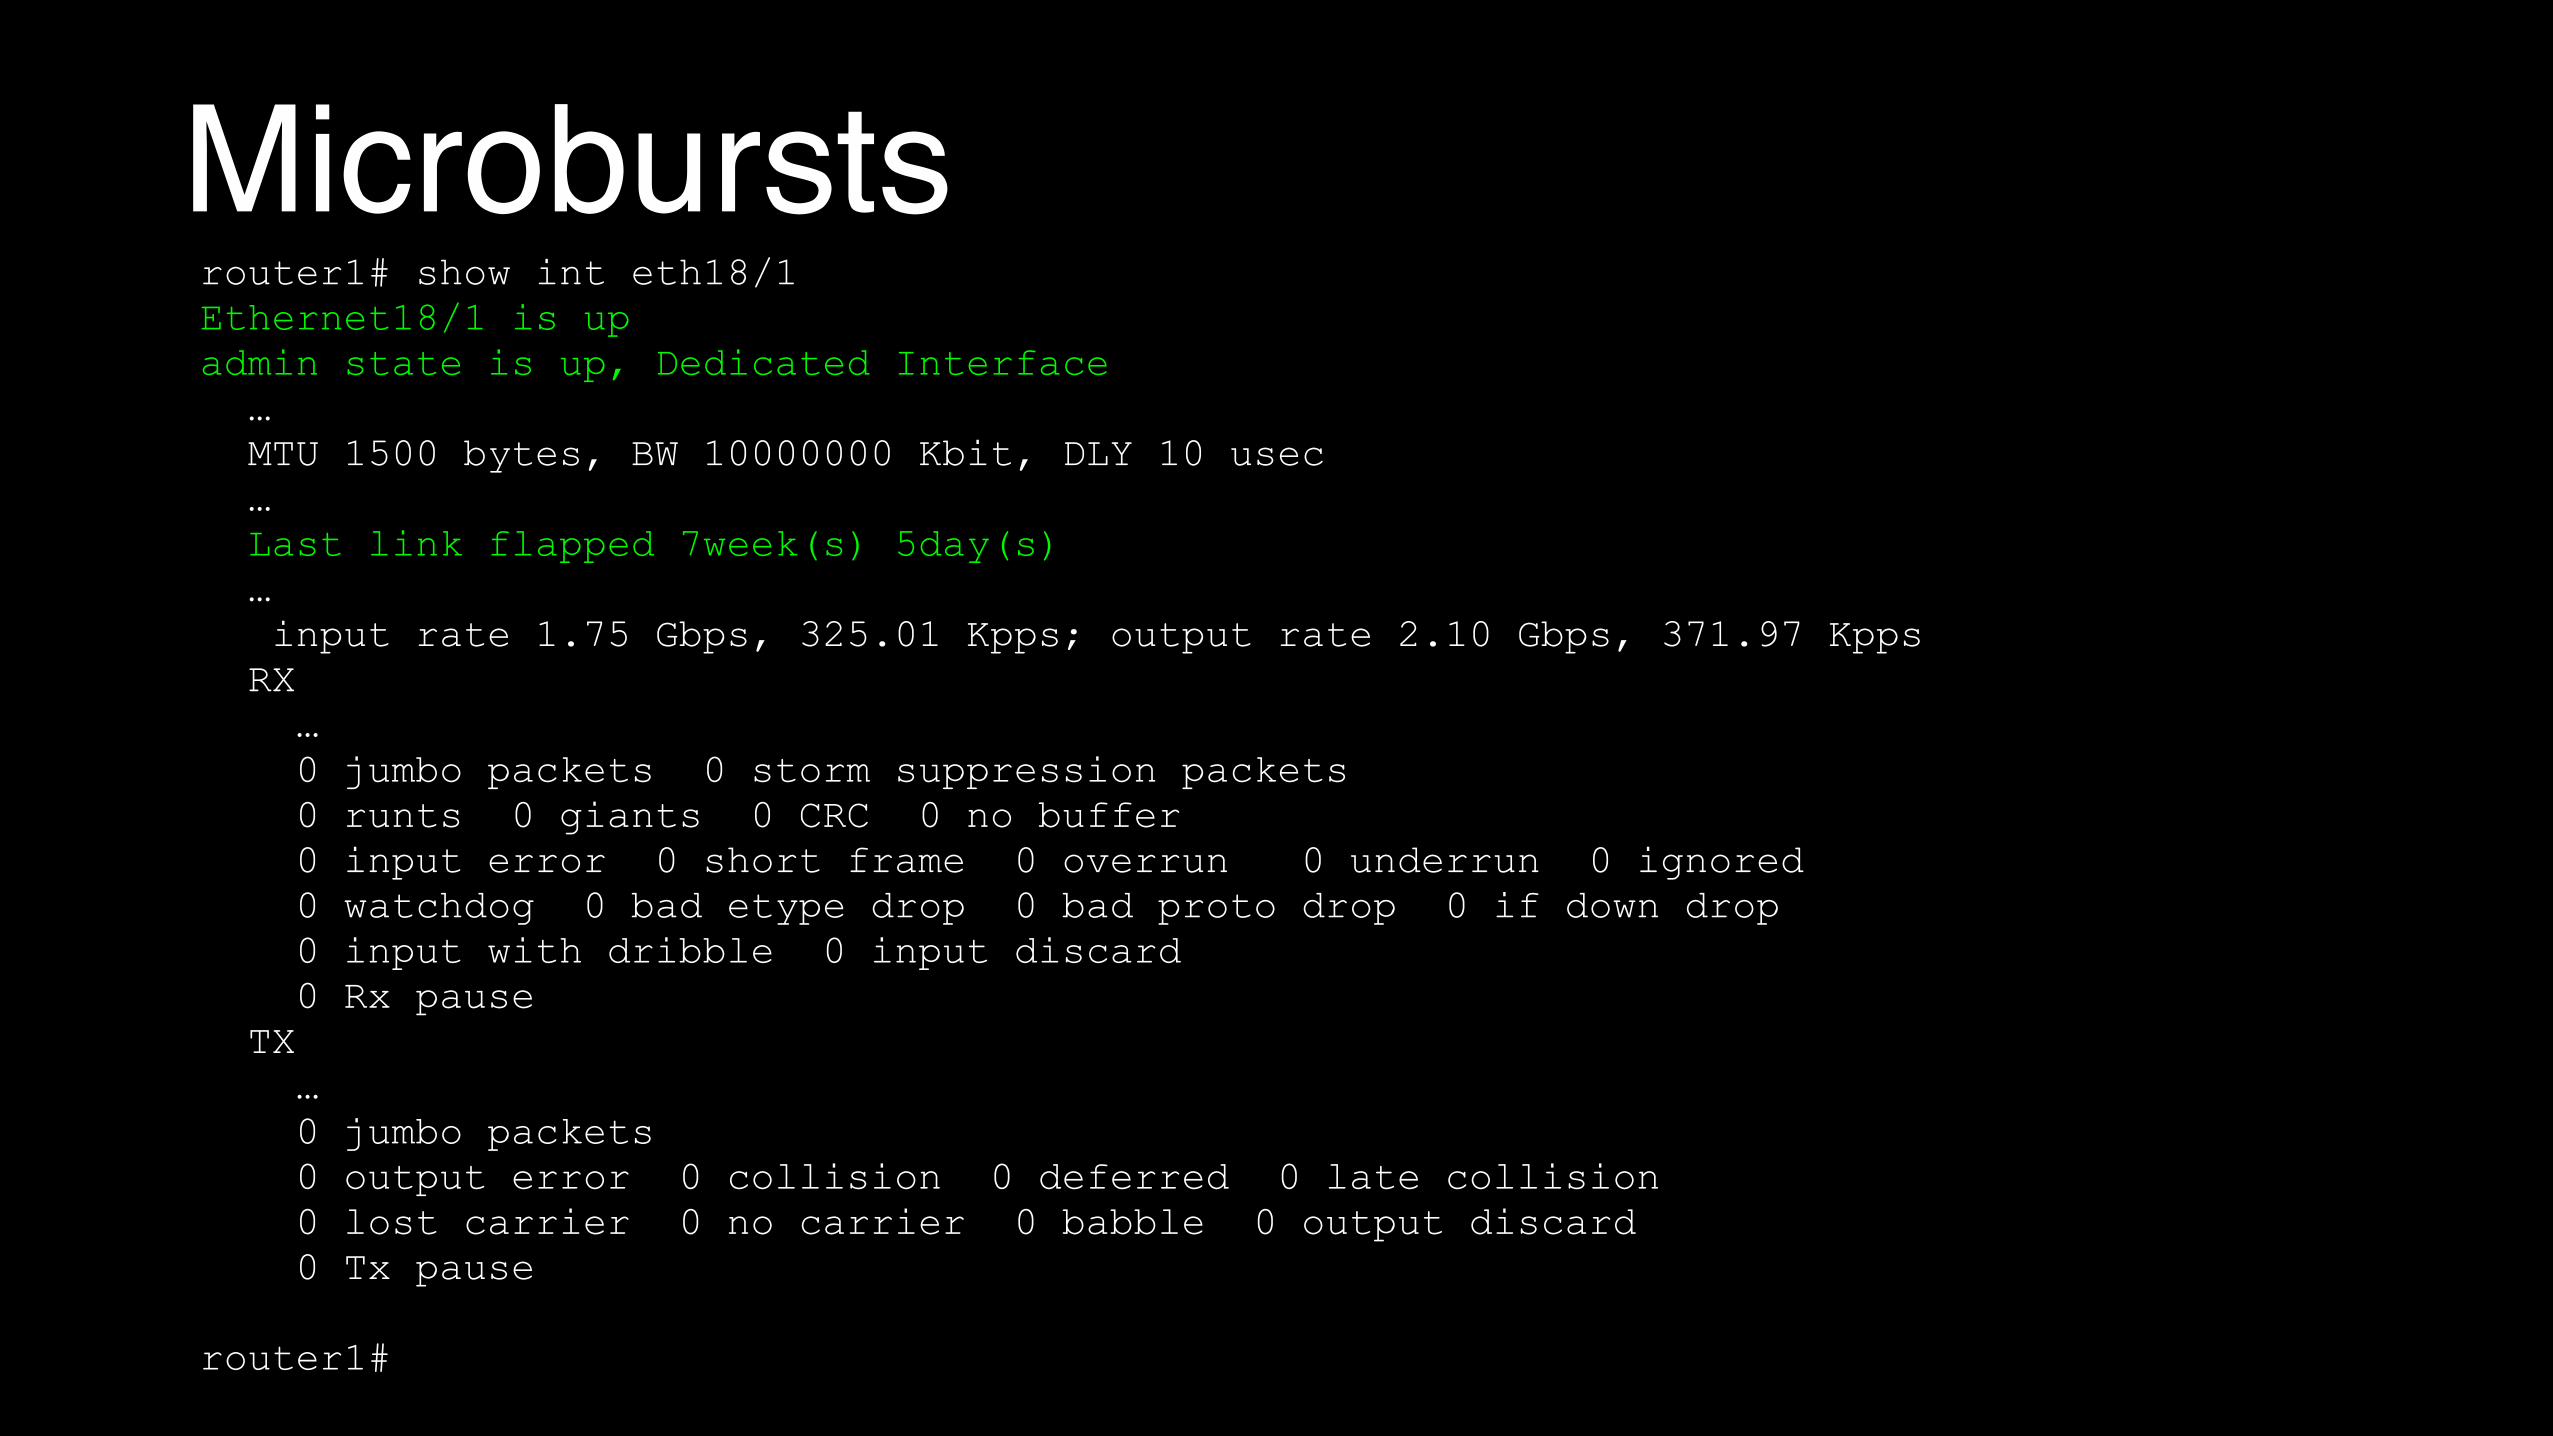
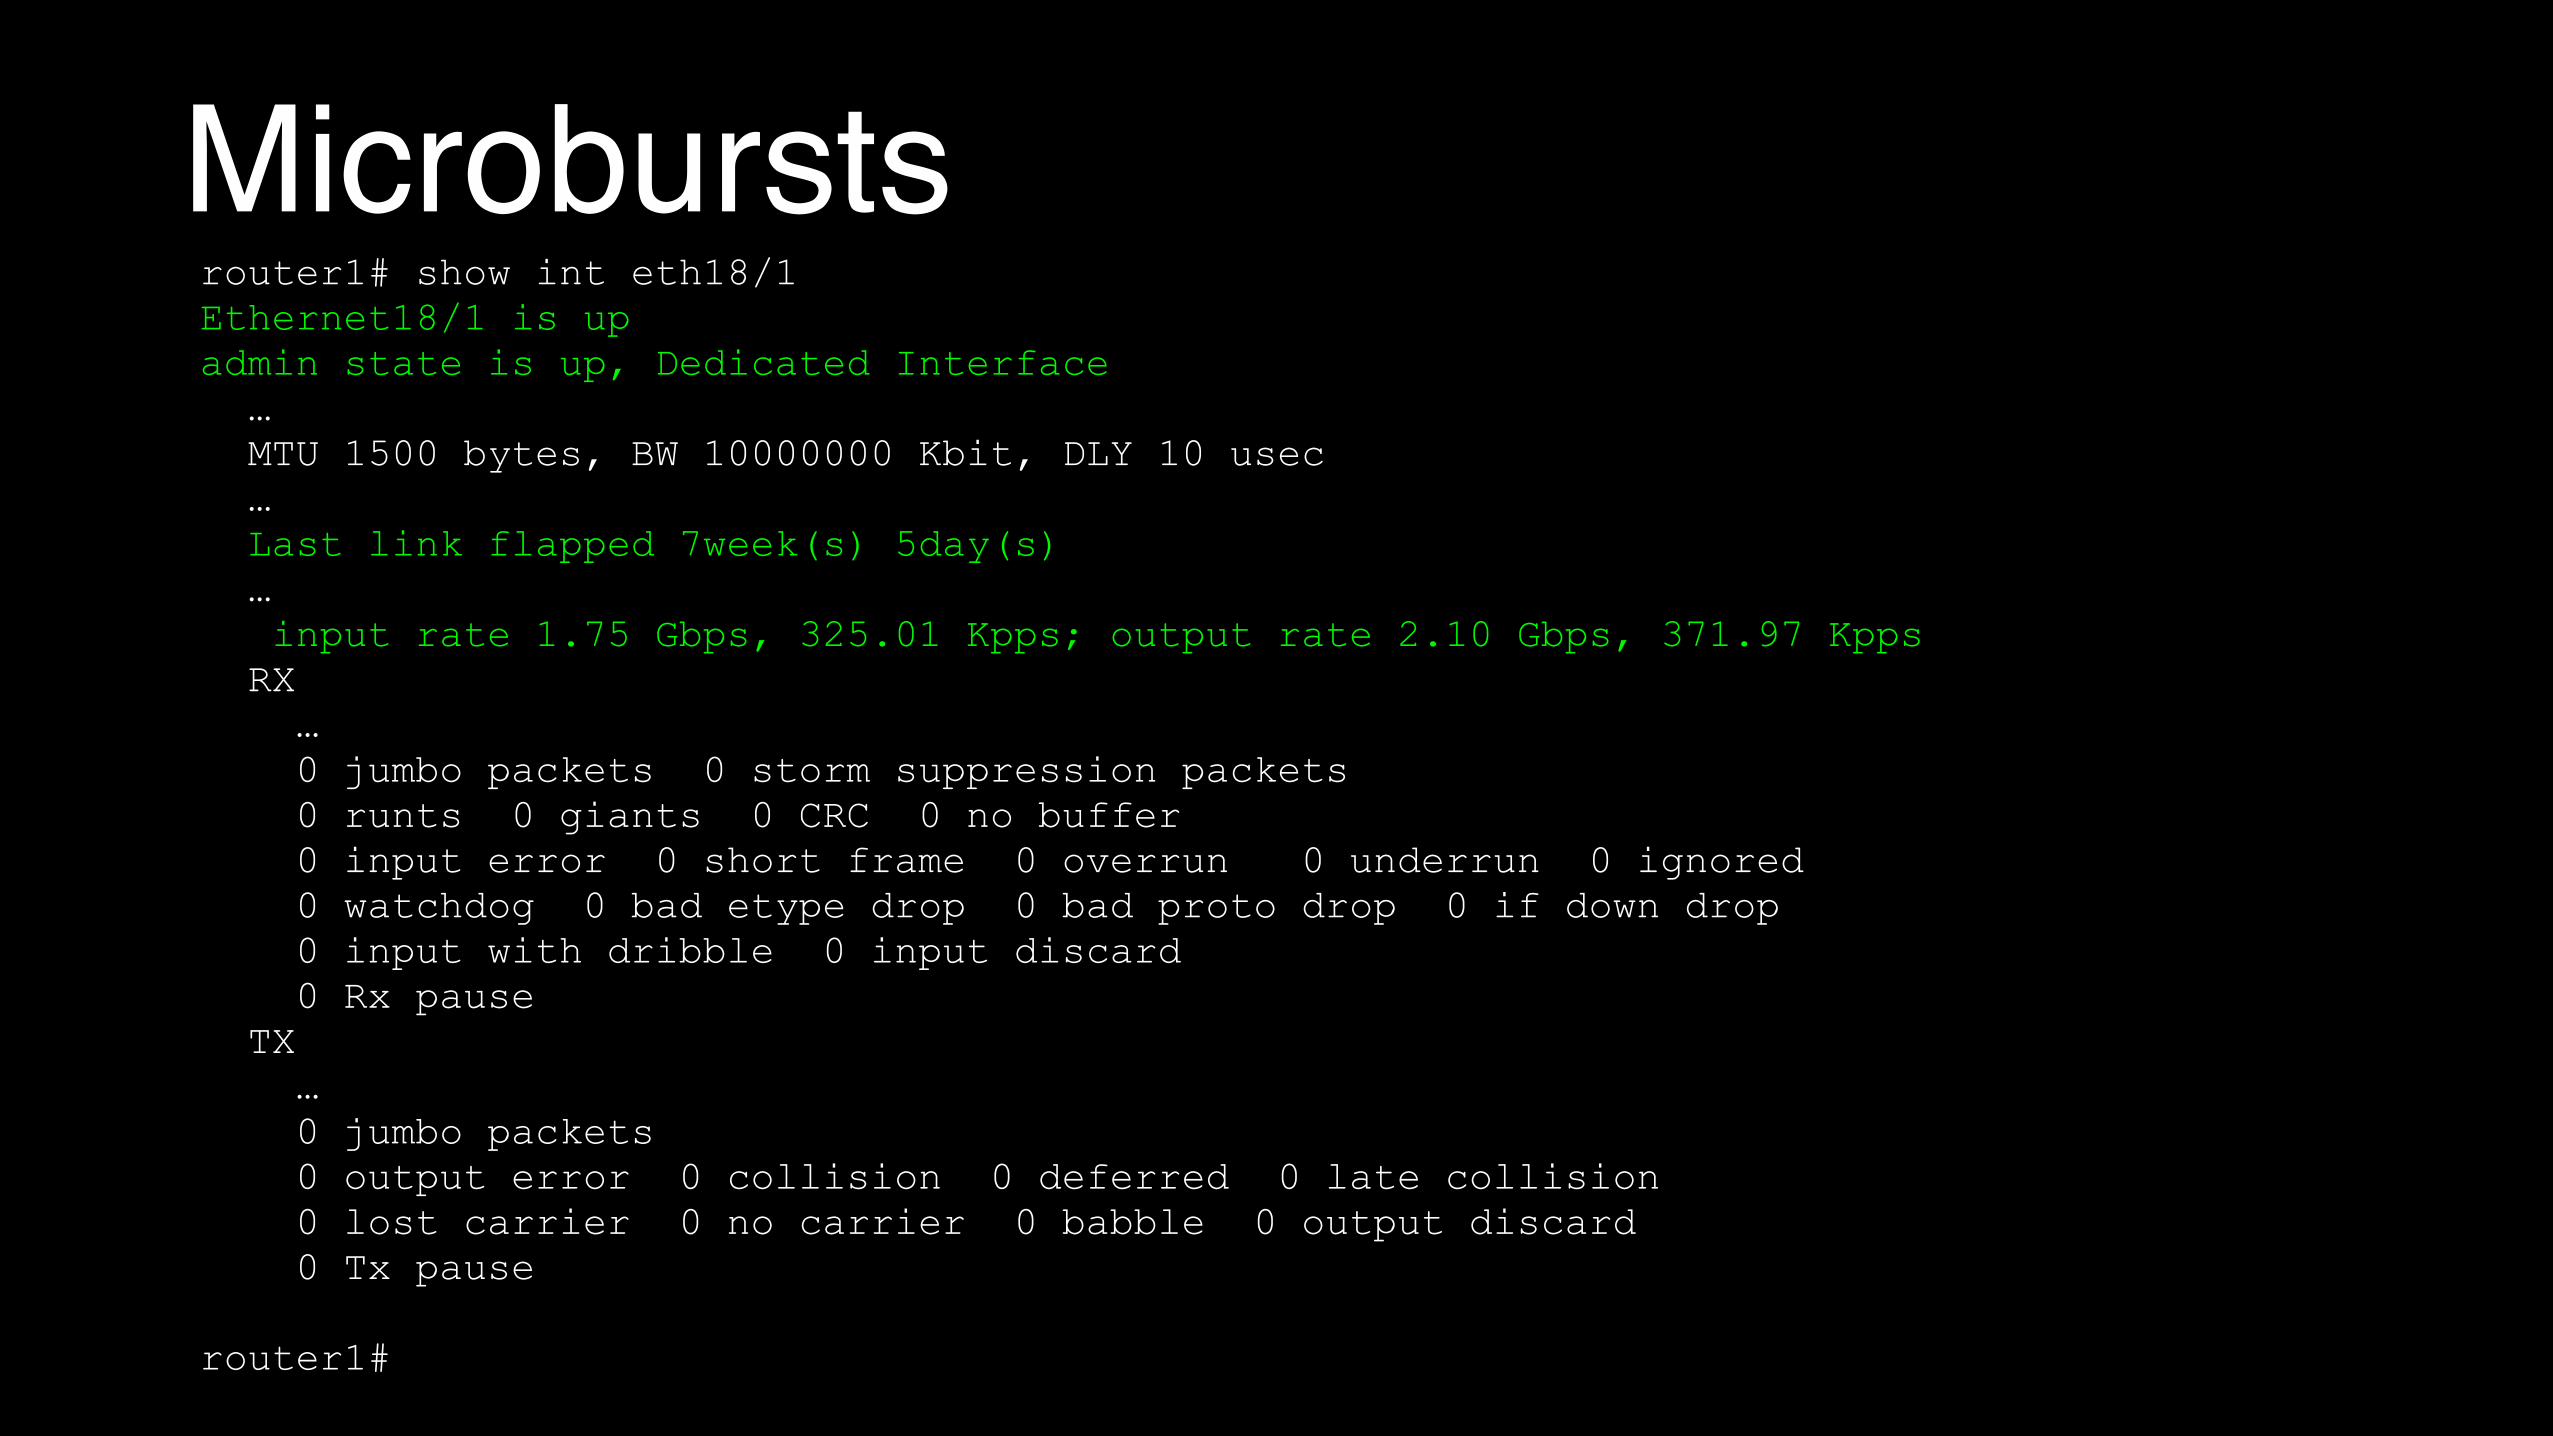
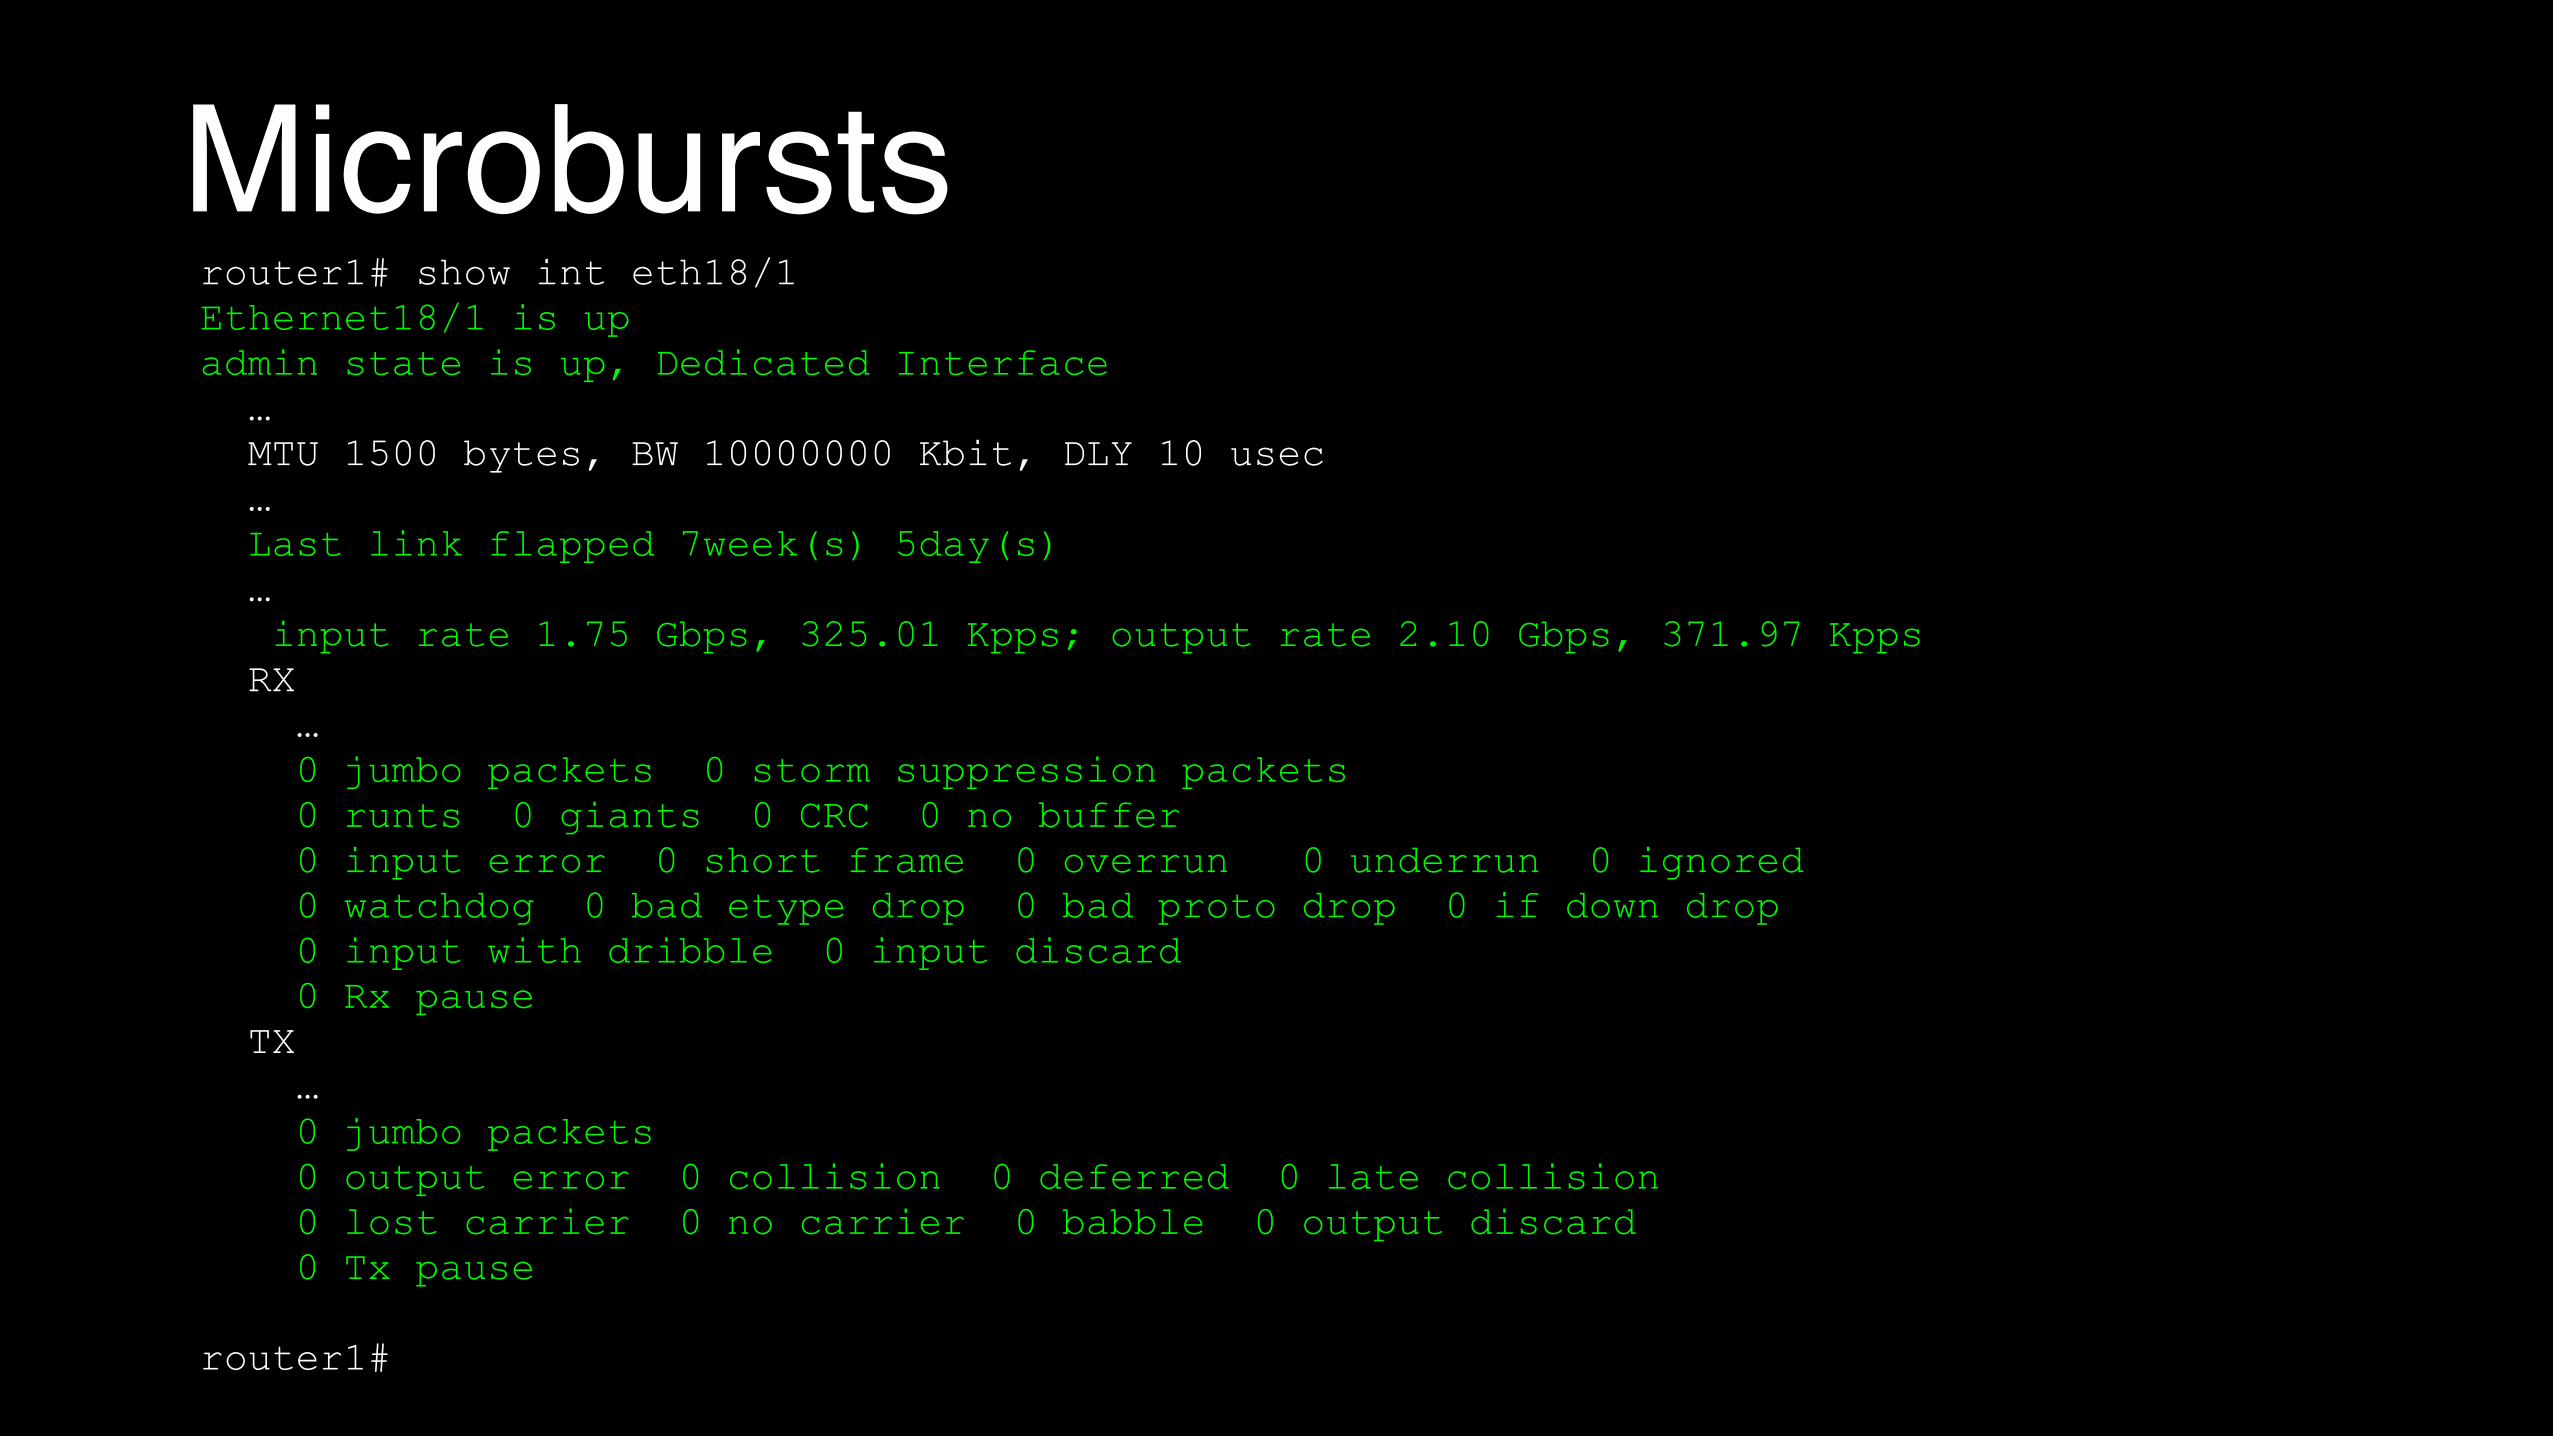
Microburstsrouter1# show int eth18/1 Ethernet18/1 is up admin state is up, Dedicated Interface … MTU 1500 bytes, BW 10000000 Kbit, DLY 10 usec … Last link flapped 7week(s) 5day(s) … input rate 1.75 Gbps, 325.01 Kpps; output rate 2.10 Gbps, 371.97 Kpps RX … 0 jumbo packets 0 storm suppression packets 0 runts 0 giants 0 CRC 0 no buffer 0 input error 0 short frame 0 overrun 0 underrun 0 ignored 0 watchdog 0 bad etype drop 0 bad proto drop 0 if down drop 0 input with dribble 0 input discard 0 Rx pause TX … 0 jumbo packets 0 output error 0 collision 0 deferred 0 late collision 0 lost carrier 0 no carrier 0 babble 0 output discard 0 Tx pause
router1#
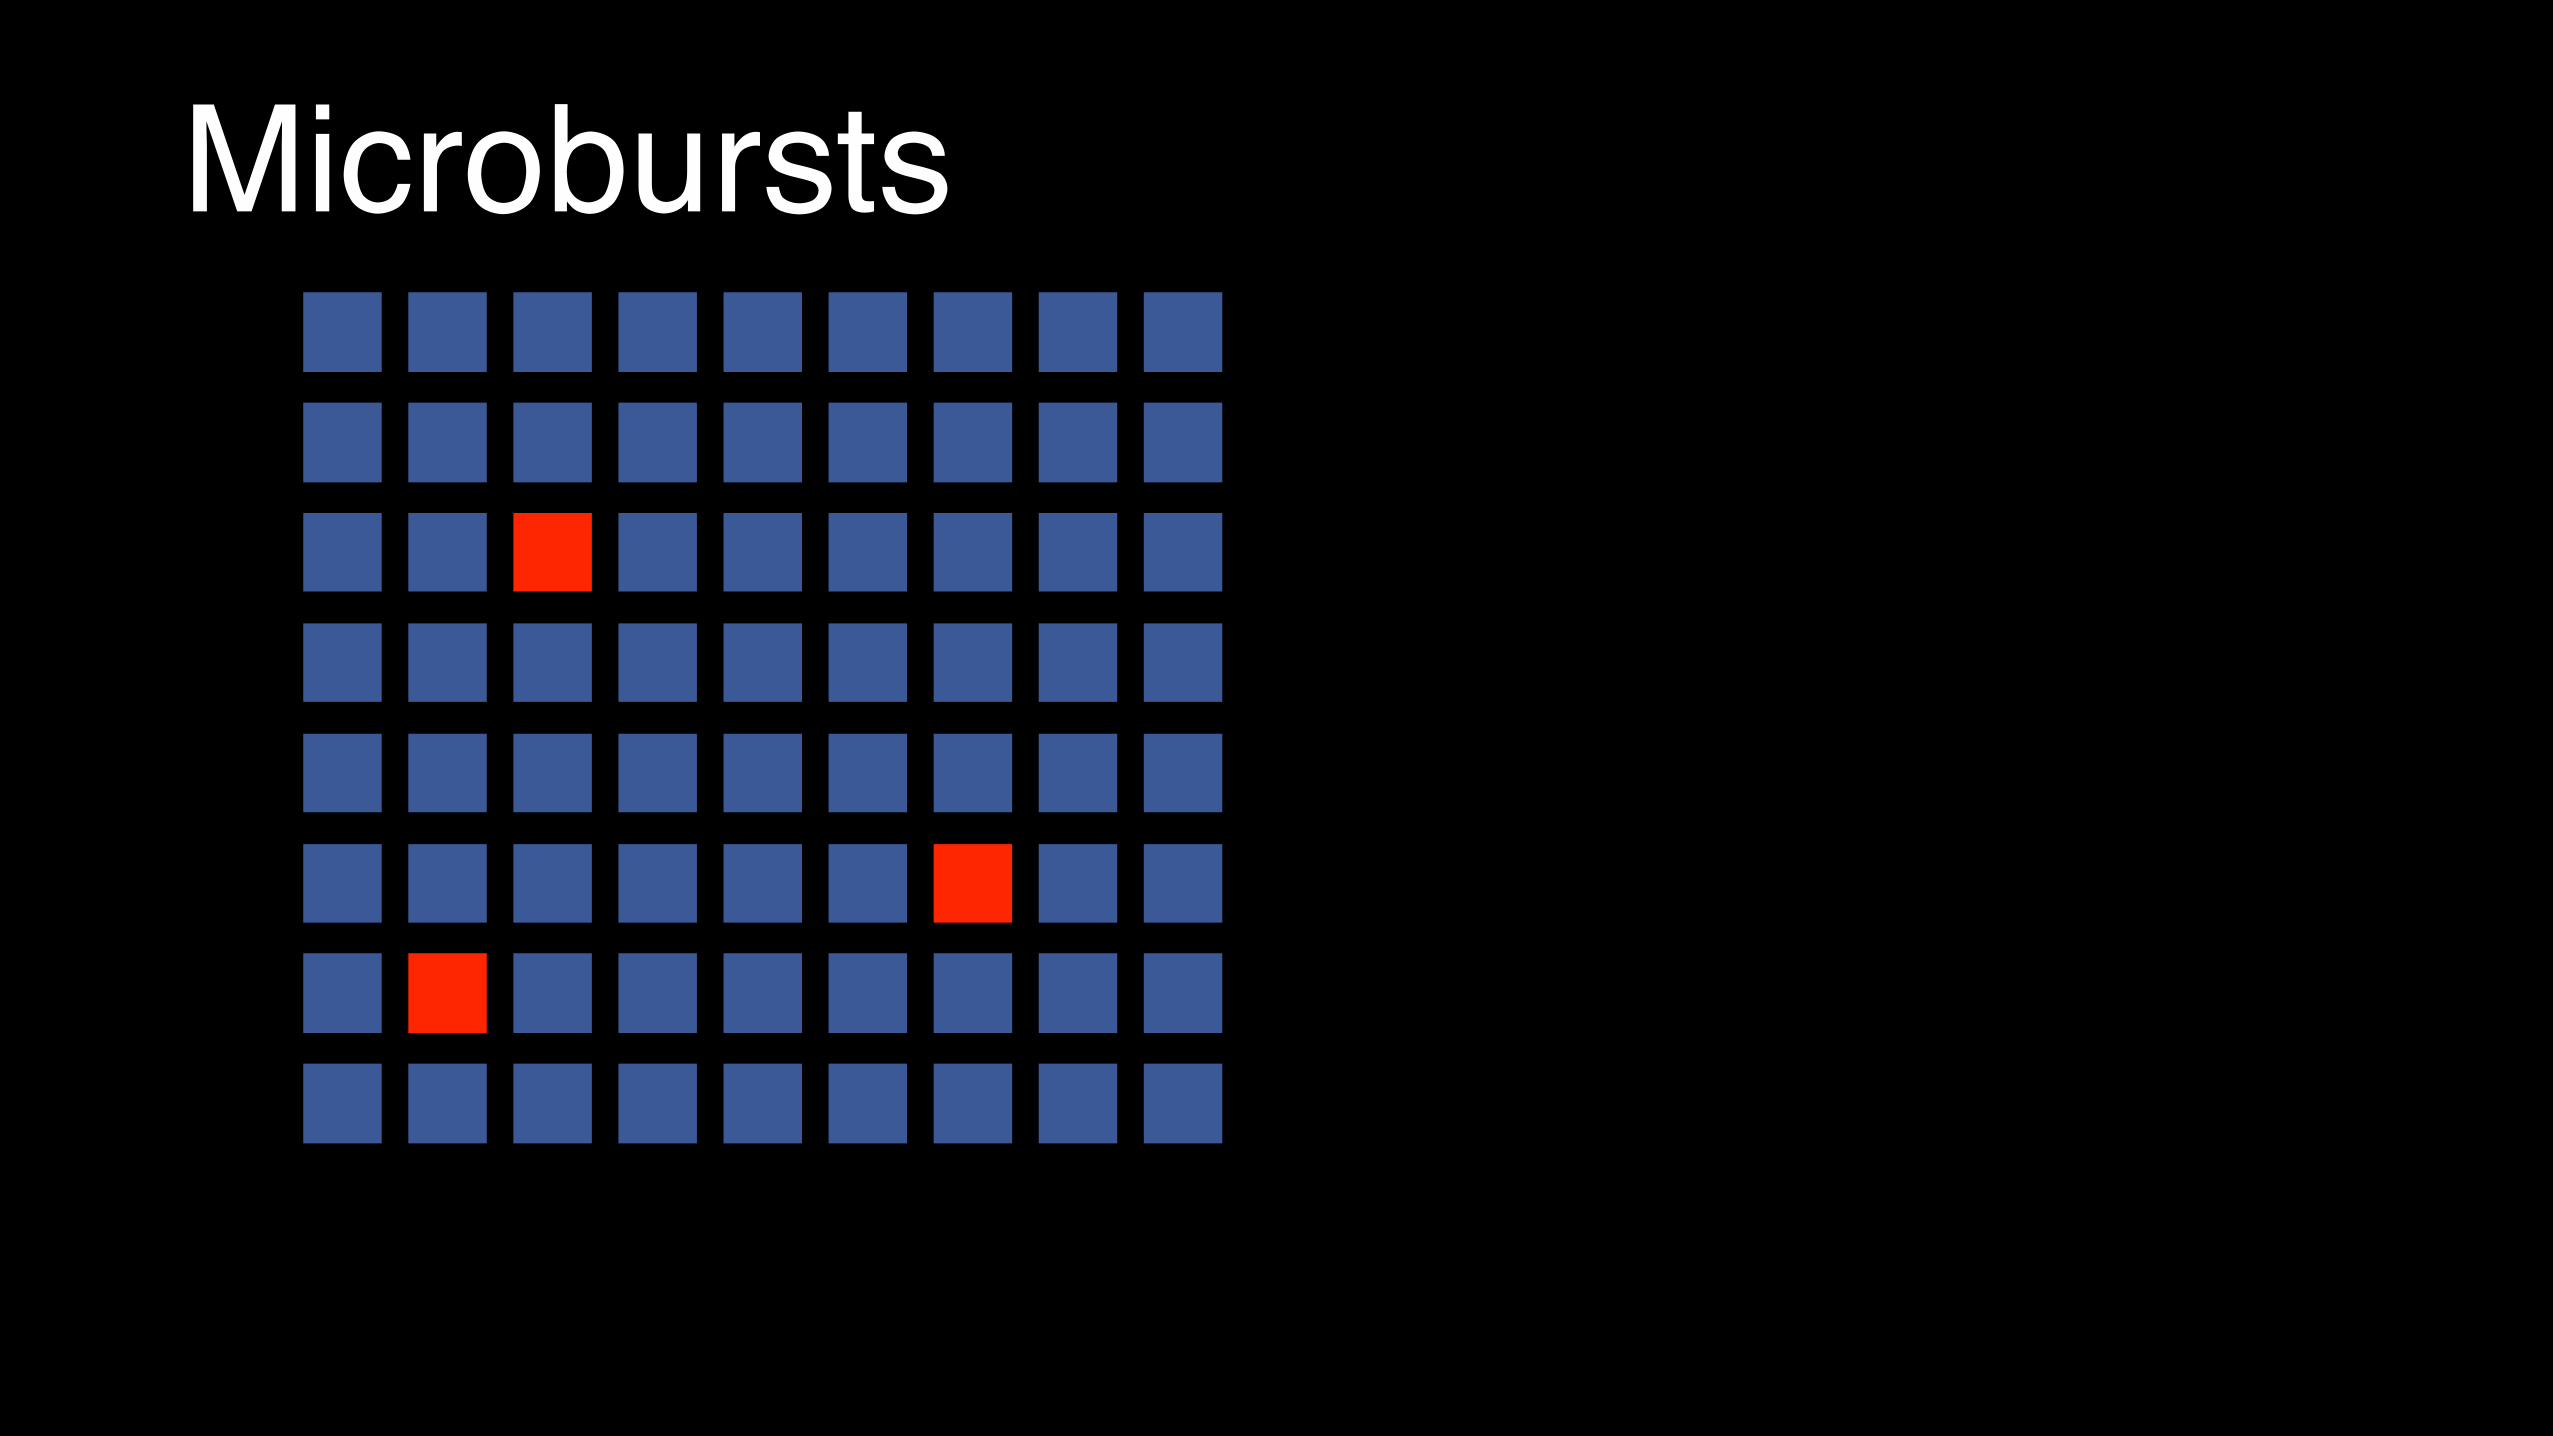
Microbursts
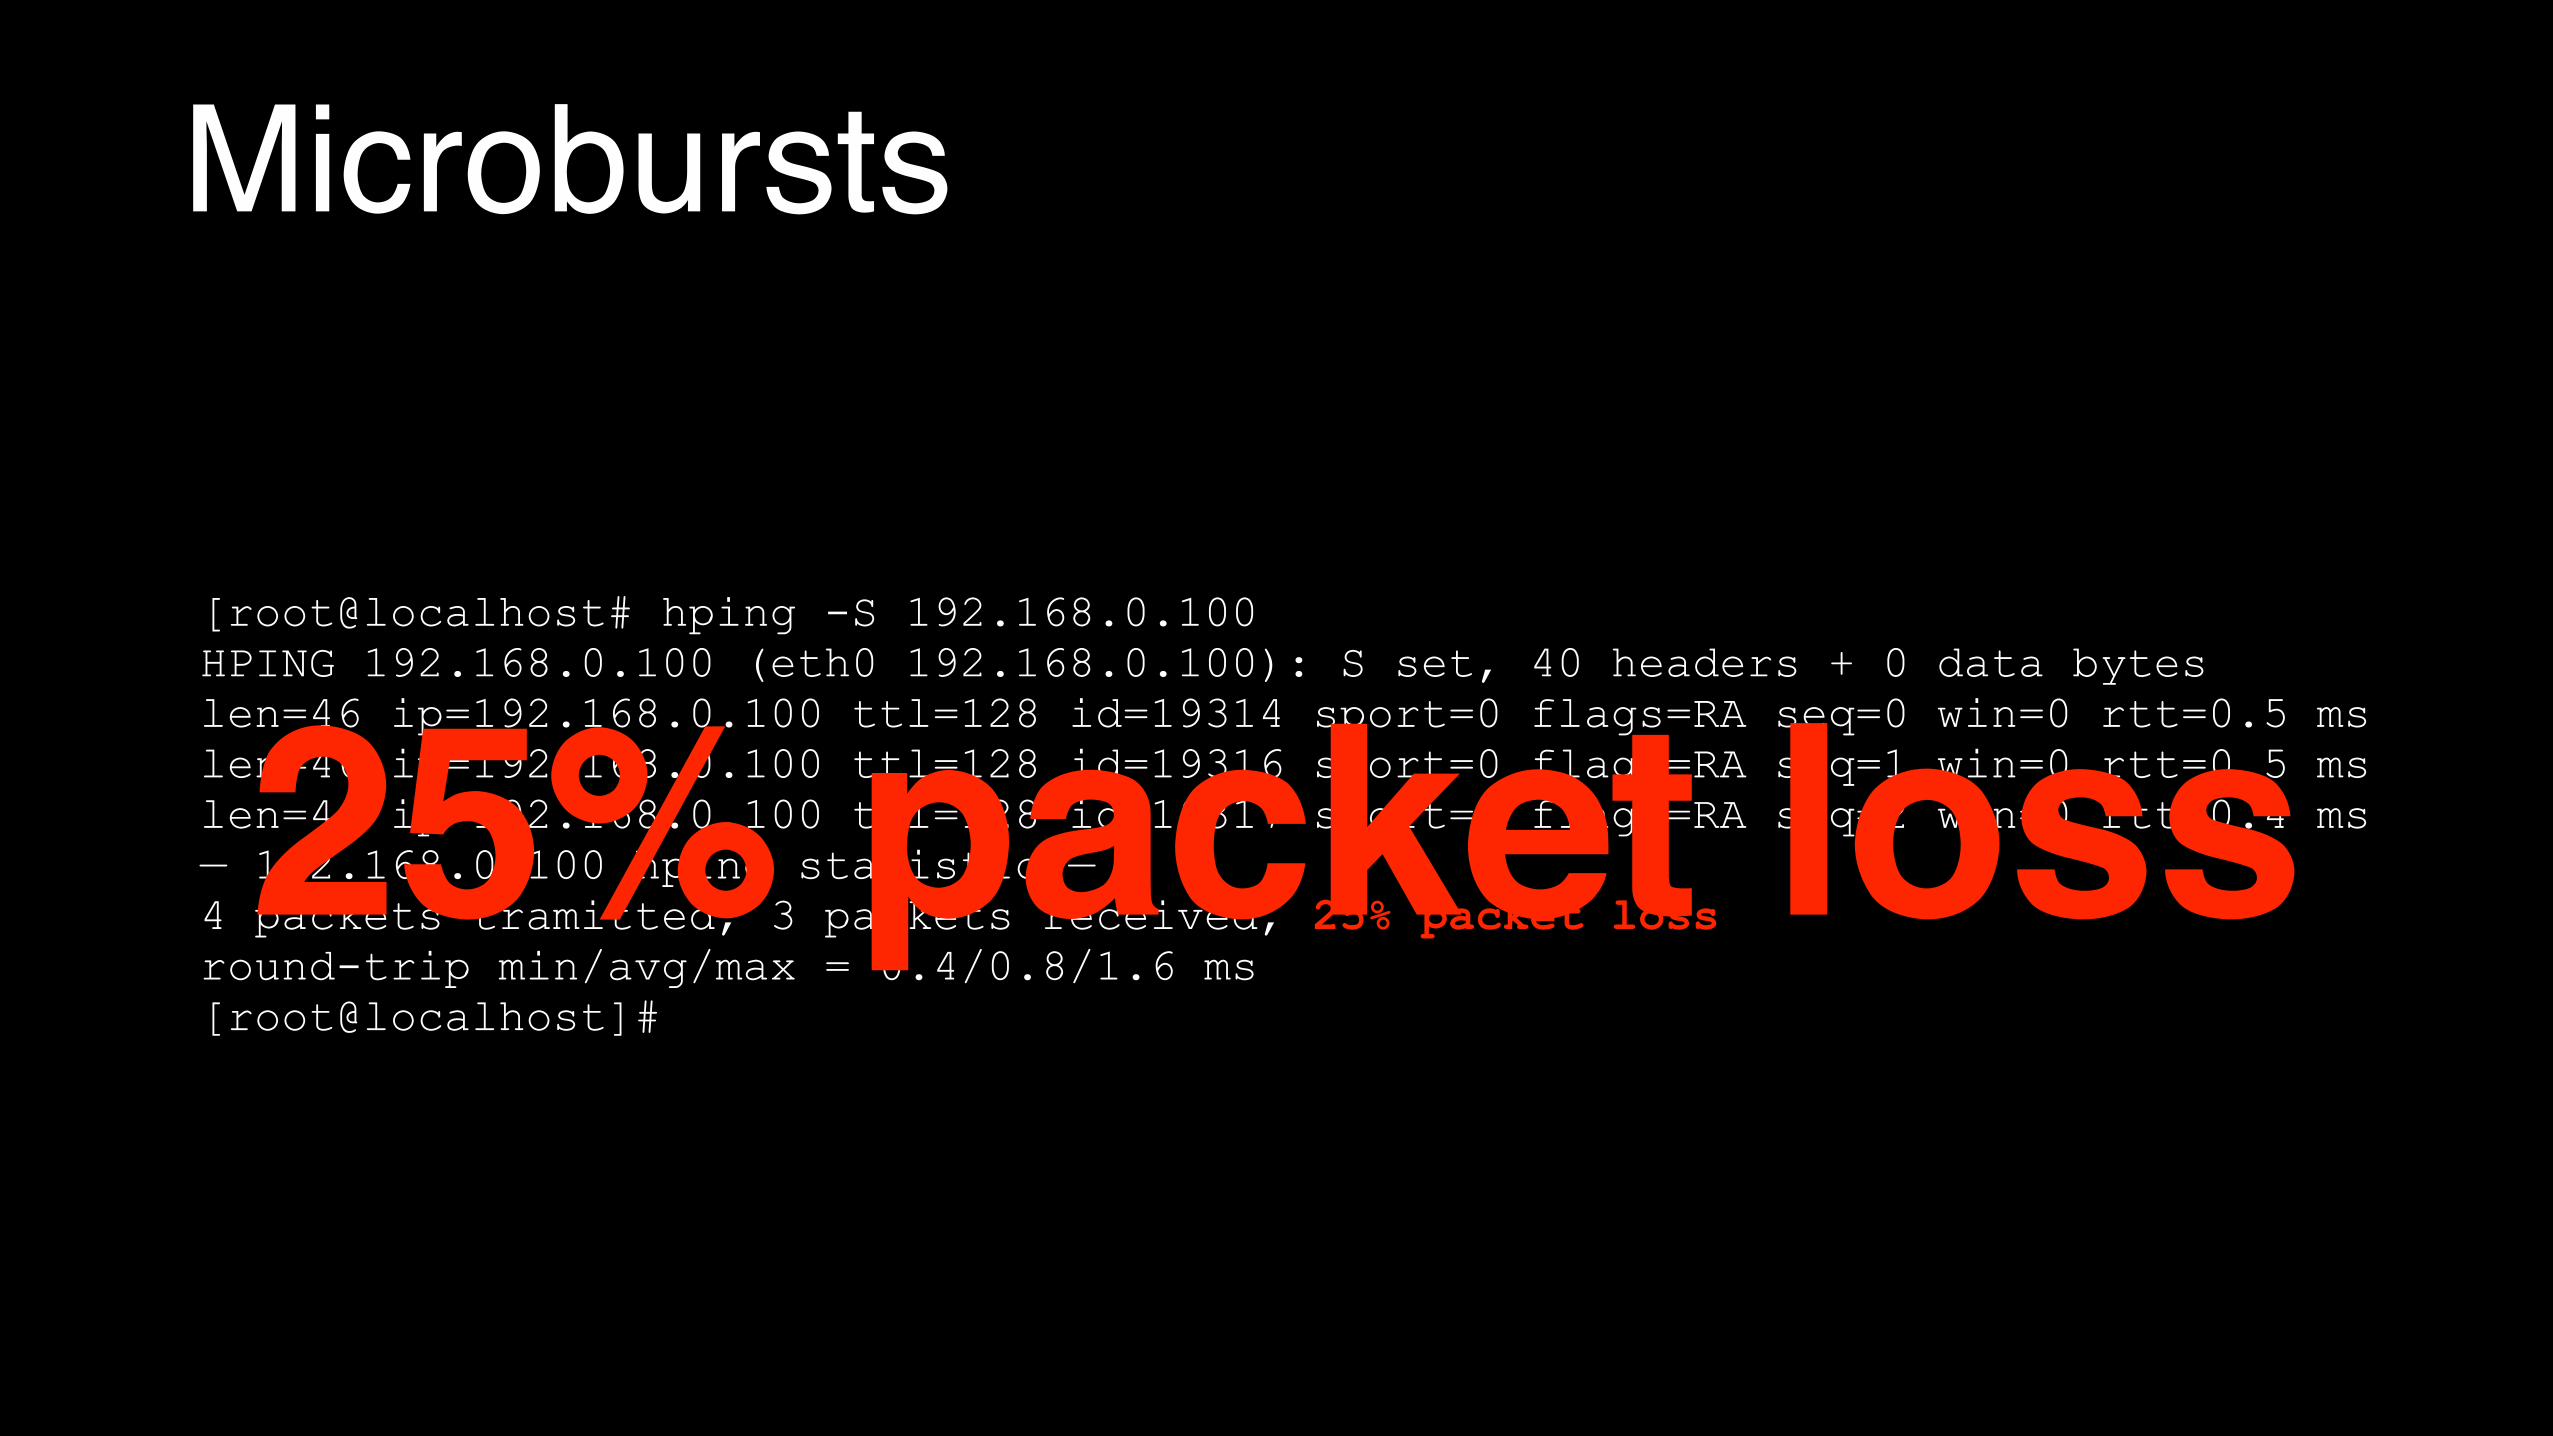
[root@localhost# hping -S 192.168.0.100 HPING 192.168.0.100 (eth0 192.168.0.100): S set, 40 headers + 0 data bytes len=46 ip=192.168.0.100 ttl=128 id=19314 sport=0 flags=RA seq=0 win=0 rtt=0.5 ms len=46 ip=192.168.0.100 ttl=128 id=19316 sport=0 flags=RA seq=1 win=0 rtt=0.5 ms len=46 ip=192.168.0.100 ttl=128 id=19317 sport=0 flags=RA seq=2 win=0 rtt=0.4 ms — 192.168.0.100 hping statistic — 4 packets tramitted, 3 packets received, 25% packet loss round-trip min/avg/max = 0.4/0.8/1.6 ms [root@localhost]#
25% packet loss
Microbursts
Microbursts

Microbursts
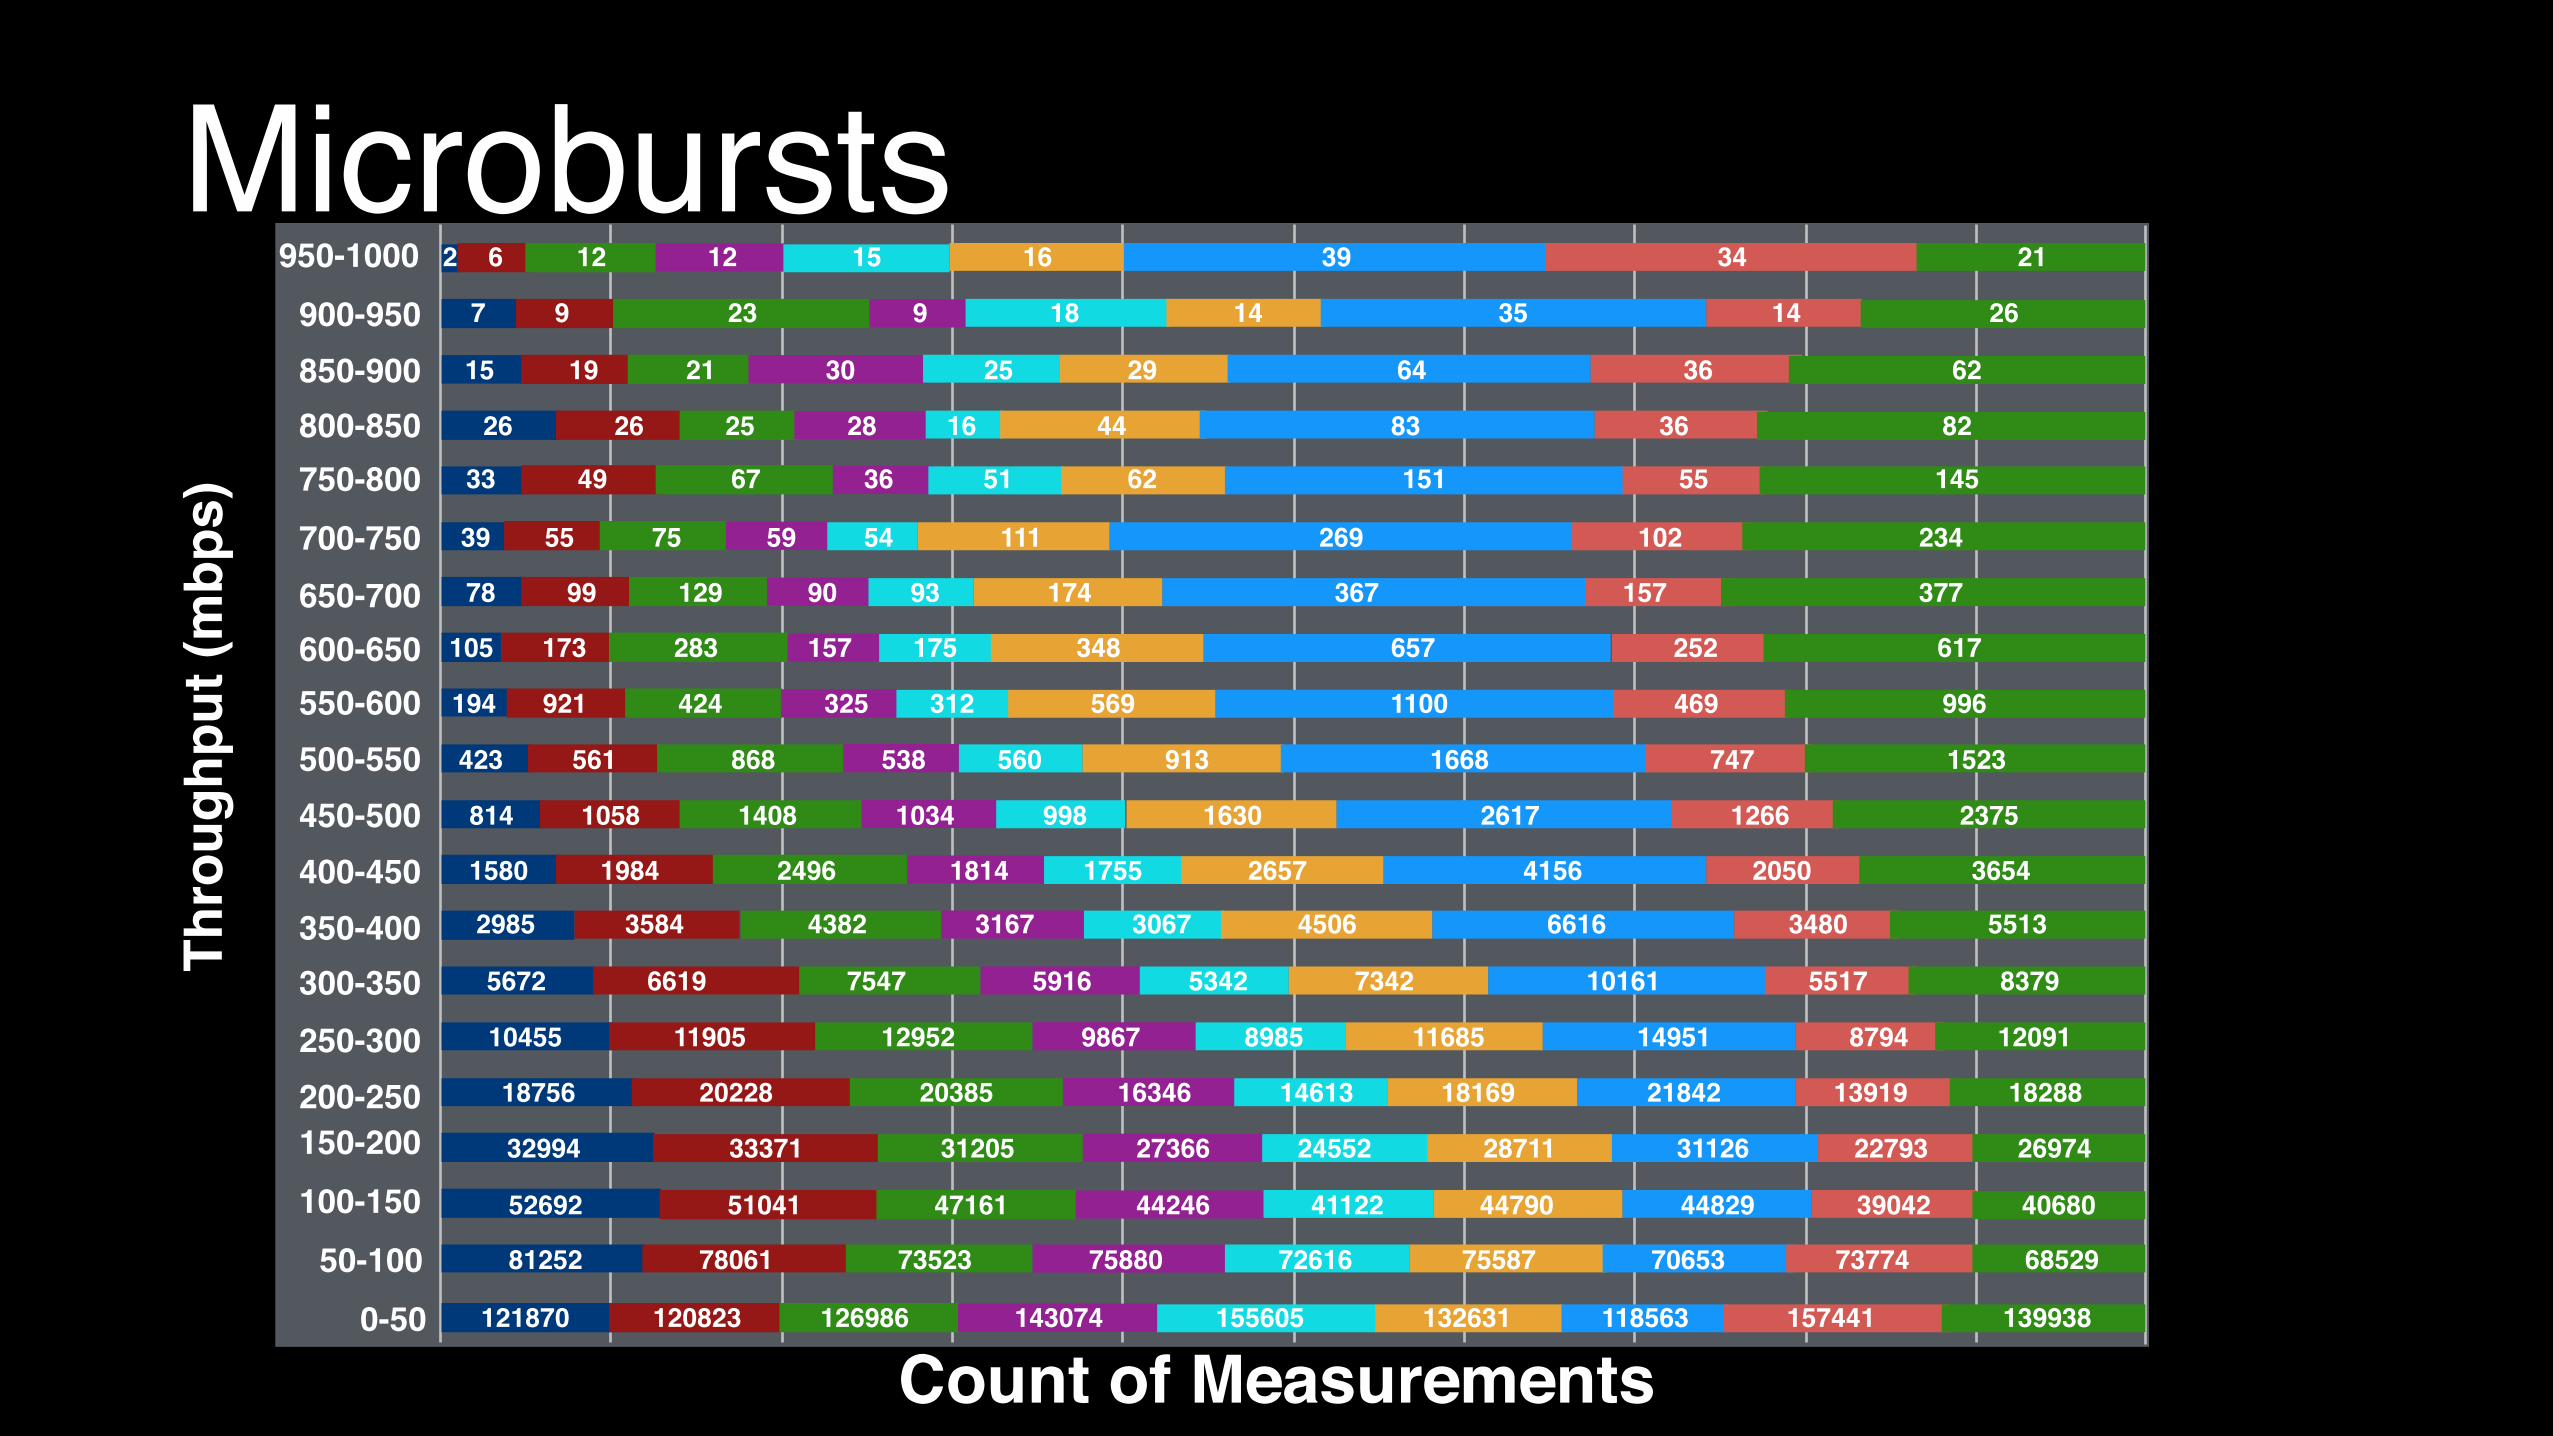
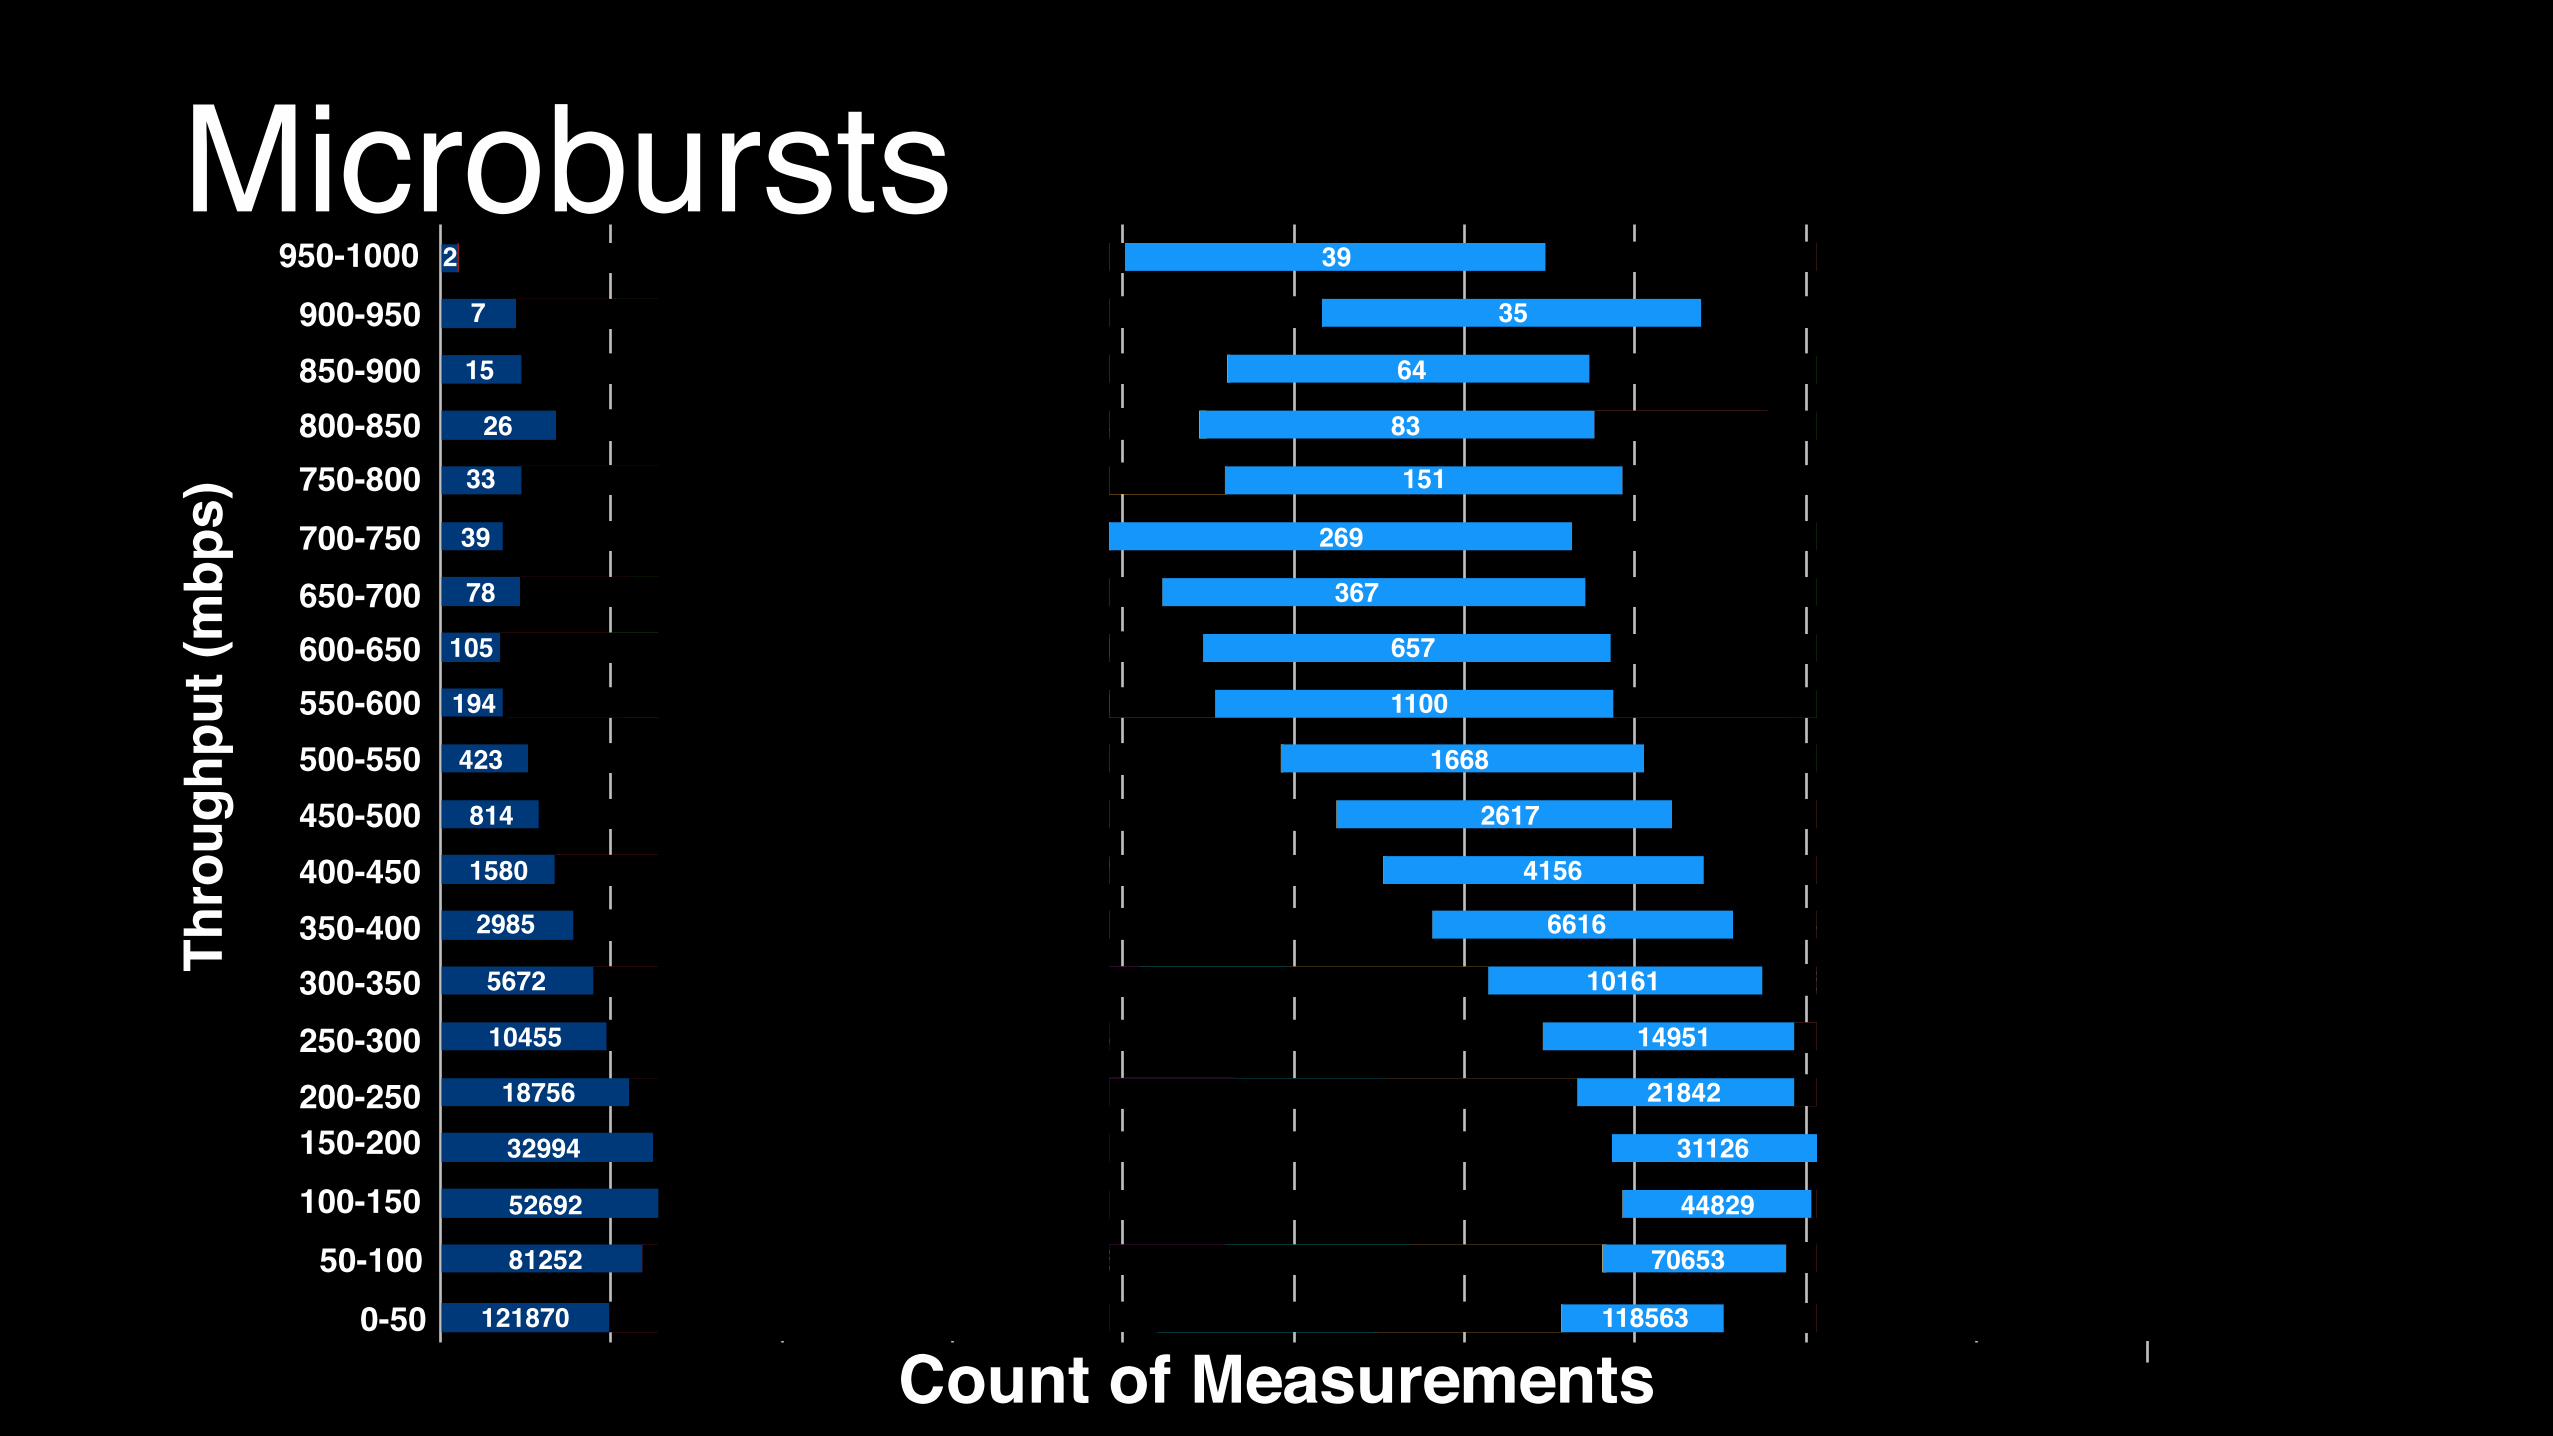
Microbursts2
7
15
26
33
39
78
105
194
423
814
1580
2985
5672
10455
18756
32994
52692
81252
121870
6 12 12 15 16 39 34 21
9 23 9 18 14 35 14 26
2119 30 25
25
366429 62
28 16 44 83 36 8226
49 67 36 51 62 151 55 145
23410226911154597555
99 129 90 93 174 367 157 377
617252657348175157283173
921
561
424 325 312 569 1100 469 996
15237471668913560538868
1058 1408 1034 998 1630 2617 1266 2375
2050415626571755181424961984
3584 4382 3167 3067 4506 6616 3480
3654
5513
837955171016173425342591675476619
11905 12952 9867 8985 11685 14951 8794 12091
20228 20385 16346 14613 18169 21842 13919 18288
2697422793311262871124552273663120533371
51041 47161 44246 41122 44790 44829 39042 40680
6852973774706537558772616758807352378061
120823 126986 143074 155605 132631 118563 157441 1399380-5050-100
100-150150-200200-250250-300300-350350-400400-450450-500500-550550-600600-650650-700700-750750-800800-850850-900900-950
950-1000Th
roug
hput
(mbp
s)
Count of Measurements
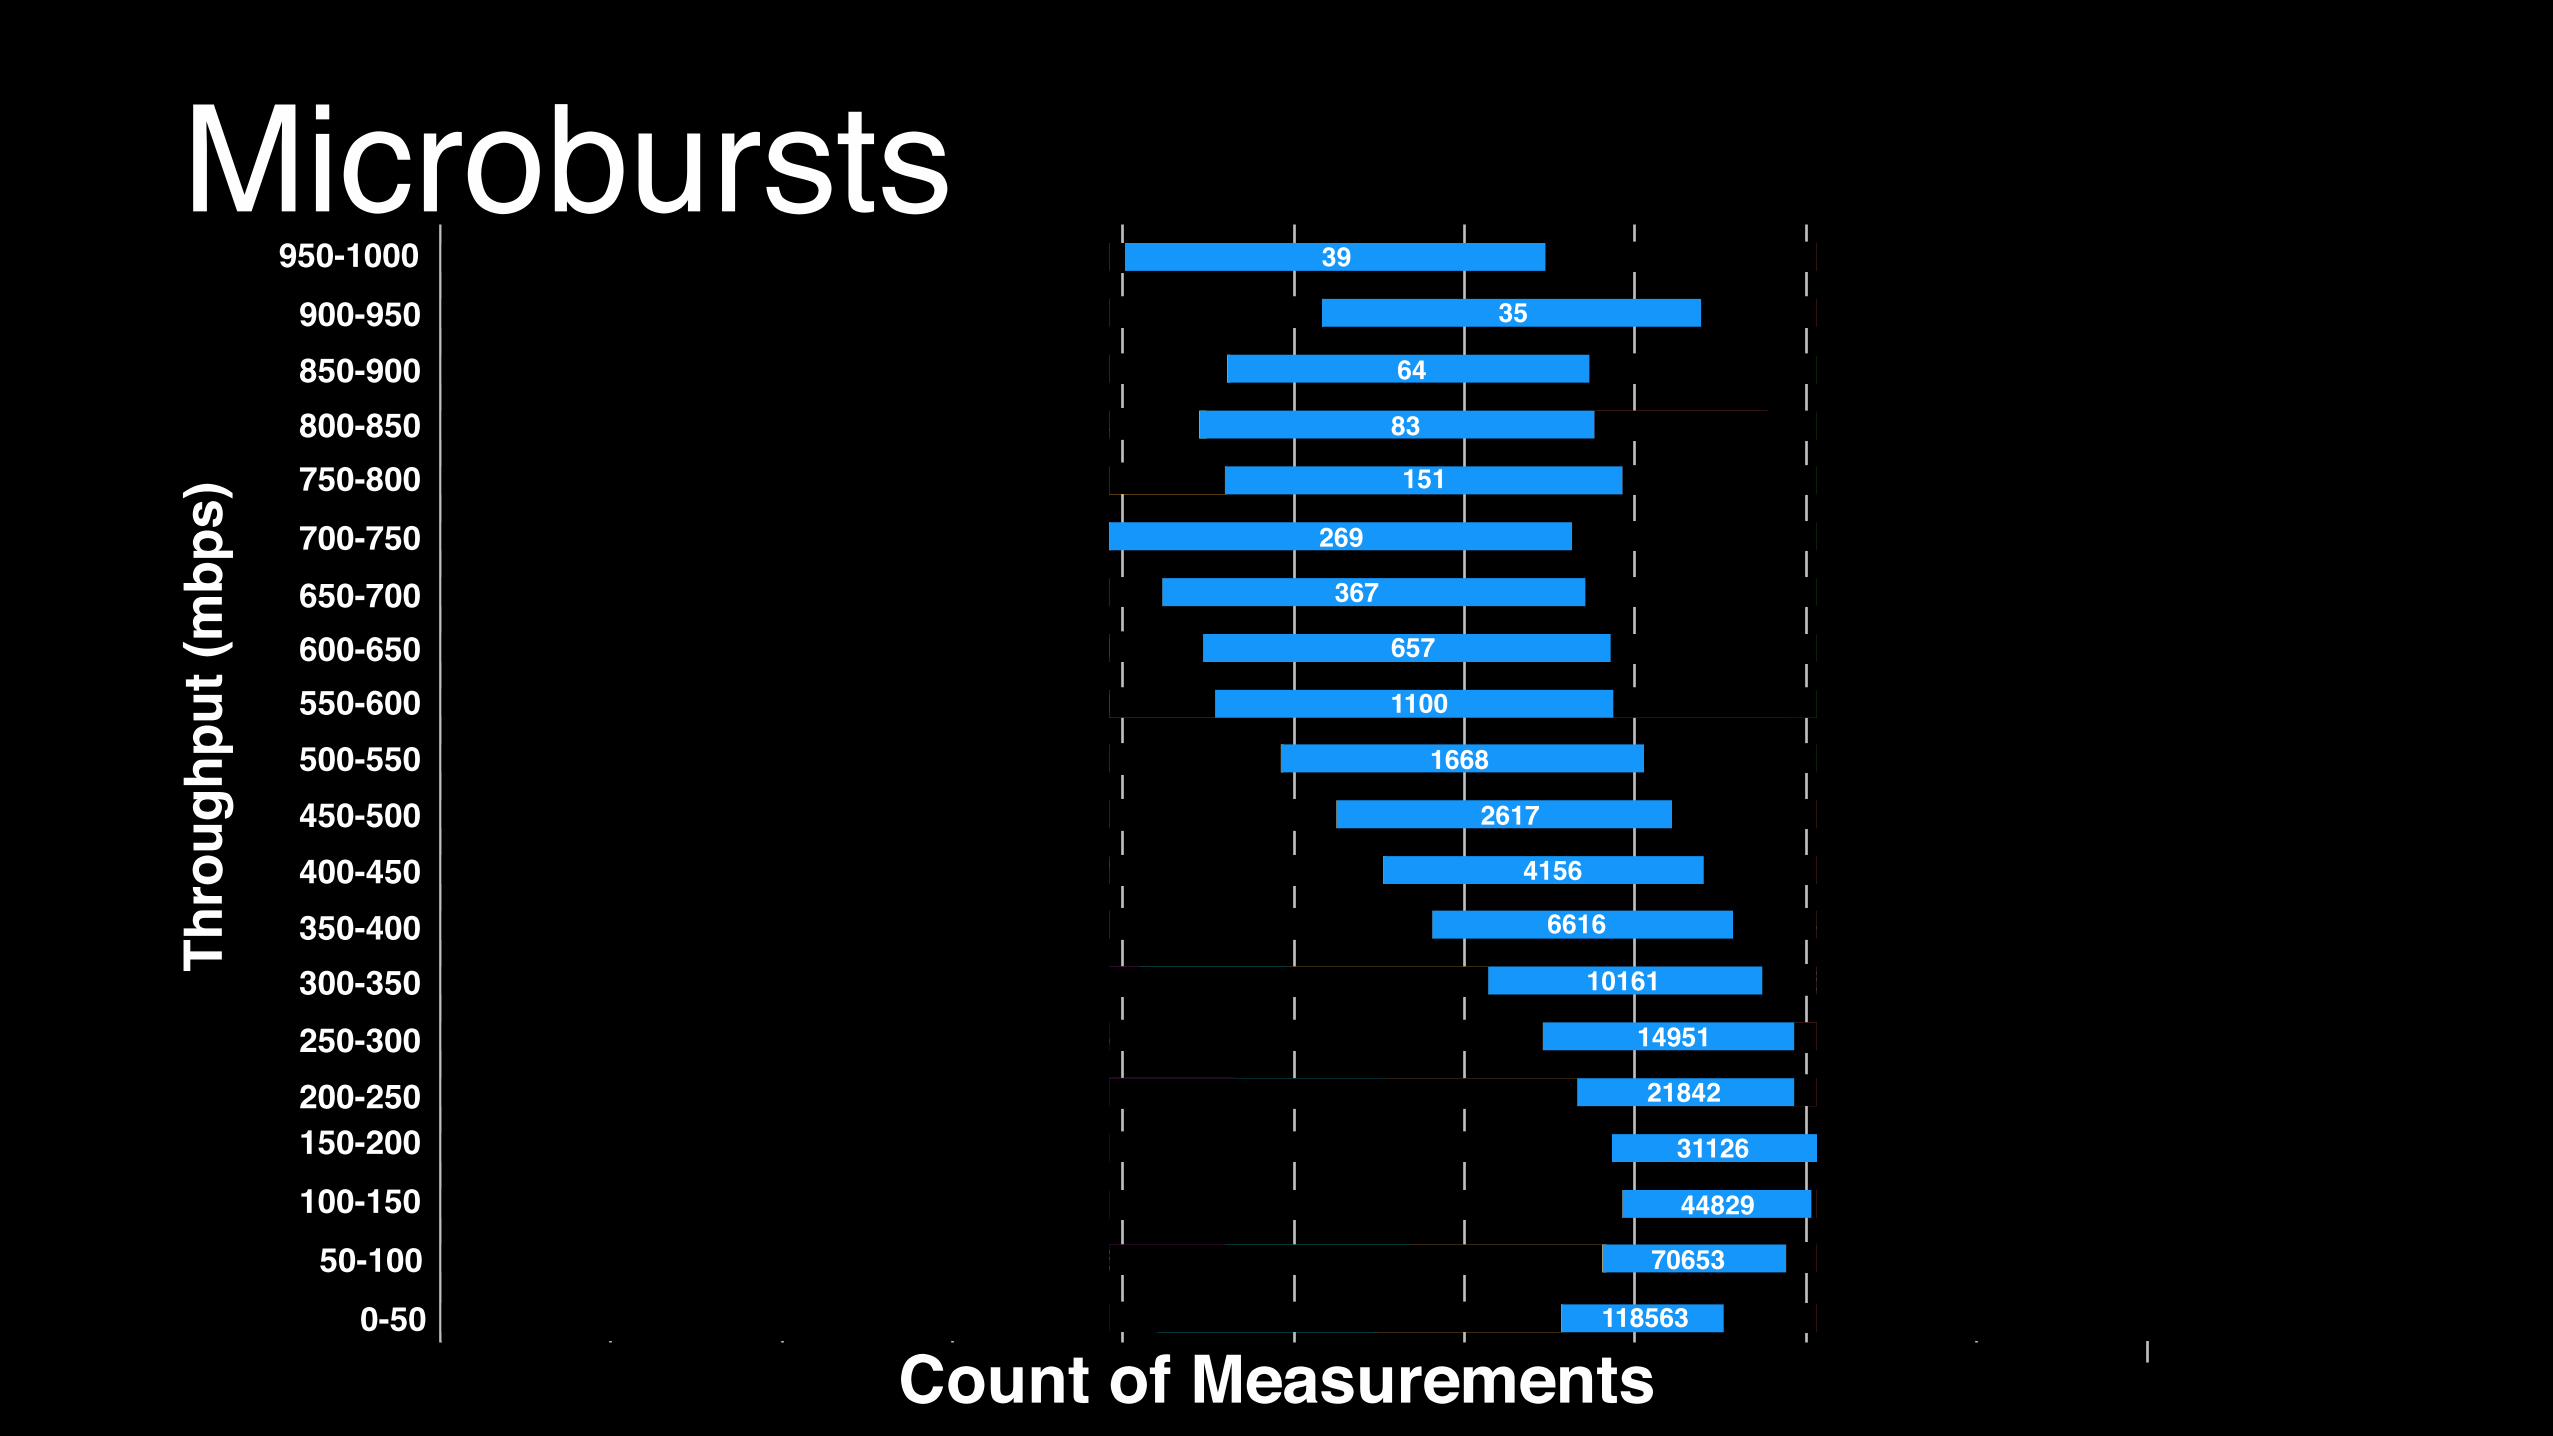
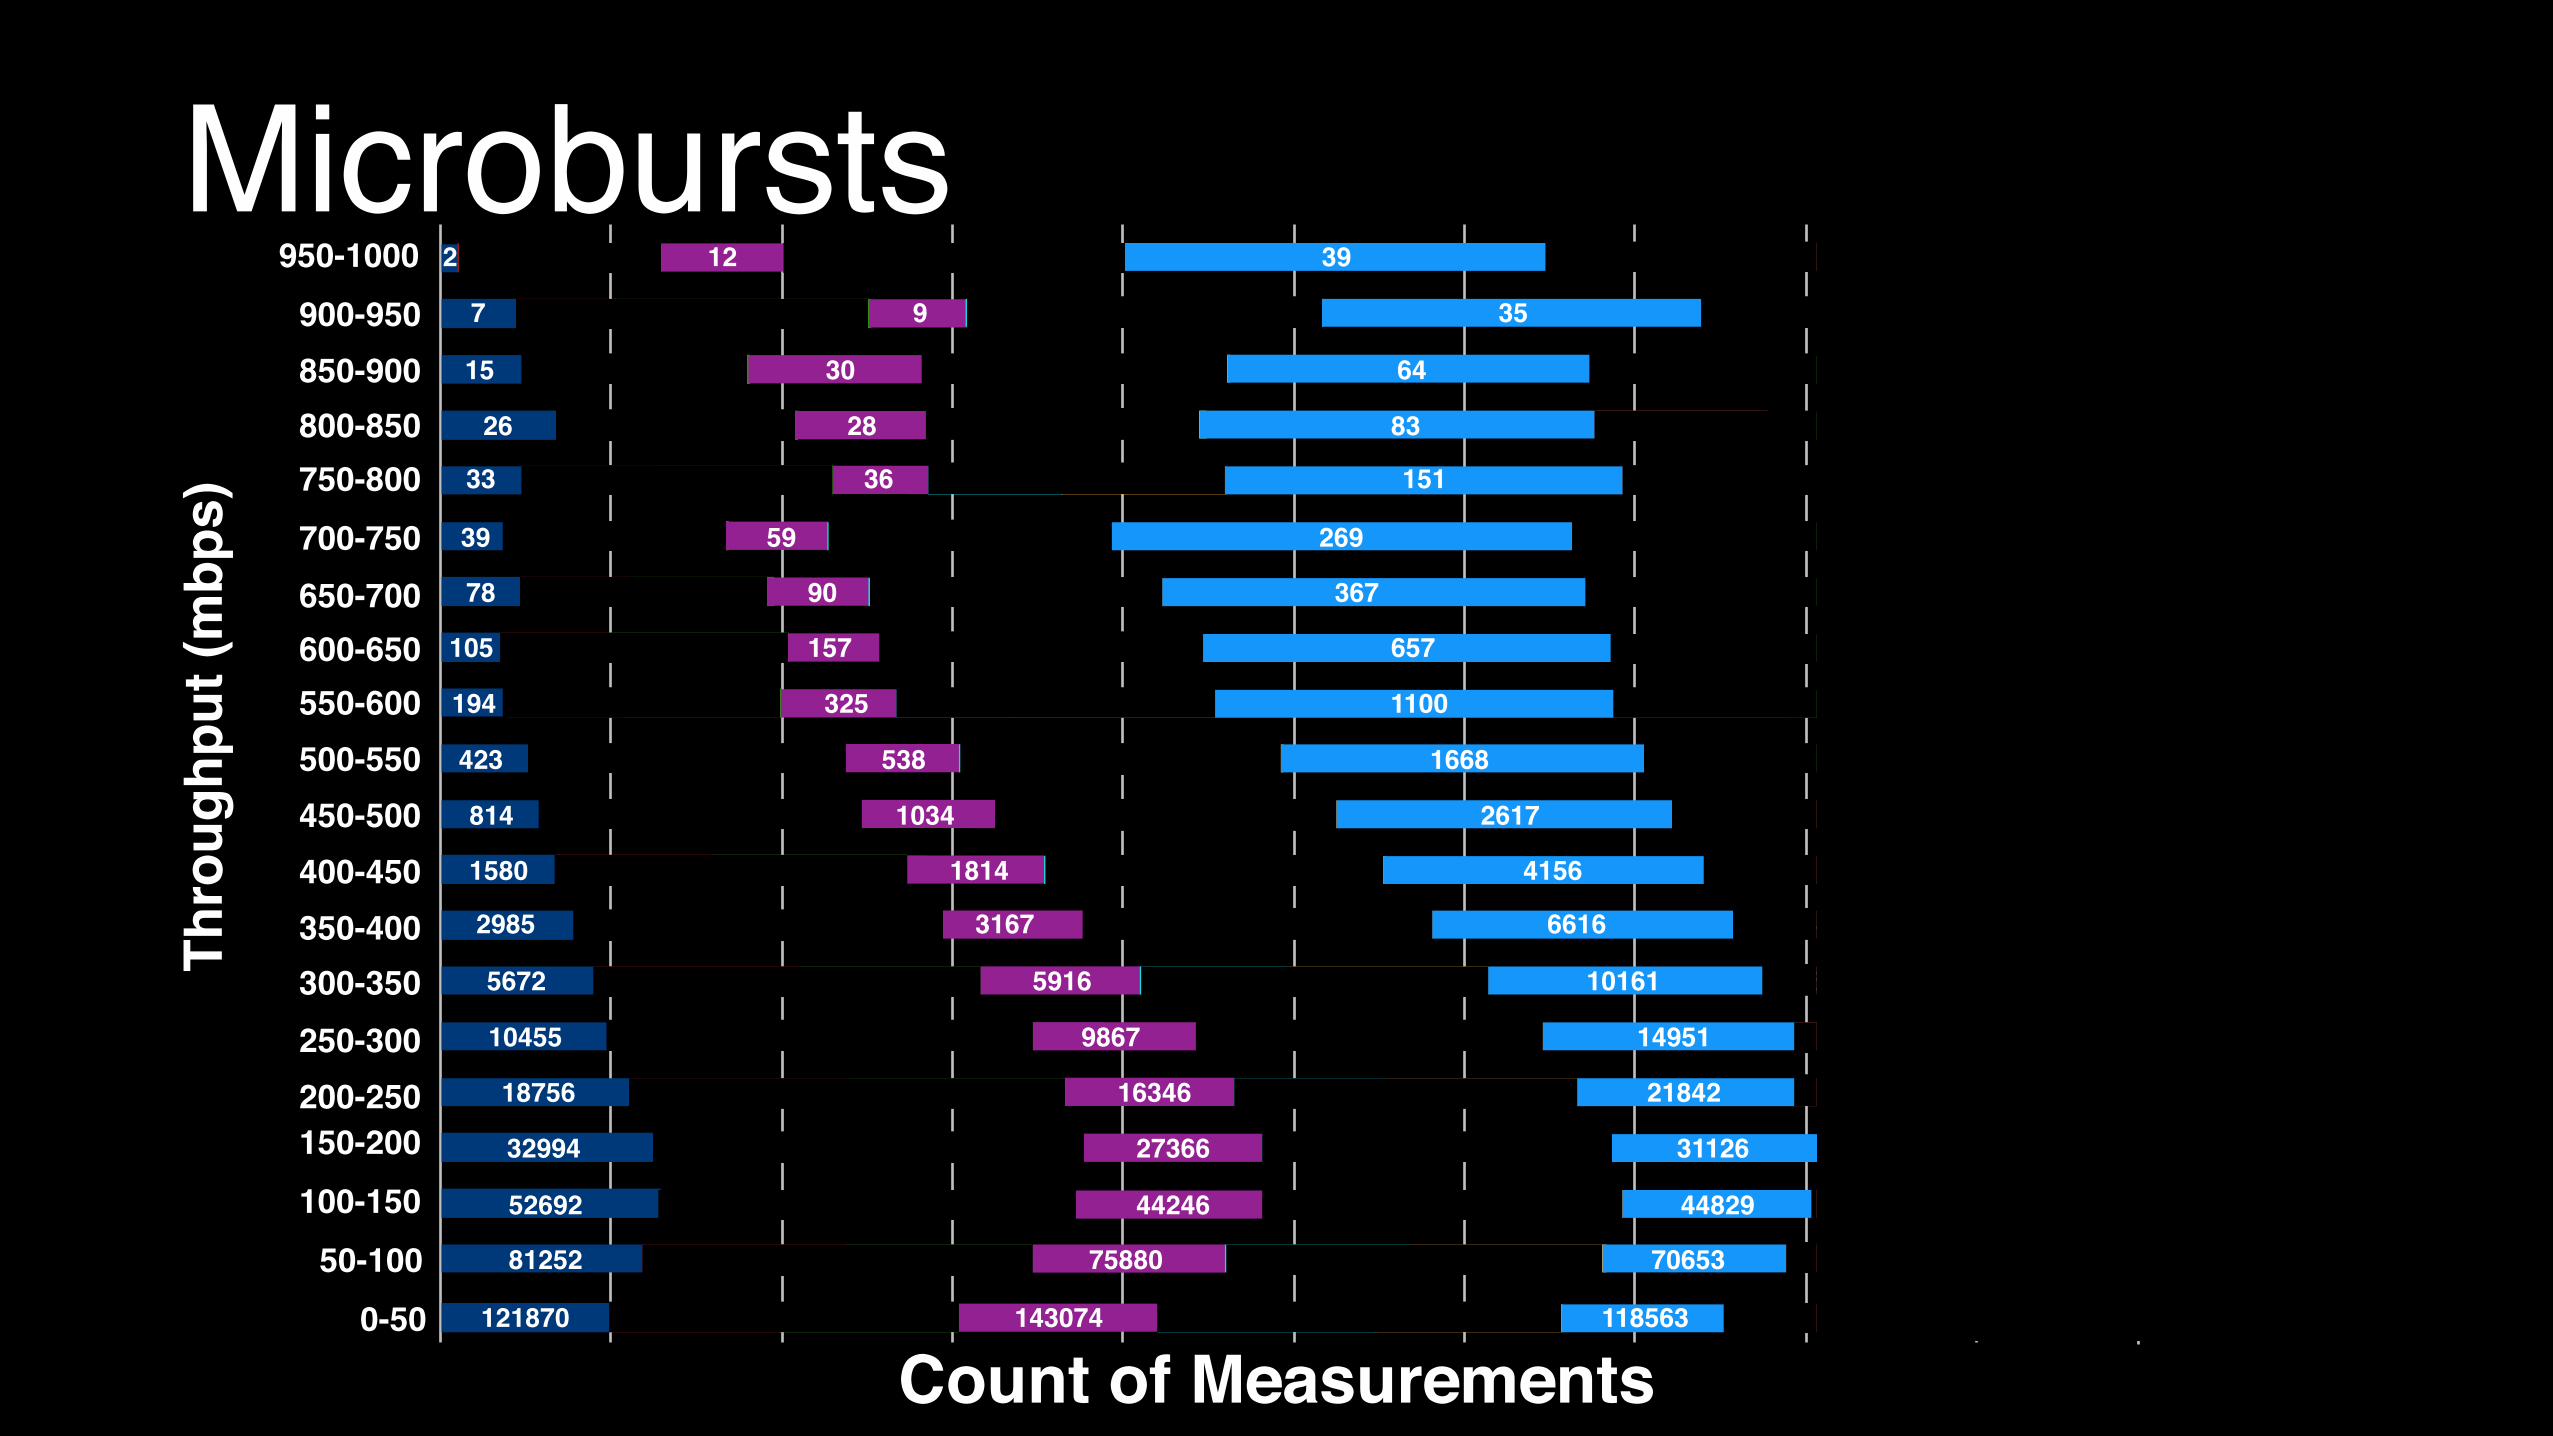
Microbursts2
7
15
26
33
39
78
105
194
423
814
1580
2985
5672
10455
18756
32994
52692
81252
121870
6 12 12 15 16 39 34 21
9 23 9 18 14 35 14 26
2119 30 25
25
366429 62
28 16 44 83 36 8226
49 67 36 51 62 151 55 145
23410226911154597555
99 129 90 93 174 367 157 377
617252657348175157283173
921
561
424 325 312 569 1100 469 996
15237471668913560538868
1058 1408 1034 998 1630 2617 1266 2375
2050415626571755181424961984
3584 4382 3167 3067 4506 6616 3480
3654
5513
837955171016173425342591675476619
11905 12952 9867 8985 11685 14951 8794 12091
20228 20385 16346 14613 18169 21842 13919 18288
2697422793311262871124552273663120533371
51041 47161 44246 41122 44790 44829 39042 40680
6852973774706537558772616758807352378061
120823 126986 143074 155605 132631 118563 157441 1399380-5050-100
100-150150-200200-250250-300300-350350-400400-450450-500500-550550-600600-650650-700700-750750-800800-850850-900900-950
950-1000
Count of Measurements
Thro
ughp
ut (m
bps)
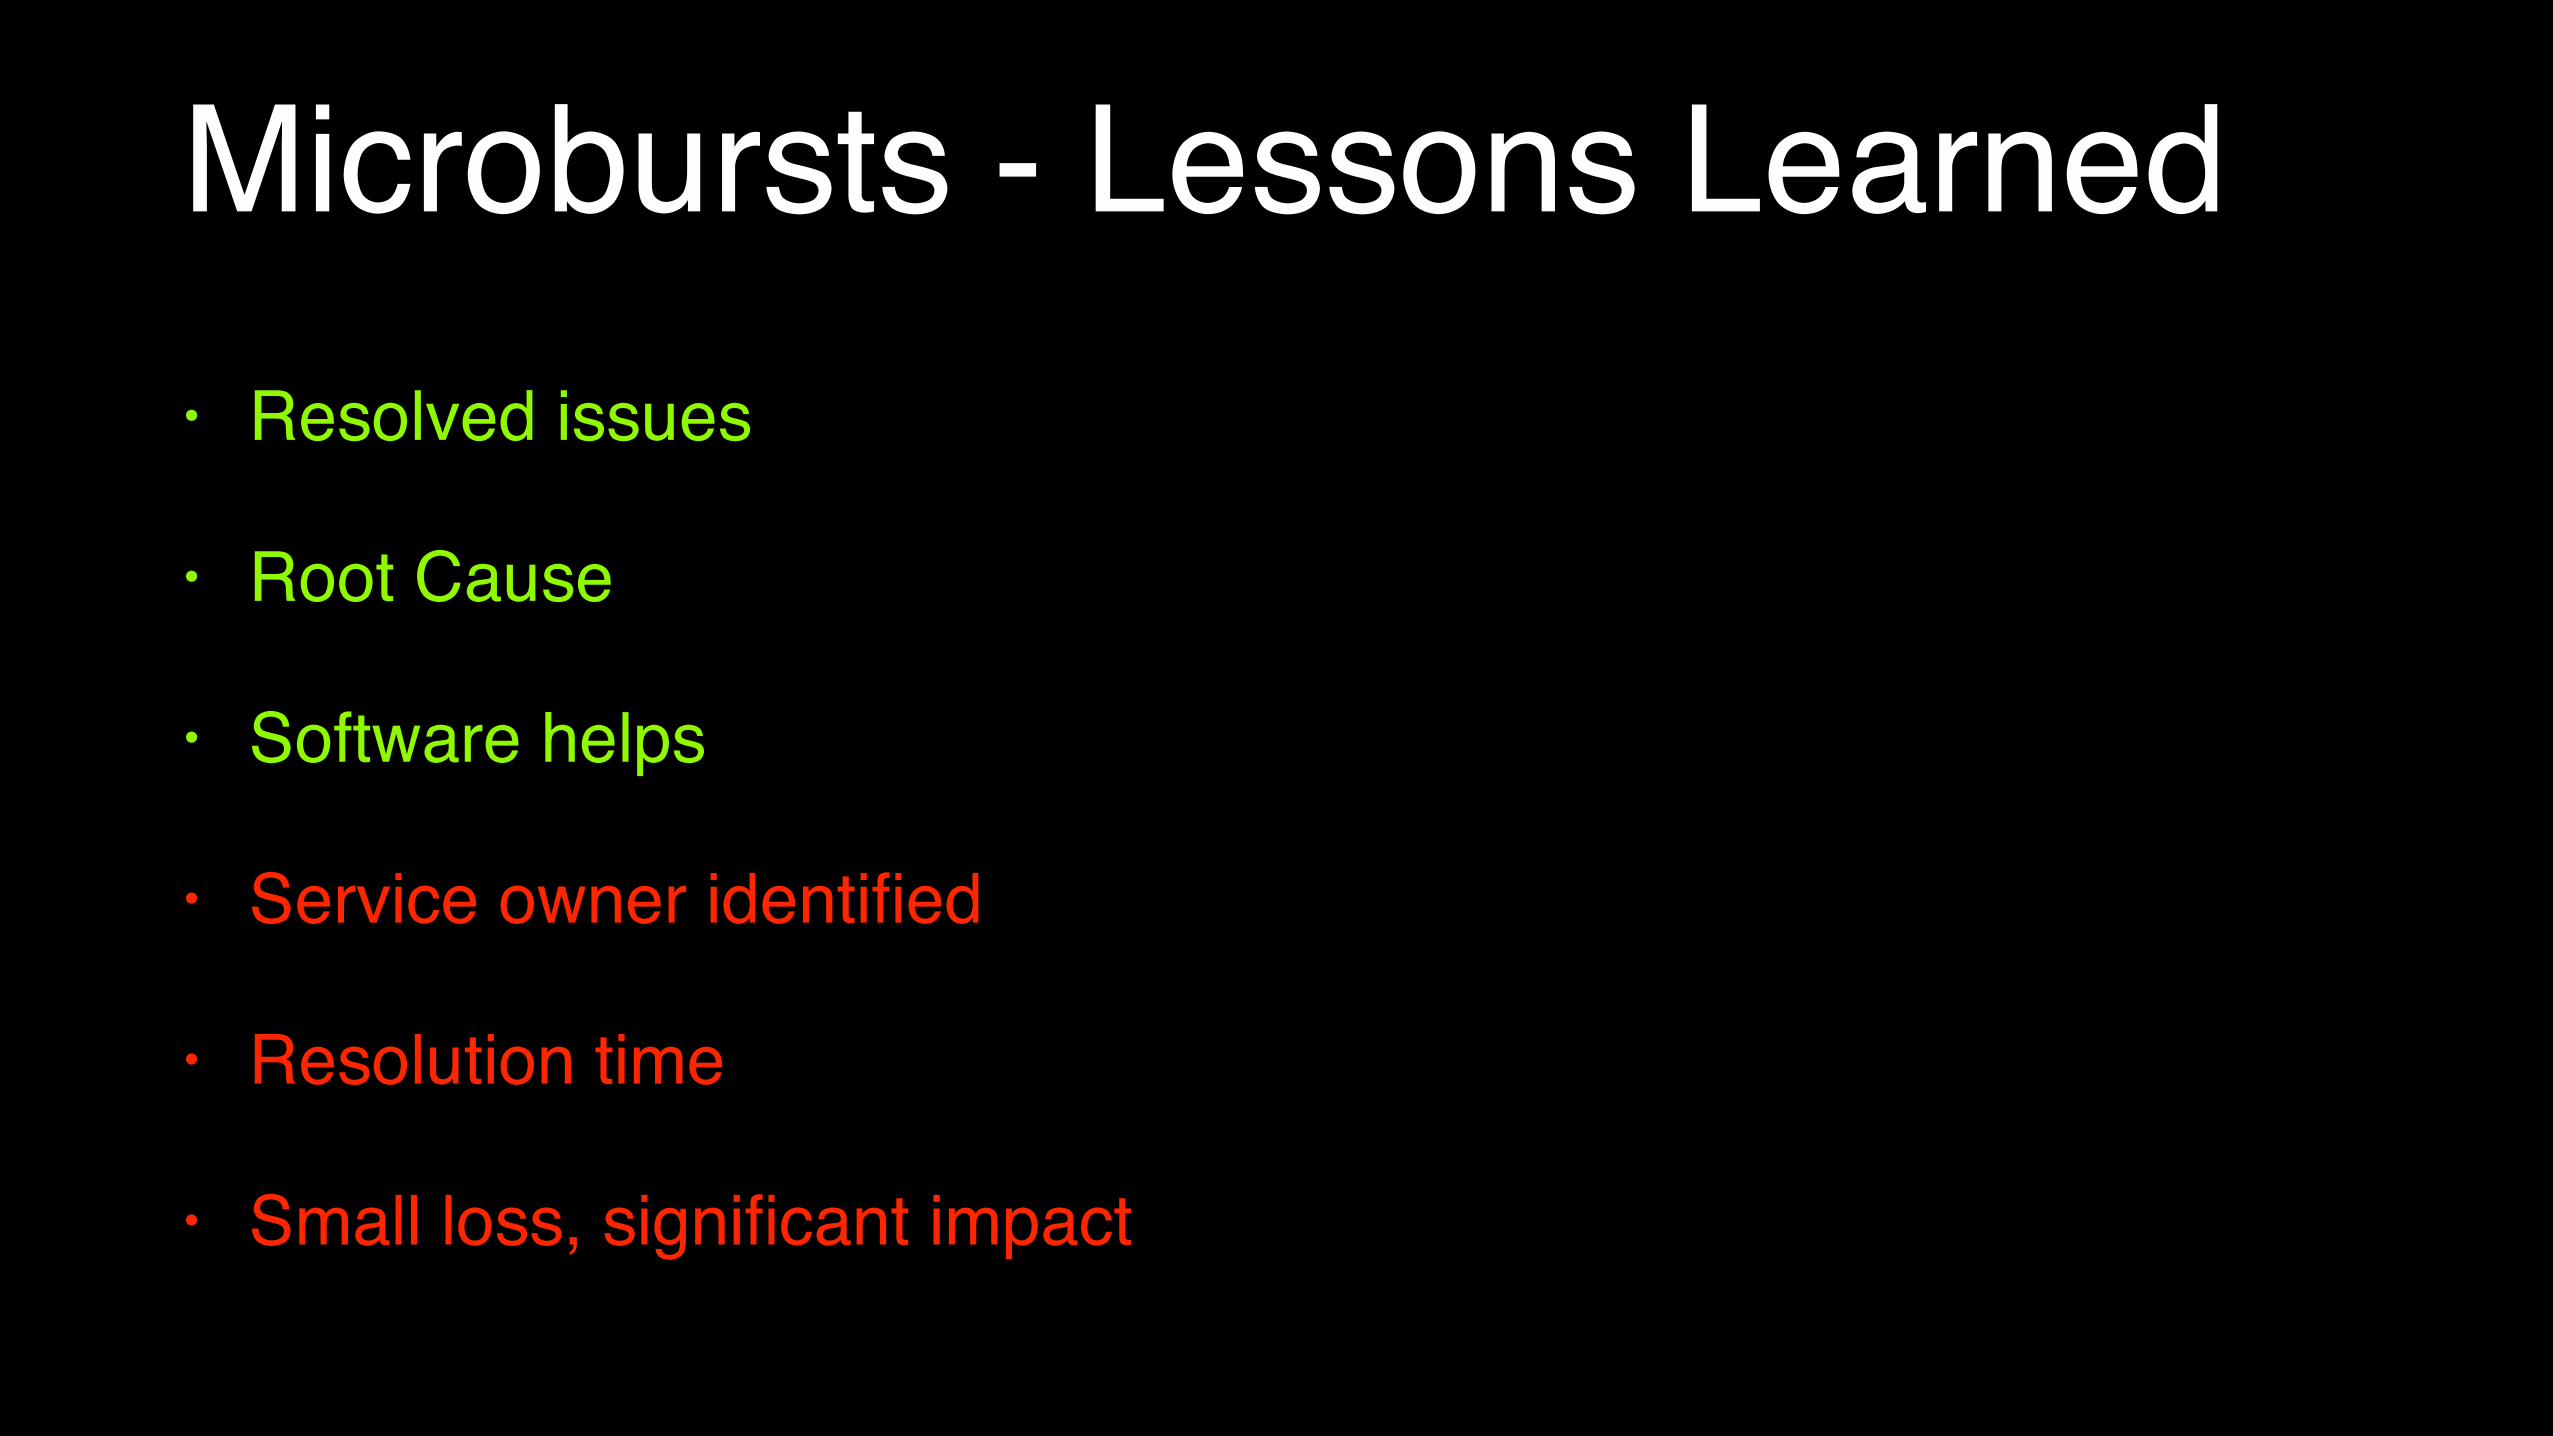
Microbursts - Lessons Learned• Resolved issues
• Root Cause
• Software helps
• Service owner identified
• Resolution time
• Small loss, significant impact

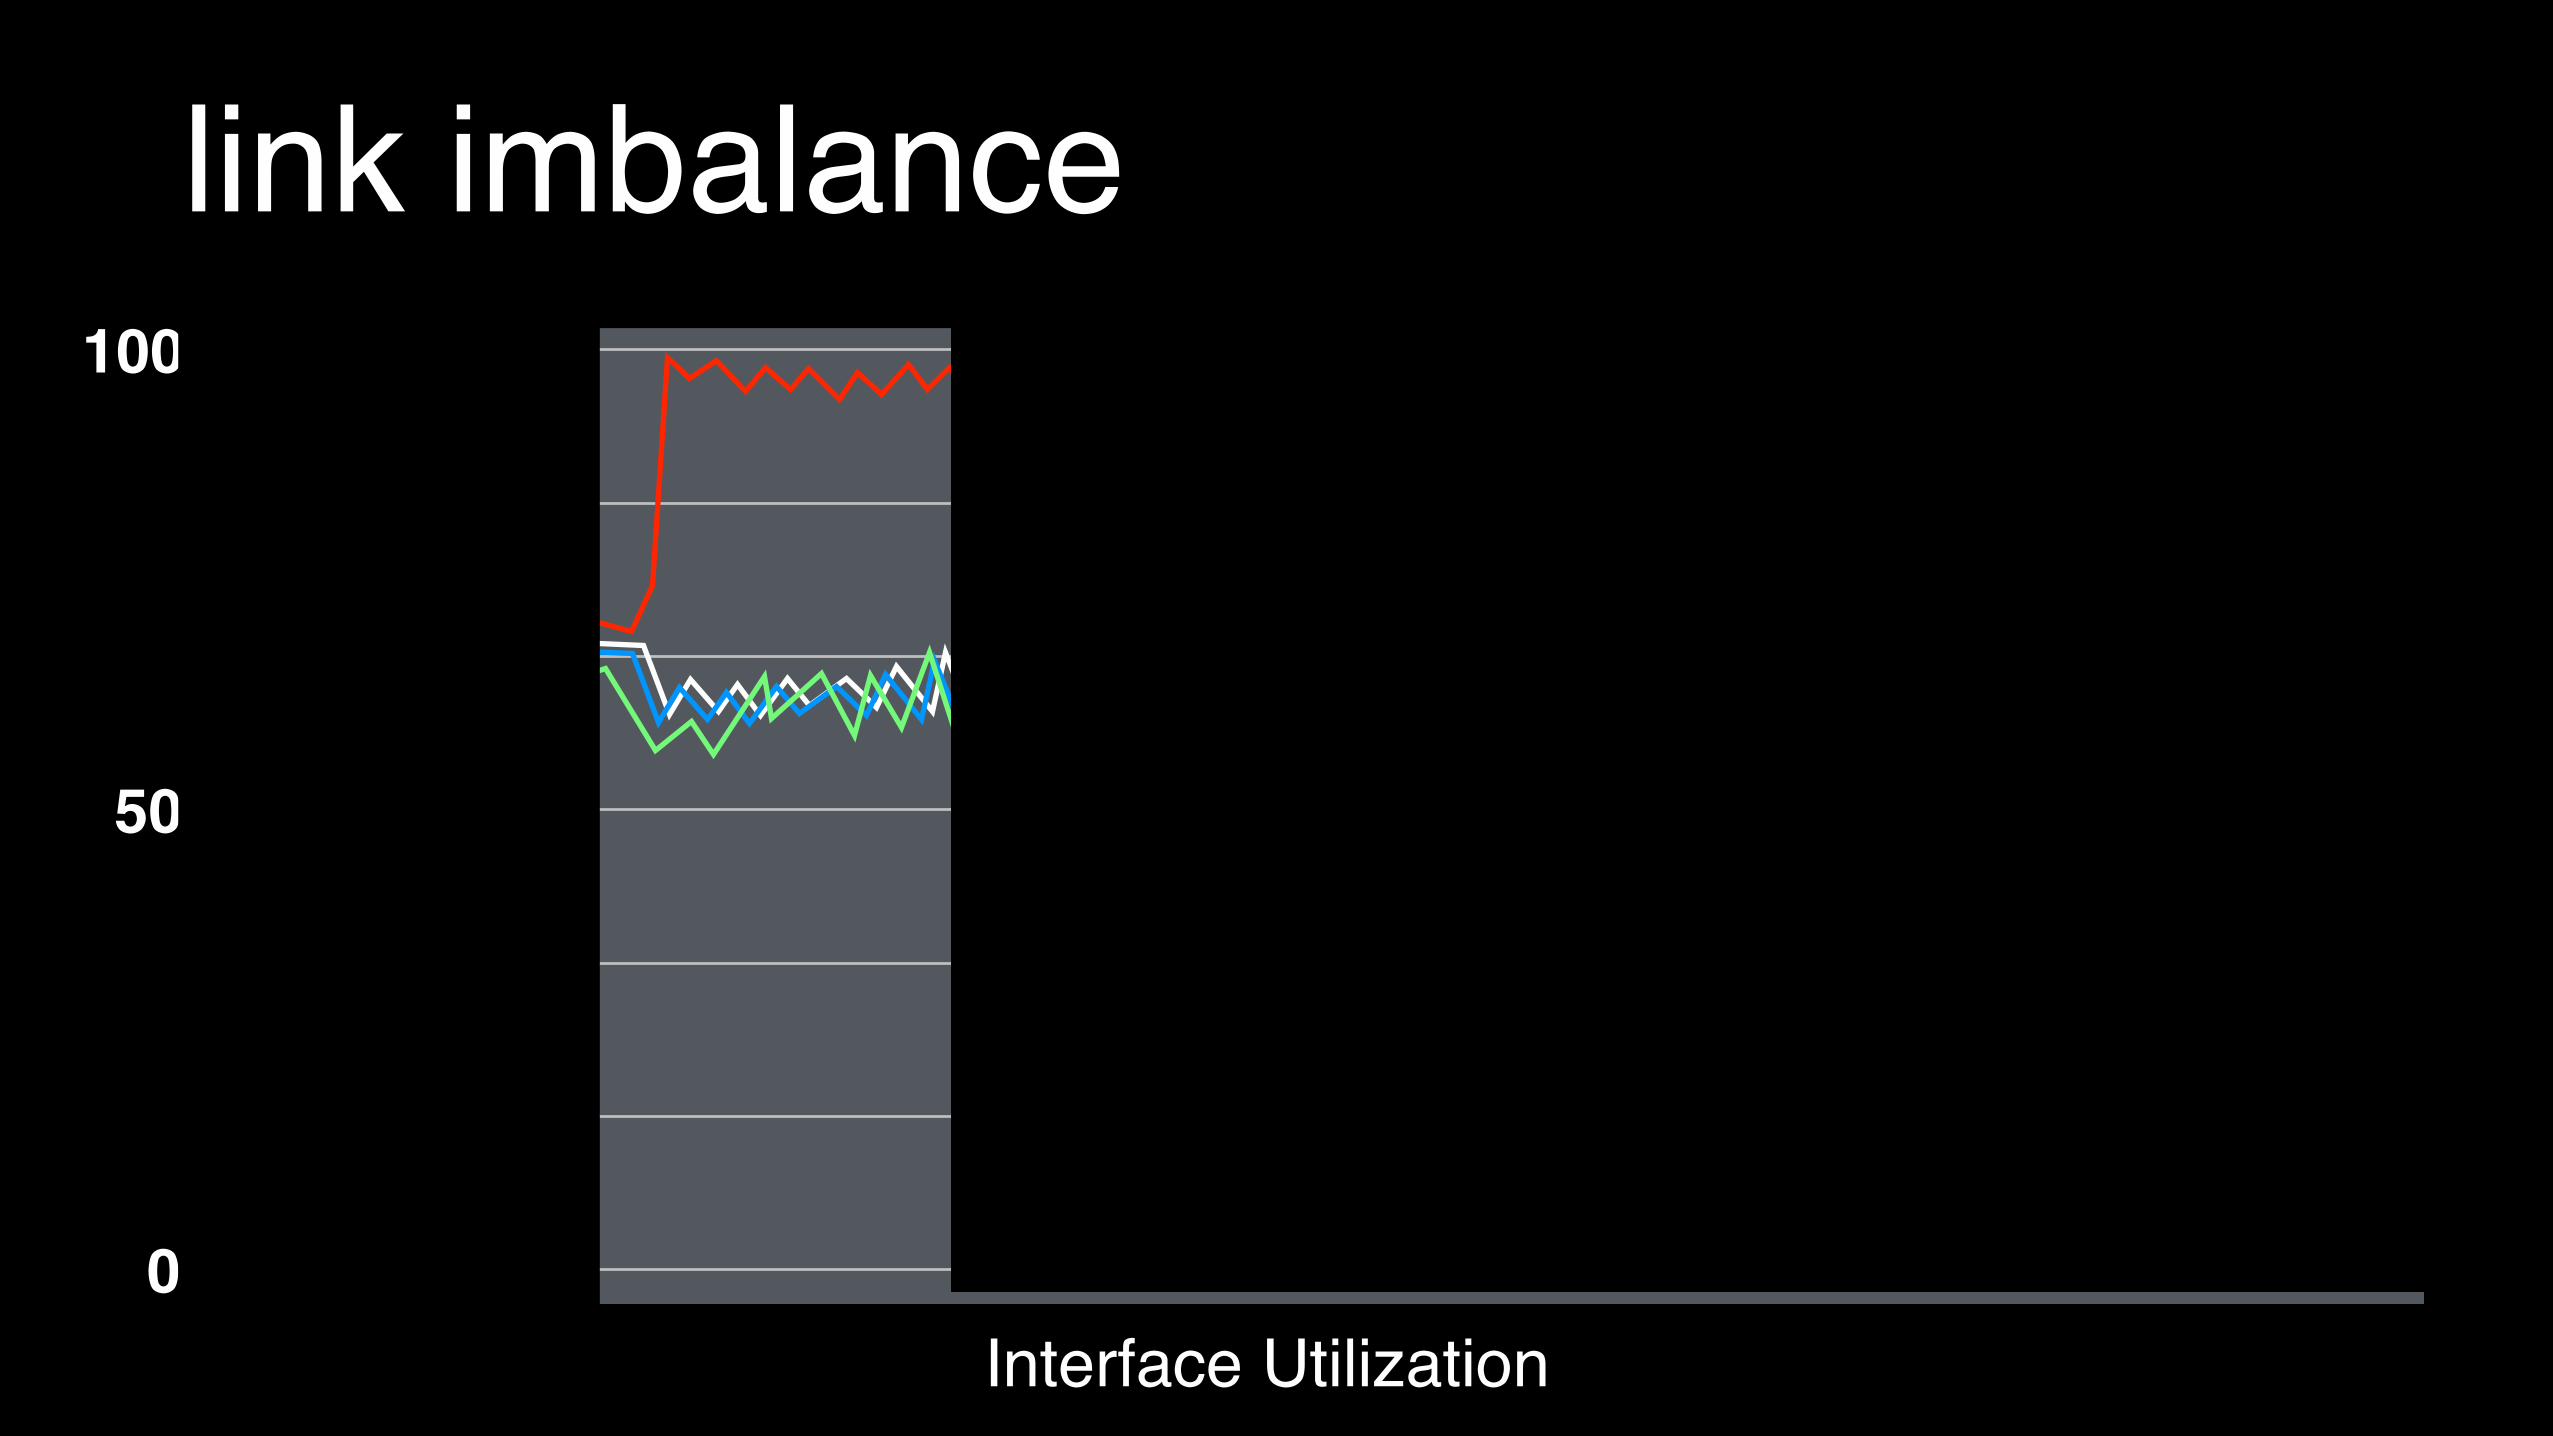
Link imbalance
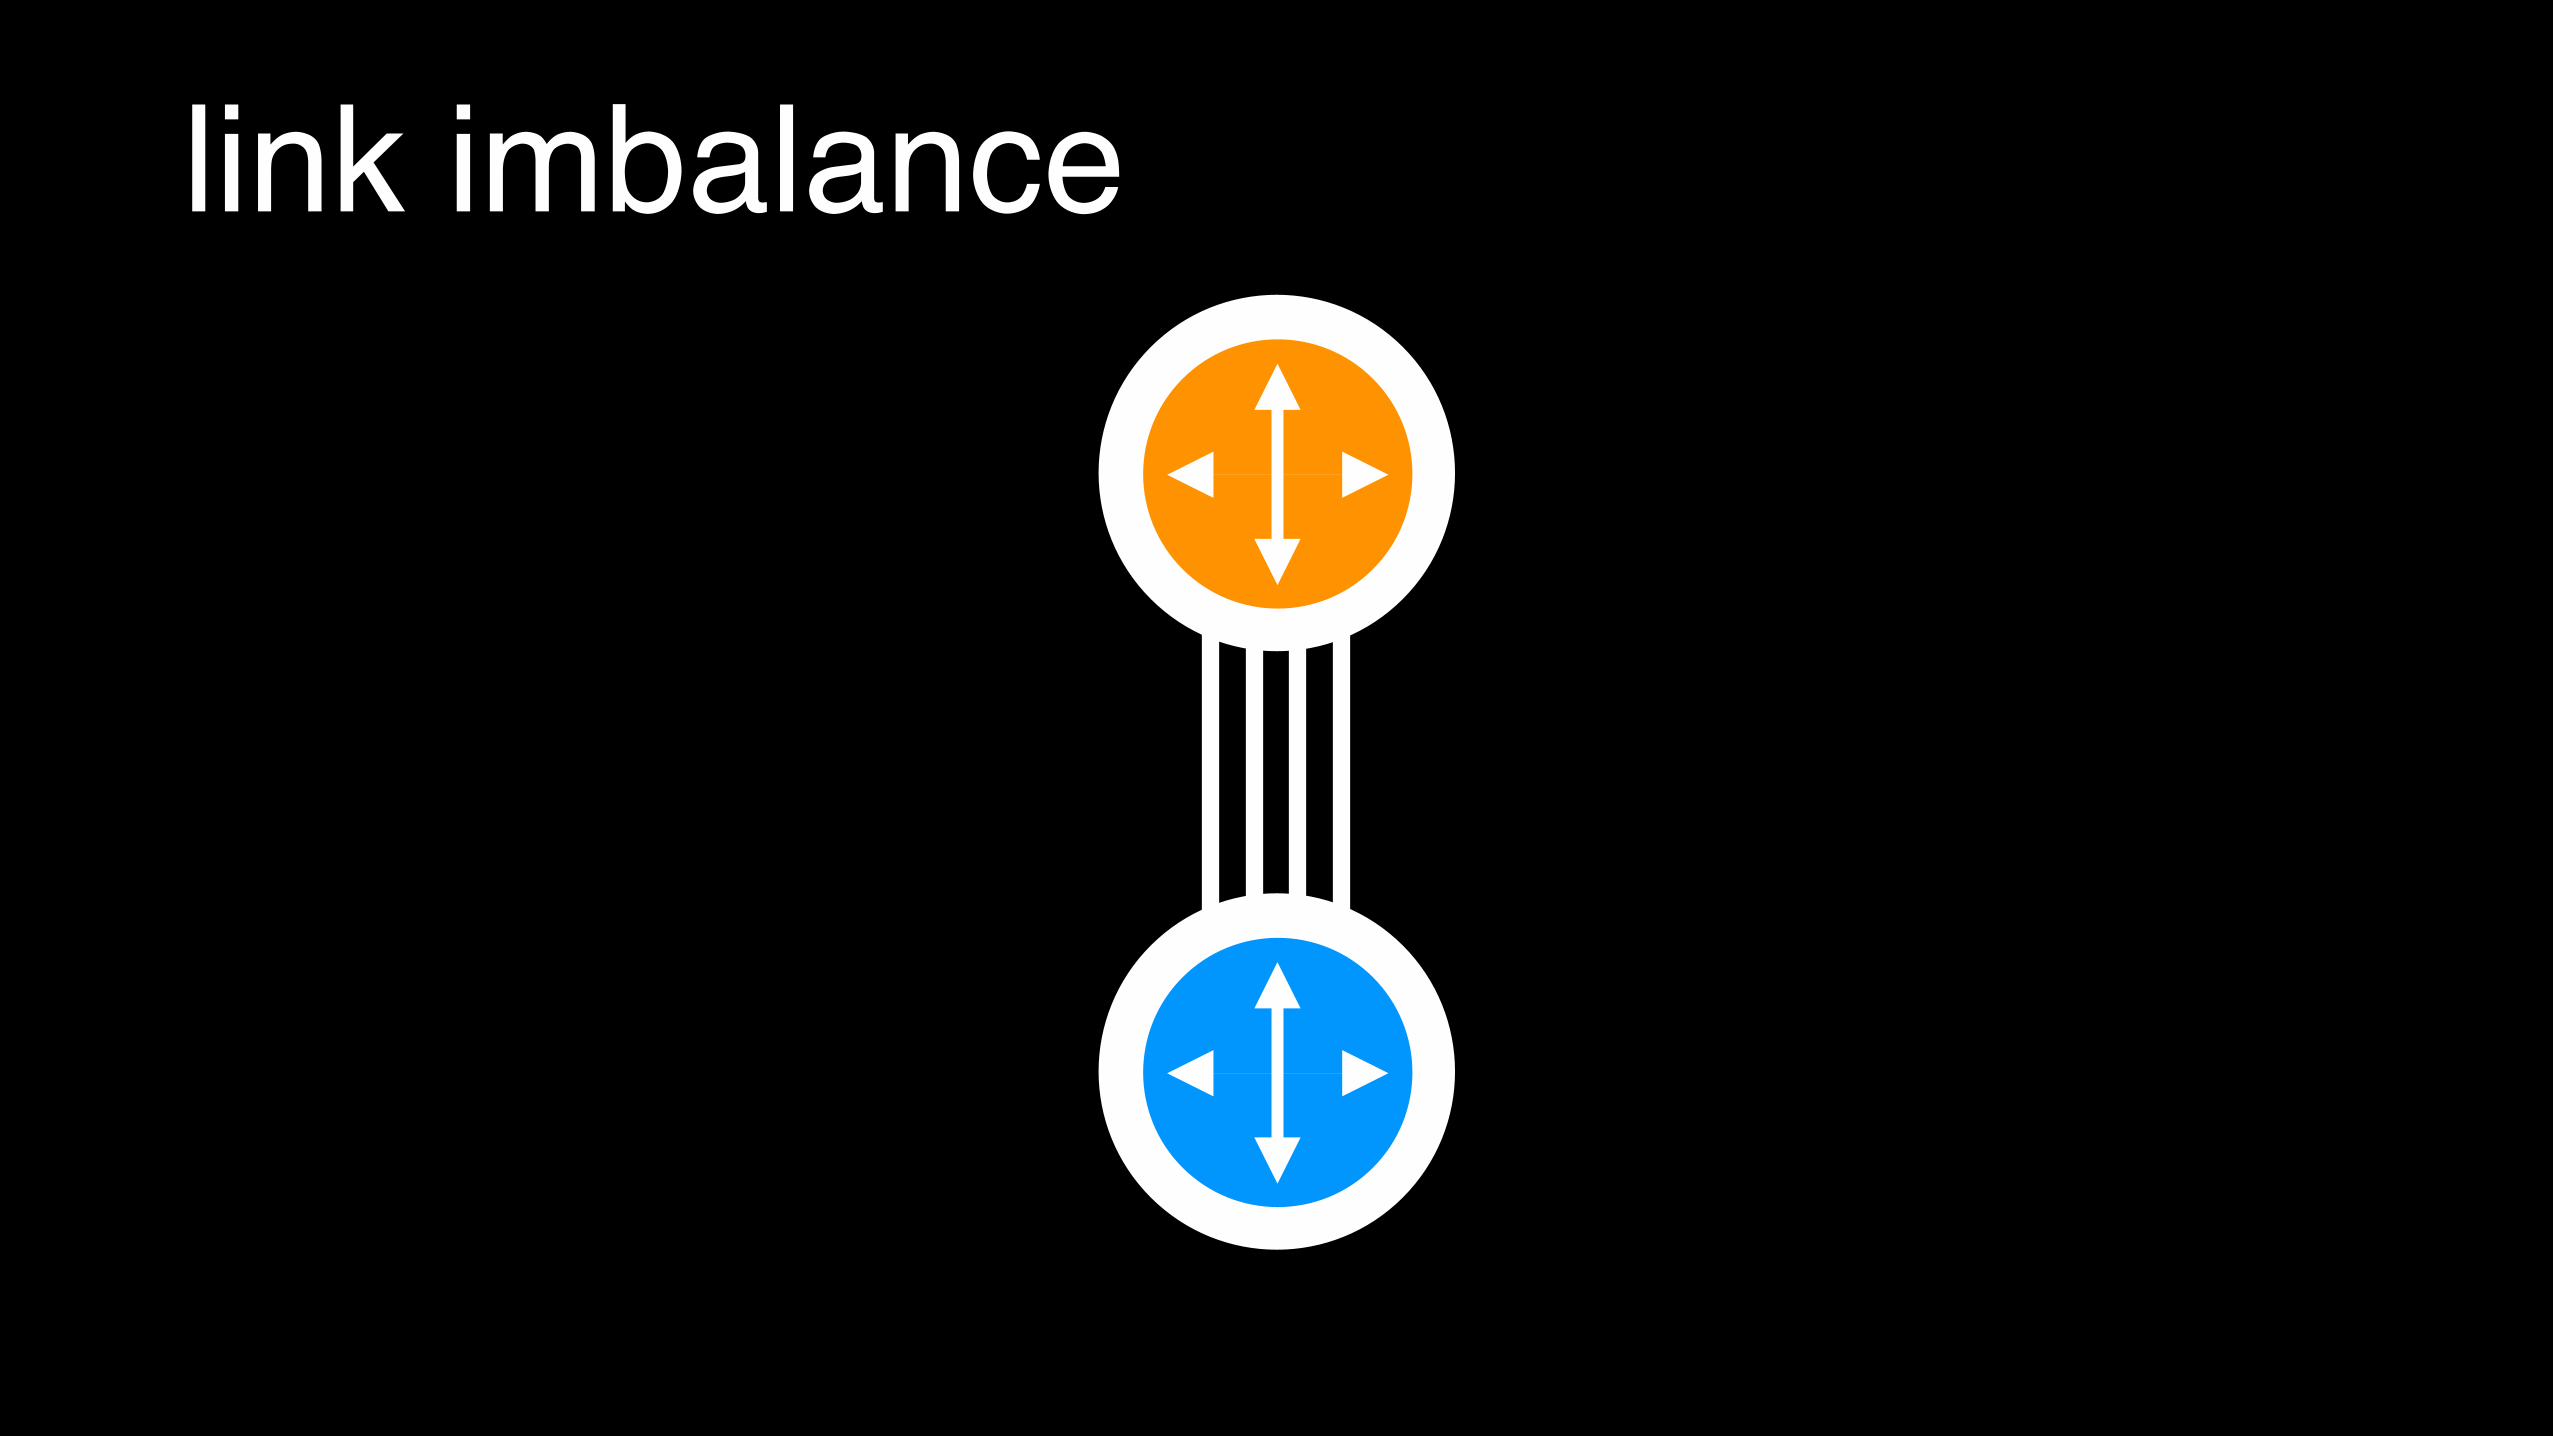
link imbalance
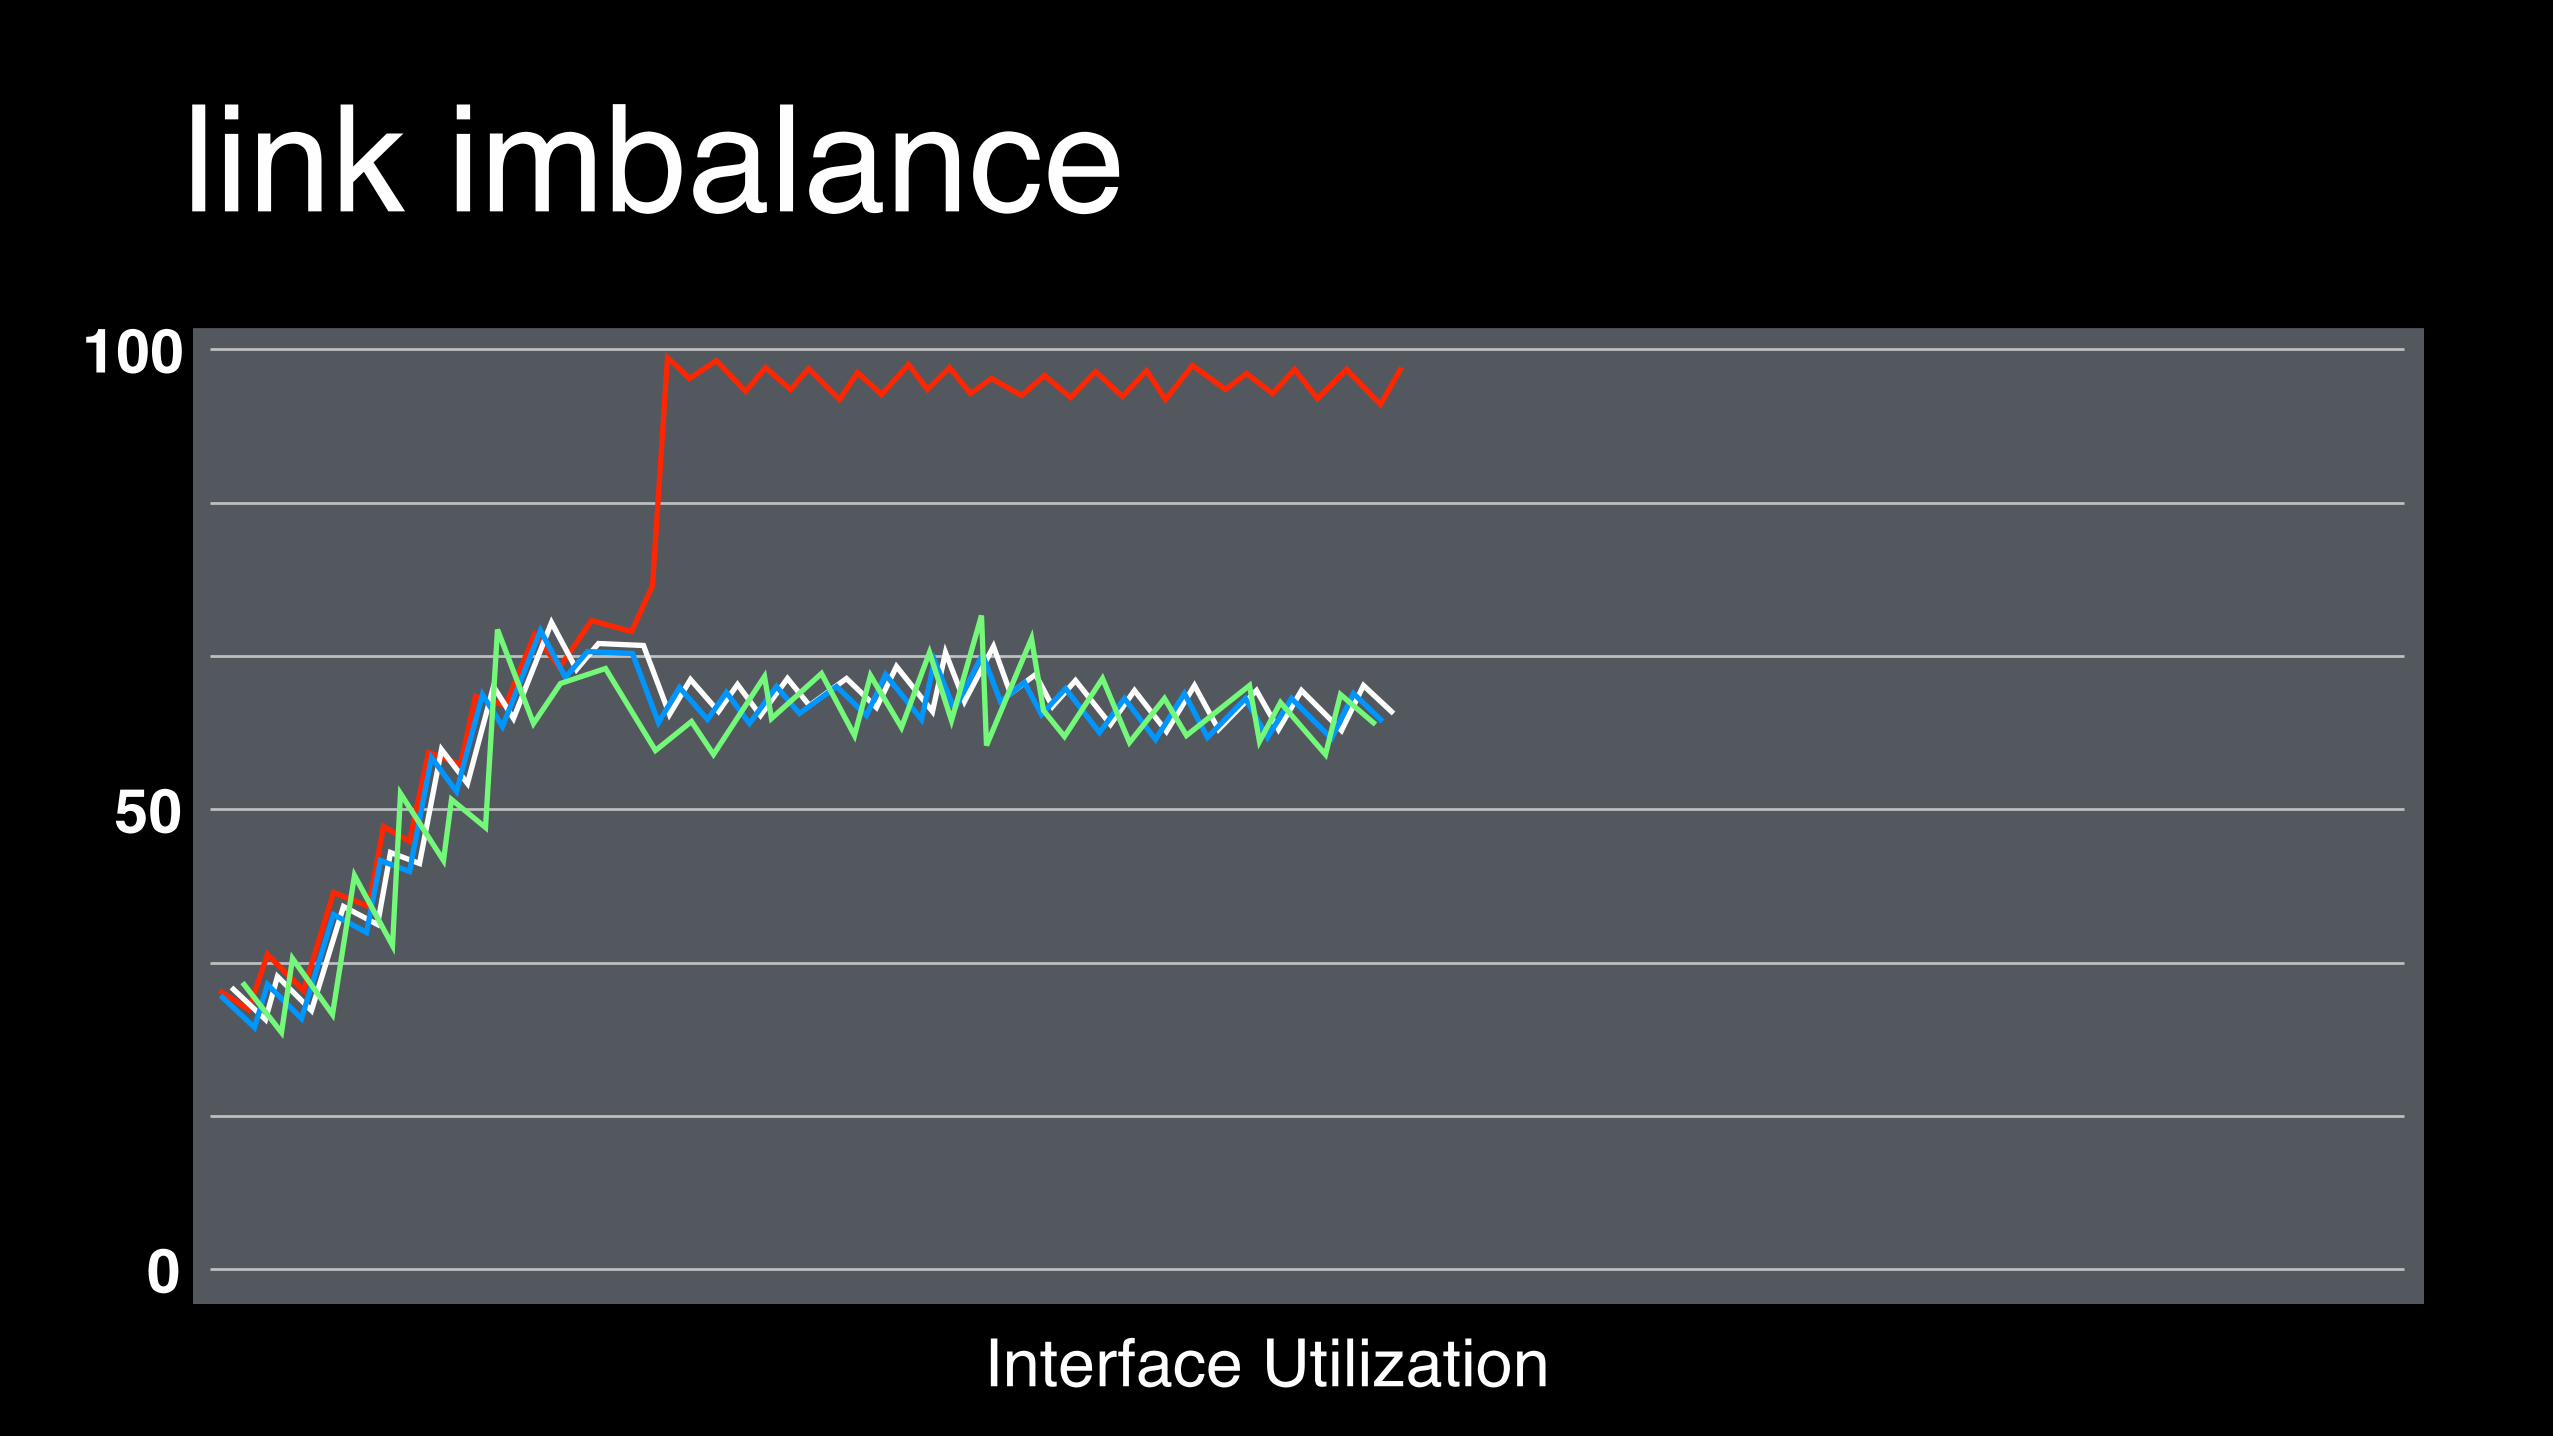
link imbalance100
50
0Interface Utilization

link imbalance
wtf.
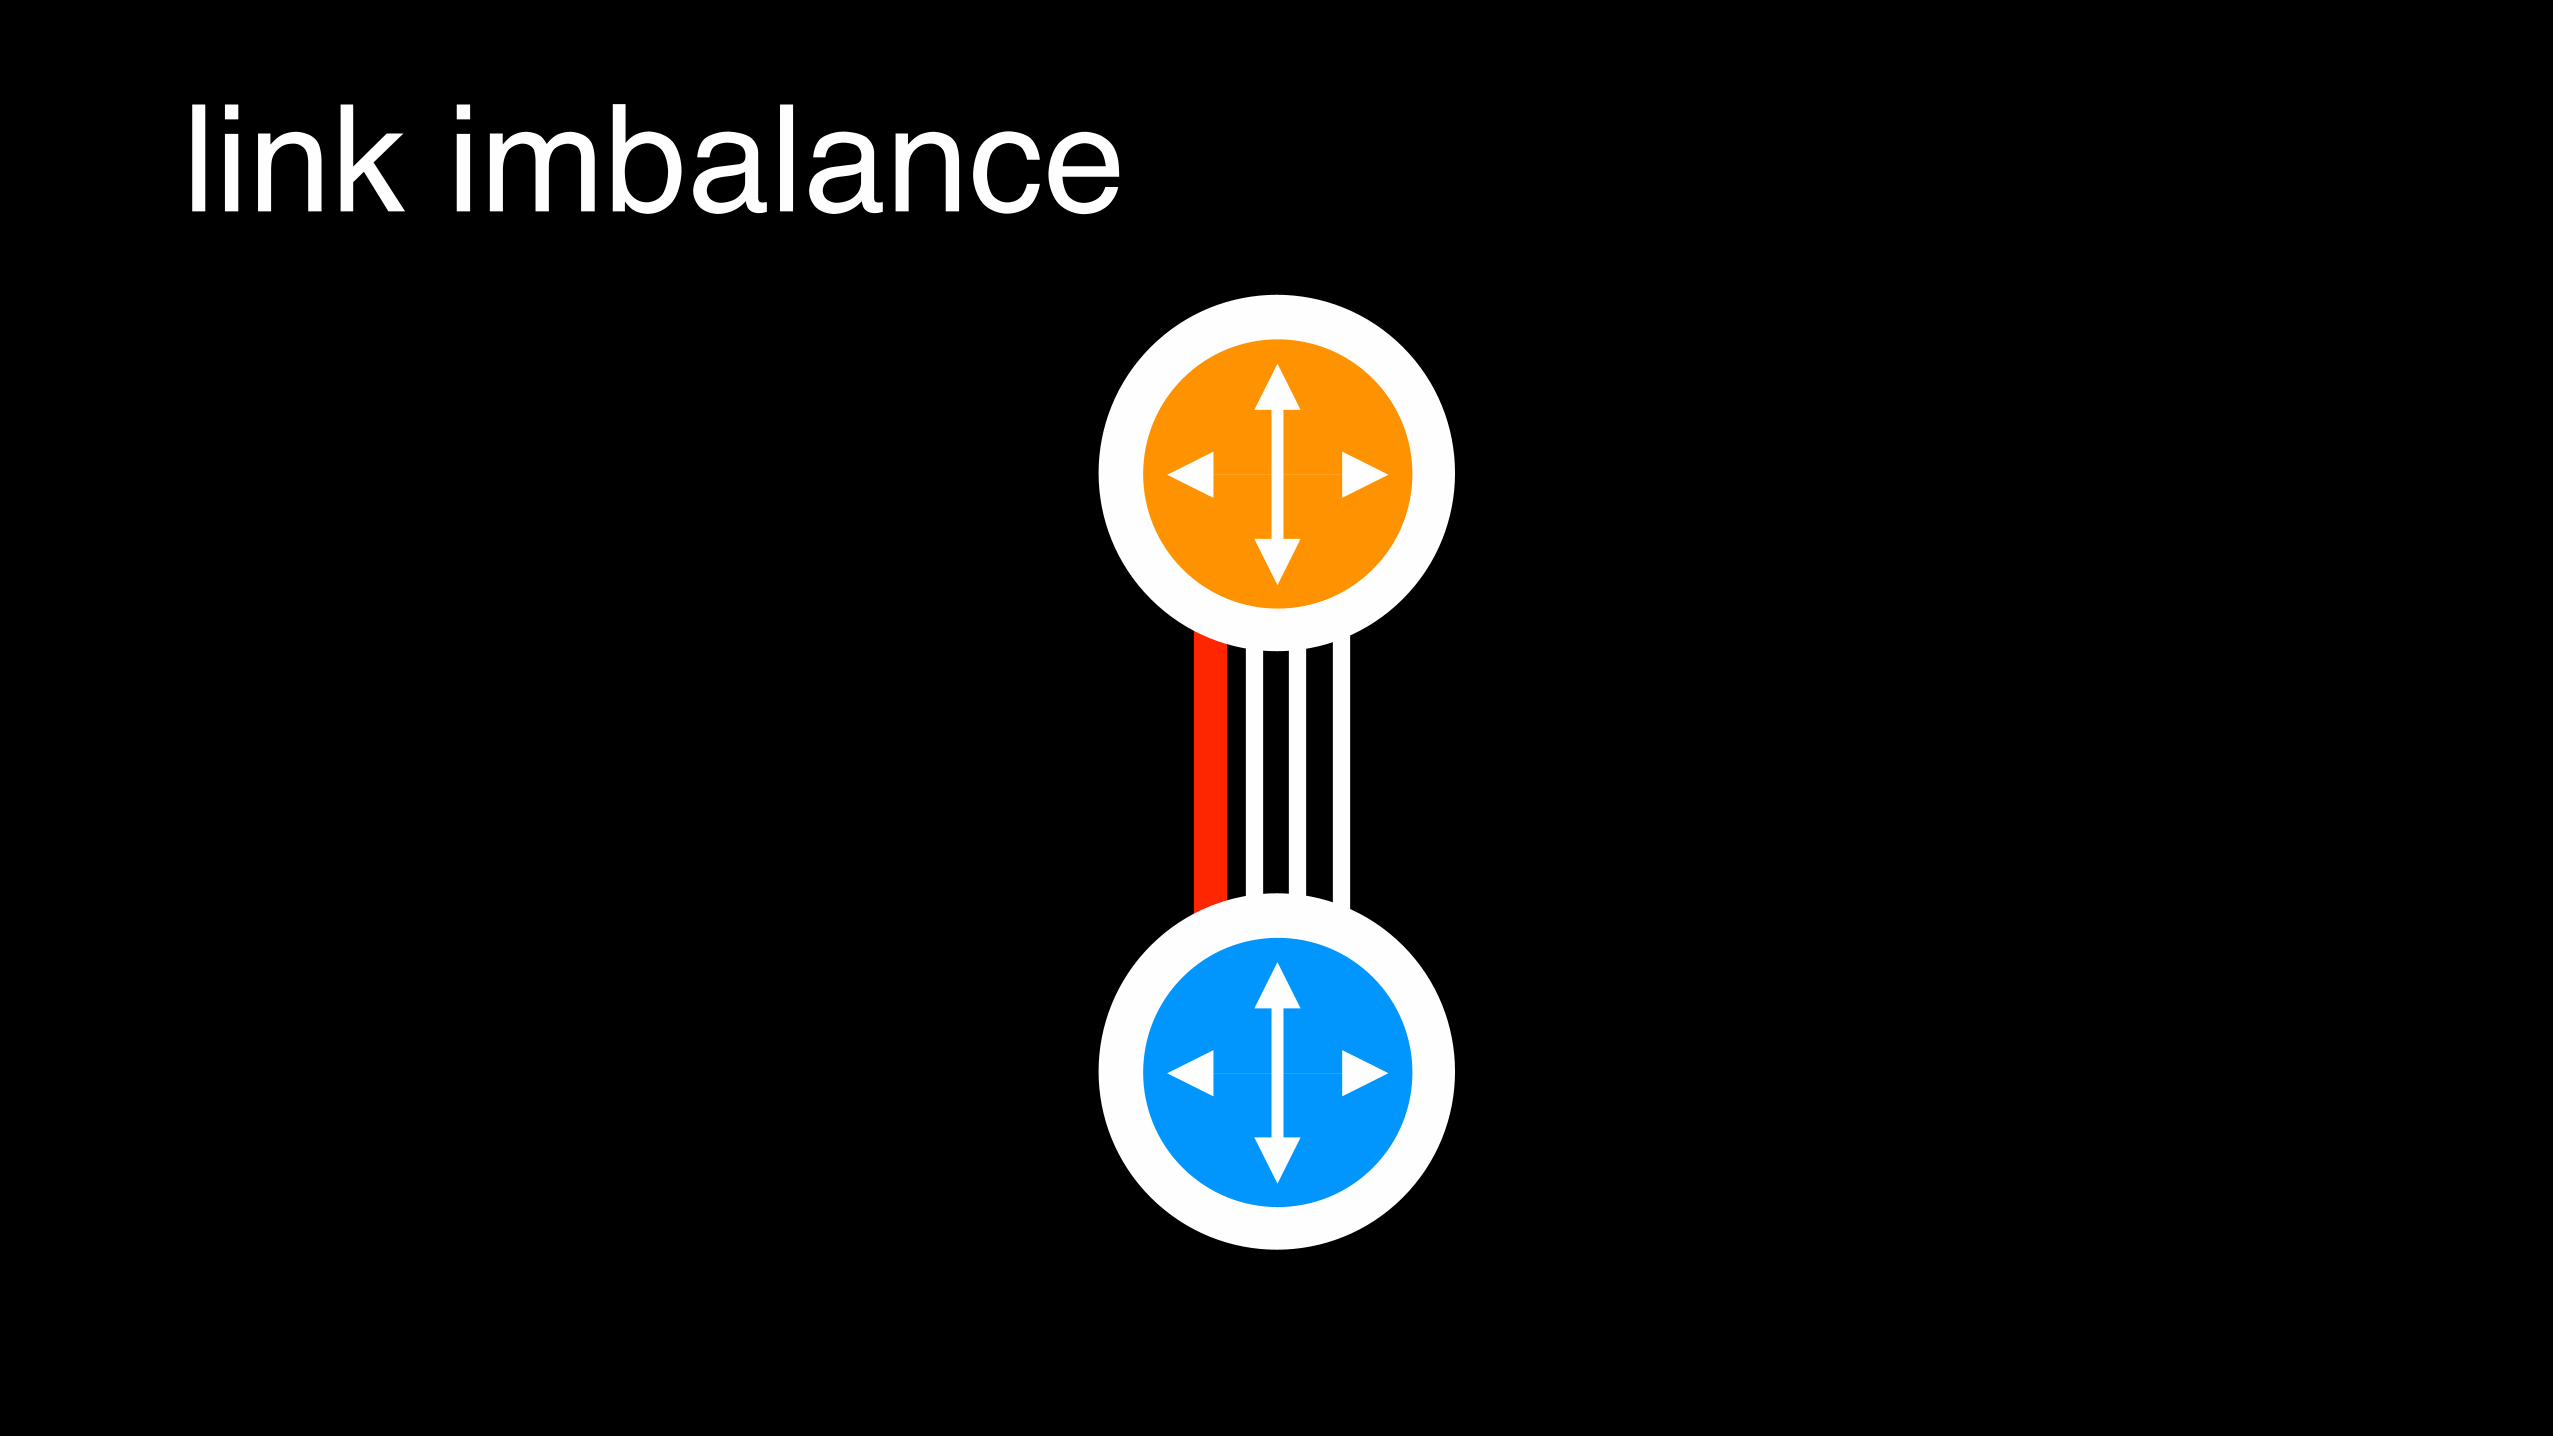
link imbalance
link imbalance

link imbalance
It’s not a [censored] fat flow!
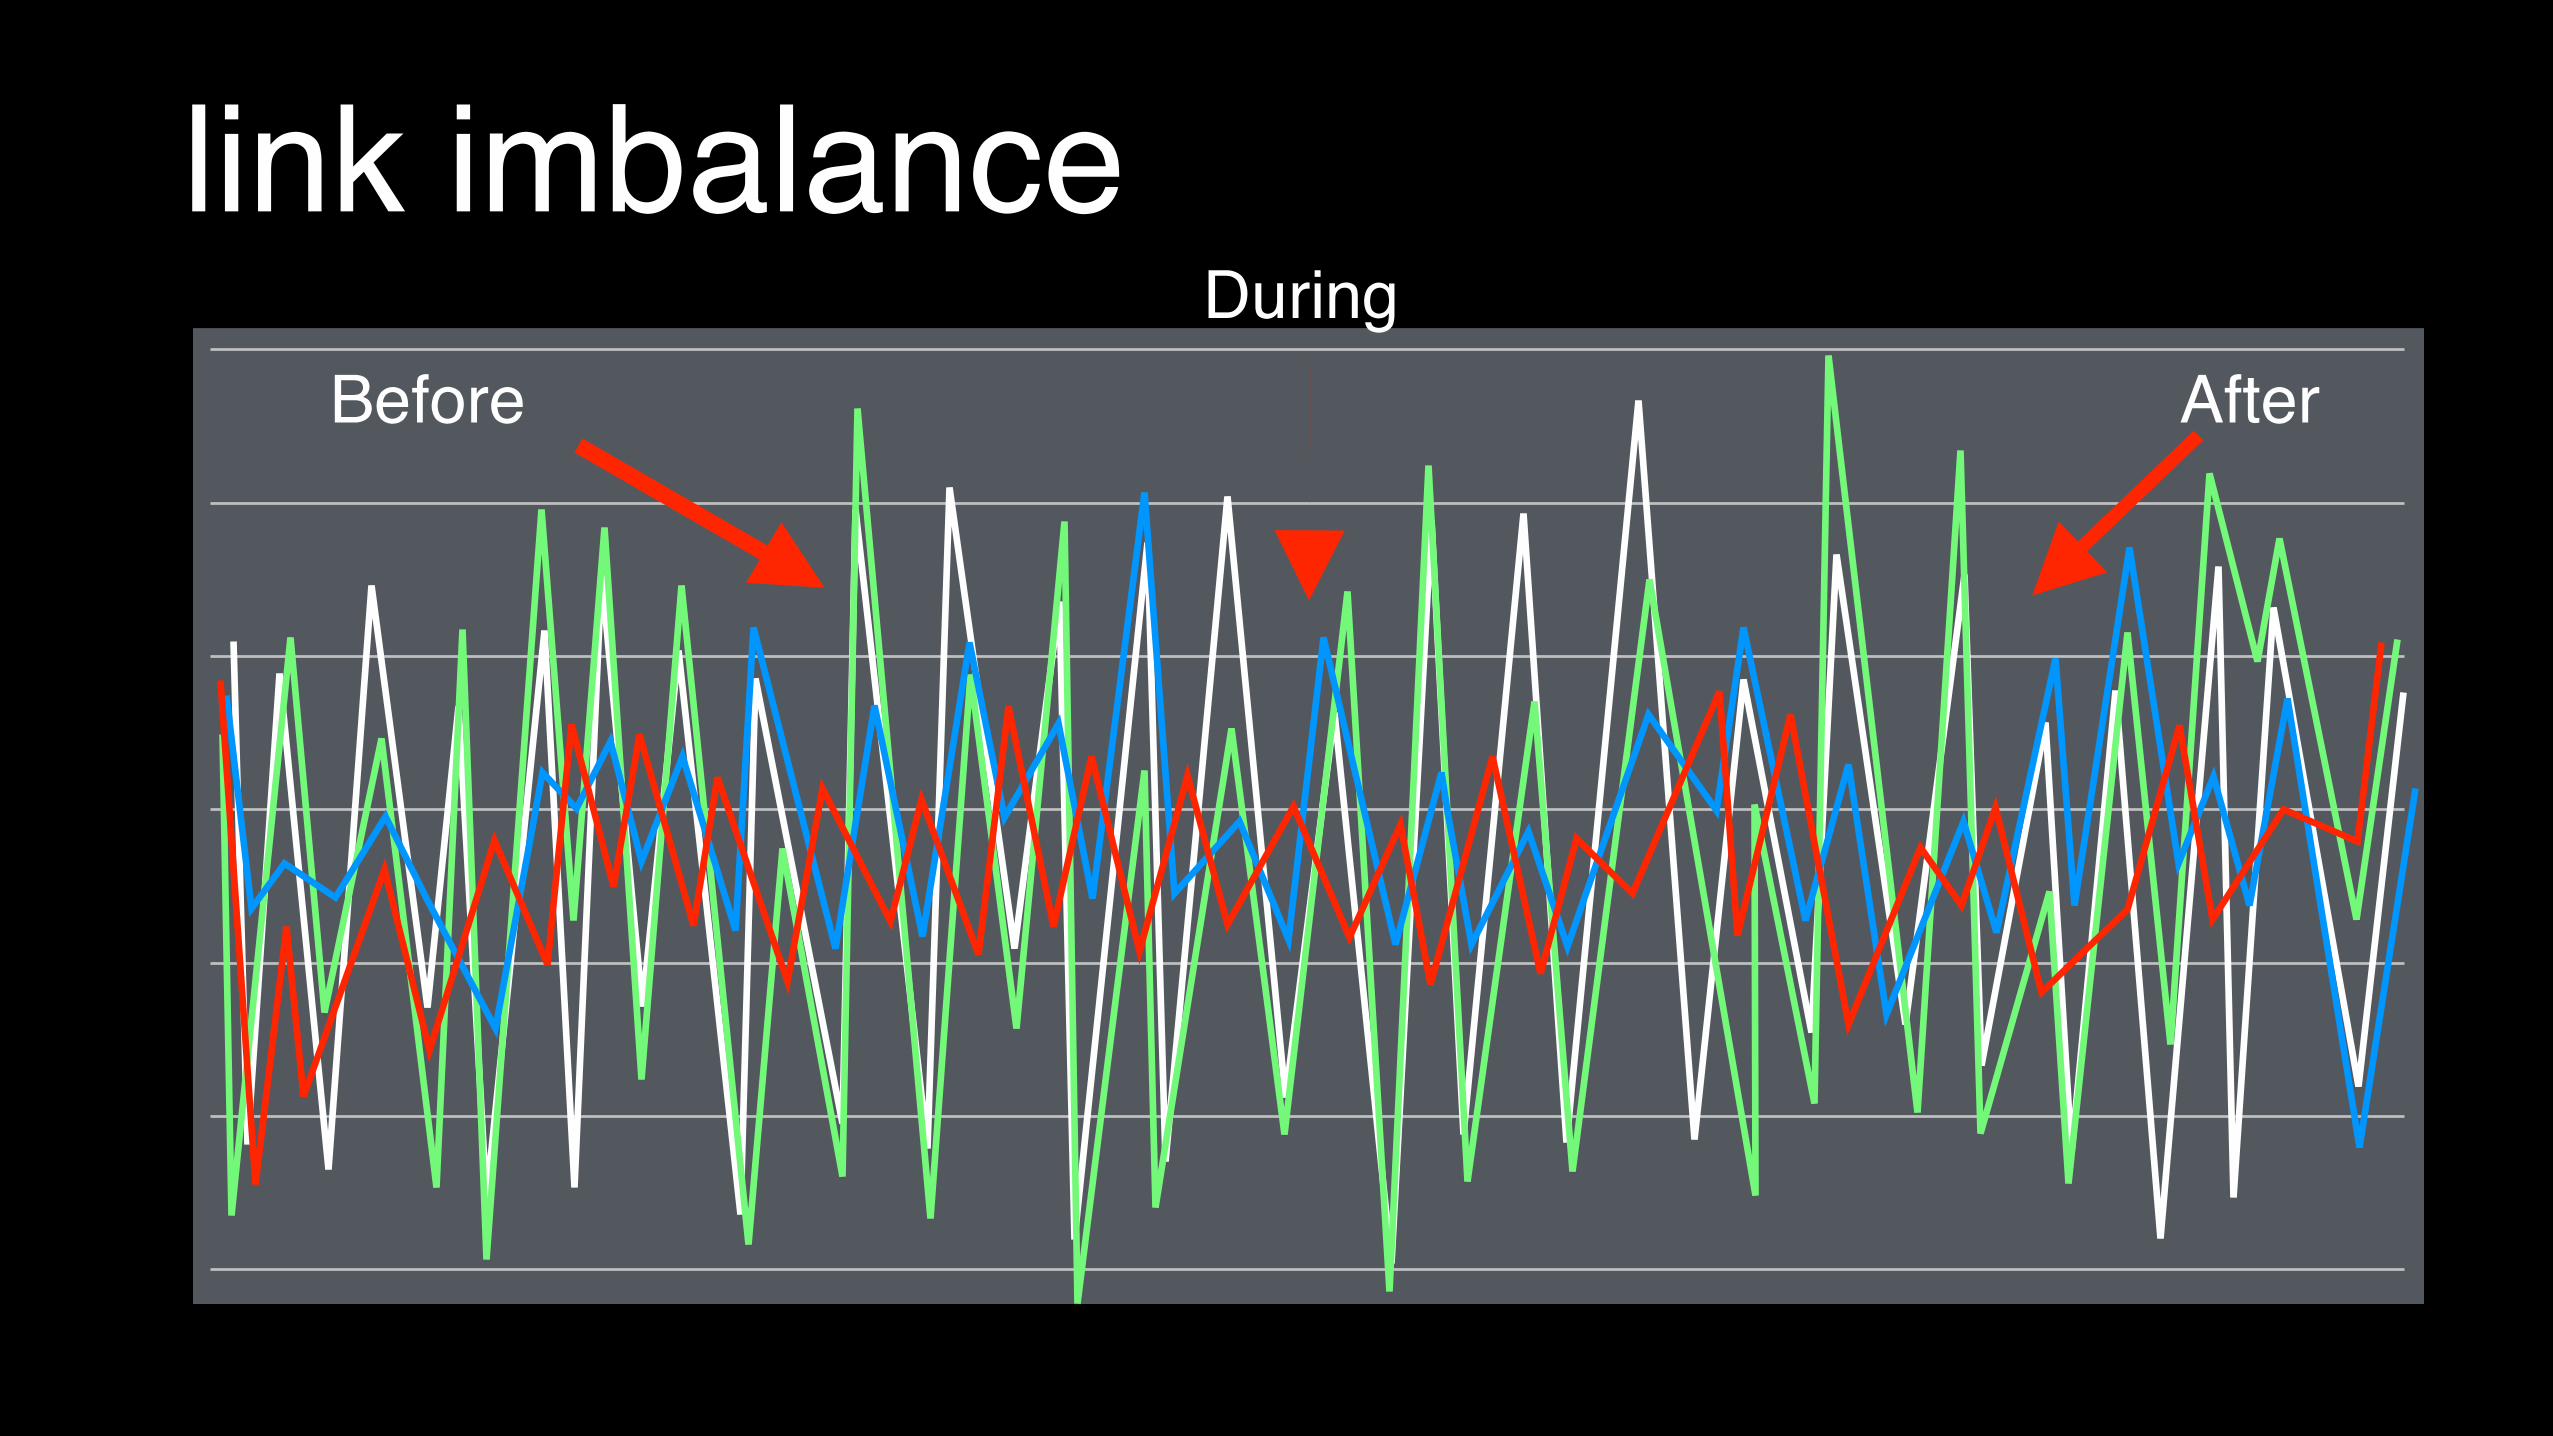
link imbalanceBefore
DuringAfter
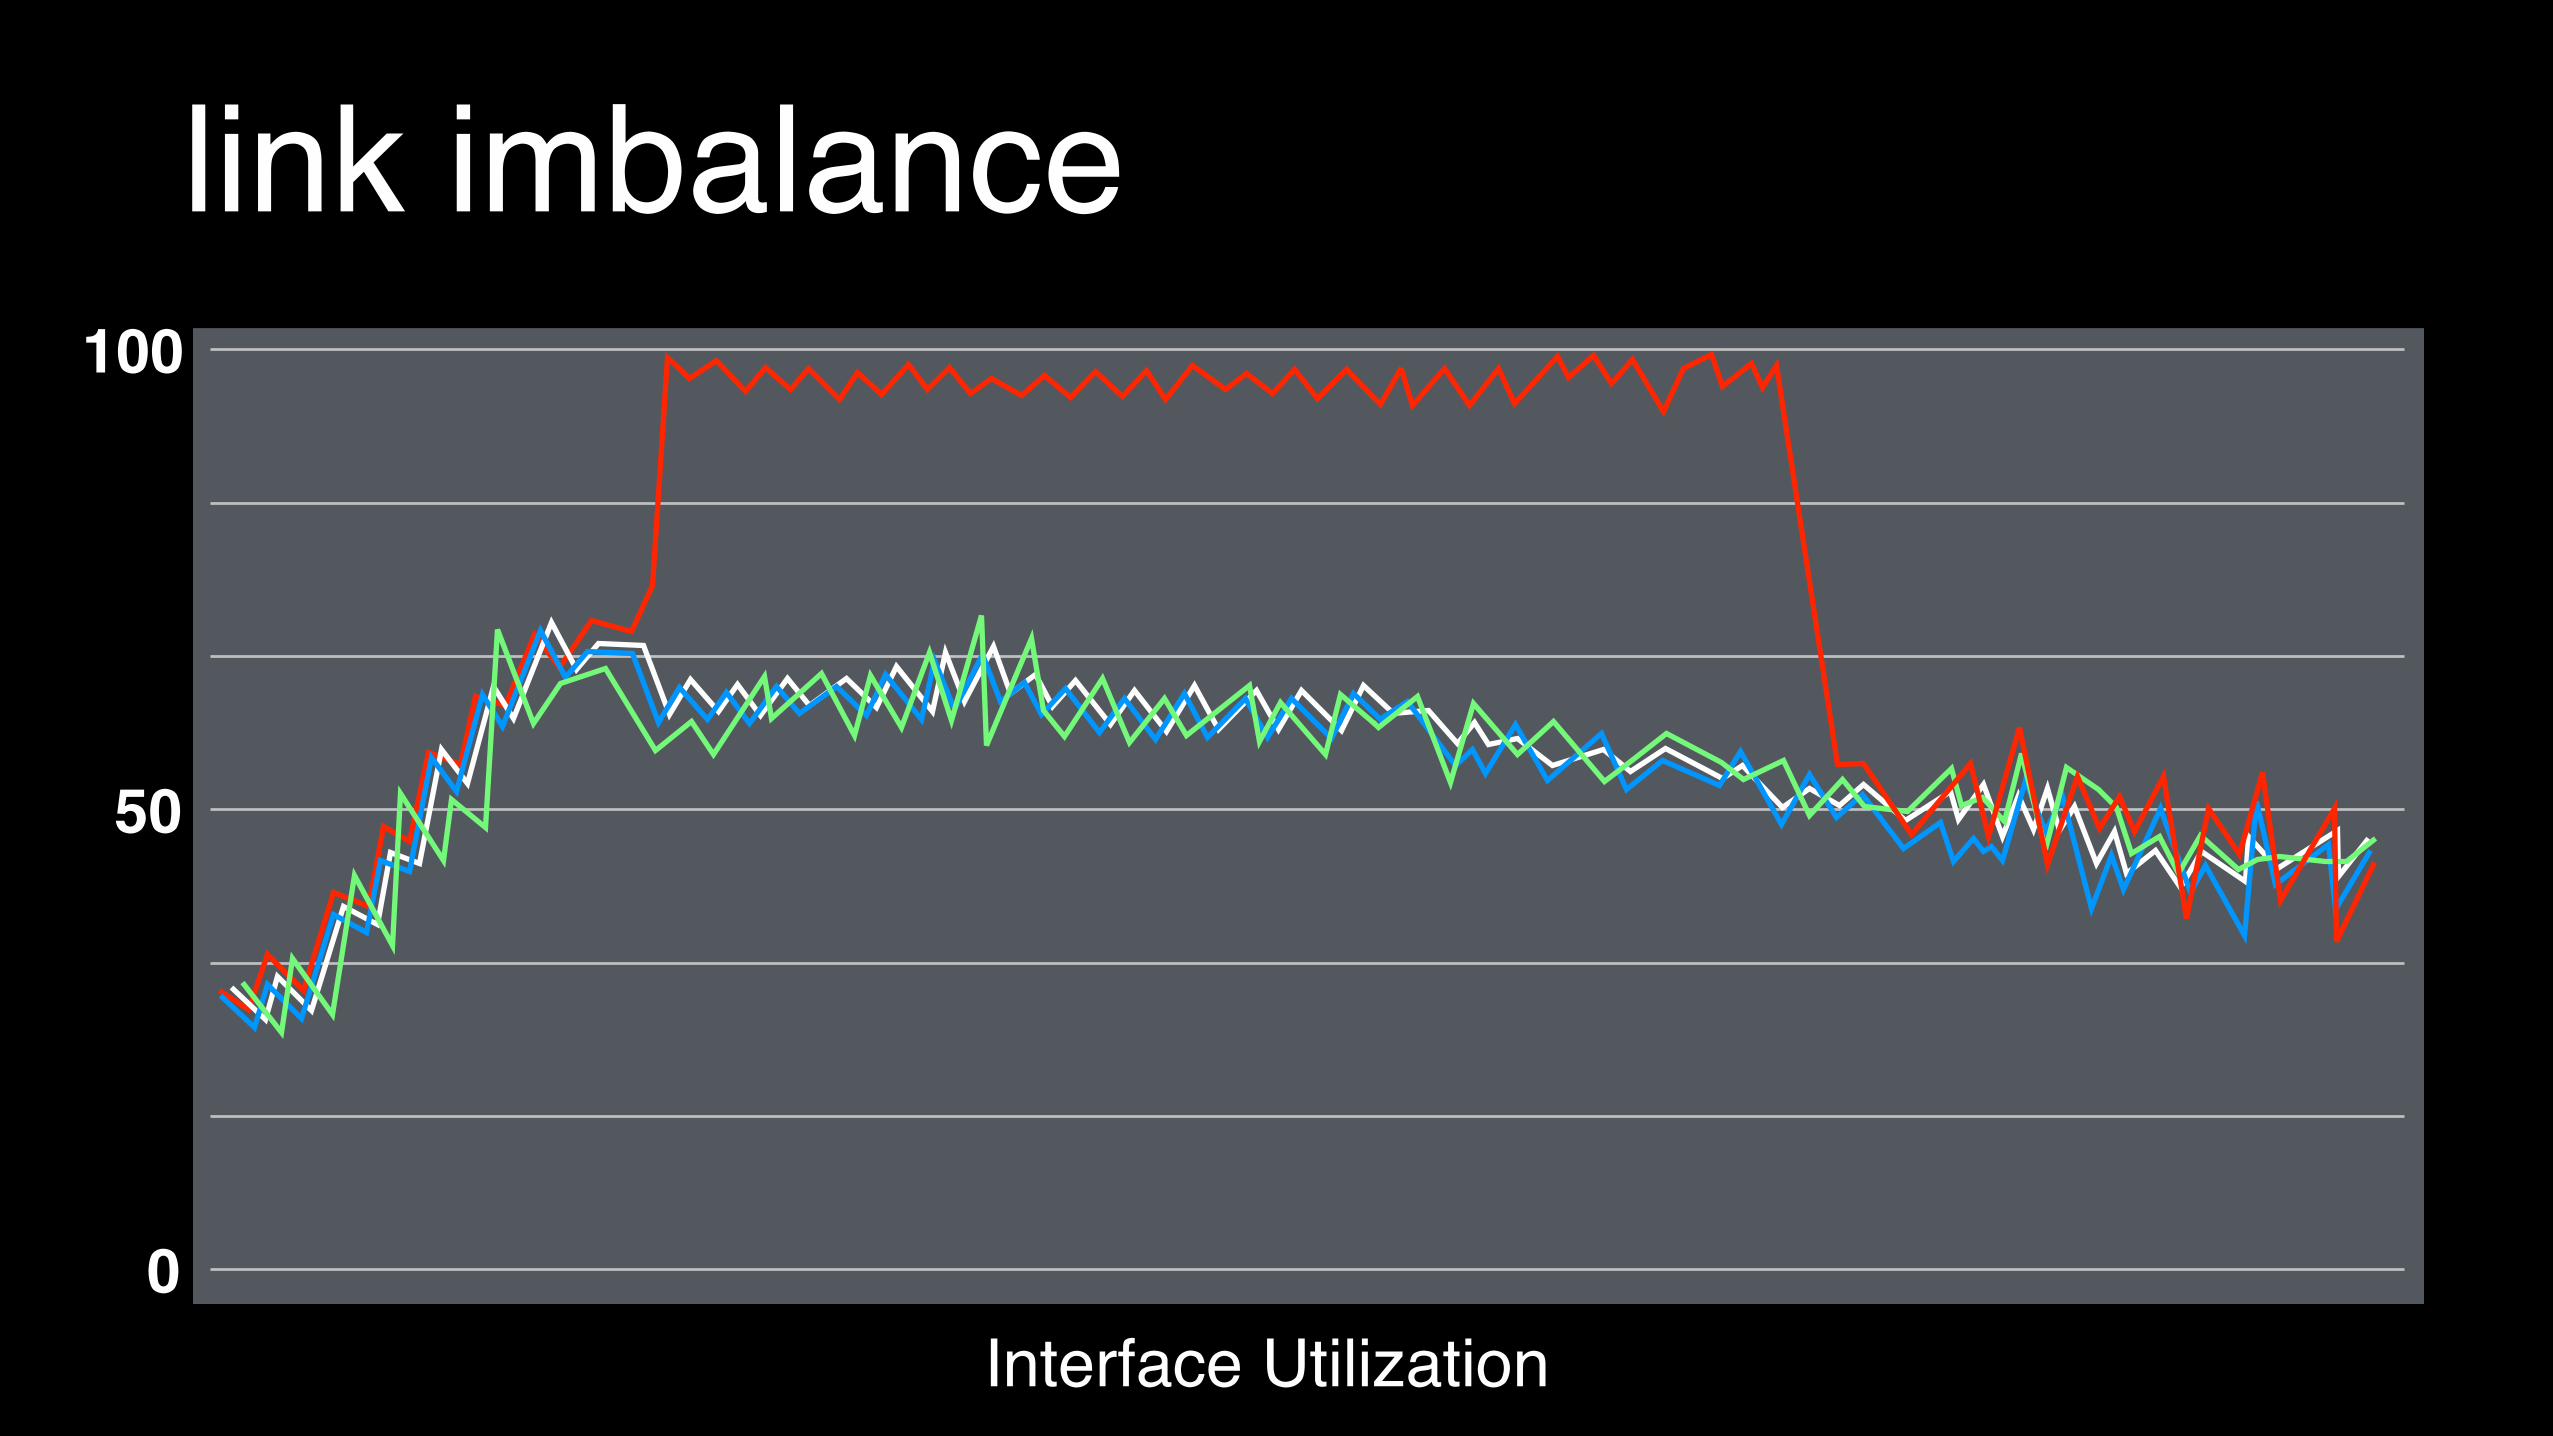
link imbalance100
50
0Interface Utilization
link imbalance100
50
0Interface Utilization

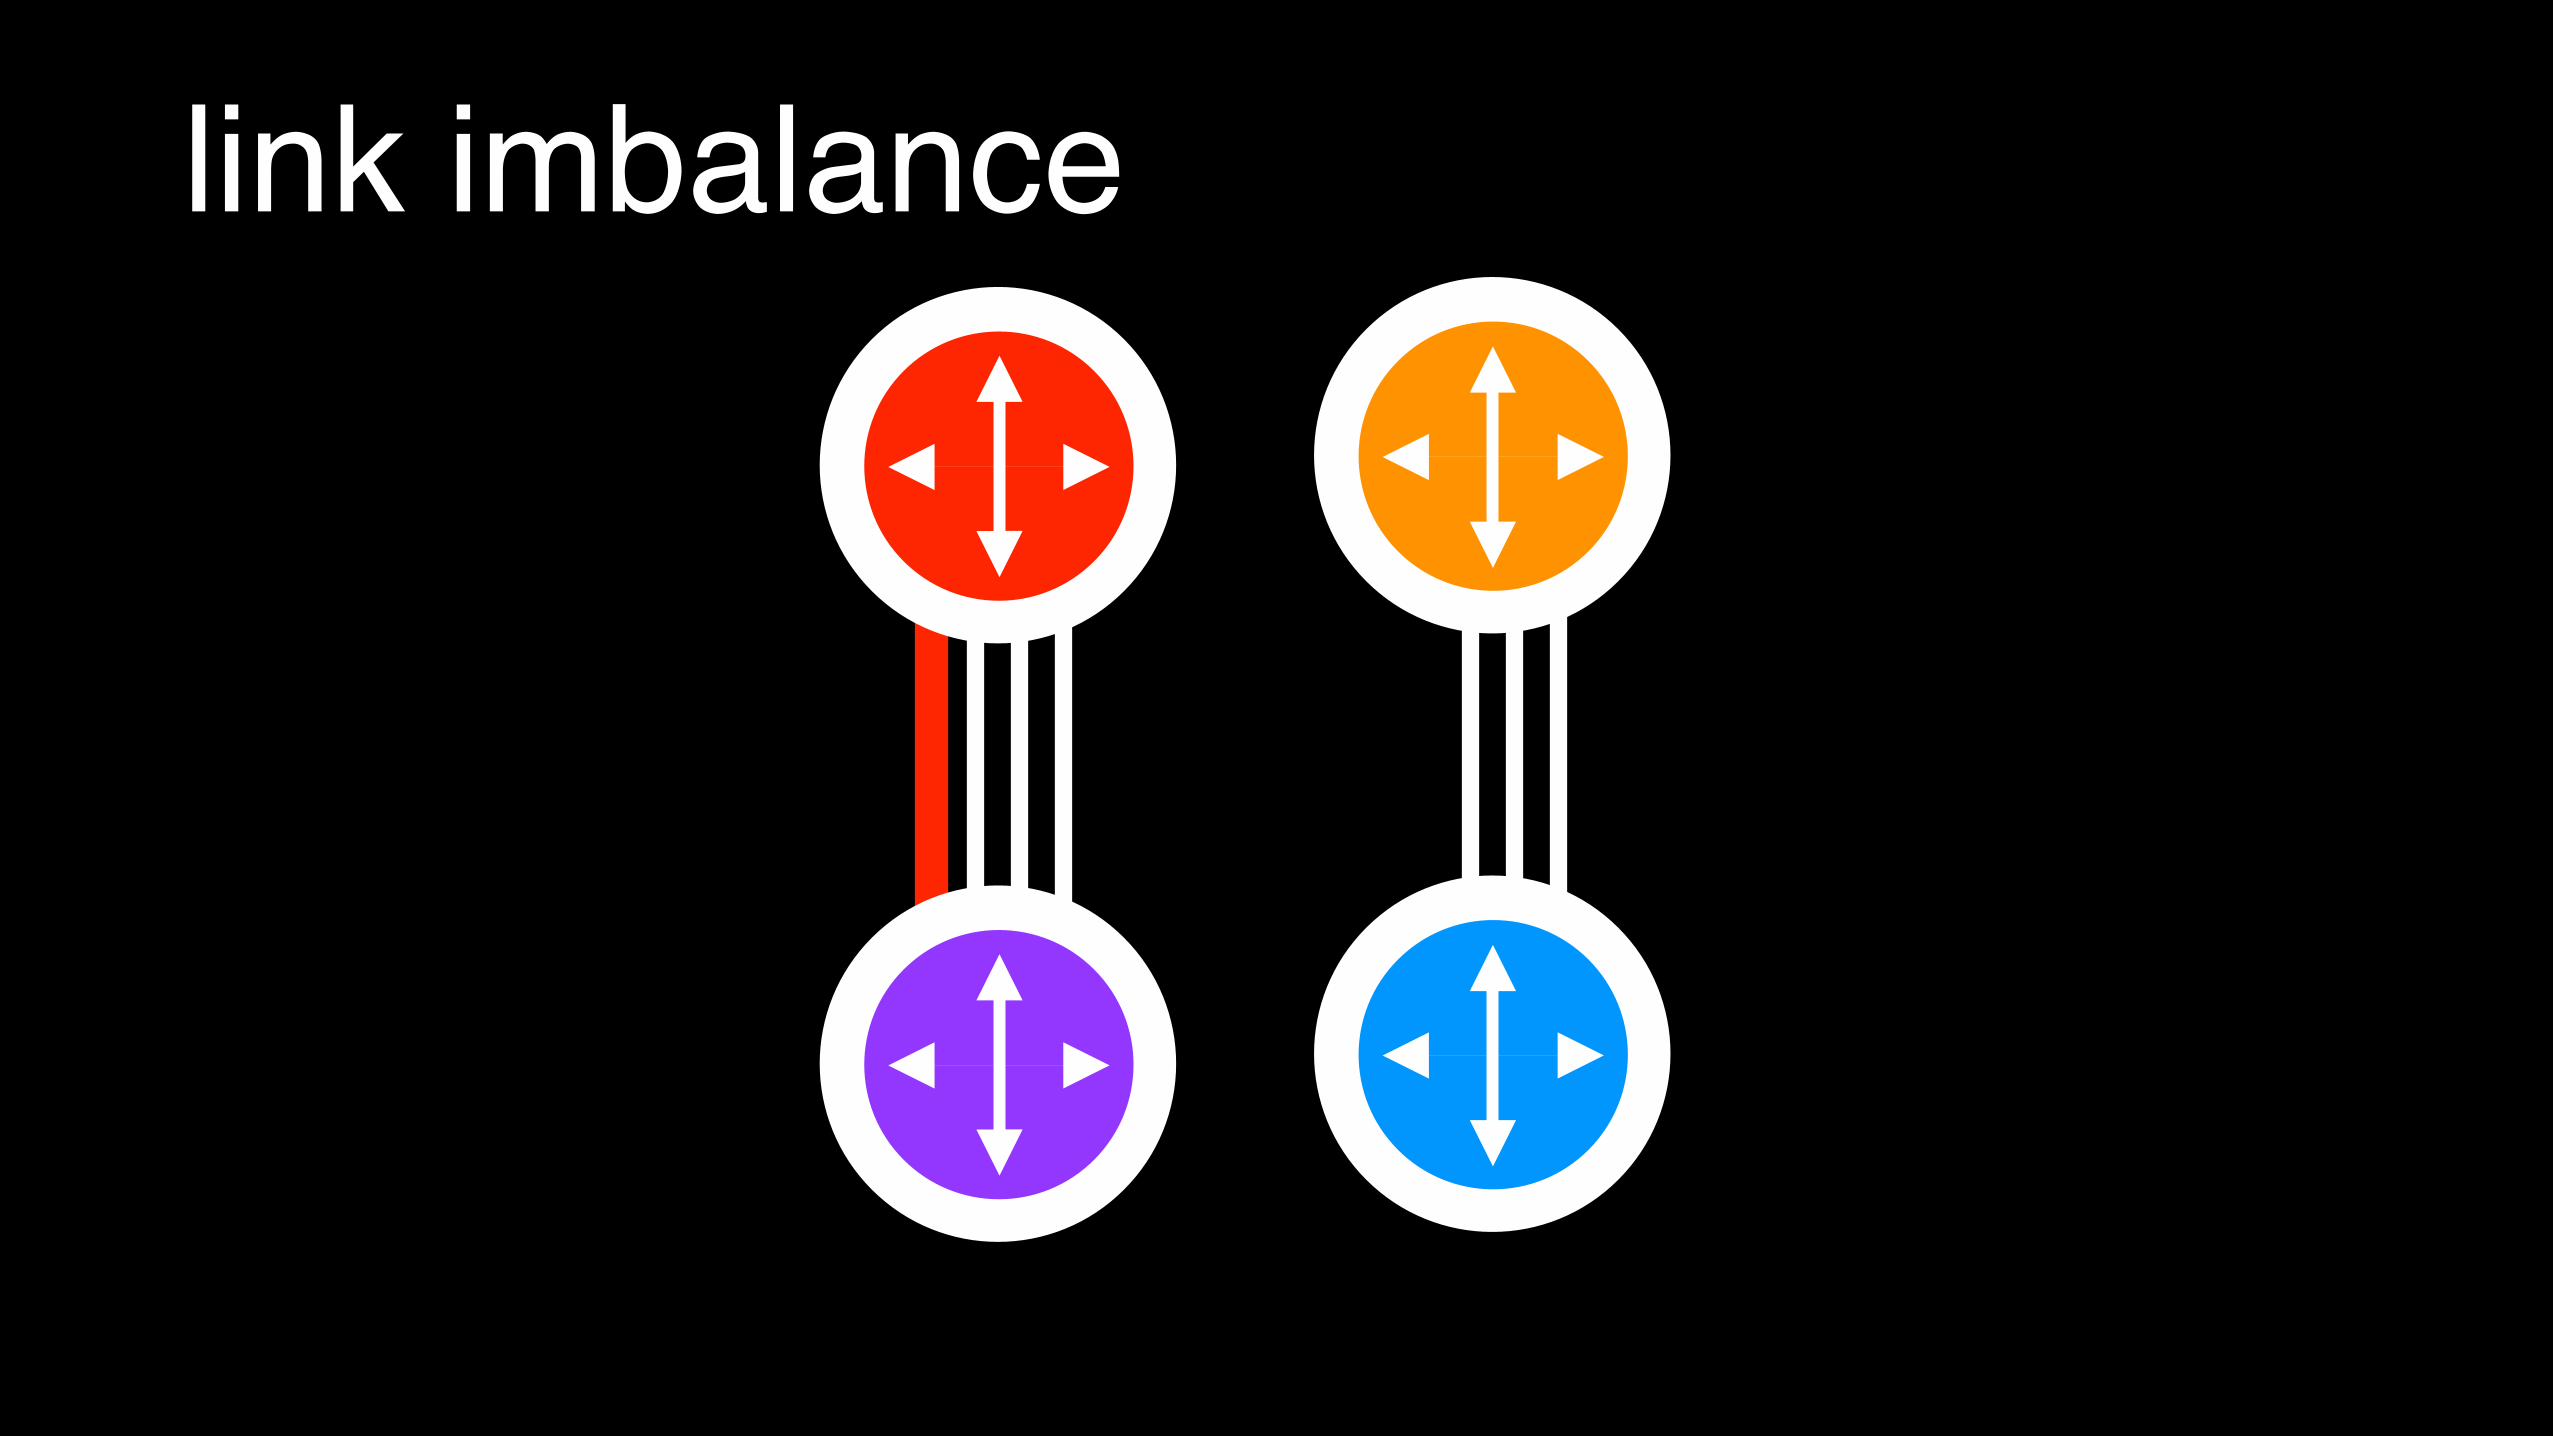
link imbalance
srsly wtf.

link imbalance
• BB Only
• >80%+ Util
• Migratory
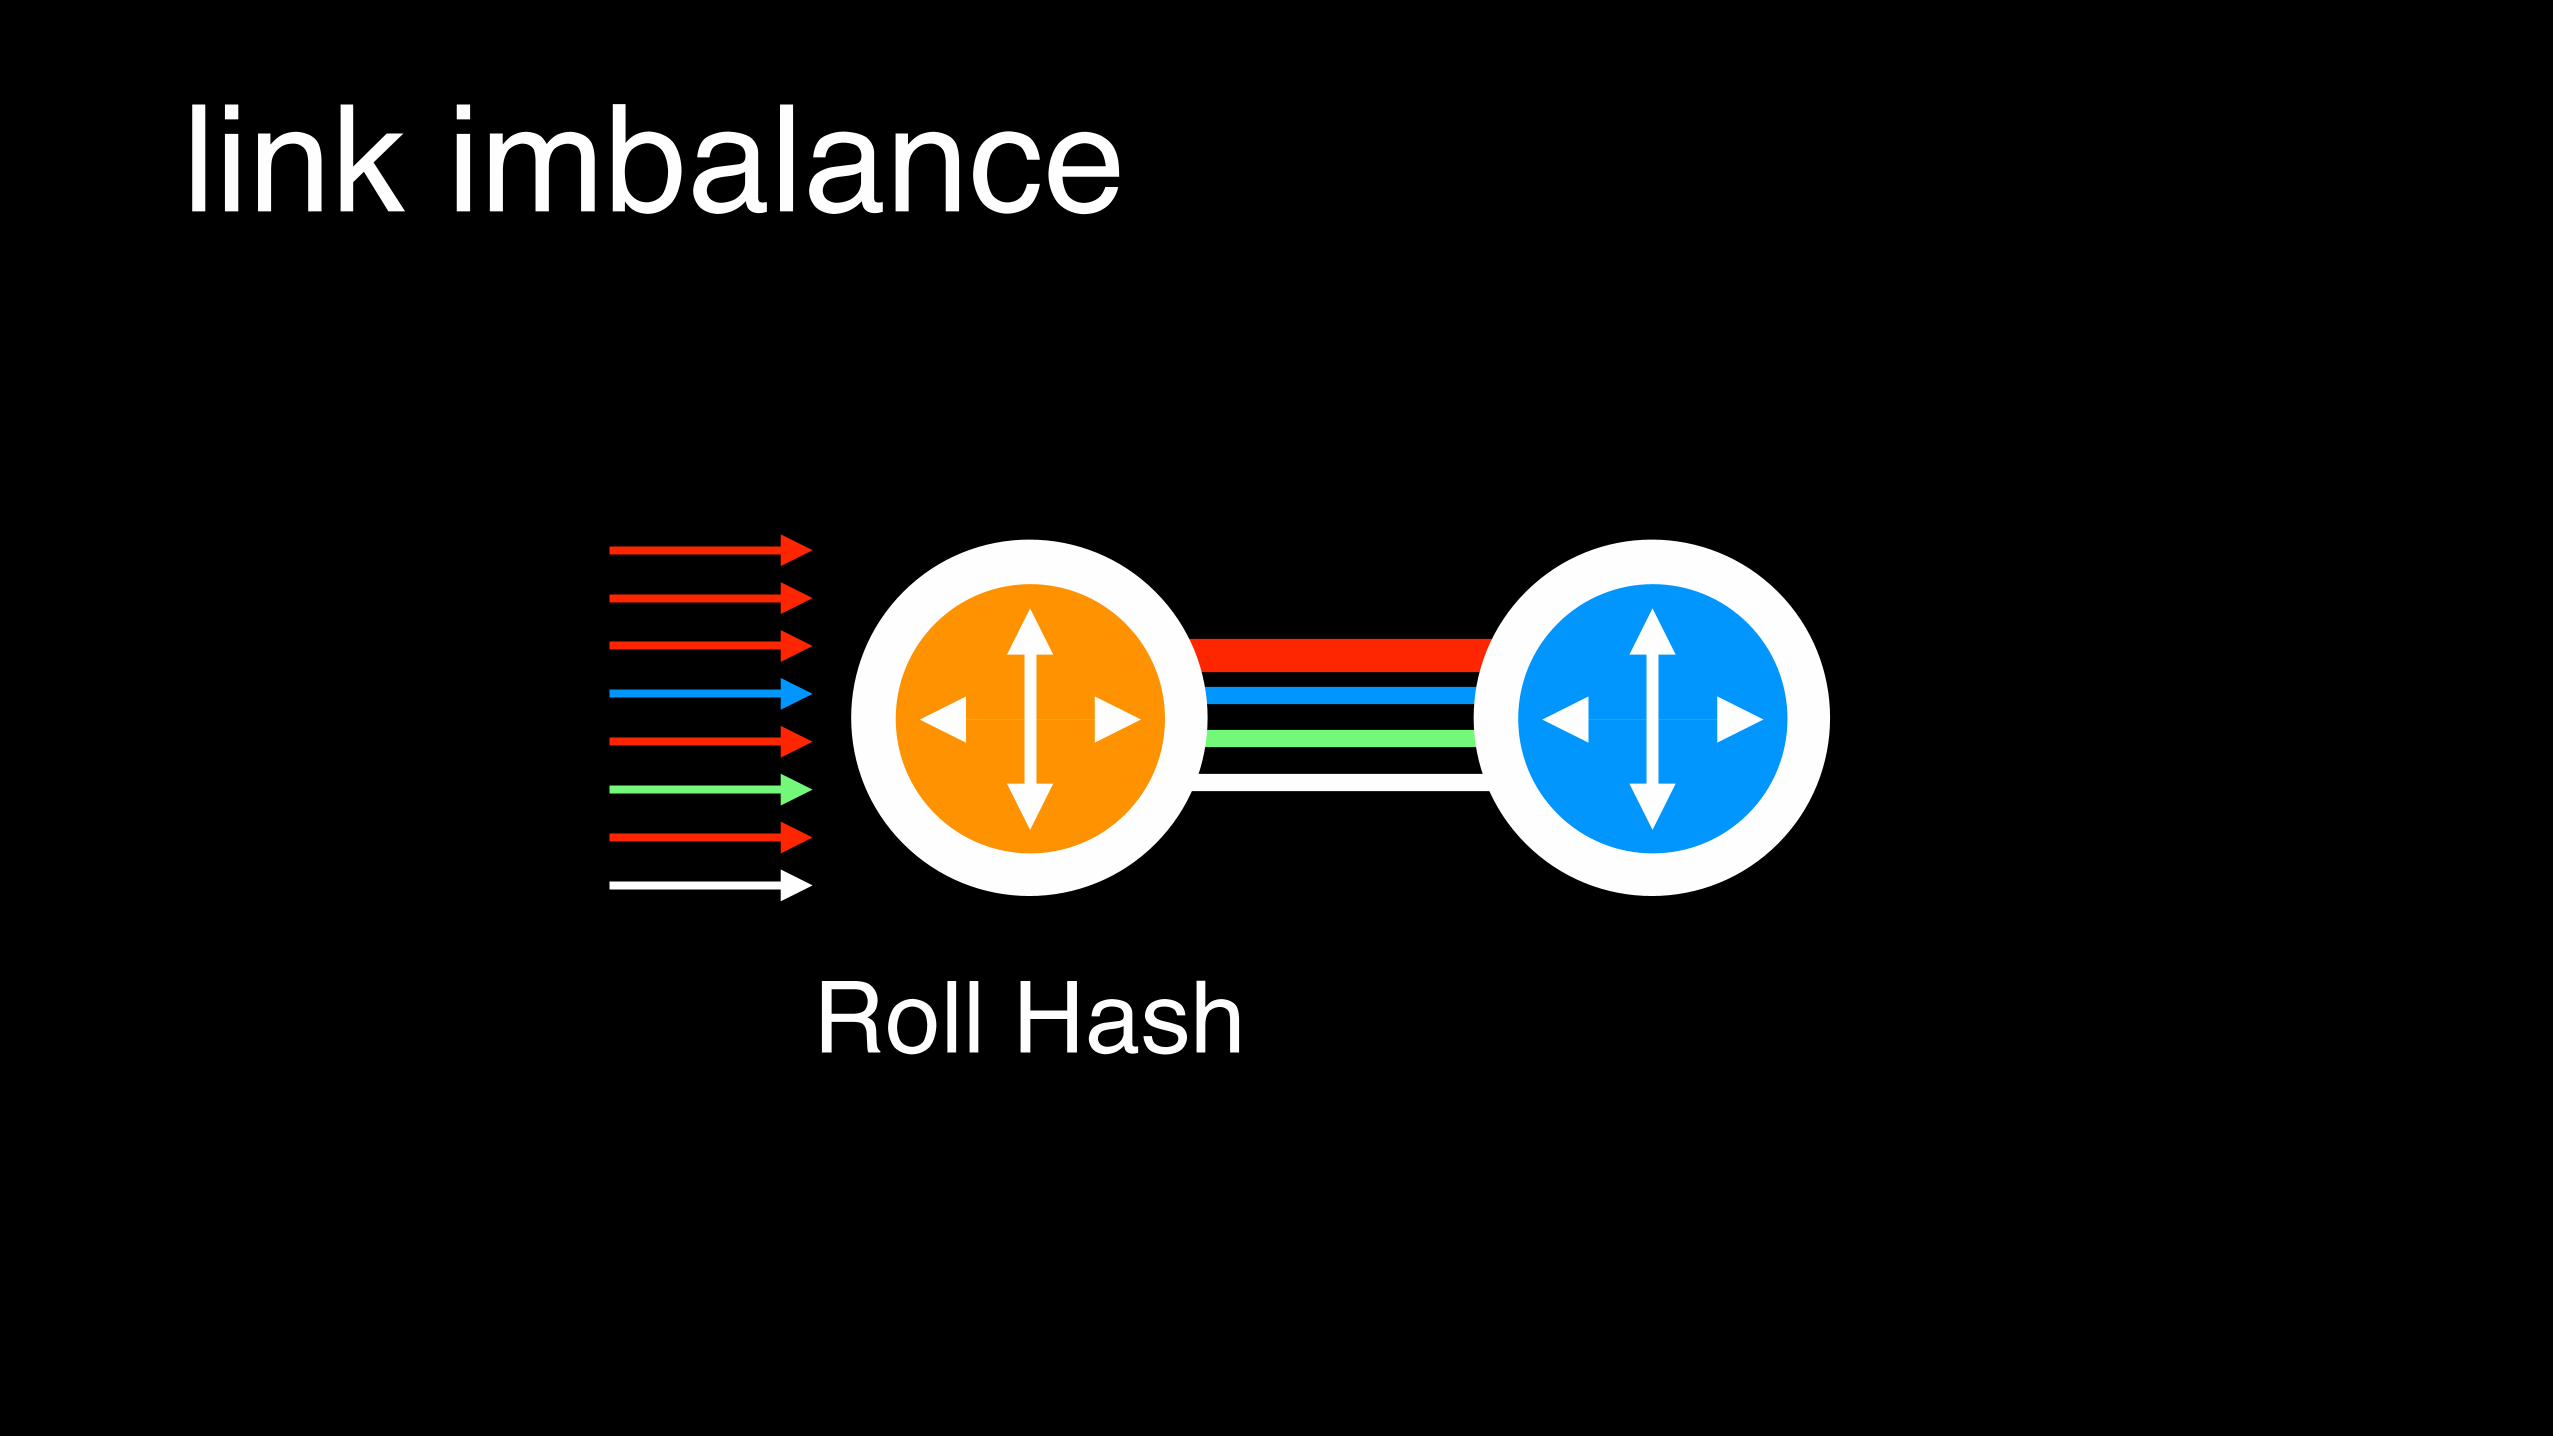
link imbalance
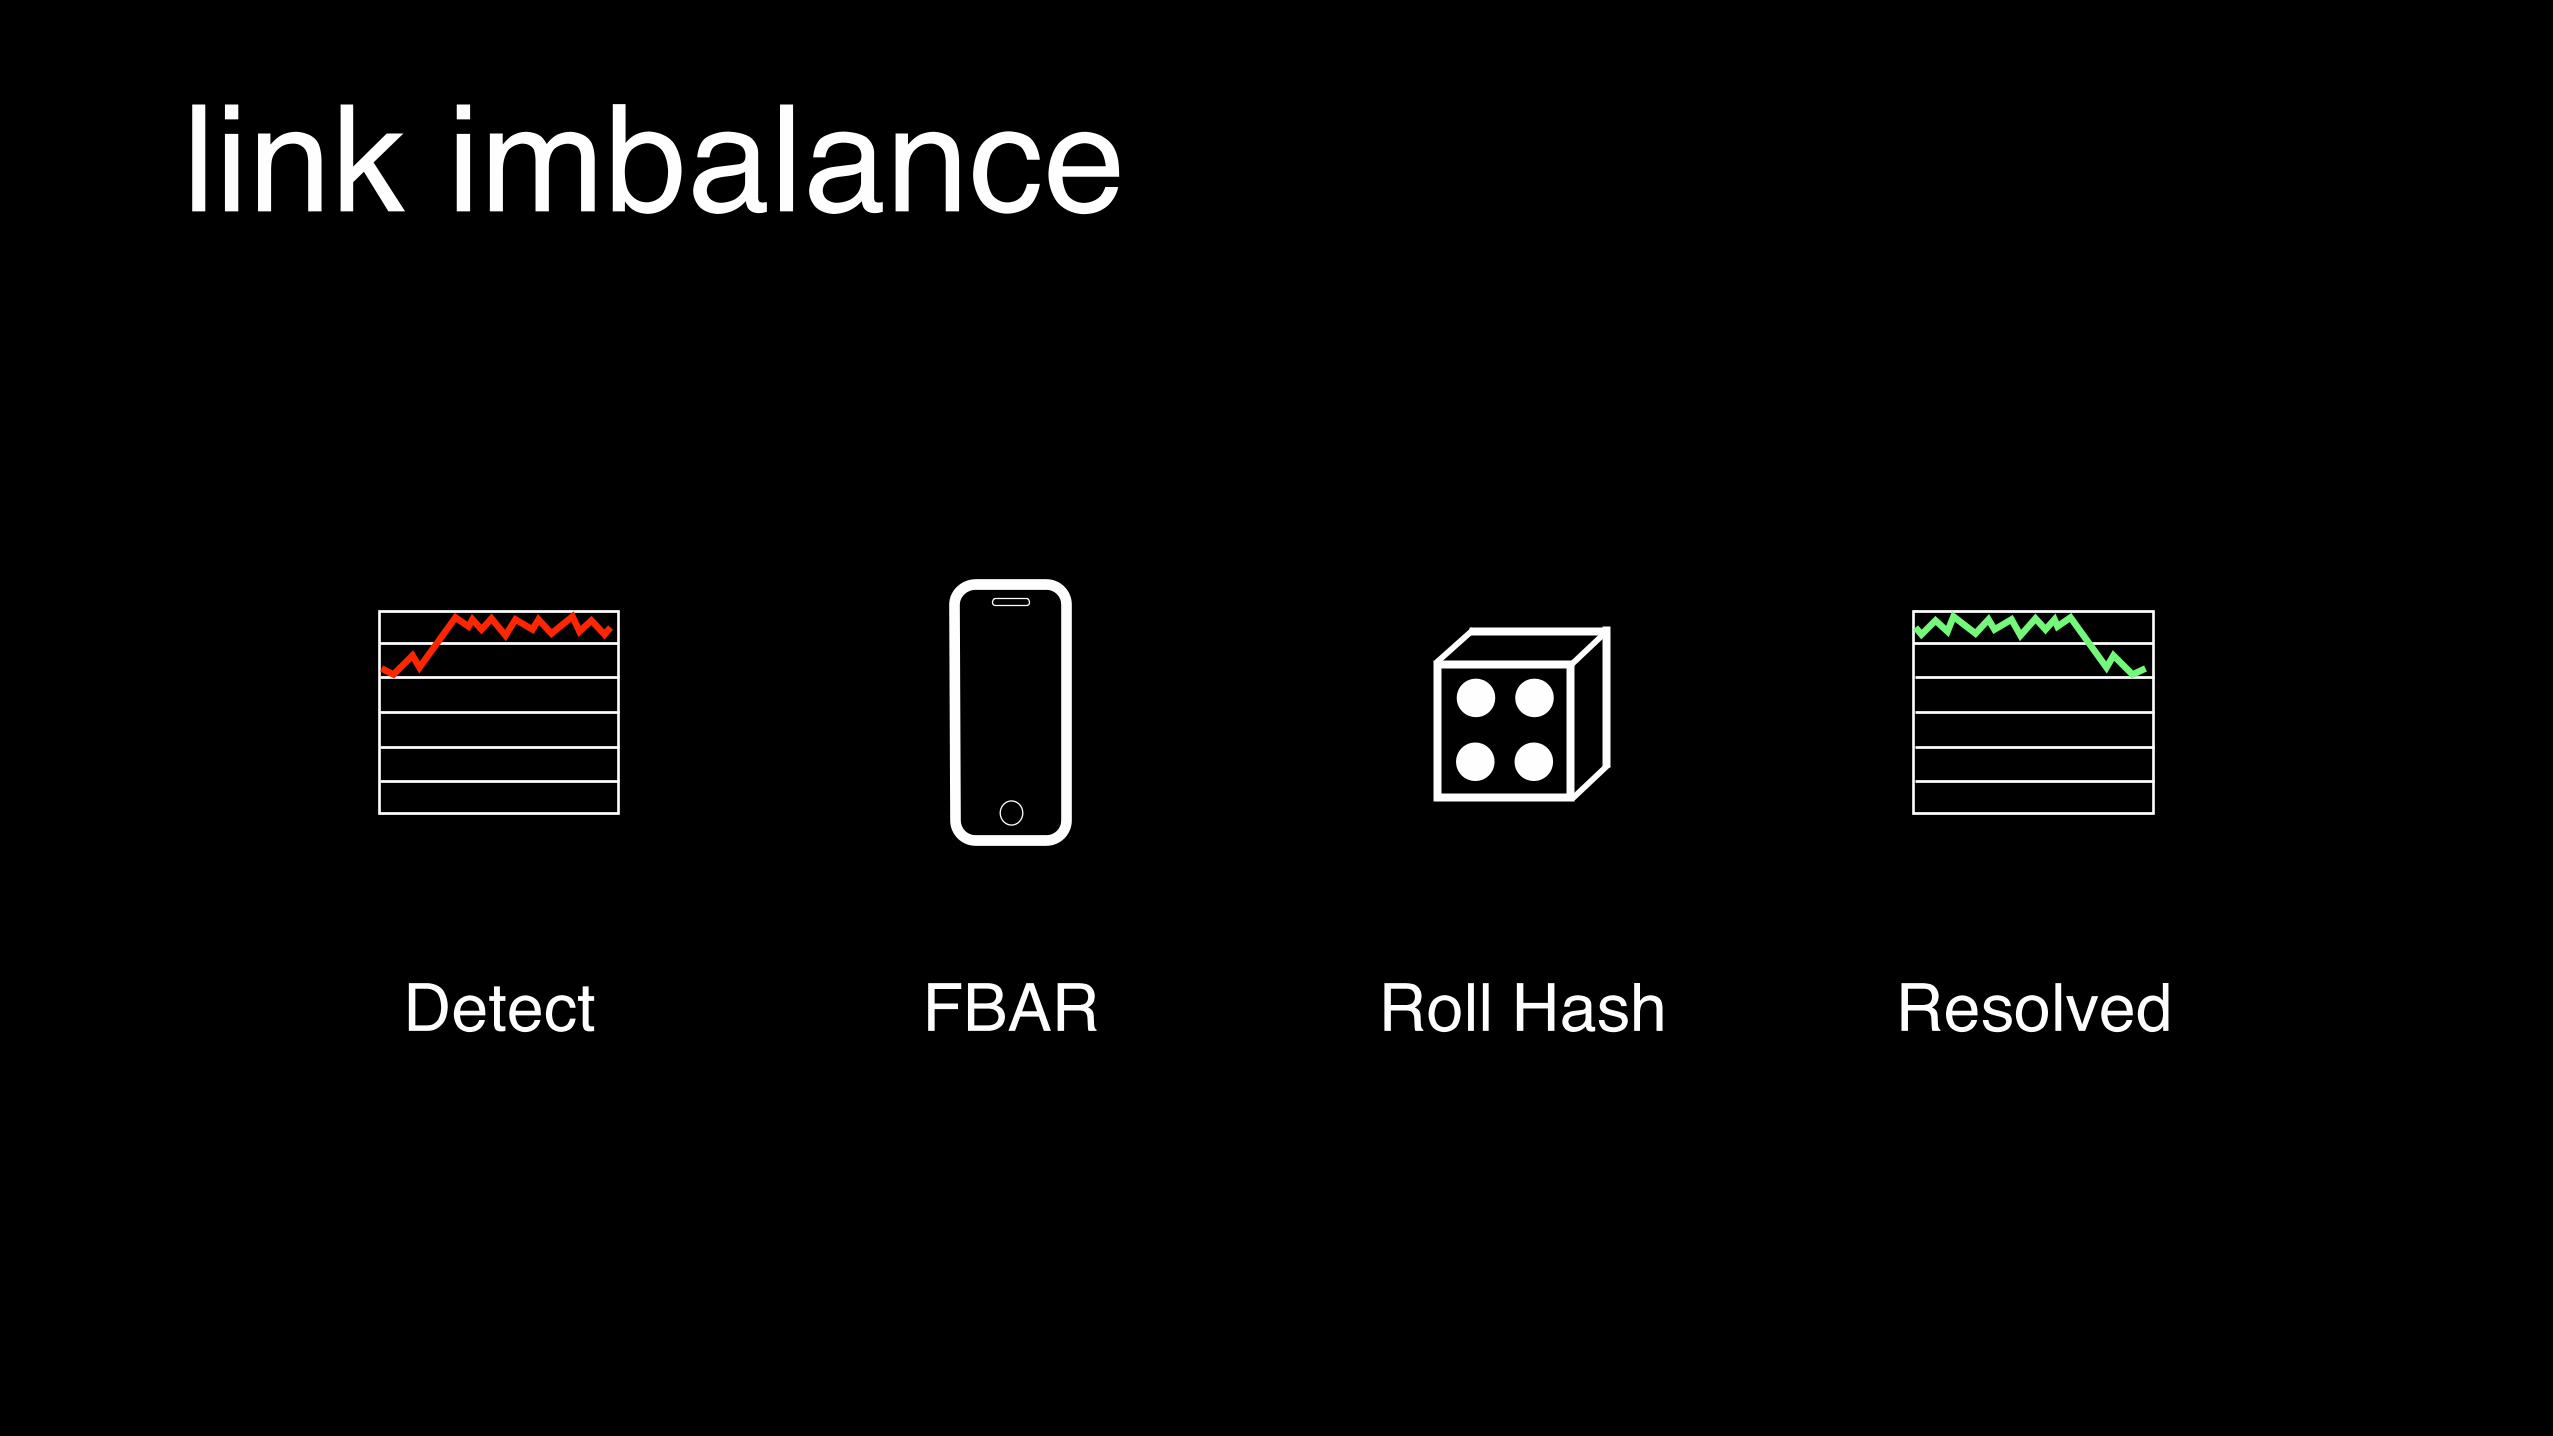
Roll Hash
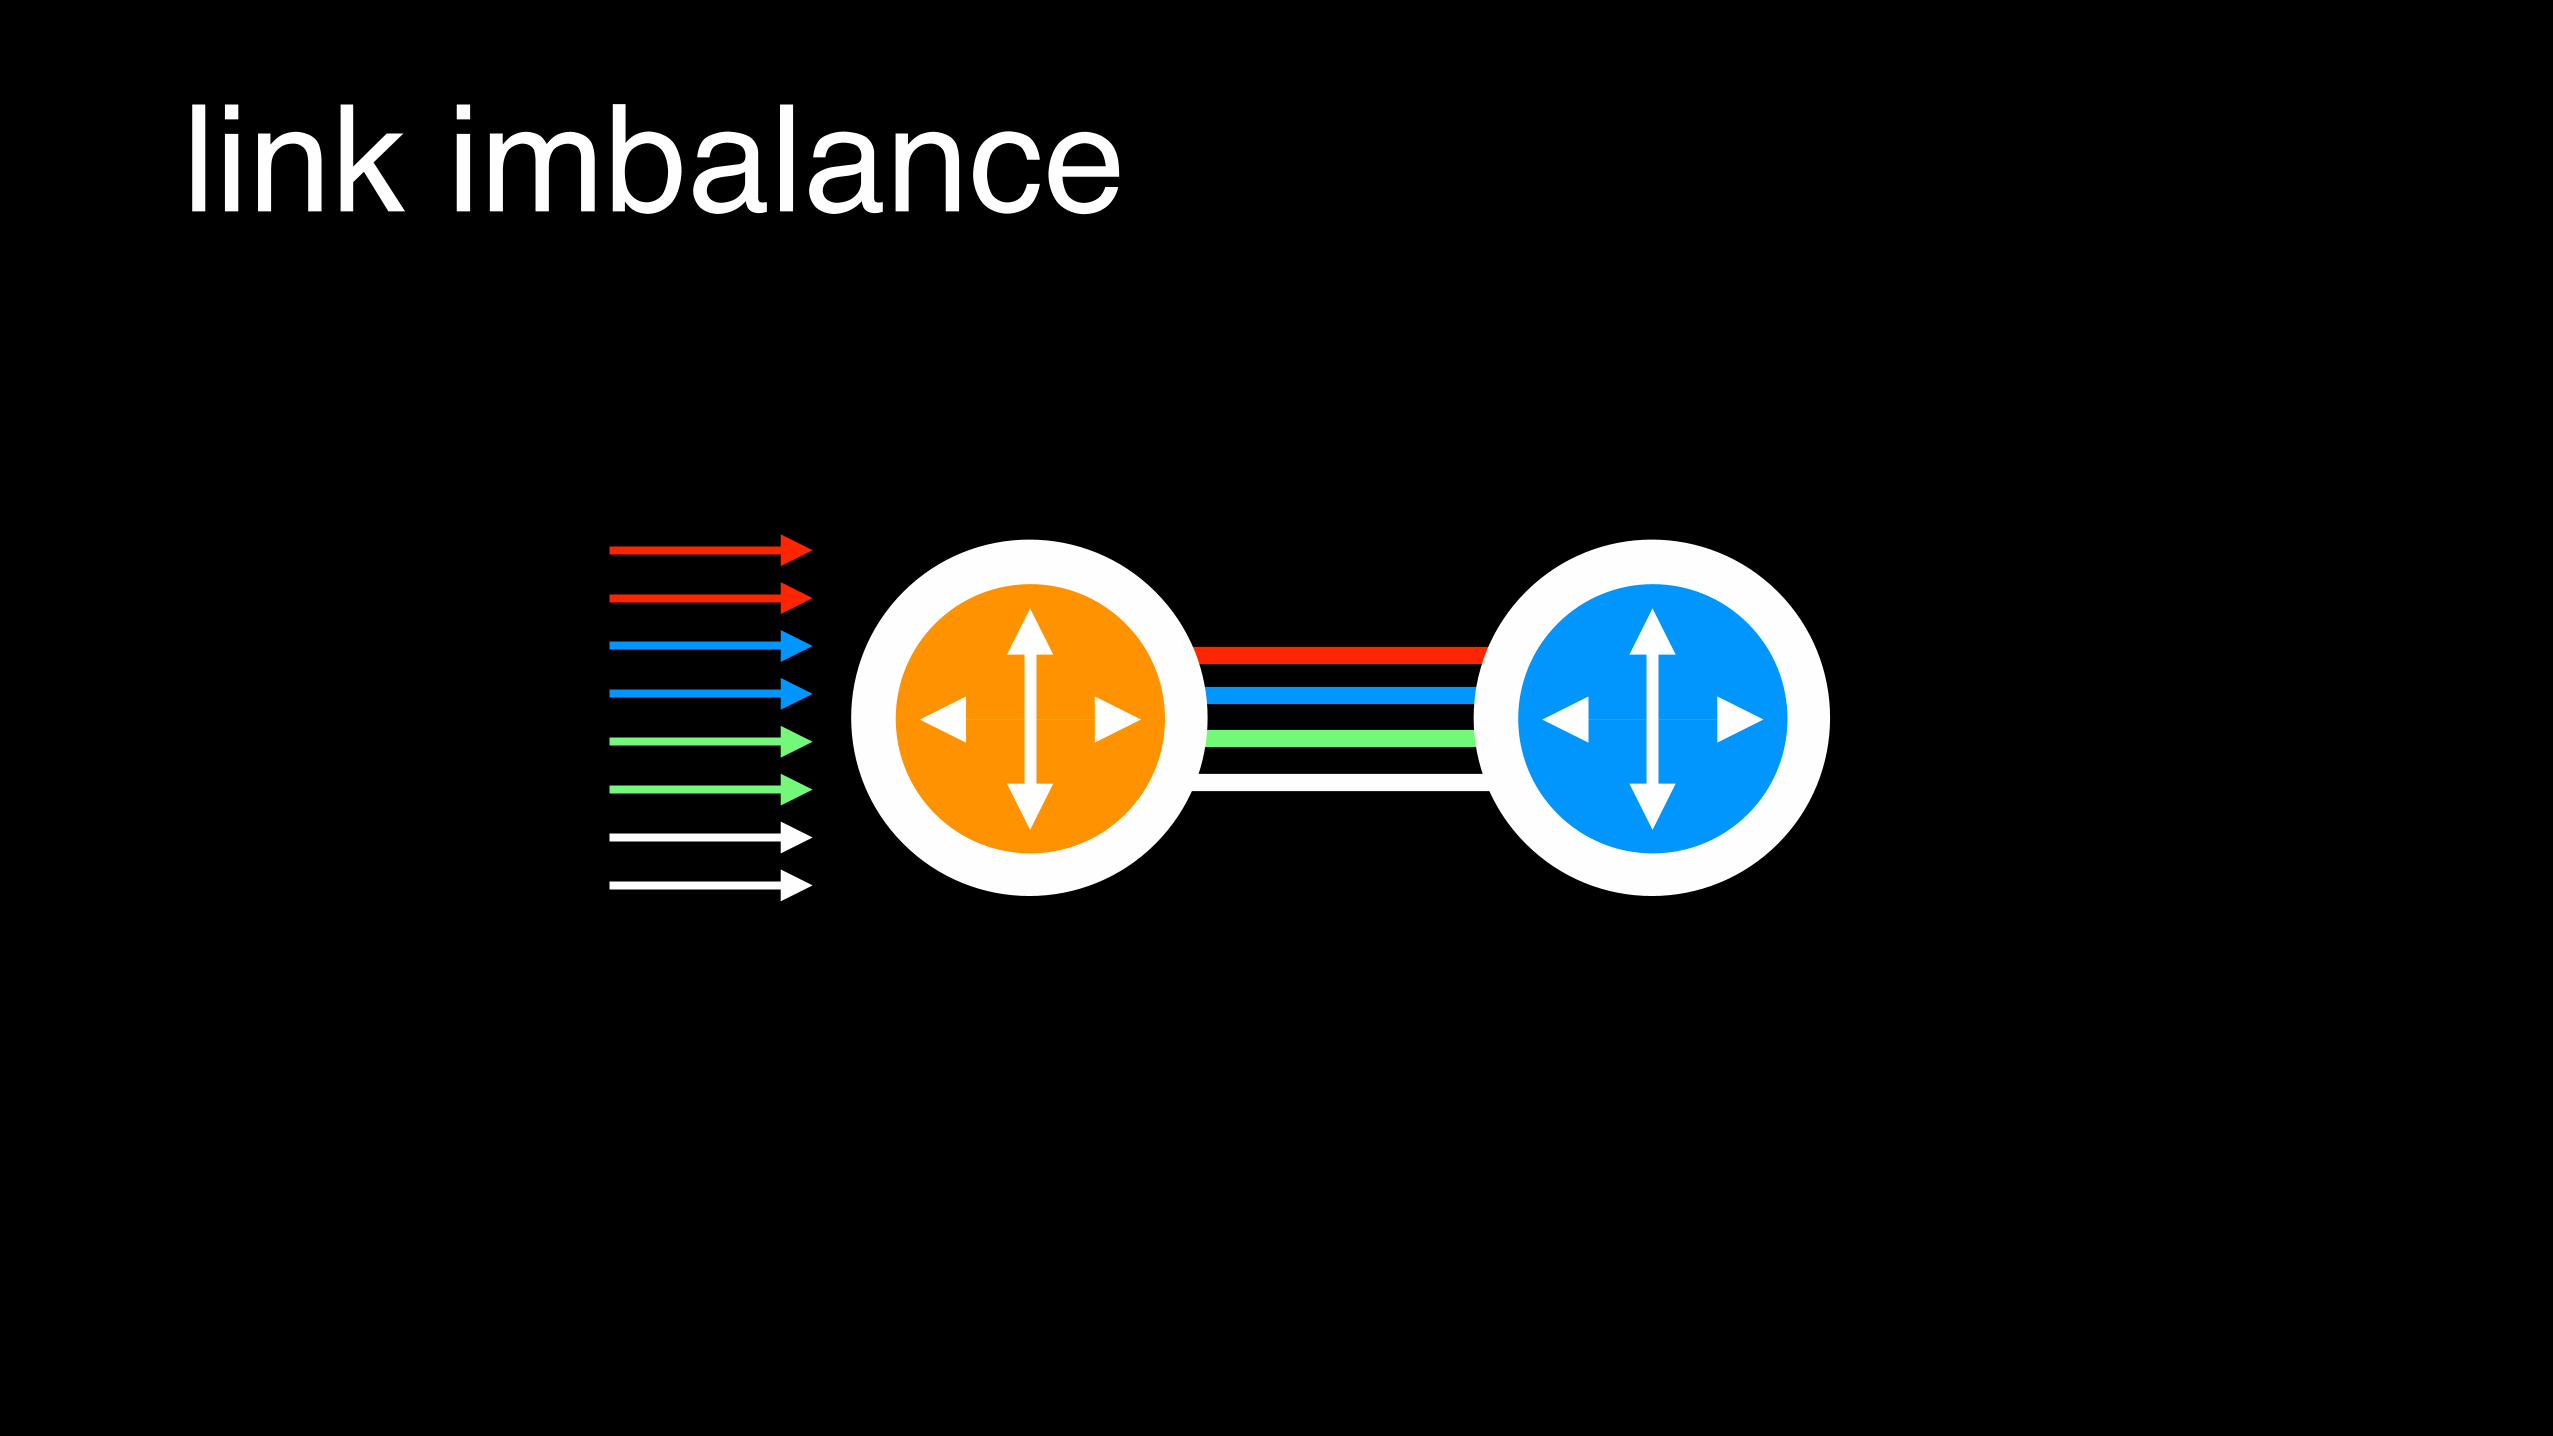
link imbalance

link imbalance
fml.
link imbalance
Roll HashDetect ResolvedFBAR


link imbalance
ZOMG!! WTF!! NO, NO, NO! &(#$&*(
link imbalance
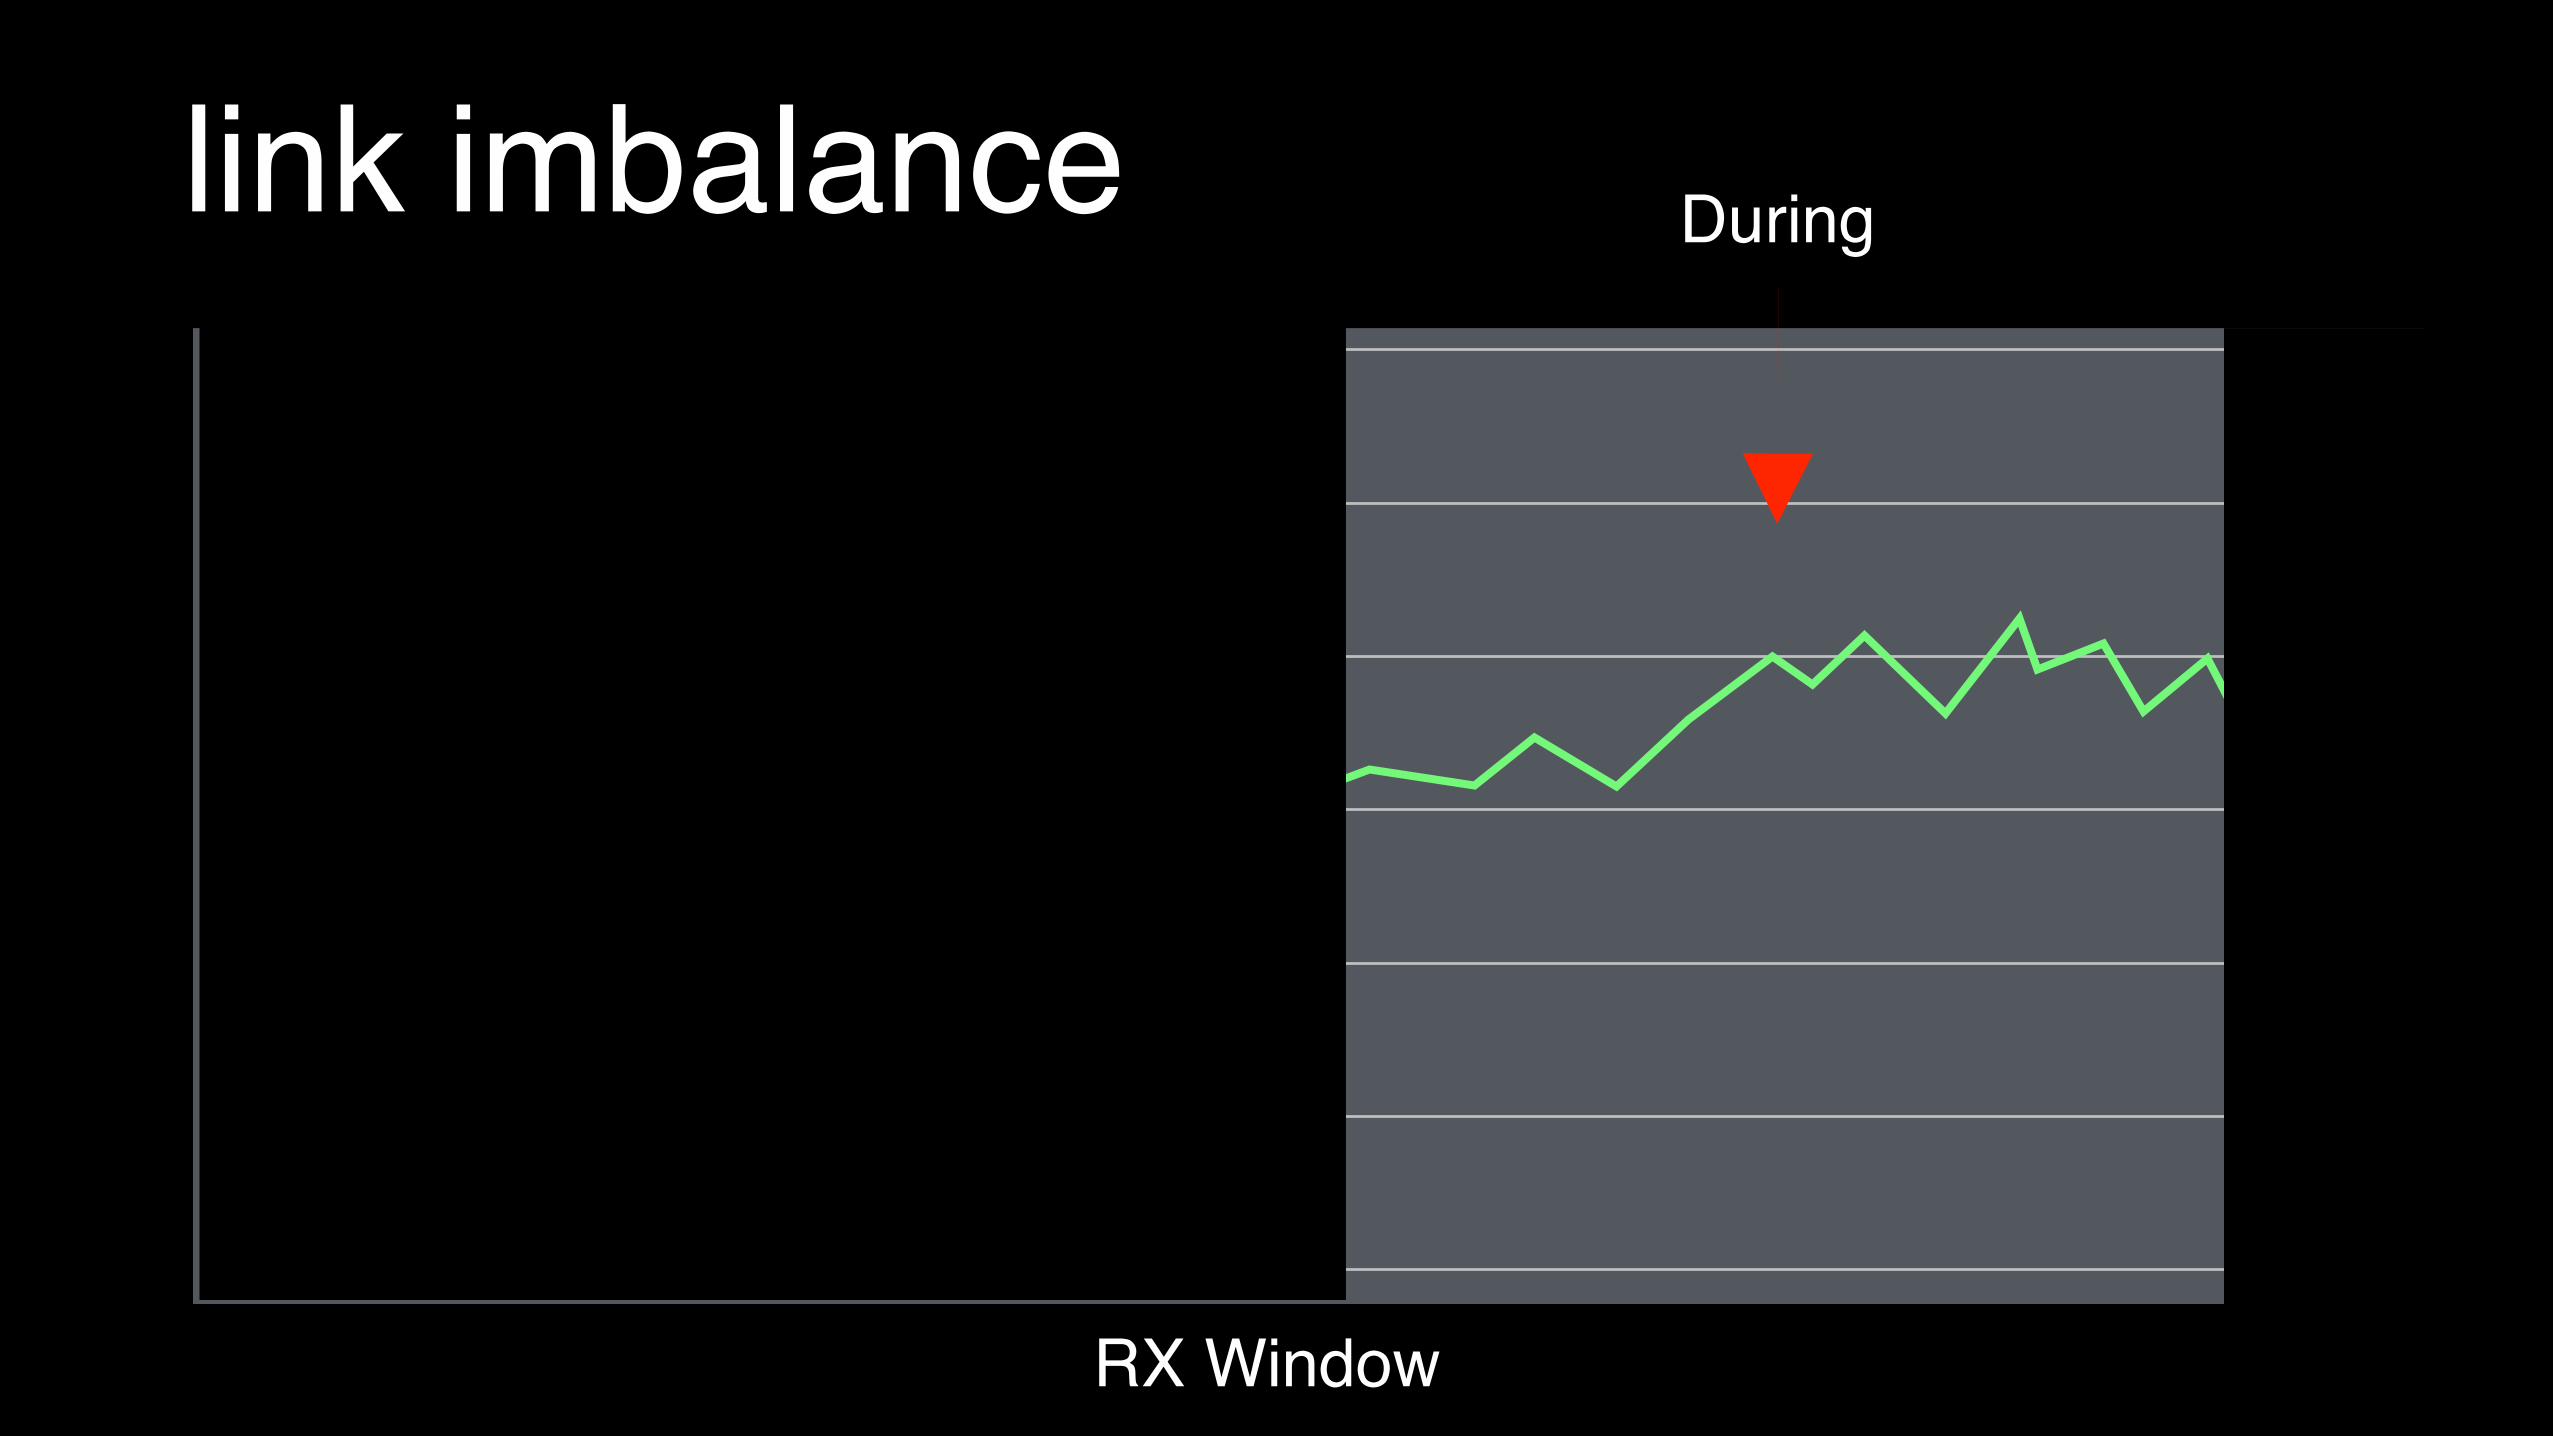
RX Window
During
link imbalance
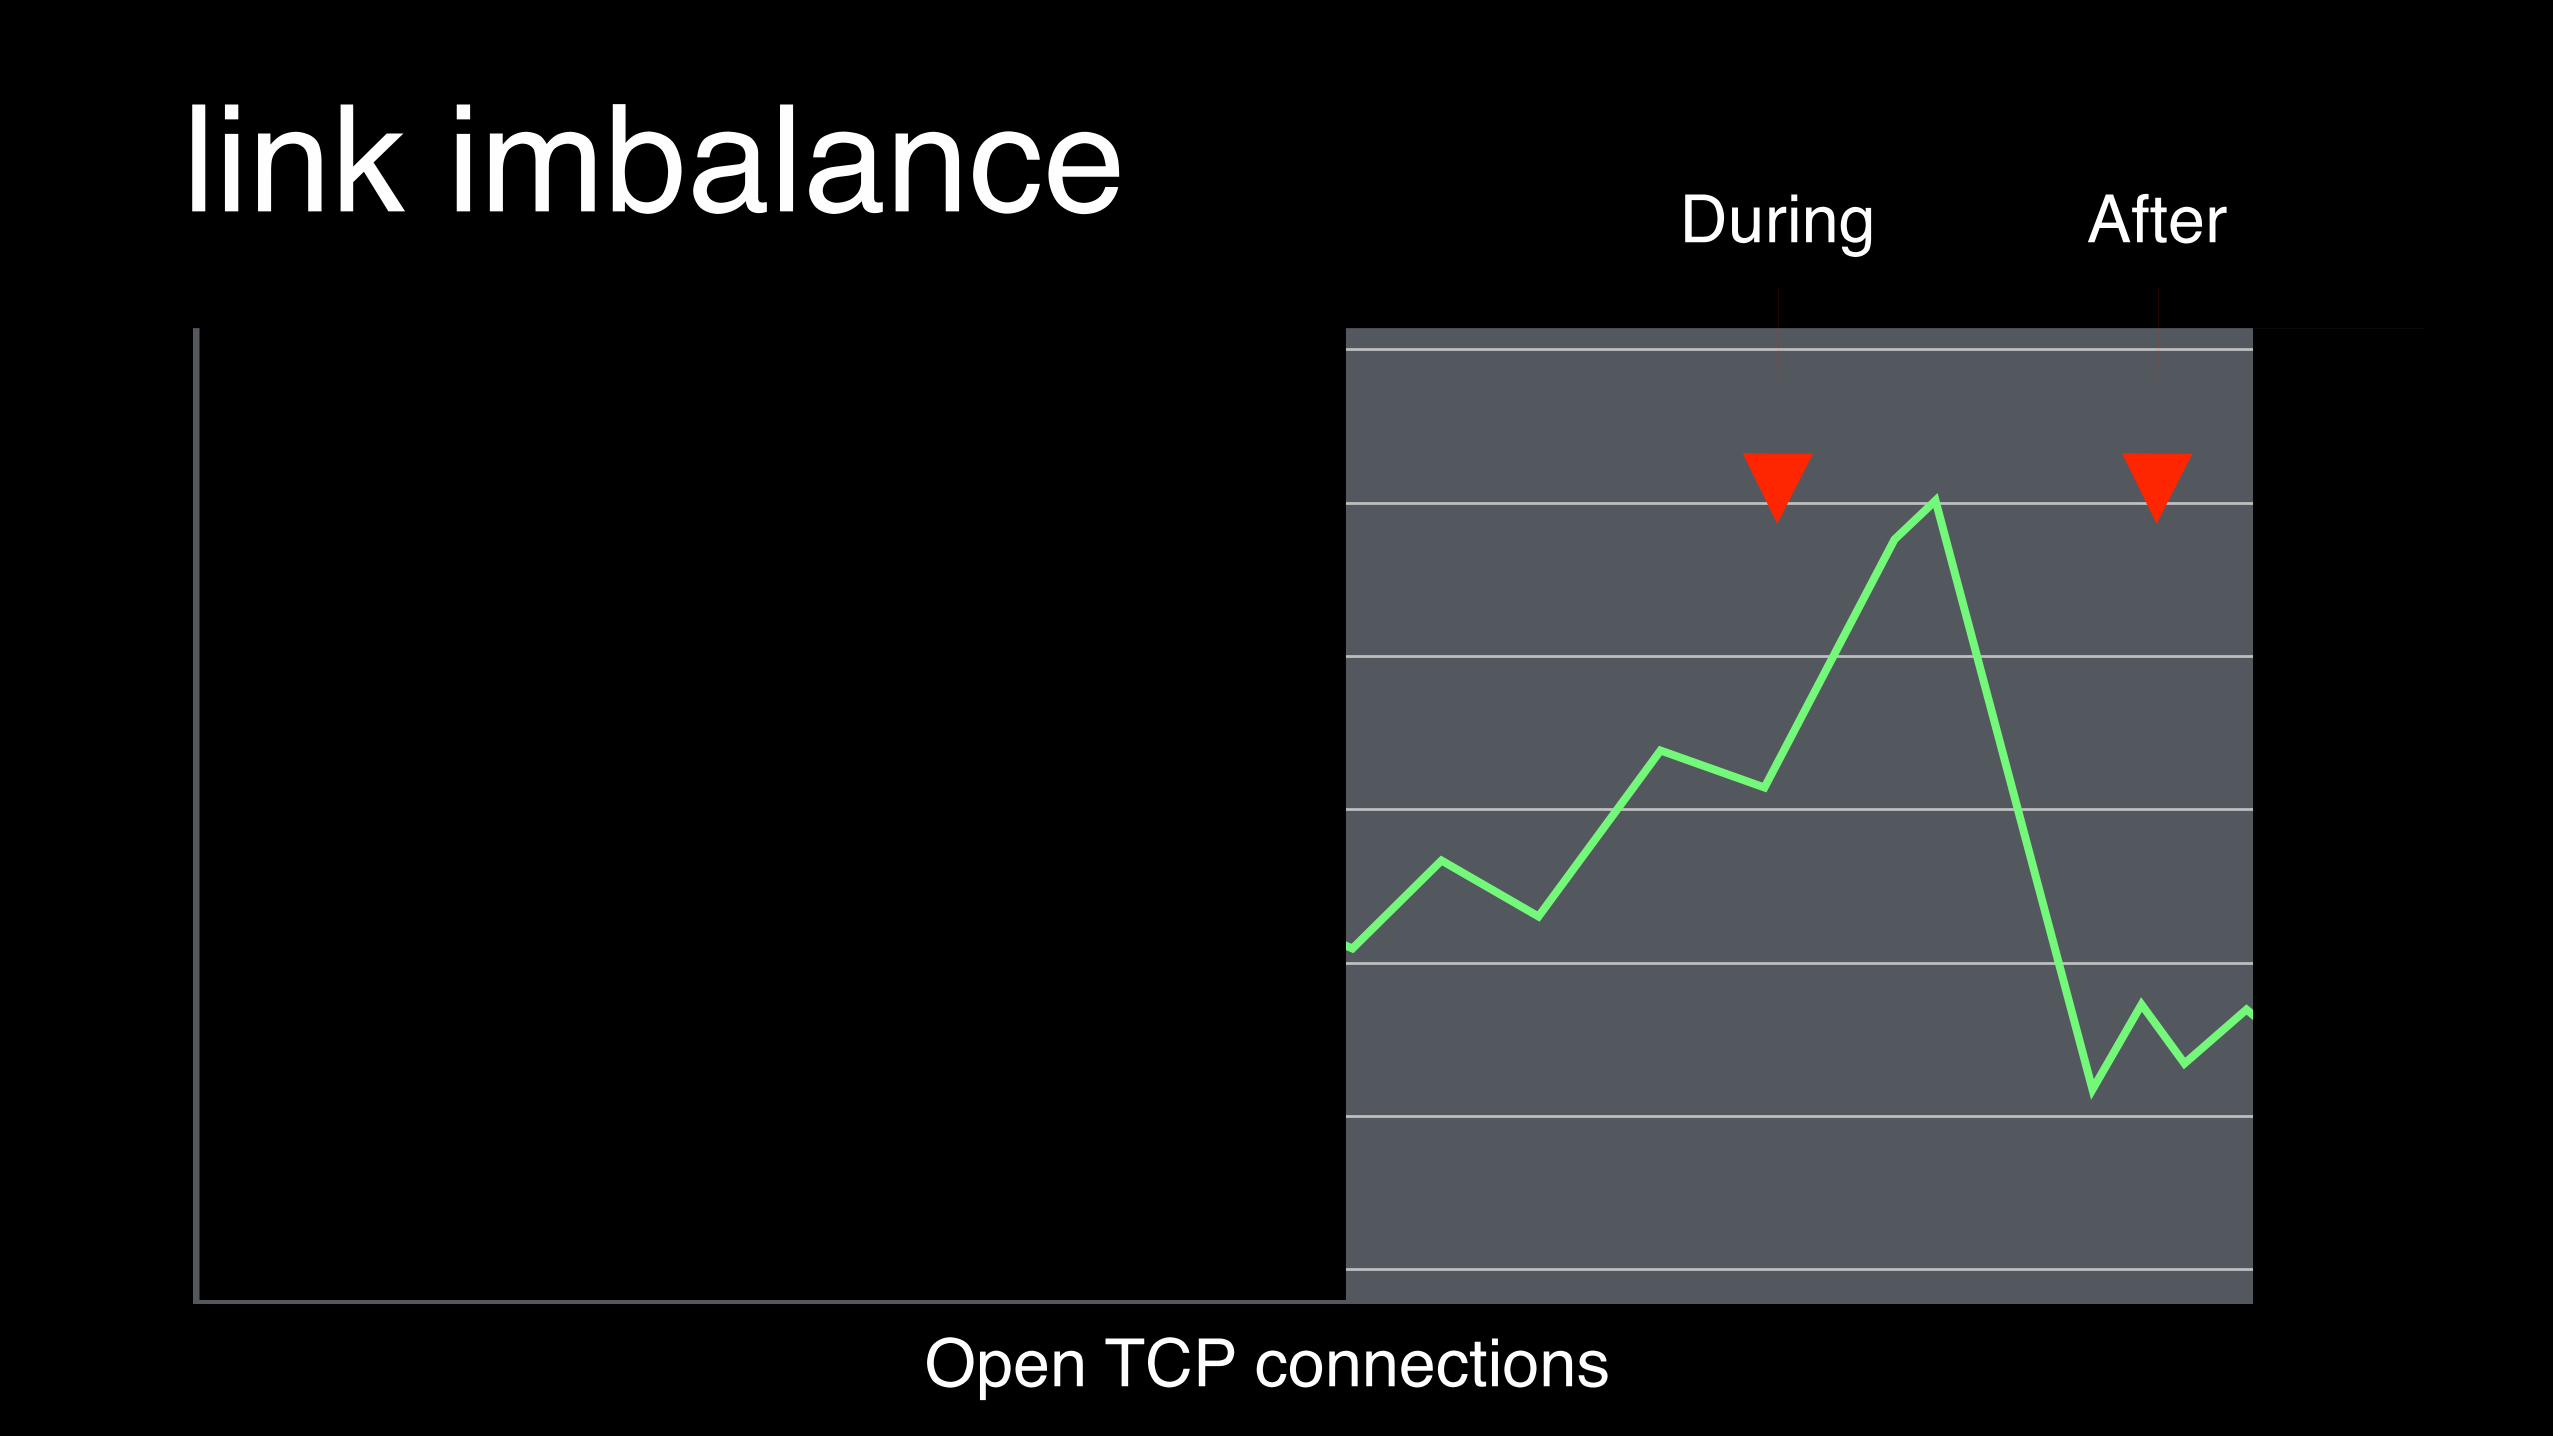
Open TCP connections
During After
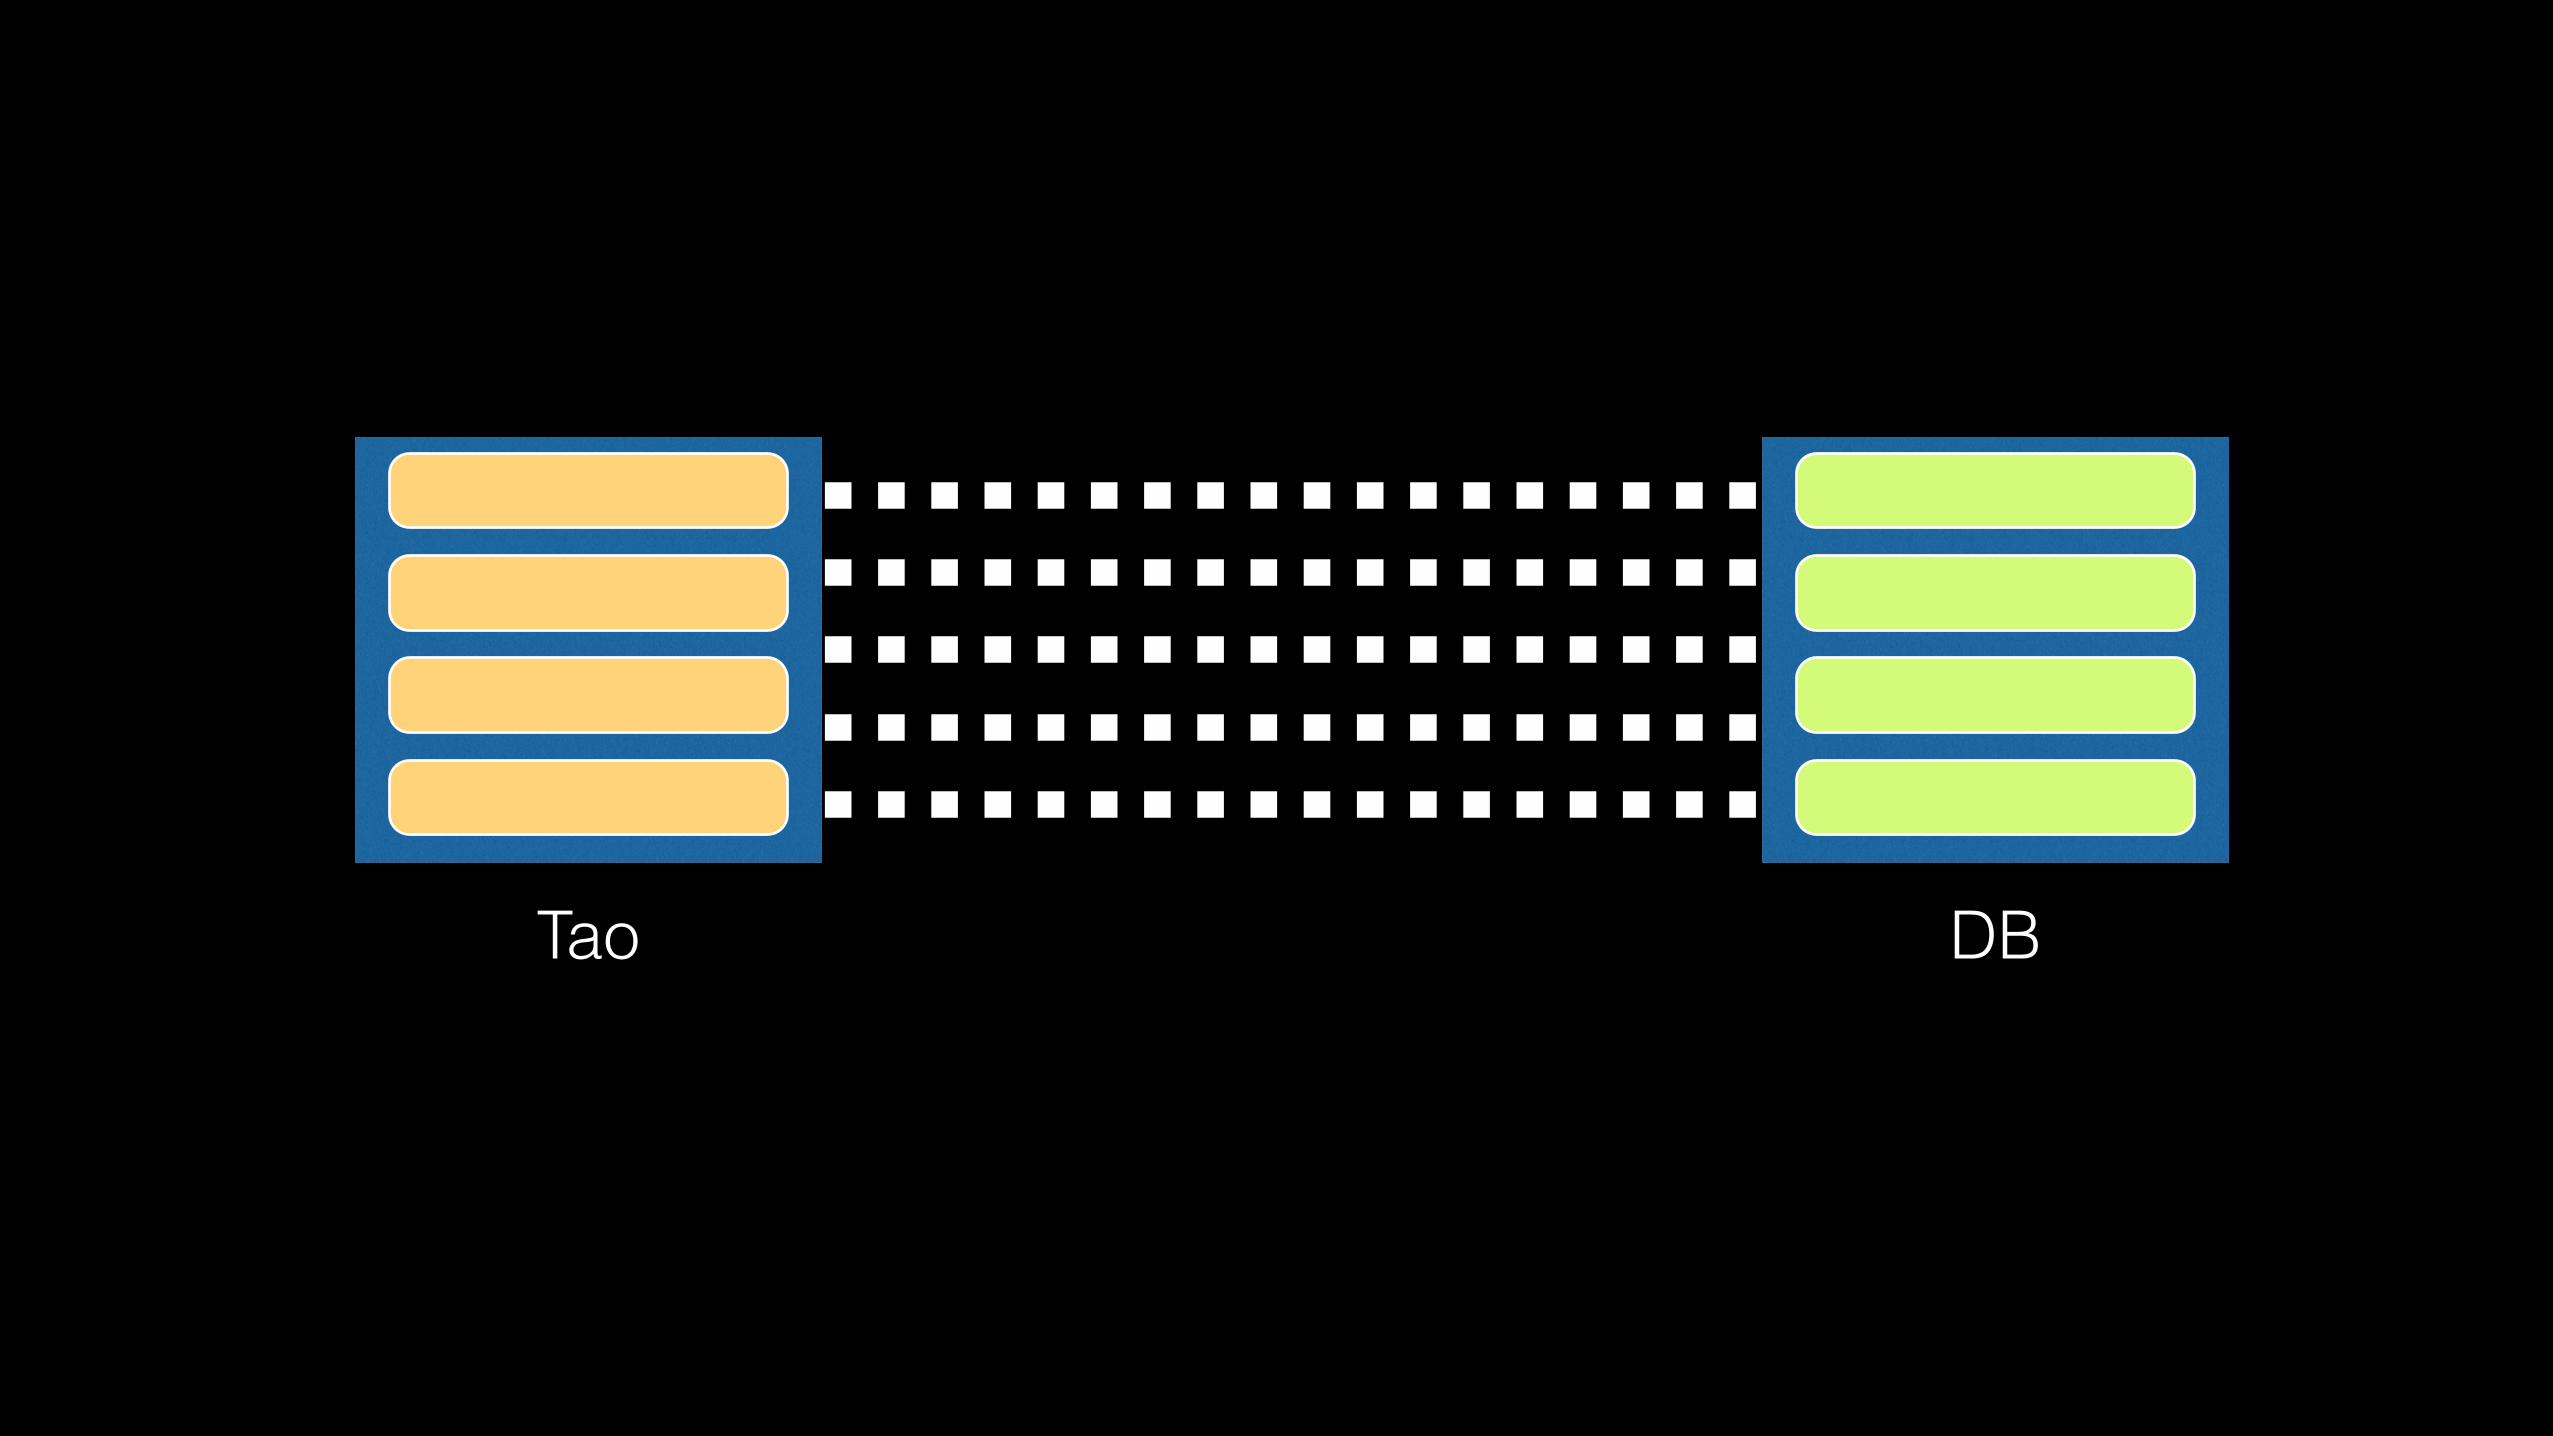
Tao DB
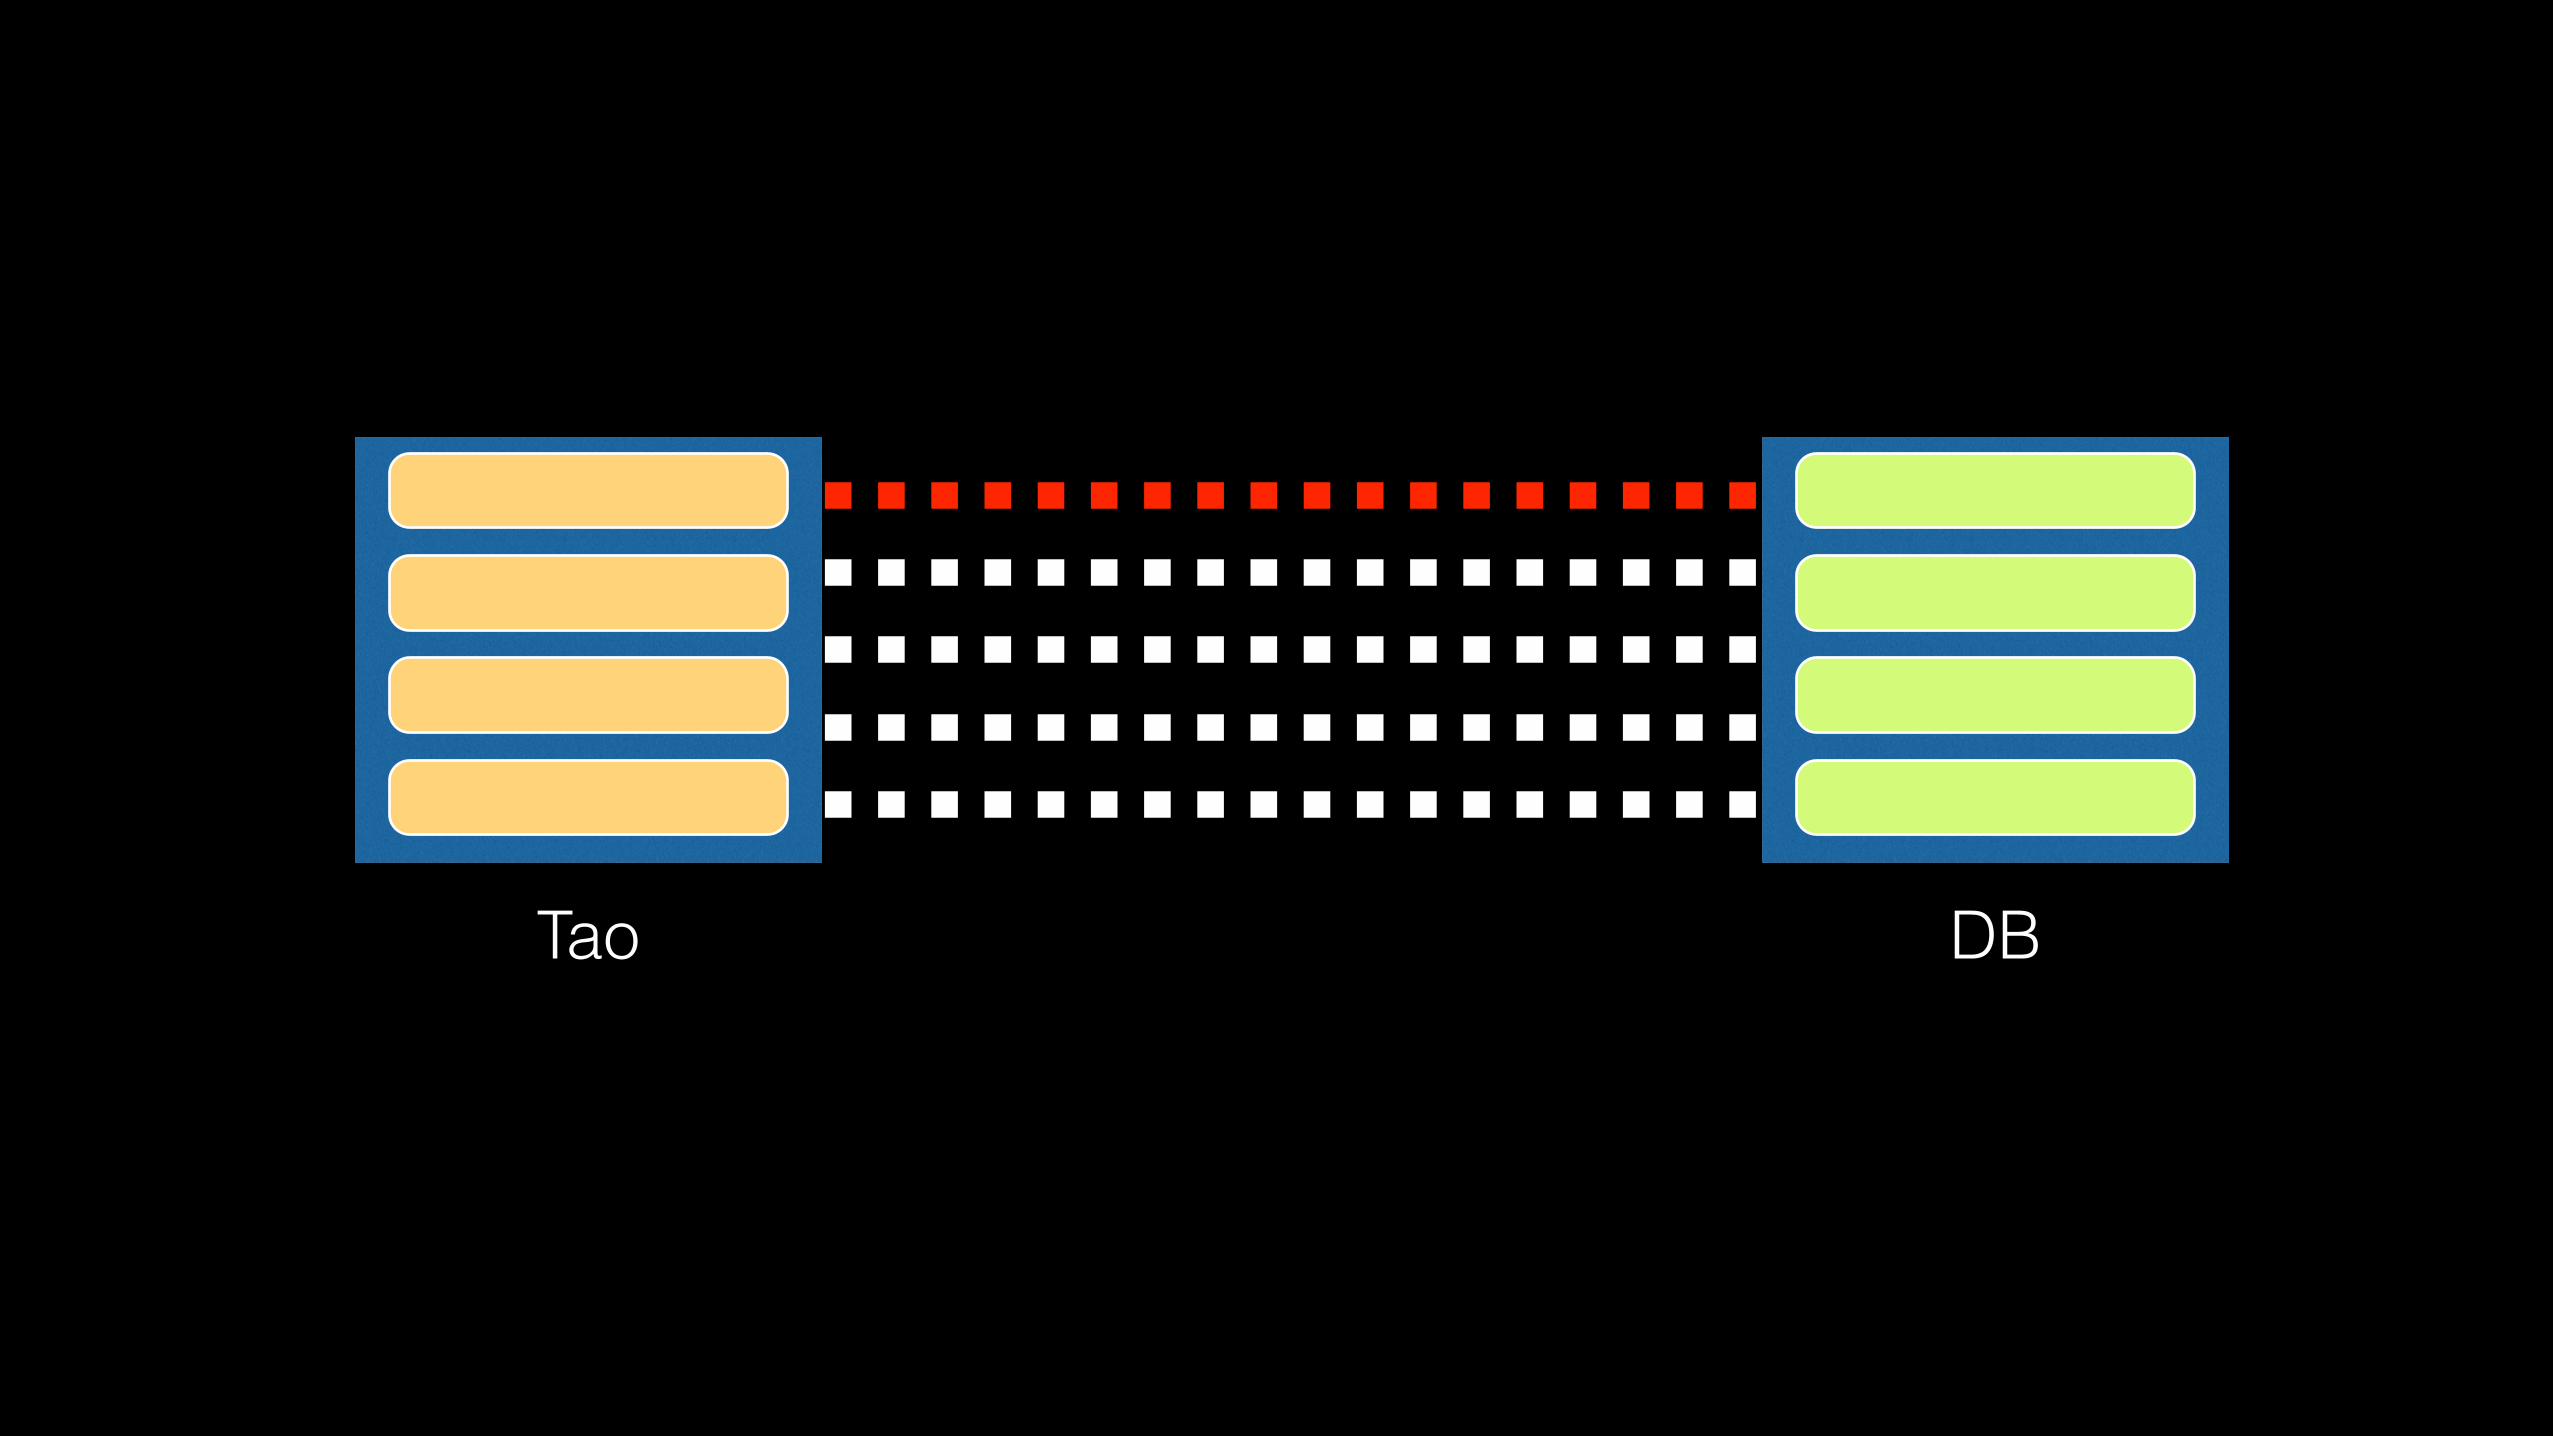
Tao DB
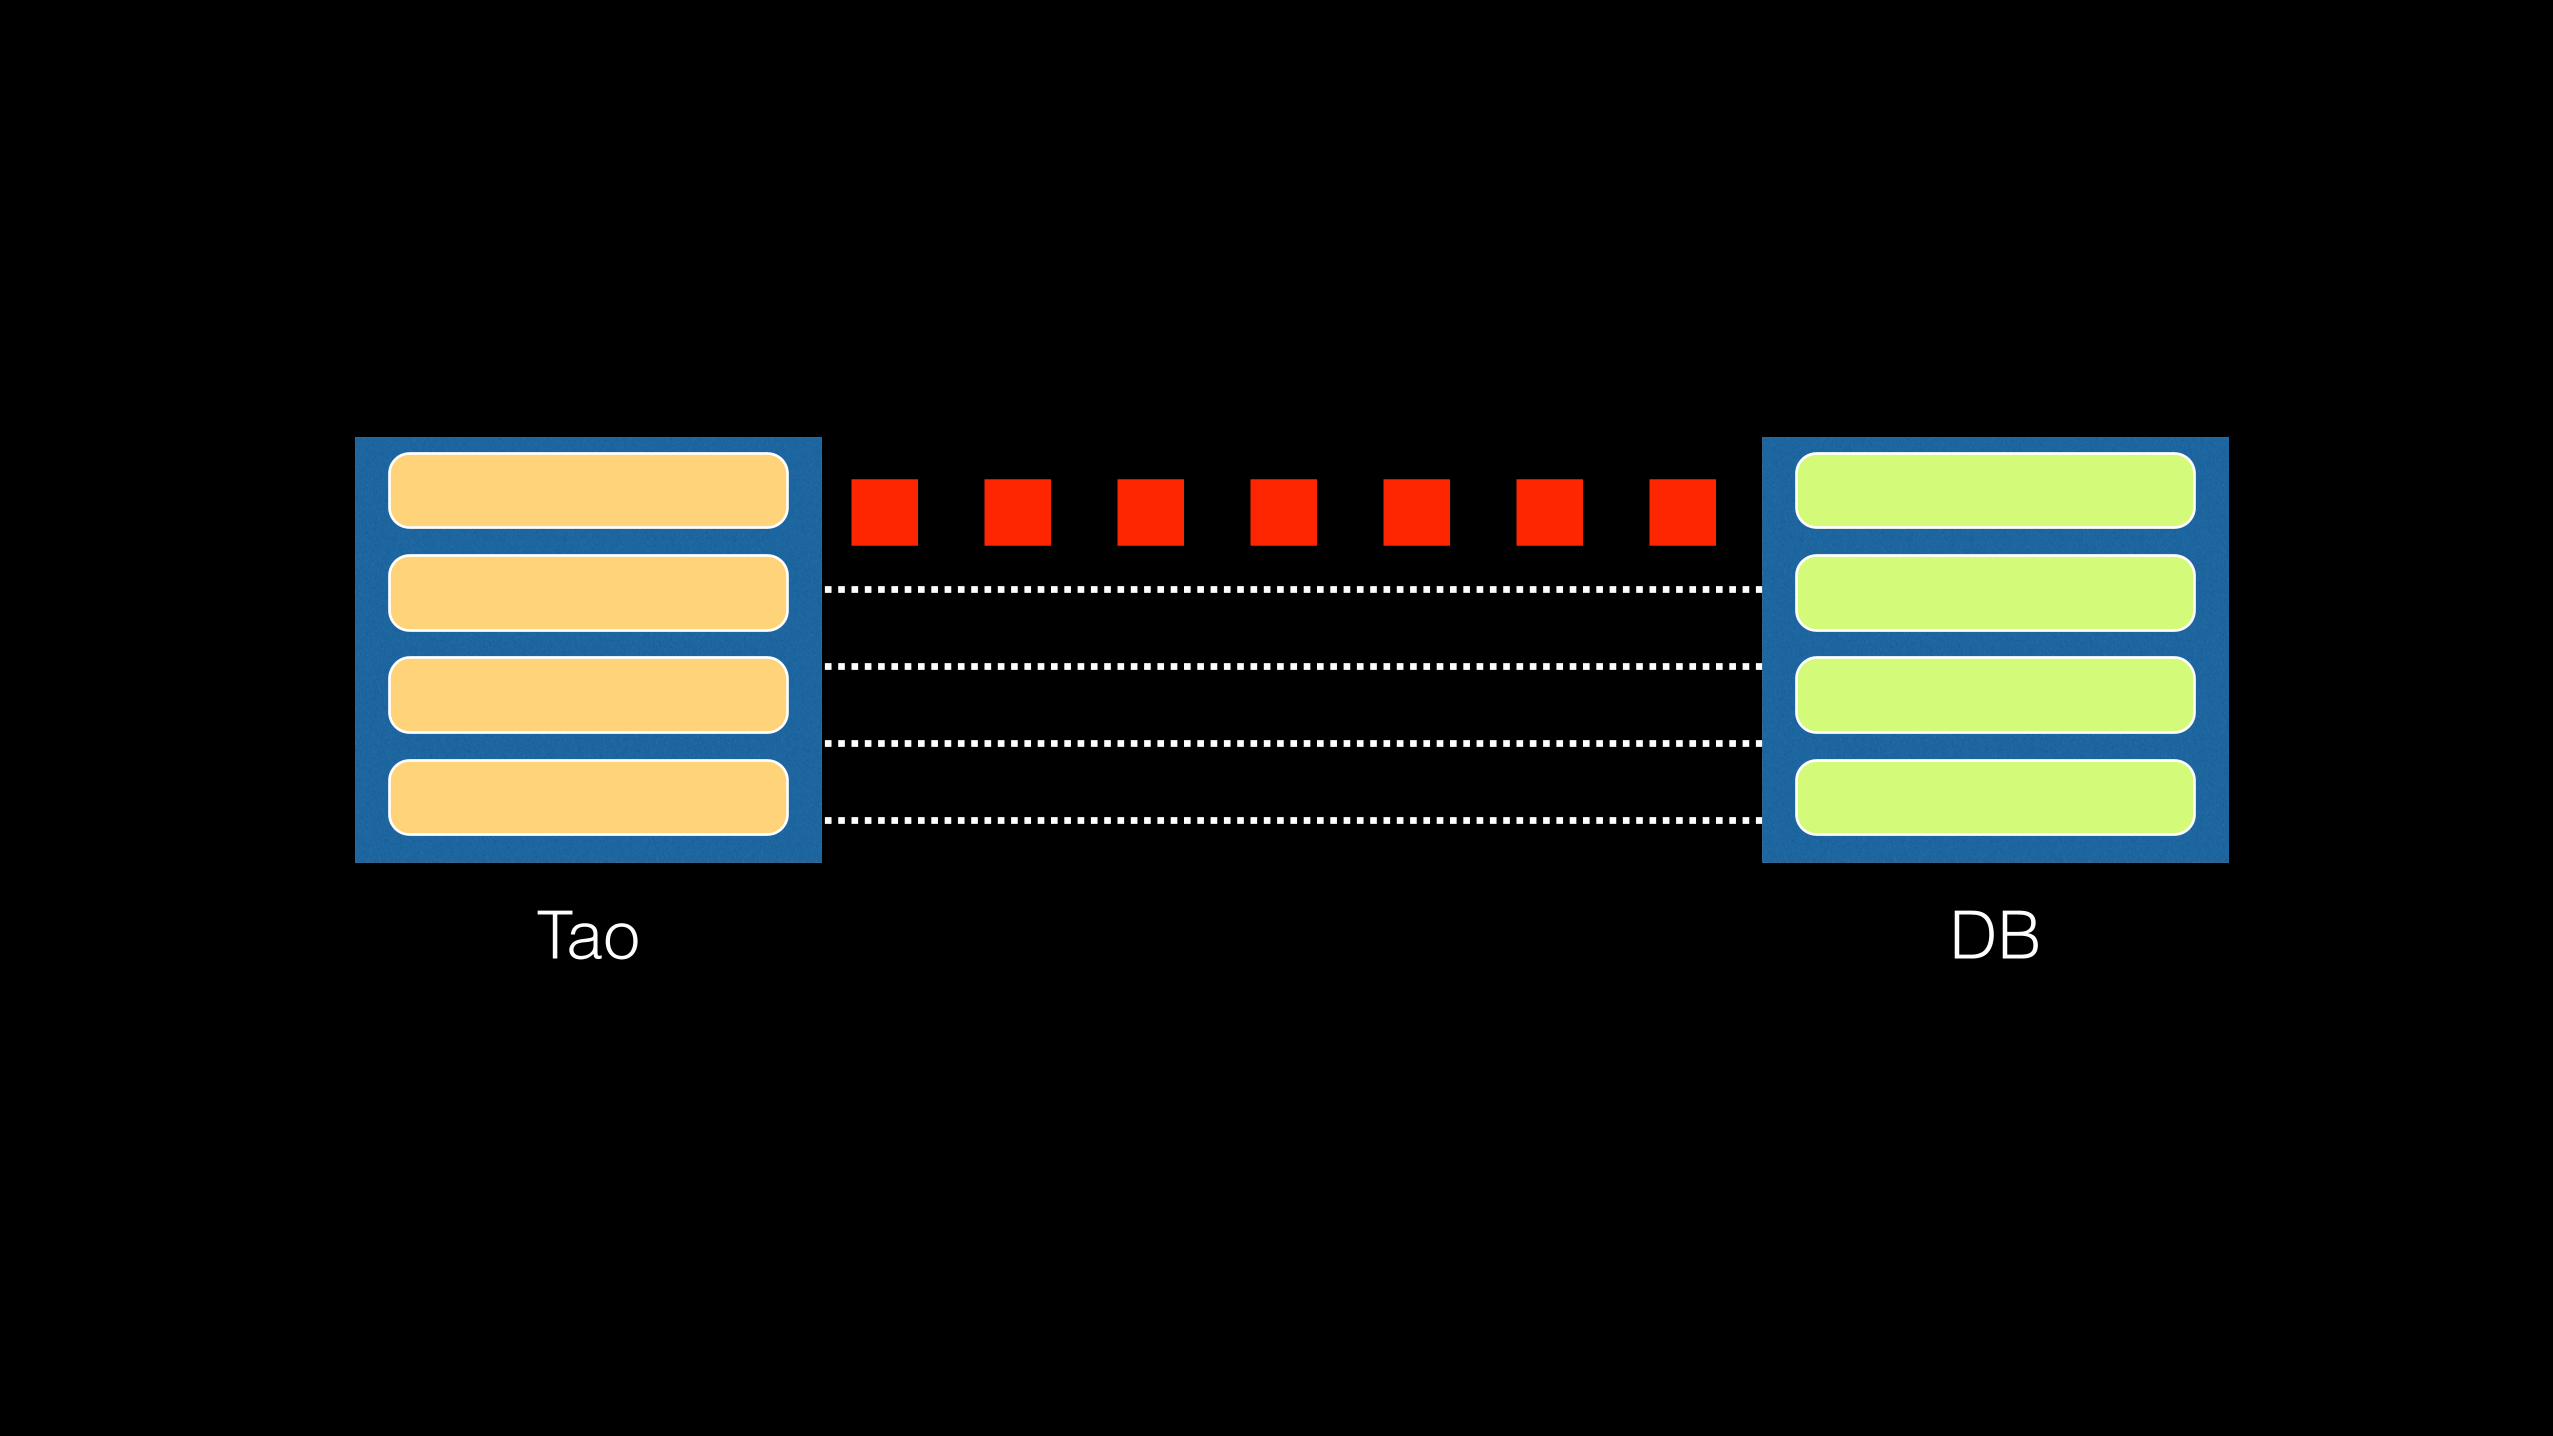
Tao DB
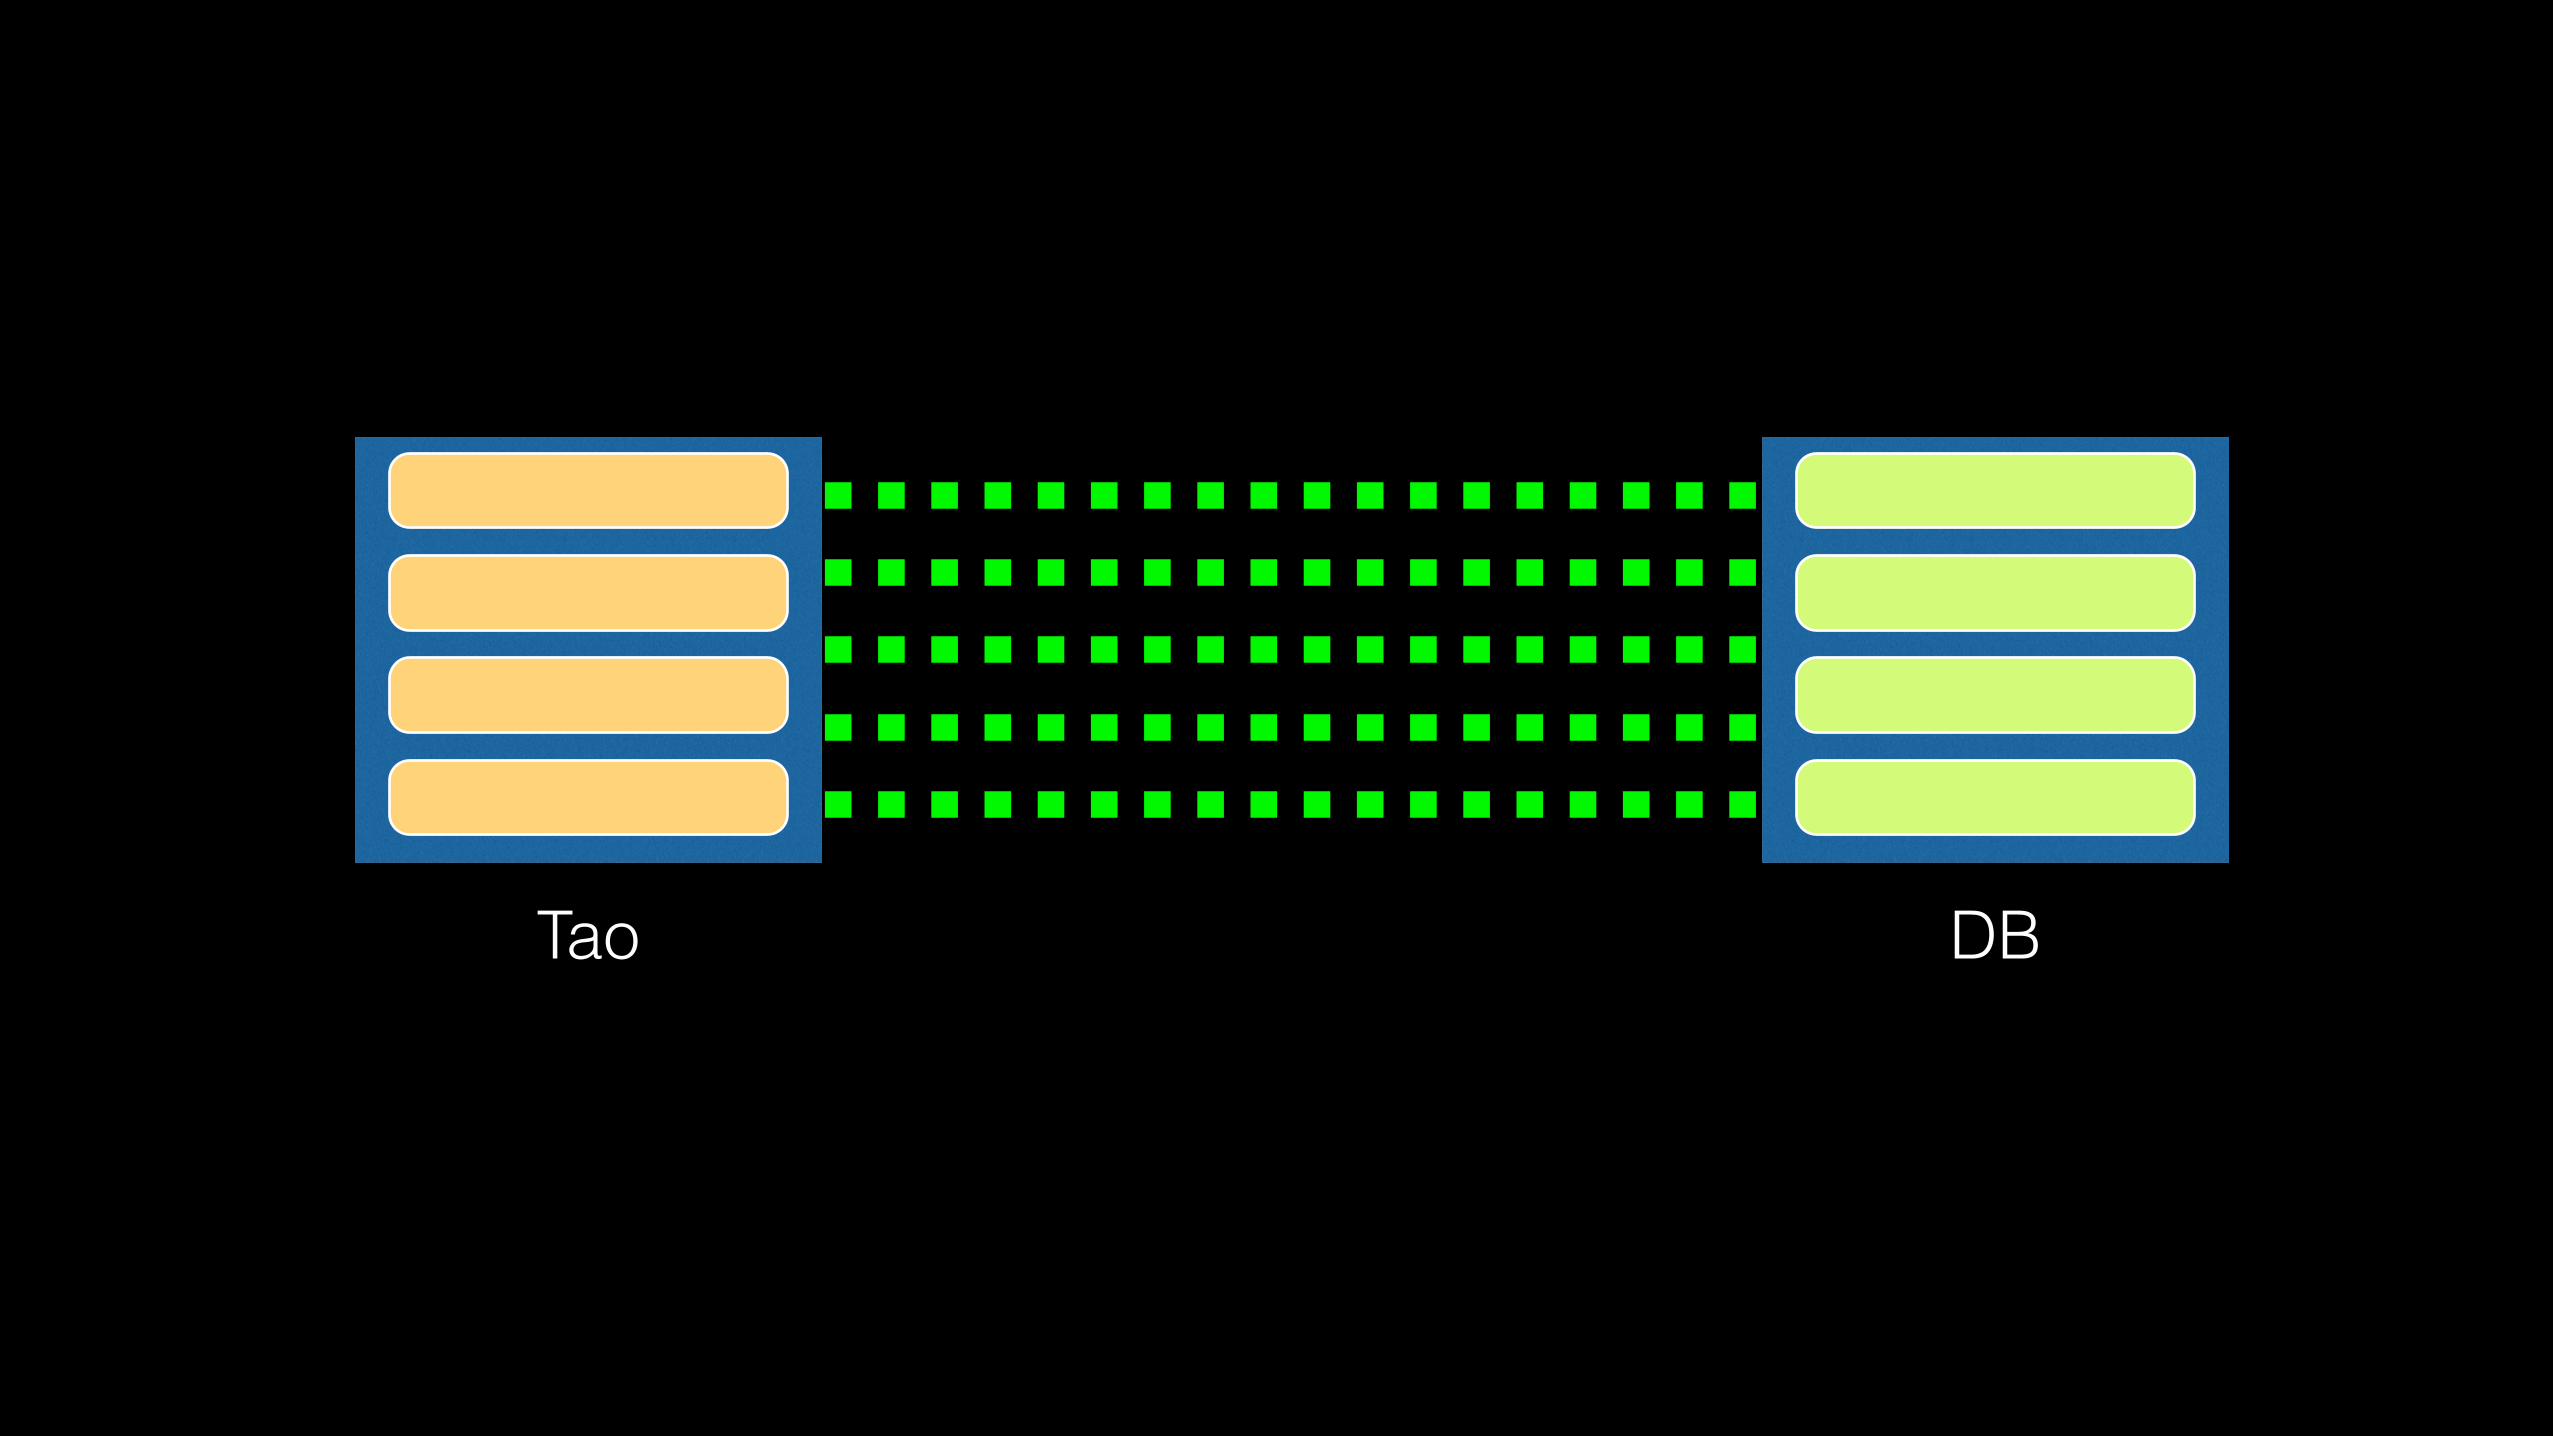
Tao DB

Link Imbalance - Lessons Learned• Resolved issues
• Root Cause
• Software helps
• Service owner identified
• Resolution time
• Small loss, significant impact
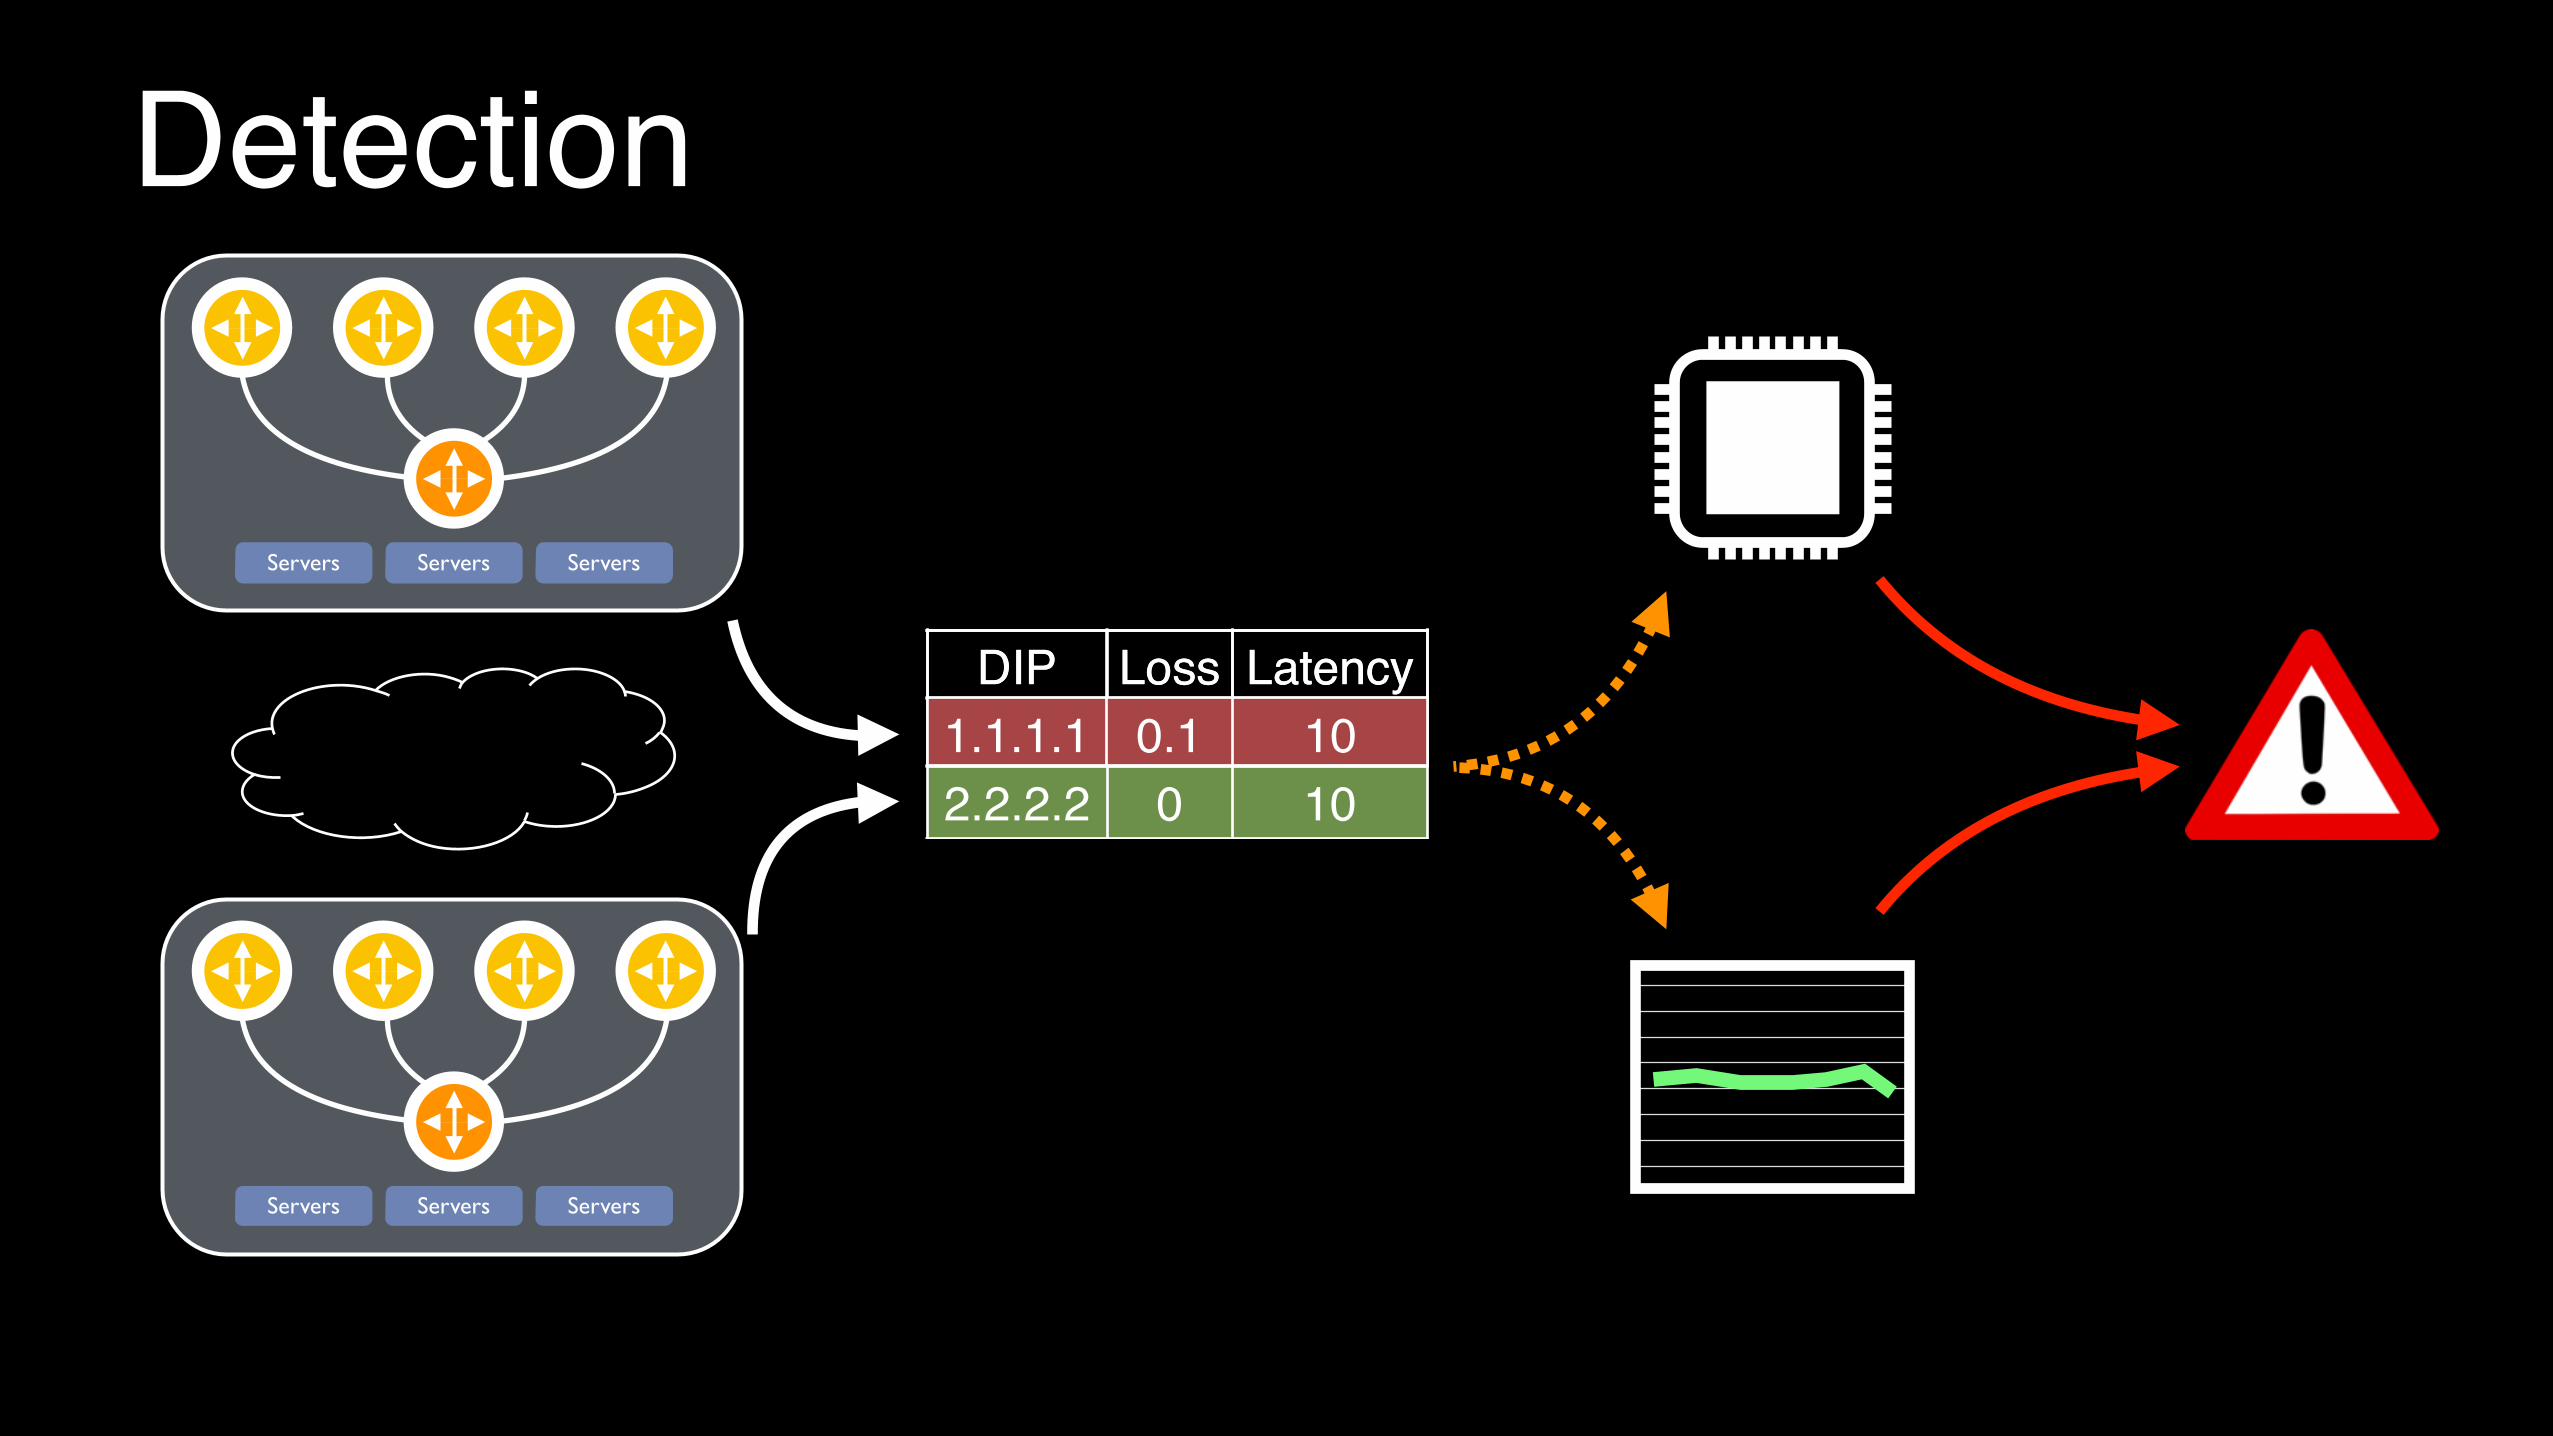
DIP Loss Latency1.1.1.1 0.1 102.2.2.2 0 10
DIP Loss Latency1.1.1.1 0.1 10
Servers ServersServers
Servers ServersServers
Detection
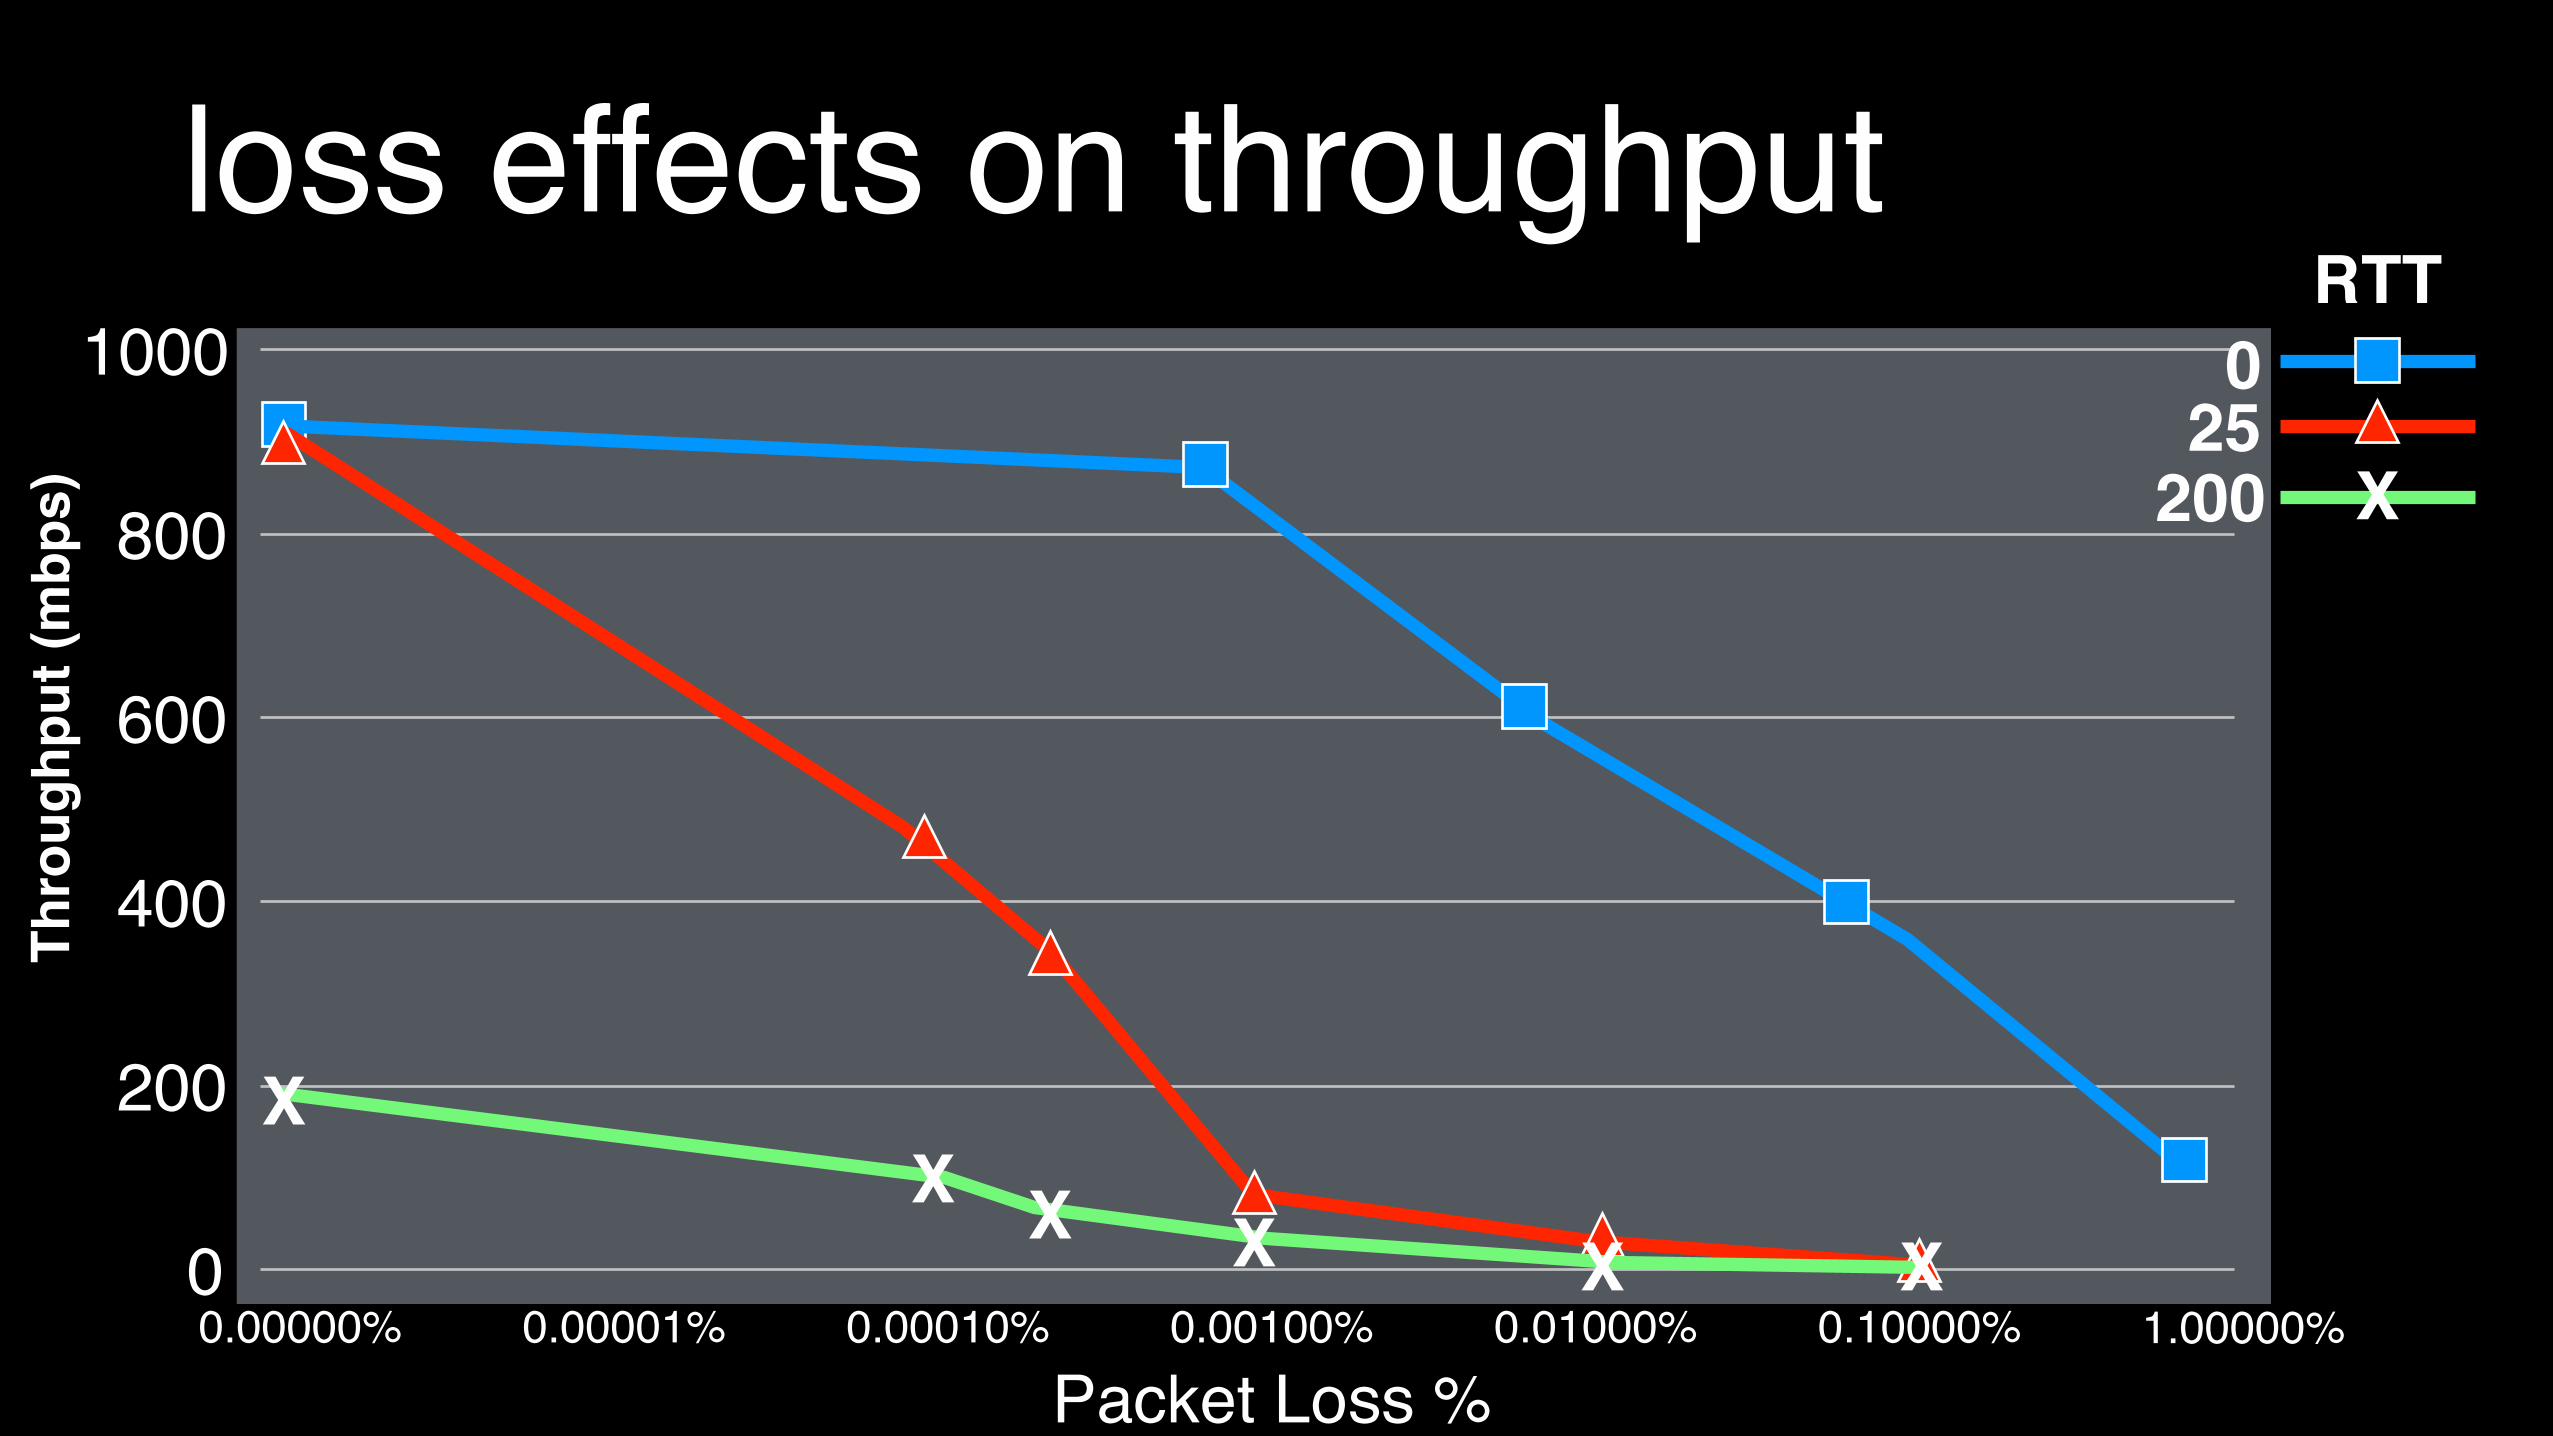
loss effects on throughput1000
400
00.00000% 0.00001% 0.00010% 0.00100% 0.01000% 0.10000% 1.00000%
Packet Loss %
Thro
ughp
ut (m
bps) 800
600
200
RTT0
X20025
XXXX
XX
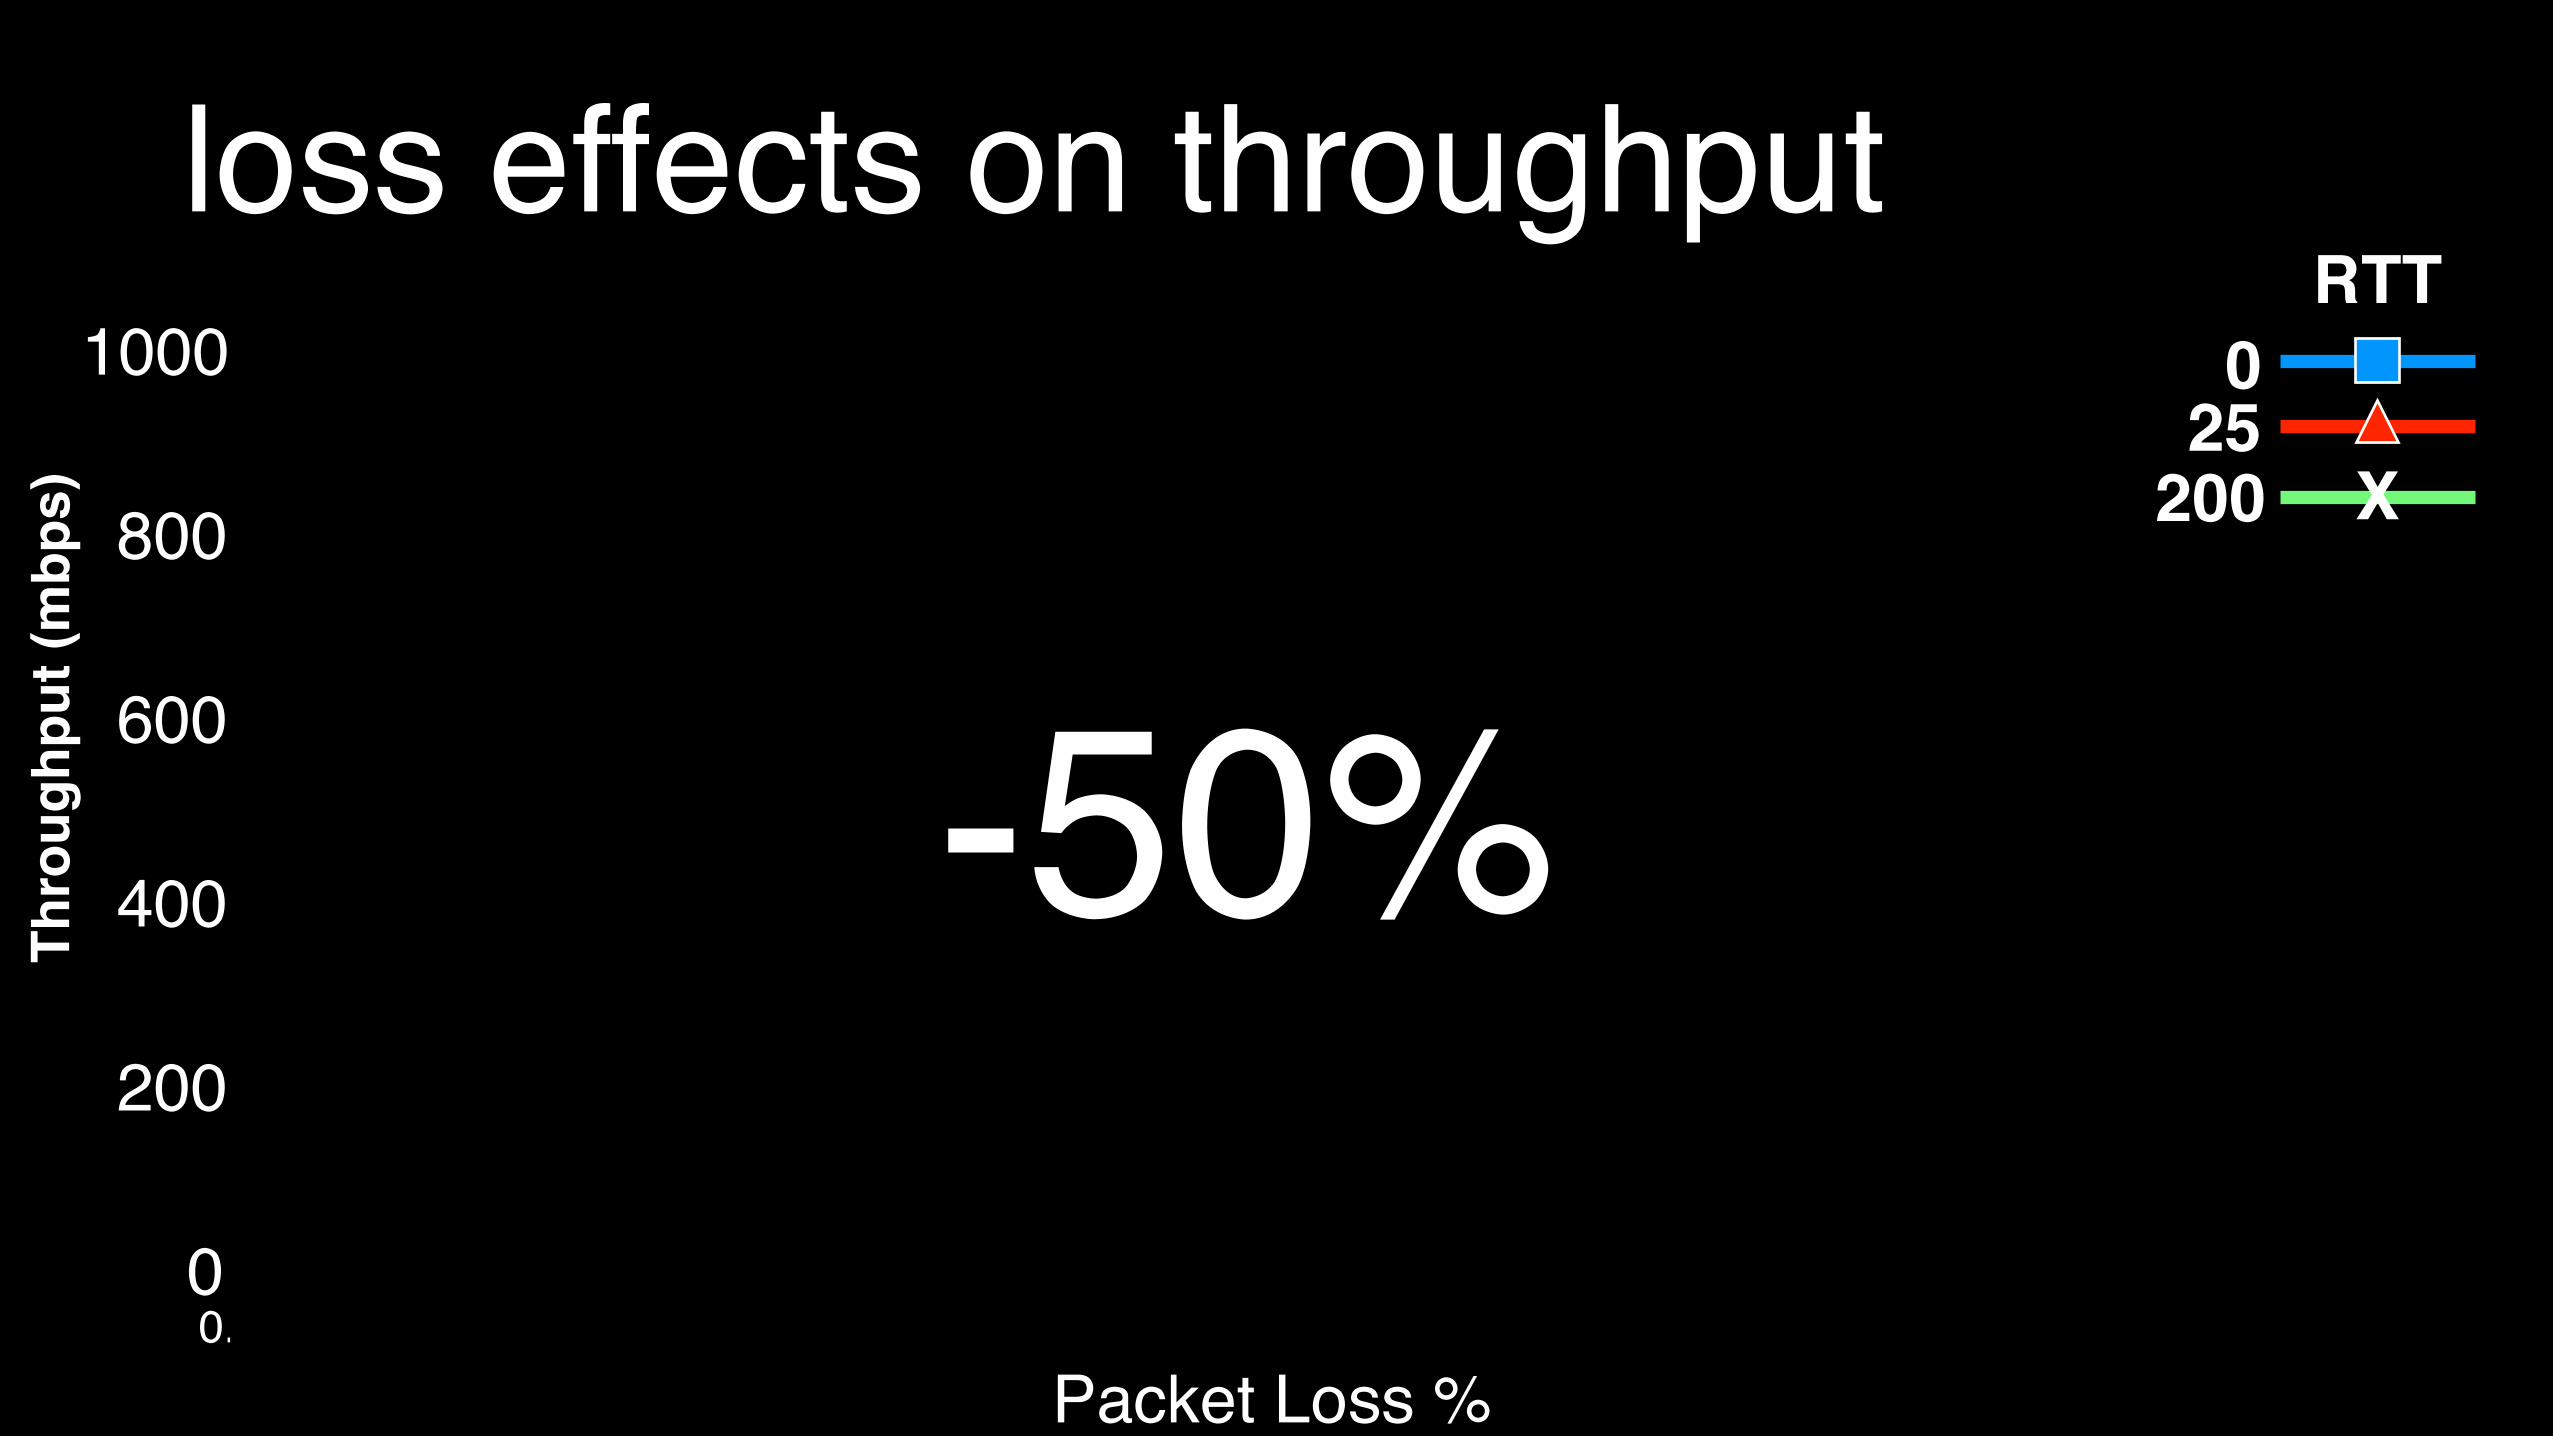
loss effects on throughput1000
400
00.00000% 0.00001% 0.00010% 0.00100% 0.01000% 0.10000% 1.00000%
Packet Loss %
Thro
ughp
ut (m
bps) 800
600
200
XXXX
XX
0
X20025
RTT
-50%
XX
XX X X0
0.00000% 0.00001% 0.00010% 0.00100% 0.01000% 0.10000% 1.00000%Packet Loss %
Thro
ughp
ut (m
bps)
350
50
100
150
250
300
200
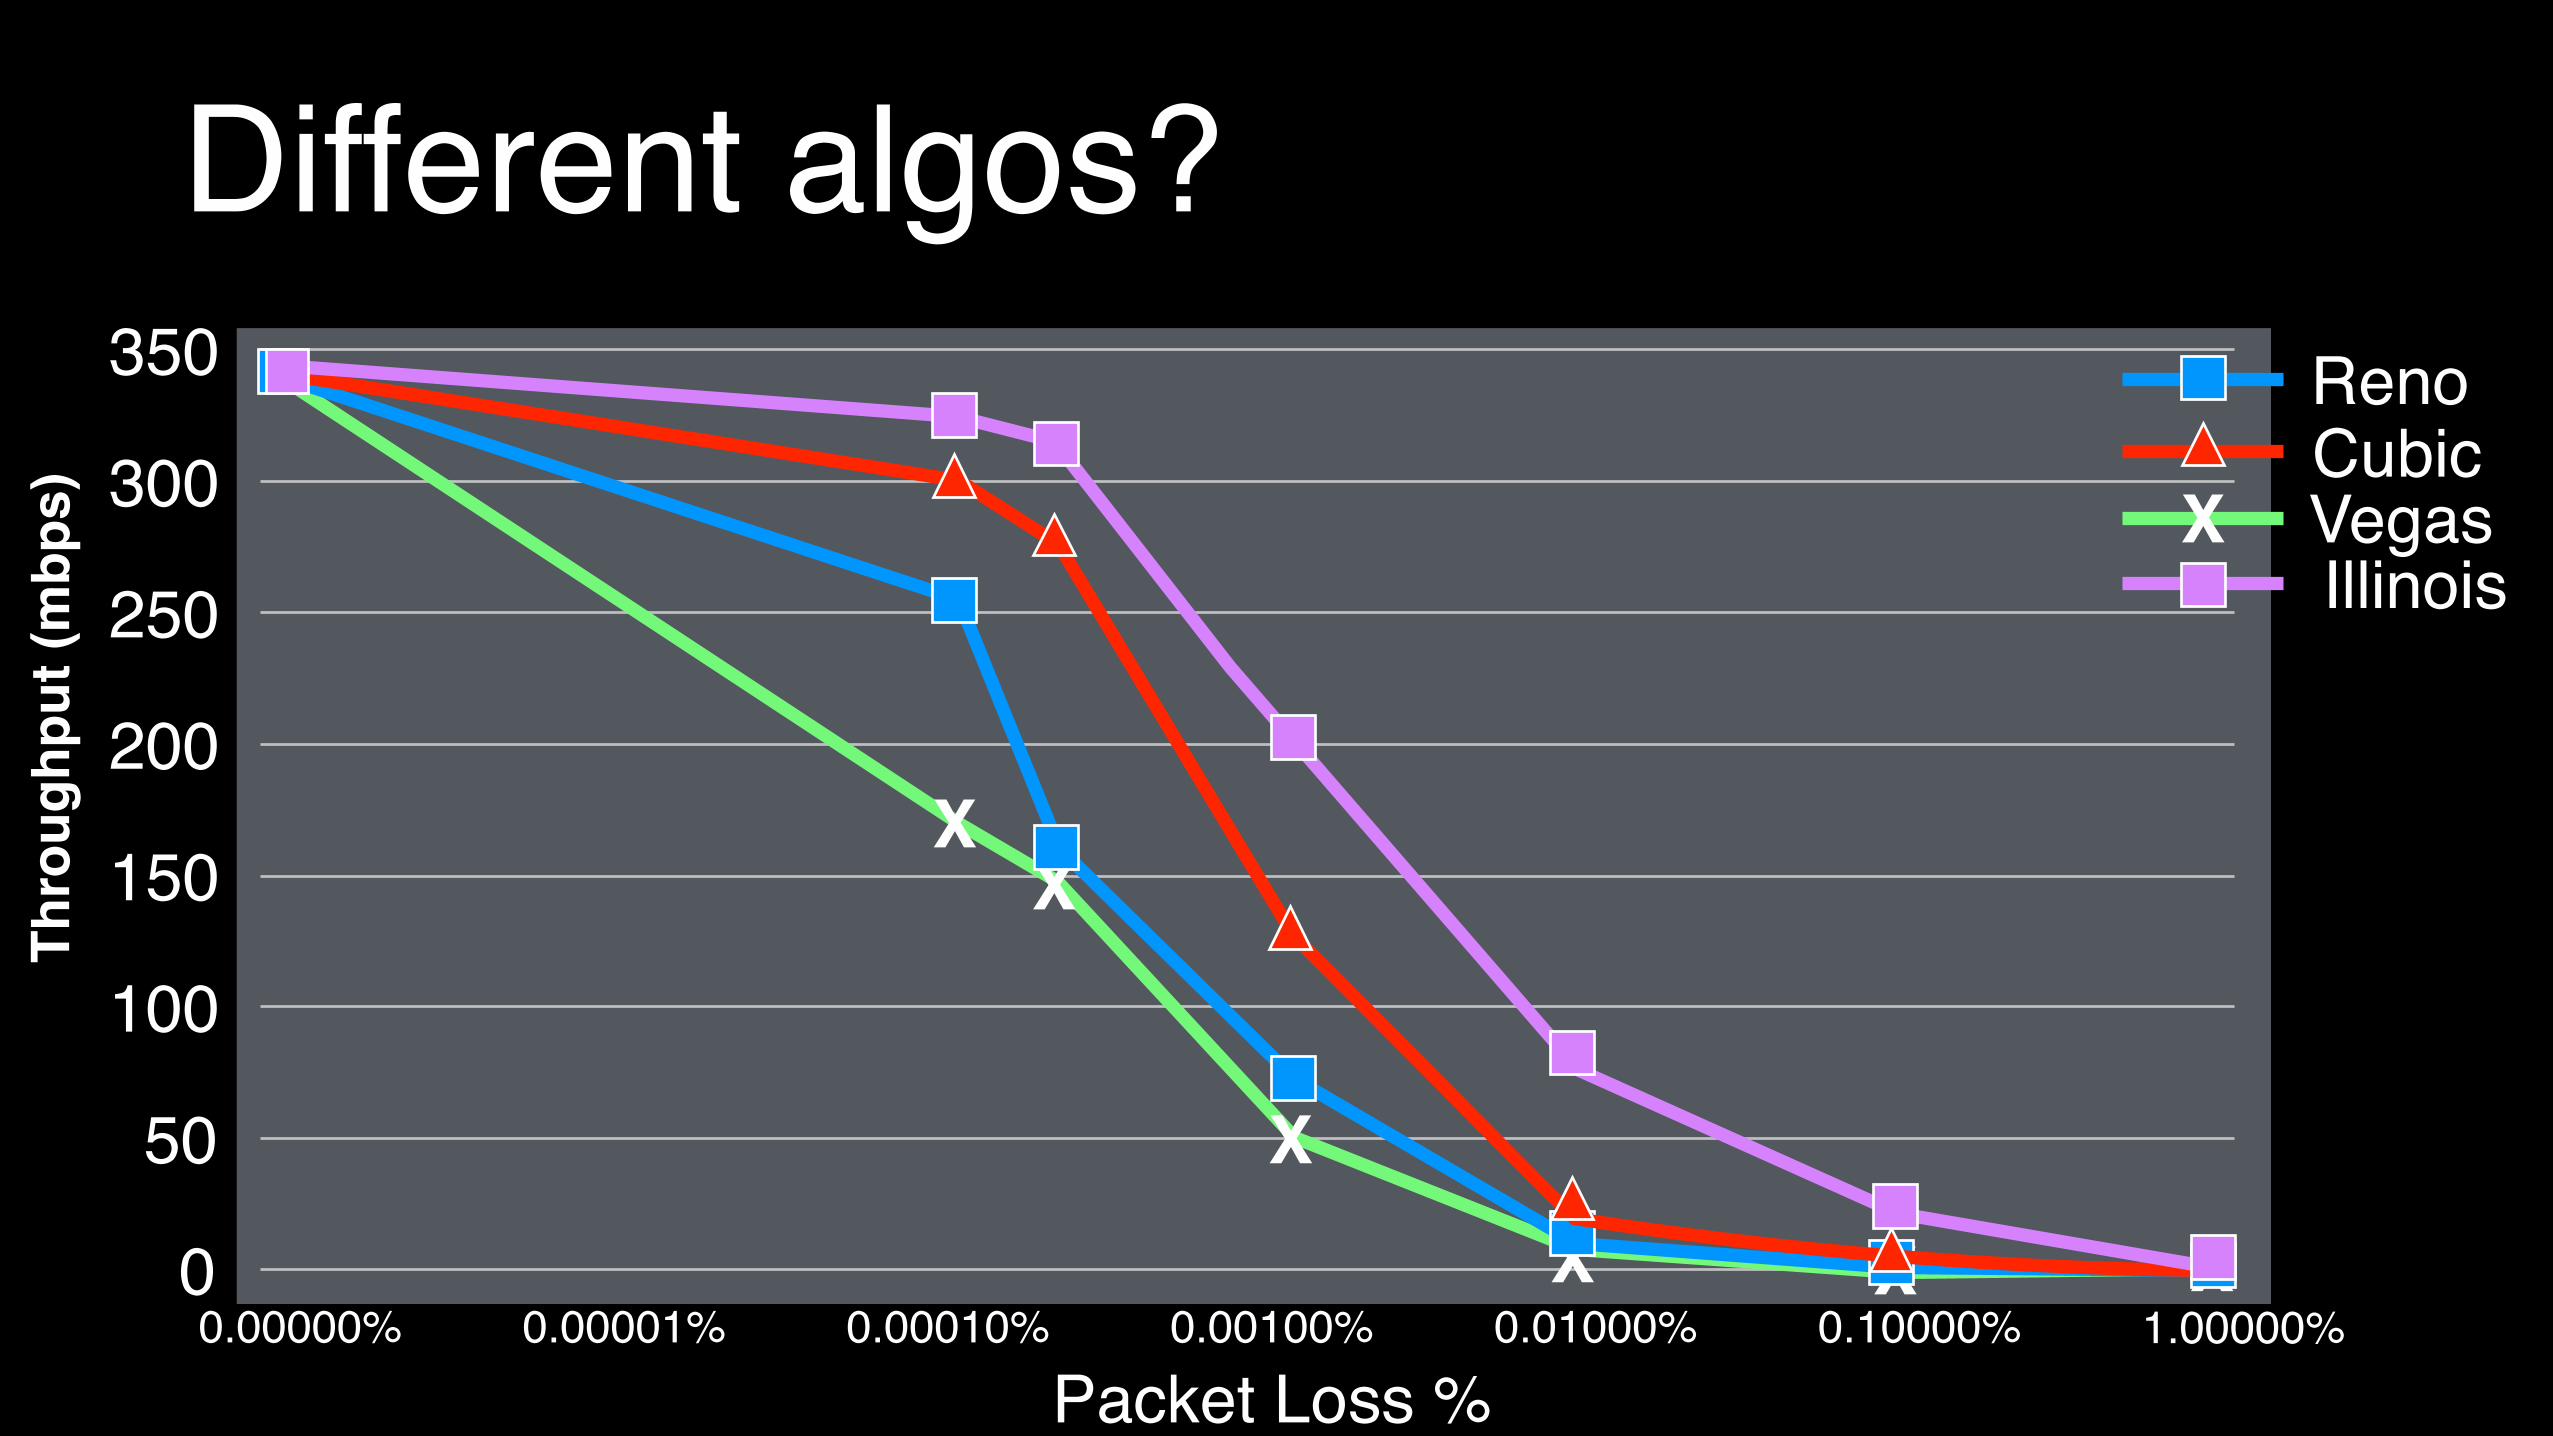
Different algos?
X
RenoCubicVegasIllinois
XX
XX X X0
0.00000% 0.00001% 0.00010% 0.00100% 0.01000% 0.10000% 1.00000%Packet Loss %
Thro
ughp
ut (m
bps)
350
50
100
150
250
300
200
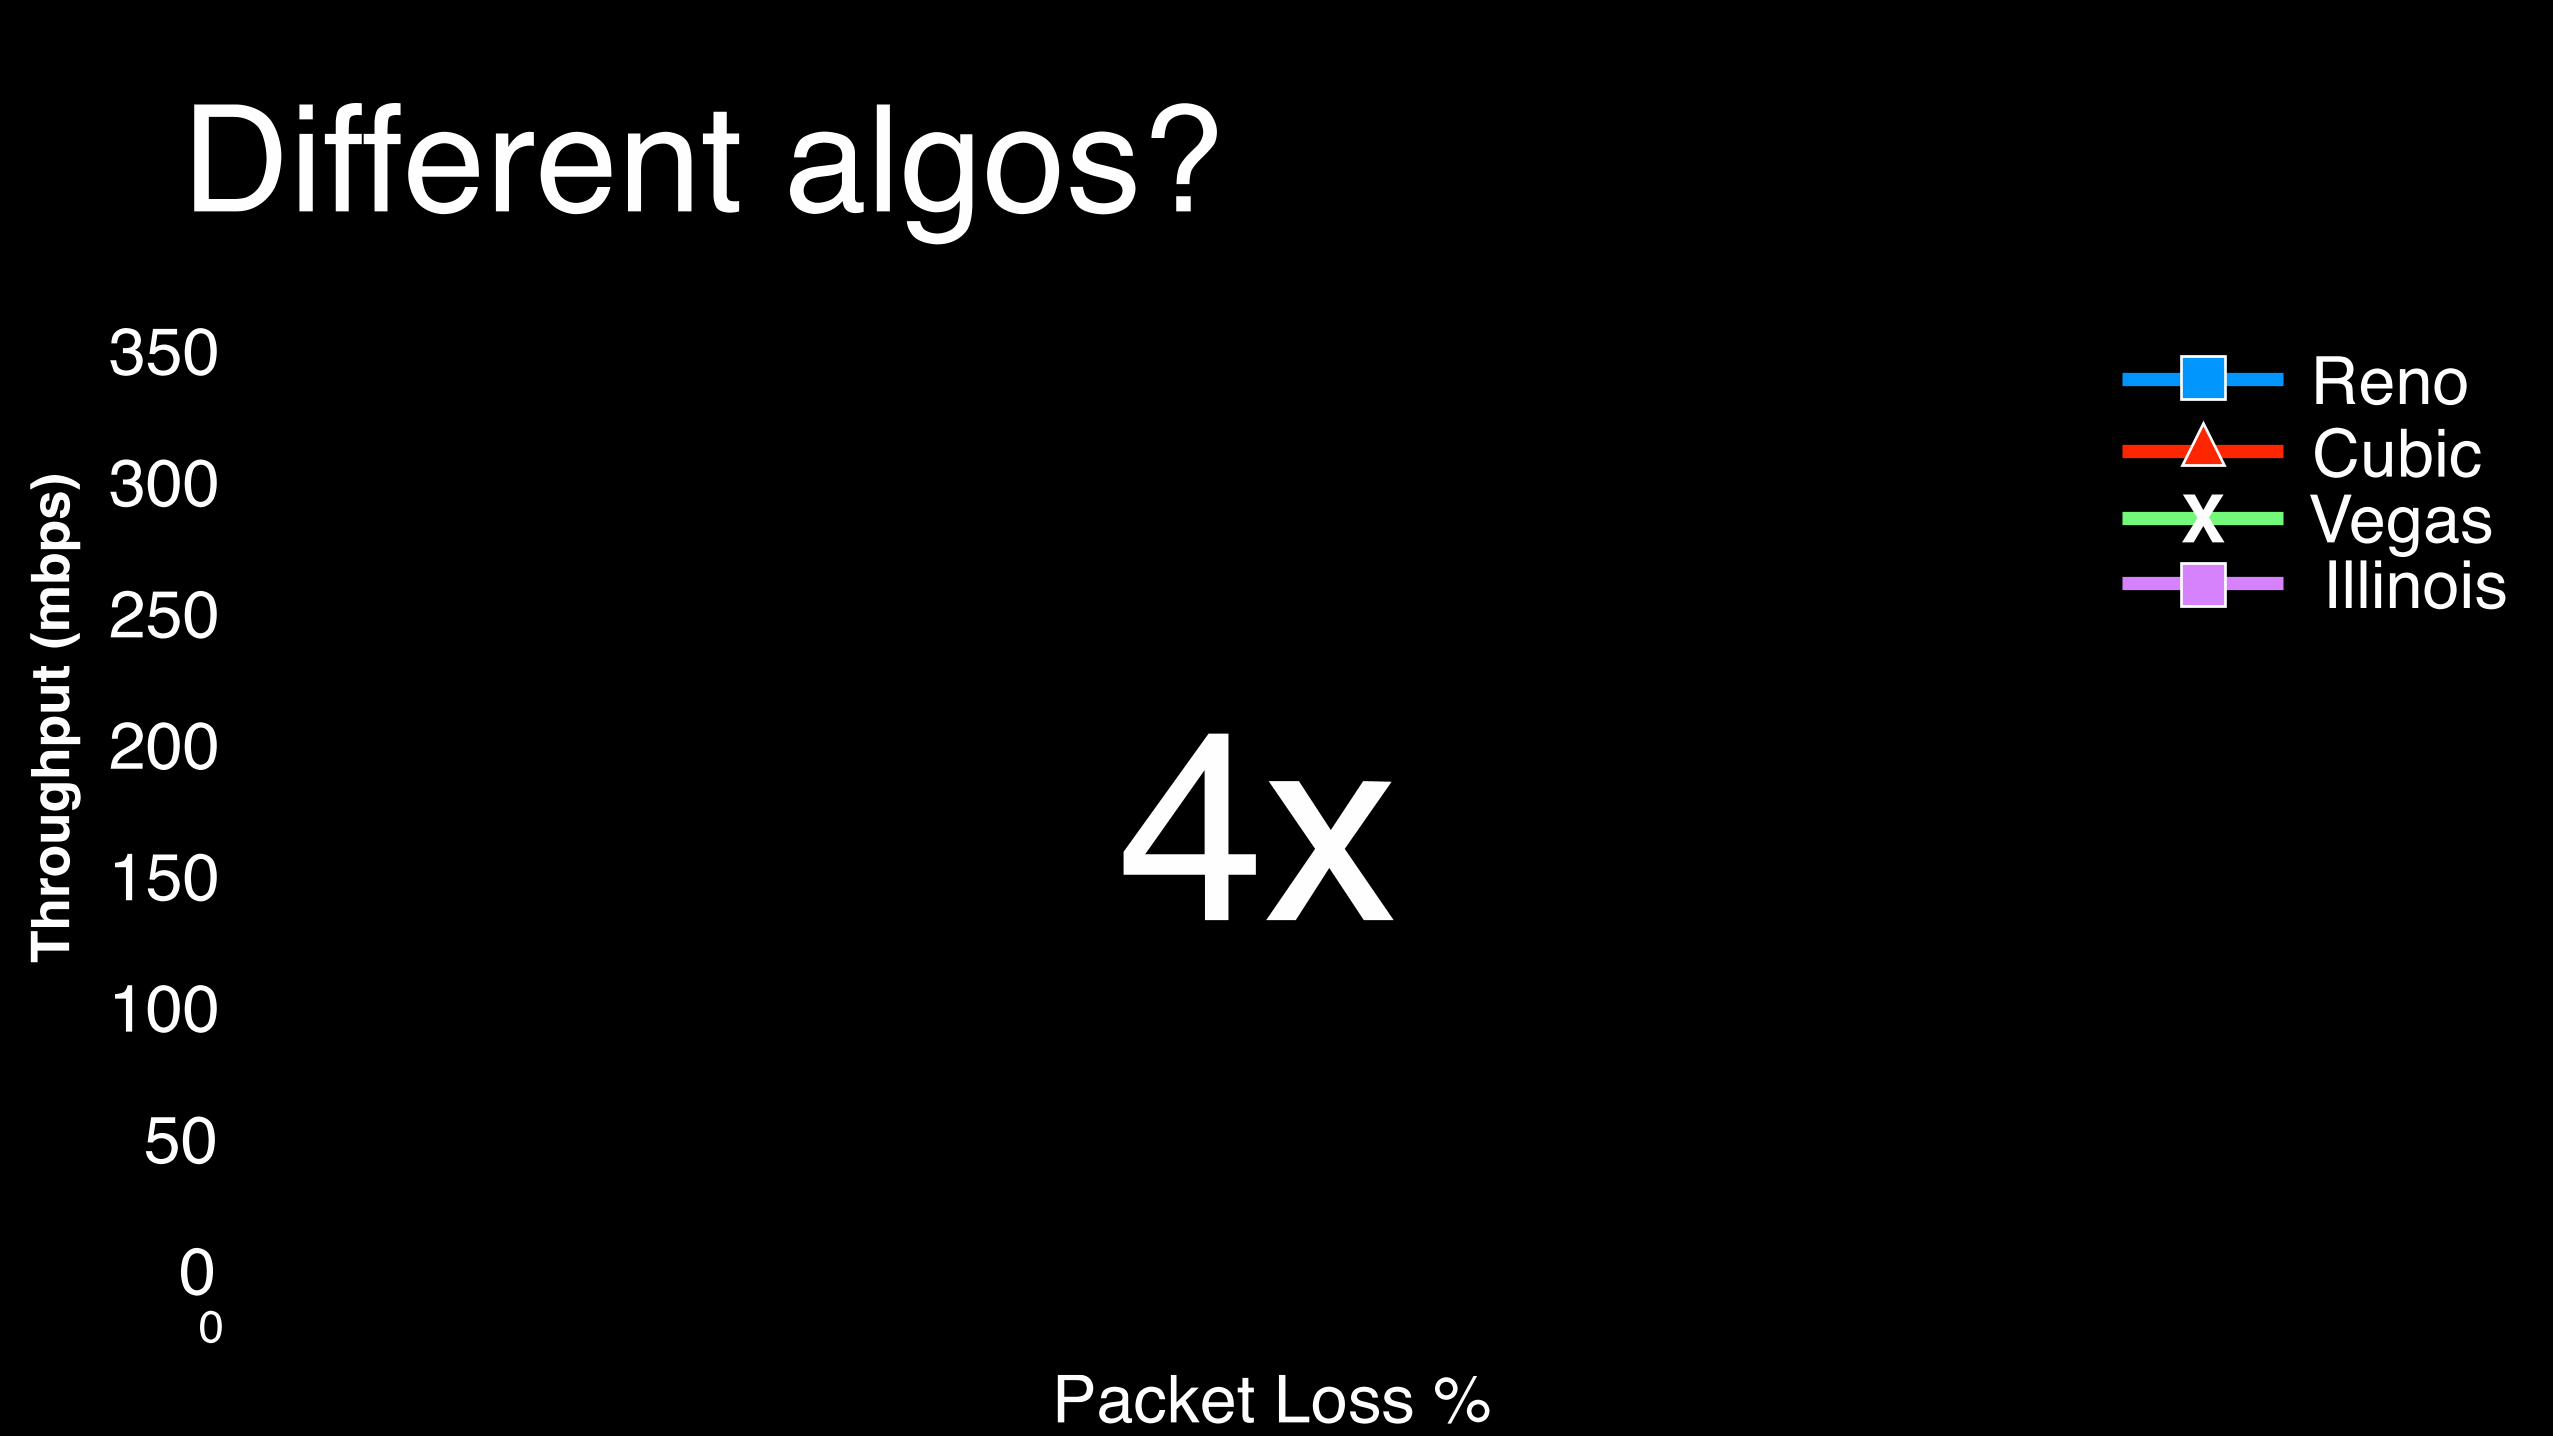
Different algos?
X
RenoCubicVegasIllinois
4x
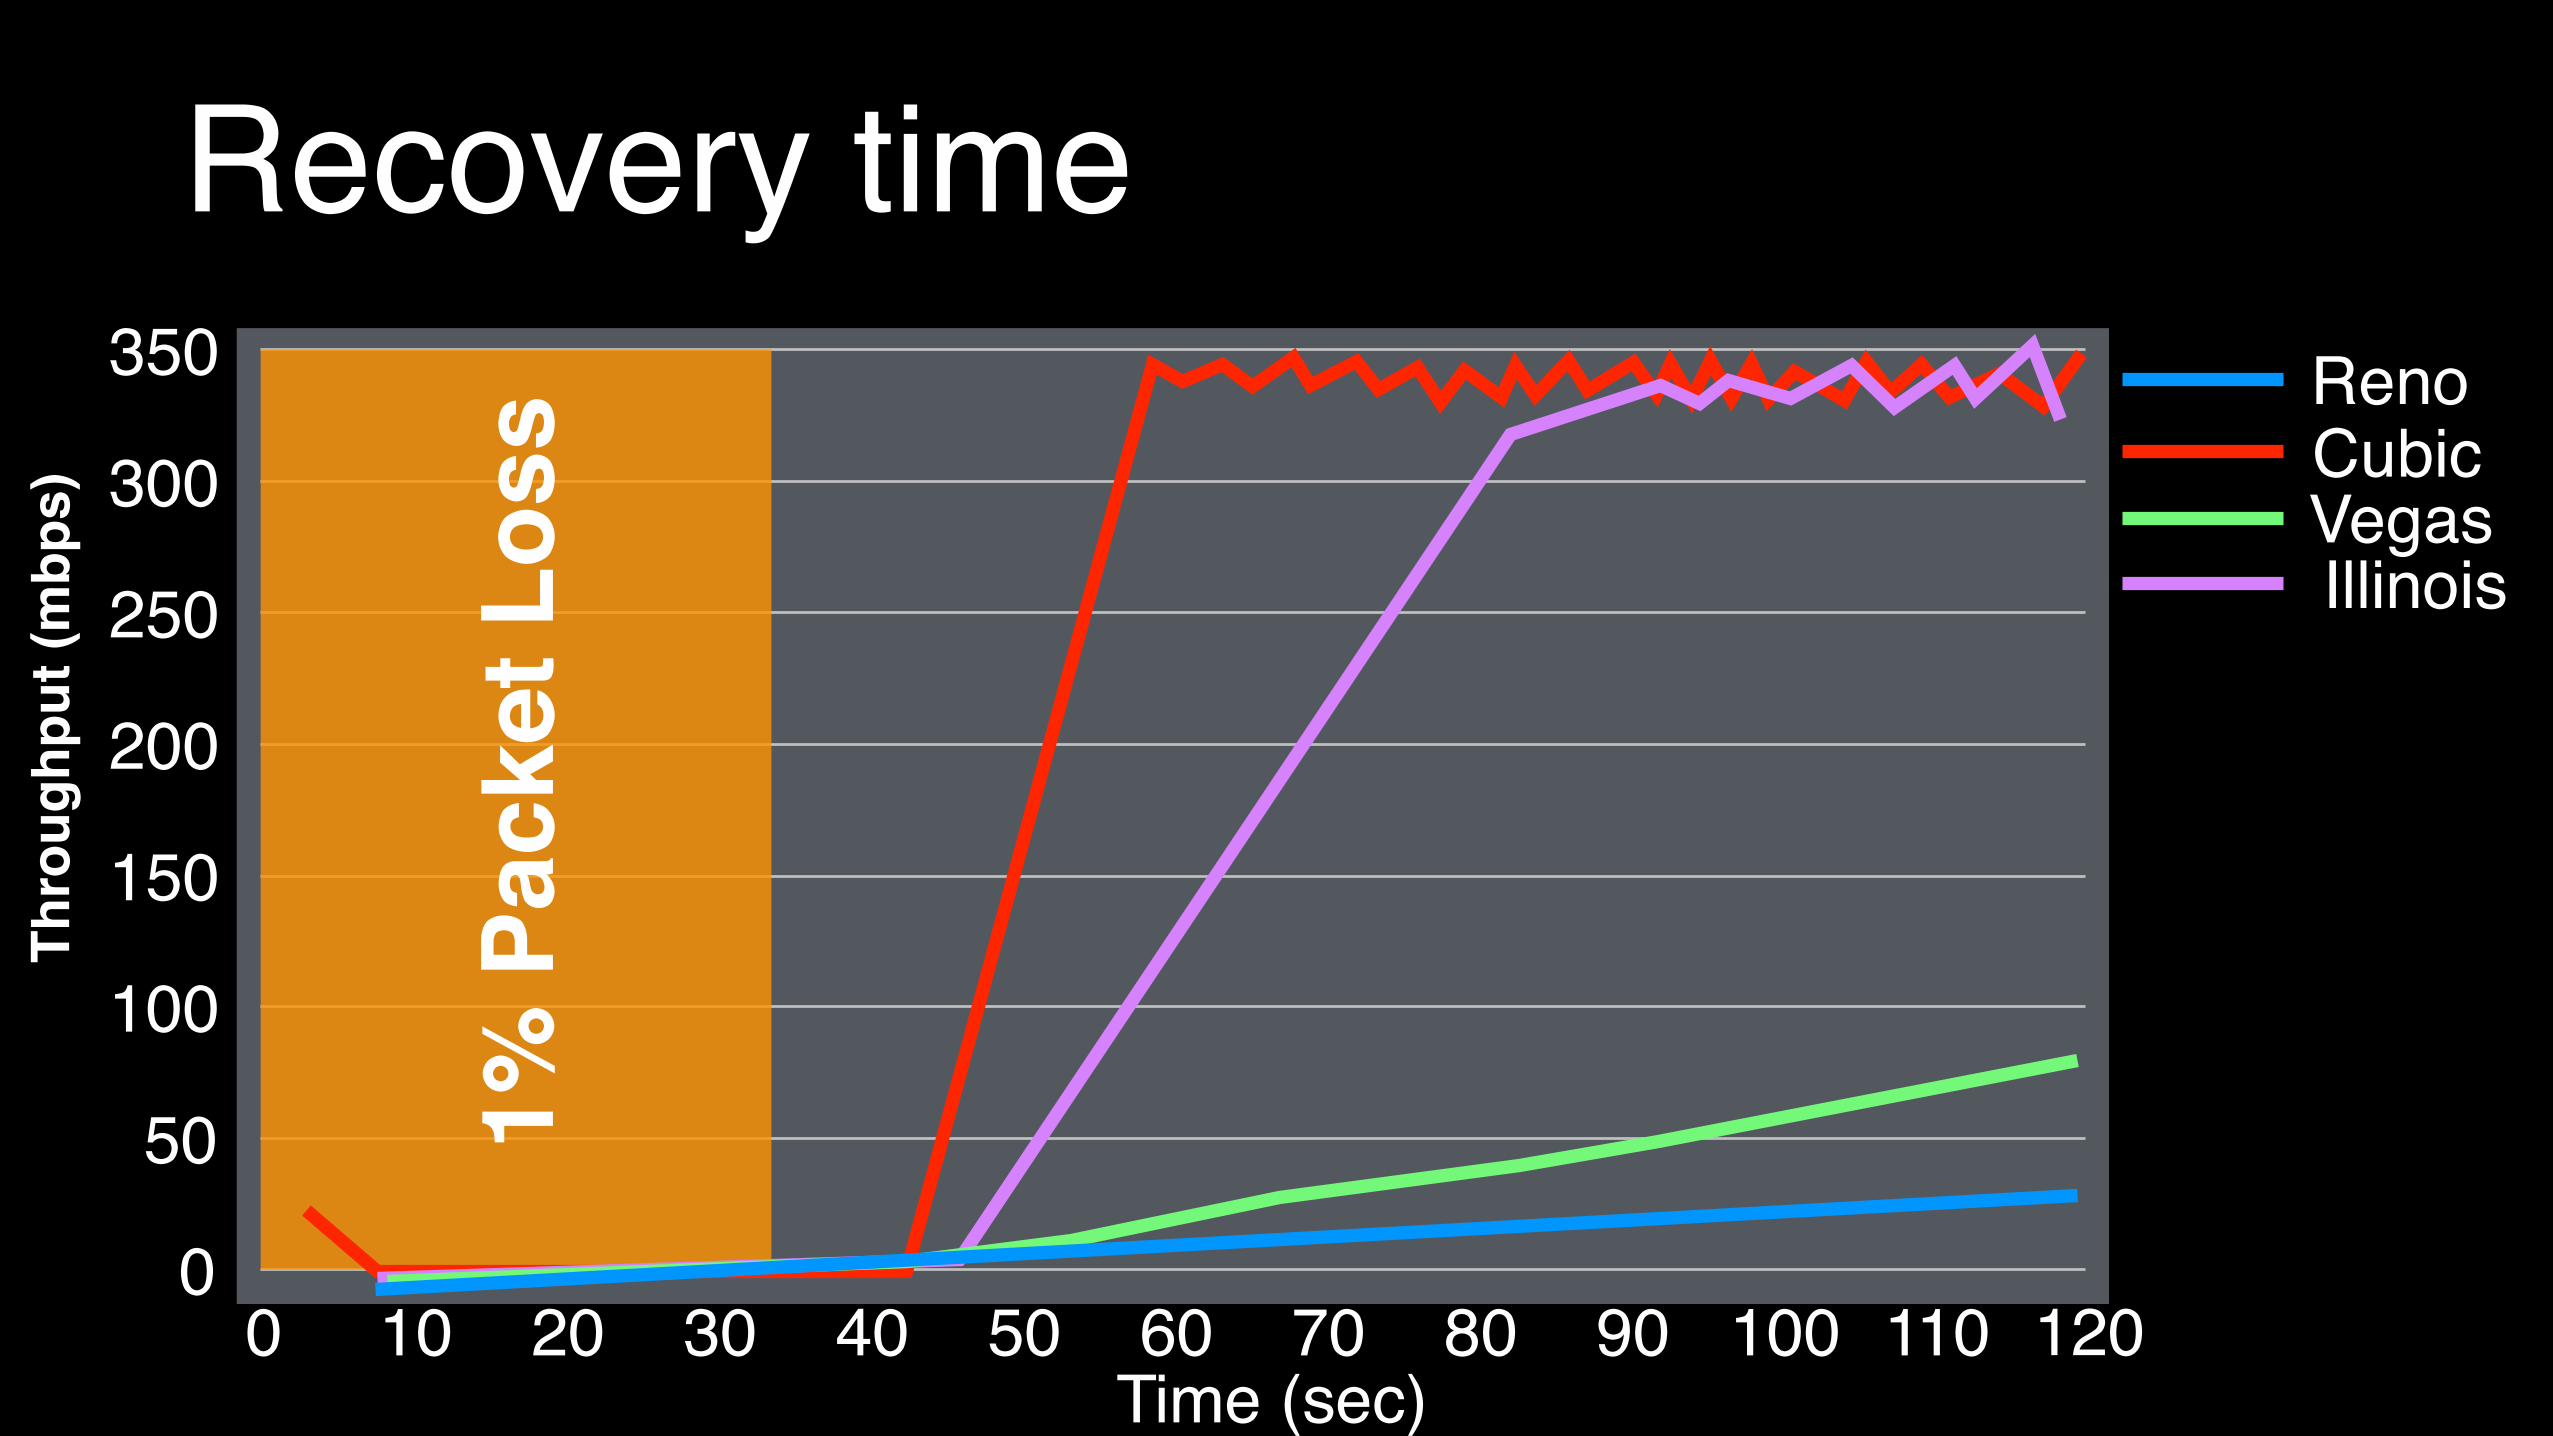
Recovery time
0
Thro
ughp
ut (m
bps)
350
50
100
150
250
300
200
Time (sec)0 120110100908070605040302010
1% P
acke
t Los
s RenoCubicVegasIllinois
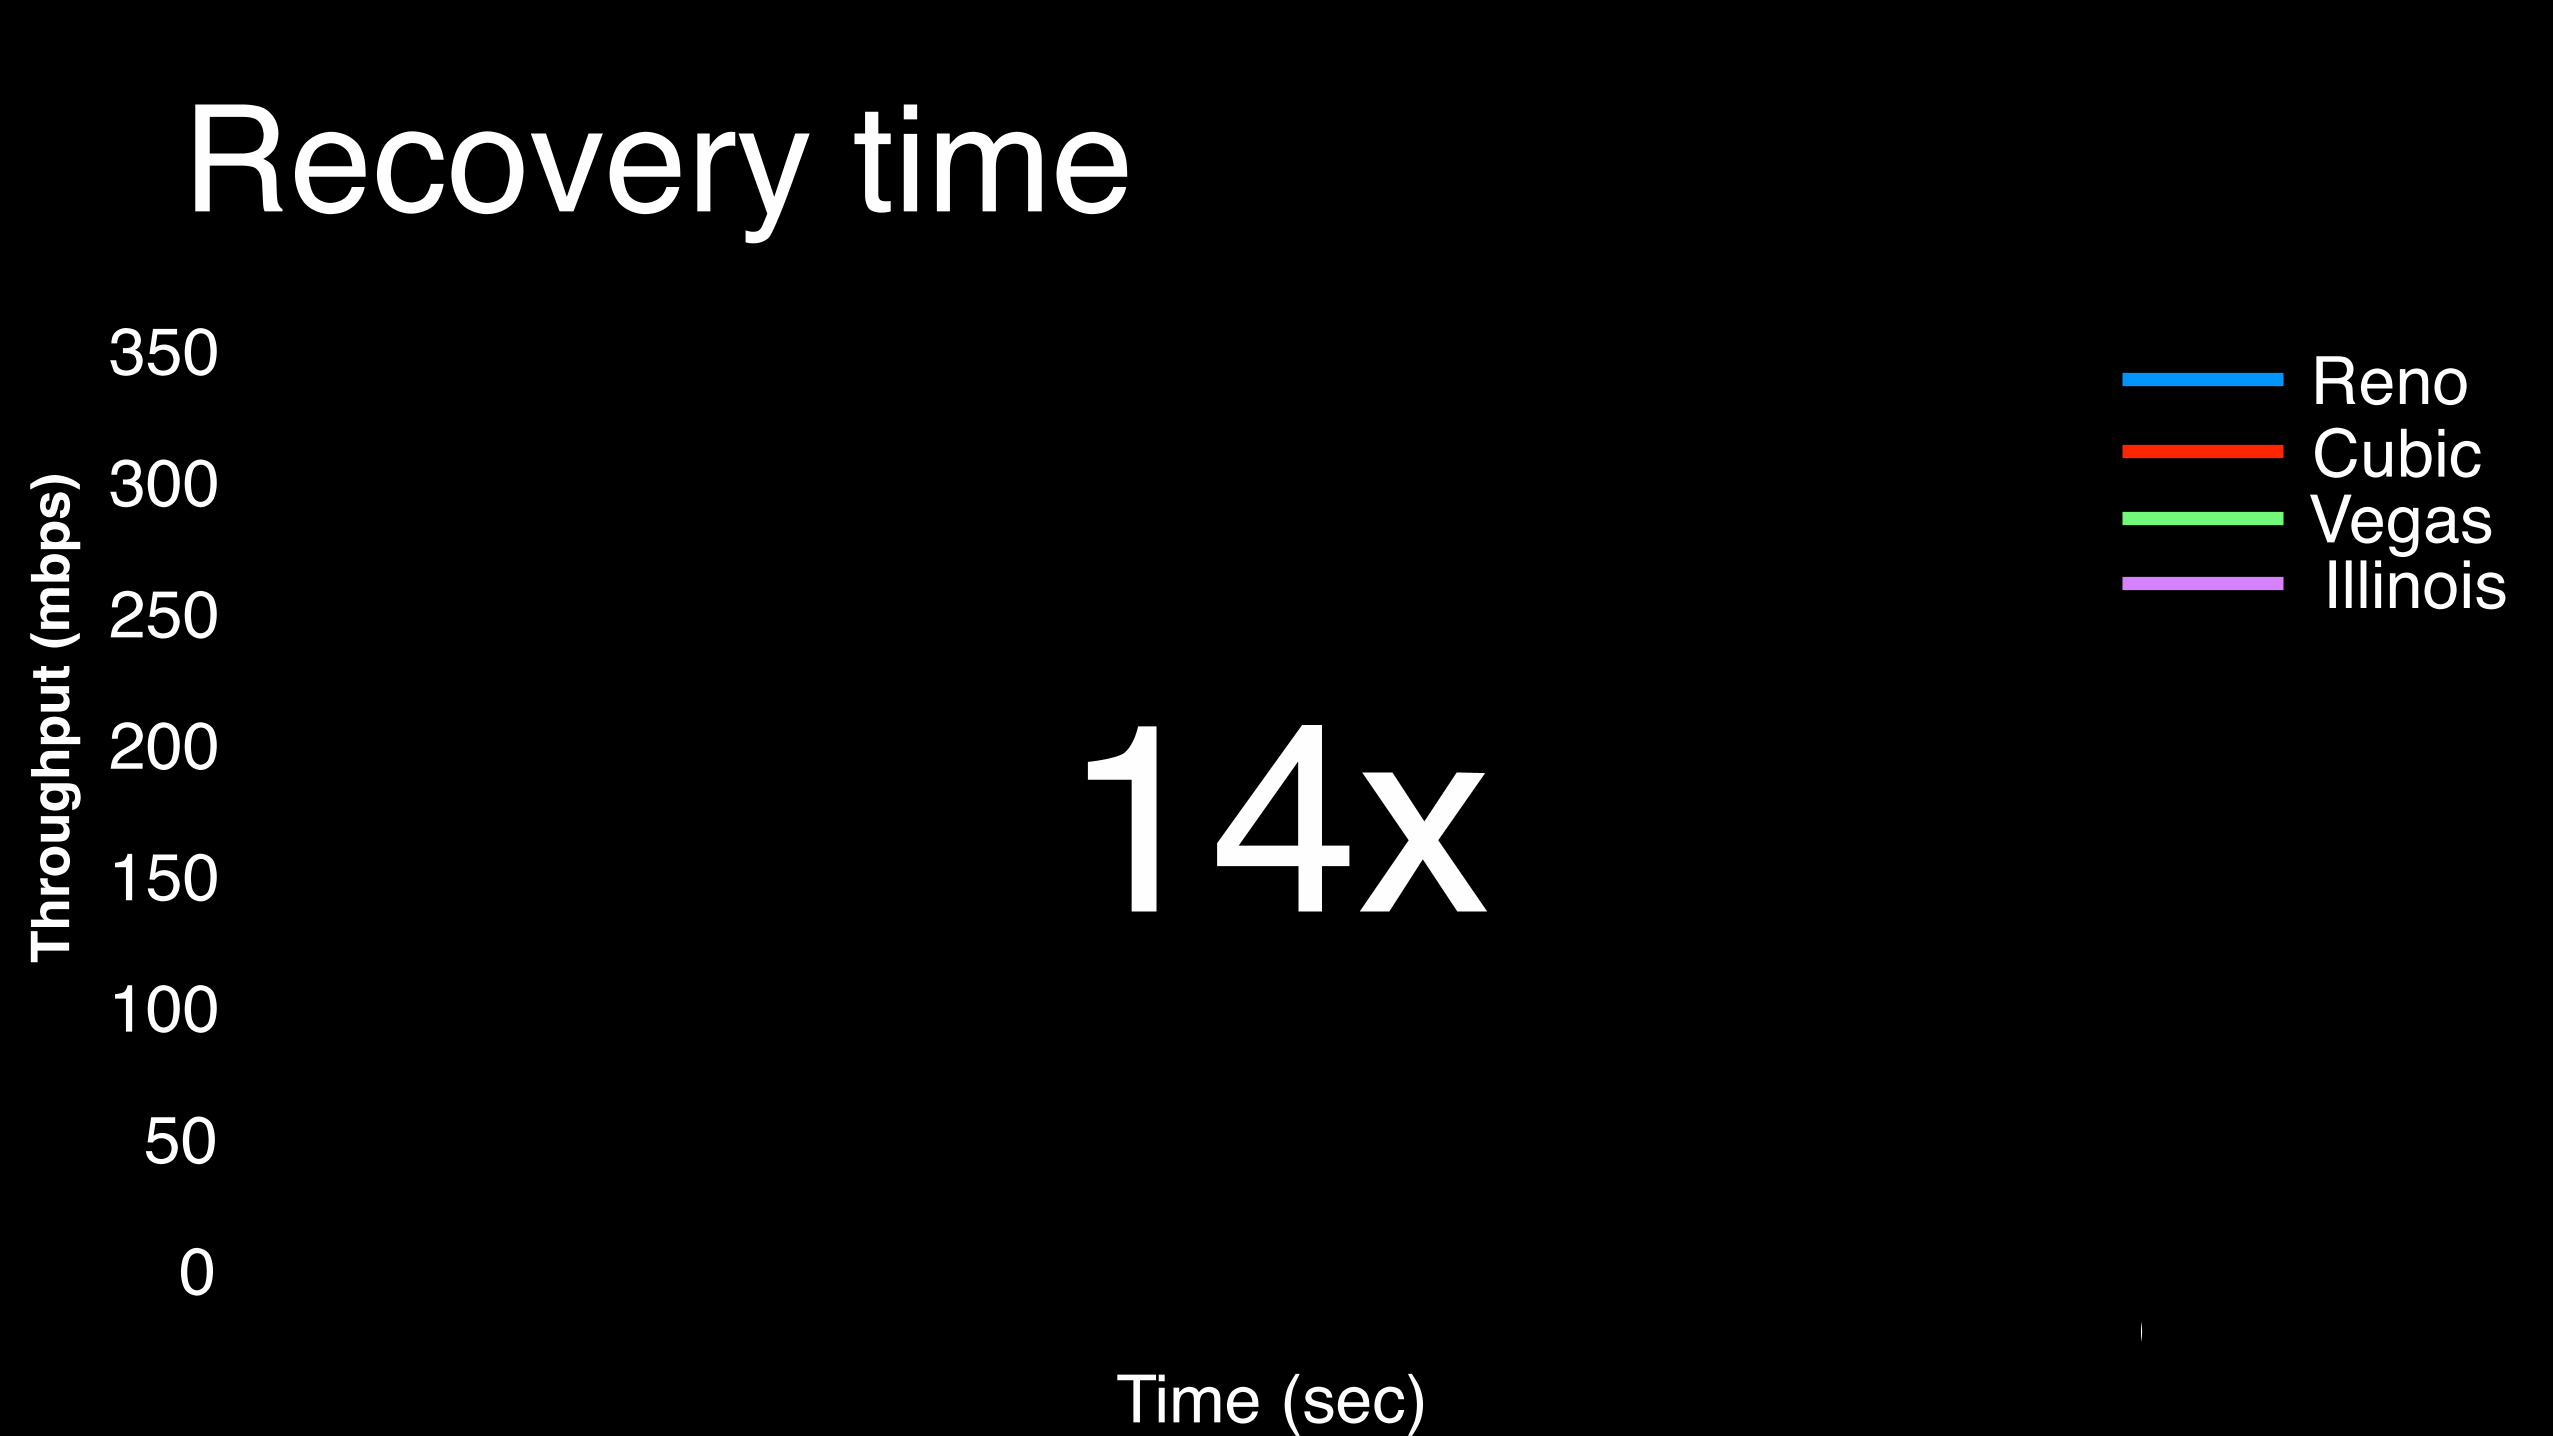
Recovery time
0
Thro
ughp
ut (m
bps)
350
50
100
150
250
300
200
Time (sec)0 120110100908070605040302010
1% P
acke
t Los
s RenoCubicVegasIllinois
14x

So, wait, how does this apply to me?
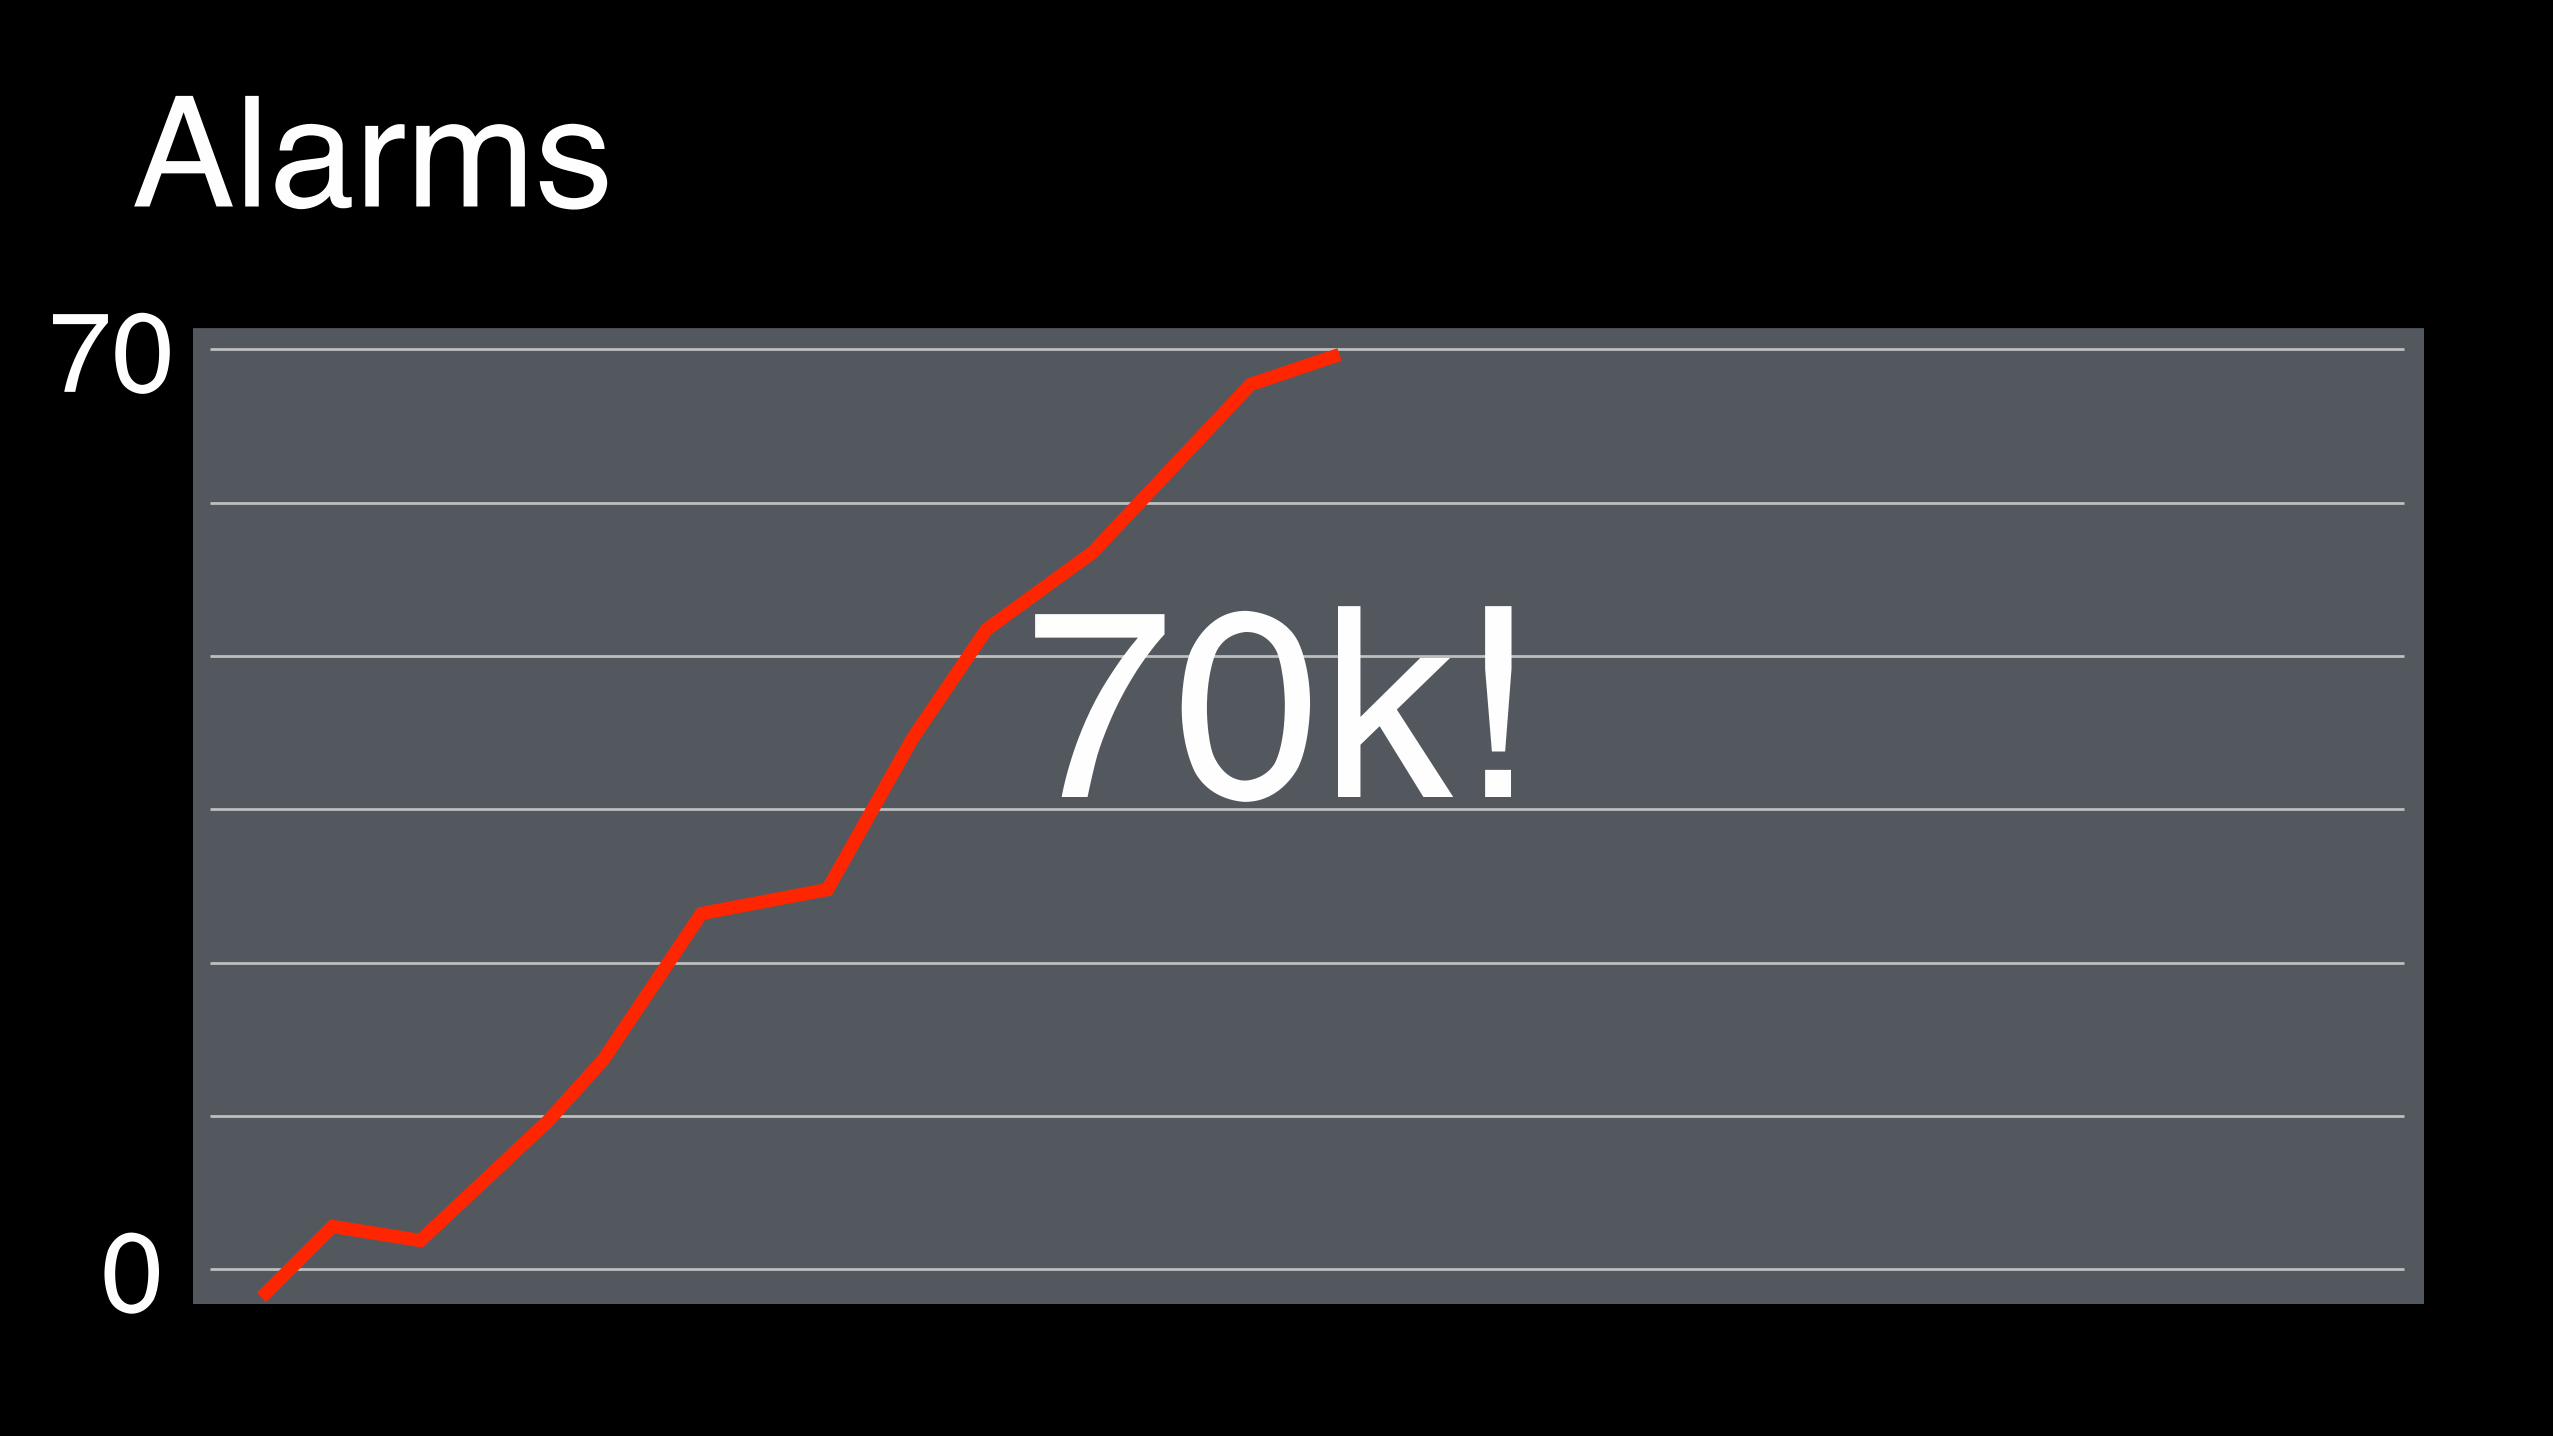
Alarms
0
70
70k!
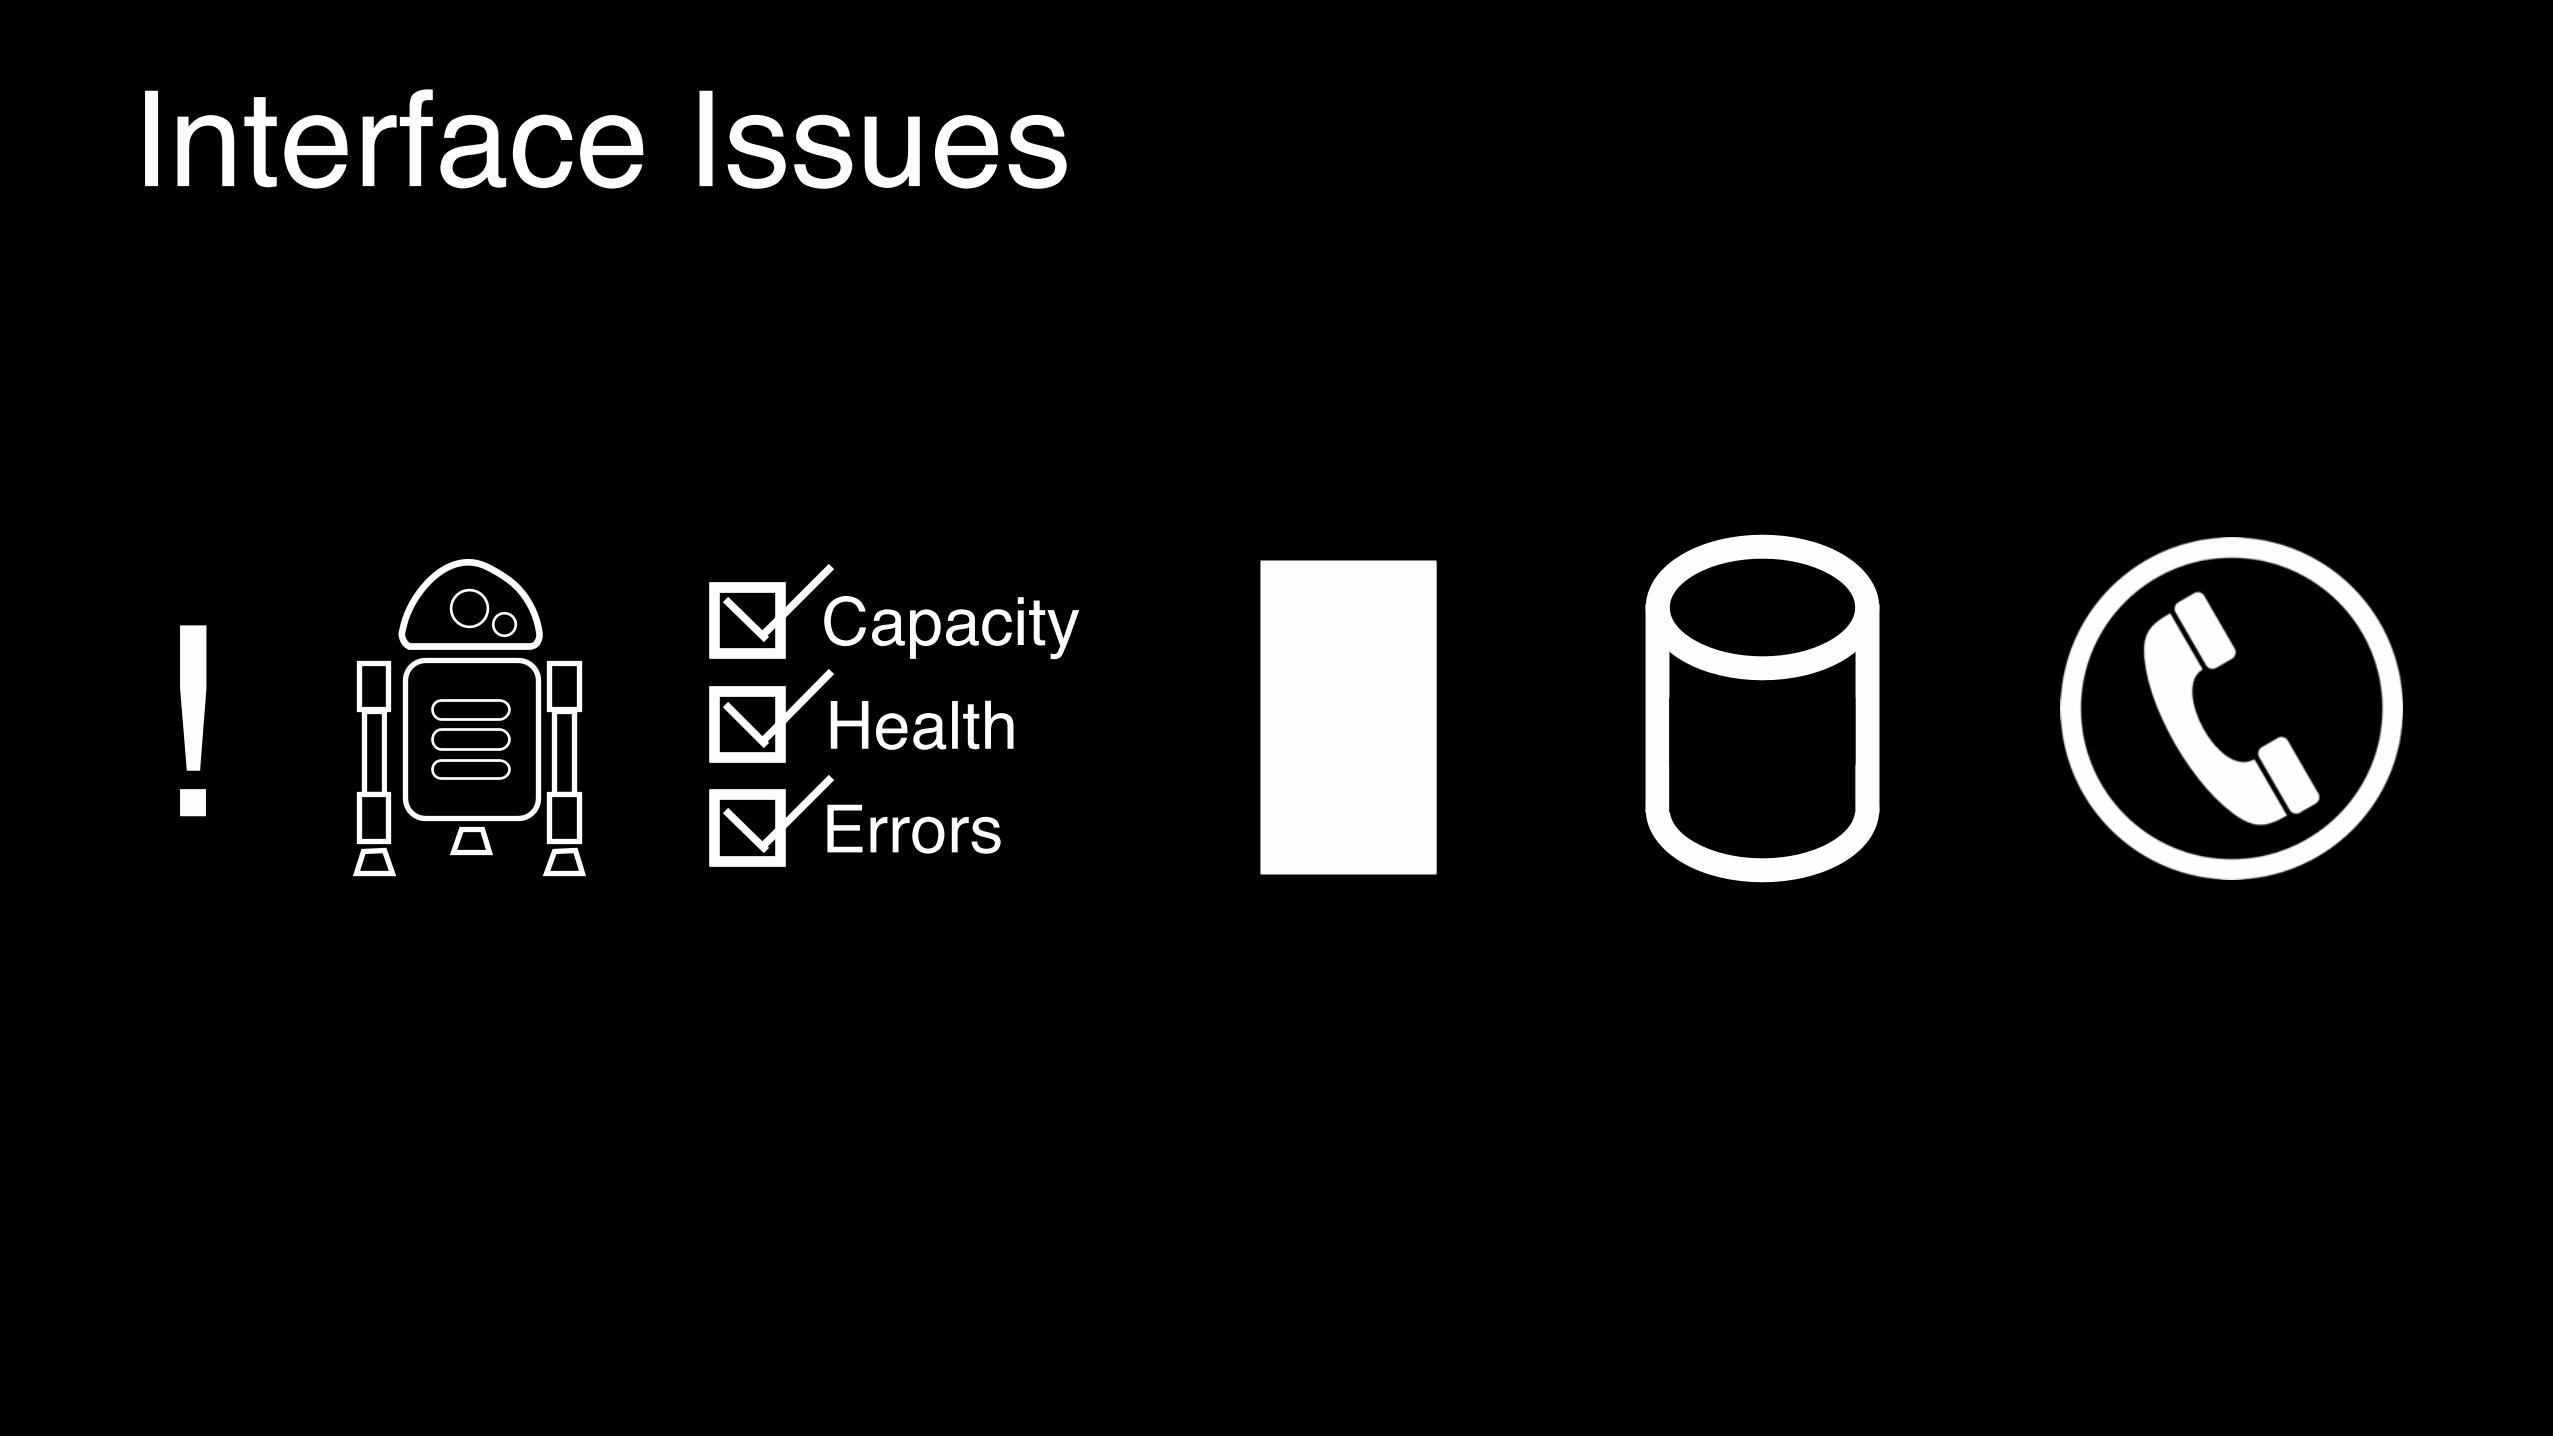
! CapacityHealthErrors
Interface Issues

Alarms Now
0
70
<100 -99.99%

Automation - One Month
3.37b0.99%
750k99.6%

Automation - One Month
750,000 * 2 = 1,500,0001,500,000 / 60 = 25,000
25,000 / 160150+

Why?

?

How do I start?

NetOps Coding101 Room: Colonial
9:30a-11a11:30a-1p

fb.com/groups/netengcode#netengcode