Embed Size (px)
Citation preview
Monica Brezzi – Francesca Utili
Department for Development PoliciesMinistry of Economic Development
17 th session of the Territorial Development Policy Committee
SymposiumSetting standards for local public goods
provision: challenges for regional development
The Italian case
Rome, 20 June 2007
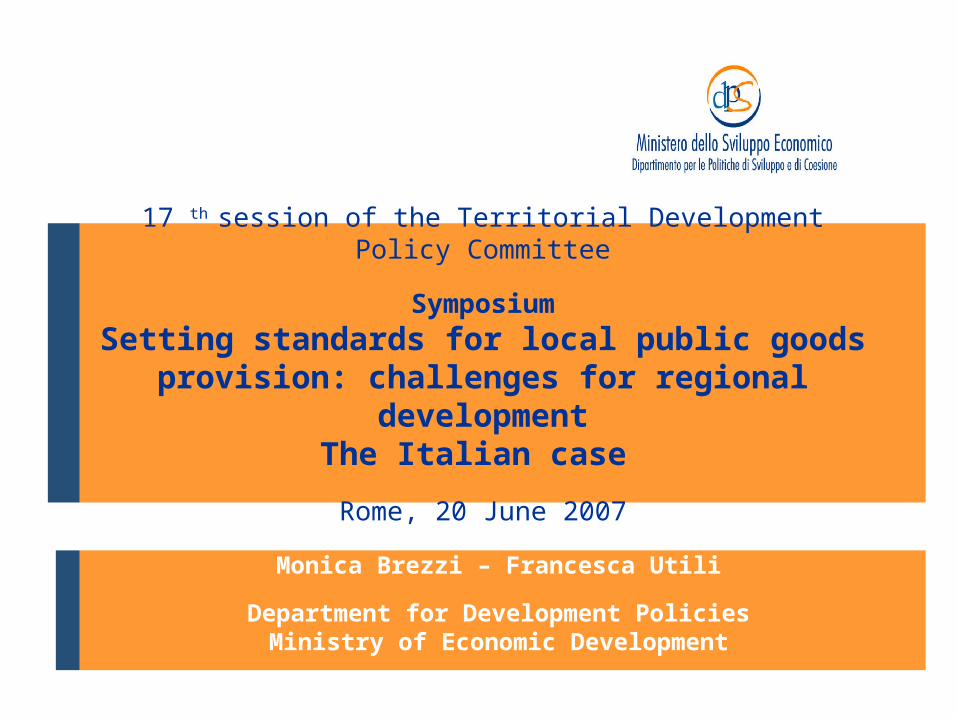
Regional development policy = long-term policy of public investments in infrastructure and training of human resources.
Not only infrastructure but also services
Outcomes observable in a shorter time span
Increase the public support on the policy long term objectives
Engage citizens
Essential services in regional development policy
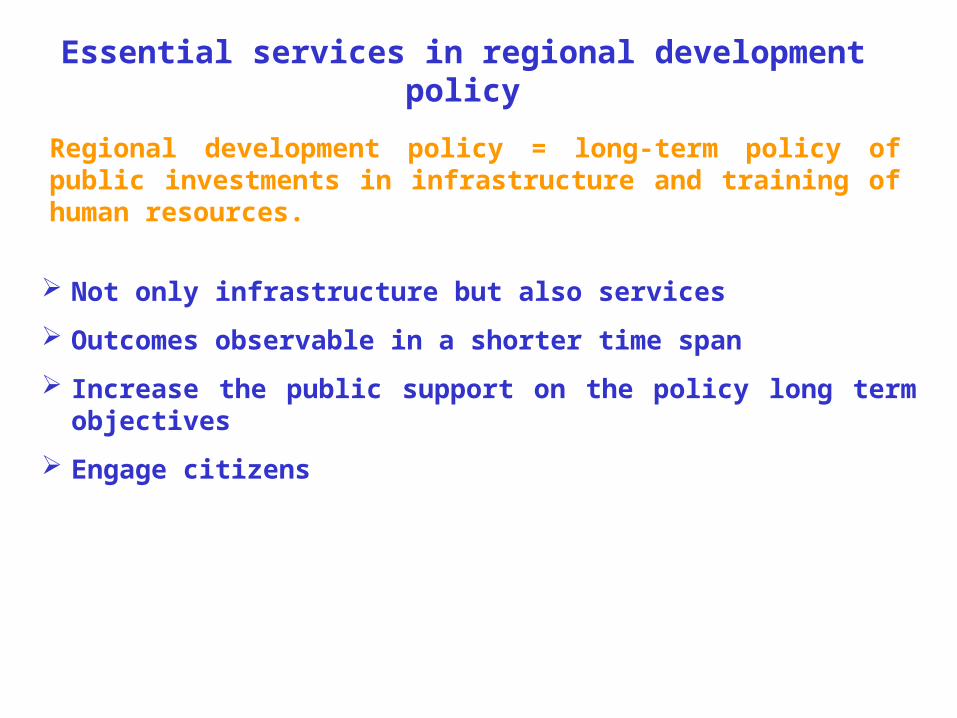
Regional disparities
South: 8 regions; Population 21 millions (36%)
Centre- North
24.819
28.434
13.96316.360
-
5.000
10.000
15.000
20.000
25.000
30.000
2000 2001 2002 2003 2004 2005
Centre-North
South
GPD per capita in the South is at 58% of Centre-North
20
30
40
50
60
70
2000 2001 2002 2003 2004 2005 2006
Centre-North
South
Per capita GDP (current euros)
Female activity rate

…also in the availability of essential services
8,7
31,8
4,2
15,5
25,5
16,8
0
5
10
15
20
25
30
35
Centre-North South Centre-North South Centre-North South
early school leavers (2006) child care coverage (2004) Recycled urban waste(2005)
(%)
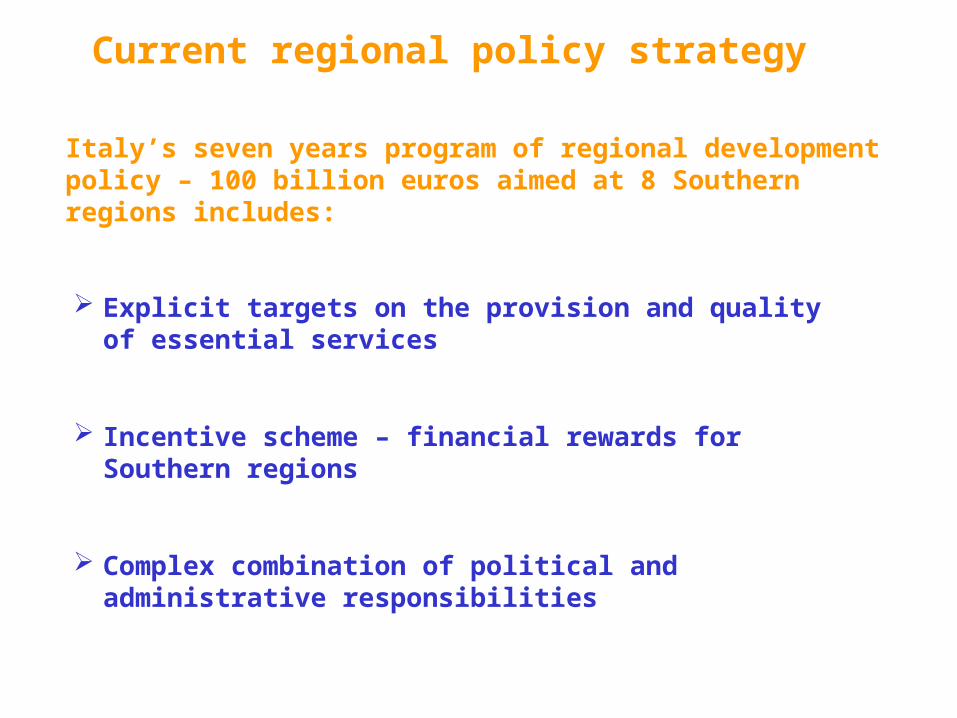
Italy’s seven years program of regional development policy – 100 billion euros aimed at 8 Southern regions includes:
Explicit targets on the provision and quality of essential services
Incentive scheme – financial rewards for Southern regions
Complex combination of political and administrative responsibilities
Current regional policy strategy
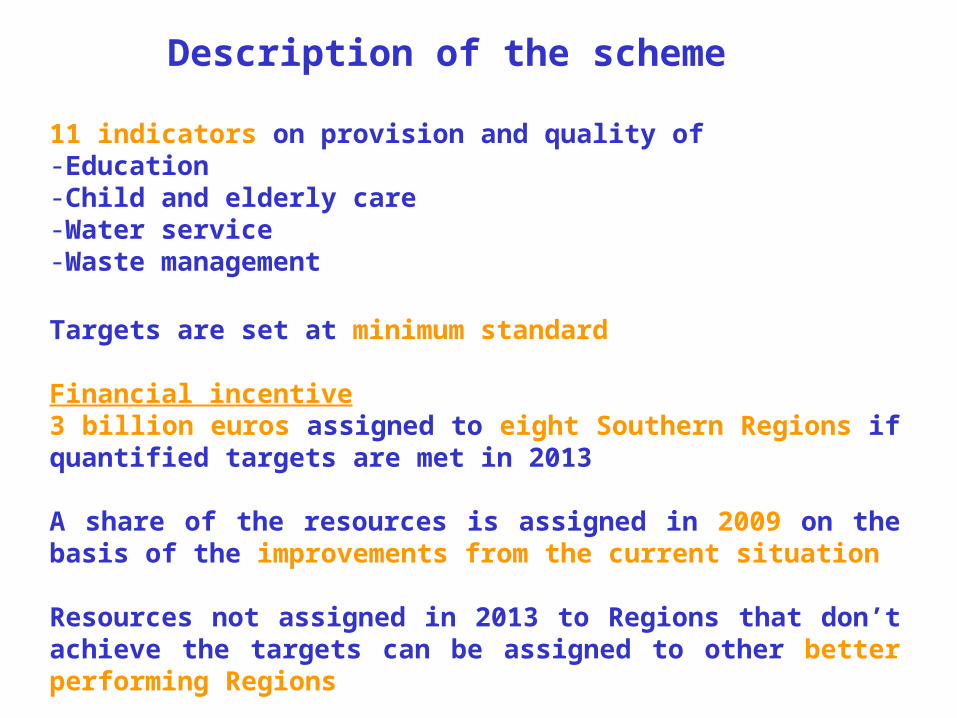
Description of the scheme
11 indicators on provision and quality of-Education-Child and elderly care-Water service-Waste management
Targets are set at minimum standard
Financial incentive3 billion euros assigned to eight Southern Regions if quantified targets are met in 2013
A share of the resources is assigned in 2009 on the basis of the improvements from the current situation
Resources not assigned in 2013 to Regions that don’t achieve the targets can be assigned to other better performing Regions
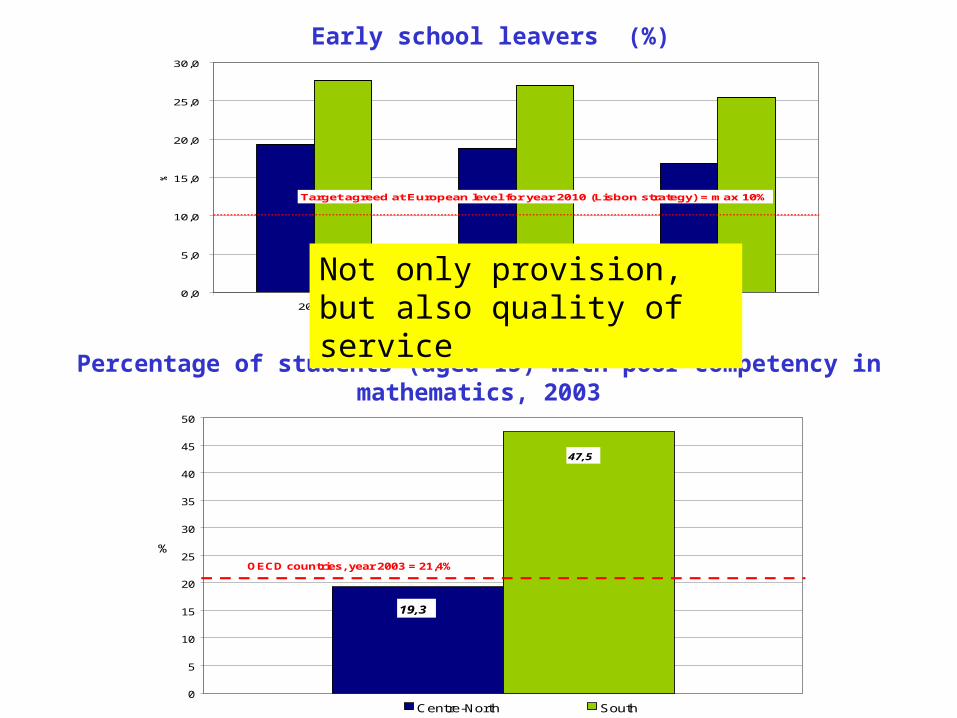
Early school leavers (%)
0,0
5,0
10,0
15,0
20,0
25,0
30,0
2004 2005 2006
%
Centre-North South
Target agreed at European level for year 2010 (Lisbon strategy) = max 10%
Percentage of students (aged 15) with poor competency in mathematics, 2003
19,3
47,5
0
5
10
15
20
25
30
35
40
45
50
Centre-North South
%
OECD countries, year 2003 = 21,4%
Not only provision, but also quality of service
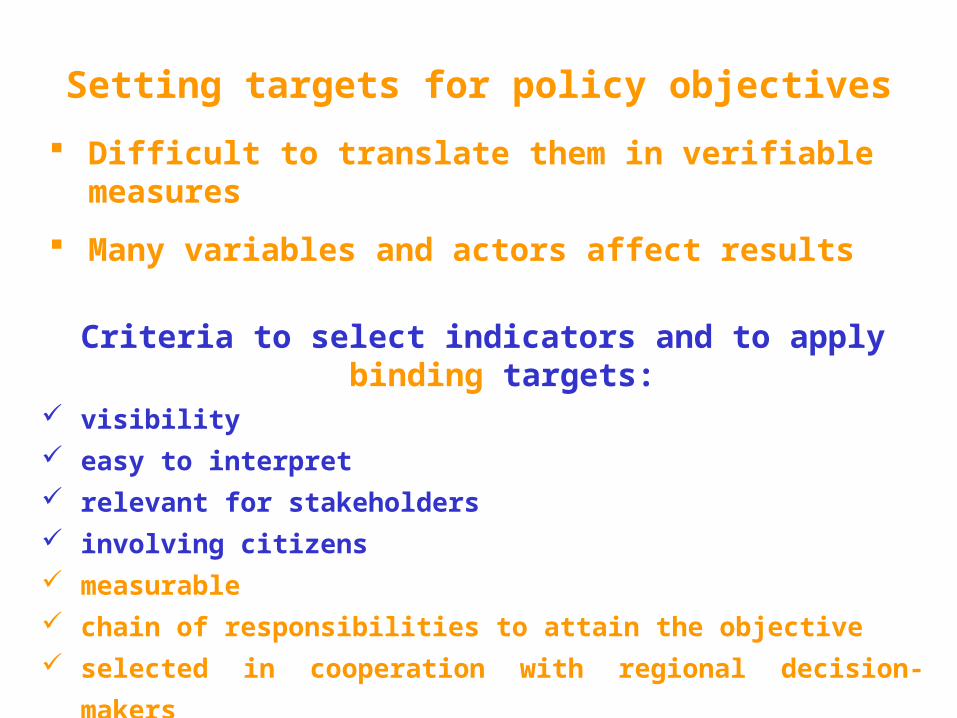
Criteria to select indicators and to apply binding targets:
visibility easy to interpret relevant for stakeholders involving citizens measurable chain of responsibilities to attain the objective selected in cooperation with regional decision-makers
Setting targets for policy objectives
Difficult to translate them in verifiable measures
Many variables and actors affect results
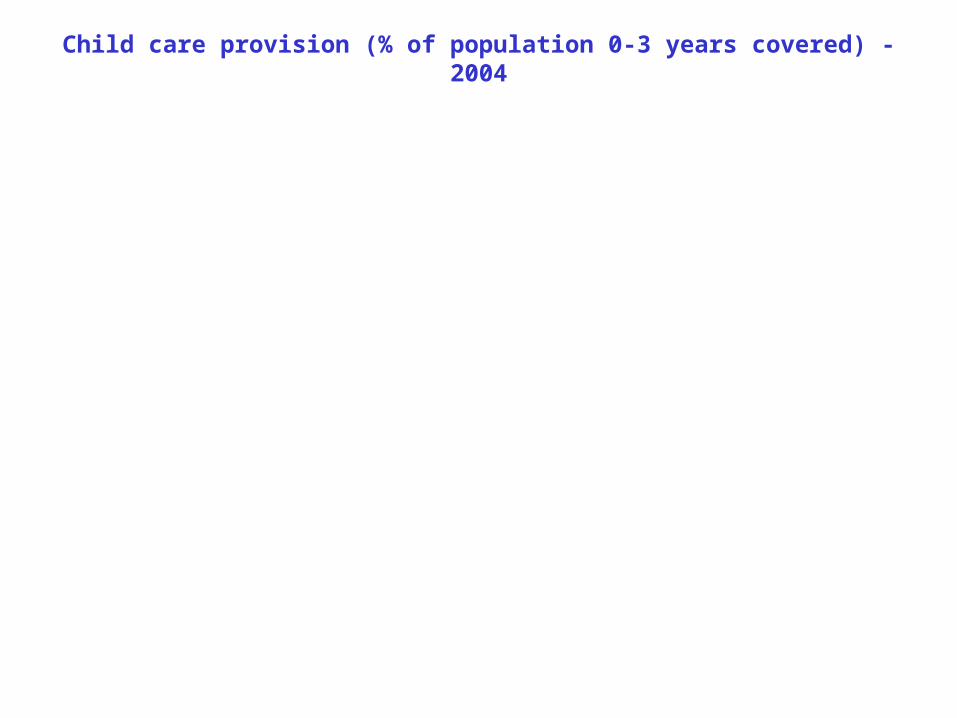
Child care provision (% of population 0-3 years covered) - 2004
0
5
10
15
20
25
30E
mili
a -
Ro
ma
gn
a
Valle
d'A
ost
a
Tosc
an
a
Ma
rch
e
Lig
uri
a
Lom
ba
rdia
Um
bri
a
Pie
mo
nte
Tre
nti
no
-AA
Ven
eto
Sa
rde
gn
a
Friu
li -
VG
Lazi
o
Ab
ruzz
o
Sic
ilia
Ba
silic
ata
Pug
lia
Mo
lise
Ca
lab
ria
Ca
mp
an
ia
(%) Italy = 12%
SouthCentre-North
Targets ambitious but achievable
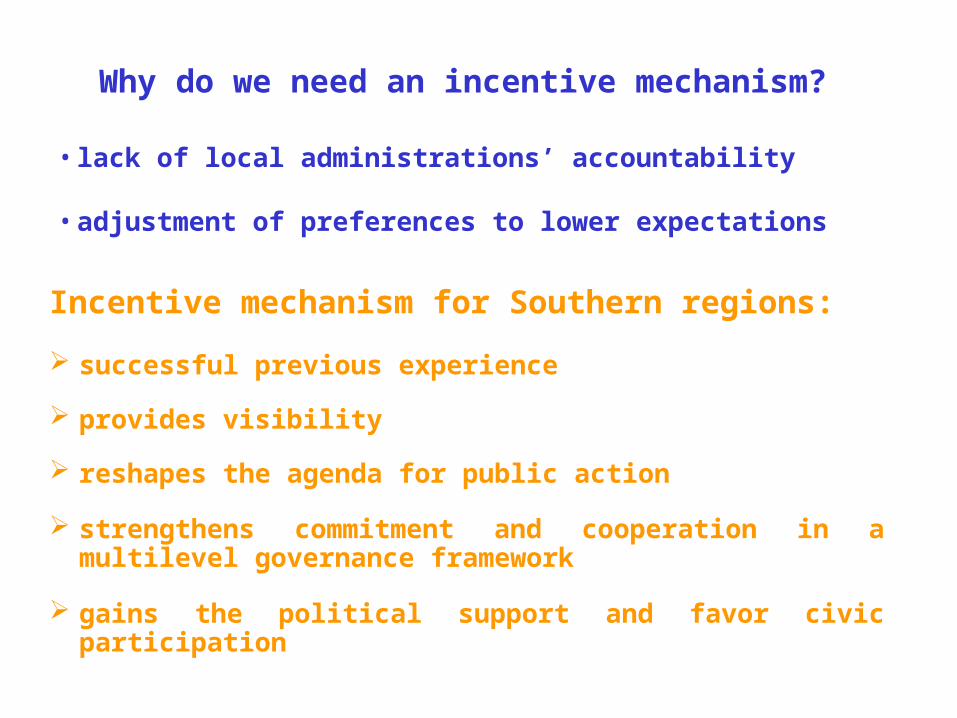
Why do we need an incentive mechanism?
Incentive mechanism for Southern regions:
successful previous experience
provides visibility
reshapes the agenda for public action
strengthens commitment and cooperation in a multilevel governance framework
gains the political support and favor civic participation
• lack of local administrations’ accountability
•adjustment of preferences to lower expectations

Services Statistical indicatorCentral
administrationLocal
administration
Early school leavers
Students with poor competency in reading
Students with poor competency in mathematics
Percentage of municipalities with child care
Children in child care
Share of old people beneficiary of home assistance
Ministry of Health
Municipalities; local public health
agenciesAmount of urban waste landfilledPercentage of recycled urban waste
Percentage of composted waste
Percentage of water distributed
Population served by waste water treatment plants
EducationMinistry of Public
educationCounties; Schools
Child and elderly care
Ministry of welfare;
Department for family's policies
Municipalities
Urban waste management
Ministry of environment
Local Water agencies;
Municipalities
Water sectorLocal Water
agencies
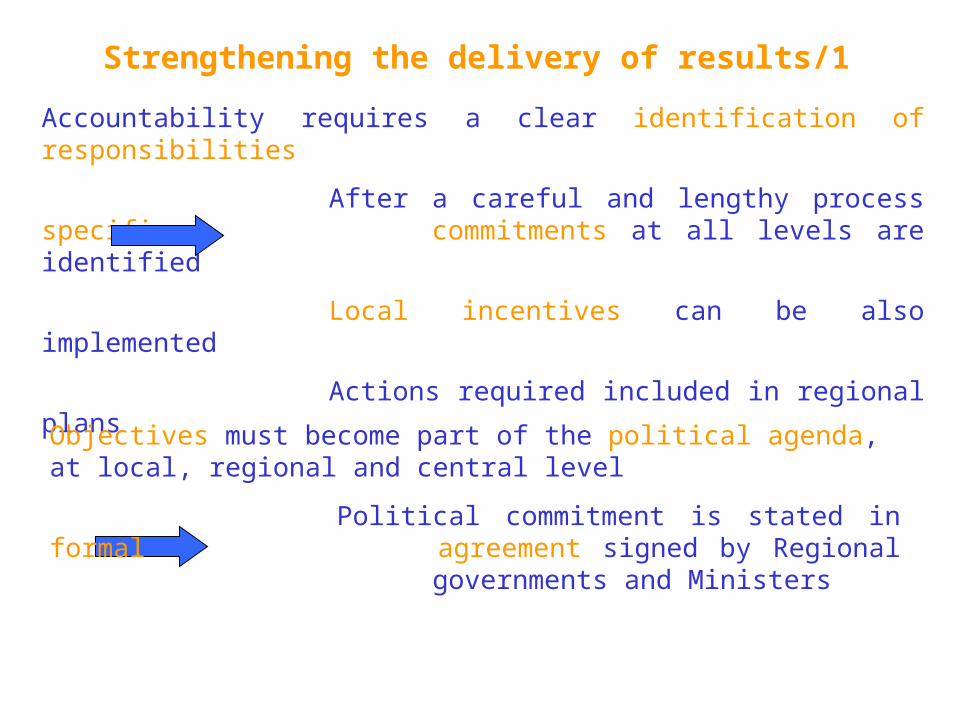
Accountability requires a clear identification of responsibilities
After a careful and lengthy process specific commitments at all levels are identified
Local incentives can be also implemented
Actions required included in regional plans
Strengthening the delivery of results/1
Objectives must become part of the political agenda, at local, regional and central level
Political commitment is stated in formal agreement signed by Regional governments and Ministers
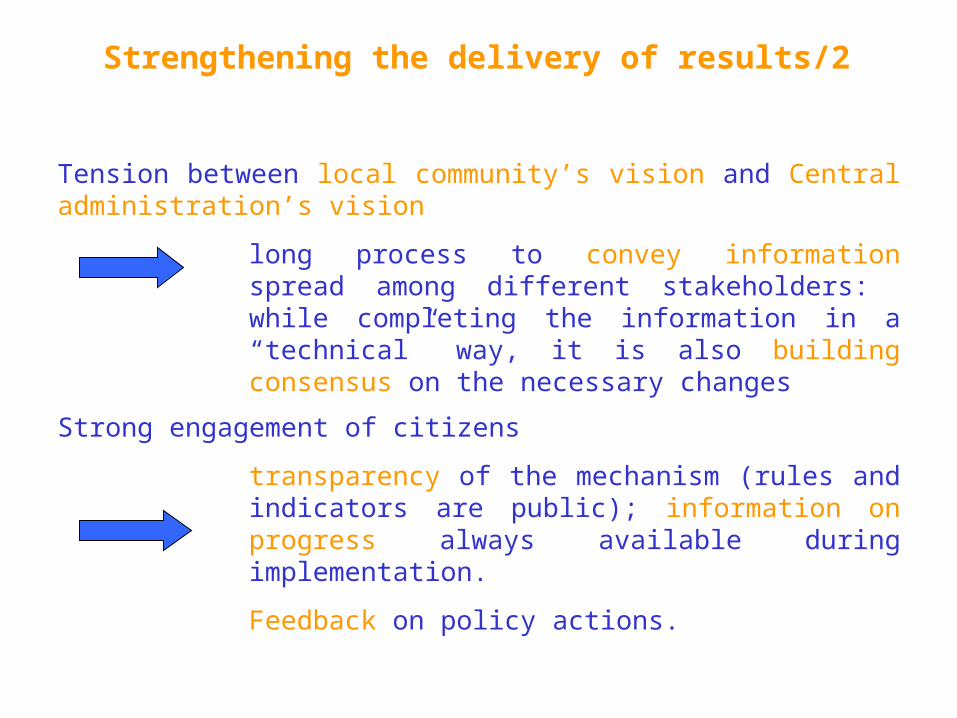
Strong engagement of citizens
transparency of the mechanism (rules and indicators are public); information on progress always available during implementation.
Feedback on policy actions.
Strengthening the delivery of results/2
Tension between local community’s vision and Central administration’s vision
long process to convey information spread among different stakeholders: while completing the information in a “technical” way, it is also building consensus on the necessary changes
200
250
300
350
400
450
2002 2003 2004 2005 2006 2007 2008 2009 2010 2011 2012
Centre-North
South
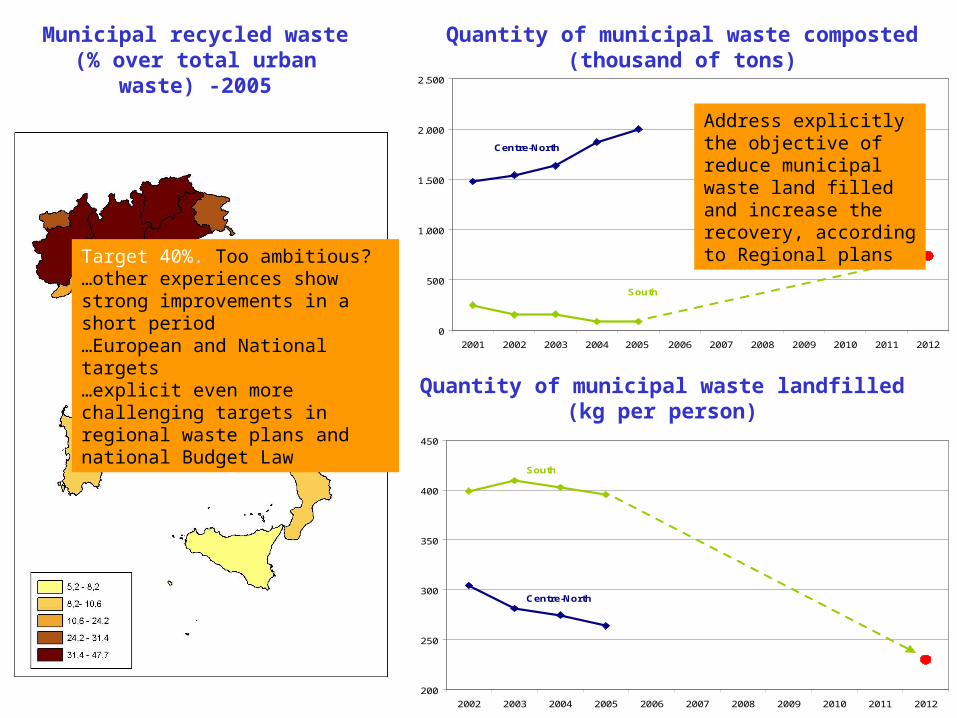
Quantity of municipal waste landfilled (kg per person)
Municipal recycled waste (% over total urban waste)
-2005
Quantity of municipal waste composted (thousand of tons)
0
500
1.000
1.500
2.000
2.500
2001 2002 2003 2004 2005 2006 2007 2008 2009 2010 2011 2012
Centre-North
South
Target 40%. Too ambitious? …other experiences show strong improvements in a short period…European and National targets …explicit even more challenging targets in regional waste plans and national Budget Law
Address explicitly the objective of reduce municipal waste land filled and increase the recovery, according to Regional plans