Embed Size (px)
Citation preview

2012
Intermediate report – WP5
Project period 5 and 6
(01.03.2011 – 31.01.2012)
Stefan Dodunekov
Zlatogor Minchev
Iliya Mitov
Krassimira Ivanova
Nina Dobrinkova
Peter Boyvalenkov
Radoslav Pavlov
Emil Kelevedzhiev
31th January 2012
KNOWLEDGE DISCOVERY METHODS AND TOOLS AND CONTINUOUS SITUATION AWARENESS SYSTEMS
(the Bulgarian Academic Approach)


Project: SEE/A/118/2.2/X MONITOR II
Institution: Institute of Mathematics and Informatics
Period: 1/03/2011 – 31/01/2012
Knowledge Discovery Methods and Tools and Continuous Situation Awareness Systems
(the Bulgarian Academic Approach)
Authors
Stefan Dodunekov
Zlatogor Minchev
Iliya Mitov
Krassimira Ivanova
Nina Dobrinkova
Peter Boyvalenkov
Radoslav Pavlov
Emil Kelevedziev
Date
31th January 2012
Version
2.9
Status
Final


3
Table of Contents
Table of Contents ....................................................................................................................... 3
Introduction ................................................................................................................................ 5
Chapter 1: Continuous Situation Awareness Systems: An Introductory Overview .................. 7
1 The cognitive processes related to situation awareness .................................................. 9
2 The process of contingency planning concerning flooding ............................................ 10
Chapter 2: Knowledge Discovery Tools Applicable in CSA Systems ......................................... 15
1 Knowledge Discovery ...................................................................................................... 15
2 Data Mining ..................................................................................................................... 16
3 Classification Algorithms ................................................................................................. 19
4 Estimation Methods ........................................................................................................ 26
5 Standardization and Interoperability .............................................................................. 27
Chapter 3: Open-source Data Mining Systems that Could be Implemented in CSA System ............................................................................................................................. 29
1 Existing open-source data mining and knowledge environment systems ..................... 29
2 PaGaNe - a new data mining environment system created in IMI-BAS ......................... 34
Chapter 4: Decision Support Tools ........................................................................................... 39
1 Multi-Criteria Decision Analysis (MCDA) ........................................................................ 39
2 MKA-2 Software System ................................................................................................. 42
3 Implementation of MKA-2 in Risk Monitoring ............................................................... 42
Appendix 1: Some Systems that Support the Global Risk Management Process .................... 45
4 EmerGeo ......................................................................................................................... 45
5 ESRI Public Safety Tools .................................................................................................. 48
6 Sahana Software ............................................................................................................. 49
7 Gaea+ .............................................................................................................................. 52

4
Appendix 2: List of Vectorizing Tools ....................................................................................... 53
References ................................................................................................................................ 57

5
Introduction
"Man is a tool-using animal... Without tools he is nothing, with tools he is all" – so said Thomas Carlyle (1795-1881). When it comes to awareness systems and contingency planning, Carlyle could not have guessed how appropriate his observation would be. Software tools can streamline the disaster recovery or business continuity planning process – or turn it into a nightmare1.
Awareness systems can be broadly defined as those systems that help people construct and maintain awareness of each others' activities, context or status, even if the participants are not co-located. Originally intended for supporting people involved in the same activities at different locations, such systems are now used to support social interactions between any connected individuals and to support social relationships over sustained periods of time [Markopoulos and Mackay, 2009].
Several cognitive processes are related to situation awareness, from short-term tactical objectives that include situation assessment leading to situation awareness to long-term strategic objectives that includes understanding and predicting the progress of the future processes.
The Knowledge Discovery in Databases (KDD) process had been defined by many authors. For instance [Fayyad et al, 1996] define it as "the nontrivial process of identifying valid, novel, potentially useful, and ultimately understandable patterns in data". [Friedman, 1997] considers the KDD process as an automatic exploratory data analysis of large databases. Data mining is an essential step in the global process of knowledge discovery. KDD has a wide scope of applications, one of which is the global monitoring.
1 http://www.rothstein.com/articles/contplansoft.html

6
The contents of this document concerns the Bulgarian Academy of Sciences added-value and experience by means of methods and tools contributing to the Continuous Situation Awareness for Crisis/Emergency Management of natural/man-made disasters and crisis.
Stefan Dodunekov and Zlatogor Minchev are starting with an introductory overview concerning CSA systems (Chapter 1).
Iliya Mitov and Krassimira Ivanova analysed the knowledge discovery tools that could be implemented in CSA Systems (Chapter 2) and made a review of the existing open-source knowledge environments and data mining systems and tools (Chapter 3).
Nina Dobrinkova and Peter Boyvalenkov described multicriteria decision making methods that can be implemented in the process of CSA-management (Chapter 4).
Finally, Radoslav Pavlov made an observation of existing systems, used to support risk management (Appendix 1).
Emil Kelevedziev made an overview of the vectorizing tools that are used in the process of preparing hazard maps (Appendix 2).

7
Chapter 1: Continuous Situation Awareness Systems: An Introductory Overview
Stefan Dodunekov, Zlatogor Minchev
Continuous Situation Awareness Systems (CSA) concerning crisis/emergency management of natural and man-made disasters is a complex task that integrates both horizontally and vertically: technologies, people and knowledge. Whilst, this part of the crisis/emergency management is mostly related to the prevention of the early warning and monitoring systems role, it is also significant for concerning its awareness comprehensiveness [Shalamanov et al, 2008].
Figure 1. Graphical illustration of CROP key idea for natural/man-made disasters & crisis management.

8
Generally, technologies integration is mainly connected with the Common Relevant
Operational Picture (CROP) building. The CROP idea for natural/man-made disasters crisis/emergency management is summarized in Figure 1.
As it is clear from the CROP graphical illustration, an integration and information fusion of GIS, different other sensors (UAVs, satellite, mobile and stationary monitoring systems) information, weather, seismological, hydrological, other environment useful information together with media, scientific modeling & simulation support, subject matter experts and rescue teams is required. This rather complex task is unsolvable solely on technological base but as it was already mentioned requires human and knowledge participation for achieving common and comprehensive understanding about the crisis/emergency management process. One positive academic example concerning the preventive actions is the BEST environment that integrates the recent EU, NATO and Bulgarian national efforts in the field [Minchev, 2012].
Apart of this it is important to outline the necessity of understanding CROP and provide it to the relevant decision making and operational level, achieving in this way continuity in the situation awareness assured from CROP.
Practically, this could be illustrated as follows (Figure 2):
Figure 2. CROP multilevel integration necessity illustration concerning natural/man-made disasters & crisis
management.
Generally, however this CROP multilevel integration necessity is not explaining how and to what extent, the information exchange should be done in the different levels concerning the process of disasters and crisis management in order to achieve CSA. Usually, this is a task that is partially solved on the legislation base2 and requires EU (and NATO) integration and harmonization [Europe 2020], [NATO, 2010]. This, in fact explains and the multilatheral integration approach necessity that encompasses different areas experts, rescue teams, politicians and the civil society being an affected object by the natural/manmade disasters and crisis.
2 The Bulgarian laws official information could be retrieved from http://lex.bg/

9
1 The cognitive processes related to situation awareness
Several cognitive processes are related to situation awareness, from short-term tactical objectives that include situation assessment leading to situation awareness to long-term strategic objectives that includes understanding and predicting the progress of the future processes. Endsley proposes the model that includes three stages of SA formation: perception, comprehension, and projection (Figure 3) [Endsley, 1995].
Figure 3. Endsley's model of situation awareness [Endsley, 1995]
− Level 1 - Perception: perceives the status, attributes, and dynamics of relevant elements in the environment. It involves the processes of monitoring, cue detection, and simple recognition, which lead to an awareness of multiple situational elements (objects, events, people, systems, environmental factors) and their current states (locations, conditions, modes, actions).
− Level 2 - Comprehension: involves a synthesis of the elements through the processes of pattern recognition, interpretation, and evaluation. This level requires integrating of the information to understand how it will impact upon the individual's goals and

10
objectives. This includes developing a comprehensive picture of the world, or of that portion of the world of concern to the individual.
− Level 3 - Projection: involves the ability to project the future actions of the elements in the environment. This level is achieved through knowledge of the status and dynamics of the elements and comprehension of the situation, and then extrapolating this information forward in time to determine how it will affect future states of the operational environment.
SA involves both a temporal and a spatial component. Time is an important concept, depending from the actions of individuals, task characteristics, and the surrounding environment. The spatial component in the model concerns the knowledge about the activities and events occurring in a specific location of interest to the individual.
2 The process of contingency planning concerning flooding
The contingency planning concerning flooding is a complex process that could be supported within the development of an integrated methodological approach. It integrates different sub-processes as:
(i) creating the flooding hazard maps, (ii) building the hydrological simulation models, (iii) gathering questionnaire based experts' evaluation, and (iv) scenario based modelling,
achieving in this way a comprehensive viewpoint of the flood prevention and risk assessment.
The first step concerning the usage of flood hazard maps is based on existing maps that are officially provided from authorized instances such as Fire Fighting & Civil Protection Directorate of the Ministry of Interior and Basin Directorate, Ministry of Environment and Water, etc. (varying in different countries). These maps are developed on the basis of historical and prognosis flooding data.
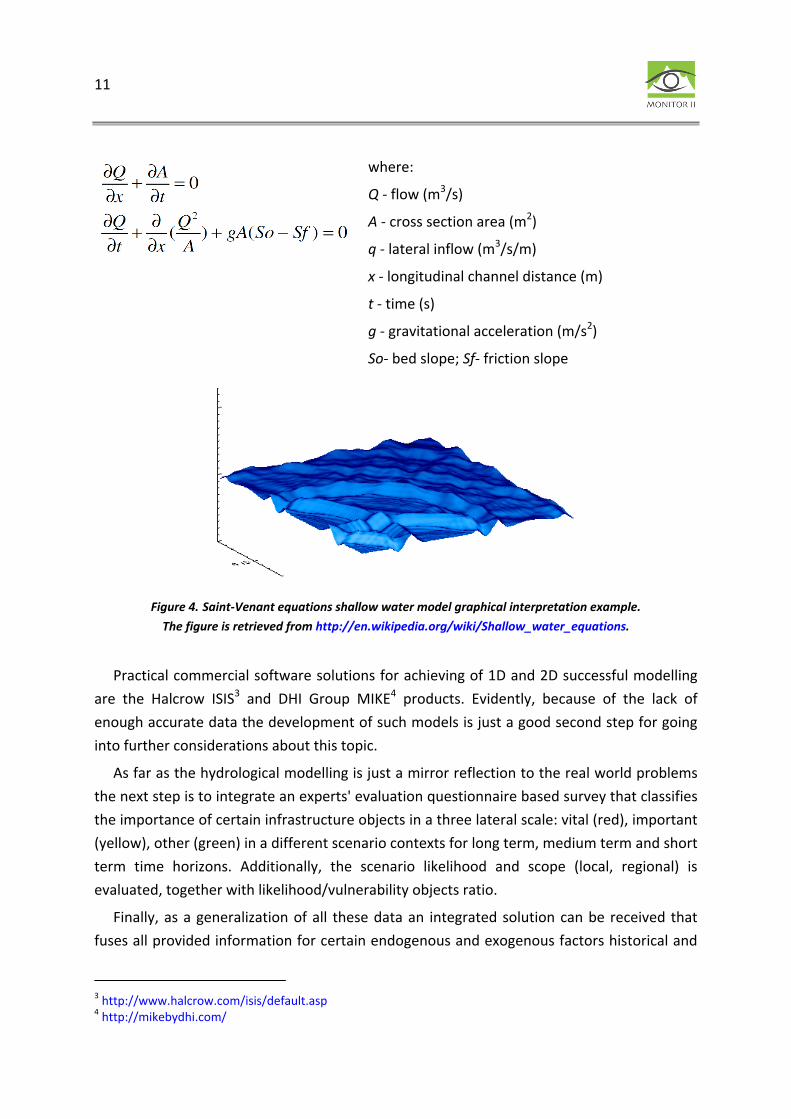
Regarding the flooding prognosis and flood hazard maps generating, an accent to flood simulation will be given in this paragraph. The mathematical background of the flood prognosis, but the Saint-Venant equations numerical integration (Figure 4). The form of these equations, concerning the 1D case for shallow water is:
11
where:
Q - flow (m3/s)
A - cross section area (m2)
q - lateral inflow (m3/s/m)
x - longitudinal channel distance (m)
t - time (s)
g - gravitational acceleration (m/s2)
So- bed slope; Sf- friction slope
Figure 4. Saint-Venant equations shallow water model graphical interpretation example.
The figure is retrieved from http://en.wikipedia.org/wiki/Shallow_water_equations.
Practical commercial software solutions for achieving of 1D and 2D successful modelling are the Halcrow ISIS3 and DHI Group MIKE4 products. Evidently, because of the lack of enough accurate data the development of such models is just a good second step for going into further considerations about this topic.
As far as the hydrological modelling is just a mirror reflection to the real world problems the next step is to integrate an experts' evaluation questionnaire based survey that classifies the importance of certain infrastructure objects in a three lateral scale: vital (red), important (yellow), other (green) in a different scenario contexts for long term, medium term and short term time horizons. Additionally, the scenario likelihood and scope (local, regional) is evaluated, together with likelihood/vulnerability objects ratio.
Finally, as a generalization of all these data an integrated solution can be received that fuses all provided information for certain endogenous and exogenous factors historical and
3 http://www.halcrow.com/isis/default.asp 4 http://mikebydhi.com/

12
prognosis dynamics (i.e. integration of the mentioned three steps and taking into account: climate changes, hydrological dynamics, soil composition and structure changes, demographic changes, critical infrastructure dynamics, etc.) in a reasonable scenario context.
2.1 Methodology
The approach that has been chosen for models development is based on the utilization of the well-known General Systems Theory [Bertalanffy, 1968], because the object of interest could be easily approximated to a Complex Dynamic System with a lot of objects, time-dependent relations sufficient enough for complicated behaviour interpretation. As far as the model interpretation is not unique, due to experts' opinion usage and different projections of interest a consideration for accomplishing of the workshop method and/or brainstorming continued further with Delphi filtering for data convergence could be used [Minchev and Shalamanov, 2010].
The selected formalism for objects machine interpretation is the Entity-Relationship (E-R) model for machine data/knowledge representation [Chen, 1976], which gives nice closure to the reality.
A further implementation of the Dynamical Systems Theory [Katok and Hasselblatt, 1999] in the discrete case is achieved by adding weights and time lags (steps number) to the relations between different objects, thus approximating a transition functions that characterize the connections between system's objects (thus constructing a model approximating the behaviour of a set of differential systems, solved/partially solved in the discrete case). Because, generally, values discretization puts a lot of questions about the accuracy that in combination with the information reliability can make this very difficult and complex. For partial solving of the problem the intuitionistic fuzzy sets are used in the input data evaluation [Minchev, 2007].
2.2 Software implementation
The software implementation is based on the E-R paradigm developed in the object oriented environment Borland Delphi 7® as I-SCIP-SA v.2.0 [Minchev and Petkova, 2010]. Briefly, this software allows creation of models using objects (interpreted as rectangles, squares and circles), which are connected with relations (interpreted as headed weighted arrows – uni- and bi- directional). The arrows' weights are marked as yellow labels over the arrows and are expressed in percentages using the following scale: low [0-30], middle [30-50] and high [50-100]. Additionally, if a dynamical classification is performed, the time steps

13
numbers (showing the discretes/delays of the transition function) are marked within blue labels above the arrows.
The 3D Sensitivity Diagram (SD) object classification in four zones in accordance with influence/dependence ratio (IDR): red (active, IDR=100/50, South-East part of SD cube), blue (passive IDR=50/100, North-West part of SD cube), yellow (critical, IDR=100/100, North-East part of the SD cube) and green (buffering, IDR=50/50, South-West part of SD cube). The third dimension shows the objects sensitivity (z-coordinate, marked with red arrow), calculated as an absolute difference between the influence (y-coordinate, marked with blue arrow) and dependence (x-coordinate, marked with green arrow) values, concerning a certain object from the system of interest. When this difference is negative the object in SD is classified as passive and is coloured in light grey, otherwise it is active and is colorized in white.
A model example for I-SCIP-SA v.2.0 about Maritsa river water level increasing scenario simulation due to the hydrological and climate changes in the area of Svilengrad is shown on Figure 5.
Figure 5. A model example for I-SCIP-SA v.2.0 about Maritsa river water level increasing scenario simulation
due to the hydrological and climate changes in the area of Svilengrad.

14
The resulting simulation in I-SCIP-SA v.2.0 environment about this model is produced and shown on Figure 6.
Figure 6. The resulting I-SCIP-SA v.2.0 on the example of Maritsa river water in the area of Svilengrad.
The presented methodological framework produces an integrated approach, achieving in this way a comprehensive viewpoint of the flood prevention and risk assessment.
What however is important to note is the role of the human factor as far as none of the steps could be excluded from subjectiveness and thus the accumulative methodological uncertainty is inevitable. One possible option for decreasing this methodological error is the usage of more accurate input data and adding a different sensor monitoring systems. Another added value to the uncertainty problem as a whole is the simulation of infeasible future scenarios and the observed and forecast future trends mathematical validation [Minchev and Shalamanov, 2010].

15
Chapter 2: Knowledge Discovery Tools Applicable in CSA Systems
Iliya Mitov, Krassimira Ivanova
In recent years the intellectualized techniques stands an integral element many fields, one of which is the global monitoring.
The knowledge discovery field is concerned with the development of methods and techniques for making sense of data. The basic problem is the mapping low-level data (which are typically too voluminous to understand and digest easily) into other forms that might be more compact (for example, a short report), more abstract (for example, a descriptive approximation or model of the process that generated the data), or more useful (for example, a predictive model for estimating the value of future cases) [Fayyad et al, 1996].
1 Knowledge Discovery
Data Mining is a part of the overall process of Knowledge Discovery in databases (KDD) [Fayyad et al, 1996].While Knowledge Discovery is defined as the process of seeking new knowledge about an application domain [Klosgen and Zytkow, 1996], data mining is concerned with the application (by humans) of algorithms designed to analyze data or to extract pattern in specific categories of data. The knowledge discovery process consists of many steps, with data mining being one of them.
The Knowledge Discovery in Databases (KDD) process had been defined by many authors. For instance [Fayyad et al, 1996] define it as "the nontrivial process of identifying valid, novel, potentially useful, and ultimately understandable patterns in data". [Friedman, 1997] considers the KDD process as an automatic exploratory data analysis of large databases.
The KDD process has been formed by different stages, which iteratively interact with each other. During the years, several models have been proposed (for instance in [Fayyad et al, 1996]). Generally, the process of knowledge discovery can be divided into following stages [Han and Kamber, 2006]:

16
1. Data cleaning (the removal of noise and inconsistent data). 2. Data integration (combining multiple data sources). 3. Data selection (retrieval of data relevant to the analysis task from the database). 4. Data transformation (transformation or consolidation of data suited for mining; this
can be done, for example by performing summary or aggregation operations). 5. Data mining (an essential process where intelligent methods are applied in order to
extract data patterns). 6. Pattern evaluation (used to identify the most interesting patterns representing
knowledge based on some interestingness measures). 7. Knowledge presentation (use of visualization and knowledge representation
techniques to present the mined knowledge to the user). Data mining is an essential part in the global process of knowledge discovery.
2 Data Mining
Data Mining is the process of analyzing a large set of raw data in order to extract hidden information which can be predicted. It is a discipline, which is at the confluence of artificial intelligence, data bases, statistics, and machine learning. The questions related to data mining present several aspects, the main being: classification, clustering, association and regularities. Technically, data mining is the process of analyzing data from many different dimensions or sides, and summarizing the relationships identified [Kouamou, 2011].
The data mining methods are divided essentially in two main types [Maimon and Rokach, 2005] (Figure 7):
− Verification-oriented (the system verifies the user's hypothesis); − Discovery-oriented (the system finds new rules and patterns autonomously) [Fayyad et
al, 1996].
Verification methods deal with the evaluation of a hypothesis proposed by an external source. These methods include the most common approaches of traditional statistics, like goodness-of-fit test, t-test of means, and analysis of variance. Such methods are not usually associated with data mining because most data mining problems are concerned with the establishment of a hypotheses rather than testing a known one.
Most of the discovery-oriented techniques are based on inductive learning [Mitchell, 1997], where a model is constructed explicitly or implicitly by generalizing from a sufficient number of training examples. The underlying assumption of the inductive approach is that the trained model is applicable to future unseen examples.

17
Figure 7. The taxonomy of data mining methods
Discovery methods are methods that automatically identify patterns in the data. The discovery method branch consists of prediction methods versus description methods.

18
Description-oriented data mining methods focus on understanding how the underlying
data operates. The main orientations of these methods are clustering, summarization and visualization.
The main directions of description-oriented methods are clustering, link analysis and summarization.
Clustering is the process of grouping the data into classes or clusters, so that objects within a cluster have high similarity in comparison to one another but are very dissimilar to objects in other clusters. Dissimilarities are assessed based on the attribute values describing the objects, using different kinds of distance measures.
Link Analysis uncovers relationships among data. It is used for 3 primary purposes [Berry et al, 2004]: (1) Find matches in data for known patterns of interest; (2) Find anomalies where known patterns are violated; and (3) Discover new patterns of interest. In this direction falls such disciplines as affinity analysis, association rules mining, and sequence discovery.
Summarization is the process of reducing a text document or a larger corpus of multiple documents into a short set of words or paragraph that conveys the main meaning of the text. There are two main methods for this: extraction and abstraction. Extractive methods work by selecting a subset of existing words, phrases, or sentences in the original text to form the summary. In contrast, abstractive methods build an internal semantic representation and then use natural language generation techniques to create a summary that is closer to what a human might generate. Such a summary might contain words not explicitly present in the original.
Prediction-oriented methods aim to build a behavioural model that can create new and unobserved samples and is able to predict the values of one or more variables related to the sample. Here two main branches are gained: classification and estimation. These two forms of data analysis are used to extract models describing important data classes or to predict future data trends. The main difference between classification and estimation is that classification map the input space into predefined classes, while estimation models map the input space into a real-valued domain.
Classification models predict categorical (discrete, unordered) labels. The classification is the problem of identifying the sub-population to which new observations belong, where the identity of the sub-population is unknown, on the basis of a training set of data containing observations whose sub-population is known. The new individual items are placed into groups based on quantitative information on one or more measurements, traits or characteristics, etc.), and based on the training set in which previously decided groupings are already established. There are several big groups, in which classifiers belongs: Bayesian

19
Methods, Support Vector Machines, Decision Trees, Decision Rules, Class Association Rules, Lazy Learners, Neural Networks, and Genetic Algorithms. For increasing the received accuracy, upper technique for ensemble methods, or so called meta-classifiers as upper stage is used.
Estimation models construct a continuous-valued function, or ordered value, which are used as predictor (estimator). The most common used technique are different kinds of regression models (involving single predictor variable or two or more predictor variables; linear or non-linear regression, etc.), while other models are also used (such as log-linear models that approximate discrete multidimensional probability distributions using logarithmic transformations). Some of the classifier models can also be tuned to be used for estimation (such as Decision Trees, Neural Networks, etc.) [Han and Kamber, 2006].
3 Classification Algorithms
Classification is the task of identifying the sub-population to which new observations belong where the identity of the sub-population is unknown, on the basis of a training set of data containing observations with a known sub-population. The new individual items are placed into groups based on quantitative information on one or more measurements, traits or characteristics, etc.), and based on the training set in which previously decided groupings are already established.
In order to increase the obtained accuracy, ensemble methods, or so called meta-classifiers as upper stage, are used.
3.1 Classifiers
Classifiers form several big groups: Bayesian Methods, Support Vector Machines, Decision Trees, Decision Rules, Class Association Rules, Lazy Learners, Neural Networks, and Genetic Algorithms.
Bayesian Methods
Bayesian classifiers are statistical classifiers which can predict class membership probabilities, such as the probability that a given instance belongs to a particular class. Bayesian classification is based on Bayes' theorem [Bayes, 1763] that shows the relation between two conditional probabilities which are the reverse of each other. Bayesian classifiers have exhibited high accuracy and speed when applied to large databases [Han and Kamber, 2006].

20
Naïve Bayesian classifiers assume that the effect of an attribute value on a given class is
independent of the values of the other attributes. This assumption is called class conditional independence. Bayesian belief networks are graphical models that can also be used for classification, which allow the representation of dependencies among subsets of attributes.
Support Vector Machines
The Support Vector Machines (SVM) [Boser et al, 1992] use a nonlinear mapping to transform the original training data into a higher dimension. Within this new dimension, it searches for the linear optimal separating hyperplane. With an appropriate nonlinear mapping to a sufficiently high dimension, data from two classes can always be separated by a hyperplane. The SVM finds this hyperplane using support vectors ("essential" training instances) and margins (defined by the support vectors).
Although the training of even the fastest SVMs can be extremely time consuming, they are highly accurate, owing to their ability to model complex nonlinear decision boundaries. They are much less prone to over-fitting than other methods. The support vectors found also provide a compact description of the learned model.
Decision Trees
Decision tree induction is the learning of decision trees from class-labeled training instances. A decision tree is a flowchart-like tree structure, where each internal node (non-leaf node) denotes a test on an attribute, each branch represents an outcome of the test, and each leaf node (or terminal node) holds a class label. The topmost node in a tree is the root node.
Given a question Q , for which the associated class label is unknown, the attribute values
are tested against the decision tree. A path is traced from the root to a leaf node, which holds the class prediction for Q . Decision trees can easily be converted to classification
rules.
The construction of decision tree classifiers does not require any domain knowledge or parameter setting; they can handle high dimensional data; their representation in tree form is intuitive and generally is easy to understand by human users. The learning and classification steps of decision tree induction are simple and fast, and usually achieve good accuracy values.
The first representative of this group was ID3 (Iterative Dichotomiser), developed by Ross Quinlan [Quinlan, 1986], after expanded to C4.5 [Quinlan, 1993]. Most algorithms for decision tree induction follow proposed ideas in ID3 and C4.5 for using a greedy approach in which decision trees are constructed in a top-down recursive divide-and-conquer manner.

21
The top-down approach starts with a training set of instances and their associated class labels. The training set is recursively partitioned into smaller subsets as the tree is being built. J48 is a Weka implementation of C4.5 [Witten and Frank, 2005].
Representative Tree (shortly named REPTree) is an extension of C4.5 [Witten and Frank, 2005], which builds a decision tree using information gain reduction and prunes it using reduced-error pruning. Optimized for speed, it only sorts values for numeric attributes once. It deals with missing values by splitting instances into pieces, as C4.5 does. The algorithm has parameters – maximum tree depth and number of folds for pruning, which can be used when REPTree participates as classifier in ensemble schema.
Decision Rules
In the rule-based classifiers the learned model is represented as a set of IF-THEN rules. The "IF"-part of a rule is known as the rule antecedent. The "THEN"-part is the rule consequent. In the rule antecedent, the condition consists of one or more attribute tests (such as age = youth, and student = yes) that are connected with logical function "AND". The rule's consequent contains a class prediction.
A rule P can be assessed by its coverage and accuracy. For a given class labeled data set { | 1,..., }iD R i n= = , let ncovers be the number of instances covered by P ; ncorrect be the
number of instances correctly classified by P ; and D be the number of instances in D . The
coverage and accuracy of P are:
( ) ncoverscoverage PD
= and ( ) ncorrectaccuracy Pncovers
= .
If more than one rule is triggered, several ordering schemes are used for conflict resolution strategy:
− size ordering – assigns the highest priority to the triggering rule that has the "toughest" requirements, where toughness is measured by the rule antecedent size;
− rule ordering – prioritizes the rules beforehand. The ordering may be class-based or rule-based: - in class-based ordering, the classes are sorted in order of decreasing "importance,"
such as by decreasing order of prevalence; - in rule-based ordering, the rules are organized into one long priority list (called
decision list), according to some measure of rule quality such as accuracy, coverage, or size, or based on advice from domain experts.
The rule induction is similar to tree induction but tree induction is breadth-first, as well as rule induction is depth-first (which means generating one rule at a time until all positive examples are covered) [Alpaydin, 2010].
22
One typical representative of a decision rules classifier is OneR [Holte, 1993]. OneR takes
as input a set of examples, each with several attributes and a class. The aim is to infer a rule that predicts the class given the values of the attributes. The OneR algorithm chooses the most informative single attribute and bases the rule on this attribute alone. Shortly algorithm consists of creating the rules with antecedent each possible value of each attribute and consequent corresponded class label, after that for each class label find the rule with maximal accuracy.
Another well-known classifier from this group is JRip. It is a Weka implementation of RIPPER (Repeated Incremental Pruning to Produce Error Reduction), proposed by William Cohen [Cohen, 1995]. RIPPER attempts to increase the accuracy of rules by replacing or revising individual rules. It uses reduced error pruning in order to decide when to stop adding more conditions to a rule; this reduces the amount of training data. RIPPER uses a heuristic based on the minimum description length principle as a stop-criterion. Rule induction is followed by a post-processing step that revises the rules in order to approximate what would have been obtained by a global pruning strategy.
Class Association Rules
Association rules show strong relations between attribute-value pairs (or items) that occur frequently in a given data set. The general idea is to search for strong associations between frequent patterns (conjunctions of attribute-value pairs) and class labels. Association rules explore highly confident associations among multiple attributes. This approach helps to overcome some constraints introduced by decision-tree induction, which considers only one attribute at a time. Class Association Rules (CAR) algorithms will be discussed in more details in the next chapter.
Lazy Learners
All classifiers which had been already described belong to the so-called eager learners. Eager learners give a set of training instances and construct classification model before receiving query to classify.
Lazy classifiers are at the opposite side. They give training instances and only store them without any or with a. When a query is submitted, the classifier performs generalization in order to classify the query based on its similarity to the stored training instances.
Contrary to the eager learning methods, lazy learners do less work in the training phase and more work in the recognition phase.
The weak point of lazy classifiers is their computational expensiveness of the recognition process. On the other hand, they are well-suited to implementation on parallel hardware. They naturally support incremental learning.
23
There are two main groups of lazy learners: k-nearest-neighbor classifiers and case-based
reasoning.
k-Nearest-Neighbor Classifiers
Nearest-neighbor classifiers are based on learning by analogy, that is by comparing a given query with training instances similar to it. The training instances are described by n attributes and are represented as points in a n-dimensional pattern space. Recognition consists of searching the pattern space for the k training instances ("k nearest neighbors") that are closest to the query. "Closeness" is defined in terms of a distance metric, such as Euclidean distance. Typical examples are IB1 and IBk [Aha and Kibler, 1991]. One interesting exception here is the KStar classifier which uses an entropy-based distance function [Cleary and Trigg, 1995].
Case-Based Reasoning
Case-based reasoning classifiers use databases of problem solutions to solve new problems. Unlike nearest-neighbor classifiers, which store training instances as points in Euclidean space, a CBR would store instances as complex symbolic descriptions. When given a new case to classify, a case-based reasoner will first check if an identical training case exists. If one is found, then the accompanying solution to that case is returned. If no identical case is found, then the case-based reasoner will search for training cases having components that are similar to those of the new case. Conceptually, these training cases may be considered as neighbors of the new case. If cases are represented as graphs, this involves searching for subgraphs that are similar to subgraphs within the new case. The case-based reasoner tries to combine the solutions of the neighboring training cases in order to propose a solution for the new case. The case-based reasoner may employ background knowledge and problem-solving strategies in order to propose a feasible combined solution [Han and Kamber, 2006].
Neural Networks
The field of neural networks was originally conceived by psychologists and neurobiologists who sought to develop and test computational analogues of neurons. A neural network is a set of connected input/output units in which each connection has a weight associated with it. During the learning phase, the network learns by adjusting the weights so as to be able to predict the correct class label of the input instances.
Long training times; a great number of parameters that are typically best determined empirically; as well as poor interpretability are amongst the weaknesses of neural networks.

24
Advantages of neural networks, however, include their high tolerance to noisy data as
well as their ability to classify patterns on which they have not been trained. They can be used when you may have little knowledge of the relationships between attributes and classes. They are well-suited for continuous-valued inputs and outputs, unlike most decision tree algorithms. Neural network algorithms are inherently parallel; parallelization techniques can be used to speed up the computation process.
In our experiments we have used Multi-Layer Perceptron, realized in Weka, for the representative of this class of algorithms.
Genetic Algorithms
Genetic algorithms attempt to incorporate in classification tasks the principles of natural evolution. An initial population is created consisting of randomly generated rules. Each rule can be represented by a string of bits. As a simple example, suppose that samples in a given training set are described by two Boolean attributes 1A and 2A and that there are two class
labels coded by "0" and "1". The rule "if 1A and not 2A then 0" can be encoded as the bit
string "100," where the two leftmost bits represent attributes 1A and 2A and the rightmost
bit represents the class. For attributes/classes that have 2k > values k bits are used to encode the attribute's values.
Based on the notion of survival of the fittest, a new population is formed to consist of the fittest rules in the current population, as well as offspring of these rules. Typically, the fitness of a rule is assessed by its classification accuracy on a set of training samples. Offsprings are created by applying genetic operators such as crossover and mutation. In crossover, substrings from pairs of rules are swapped to form new pairs of rules. In mutation, randomly selected bits in a rule's string are inverted. The process of generating new populations based on prior populations of rules continues until a population P evolves where each rule in P satisfies a the specified fitness threshold.
The weak point of genetic algorithms is their time consuming learning process. However, genetic algorithms are easily parallelizable and have been used for classification as well as other optimization problems. In data mining, they may be used to evaluate the fitness of other algorithms [Han and Kamber, 2006].
3.2 Ensemble Methods
Ensemble methods combine a series of k learned models, 1,... kM M , with the aim of
creating an improved composite model *M . The main strategies here are bagging and boosting [Han and Kamber, 2006], as well as stacking [Witten and Frank, 2005].

25
Bagging
The term bagging denotes "bootstrap aggregation". Given a set D of d instances, bagging works as follows. For the iteration , 1,...,i i k= a training set iD is sampled with
replacement [StatTrek, 2011] from the original set D . Because sampling with replacement is used, some of the original tuples of D may not be included in iD , where as others may
occur more than once. A classifier model iM is learned for each training set iD . To classify a
query Q each classifier iM returns its class prediction which counts as one vote. The bagged
classifier *M counts the votes and assigns the class with the most votes to Q [Breiman,
1996].
The bagged classifier often has significantly greater accuracy than a single classifier derived from the original training data. It is also more robust to the effects of noisy data. The increased accuracy occurs because the composite model reduces the variance of the individual classifiers.
Boosting
In boosting, weights are assigned to each training instance. A series of k classifiers is iteratively learned. After a classifier iM is learned, the weights are updated to allow the
subsequent classifier 1iM + aggravating training instances that were misclassified by iM . The
final boosted classifier *M combines the votes of each individual classifier, where the weight of each classifier's vote is a function of its accuracy.
Stacking
Stacked generalization or stacking, is an alternative method for combining multiple models. Unlike bagging and boosting, stacking is not used to combine models of the same type. Instead it is applied to models built by various learning algorithms (for example a decision tree inducer, a Naïve Bayes learner and an instance-based learning method). The usual procedure would be to estimate the expected error for each algorithm by cross-validating and then to choose the most appropriate one in order to form a model which can be used for prediction on future data combining outputs by voting. However voting criteria is not reliable enough. The problem is that it is not clear which classifier can be trusted (there are several types of classifiers which can be used). Stacking introduces the concept of the meta-learner which replaces the voting procedure. Stacking attempts to learn which classifiers are reliable using a different learning algorithm – the meta-learner – to discover what is the best way to combine the output from the base learners [Witten and Frank, 2005].

26
4 Estimation Methods
Estimation is the task of predicting continuous (or ordered) values for given input. Let's mention that in some literature the concept "prediction" is also used for signing this methods (for instance [Han and Kamber, 2006]).
Regression
Regression analysis can be used to model the relationship between one or more independent or predictor variables and a dependent or response variable (which is continuous-valued). In the context of data mining, the predictor variables are the attributes of interest making up the attribute vector. In general, the values of the predictor variables are known. (Techniques exist for handling cases where such values may be missing.)
In simple linear regression, the data are modelled to fit a straight line. A random variable, y (called a response variable), can be modelled as a linear function of another random
variable, x (called a predictor variable), with the equation y wx b= + , where the variance of
y is assumed to be constant. In the context of data mining, x and y are both numerical
attributes. The coefficients, w and b (called regression coefficients), specify the slope of the line and the y -intercept, respectively. These coefficients can be solved by the method of least squares, which minimizes the error between the actual line separating the data and the estimate of the line.
Multiple linear regression is an extension of simple linear regression, which allows a response variable y to be modeled as a linear function of two or more predictor variables.
0 1 1 2 2y w w x w x= + + , where 1x and 2x are values of corresponding attributes from the
describing vector. Multiple regression problems are implemented in statistical software packages SAS and SPSS.
Nonlinear Regression is based on using some polynomial models as more accurate modeling. By applying transformations to the variables, the nonlinear model can be converted into a linear one that can then be solved by the method of least squares [Han and Kamber, 2006].
Generalized Linear Models represent the theoretical foundation on which linear regression can be applied to the modeling of categorical response variables. The variance of the response variable y is a function of the mean value of y . Common types of generalized
linear models include logistic regression and Poisson regression. Logistic regression models the probability of some event occurring as a linear function of a set of predictor variables. Count data frequently exhibit a Poisson distribution and are commonly modeled using Poisson regression [Maimon and Rockach, 2005].

27
Log-linears
Log-linear models approximate discrete multidimensional probability distributions using logarithmic transformations. Given a set of tuples in n dimensions (e.g., described by n attributes), we can consider each tuple as a point in a n -dimensional space. In the log-linear method, all attributes must be categorical; hence continuous-valued attributes must first be discretized. Log-linear models can be used to estimate the probability of each point in a multidimensional space for a set of discretized attributes, based on a smaller subset of dimensional combinations. This allows a higher-dimensional data space to be constructed from lower dimensional spaces. Log-linear models are therefore also useful for dimensionality reduction (since the lower-dimensional points together typically occupy less space than the original data points) and data smoothing (since aggregate estimates in the lower-dimensional space are less subject to sampling variations than the estimates in the higher-dimensional space). Because of this, aside from prediction, the log-linear model is useful for data compression and data smoothing.
Decision tree induction
The classification trees can be adapted so as to predict continuous (ordered) values, rather than class labels. There are two main types of trees for prediction—regression trees and model trees. Regression trees were proposed as a component of the CART learning system. Each regression tree leaf stores a continuous-valued prediction, which is actually the average value of the predicted attribute for the training tuples that reach the leaf. Regression and model trees tend to be more accurate than linear regression when the data are not represented well by a simple linear model [Han and Kamber, 2006].
5 Standardization and Interoperability
With the advancement of modern information technologies and the boost in data mining, the use of knowledge discovery becomes an everyday practice. Business Intelligence, Web Mining, Medical Diagnostics, Drives and Controls, GPS Systems, Global Monitoring for Environment and Security, etc. are only few of the application areas where data mining is a core component.
Data mining gradually became an emergent technology across multiple industries and sectors. Such expanded and enlarged use means that it is necessary to design a data mining environment which meets the following requirements:
− data interoperability (currently each system uses its own notation for data entry, for instance C4.5-standard, arff-standard, etc.);

28
− openness for adding new algorithms to the environment; − modularity in order to allow combining of different techniques that became a part of a
global process; − the modules must allow use by different systems, not only a closed use within their
own environment; − user flexibility and possibility to guide the entire data mining process. Kouamou described in 2011 the logical structure of data mining environment [Kouamou,
2011]. The author suggests that integration and interoperability of modern data mining environments are achieved by application of modern industrial standards, such as XML-based languages.
Notably, such systems are able to import and export models in PMML (Predictive Model Markup Language), which provides a standard way to represent data mining models which allows sharing between different statistical applications. PMML is an XML-based language developed by the Data Mining Group, an independent group of numerous data mining companies.
The adoption of standards in this discipline already made it possible to develop procedures of data exchange between various platforms. At the same time there are reflections on the standardization of a data mining process model. The presentation of these efforts demonstrated that the challenge for the future is to develop and popularize widely accepted standards in data mining environment; if developed and adopted, such a standard will stimulate major industry growth and interest. It would also promote development and delivery of solutions that use business language, resulting in performing projects faster, cheaper, more manageably, and more reliably.

29
Chapter 3: Open-source Data Mining Systems that Could be Implemented in CSA System
Iliya Mitov, Krassimira Ivanova
There are several well-known data mining open-source systems which are aiming to support the study and research of the field of data mining, as well as the implication of some modules in real tasks.
1 Existing open-source data mining and knowledge environment systems
Here we will stop our attention on some of the most popular and successful open-source data mining and knowledge environment systems. Some of them are produced in universities research centers as frontier systems for implementation the newly developed algorithms; the others are proposed as freeware modules to some commercial complex systems and platforms.
Weka
Weka5 (Waikato Environment for Knowledge Analysis) is developed by the University of Waikato, New Zealand since 1993.
Weka is well-known suite for machine learning software that supports several typical data mining tasks, particularly data preprocessing, clustering, classification, regression, visualization, and feature selection.
Weka is written in Java and it provides access to SQL databases utilizing Java Database Connectivity and it is also able to process the results returned by a database query. The main user interface is the Explorer, but the same functionality can be accessed from through the command line interface or the component-based Knowledge Flow interface.
5 http://www.cs.waikato.ac.nz/~ml/weka/

30
In 2005, Weka received the SIGKDD Data Mining and Knowledge Discovery Service Award.
In 2006, Pentaho Corporation acquired an exclusive license to use Weka for business intelligence. It forms the data mining and predictive analytics component of the Pentaho business intelligence suite.
Orange
Orange6 is developed and maintained at the Faculty of Computer and Information Science, University of Ljubljana, Slovenia.
Orange is an open component-based data mining and machine learning software suite that features friendly yet powerful, fast and versatile visual programming front-end for data analysis and visualization, and Python bindings and libraries for scripting.
It is written in C++ and Python, and its graphical user interface is based on the cross-platform Qt framework.
It includes a comprehensive set of components for data preprocessing, feature scoring and filtering, modeling, model evaluation and exploration techniques.
RapidMiner
RapidMiner7, formerly called YALE (Yet Another Learning Environment), is created and maintained by Rapid-I GMBH, Germany. It is a machine learning and data mining environment written in Java which is utilized for both research and real-world data mining tasks. It enables experiments to be made up of a huge number of arbitrarily nestable operators, which are detailed in XML files and are made with RapidMiner's graphical user interface. RapidMiner provides more than 500 operators for all main machine learning procedures; it also combines learning schemes and attribute evaluators of the Weka learning environment. It is available as a stand-alone tool for data analysis and as a data-mining engine that can be integrated into other products.
jHepWork
Designed for scientists, engineers and students, jHepWork8 is a multiplatform free and open-source Java-based data analysis framework created as an attempt to develop a data analysis environment using open-source packages with a comprehensible user interface which would be competitive to commercial software. It is specifically made for interactive scientific plots in 2D and 3D and includes numerical scientific libraries implemented in Java for mathematical functions, random numbers, and other data mining algorithms. jHepWork
6 http://www.ailab.si/orange 7 http://rapidminer.com/ 8 http://jwork.org/jhepwork/

31
is based on a high-level programming language Jython, but Java coding can also be used to call jHepWork numerical and graphical libraries.
The jHepWork is a collective effort of many people dedicated to open-source scientific software, coordinated by Sergei Chekanov since 2005.
KNIME
KNIME9 (Konstanz Information Miner), maintained by KNIME GMBH, Germany, is a user friendly, intelligible, and comprehensive open-source data integration, processing, analysis, and exploration platform. It gives users the ability to visually create data flows or pipelines, selectively execute some or all analysis steps, and later study the results, models, and interactive views. KNIME is written in Java, and it is based on Eclipse and makes use of its extension method to support plugins thus providing additional functionality. Through plugins, users can add modules for text, image, and time series processing and can integrate a range of open source projects, such as R programming language, Weka, the Chemistry Development Kit, and LibSVM.
KNIME has been selected by Gartner as Cool Vendor 2010 in the key technology areas Analytics, Business Intelligence, and Performance Management.
SIPINA
SIPINA10 has been developed at the University of Lyon, France since 1995. It is an open data mining software which implements a number of supervised learning paradigms, but mainly classification tree software (it specializes on Classification Trees algorithms such as ID3, CHAID, and C4.5, but other supervised methods e.g. k-NN, Multilayer Perceptron, Naive Bayes, etc. are also available.
SIPINA can handle both continuous and discrete attributes. SIPINA theoretical limitations are 16,384 attributes and 500,000,000 examples. Because it loads the complete dataset in the memory before the learning process, the true limitation is the capacity of the computer memory available.
SIPINA allows feature transformations (discretizing an attribute, coding a set of attributes from a discrete attribute, etc.), feature selection using "filter methods" (selecting the best predictive attributes independently of the supervised algorithms used prior to induction) or "wrapper methods" (where a supervised algorithm selects the best attributes), error evaluation and classification.
9 http://www.knime.org/ 10 http://eric.univ-lyon2.fr/~ricco/sipina.html

32
TANAGRA
The TANAGRA project is a successor of SIPINA11 [Rakotomalala, 2005]. It combines several data mining methods from the domains of exploratory data analysis, statistical learning, machine learning and databases. TANAGRA implements various supervised learning algorithms, more specifically an interactive and visual construction of decision trees. TANAGRA contains some supervised learning but also other paradigms such as clustering, factorial analysis, parametric and nonparametric statistics, association rule, etc.
The primary goal of the TANAGRA project is to make available to researchers and students an easy-to-use data mining software, conforming to the present norms of the software development in this domain (especially in the design of its GUI and the way to use it), and allowing to analyze either real or synthetic data.
A further goal of TANAGRA is to offer researchers an architecture allowing them to easily add their own data mining methods, which would allow to compare performances and establish benchmarks. TANAGRA serves as an experimental platform which support researchers do the essential part of their work, instead of dealing with data management which is the most unpleasant part in the programming of this kind of tools.
The last goal targeting novice developers is to disseminate a possible methodology for the development of this kind of software. Developers can take advantage of free access to source code and can see how this sort of software is built and what problems to avoid; they also can observe what are the main stages of the implementation project, and which tools and code libraries to use. Thus TANAGRA can be considered as a pedagogical tool for learning programming techniques.
AlphaMiner
AlphaMiner12 is developed by the E-Business Technology Institute of the University of Hong Kong. The technology of Business Intelligence (BI) helps companies to improve business decision making. Over the past decade, international companies in the banking, telecommunications, insurances, retails and e-business sectors have successfully used BI to solve numerous business problems in marketing, customer service, cross selling, customer retention, fraud detection and risk management. BI solutions are costly and only large enterprises can afford them. AlphaMiner data mining system provides affordable BI technologies by leveraging existing open source technologies and empowers small companies with the capability to make better decisions in the fast changing business environment. Plug-able component architecture provides extensibility for adding new BI
11 http://eric.univ-lyon2.fr/~ricco/tanagra/en/tanagra.html 12 http://www.eti.hku.hk/alphaminer/index.html

33
capabilities in data import and export, data transformations, modeling algorithms, model assessment and deployment. Versatile data mining functions offer powerful analytics to conduct industry specific analysis including customer profiling and clustering, product association analysis, classification and prediction.
ELKI
ELKI13 (Environment for DeveLoping KDD-Applications Supported by Index-Structures), developed by the Institute for Computer Science of University of Munich, Germany [Achtert et al, 2010], is a data mining software framework with a focus on clustering and outlier detection methods written in Java.
As discussed above, data mining research makes use of multiple algorithms for similar tasks. A fair and useful comparison of these algorithms is difficult due to several reasons:
− most of the software tools are commercial and their implementations are not easily available;
− even when different software implementations are available, an evaluation in terms of efficiency is biased to evaluate the efforts of different authors in efficient programming instead of evaluating algorithmic merits. Probably this is influenced by the fact that usability evaluations could be performed easier than an objective evaluation of the algorithms.
On the other hand, efficient data management tools like index-structures can show considerable impact on data mining tasks and are therefore useful for a broad variety of algorithms.
In ELKI, data mining algorithms and data management tasks are separated and allow for separate evaluation. This distinguishes ELKI among data mining frameworks like Weka framework for index structures like GiST. At the same time, ELKI is open to arbitrary data types, distance or similarity measures, or file formats. The fundamental approach applied in ELKI is the independence of file parsers or database connections, data types, distances, distance functions, and data mining algorithms. Helper classes, e.g. for algebraic or analytic computations, are available for all algorithms on equal terms.
Rattle
Rattle14 (the R Analytical Tool To Learn Easily), created and supported by Togaware Pty Ltd., Australia, is a open-source data mining toolkit used to analyze very large collections of data [Williams, 2009]. Rattle presents statistical and visual summaries of data, transforms data into forms that can be readily modeled, builds both unsupervised and supervised
13 http://www.dbs.ifi.lmu.de/research/KDD/ELKI/

34
models from the data, presents the performance of models graphically, and scores new datasets. The scientific blog DecisionStats (29.04.2010) listed Rattle as one of the top 10 graphical user interfaces in statistical software.
Through a simple and logical graphical user interface based on Gnome, Rattle can be used by itself to deliver data mining projects. Rattle also provides an entry into sophisticated data mining using the open source and free statistical language R.
Rattle runs under GNU/Linux, Macintosh OS/X, and MS/Windows. The aim is to provide an intuitive interface that takes you through the basic steps of data mining, as well as illustrating the R code that is used to achieve this. Whilst the tool itself may be sufficient for all of a user's needs, it also provides a stepping stone to more sophisticated processing and modeling.
LUCS-KDD repository
The LUCS-KDD repository15 (Liverpool University of Computer Science – Knowledge Discovery in Data) has been developed and maintained by the Department of Computer Science, University of Liverpool, UK since 1997. This repository provides a common environment for research tasks and comparison between different algorithms, some of which are a product of the group that supports repository. A number of algorithms were developed since the work on LUCS-KDD commenced; they are released as open access and serve different applications. The team adopted several algorithms: associative rule mining (Apriori-T and TFP) and class association rules algorithms (TFPC) featuring preprocessing of the data and set-enumeration tree structures (the P-tree and the T-tree) to facilitate search.
2 PaGaNe - a new data mining environment system created in IMI-BAS
It is a new data mining environment system, created by the team from the Institute of Mathematics and Informatics – Bulgarian Academy of Sciences. Iliya Mitov and Krassimira Ivanova, which are the members of the Bulgarian team of MONITOR II, are the principal developers of PaGaNe [Mitov et al, 2009].
14 http://rattle.togaware.com/ 15 http://www.csc.liv.ac.uk/~frans/KDD/

35
PaGaNe incorporates different types of statistical analysis methods, discretization
algorithms, association rule miner, as well as classification algorithms, which all are based on the use of multi-dimensional numbered information spaces.
The "class association rules" (CAR) algorithms have their important place in the family of classification algorithms. The advantages of associative classifiers can be highlighted in several very important directions, such as: very efficient training; possibility to deal with high dimensionality; no assumptions for the independence of attributes; very fast classification and the result are easily understandable by humans. The latter two advantages make CAR algorithms an irreplaceable assistant in the processes of disaster risk management, where fast reaction and reliability of the systems are crucial.
2.1 Associative classifiers PGN and MPGN
The new associative classifiers PGN and MPGN, implemented in PaGaNe [Mitov, 2011] showed very good behaviour in the field of recognizing non-uniform multi-class datasets.
PGN creates association rules, striving for maximal accuracy of produced rules. One of the main specifics of PGN is that it is a parameter free classifier. Let mention that in classical CAR algorithms users have to provide the support and confidence level. The association rule mining goes from longest rules (instances) to the shorter ones until no intersections between patterns in the classes are possible. In the pruning phase the contradictions and inconsistencies of more general rules are cleared, after that the pattern set is compacted throwing all more concrete rules within the classes.
MPGN employs multilayer structure and offers the possibility to escape combinatorial explosion using smart disposing of the information.
2.2 Experiments with Forestfires dataset
We have made the comparison between classification accuracy of MPGN and other classifiers, realized in WEKA [Witten and Frank, 2005] for Forestfires data set16.
For this comparison we have use best representatives from different groups of classifiers in WEKA (the classifiers that have showed best results within the group).
The chosen classifiers from groups, sorted in decreasing order of accuracy in the group, are as follows:
− Bayes – AODE (Aggregating One-Dependence Estimators), HNB (Hidden Naive Bayes), NaiveBayes;
16 http://archive.ics.uci.edu/ml/datasets/Forest+Fires
36
− Functions – SMO (Sequential Minimal Optimization), SimpleLogistic,
MultilayerPerceptron; − Lazy – IB1, IBk, KStar; − Meta – AdaBoostM1, LogitBoost, MultiScheme; − Rules – JRip, ConjunctiveRule, OneR; − Trees – ADTree, LADTree, J48. The total number of the instances in the examining set was 129 instances.
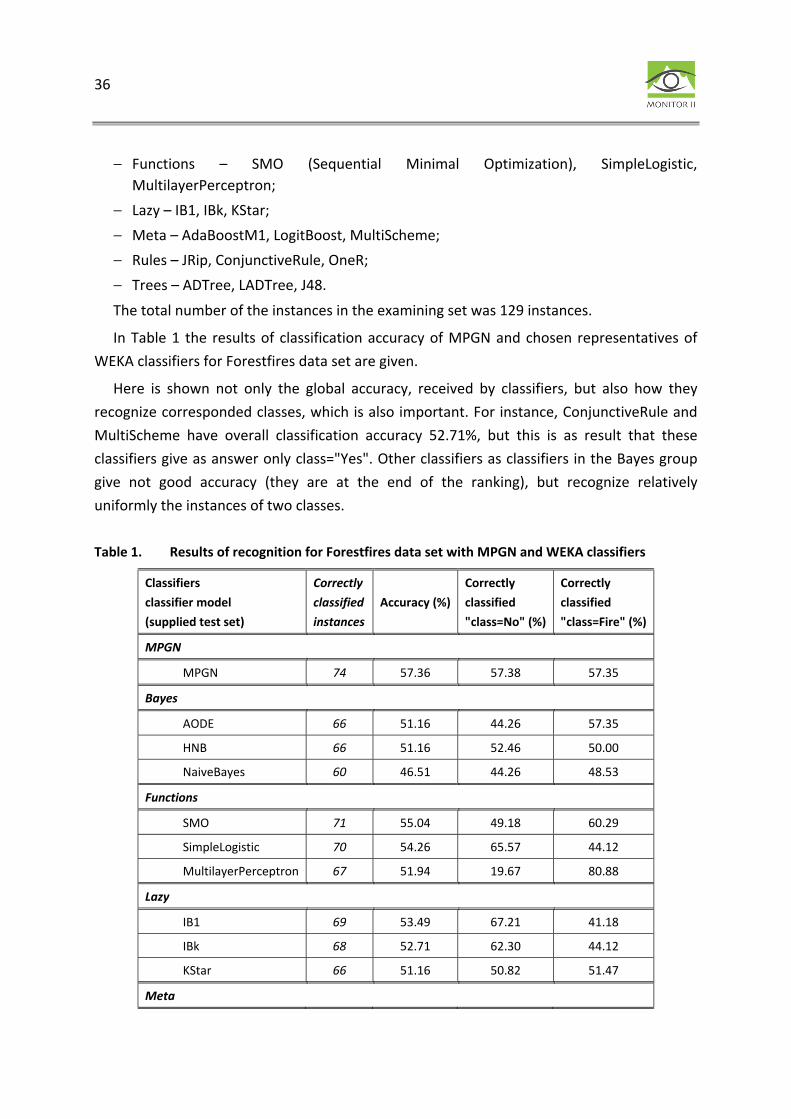
In Table 1 the results of classification accuracy of MPGN and chosen representatives of WEKA classifiers for Forestfires data set are given.
Here is shown not only the global accuracy, received by classifiers, but also how they recognize corresponded classes, which is also important. For instance, ConjunctiveRule and MultiScheme have overall classification accuracy 52.71%, but this is as result that these classifiers give as answer only class="Yes". Other classifiers as classifiers in the Bayes group give not good accuracy (they are at the end of the ranking), but recognize relatively uniformly the instances of two classes.
Table 1. Results of recognition for Forestfires data set with MPGN and WEKA classifiers
Classifiers classifier model (supplied test set)
Correctly classifiedinstances
Accuracy (%) Correctly classified "class=No" (%)
Correctly classified "class=Fire" (%)
MPGN
MPGN 74 57.36 57.38 57.35
Bayes
AODE 66 51.16 44.26 57.35
HNB 66 51.16 52.46 50.00
NaiveBayes 60 46.51 44.26 48.53
Functions
SMO 71 55.04 49.18 60.29
SimpleLogistic 70 54.26 65.57 44.12
MultilayerPerceptron 67 51.94 19.67 80.88
Lazy
IB1 69 53.49 67.21 41.18
IBk 68 52.71 62.30 44.12
KStar 66 51.16 50.82 51.47
Meta

37
AdaBoostM1 72 55.81 14.75 92.65
LogitBoost 70 54.26 65.57 44.12
MultiScheme 68 52.71 0.00 100.00
Rules
JRip 77 59.69 26.23 89.71
ConjunctiveRule 68 52.71 0.00 100.00
OneR 65 50.38 47.54 52.94
Trees
ADTree 83 64.34 36.07 89.71
LADTree 78 60.47 24.59 92.65
J48 67 51.94 19.67 80.88
Figure 8 shows overall classification accuracy of Forestfires data set for examined classifiers. Different colors of bars correspond to the groups, in which classifiers belongs. As we can see best results are given from ADTree and LADTree. In contrary, classifiers from Bayes group have not so good overall accuracy. MPGN showed relatively good results and is on the fourth position.
Figure 8. Classification accuracy of Forestfires data set
As we can see on Figure 9 it is not enough one classifier to have good overall accuracy. Keeping awareness commands in permanent readiness is also not so good situation. From

38
first five classifiers only MPGN gives relatively good ratio on recognition two classes. In the other four classifiers prevailing answers are class="Fire".
Figure 9. The ratio between recognized instances from class "No" versus class "Fire" on the example of
Forestfires dataset for different classifiers
So, we think that the classification algorithms implemented in PaGaNe can be implemented as parts of one integrated CSA-system in the phase of recognition the disaster appearance.

39
Chapter 4: Decision Support Tools
Nina Dobrinkova, Peter Boyvalenkov
Multi-Criteria Decision Analysis (MCDA) has undergone an impressive development during the last 30 years, in part because it is amenable to handling today's complex problems, in which the level of conflict between multiple evaluation axes is such that intuitive solutions are not satisfactory. MCDA is not a tool providing the "right" solution in a decision problem, since no such solution exists.
1 Multi-Criteria Decision Analysis (MCDA)
MCDA is at the same time an approach and methodology (techniques), the main goal of which is ranking of the alternatives to be achieved – from the most preferred to less preferred. These alternatives could differ in the degree in which they achieved several criteria (goals) and none of these alternatives is obviously the best one in achieving all goals simultaneously. In other words, these alternatives are equally good to be the most preferred, the best, one. In addition, some conflict or trade-off is usually evident amongst the objectives; options that are more beneficial are also usually more costly, for example. Costs and benefits typically conflict, but so can short-term benefits compared to long-term ones, and risks may be greater for the otherwise more beneficial options.
The main role in the solving process of problems for multicriteria analysis is played by the so-called Decision Maker (DM). His/her global and local preferences determine the final (the most preferred) solution of the MCDA problem being solved.
Depending on the way of presenting, receiving and using of the information about the preferences of the DM and on the fact if there exists restriction in the abilities of the DM for comparing alternatives, the MCDA problems could be deviled into three classes [Vincke, 1992]:
− approaches of multiattribute utility theory: methods, in which the global preferences of the DM are aggregated as a result of the synthesis of one generalized (global) criterion [Dyer, 2004];

40
− outranking approaches: methods, in which the global preferences of the DM are
aggregated as a result of the synthesis of one or several generalized relations of preferences among the alternatives;
− interactive approaches: methods, in which the global preferences of the DM are aggregated iteratively using direct or indirect comparing between two or more alternatives.
Methods of the Multiattribute Utility Theory
Here are such methods as: methods of the value trade-offs [Keeney and Raiffa, 1993], weighted methods AHP [Saaty, 1994], UTA method [Beuthe and Scannella, 2001], MACBETH method [Bana and Chagas, 2004]. In this class of methods two sub-classes could be grouped, which differ in the way of aggregation of the global preferences of the DM. In the first sub-class a generalized (global) functional criterion is formed, while in the second class (weighted methods) such a criterion (in an additive form) is formed indirectly. Despite of the differences among the ways of receiving the preference information by the DM, in the both sub-classes use the statement that there does not exist a restriction in the abilities of the DM for comparing among the alternatives. For expressing the preferences of the DM in comparing two alternatives two binary relations are used – the binary relation of strong preference P (which is non-reflexive, asymmetric and transitive) and the binary relation of non-difference I (which is reflexive, symmetric and transitive).
Outranking Methods
These are methods such as PROMETHEE method [Brans and Mareschal, 1994] and ELECTRE method [Roy, 1996], which are based on the belief that there really exists a restriction in the abilities of the DM for comparing among the alternatives. In these methods first one or several so-called outranking relations are building in accordance to the preferences of the DM. After that this outranking relations is used for supporting the DM in solving the MCDA problem. In the outranking methods when two alternatives are compared four different binary relations are used: non-difference relation I (reflective and symmetric), low preference relation Q (non-reflective and asymmetric), high preferences relations P (non-reflexive, asymmetric and transitive) and non-comparing relation R (non-reflective and asymmetric). The outranking relation "covers" these four relations. In the most of the outranking methods it is considered that the DM does not want or are not able to make this clear division into four relations and that is why the DM prefer to set more global preference information such as inter-criteria (weights and veto levels) and intra-criteria information (levels of preference and non-difference).

41
The outranking methods and the methods, based on the multiattribute utility theory, are
traditional methods for solving of wide range of MCDA problems. When solving problems with large number of criteria and comparatively big number of alternatives, the outranking methods are the best ones to be used.
Interactive Methods
Problems with large numbers of alternatives and comparatively small quantitative criteria, in which the DM are not able to evaluate all the alternatives simultaneously, are very closed by nature to the decision making problems of multicriteria optimization. For solving of these types of problems interactive methods are developed [Vassileva et al, 2001]. MCDA approach proceeds with active involvement of the DMs as it is shown on the Figure 10.
Figure 10. The steps in the MCDA procedure
The steps necessary before arriving to a final decision include: problem identification, problem structuring, preference modelling, aggregation and analysis of the results and finally negotiations to achieve consensus. These steps can be interconnected in backtracking and loops, before final decision become common for all DMs involved into the process. The strength of the MCDA methodology lies in the dynamic connection between all steps above.
42
2 MKA-2 Software System
The MCDA problems for choosing of the most appropriate strategy when dangerous flooding events happen usually have not very big number of alternatives and criteria for their evaluation. In the decision making process the DMs (the responsible people rescue actives from civil protection units) can be supported by the methods, realized in the decision support system for multicriteria analysis MKA-2.
MKA-2 software system [Vassilev et al, 2005] is designed to support the solution of problems for multicriteria choice and for multicriteria ranking. The system includes four types of methods: weighting method – AHP [Saaty, 1994], outranking method – PROMETHEE II and ELECTRE III [Brans and Mareschal, 1994], [Roy, 1996] and interactive method CBIM [Vassileva et al, 2001]. The setting of the preference information by the DM for each of them is made in different manner – comparing by couples, weights of the criteria, preferences levels, levels of non-difference, veto level, etc.
3 Implementation of MKA-2 in Risk Monitoring
One example of implementation of MCDA-approach for choosing the most appropriated strategy for reaction when dangerous flooding events happen was shown in [Dobrinkova et al, 2010], made in the frame of Evros2010 project (approved by the EC, DG Environment Civil Protection Unit; 2009-2010)
The main focus of the project field test simulations is on seven different scenarios, one of which was under the scope of this research. The scenarios are:
− Scenario 1: Search and Rescue of missing hunters and illegal immigrants in delta of Evros River, where hunters and illegal immigrants are in danger from a fast coming waters in the delta of river.
− Scenario 2: Rescue of agricultural vehicle's passengers in Ardas River on the county road Kastanies – Marasia. Here a driver has taken a risk to cross a bridge, when Ardas river level is getting fast very high.
− Scenario 3: Traffic accident of road tanker trailer carrying a hazardous chemical cargo. The risk in this scenario is very high for the factory workers near by.
− Scenario 4: Evacuation of the population of Praggi village, Municipality of Didymoteicho. This scenario is under the scope of our research, because of the potential losses for the population of the village and the high percentage of mortality possibilities.

43
− Scenario 5: Clearing of Hellenic Railway Organization's (OSE) tank wagons that contain
hazardous cargo (chemicals) at the Railway Station of Praggi, Municipality of Didymoteicho. Here the continuous rainfall is flooding the wagons railway.
− Scenario 6: Search and Rescue of people in the lake of Tycheron, where bad weather conditions are causing difficulties to the rescue teams.
− Scenario 7: Search and Rescue of visitors – excursionists at the place of "Fossil forest of Lefkimi", in this scenario a storm is coming and the people are lost in the mountain.
The main objective of the investigation was to analyze different approach for the decision makers in the civil protection units concerning the flood rescue actions of Evros River. This methodology was implemented to the village of Pragi that is located in the Municipality of Didymoteicho (Greece). The village has suffered from many devastating floods due to its geographical location with severe social and economic impacts. The chosen scenario problem was with main focus on selecting of the most suitable strategy for reaction of the Civil Protection units from the international teams.
Each of the strategies was evaluated with different (contradictory) criteria:
− Criteria 1: Minimizing of the financial expenditures for organizing the rescue actions. − Criteria 2: Minimizing the agricultural losses. − Criteria 3: Minimizing of the danger of mortality through the inhabitants. The evaluation of the strategies for actions according to each of these criteria was
presented in the Decision Evaluation Table in the following way:
Criteria 1 Criteria 2 Criteria 3
Strategy 1: No evacuation A11 A12 A13
Strategy 2: Partially done evacuation A21 A22 A23
Strategy 3: Full evacuation A31 A32 A33
A financial evaluation was formed for each of the strategies according to the Criteria 1 and Criteria 2 (quantitative criteria). The Criteria 3 was evaluated with the help of a qualitative scale /1- low, .., 9 - high level of danger/.
It is obvious that each one of these strategies has its advantages and disadvantages. Each one of them is the best one according to one particular criterion. In the terms of MCDA these strategies /alternatives/ are non-dominated, which means that they are equally good to be chosen for the most preferred or final solution of the problem. In order one of them to be selected for the most preferred one; a compromise has to be made in relation with two of the criteria. For example: If we choose Strategy 1, which has the best value (A13) from the

44
point of view of Criteria 3 - no mortality of the population of Praggi village, but it will be with very bad values (A12) for the Criteria 3, because the agricultural losses will be huge. The task for choosing the best one will become harder if the number of the possible strategies for reaction and organizing rescue activities is bigger. To the teams from the Civil protection units from the different countries, which participated in the Field Test Exercise, was recommended to use some of the methods for solving MCDA problems, implemented in the decision support system for multicriteria analysis МКА-2. In this way they set their preferences in the easiest for them formulation and made ranking of the strategies with the help of the software system MKA-2.

45
Appendix 1: Some Systems that Support the Global Risk Management Process
Radoslav Pavlov
There are several systems aimed to support risk management and different stages of the whole process of gathering information, analysis of risk, decision support of planning actions, visualization and making output reports, etc. In this process the interoperability questions stands on the first positions.
4 EmerGeo
The mission of EmerGeo Solutions Inc.17 is to produce outstanding financial returns for their shareholders by providing reliable, world-class, open standards based technology solutions and services that will prove effective in helping government and industry to mitigate against, prepare for, respond to and recover from potential or actual incidents, natural disasters, acts of terrorism, and other risks.
EmerGeo18 provides emergency and crisis management software and services to clients worldwide. In response to growing demands for multi-agency interoperability and real-time situational awareness, EmerGeo has developed two integrated products: Fusionpoint and EmerGeo Mapping.
Fusionpoint
EmerGeo Fusionpoint delivers a single unified view of critical data to those who need it – regardless of what information systems they have invested in. The specifics of EmerGeo Fusionpoint can be outlined in the following points19:
17 http://www.emergeo.com/investors 18 http://www.emergeo.com/ 19 http://www.emergeo.com/wp-content/uploads/2011/07/Fusionpoint-Brochure-Summary.pdf

46
− The flexible and intuitive web dashboard style interface brings together information
from many sources in both map and tabular formats – creates a Common Operating Picture. Customers can also run their existing web applications inside the dashboard.
− Comes bundled with essential tools for crisis management used in Emergency Operation Centres, such as event logging, alerting, mapping and resource management.
− The Fusion engine and Enterprise Service Bus (ESB) enable two-way, real-time connections to multiple data sources, including third-party crisis management software, GIS-based map viewers such as ESRI Flex, IP cameras and hazard models and alert notification systems. Implements an evolutionary way of capturing, managing and communicating unstructured information across multiple systems both securely and in real-time.
− A Geospatial Decision Support (rules) and Alerting Engine that can be configured by users to automate workflow processes and trigger alerts. Hazard models and advanced analytical tools support critical decisions.
EmerGeo Fusionpoint interfaces to: Crisis Management Software; Mapping (ESRI ArcGIS, Google Maps, etc.); Vehicle & People Tracking Systems; Notification Systems; IP Cameras/Video Surveillance Interfaces, etc.
EmerGeo Mapping
EmerGeo Mapping20 is an open emergency mapping tool that integrates with existing GIS systems, EmerGeo Fusionpoint and Google Earth. It provides integrated situational awareness technology and services to help manage risk in emergency management for enterprises and all levels of government.
EmerGeo Mapping includes: EmerGeo Navigator (a simple, browser-based common operating picture and situational awareness client that provides a complete view of an emergency situation, or major event, such as a hurricane, flood, or international sporting event) and EmerGeo Smart Client (a desktop application to manage, author and publish information to other Smart Client users or EmerGeo Navigator).
With EmerGeo's Mapping and situational awareness tools you can:
− Provide an authoritative picture of events as they unfold. − Enable information to flow effectively between emergency first responders, command
posts, staging areas and Emergency Operation Centers (EOC).
20 http://www.emergeo.com/solutions/mapping

47
− Provide a managed Common Operating Picture (mCOP) to enable collaboration and
communication across multiple organizations, local, state and federal agencies and systems.
− Fuse complex, disparate datasets and operational data with geospatial layers to provide decision makers, analysts, and operators with a uniform operating environment.
− Publish map documents, cartographic products, models, geoprocesses, analyses, and Web services.
− Ensure reliable and robust interoperability with geospatial applications, network architectures, and enterprise services that follow OGC and ISO standards.
− Customize viewers and visualization tools to fit your specific needs and requirements. − Utilize commercial or publicly available datasets. − Integrate your data models, analyses, and geoprocesses to accommodate your
processes and workflows. − Interface with leading crisis management information systems like WebEOC® and
ETeam™. − Interface with simulation technologies. − Have instant built-in access to hazard modeling tools like the Aloha® plume model to
expedite response and recovery. − Operate a simple web-based situation map inside a web dashboard (using EmerGeo
Fusionpoint). EmerGeo Mapping also helps organizations achieve interoperability by:
− Promoting standardization and streamlined communications by organizing, displaying and sharing data in standardized ways (e.g. data categorization and symbolization based on Homeland Security standards; publishing to third-party applications using GeoRSS, WMS and KML).
− Guiding users through standard planning and response processes using "wizards". − Communicating information among emergency roles and agencies through a role-
based publishing function. − Providing a common operating picture or situational awareness view that brings
together data from multiple emergency management software applications and technologies.
− Presenting the right level of detail and functionality (tools) to the right role in each emergency organization.

48
EmerGeo works in a close collaboration with GDACS (Global Disaster Alert and
Coordination System)21 (cooperation framework under the United Nations umbrella), which provides near real-time alerts about natural disasters around the world and tools to facilitate response coordination, including media monitoring, map catalogues and Virtual On-Site Operations Coordination Centre.
5 ESRI Public Safety Tools
There are set of on-line public safety tools, supported by ESRI Society22.
CATS
Consequences Assessment Toolset (CATS)23 is a PC-based system that works with ArcView for powerful cost-effective for disaster analysis. It is developed by the Defense Threat Reduction Agency (DTRA)24, and is available free of charge to U.S. federal, state, and local government emergency response organizations. CATS provides a comprehensive package of hazard prediction models, casualty and damage assessment tools, and population and infrastructure data. CATS tools focus on chemical, biological, radiological, nuclear disaster analysis and supports a wide range of response applications and access to remote databases for custom analysis.
CATS works before, during, and after a disaster to perform disaster modeling and analysis. Before disaster strikes CATS creates realistic scenarios for training and planning and supports creating contingency plans. In the phase of disaster strikes CATS assess the affected population quickly and accurately. Also it track and assess damage from explosives, industrial agent release, or weapons of mass destruction. It helps to reduce response timelines and determine roadblock locations and exclusion zones for safe routing of responders and victims. After disaster strikes CATS allows to assess needs and locate resources for a sustained response as well as to obtain information for reporting, damage assessment, and lessons learned.
21 http://www.gdacs.org/ 22 http://www.esri.com/industries/public-safety/tools.html 23 http://www.esri.com/industries/public-safety/tools/cats.html 24 http://www.dtra.mil/Home.aspx

49
FEMA's HAZUS-MH
FEMA's HAZUS-MH25 gives you a GIS methodology and software that contains models for estimating potential losses from natural disasters.
Developed by the Federal Emergency Management Agency (FEMA)26, Hazards U.S. Multi-Hazard (HAZUS-MH) is a nationally standardized methodology and software program that contains models for estimating potential losses from natural disasters. HAZUS-MH works with Esri ArcGIS software to map and display hazard data. It allows users to estimate the impacts of hurricane winds, floods, and earthquakes. U.S. government agencies and private sector organizations can order HAZUS-MH from FEMA free of charge.
Data Appliance
Data Appliance for ArcGIS27 is a turnkey solution that provides terabytes of worldwide base-maps and reference layers, along with geo-coding and routing, preloaded onto a network-attached storage device that plugs right into your organization's internal network. These capabilities are available as web services through ArcGIS Online.
Data Appliance for ArcGIS can be used for: sharing mapping applications; highlighting the existing operational data by combining it with rich reference maps; finding locations by address or place name, calculating routes, and creating driving directions; building services to perform specialized visualization and analysis.
6 Sahana Software
The Sahana Software Foundation28 is dedicated to the mission of saving lives by providing information management solutions that enable organizations and communities to better prepare for and respond to disasters. Sahana software was originally developed by members of the Sri Lankan IT community who wanted to find a way to apply their talents towards helping their country recover in the immediate aftermath of the 2004 Indian Ocean earthquake and tsunami. The word "Sahana" means "relief" in Sinhalese, one of the national languages of Sri Lanka.
25 http://www.esri.com/industries/public-safety/tools/hazus.html 26 http://www.fema.gov/ 27 http://www.esri.com/software/arcgis/data-appliance/index.html 28 http://sahanafoundation.org/

50
Sahana is a Free and Open Source Software (FOSS) application which can provide a
comprehensive solution for disaster information management, relief and recovery operations [Ariyabandu, 2009].
Eden
Eden (Emergency Development ENvironment)29 for Rapid Deployment Humanitarian Response Management is a flexible humanitarian platform with a rich feature set which can be rapidly customized to adapt to existing processes and integrate with existing systems to provide effective solutions for critical humanitarian needs management either prior to or during a crisis.
Eden is designed for most organizations and agencies engaged in humanitarian activities, including UN agencies, NGOs and government agencies, and provides solutions to challenges involved in resource management, information management, coordination, decision support and stakeholder communications.
Its main capabilities are:
− Logistics Management – Manage Requests, Donations and Warehouses. − Staff Management – Manage staff & volunteers by capturing their skills, availability
and allocation. − Organization Registry – Creates database of organizations to help facilitate
coordination. − Assessments – Supports needs assessments. − Project Tracking – Provides status and visibility on projects and organizations needs − Hospital Management System – Hospitals can share information on resources & needs. − Shelter Registry – Tracks the location, distribution, capacity of Shelters and provides a
breakdown of the People inside them. − Person Finder – Report and search for Missing Persons − Disaster Victim Identification – Supports management of the recovery of dead bodies
and the identification of the deceased. − Mapping – Provides mapping solution to support situational awareness and geospatial
analysis. − Messaging – Sends and receives Alerts and other messages via Email & SMS. − Document Library – Enables a library of digital resources, such as Photos & Documents. Eden software was first deployed for disaster responses purposes following the 2010 Haiti
earthquake for public use and also to support a the food distribution programs of the UN
29 http://sahanafoundation.org/products/eden/
51
World Food Programme. Since the Haiti earthquake, Eden has been used for the following disasters by individuals, organizations and governments: Earthquake and Tsunami in Japan – 2011; Flooding in Colombia – 2011; Flooding in Venezuela – 2010; Flooding in Pakistan – 2010; Hurricane in Veracruz, Mexico – 2010.
Eden has also been adopted by such organizations as the Asian Disaster Preparedness Center (ADPC) for its Disaster Risk Reduction Projects Portal30 and the IFRC Asia Pacific Disaster Management Unit.
Vesuvius
Vesuvius (Hospital Triage and Lost Person Finder Capabilities)31 is focused on the disaster preparedness and response needs of the medical community, contributing to family reunification and assisting with hospital triage. Vesuvius's development is led by the US National Library of Medicine as part of the Bethesda Hospitals Emergency Preparedness Partnership to serve area hospitals, medical facilities and jurisdictions with a need to tie victim intake records with missing/found persons reports submitted by the public.
Optimized for family reunification and assisting with hospital triage, Vesuvius focuses on:
− Missing Persons Reporting: Contributes to family reunification through multiple means of accepting reports and providing advanced search and filtering capabilities
− Hospital Triage Management: Provides tools to assist in local and remote hospital triage management, including photo capture and electronic notifications of patient intake records to hospitals and the person locator registry.
Since 2009, the US National Library of Medicine (NLM) is using Vesuvius to support disaster preparedness and response in family reunification and hospital triage, enabling capture of photos, exchange of data across facilities for use in US-hospital-focused catastrophic situations. While their primary mission has been to support the Bethesda Hospitals Emergency Preparedness Partnership (BHEPP), NLM has also supported the public use of the Vesuvius People Locator System32 for the Haiti earthquake (2010), Christchurch Earthquake (2011), and Japan Earthquake and Tsunami (2011).
Mayon
Mayon (Emergency Resource Management Capabilities for Municipalities)33 provides an emergency personnel and resource management solution that is highly scalable to manage
30 http://www.google.com/url?q=http%3A%2F%2Fdrrprojects.net%2F&sa=D&sntz=1&usg=AFQjCNE0xVUrxY-R_HC0qhn5Eh7QU1K74Q 31 http://sahanafoundation.org/products/vesuvius/ 32 https://pl.nlm.nih.gov/ 33 http://sahanafoundation.org/products/mayon/

52
large numbers of events, persons and resources. Its intended to serve professional emergency management organizations in large municipalities and jurisdictions charged with preparedness, response, recovery and mitigation responsibilities.
Mayon Features are:
− Emergency/Disaster Scenario Management – Allows users to set up several scenarios with different resource pools, staffing requirements, shift patterns, and deployment strategies and seamlessly implement these plans during an emergency.
− Facility Management – Manages facilities such as shelters and attached resources that used in emergency and disaster response.
− Staff Management – Manages automatic shift generation and deployment with distance-based staff assignment, scaled to handle up to 160,000 staff and 400,000 shifts generated per month per event with no event limit.
Mayon is being deployed by the City of New York's Office of Emergency Management in support of its all-hazards shelter management plan.
7 Gaea+
Gaea+ as a Continuous Situation Awareness system used by Administration of the Republic of Slovenia for Civil Protection and Disaster Relief34 in its RS national-security system that also encompasses protection, rescue and relief activities. The aim of the system is to reduce the number of disasters and to forestall or reduce the number of casualties and other consequences of such disasters. Gaea+ is 3D visual tool based on NASA World Wind. Gaea+ is a product of XLAB Research, which focus is put on distributed systems (peer-to-peer, fault-tolerance, resource discovery and management, network protocols, visualisation, semantic computing, information retrieval, etc.). GAEA+ is proposed by Slovenia Project Partner of Monitor II to be used as a base for build CSA system for Slovenia.
34 http://research.xlab.si/index.php?option=com_content&task=view&id=251&Itemid=130

53
Appendix 2: List of Vectorizing Tools
Emil Kelevedzhiev
There are several programs that can be used for creating vector layer of DEM, using existing cartographic materials. Below we give the information for some of them as they present themself (sorted in alphabetical order):
− 3DEM http://www.visualizationsoftware.com/3dem It has the capacity to produce 3D terrain images and flyby animations by leveraging data sources readily available including but not limited to: LIDAR Point Cloud (LAS) files; USGS Digital Elevation Model (ASCII DEM) files; USGS Spatial Data Transfer Standard (SDTS DEM) files; NOAA Global Land One-km Base Elevation (GLOBE DEM) files; NASA Mars Orbiter Laser Altimeter (MOLA) files; NASA Shuttle Radar Topography Mission (SRTM) files; Any topographic data file that contains rows and columns of elevation data. The terrain visualization software offers the ability to merge multiple DEMs to provide high-resolution overhead maps and 3D projections of large areas. Latitude and longitude coordinates are shown on all overhead map displays. Both Lat/Lon and UTM coordinates are supported, allowing display and measurement of position to high accuracy. GPS receiver waypoints, routes, and tracks can be read via serial interface and displayed on 3D images and flybys of the terrain, allowing visualization of the path of a trek through the wilderness.
− AutoCAD Family http://usa.autodesk.com/adsk/servlet/pc/index?id=2600114&siteID=123112 AutoCAD Raster Design makes the most of rasterized scanned drawings, maps, aerial photos, satellite imagery, and digital elevation models. With powerful raster editing and raster-to-vector conversion tools, AutoCAD Raster Design software helps you to easily clean up, edit, enhance, and maintain scanned drawings and plans in a familiar AutoCAD environment for use in AutoCAD, AutoCAD Architecture, AutoCAD Civil 3D, AutoCAD Electrical, AutoCAD Map 3D, AutoCAD Mechanical, AutoCAD MEP, AutoCAD P&ID, and Autodesk Topobase software.
− EasyTrace http://www.easytrace.com/ Specialized on developing and applying cartographic materials digitizing tools. During

54
17 years existing they met all kinds of material - cities, factories, pipelines, topological foundations of large areas. Maps of Russia, Kazakhstan, Bosnia, Japan, Thailand, etc.
− ENVI http://www.exelisvis.com/language/en-us/productsservices/envi.aspx The ENVI product family provides a variety of software solutions for processing and analyzing geospatial imagery used by scientists, researchers, image analysts, and GIS professionals around the world. ENVI solutions combine the latest spectral image processing and image analysis technology with an intuitive, user-friendly interface to help you get meaningful information from imagery.
− Erdas Imagine http://www.erdas.com/products/ERDASIMAGINE/ERDASIMAGINE/Details.aspx It performs advanced remote sensing analysis and spatial modeling to create new information. In addition, with ERDAS IMAGINE, you can visualize your results in 2D, 3D, movies, and on cartographic quality map compositions.
− Global Mapper http://www.globalmapper.com/ Global Mapper is more than just a utility; it has built in functionality for distance and area calculations, raster blending, feathering, spectral analysis and contrast adjustment, elevation querying, line of sight calculations, cut-and-fill volume calculations, as well as advanced capabilities like image rectification, contour generation from surface data, view shed analysis (including Fresnel) from surface data, watershed delineation, terrain layer comparison (including differencing), and triangulation and gridding of 3D point data. Repetitive tasks can be accomplished using the built in scripting language or comprehensive batch conversion functionality.
− Golden Surfer http://www.goldensoftware.com/products/surfer/surfer.shtml Surfer is a full-function 3D visualization, contouring and surface modeling package that runs under Microsoft Windows. Surfer is used extensively for terrain modeling, bathymetric modeling, landscape visualization, surface analysis, contour mapping, 3D surface mapping, gridding, volumetrics, and much more
− MapInfo Professional http://www.pbinsight.com/products/location-intelligence/applications/mapping-analytical/mapinfo-professional/ MapInfo Professional is a powerful Microsoft Windows-based mapping and geographic analysis application from the experts in location intelligence. Designed to easily visualize the relationships between data and geography, MapInfo Professional helps business analysts, planners, GIS professionals – even non-GIS users – gain new insights into their markets, share information-rich maps and graphs and improve strategic decision-making

55
− MatLab Mapping Toolbox
http://www.mathworks.com/products/mapping/index.html Mapping Toolbox provides tools and utilities for analyzing geographic data and creating map displays. You can import vector and raster data from shapefile, GeoTIFF, SDTS DEM, or other file formats, as well as Web-based data from Web Map Service (WMS) servers. The toolbox lets you customize the imported data by subsetting, trimming, intersecting, adjusting spatial resolution, and applying other methods. Geographic data can be combined with base map layers from multiple sources in a single map display. With function-level access to all key features, you can automate frequent tasks in your geospatial workflow.
− R2V http://www.ablesw.com/r2v/ is an advanced raster to vector conversion software for automated map digitizing, GIS data capture and CAD conversion applications. R2V is currently being used in more than 60 countries by thousands of users for mapping and GIS data conversion applications.
− Raster2Vector http://www.cnccontrols.com/raster2vector.asp Raster2Vector converts Bitmaps, Jpeg, TIF and PCX graphic files to DXF files or vector files consisting of lines, arcs and circles. Now files produced by your scanner software or raster image editing programs can be converted to vector files DXF or TXT. Advanced settings let you control the way the images will be converted. Once created, the DXF file can be used in any of a number of various programs that read standard AutoCAD DXF files including Advanced System 3000.
− TransDEM http://www.rolandziegler.de/StreckeUndLandschaft/startseiteTransDEMEngl.htm TransDEM is a central pre-processing tool for route building based on geo data. It handles digital elevation models, raster maps, plans and orthophotos and provides vector data conversion and basis editing features.
Most of them are not freeware, some of them give older versions free (for instance EasyTrace 7.99).

56

57
References
[Achtert et al, 2010] Achtert, E., Kriegel, H.-P., Reichert, L., Schubert, E., Wojdanowski, R., Zimek, A.: Visual еvaluation of outlier detection models. In 15th Int. Conf. on Database Systems for Advanced Applications (DASFAA 2010), Tsukuba, Japan, 2010, LNCS, Vol. 5982, 2010, pp.396-399.
[Aha and Kibler, 1991] Aha, D., Kibler, D.: Instance-based learning algorithms. Machine Learning. No.6, 1991, pp.37-66.
[Alpaydin, 2010] Alpaydin, E.: Introduction to Machine Learning. The MIT Press, Second Ed., 2010.
[Ariyabandu, 2009] Ariyabandu, R.: Free and Open Source Software for Disaster Management: A Case Study of Sahana Disaster Management System of Sri Lanka. ESCAP Technical Paper. 2009.
[Bana and Chagas, 2004] Bana e Costa, C., Chagas, M.: A career choice problem: an example of how to use Macbeth to build a quantitative value model based on qualitative value judgments. European Journal of Operational Research, 153(2), 2004, pp.323-331.
[Basher, 2006] Basher, R.: Global early warning systems for natural hazards: systematic and people-centred. Phil. Trans. R. Soc. A 364, 2006, pp.2167-2182, doi:10.1098/rsta.2006.1819
[Bayes, 1763] Bayes, T.: Essay Towards Solving a Problem in the Doctrine of Chances. Encyclopædia Britannica Online. <http://www.britannica.com/EBchecked/topic/678260/Essay-Towards-Solving-a-Problem-in-the-Doctrine-of-Chances>, accessed at 01.03.2011.
[Berry et al, 2004] Berry, P., Harrison, I., Lowrance, J., Rodriguez, A., Ruspini, E., Thomere, J., Wolverton, M.: Link Analysis Workbench. Technical Report, SRI Int., 2004.
[Bertalanffy, 1968] Bertalanffy, L.: General System Theory: Foundation, Development, Applications. New York, 1968.
[Beuthe and Scannella, 2001] Beuthe, M., Scannella, G.: Comparative analysis of UTA multicriteria methods. European Journal of Operational Research, 130(2), 2001, pp.246-262.
[Boser et al, 1992] Boser, B., Guyon, I., Vapnik, V.: A training algorithm for optimal margin classifiers. In Proc. of the Annual Conference on Computational Learning Theory, Pittsburgh, 1992, pp.144-152.
[Brans and Mareschal, 1994] Brans, J. P., Mareschal, B.: The PROMCALC & GAIA decision support system for multicriteria decision aid. Decision Support System, 12, 1994, pp.297-310.
[Breiman, 1996] Breiman, L. Bagging predictors. Machine Learning 24/2, 1996, pp.123-140.
[Chen, 1976] Chen, P.: The Entity-Relationship Model-Toward a Unified View of Data. ACM Transactions on Database Systems, 1(1), 1976, pp.9-36.
[Cleary and Trigg, 1995] Cleary, J., Trigg, L.: K*: An instance-based learner using an entropic distance measure. In: 12th Int. Conf. on Machine Learning, 1995, pp.108 114.
[Cohen, 1995] Cohen, W.: Fast effective rule induction. In Proc. of the 12th Int. Conf. on Machine Learning, Lake Taho, California, Morgan Kauffman, 1995.
[Dobrinkova et al, 2010] Dobrinkova, N., Genova, K., Vassileva, M.: Multicriteria Analysis Applied to a Flood Event on River Maritza/Evros. Int. Multidisciplinary Scientific GeoConference SGEM 2010, pp.X-X

58
[Dyer, 2004] Dyer, J. MAUT: Multiattribute utility theory. In: Multiple Criteria Decision Analysis: State of the Art
Surveys (J. Figueira, S. Greco and M. Ehrgott, Eds). Springer-Verlag, London, 2004, pp.265-285.
[Endsley, 1995] Endsley, M.: Toward a theory of situation awareness in dynamic systems. Human Factors 37(1), 1995, pp.32–64.
[Europe 2020] Europe 2020: The European Strategy for Sustainable Growth, http://ec.europa.eu/europe2020/
[Fayyad et al, 1996] Fayyad, U., Piatetsky-Shapiro, G., Smyth, P.: From data mining to knowledge discovery: an overview. In Advances in Knowledge Discovery and Data Mining. American Association for AI, Menlo Park, CA, USA, 1996, pp.1-34.
[Friedman, 1997] Friedman, J.: Data mining and statistics: what is the connection? Keynote Address, 29th Symposium on the Interface: Computing Science and Statistics, 1997.
[Han and Kamber, 2006] Han, J., Kamber, M.: Data Mining: Concepts and Techniques. Morgan Kaufman Publ., Elsevier, 2006.
[Holte, 1993] Holte, R.: Very simple classification rules perform well on most commonly used datasets. Machine Learning, Vol. 11, 1993, pp.63-91.
[Katok and Hasselblatt, 1999] Katok, A., Hasselblatt, B.: Introduction to the Modern Theory of Dynamical Systems. Cambridge University Press, 1999.
[Keeney and Raiffa, 1993] Keeney, R., Raiffa, H.: Decisions with Multiple Objectives, Preferences and Value Trade Offs. Cambridge University Press, Cambridge, UK, 1993.
[Klosgen and Zytkow, 1996] Klosgen, W, Zytkow, J.: Knowledge discovery in databases terminology. In Advances in Knowledge Discovery and Data Mining. AAAI Press, 1996, pp.573-592.
[Kouamou, 2011] Kouamou, G.: A software architecture for data mining environment. Ch.13 in New Fundamental Technologies in Data Mining, InTech Publ., 2011, pp.241-258.
[Maimon and Rokach, 2005] Maimon, O., Rokach, L.: Decomposition Methodology for Knowledge Discovery and Data Mining. Vol. 61 of Series in Machine Perception and Artificial Intelligence. World Scientific Press, 2005.
[Markopoulos and Mackay, 2009] Markopoulos, P.; Mackay, W. (Eds.).: Awareness Systems: Advances in Theory, Methodology and Design., 1st Edition., Springer, HCI-Series, XVI, 2009, 470 p.
[Minchev and Petkova, 2010] Minchev, Z., Petkova, M.: Information Processes and Threats in Social Networks. A Case Study. In Proc. of the Conjoint Scientific Seminar "Modelling and Control of Information Processes", Sofia, Bulgaria, 2010, pp.85-93.
[Minchev and Shalamanov, 2010] Minchev, Z., Shalamanov, V.: Scenario Generation and Assessment Framework Solution in Support of the Comprehensive Approach. In Proc. of SAS-081 Symposium on "Analytical Support to Defence Transformation", RTO-MP-SAS-081, Sofia, 2010, pp.22-1 – 22-16.
[Minchev, 2007] Minchev, Z.: Intelligent Scenario Development for CAX. In Proceedings of NATO ARW: "Scientific Support for the Decision Making in the Security Sector", Velingrad, Bulgaria, IOS Press Amsterdam - NATO Science for Peace Security Series, Section D: Information and Communication Security, vol.12, 2007, pp.16-24.
[Minchev, 2012] Minchev, Z.: Evolving Academic Contribution to the Development of Bulgaria's Emergency Management Capabilities. In Proc. of "Early Recovery and Consequence Management in the Aftermath of Natuaral and Man-made Disasters in the Greater Black Sea Area", Bucharest, January 28-29, 2012.
[Mitchell, 1997] Mitchell, T.: Machine Learning, McGraw-Hill, 1997.

59
[Mitov et al, 2009] Mitov, I., Ivanova, K., Markov, K., Velychko, V., Vanhoof. K., Stanchev, P.: "PaGaNe" – A
classification machine learning system based on the multidimensional numbered information spaces. In World Scientific Proc. Series on Computer Engineering and Information Science, No.2, pp.279-286.
[Mitov, 2011] Mitov, I.: Class Association Rule Mining Using Multi-Dimensional Numbered Information Spaces. PhD Thesis, Hasselt University, Belgium, 2011.
[NATO, 2010] NATO New Strategic Concept, http://www.nato.int/strategic-concept/
[Quinlan, 1986] Quinlan, R.: Induction of decision trees. Machine Learning 1/1, 1986, pp.81-106.
[Quinlan, 1993] Quinlan, R.: C4.5: Programs for Machine Learning. Morgan Kaufmann Publishers, 1993.
[Rakotomalala, 2005] Rakotomalala, R.: TANAGRA: a free software for research and academic purposes. In Proc. of EGC'2005, RNTI-E-3, Vol. 2, 2005, pp.697-702 (in French)
[Roy, 1996] Roy, B.: Multicriteria Methodology for Decision Aiding. Kluwer, 1996.
[Saaty, 1994] Saaty, T. S.: Highlights and critical points in the theory and application of the analytic hierarchy process. European Journal of Operational Research, 74, 1994, pp.426-447.
[Shalamanov et al, 2008] Shalamanov, V., Minchev, Z., Tagarev, T., et al.: Security Research and Change Management in the Security Sector (The Bulgarian Example in the Period 1999-2008). Change Management Series, Institute for Parallel Processing, Bulgarian Academy of Sciences, G.C. Marshall Association - Bulgaria, Sofia, Demetra Ltd., 2008.
[StatTrek, 2011] http://stattrek.com/Lesson3/SamplingTheory.aspx
[Vassilev et al, 2005] Vassilev, V., Genova, K., Vassileva, M., Staykov, B., Andonov, F.: A Software system for multcriteria analysis and optimization. Problems of Engineering Cybernetics and Robotics, 55, 2005, pp.8-19.
[Vassileva et al, 2001] Vassileva, M., Genova, K., Vassilev, V.: A classification based interactive algorithm of multicriteria linear integer programming. Cybernetics and Information Technologies, 1(1), 2001, pp.5-20.
[Vincke, 1992] Vincke, P. Multicriteria Decision-Aid. John Wiley & Sons, New York, 1992.
[Williams, 2009] Williams, G.: Rattle: A data mining GUI for R. The R Journal, 1:2, 2009, pp.45-55. http://rattle.togaware.com/
[Witten and Frank, 2005] Witten, I., Frank, E.: Data Mining: Practical Machine Learning Tools and Techniques. 2nd Edition, Morgan Kaufmann, San Francisco, 2005.