Embed Size (px)
Citation preview
Monitoring and Evaluation (M&E)
Plan for ARAfrica RISING
Research Review & Planning Meeting – East & Southern Africa Project
23-25 October 2012, Tamale, Ghana
OutlineAR Objectives, activities, and expected resultsMonitoringEvaluationM&E ObjectivesPrinciplesIndicatorsMethodsRoles and Responsibilities
Expected results• Expected key, direct results of implementation
Sustainable higher productivityReduced negative environmental impactsIncreased contributions to natural capital & flow of
environmental services, nutrition/genderValue chain conduct and performance improved? /
Improved market efficiency? / Improved extension effectiveness?
• Many other results possible: labor use, WUE, poverty, hunger, etc.
Monitoring“process of systematic collection and analysis of
data on specific” Describes the “what” of implementation Useful for:
Management - to see if project is on trackReporting – to inform client & other stakeholders of
progress Indicators
USAID FTFOthers (custom) useful to AR for monitoring or
evaluation or both
Evaluation“periodic assessment of worth or significance of an
activity, policy or programme”
• Helps understand “how” & “why” of implementation
• Determines & attributes impact
• Qualitative and/or quantitative
• Dimensions Sites (different levels) Development domains Household types Technologies & combinations Implementation processes
M&E Objectives
•Support effective project management•Provide the data for timely reporting to
USAID•Help all stakeholders to learn about the
project’s successes and failures
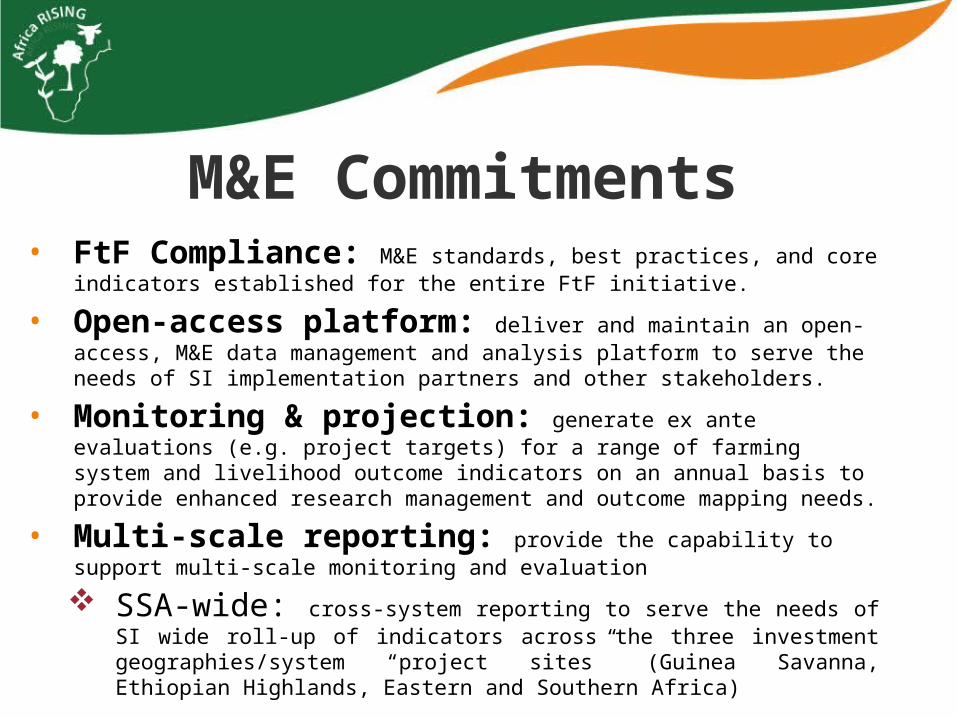
M&E Commitments• FtF Compliance: M&E standards, best practices, and core indicators
established for the entire FtF initiative.
• Open-access platform: deliver and maintain an open-access, M&E data management and analysis platform to serve the needs of SI implementation partners and other stakeholders.
• Monitoring & projection: generate ex ante evaluations (e.g. project targets) for a range of farming system and livelihood outcome indicators on an annual basis to provide enhanced research management and outcome mapping needs.
• Multi-scale reporting: provide the capability to support multi-scale monitoring and evaluation
SSA-wide: cross-system reporting to serve the needs of SI wide roll-up of indicators across the three investment geographies/system “project sites” (Guinea Savanna, Ethiopian Highlands, Eastern and Southern Africa)
Guinea – Savannah
East and Southern Africa Maize Mixed
Ethiopian Highlands
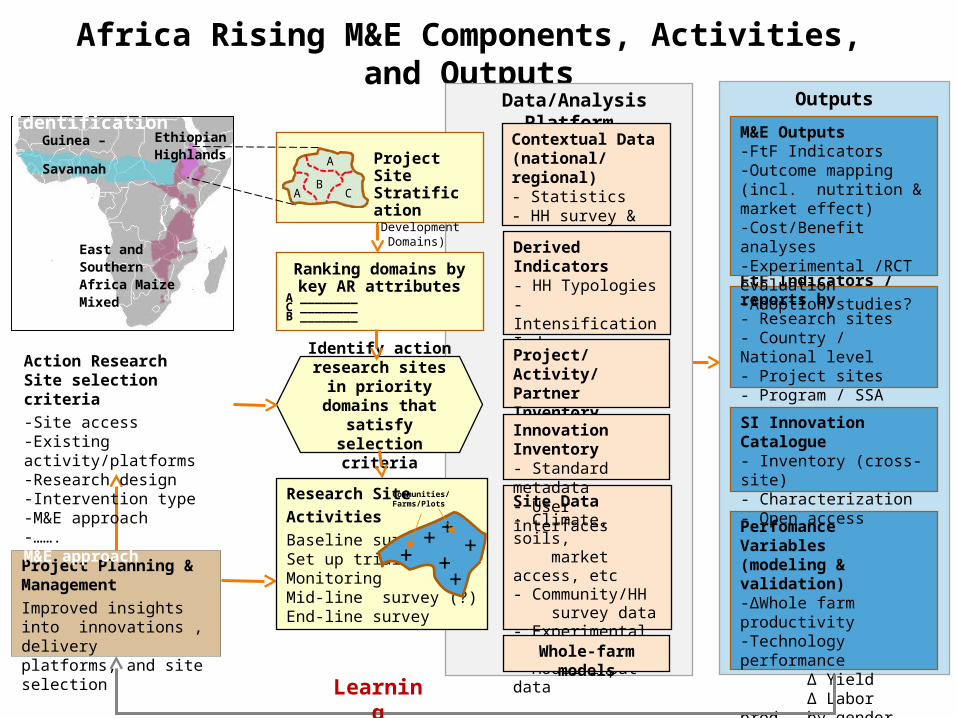
Africa Rising M&E Components, Activities, and Outputs
Program/Project Site Identification Outputs
FtF Indicators / reports by- Research sites- Country / National level- Project sites- Program / SSA
Perfomance Variables(modeling & validation)-∆Whole farm productivity-Technology performance ∆ Yield ∆ Labor prod.- by gender ∆ NUE, WUE- ∆Revenues, Costs, Profits
M&E Outputs-FtF Indicators-Outcome mapping (incl. nutrition & market effect)-Cost/Benefit analyses-Experimental /RCT evaluation -Adoption studies?
SI Innovation Catalogue- Inventory (cross-site)- Characterization- Open access
Project Planning & ManagementImproved insights into innovations , delivery platforms, and site selection
Learning
Data/Analysis Platform
Contextual Data(national/regional)- Statistics- HH survey & census- Spatial data
Derived Indicators- HH Typologies- Intensification Index- Sustainability Index- Nutrition index?
Ranking domains by key AR attributes
A ________C ________B ________
Project Site Stratification(Development Domains)
B
A
A C
Project/Activity/Partner Inventory- Project DB (& maps)
Action Research Site selection criteria-Site access-Existing activity/platforms-Research design-Intervention type-M&E approach-…….M&E approach
Identify action research sites in
priority domains that satisfy selection
criteria
Site Data - Climate, soils, market access, etc- Community/HH survey data - Experimental data- Model input data
Whole-farm models
Innovation Inventory- Standard metadata- User interfaces
Research Site ActivitiesBaseline survey Set up trialsMonitoring Mid-line survey (?)End-line survey
++
+++
+
Communities/Farms/Plots
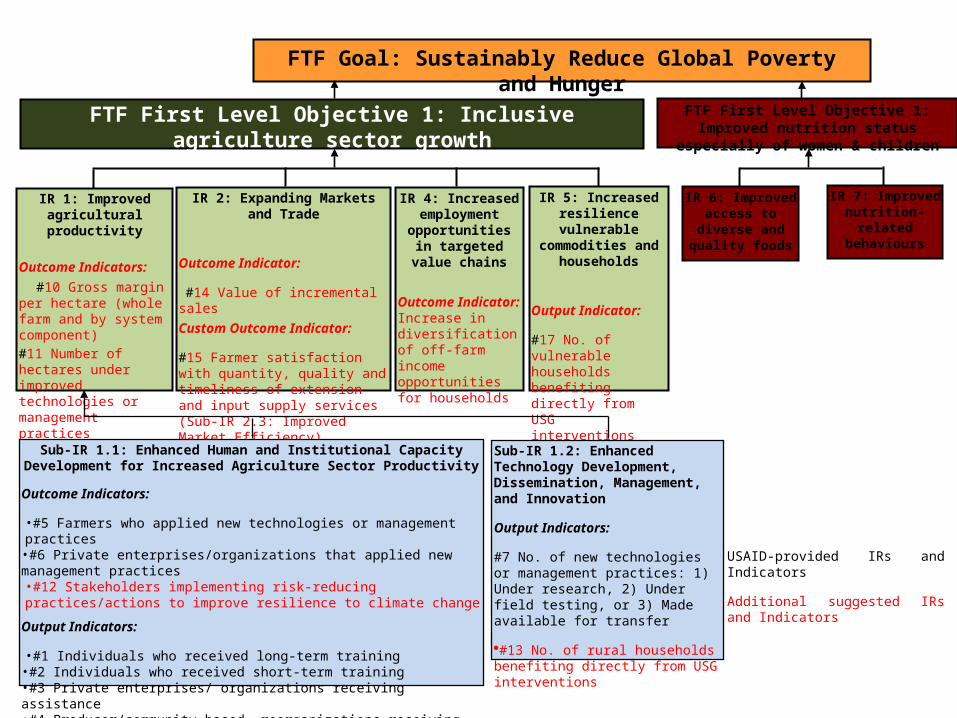
USAID-provided IRs and Indicators
Additional suggested IRs and Indicators
FTF Goal: Sustainably Reduce Global Poverty and Hunger
IR 1: Improved agricultural productivity
Outcome Indicators: #10 Gross margin per hectare (whole farm and by system component)#11 Number of hectares under improved technologies or management practices
IR 2: Expanding Markets and Trade
Outcome Indicator:
#14 Value of incremental salesCustom Outcome Indicator:
#15 Farmer satisfaction with quantity, quality and timeliness of extension and input supply services (Sub-IR 2.3: Improved Market Efficiency)
IR 4: Increased employment
opportunities in targeted value chains
Outcome Indicator: Increase in diversification of off-farm income opportunities for households
IR 5: Increased resilience vulnerable
commodities and households
Output Indicator:
#17 No. of vulnerable households benefiting directly from USG interventions
FTF First Level Objective 1: Inclusive agriculture sector growth
IR 7: Improved nutrition-related
behaviours
IR 6: Improved access to diverse and quality foods
FTF First Level Objective 1: Improved nutrition status especially of women & children
Sub-IR 1.1: Enhanced Human and Institutional Capacity Development for Increased Agriculture Sector Productivity
Outcome Indicators:
•#5 Farmers who applied new technologies or management practices•#6 Private enterprises/organizations that applied new management practices•#12 Stakeholders implementing risk-reducing practices/actions to improve resilience to climate change
Output Indicators:
•#1 Individuals who received long-term training•#2 Individuals who received short-term training•#3 Private enterprises/ organizations receiving assistance•#4 Producer/community based reorganizations receiving assistance
Sub-IR 1.2: Enhanced Technology Development, Dissemination, Management, and Innovation
Output Indicators:
#7 No. of new technologies or management practices: 1) Under research, 2) Under field testing, or 3) Made available for transfer
#13 No. of rural households benefiting directly from USG interventions
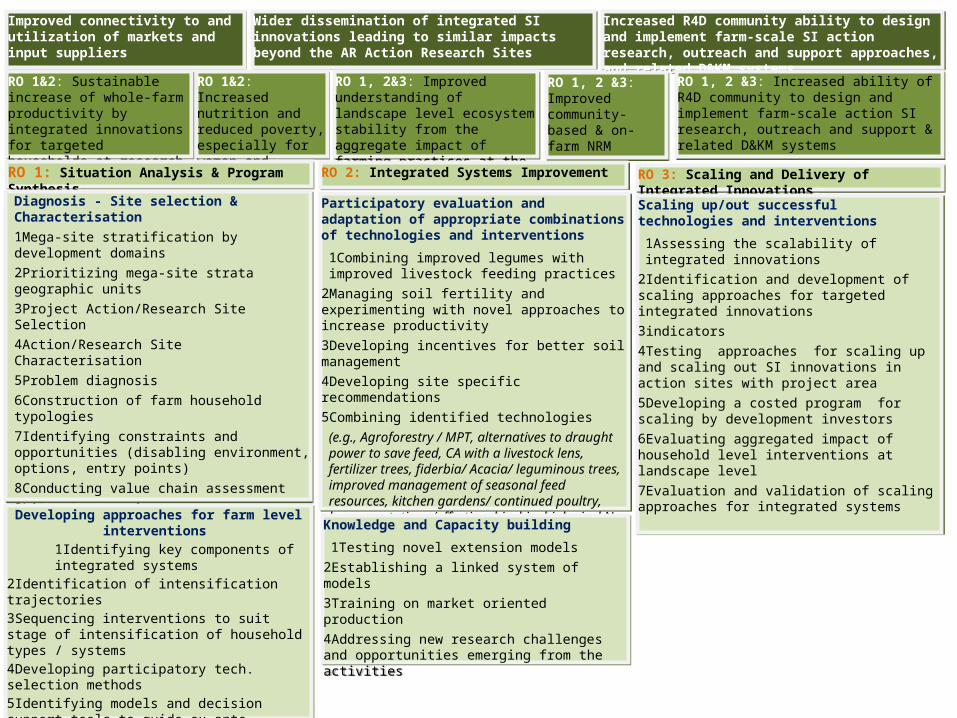
Improved connectivity to and utilization of markets and input suppliersImproved connectivity to and utilization of markets and input suppliers
Wider dissemination of integrated SI innovations leading to similar impacts beyond the AR Action Research SitesWider dissemination of integrated SI innovations leading to similar impacts beyond the AR Action Research Sites
RO 1&2: Sustainable increase of whole-farm productivity by integrated innovations for targeted households at research sites
RO 1&2: Sustainable increase of whole-farm productivity by integrated innovations for targeted households at research sites
RO 1&2: Increased nutrition and reduced poverty, especially for women and children
RO 1&2: Increased nutrition and reduced poverty, especially for women and children
RO 1: Situation Analysis & Program SynthesisRO 1: Situation Analysis & Program Synthesis
Diagnosis - Site selection & Characterisation1Mega-site stratification by development domains2Prioritizing mega-site strata geographic units3Project Action/Research Site Selection4Action/Research Site Characterisation5Problem diagnosis6Construction of farm household typologies7Identifying constraints and opportunities (disabling environment, options, entry points)8Conducting value chain assessment9Literature review1Baseline survey1Development of common key indicators (biophysical, socio-economic & institutional)1Technology inventory and characterisation1Ex-ante analysis of potential options
1integrated systems priority setting & planning
1Cooperation and collaboration with partners
Developing approaches for farm level interventions 1Identifying key components of integrated systems
2Identification of intensification trajectories3Sequencing interventions to suit stage of intensification of household types / systems4Developing participatory tech. selection methods5Identifying models and decision support tools to guide ex-ante technology identification6Ex-ante sustainability & resilience evaluation7Identify high impact sweet spots/ best bets/fits
Participatory evaluation and adaptation of appropriate combinations of technologies and interventions
1Combining improved legumes with improved livestock feeding practices
2Managing soil fertility and experimenting with novel approaches to increase productivity3Developing incentives for better soil management4Developing site specific recommendations5Combining identified technologies
(e.g., Agroforestry / MPT, alternatives to draught power to save feed, CA with a livestock lens, fertilizer trees, fiderbia/ Acacia/ leguminous trees, improved management of seasonal feed resources, kitchen gardens/ continued poultry, legume rotations (effective rhizobia, biological N fix), micro dosing, more effective contribution to livestock to nutrient management, supplemental irrigation, rainwater harvesting, etc.)
Knowledge and Capacity building
1Testing novel extension models2Establishing a linked system of models3Training on market oriented production4Addressing new research challenges and opportunities emerging from the activities
Knowledge and Capacity building
1Testing novel extension models2Establishing a linked system of models3Training on market oriented production4Addressing new research challenges and opportunities emerging from the activities
RO 3: Scaling and Delivery of Integrated InnovationsRO 3: Scaling and Delivery of Integrated Innovations
Increased R4D community ability to design and implement farm-scale SI action research, outreach and support approaches, and related D&KM systems
Increased R4D community ability to design and implement farm-scale SI action research, outreach and support approaches, and related D&KM systems
RO 1, 2&3: Improved understanding of landscape level ecosystem stability from the aggregate impact of farming practices at the household level
RO 1, 2&3: Improved understanding of landscape level ecosystem stability from the aggregate impact of farming practices at the household level
Scaling up/out successful technologies and interventions
1Assessing the scalability of integrated innovations2Identification and development of scaling approaches for targeted integrated innovations3indicators4Testing approaches for scaling up and scaling out SI innovations in action sites with project area5Developing a costed program for scaling by development investors6Evaluating aggregated impact of household level interventions at landscape level7Evaluation and validation of scaling approaches for integrated systems
RO 1, 2 &3: Improved community-based & on-farm NRM
RO 1, 2 &3: Improved community-based & on-farm NRM
RO 1, 2 &3: Increased ability of R4D community to design and implement farm-scale action SI research, outreach and support & related D&KM systems
RO 1, 2 &3: Increased ability of R4D community to design and implement farm-scale action SI research, outreach and support & related D&KM systems
RO 2: Integrated Systems ImprovementRO 2: Integrated Systems Improvement
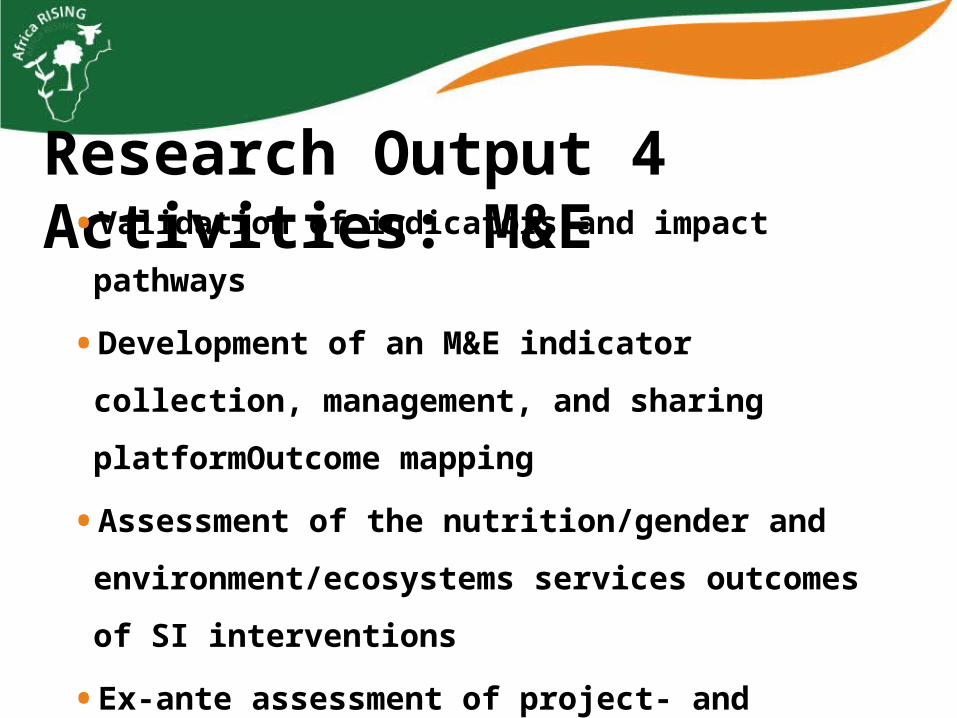
Research Output 4 Activities: M&E• Validation of indicators and impact pathways
• Development of an M&E indicator collection, management,
and sharing platformOutcome mapping
• Assessment of the nutrition/gender and
environment/ecosystems services outcomes of SI
interventions
• Ex-ante assessment of project- and program-scale outcomes,
impacts and spillover potentials
• Adoption and Impact studies
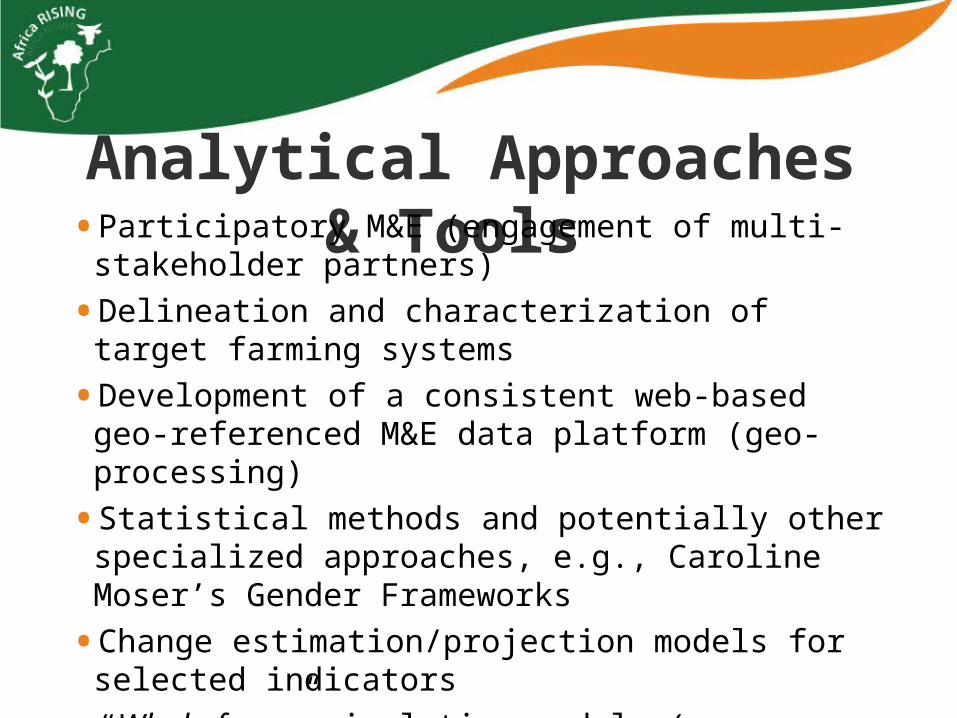
Analytical Approaches & Tools • Participatory M&E (engagement of multi-stakeholder
partners)
• Delineation and characterization of target farming systems
• Development of a consistent web-based geo-referenced M&E data platform (geo-processing)
• Statistical methods and potentially other specialized approaches, e.g., Caroline Moser’s Gender Frameworks
• Change estimation/projection models for selected indicators
• “Whole-farm” simulation models (e.g., NUANCES and APSFARM)
• Econometric approaches
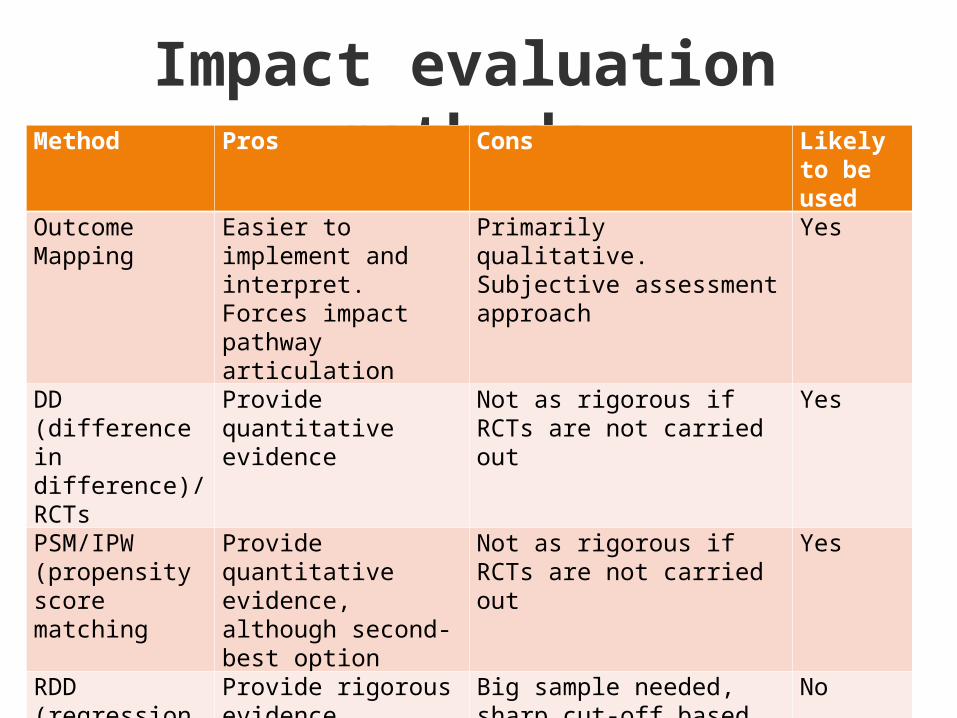
Impact evaluation methodsMethod Pros Cons Likely to
be used
Outcome Mapping
Easier to implement and interpret. Forces impact pathway articulation
Primarily qualitative. Subjective assessment approach
Yes
DD (difference in difference)/RCTs
Provide quantitative evidence
Not as rigorous if RCTs are not carried out
Yes
PSM/IPW (propensity score matching
Provide quantitative evidence, although second-best option
Not as rigorous if RCTs are not carried out
Yes
RDD (regression discontinuity design)
Provide rigorous evidence
Big sample needed, sharp cut-off based on continuous eligibility criterion (which AR is currently not supporting)
No
Adoption Studies Gain insight into factors limiting uptake of innovations
Many factors influence adoption. Care needed in data collection to limit cost
Yes
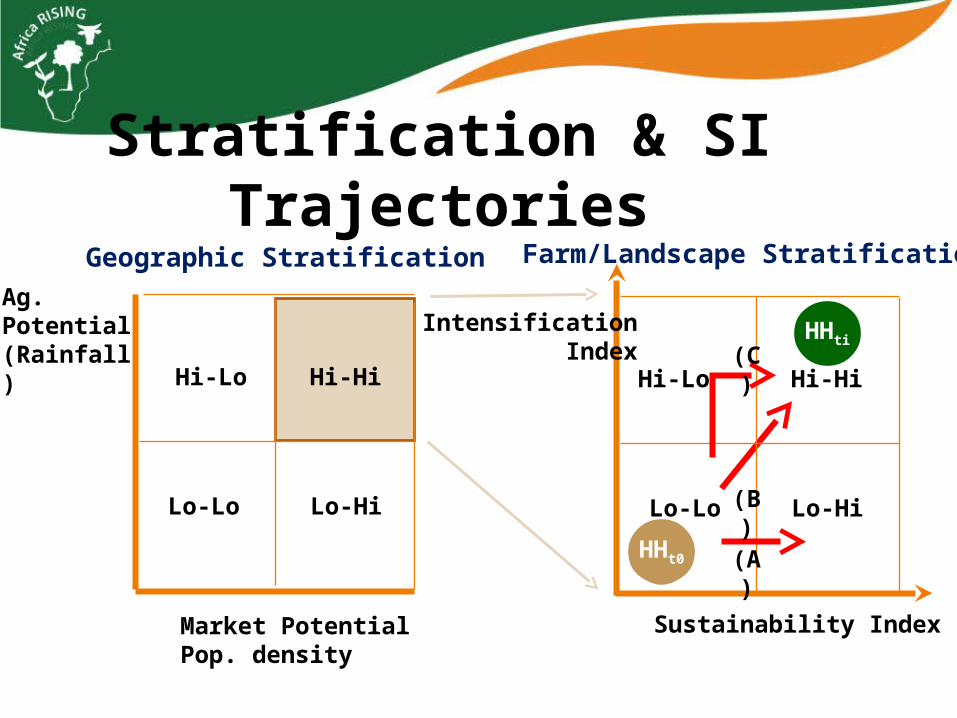
Stratification & SI Trajectories
Ag. Potential(Rainfall)
Hi-Hi
Lo-HiLo-Lo
Hi-Lo
Market PotentialPop. density
Geographic Stratification
Hi-Hi
Lo-HiLo-Lo
Hi-Lo
Sustainability Index
Intensification Index
Farm/Landscape Stratification
HHt0
HHti(C)
(A)
(B)
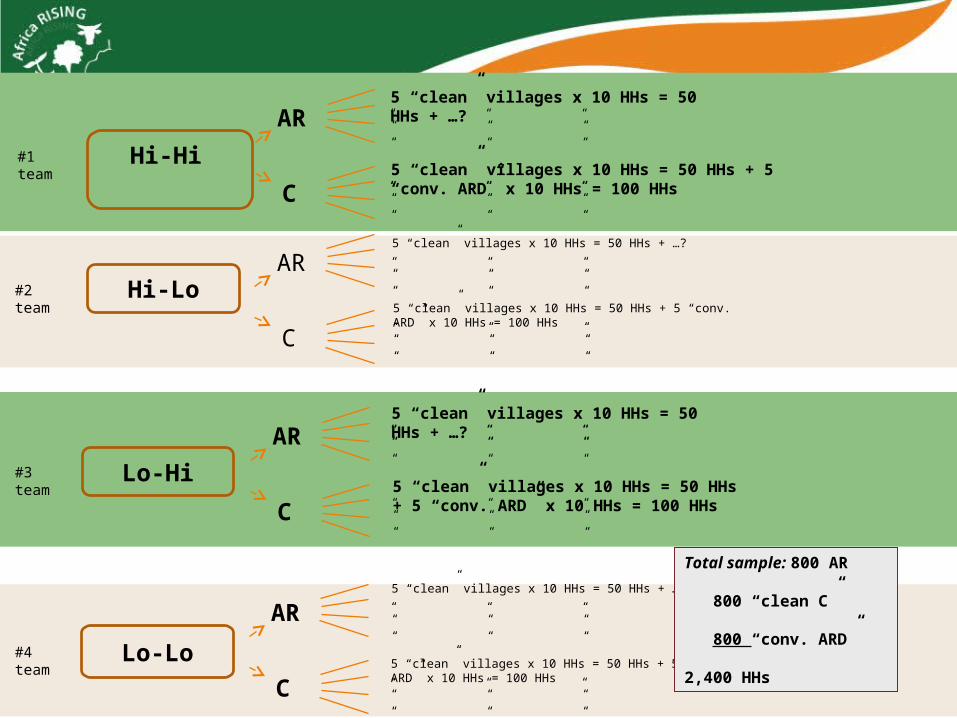
Hi-Hi
Hi-Lo
Lo-Hi
Lo-Lo
AR
C
AR
C
AR
C
AR
C
5 “clean” villages x 10 HHs = 50 HHs + …?“ “ ““ “ “
“ “ “
5 “clean” villages x 10 HHs = 50 HHs + …?
“ “ ““ “ “
“ “ “
#1 team
#2 team
#3 team
#4 team
5 “clean” villages x 10 HHs = 50 HHs + …?“ “ ““ “ “
“ “ “
5 “clean” villages x 10 HHs = 50 HHs + …?
“ “ ““ “ “
“ “ “
5 “clean” villages x 10 HHs = 50 HHs + 5 “conv. ARD” x 10 HHs = 100 HHs“ “ ““ “ “
“ “ “
5 “clean” villages x 10 HHs = 50 HHs + 5 “conv. ARD” x 10 HHs = 100 HHs“ “ ““ “ “
“ “ “
5 “clean” villages x 10 HHs = 50 HHs + 5 “conv. ARD” x 10 HHs = 100 HHs“ “ ““ “ “
“ “ “
5 “clean” villages x 10 HHs = 50 HHs + 5 “conv. ARD” x 10 HHs = 100 HHs“ “ ““ “ “
“ “ “
Total sample: 800 AR 800 “clean C” 800 “conv. ARD” 2,400 HHs
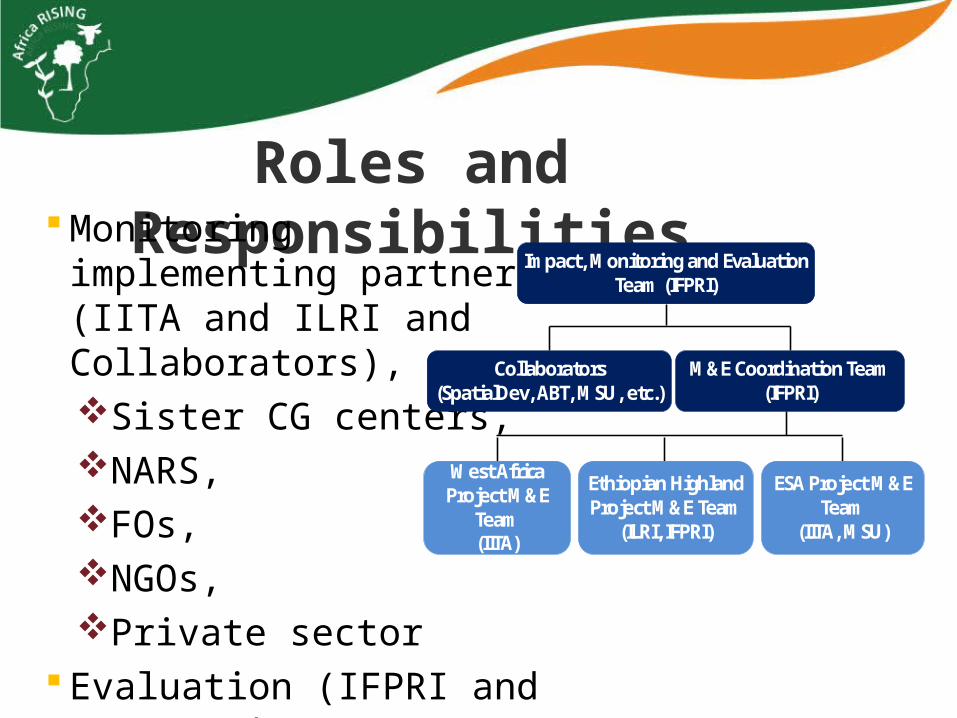
Roles and Responsibilities Monitoring implementing
partners (IITA and ILRI and Collaborators),Sister CG centers, NARS, FOs, NGOs,Private sector
Evaluation (IFPRI and partners)
Impact, Monitoring and Evaluation Team (IFPRI)
M&E Coordination Team(IFPRI)
Collaborators(SpatialDev, ABT, MSU, etc.)
West Africa Project M&E
Team(IITA)
Ethiopian Highland Project M&E Team
(ILRI, IFPRI)
ESA Project M&E Team
(IITA, MSU)
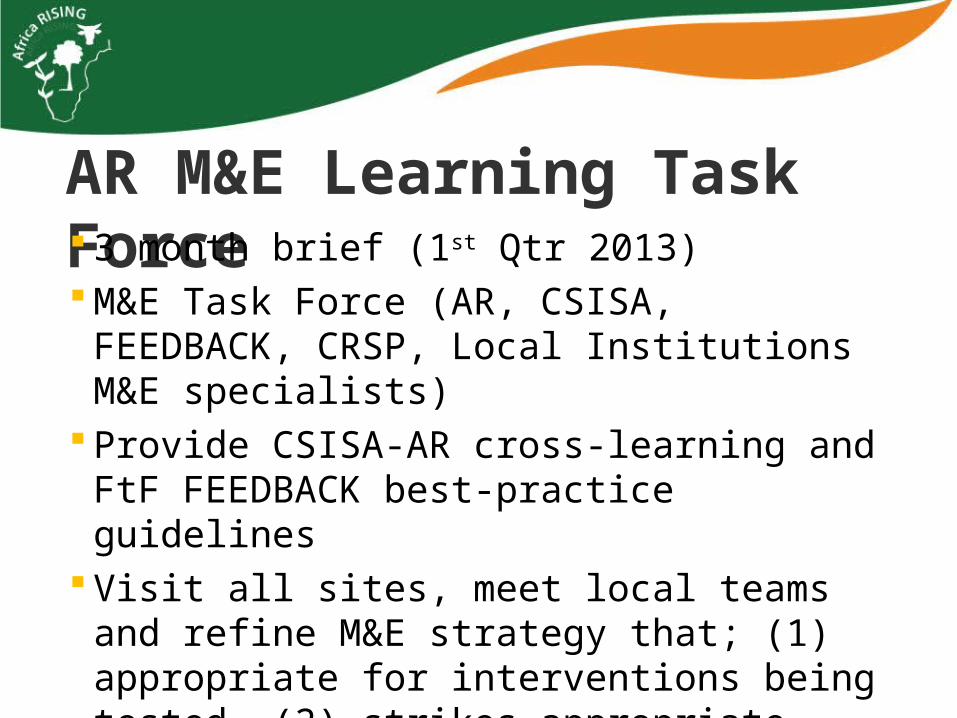
AR M&E Learning Task Force 3 month brief (1st Qtr 2013) M&E Task Force (AR, CSISA, FEEDBACK, CRSP, Local
Institutions M&E specialists) Provide CSISA-AR cross-learning and FtF FEEDBACK
best-practice guidelines Visit all sites, meet local teams and refine M&E
strategy that; (1) appropriate for interventions being tested, (2) strikes appropriate balance between rigour and cost/feasibility, (3) lays out strategy for remainder of 5 years.
Africa Research in Sustainable Intensification for the Next Generation
africa-rising.net
Thank you!