Embed Size (px)
Citation preview
Monitoring and TroubleshootiOL-24371-01
C H A P T E R 6
Monitoring DashboardThis chapter explains the list of default dashboards in Monitoring Dashboard (see List of Default Portlets in Monitoring Dashboard) and the following portlets in the dashboard:
• N-Hop View
• High Severity Faults
• Syslog Summary
• Syslog Alerts
• Alerts Summary
• Fault Events Summary
• IPSLA Violation Summary
• Syslog Messages
• Top N Syslog Sender
• Highest Latency
• Highest Jitter
• Lowest Availability
• IPSLA Availability
• CPU Utilization Summary Chart
• Custom Top /Bottom N Records
• Device Availability
• Interface Availability
• Histo-Graph It
• Live Graph-It
• TOP-N Interface Discards
• TOP-N Interface Errors
• TOP-N Interface Utilization
• TOP-N Memory Utilization
• TOP-N-POE Utilization
• TOP-N CPU Utilization
• Performance Threshold Information
6-1ng with Cisco Prime LAN Management Solution 4.1
Chapter 6 Monitoring DashboardList of Default Portlets in Monitoring Dashboard
• Performance TrendWatch Information
• TOP-N Environmental Temperature
• NAM Top N Statistics Portlet
• NAM Attribute Value
• IPSLA Collector Information
• IPSLA Device Categorization
See Getting Started with Cisco Prime LAN Management Solution 4.1 for the list of dashboards and portlets in LMS 4.1.
In a multi-server setup, all performance management portlets display the data specific to that server only.
List of Default Portlets in Monitoring DashboardThe following portlets appear by default in the Monitoring Dashboard:
• High Severity Faults
• Syslog Summary
• Syslog Alerts
• Alerts Summary
• Fault Events Summary
• Syslog Messages
• Top N Syslog Sender
• Device Availability
• Interface Availability
• TOP-N Interface Discards
• TOP-N Interface Errors
• TOP-N Interface Utilization
• TOP-N Memory Utilization
• TOP-N CPU Utilization
• N-Hop View
• IPSLA Violation Summary
• Histo-Graph It
• Live Graph-It
To see the other portlet details, you must add them to the Monitoring Dashboard.
See Getting Started with Cisco Prime LAN Management Solution 4.1 for information on:
• Changing the look and feel of the portlets.
• Adding portlets to dashboards
• Refreshing portlets
6-2Monitoring and Troubleshooting with Cisco Prime LAN Management Solution 4.1
OL-24371-01
Chapter 6 Monitoring DashboardN-Hop View
N-Hop ViewN-Hop View portlet is an HTML based light weight feature. This is much faster than the regular Topology services.
This portlet displays an N-hop view from a specified device. It should be used to view a limited set of devices.
Using N-Hop View, you can:
• Select any device from the map and choose to see the Device dashboard report is launched. It displays performance details for the device.
• Select any link from the Topology map and choose to see the Interface Report for that particular link displaying data for the last one hour.
• Select any device to cross-launch Software Distribution and NetConfig page
• Select any IPSLA capable device, right click and choose Show Collector or Create Collector.
The corresponding Collector Management page is launched. You can either create new collectors or view existing ones for Layer 3 devices. An error appears if you do this on a Layer 2 device.
• View the details of Fault History Report and Fault Alerts
• Access a device using Telnet. To do so, choose a device, right click and choose Telnet.
• View the following information in the map:
IP Address IP Address of the Device
device name Name of the device
sysName sysName
sysContact Contact person for that device
sysLocation Physical location of the device
sysOID Value of the System Object Identifier MIB variable of the device
6-3Monitoring and Troubleshooting with Cisco Prime LAN Management Solution 4.1
OL-24371-01
Chapter 6 Monitoring DashboardN-Hop View
– To view information, right click anywhere on the map and select the required value. The selected information is displayed for all devices.
– To hide the displayed information, right click anywhere on the map and select Show/Hide Labels. Move the mouse over the label to display this relevant information.
You can drag the labels anywhere inside the map. To set it to its original position, right click in the map and choose Reset Draggables.
You can view the details about a single device or link.
– Click the link Show Properties at the top right corner. (It toggles between Show Properties and Hide Properties). You can also move the IP address of the devices using the cursor.
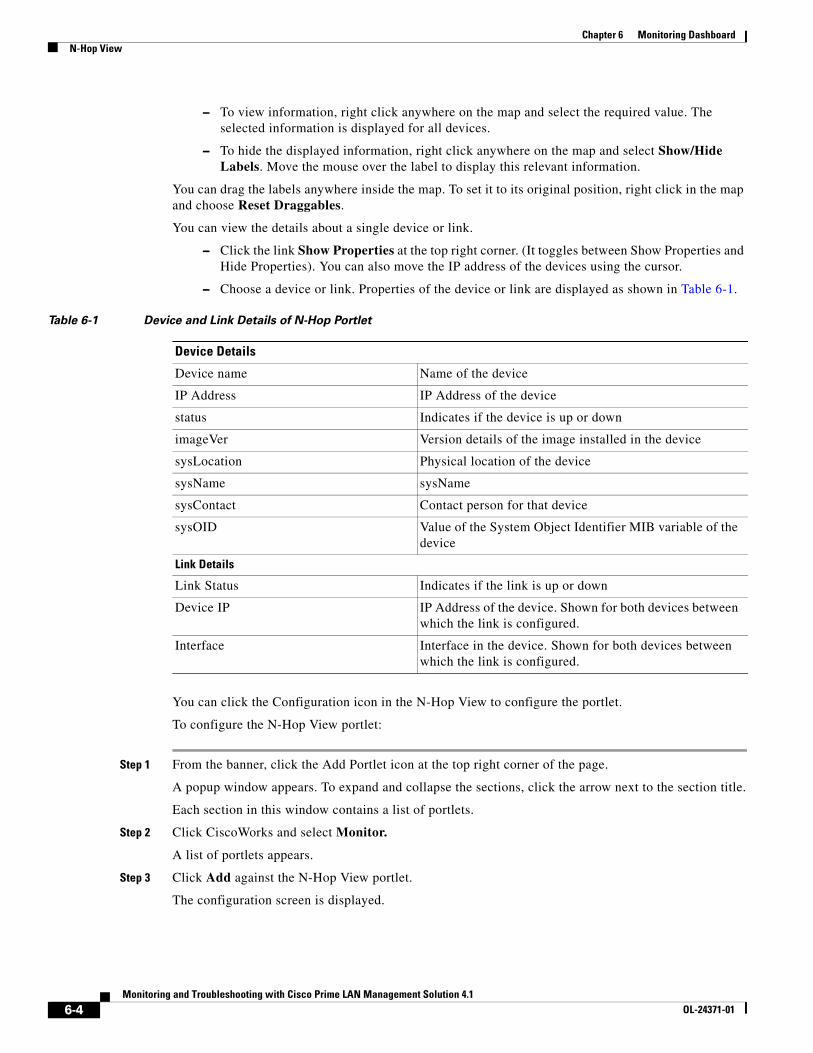
– Choose a device or link. Properties of the device or link are displayed as shown in Table 6-1.
You can click the Configuration icon in the N-Hop View to configure the portlet.
To configure the N-Hop View portlet:
Step 1 From the banner, click the Add Portlet icon at the top right corner of the page.
A popup window appears. To expand and collapse the sections, click the arrow next to the section title.
Each section in this window contains a list of portlets.
Step 2 Click CiscoWorks and select Monitor.
A list of portlets appears.
Step 3 Click Add against the N-Hop View portlet.
The configuration screen is displayed.
Table 6-1 Device and Link Details of N-Hop Portlet
Device Details
Device name Name of the device
IP Address IP Address of the device
status Indicates if the device is up or down
imageVer Version details of the image installed in the device
sysLocation Physical location of the device
sysName sysName
sysContact Contact person for that device
sysOID Value of the System Object Identifier MIB variable of the device
Link Details
Link Status Indicates if the link is up or down
Device IP IP Address of the device. Shown for both devices between which the link is configured.
Interface Interface in the device. Shown for both devices between which the link is configured.
6-4Monitoring and Troubleshooting with Cisco Prime LAN Management Solution 4.1
OL-24371-01
Chapter 6 Monitoring DashboardHigh Severity Faults
Step 4 Enter the IP address or the Device name of the root device in the Root Device field.
If the device you specify is not managed by LMS, it will display an error message such as “The root device you specified is not managed by LMS”
Step 5 Enter the number of hops in the Hop count field.
The Network Topology map is drawn for the specified number of hops.
Step 6 Add the device to the critical device poller by checking the Poll Devices check-box.
LMS polls the network periodically. If you need to monitor the status of a certain device more frequently, add it to the critical device poller.
This device is removed from the critical poller list when you close the N-Hop View portlet window.
Step 7 Check the Show Fault Monitor Alerts check box to display the Fault Alerts.
– Check the Critical check box to display only the critical alerts.
– Check the Warning check box to display only the warning alerts.
– Check the Informational check box to display only the informational alerts.
You can also check the Critical, Warning, and Informational check boxes to display all the critical, warning and informational alerts.
Step 8 Select the time interval from the Refresh Every drop-down list. The interval can be either in minutes or hours.
By default, the portlet refreshes the topology map every 2 minutes. If you set the time interval, it refreshes accordingly. For every refresh, the data is fetched from the last polling cycle of the critical device poller.
Step 9 Click Save to view the portlet with the configured settings.
Note You can also add this portlet to other application and view it.
High Severity FaultsIn the High Severity Faults portlet, you can view the details of high severity faults .
The High Severity Faults portlet provides a consolidated real-time view of the operational status of your network. When a fault occurs in the network, LMS generates an event. All events occurring on the same device are rolled into a single fault.
6-5Monitoring and Troubleshooting with Cisco Prime LAN Management Solution 4.1
OL-24371-01
Chapter 6 Monitoring DashboardSyslog Summary
You can also use Notification Services to change the standard event name to a more meaningful one.
Click the High Severity Faults portlet header link to view the details of faults in Fault Monitor.
To configuring High Severity Faults:
Step 1 Move the mouse over the title bar of the High Severity Faults portlet to view the icons.
Step 2 Click the Configuration icon.
You can:
• Select the minute and hour from the Refresh Every drop-down list to change the Refresh time. The items in the portlet get refreshed at the changed Refresh time.
• Select the number of faults to be displayed in the portlet from the No. of Faults to be Displayed drop-down list.
For example, if you select the number of faults as 3 , the details of any three alerts are displayed in the portlet.
Step 3 Click Save to view the configured portlet with the changed settings.
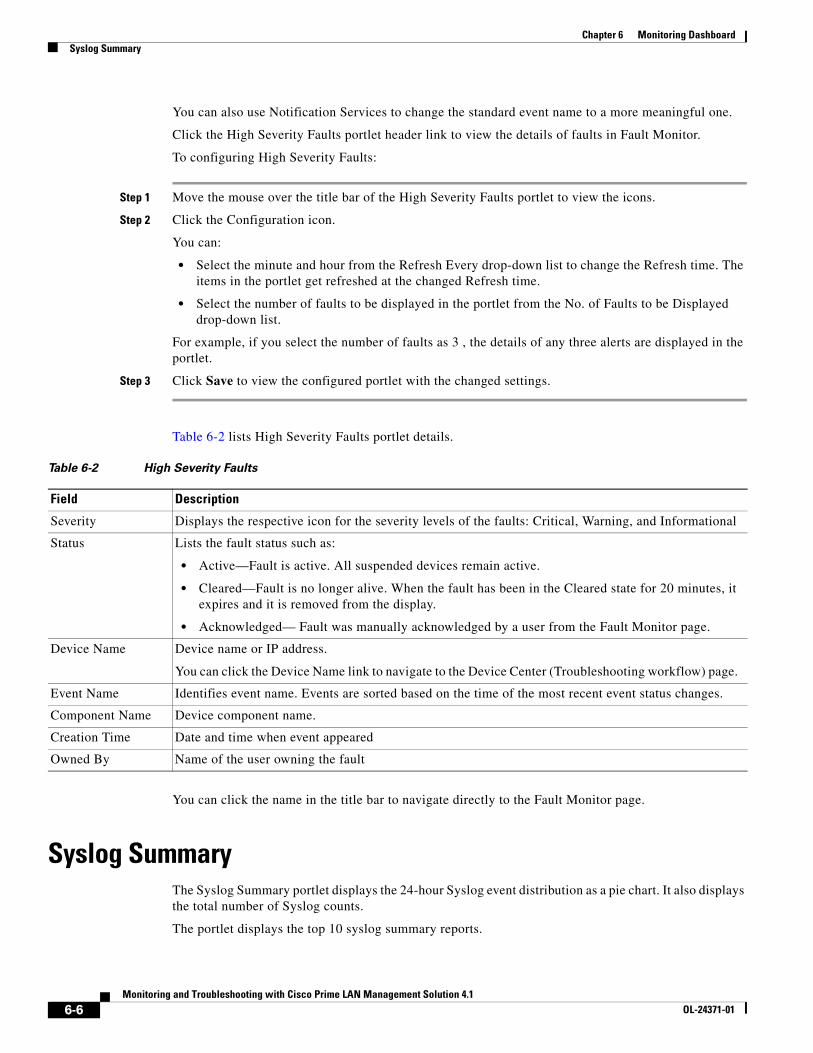
Table 6-2 lists High Severity Faults portlet details.
You can click the name in the title bar to navigate directly to the Fault Monitor page.
Syslog Summary The Syslog Summary portlet displays the 24-hour Syslog event distribution as a pie chart. It also displays the total number of Syslog counts.
The portlet displays the top 10 syslog summary reports.
Table 6-2 High Severity Faults
Field Description
Severity Displays the respective icon for the severity levels of the faults: Critical, Warning, and Informational
Status Lists the fault status such as:
• Active—Fault is active. All suspended devices remain active.
• Cleared—Fault is no longer alive. When the fault has been in the Cleared state for 20 minutes, it expires and it is removed from the display.
• Acknowledged— Fault was manually acknowledged by a user from the Fault Monitor page.
Device Name Device name or IP address.
You can click the Device Name link to navigate to the Device Center (Troubleshooting workflow) page.
Event Name Identifies event name. Events are sorted based on the time of the most recent event status changes.
Component Name Device component name.
Creation Time Date and time when event appeared
Owned By Name of the user owning the fault
6-6Monitoring and Troubleshooting with Cisco Prime LAN Management Solution 4.1
OL-24371-01
Chapter 6 Monitoring DashboardSyslog Alerts
There are options to view the graph as a chart or as a grid.
To configure the Syslog Summary portlet:
Step 1 Move the mouse over the title bar of the High Severity portlet to view the icons.
Step 2 Click the Configuration icon.
You can:
• Select the minute and hour from the Refresh Every drop-down list to change the Refresh time
The items in the portlet get refreshed at the changed refresh time.
• Select the number of rows to be displayed in the portlet from the No.of Rows to be Displayed drop-down list.
• Select the Show graph check box
Step 3 Click Save to view the configured portlet with the changed settings.
Syslog AlertsIn the Syslog Alerts portlet you can view the error messages, or informational messages about events such as exceptions, and device configuration changes.
To configure the Syslog Alerts portlet:
Step 1 Move the mouse over the title bar of the High Severity portlet to view the icons.
Step 2 Click the Configuration icon.
You can:
• Select the minute and hour from the Refresh Every drop-down list to change the Refresh time
The items in the portlet get refreshed at the changed refresh time.
• Select the number of records to be displayed in the portlet from the Show Last Records drop-down list.
• To view the exception period report, enable the Only Exception period report check box.
Step 3 Click Save to view the configured portlet with the changed settings.
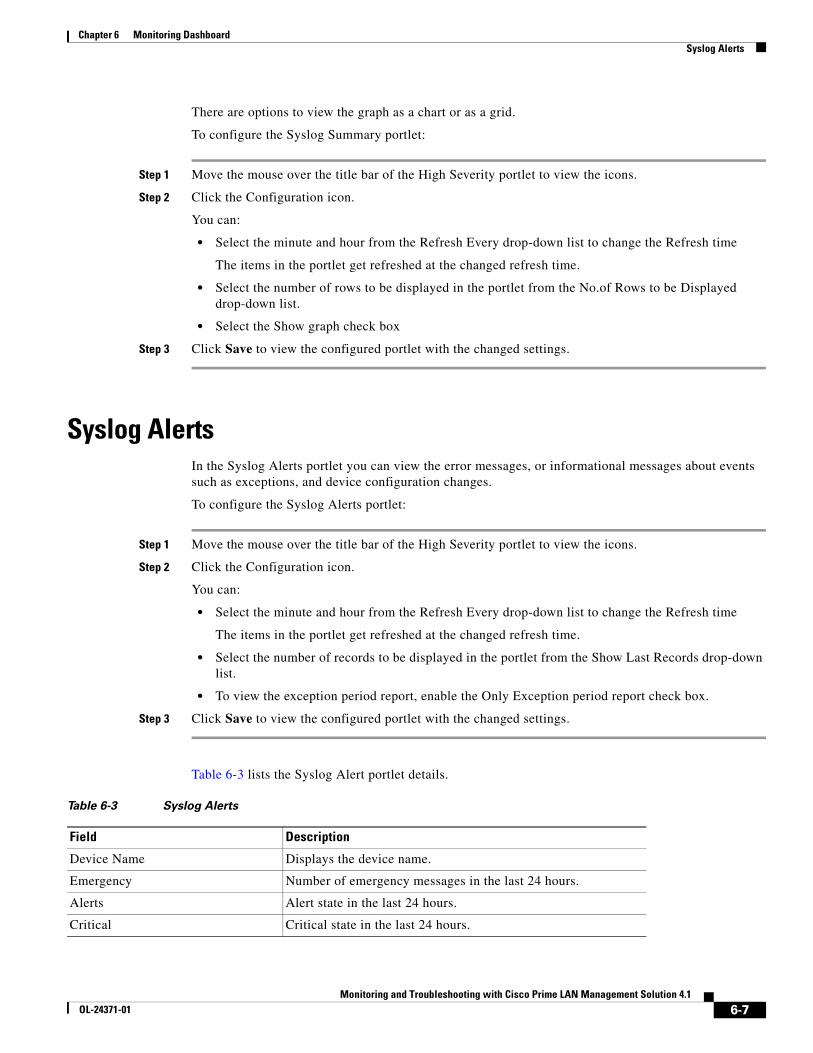
Table 6-3 lists the Syslog Alert portlet details.
Table 6-3 Syslog Alerts
Field Description
Device Name Displays the device name.
Emergency Number of emergency messages in the last 24 hours.
Alerts Alert state in the last 24 hours.
Critical Critical state in the last 24 hours.
6-7Monitoring and Troubleshooting with Cisco Prime LAN Management Solution 4.1
OL-24371-01
Chapter 6 Monitoring DashboardAlerts Summary
You can click the portlet name in the title bar to navigate directly to the Report Generator page.
Alerts SummaryThe Alerts and Summary portlet will capture the alerts and notification details of various LMS applications. This will provide a launch point for various alarms and notification events within LMS.
The Alerts summary portlet will provide the total number of alerts or events for the following in the LMS: applications.
• Discrepancies
• Best Practices Deviations
• High Severity Alerts
• S0, S1, S2 Syslog Alerts
• IPSLA Violations
• Threshold Violations
You can click the alerts count given in the portlet to view the details of the respective application. However, you cannot change the Refresh interval. This is because the Refresh interval is set to five minutes.
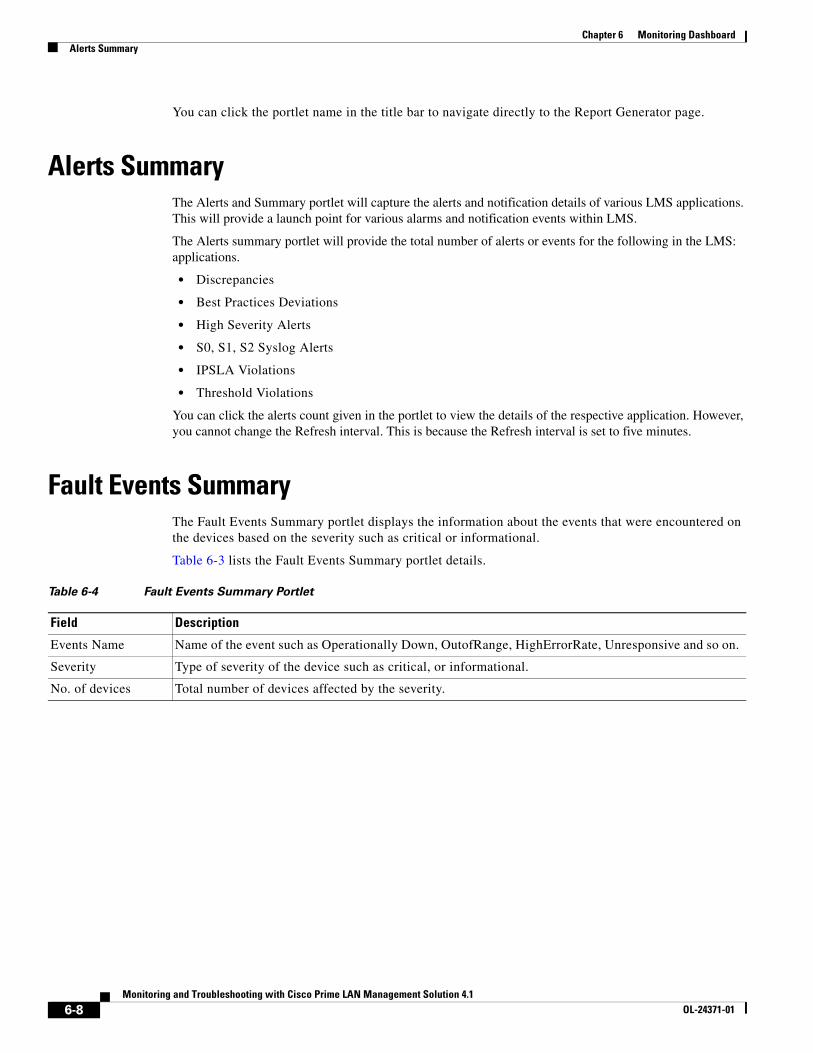
Fault Events SummaryThe Fault Events Summary portlet displays the information about the events that were encountered on the devices based on the severity such as critical or informational.
Table 6-3 lists the Fault Events Summary portlet details.
Table 6-4 Fault Events Summary Portlet
Field Description
Events Name Name of the event such as Operationally Down, OutofRange, HighErrorRate, Unresponsive and so on.
Severity Type of severity of the device such as critical, or informational.
No. of devices Total number of devices affected by the severity.
6-8Monitoring and Troubleshooting with Cisco Prime LAN Management Solution 4.1
OL-24371-01
Chapter 6 Monitoring DashboardIPSLA Violation Summary
To configure Fault Events Summary portlet:
Step 1 Move the mouse over the title bar of the Fault Events Summary portlet to view the icons.
Step 2 Click the Configuration icon.
Step 3 Select the minute and hour from the Refresh Every drop-down list to change the Refresh time.
The items in the portlet get refreshed at the changed Refresh time.
Step 4 Expand the icon against the Critical check box.
It displays the list of Critical events. You can select the check box against the respective critical events to display the events in the portlet. Expand the icon against the Informational check box.
It displays the list of Informational events. You can select the check box against the respective informational events to display the events in the portlets.
Note You can select a maximum of 20 events to be displayed in the portlet.
Step 5 Click Save to view the portlet with the configured settings such as the Events Name, Severity and the No.of Devices.
Click the device count link against the corresponding Events to navigate to the Alerts and Activities page.
IPSLA Violation Summary IPSLA Violation Summary portlet displays the Violation summary count of collectors.
This portlet displays seven Violation Summary details such as rfactor, MOS, ICPF, Errors, Latency, Jitter and others.
You can configure the refresh time and the violation summary details for rfactor, MOS, ICPF, Errors and so on.
To configure IPSLA Violation Summary Details portlet:
Step 1 Click the configuration icon in the IPSLA Violation Summary portlet.
The configuration page appears.
Step 2 Expand the group and select the check box against each variable.
Step 3 Click the Save button.
The selected variable appears in the portlet.
Note In the IPSLA Violation Summary reports, the source device and the target device displays only the IP Address and not the Display Name.
6-9Monitoring and Troubleshooting with Cisco Prime LAN Management Solution 4.1
OL-24371-01
Chapter 6 Monitoring DashboardSyslog Messages
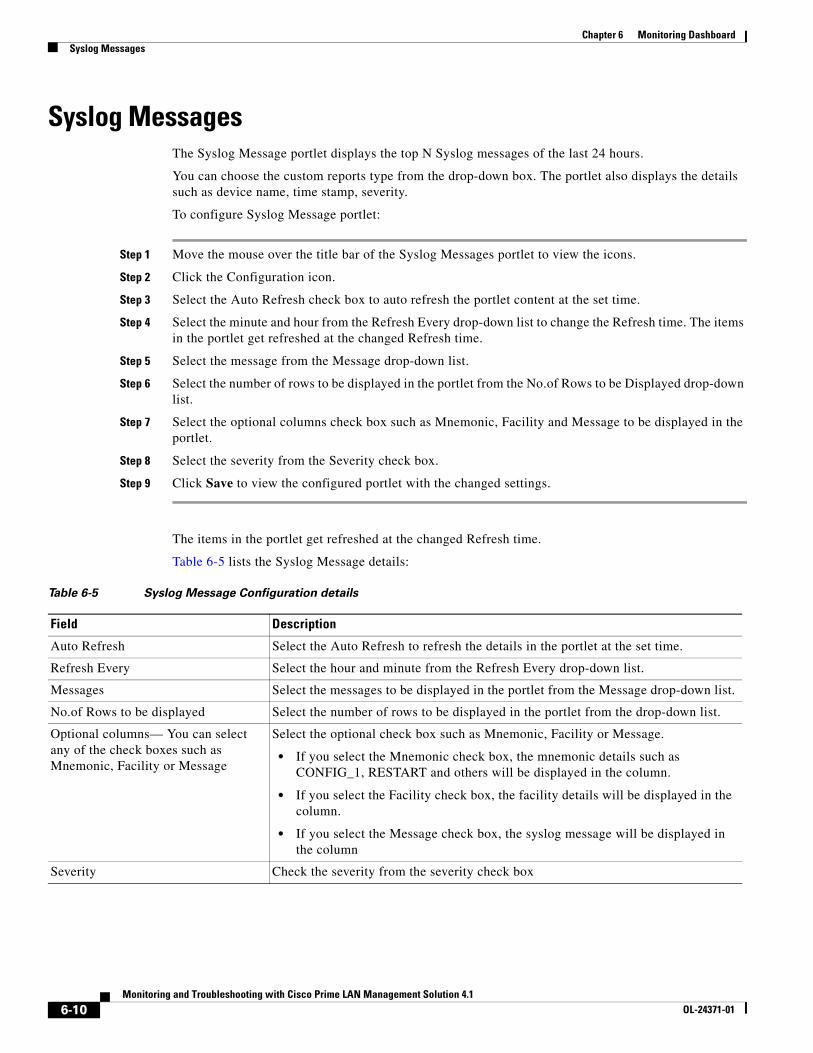
Syslog MessagesThe Syslog Message portlet displays the top N Syslog messages of the last 24 hours.
You can choose the custom reports type from the drop-down box. The portlet also displays the details such as device name, time stamp, severity.
To configure Syslog Message portlet:
Step 1 Move the mouse over the title bar of the Syslog Messages portlet to view the icons.
Step 2 Click the Configuration icon.
Step 3 Select the Auto Refresh check box to auto refresh the portlet content at the set time.
Step 4 Select the minute and hour from the Refresh Every drop-down list to change the Refresh time. The items in the portlet get refreshed at the changed Refresh time.
Step 5 Select the message from the Message drop-down list.
Step 6 Select the number of rows to be displayed in the portlet from the No.of Rows to be Displayed drop-down list.
Step 7 Select the optional columns check box such as Mnemonic, Facility and Message to be displayed in the portlet.
Step 8 Select the severity from the Severity check box.
Step 9 Click Save to view the configured portlet with the changed settings.
The items in the portlet get refreshed at the changed Refresh time.
Table 6-5 lists the Syslog Message details:
Table 6-5 Syslog Message Configuration details
Field Description
Auto Refresh Select the Auto Refresh to refresh the details in the portlet at the set time.
Refresh Every Select the hour and minute from the Refresh Every drop-down list.
Messages Select the messages to be displayed in the portlet from the Message drop-down list.
No.of Rows to be displayed Select the number of rows to be displayed in the portlet from the drop-down list.
Optional columns— You can select any of the check boxes such as Mnemonic, Facility or Message
Select the optional check box such as Mnemonic, Facility or Message.
• If you select the Mnemonic check box, the mnemonic details such as CONFIG_1, RESTART and others will be displayed in the column.
• If you select the Facility check box, the facility details will be displayed in the column.
• If you select the Message check box, the syslog message will be displayed in the column
Severity Check the severity from the severity check box
6-10Monitoring and Troubleshooting with Cisco Prime LAN Management Solution 4.1
OL-24371-01
Chapter 6 Monitoring DashboardTop N Syslog Sender
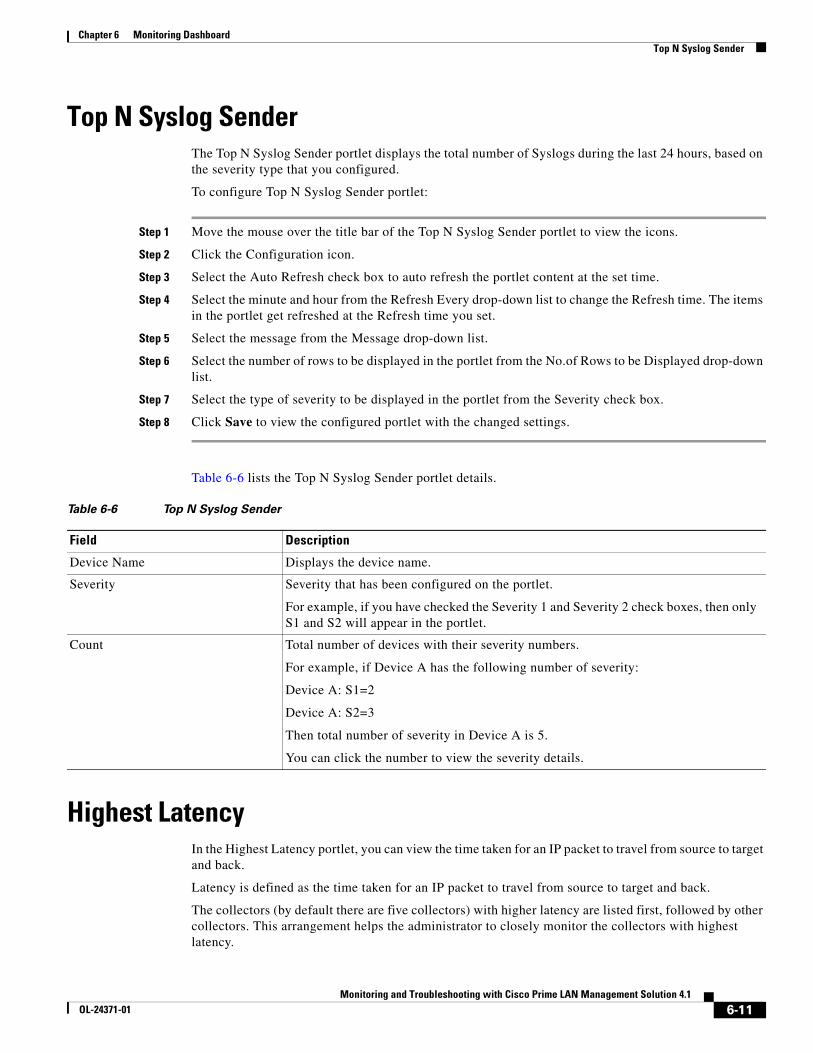
Top N Syslog Sender The Top N Syslog Sender portlet displays the total number of Syslogs during the last 24 hours, based on the severity type that you configured.
To configure Top N Syslog Sender portlet:
Step 1 Move the mouse over the title bar of the Top N Syslog Sender portlet to view the icons.
Step 2 Click the Configuration icon.
Step 3 Select the Auto Refresh check box to auto refresh the portlet content at the set time.
Step 4 Select the minute and hour from the Refresh Every drop-down list to change the Refresh time. The items in the portlet get refreshed at the Refresh time you set.
Step 5 Select the message from the Message drop-down list.
Step 6 Select the number of rows to be displayed in the portlet from the No.of Rows to be Displayed drop-down list.
Step 7 Select the type of severity to be displayed in the portlet from the Severity check box.
Step 8 Click Save to view the configured portlet with the changed settings.
Table 6-6 lists the Top N Syslog Sender portlet details.
Highest LatencyIn the Highest Latency portlet, you can view the time taken for an IP packet to travel from source to target and back.
Latency is defined as the time taken for an IP packet to travel from source to target and back.
The collectors (by default there are five collectors) with higher latency are listed first, followed by other collectors. This arrangement helps the administrator to closely monitor the collectors with highest latency.
Table 6-6 Top N Syslog Sender
Field Description
Device Name Displays the device name.
Severity Severity that has been configured on the portlet.
For example, if you have checked the Severity 1 and Severity 2 check boxes, then only S1 and S2 will appear in the portlet.
Count Total number of devices with their severity numbers.
For example, if Device A has the following number of severity:
Device A: S1=2
Device A: S2=3
Then total number of severity in Device A is 5.
You can click the number to view the severity details.
6-11Monitoring and Troubleshooting with Cisco Prime LAN Management Solution 4.1
OL-24371-01
Chapter 6 Monitoring DashboardHighest Jitter
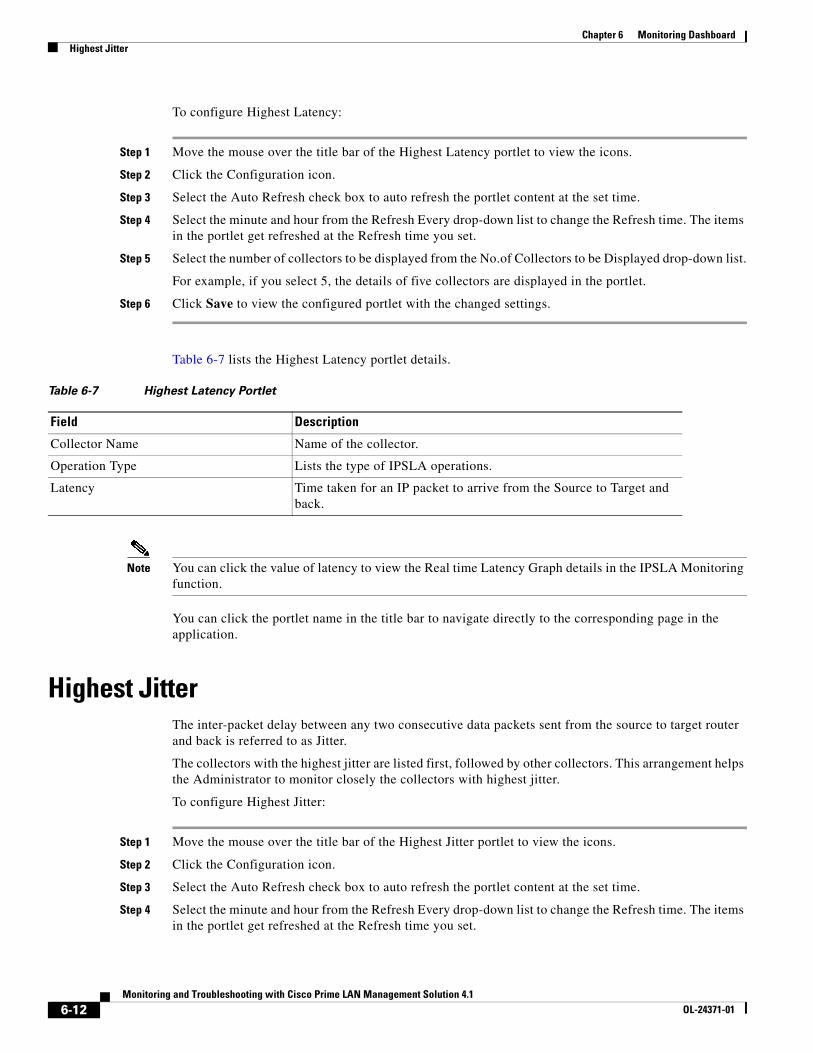
To configure Highest Latency:
Step 1 Move the mouse over the title bar of the Highest Latency portlet to view the icons.
Step 2 Click the Configuration icon.
Step 3 Select the Auto Refresh check box to auto refresh the portlet content at the set time.
Step 4 Select the minute and hour from the Refresh Every drop-down list to change the Refresh time. The items in the portlet get refreshed at the Refresh time you set.
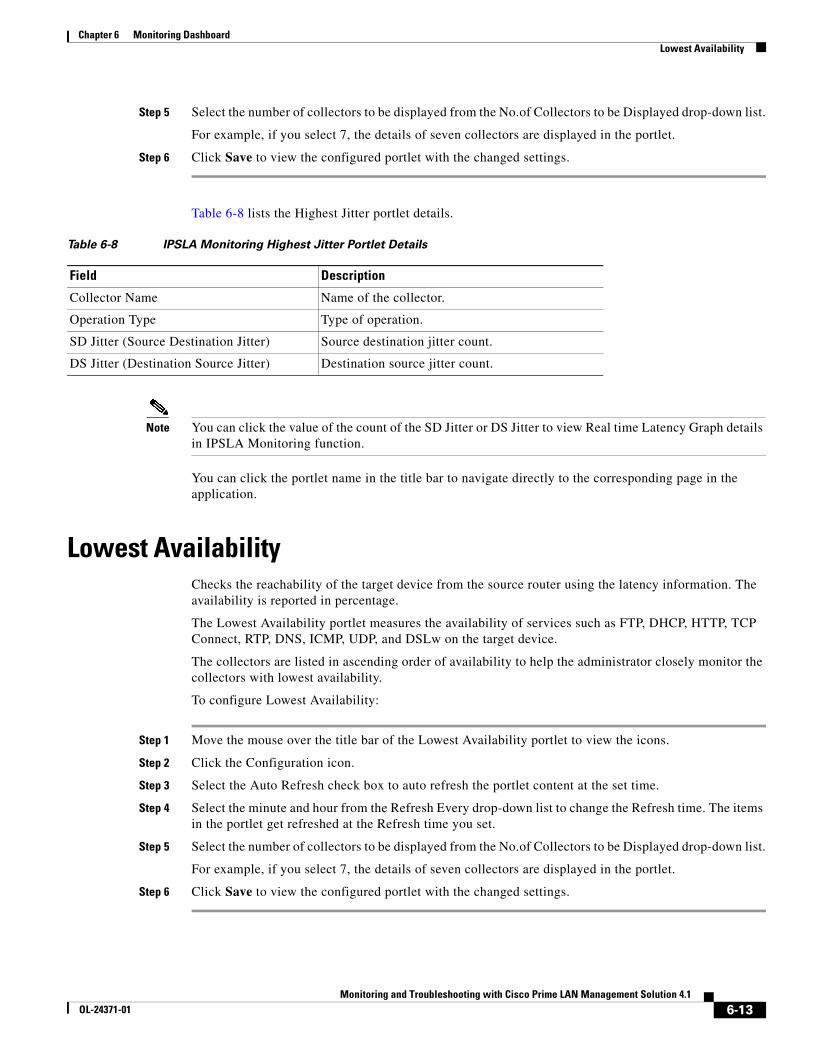
Step 5 Select the number of collectors to be displayed from the No.of Collectors to be Displayed drop-down list.
For example, if you select 5, the details of five collectors are displayed in the portlet.
Step 6 Click Save to view the configured portlet with the changed settings.
Table 6-7 lists the Highest Latency portlet details.
Note You can click the value of latency to view the Real time Latency Graph details in the IPSLA Monitoring function.
You can click the portlet name in the title bar to navigate directly to the corresponding page in the application.
Highest JitterThe inter-packet delay between any two consecutive data packets sent from the source to target router and back is referred to as Jitter.
The collectors with the highest jitter are listed first, followed by other collectors. This arrangement helps the Administrator to monitor closely the collectors with highest jitter.
To configure Highest Jitter:
Step 1 Move the mouse over the title bar of the Highest Jitter portlet to view the icons.
Step 2 Click the Configuration icon.
Step 3 Select the Auto Refresh check box to auto refresh the portlet content at the set time.
Step 4 Select the minute and hour from the Refresh Every drop-down list to change the Refresh time. The items in the portlet get refreshed at the Refresh time you set.
Table 6-7 Highest Latency Portlet
Field Description
Collector Name Name of the collector.
Operation Type Lists the type of IPSLA operations.
Latency Time taken for an IP packet to arrive from the Source to Target and back.
6-12Monitoring and Troubleshooting with Cisco Prime LAN Management Solution 4.1
OL-24371-01
Chapter 6 Monitoring DashboardLowest Availability
Step 5 Select the number of collectors to be displayed from the No.of Collectors to be Displayed drop-down list.
For example, if you select 7, the details of seven collectors are displayed in the portlet.
Step 6 Click Save to view the configured portlet with the changed settings.
Table 6-8 lists the Highest Jitter portlet details.
Note You can click the value of the count of the SD Jitter or DS Jitter to view Real time Latency Graph details in IPSLA Monitoring function.
You can click the portlet name in the title bar to navigate directly to the corresponding page in the application.
Lowest AvailabilityChecks the reachability of the target device from the source router using the latency information. The availability is reported in percentage.
The Lowest Availability portlet measures the availability of services such as FTP, DHCP, HTTP, TCP Connect, RTP, DNS, ICMP, UDP, and DSLw on the target device.
The collectors are listed in ascending order of availability to help the administrator closely monitor the collectors with lowest availability.
To configure Lowest Availability:
Step 1 Move the mouse over the title bar of the Lowest Availability portlet to view the icons.
Step 2 Click the Configuration icon.
Step 3 Select the Auto Refresh check box to auto refresh the portlet content at the set time.
Step 4 Select the minute and hour from the Refresh Every drop-down list to change the Refresh time. The items in the portlet get refreshed at the Refresh time you set.
Step 5 Select the number of collectors to be displayed from the No.of Collectors to be Displayed drop-down list.
For example, if you select 7, the details of seven collectors are displayed in the portlet.
Step 6 Click Save to view the configured portlet with the changed settings.
Table 6-8 IPSLA Monitoring Highest Jitter Portlet Details
Field Description
Collector Name Name of the collector.
Operation Type Type of operation.
SD Jitter (Source Destination Jitter) Source destination jitter count.
DS Jitter (Destination Source Jitter) Destination source jitter count.
6-13Monitoring and Troubleshooting with Cisco Prime LAN Management Solution 4.1
OL-24371-01
Chapter 6 Monitoring DashboardIPSLA Availability
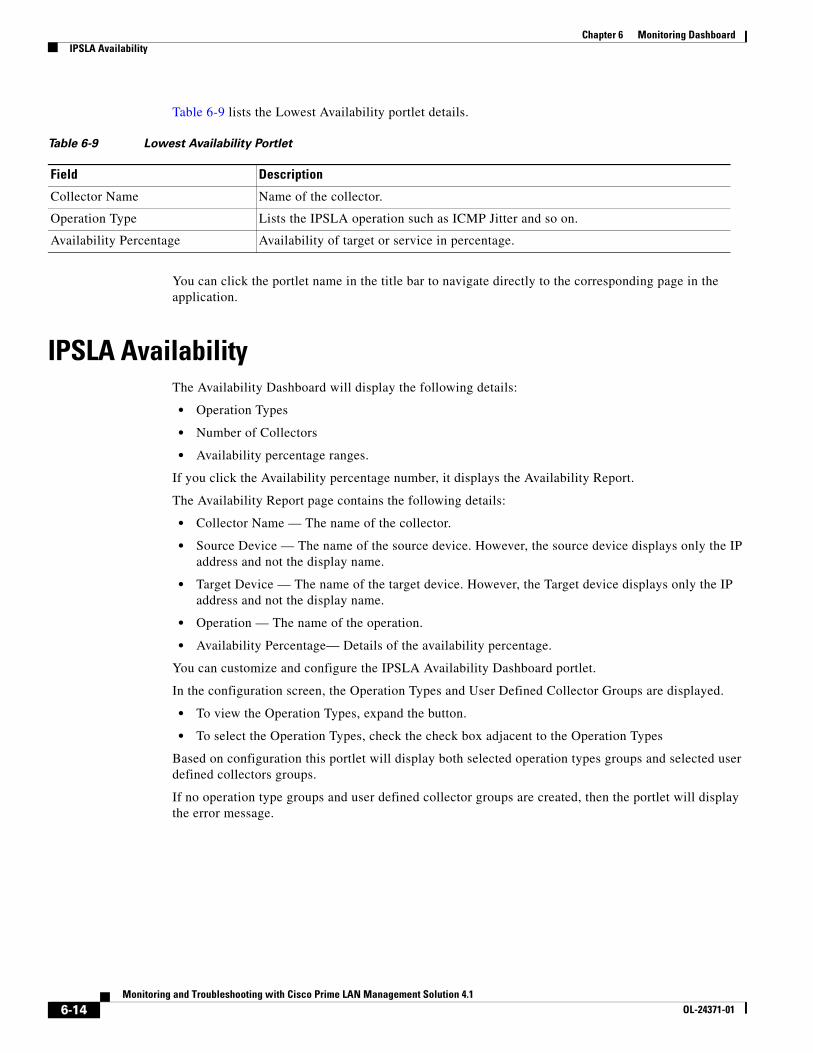
Table 6-9 lists the Lowest Availability portlet details.
You can click the portlet name in the title bar to navigate directly to the corresponding page in the application.
IPSLA Availability The Availability Dashboard will display the following details:
• Operation Types
• Number of Collectors
• Availability percentage ranges.
If you click the Availability percentage number, it displays the Availability Report.
The Availability Report page contains the following details:
• Collector Name — The name of the collector.
• Source Device — The name of the source device. However, the source device displays only the IP address and not the display name.
• Target Device — The name of the target device. However, the Target device displays only the IP address and not the display name.
• Operation — The name of the operation.
• Availability Percentage— Details of the availability percentage.
You can customize and configure the IPSLA Availability Dashboard portlet.
In the configuration screen, the Operation Types and User Defined Collector Groups are displayed.
• To view the Operation Types, expand the button.
• To select the Operation Types, check the check box adjacent to the Operation Types
Based on configuration this portlet will display both selected operation types groups and selected user defined collectors groups.
If no operation type groups and user defined collector groups are created, then the portlet will display the error message.
Table 6-9 Lowest Availability Portlet
Field Description
Collector Name Name of the collector.
Operation Type Lists the IPSLA operation such as ICMP Jitter and so on.
Availability Percentage Availability of target or service in percentage.
6-14Monitoring and Troubleshooting with Cisco Prime LAN Management Solution 4.1
OL-24371-01
Chapter 6 Monitoring DashboardCPU Utilization Summary Chart
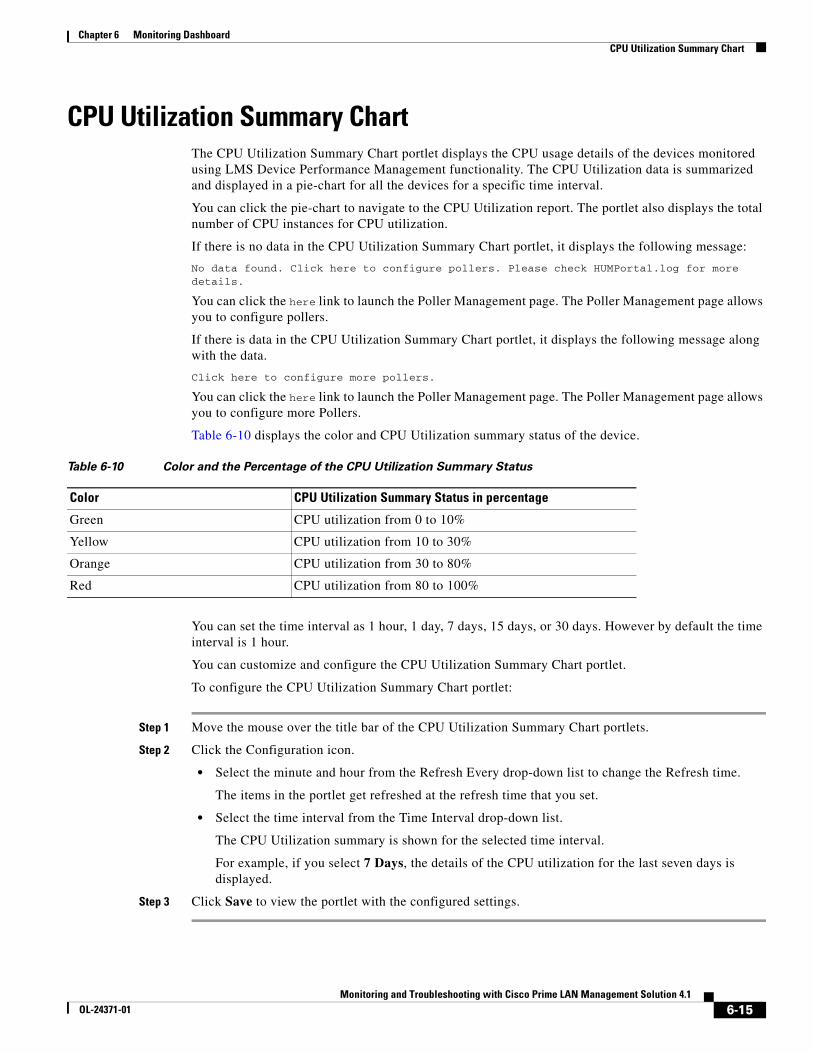
CPU Utilization Summary ChartThe CPU Utilization Summary Chart portlet displays the CPU usage details of the devices monitored using LMS Device Performance Management functionality. The CPU Utilization data is summarized and displayed in a pie-chart for all the devices for a specific time interval.
You can click the pie-chart to navigate to the CPU Utilization report. The portlet also displays the total number of CPU instances for CPU utilization.
If there is no data in the CPU Utilization Summary Chart portlet, it displays the following message:
No data found. Click here to configure pollers. Please check HUMPortal.log for more details.
You can click the here link to launch the Poller Management page. The Poller Management page allows you to configure pollers.
If there is data in the CPU Utilization Summary Chart portlet, it displays the following message along with the data.
Click here to configure more pollers.
You can click the here link to launch the Poller Management page. The Poller Management page allows you to configure more Pollers.
Table 6-10 displays the color and CPU Utilization summary status of the device.
You can set the time interval as 1 hour, 1 day, 7 days, 15 days, or 30 days. However by default the time interval is 1 hour.
You can customize and configure the CPU Utilization Summary Chart portlet.
To configure the CPU Utilization Summary Chart portlet:
Step 1 Move the mouse over the title bar of the CPU Utilization Summary Chart portlets.
Step 2 Click the Configuration icon.
• Select the minute and hour from the Refresh Every drop-down list to change the Refresh time.
The items in the portlet get refreshed at the refresh time that you set.
• Select the time interval from the Time Interval drop-down list.
The CPU Utilization summary is shown for the selected time interval.
For example, if you select 7 Days, the details of the CPU utilization for the last seven days is displayed.
Step 3 Click Save to view the portlet with the configured settings.
Table 6-10 Color and the Percentage of the CPU Utilization Summary Status
Color CPU Utilization Summary Status in percentage
Green CPU utilization from 0 to 10%
Yellow CPU utilization from 10 to 30%
Orange CPU utilization from 30 to 80%
Red CPU utilization from 80 to 100%
6-15Monitoring and Troubleshooting with Cisco Prime LAN Management Solution 4.1
OL-24371-01
Chapter 6 Monitoring DashboardCustom Top /Bottom N Records
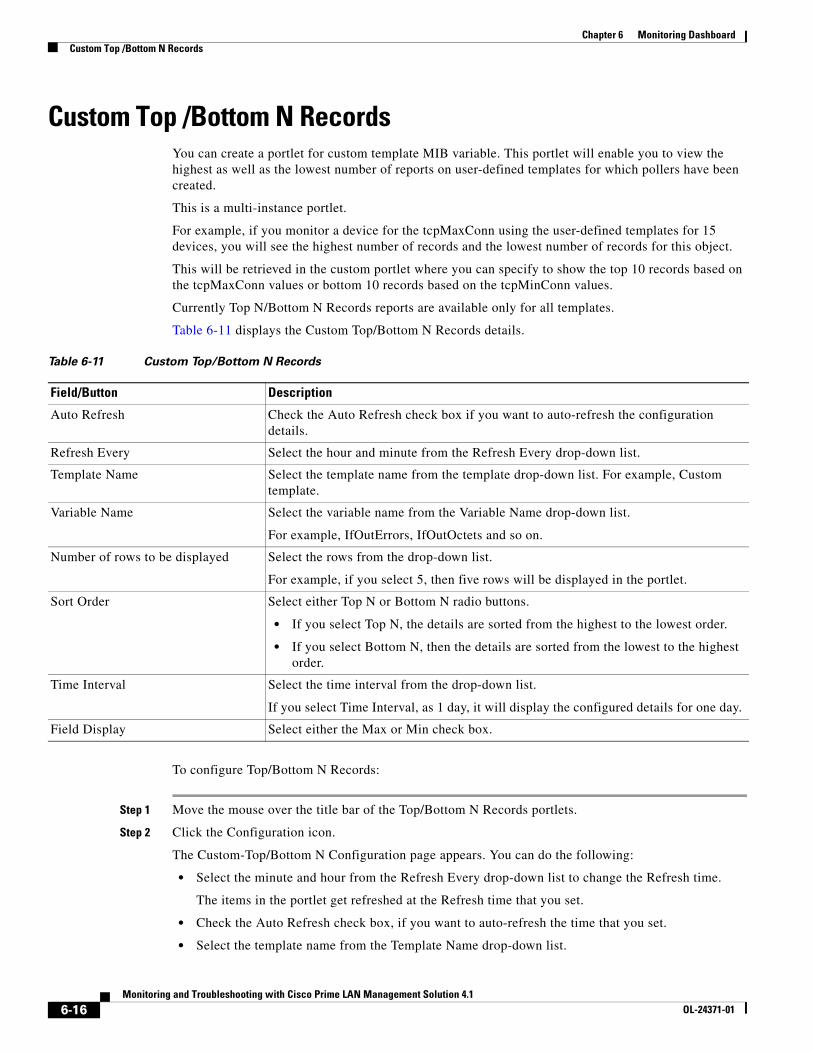
Custom Top /Bottom N RecordsYou can create a portlet for custom template MIB variable. This portlet will enable you to view the highest as well as the lowest number of reports on user-defined templates for which pollers have been created.
This is a multi-instance portlet.
For example, if you monitor a device for the tcpMaxConn using the user-defined templates for 15 devices, you will see the highest number of records and the lowest number of records for this object.
This will be retrieved in the custom portlet where you can specify to show the top 10 records based on the tcpMaxConn values or bottom 10 records based on the tcpMinConn values.
Currently Top N/Bottom N Records reports are available only for all templates.
Table 6-11 displays the Custom Top/Bottom N Records details.
To configure Top/Bottom N Records:
Step 1 Move the mouse over the title bar of the Top/Bottom N Records portlets.
Step 2 Click the Configuration icon.
The Custom-Top/Bottom N Configuration page appears. You can do the following:
• Select the minute and hour from the Refresh Every drop-down list to change the Refresh time.
The items in the portlet get refreshed at the Refresh time that you set.
• Check the Auto Refresh check box, if you want to auto-refresh the time that you set.
• Select the template name from the Template Name drop-down list.
Table 6-11 Custom Top/Bottom N Records
Field/Button Description
Auto Refresh Check the Auto Refresh check box if you want to auto-refresh the configuration details.
Refresh Every Select the hour and minute from the Refresh Every drop-down list.
Template Name Select the template name from the template drop-down list. For example, Custom template.
Variable Name Select the variable name from the Variable Name drop-down list.
For example, IfOutErrors, IfOutOctets and so on.
Number of rows to be displayed Select the rows from the drop-down list.
For example, if you select 5, then five rows will be displayed in the portlet.
Sort Order Select either Top N or Bottom N radio buttons.
• If you select Top N, the details are sorted from the highest to the lowest order.
• If you select Bottom N, then the details are sorted from the lowest to the highest order.
Time Interval Select the time interval from the drop-down list.
If you select Time Interval, as 1 day, it will display the configured details for one day.
Field Display Select either the Max or Min check box.
6-16Monitoring and Troubleshooting with Cisco Prime LAN Management Solution 4.1
OL-24371-01
Chapter 6 Monitoring DashboardDevice Availability
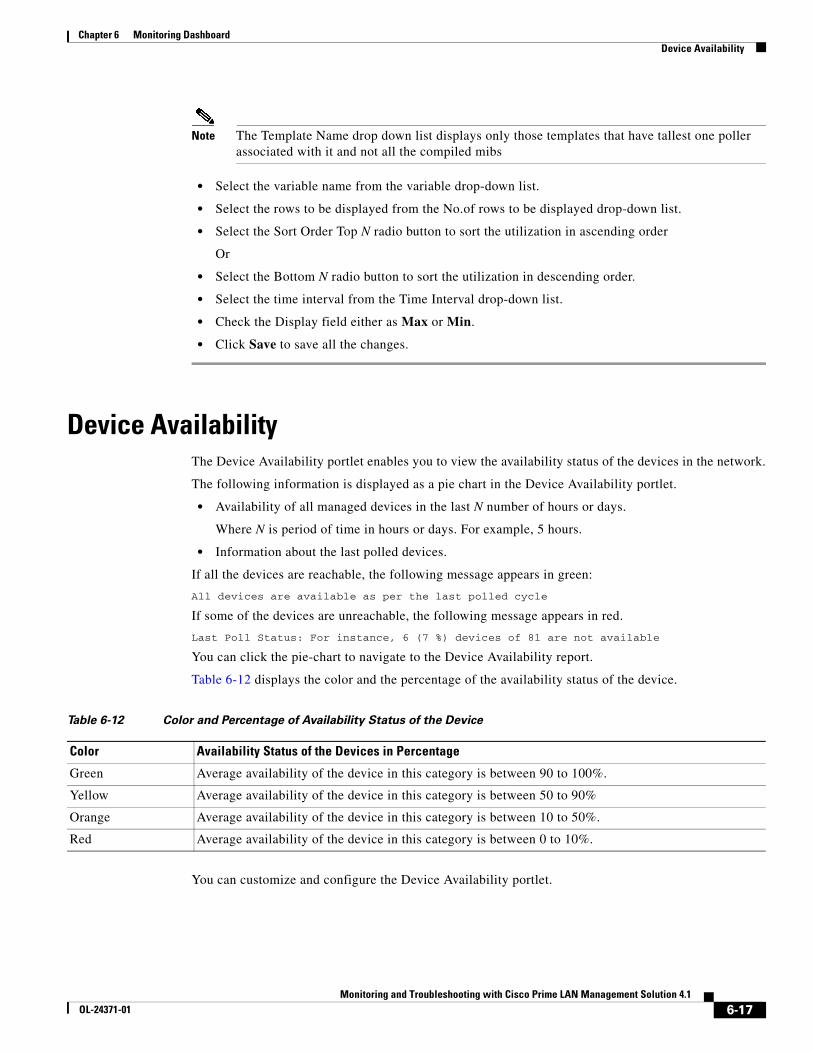
Note The Template Name drop down list displays only those templates that have tallest one poller associated with it and not all the compiled mibs
• Select the variable name from the variable drop-down list.
• Select the rows to be displayed from the No.of rows to be displayed drop-down list.
• Select the Sort Order Top N radio button to sort the utilization in ascending order
Or
• Select the Bottom N radio button to sort the utilization in descending order.
• Select the time interval from the Time Interval drop-down list.
• Check the Display field either as Max or Min.
• Click Save to save all the changes.
Device Availability The Device Availability portlet enables you to view the availability status of the devices in the network.
The following information is displayed as a pie chart in the Device Availability portlet.
• Availability of all managed devices in the last N number of hours or days.
Where N is period of time in hours or days. For example, 5 hours.
• Information about the last polled devices.
If all the devices are reachable, the following message appears in green:
All devices are available as per the last polled cycle
If some of the devices are unreachable, the following message appears in red.
Last Poll Status: For instance, 6 (7 %) devices of 81 are not available
You can click the pie-chart to navigate to the Device Availability report.
Table 6-12 displays the color and the percentage of the availability status of the device.
You can customize and configure the Device Availability portlet.
Table 6-12 Color and Percentage of Availability Status of the Device
Color Availability Status of the Devices in Percentage
Green Average availability of the device in this category is between 90 to 100%.
Yellow Average availability of the device in this category is between 50 to 90%
Orange Average availability of the device in this category is between 10 to 50%.
Red Average availability of the device in this category is between 0 to 10%.
6-17Monitoring and Troubleshooting with Cisco Prime LAN Management Solution 4.1
OL-24371-01
Chapter 6 Monitoring DashboardInterface Availability
To configure Device Availability portlet:
Step 1 Move the mouse over the title bar of the Device Availability portlets.
Step 2 Click the Configuration icon.
You can do any of the following:
• Select the minute and hour from the Refresh Every drop-down list to change the Refresh time.
The items in the portlet get refreshed at changed refresh time.
• Select the time interval from the Time Interval drop-down list.
The Device Availability details are shown for the selected time interval.
For example, if you select 7 Days, the details of the devices available for the last seven days will be displayed.
Step 3 Click Save to view the portlet with the configured settings.
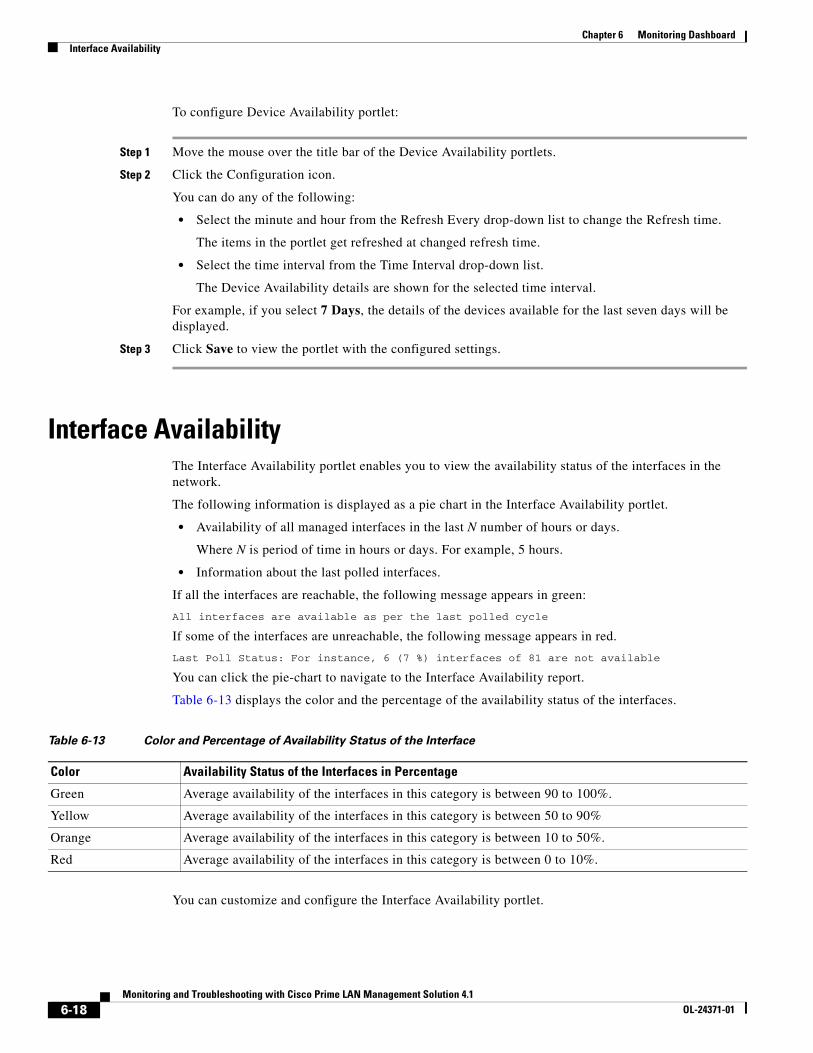
Interface Availability The Interface Availability portlet enables you to view the availability status of the interfaces in the network.
The following information is displayed as a pie chart in the Interface Availability portlet.
• Availability of all managed interfaces in the last N number of hours or days.
Where N is period of time in hours or days. For example, 5 hours.
• Information about the last polled interfaces.
If all the interfaces are reachable, the following message appears in green:
All interfaces are available as per the last polled cycle
If some of the interfaces are unreachable, the following message appears in red.
Last Poll Status: For instance, 6 (7 %) interfaces of 81 are not available
You can click the pie-chart to navigate to the Interface Availability report.
Table 6-13 displays the color and the percentage of the availability status of the interfaces.
You can customize and configure the Interface Availability portlet.
Table 6-13 Color and Percentage of Availability Status of the Interface
Color Availability Status of the Interfaces in Percentage
Green Average availability of the interfaces in this category is between 90 to 100%.
Yellow Average availability of the interfaces in this category is between 50 to 90%
Orange Average availability of the interfaces in this category is between 10 to 50%.
Red Average availability of the interfaces in this category is between 0 to 10%.
6-18Monitoring and Troubleshooting with Cisco Prime LAN Management Solution 4.1
OL-24371-01
Chapter 6 Monitoring DashboardHisto-Graph It
To configure Interface Availability portlet:
Step 1 Move the mouse over the title bar of the Interface Availability portlets.
Step 2 Click the Configuration icon.
You can do any of the following:
• Select the minute and hour from the Refresh Every drop-down list to change the Refresh time.
The items in the portlet get refreshed at changed refresh time.
• Select the time interval from the Time Interval drop-down list.
The Interface Availability details are shown for the selected time interval.
For example, if you select 7 Days, the details of the interfaces available for the last seven days will be displayed.
Step 3 Click Save to view the portlet with the configured settings.
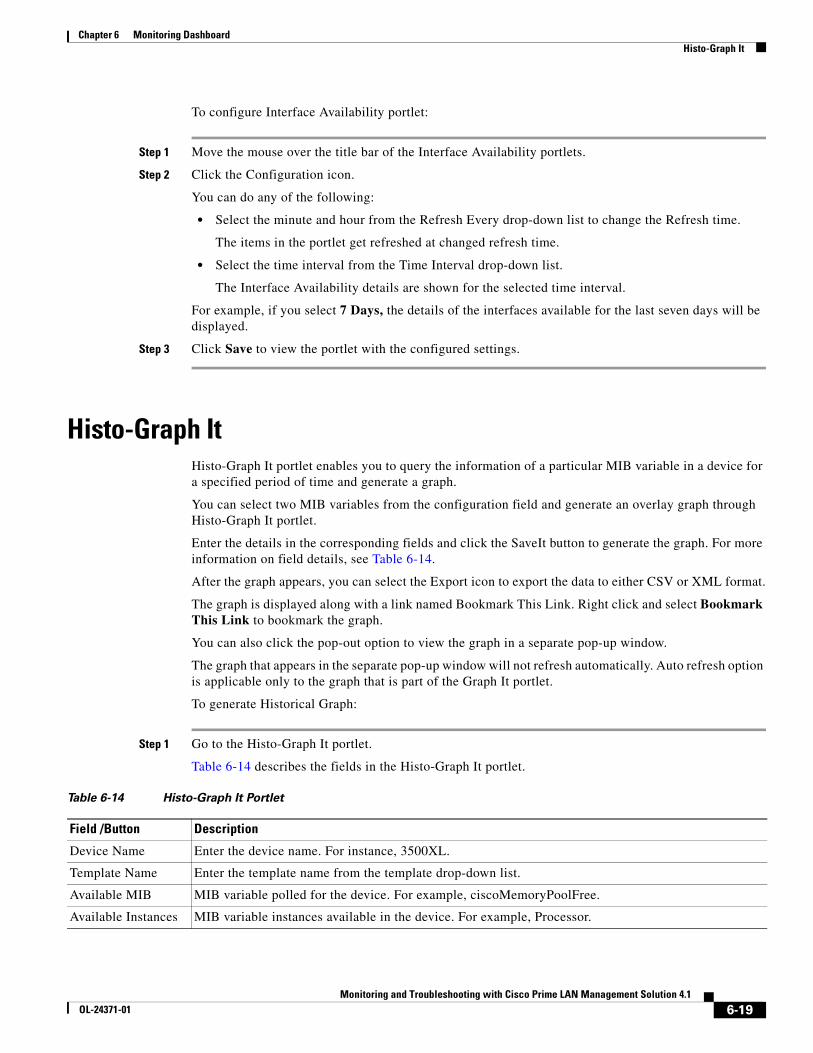
Histo-Graph It Histo-Graph It portlet enables you to query the information of a particular MIB variable in a device for a specified period of time and generate a graph.
You can select two MIB variables from the configuration field and generate an overlay graph through Histo-Graph It portlet.
Enter the details in the corresponding fields and click the SaveIt button to generate the graph. For more information on field details, see Table 6-14.
After the graph appears, you can select the Export icon to export the data to either CSV or XML format.
The graph is displayed along with a link named Bookmark This Link. Right click and select Bookmark This Link to bookmark the graph.
You can also click the pop-out option to view the graph in a separate pop-up window.
The graph that appears in the separate pop-up window will not refresh automatically. Auto refresh option is applicable only to the graph that is part of the Graph It portlet.
To generate Historical Graph:
Step 1 Go to the Histo-Graph It portlet.
Table 6-14 describes the fields in the Histo-Graph It portlet.
Table 6-14 Histo-Graph It Portlet
Field /Button Description
Device Name Enter the device name. For instance, 3500XL.
Template Name Enter the template name from the template drop-down list.
Available MIB MIB variable polled for the device. For example, ciscoMemoryPoolFree.
Available Instances MIB variable instances available in the device. For example, Processor.
6-19Monitoring and Troubleshooting with Cisco Prime LAN Management Solution 4.1
OL-24371-01
Chapter 6 Monitoring DashboardHisto-Graph It
Step 2 Enter a device name in the Device Name field.
The Available MIB drop-down list populates the list of MIB variables polled for the device and select a template from the list.
Step 3 Select a MIB variable from the Available MIB drop-down list.
The Available Instances drop-down list populates the list of MIB variable instances in the device.
Step 4 Select a MIB variable instance from the Available Instances drop-down list.
Step 5 Either:
• Select an interval from the Interval drop-down list.
Or
• Select the start date and end date from the respective fields.
The Date Picker is enabled only when you select Custom for the Interval.
Note After modifying the time (hh:mm) click the data again on the pop-up calendar to reflect the time change in the portlet.
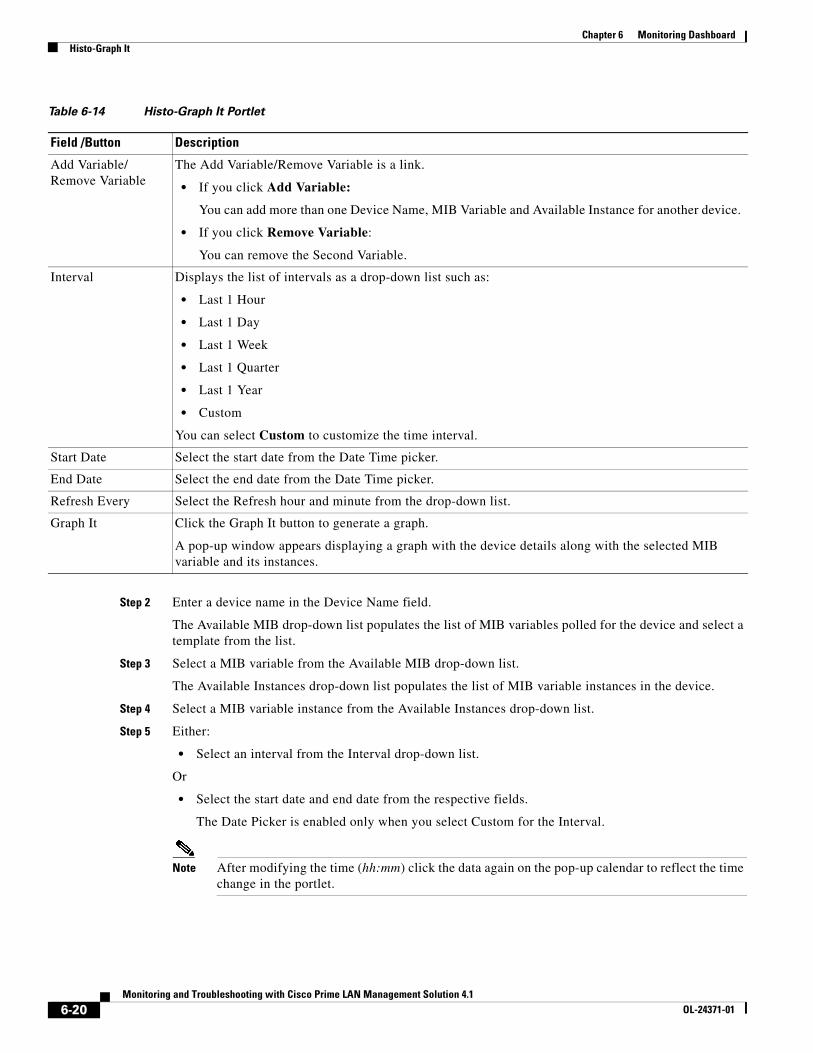
Add Variable/ Remove Variable
The Add Variable/Remove Variable is a link.
• If you click Add Variable:
You can add more than one Device Name, MIB Variable and Available Instance for another device.
• If you click Remove Variable:
You can remove the Second Variable.
Interval Displays the list of intervals as a drop-down list such as:
• Last 1 Hour
• Last 1 Day
• Last 1 Week
• Last 1 Quarter
• Last 1 Year
• Custom
You can select Custom to customize the time interval.
Start Date Select the start date from the Date Time picker.
End Date Select the end date from the Date Time picker.
Refresh Every Select the Refresh hour and minute from the drop-down list.
Graph It Click the Graph It button to generate a graph.
A pop-up window appears displaying a graph with the device details along with the selected MIB variable and its instances.
Table 6-14 Histo-Graph It Portlet
Field /Button Description
6-20Monitoring and Troubleshooting with Cisco Prime LAN Management Solution 4.1
OL-24371-01
Chapter 6 Monitoring DashboardLive Graph-It
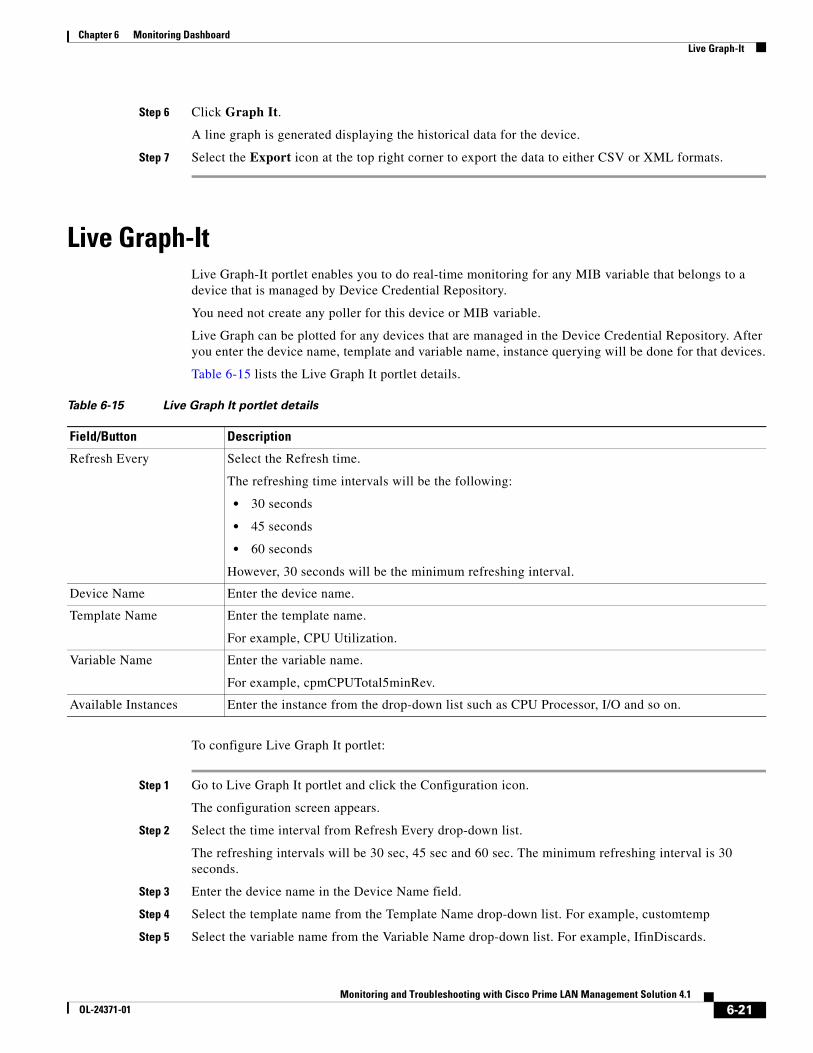
Step 6 Click Graph It.
A line graph is generated displaying the historical data for the device.
Step 7 Select the Export icon at the top right corner to export the data to either CSV or XML formats.
Live Graph-It Live Graph-It portlet enables you to do real-time monitoring for any MIB variable that belongs to a device that is managed by Device Credential Repository.
You need not create any poller for this device or MIB variable.
Live Graph can be plotted for any devices that are managed in the Device Credential Repository. After you enter the device name, template and variable name, instance querying will be done for that devices.
Table 6-15 lists the Live Graph It portlet details.
To configure Live Graph It portlet:
Step 1 Go to Live Graph It portlet and click the Configuration icon.
The configuration screen appears.
Step 2 Select the time interval from Refresh Every drop-down list.
The refreshing intervals will be 30 sec, 45 sec and 60 sec. The minimum refreshing interval is 30 seconds.
Step 3 Enter the device name in the Device Name field.
Step 4 Select the template name from the Template Name drop-down list. For example, customtemp
Step 5 Select the variable name from the Variable Name drop-down list. For example, IfinDiscards.
Table 6-15 Live Graph It portlet details
Field/Button Description
Refresh Every Select the Refresh time.
The refreshing time intervals will be the following:
• 30 seconds
• 45 seconds
• 60 seconds
However, 30 seconds will be the minimum refreshing interval.
Device Name Enter the device name.
Template Name Enter the template name.
For example, CPU Utilization.
Variable Name Enter the variable name.
For example, cpmCPUTotal5minRev.
Available Instances Enter the instance from the drop-down list such as CPU Processor, I/O and so on.
6-21Monitoring and Troubleshooting with Cisco Prime LAN Management Solution 4.1
OL-24371-01
Chapter 6 Monitoring DashboardTOP-N Interface Discards
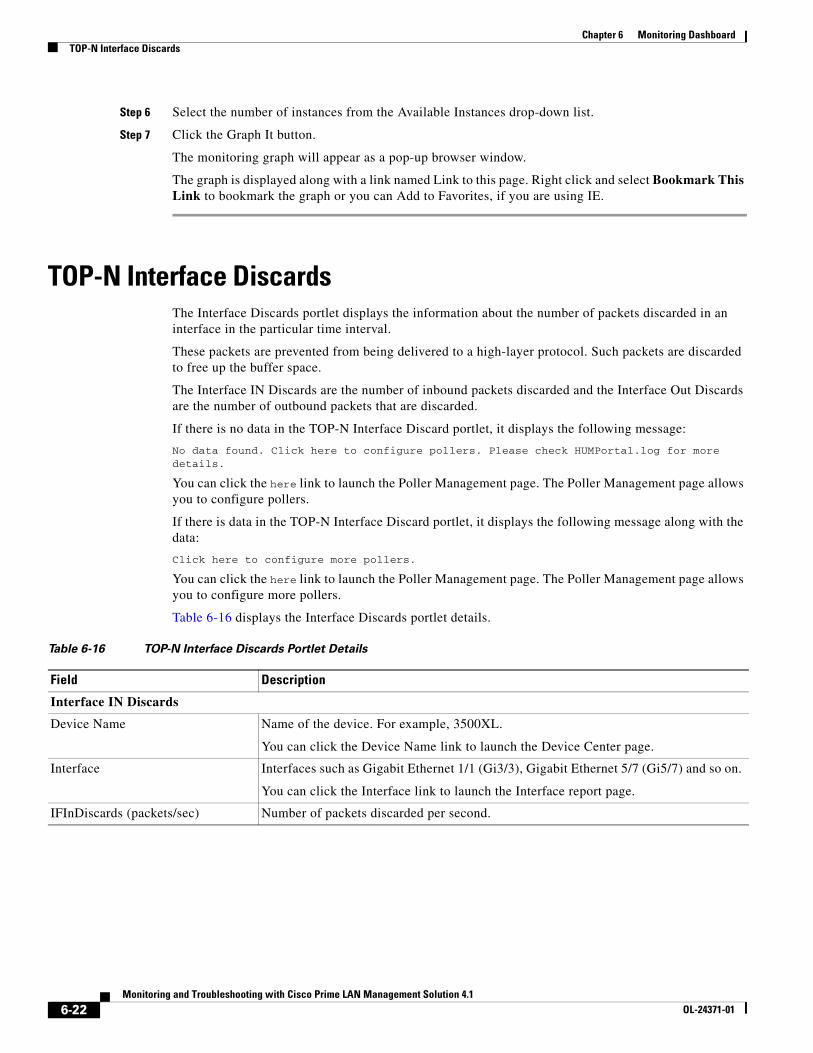
Step 6 Select the number of instances from the Available Instances drop-down list.
Step 7 Click the Graph It button.
The monitoring graph will appear as a pop-up browser window.
The graph is displayed along with a link named Link to this page. Right click and select Bookmark This Link to bookmark the graph or you can Add to Favorites, if you are using IE.
TOP-N Interface DiscardsThe Interface Discards portlet displays the information about the number of packets discarded in an interface in the particular time interval.
These packets are prevented from being delivered to a high-layer protocol. Such packets are discarded to free up the buffer space.
The Interface IN Discards are the number of inbound packets discarded and the Interface Out Discards are the number of outbound packets that are discarded.
If there is no data in the TOP-N Interface Discard portlet, it displays the following message:
No data found. Click here to configure pollers. Please check HUMPortal.log for more details.
You can click the here link to launch the Poller Management page. The Poller Management page allows you to configure pollers.
If there is data in the TOP-N Interface Discard portlet, it displays the following message along with the data:
Click here to configure more pollers.
You can click the here link to launch the Poller Management page. The Poller Management page allows you to configure more pollers.
Table 6-16 displays the Interface Discards portlet details.
Table 6-16 TOP-N Interface Discards Portlet Details
Field Description
Interface IN Discards
Device Name Name of the device. For example, 3500XL.
You can click the Device Name link to launch the Device Center page.
Interface Interfaces such as Gigabit Ethernet 1/1 (Gi3/3), Gigabit Ethernet 5/7 (Gi5/7) and so on.
You can click the Interface link to launch the Interface report page.
IFInDiscards (packets/sec) Number of packets discarded per second.
6-22Monitoring and Troubleshooting with Cisco Prime LAN Management Solution 4.1
OL-24371-01
Chapter 6 Monitoring DashboardTOP-N Interface Errors
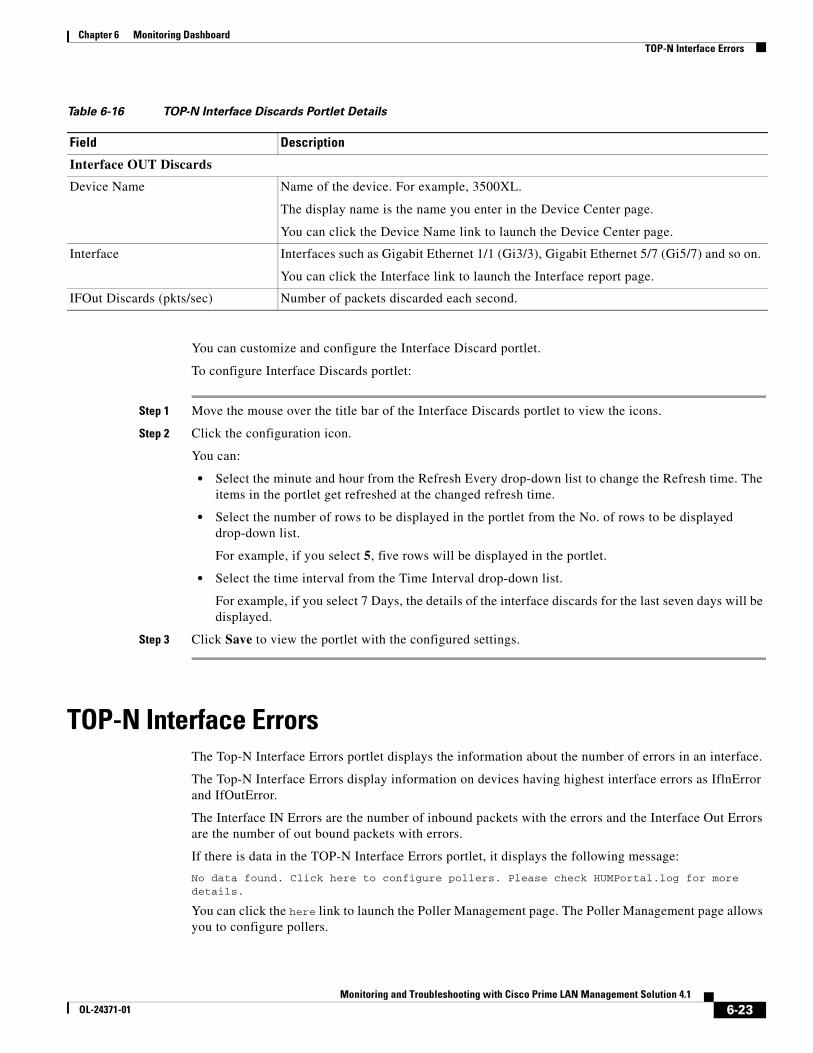
You can customize and configure the Interface Discard portlet.
To configure Interface Discards portlet:
Step 1 Move the mouse over the title bar of the Interface Discards portlet to view the icons.
Step 2 Click the configuration icon.
You can:
• Select the minute and hour from the Refresh Every drop-down list to change the Refresh time. The items in the portlet get refreshed at the changed refresh time.
• Select the number of rows to be displayed in the portlet from the No. of rows to be displayed drop-down list.
For example, if you select 5, five rows will be displayed in the portlet.
• Select the time interval from the Time Interval drop-down list.
For example, if you select 7 Days, the details of the interface discards for the last seven days will be displayed.
Step 3 Click Save to view the portlet with the configured settings.
TOP-N Interface Errors The Top-N Interface Errors portlet displays the information about the number of errors in an interface.
The Top-N Interface Errors display information on devices having highest interface errors as IflnError and IfOutError.
The Interface IN Errors are the number of inbound packets with the errors and the Interface Out Errors are the number of out bound packets with errors.
If there is data in the TOP-N Interface Errors portlet, it displays the following message:
No data found. Click here to configure pollers. Please check HUMPortal.log for more details.
You can click the here link to launch the Poller Management page. The Poller Management page allows you to configure pollers.
Interface OUT Discards
Device Name Name of the device. For example, 3500XL.
The display name is the name you enter in the Device Center page.
You can click the Device Name link to launch the Device Center page.
Interface Interfaces such as Gigabit Ethernet 1/1 (Gi3/3), Gigabit Ethernet 5/7 (Gi5/7) and so on.
You can click the Interface link to launch the Interface report page.
IFOut Discards (pkts/sec) Number of packets discarded each second.
Table 6-16 TOP-N Interface Discards Portlet Details
Field Description
6-23Monitoring and Troubleshooting with Cisco Prime LAN Management Solution 4.1
OL-24371-01
Chapter 6 Monitoring DashboardTOP-N Interface Errors
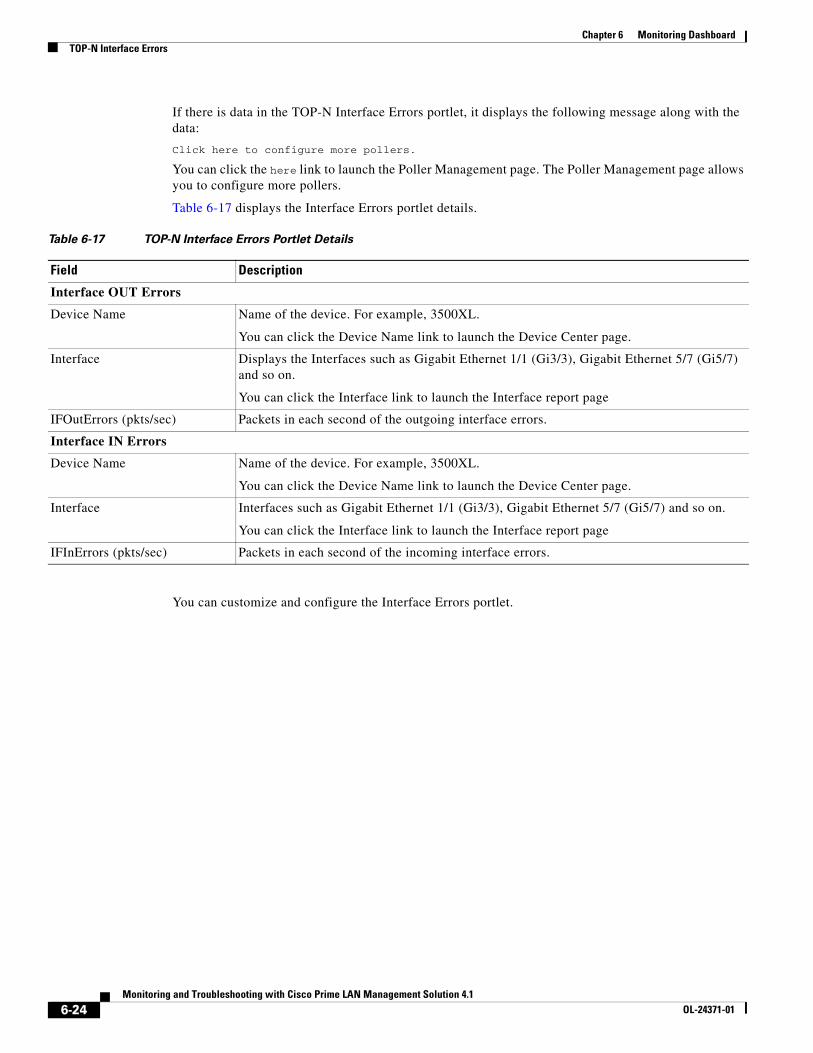
If there is data in the TOP-N Interface Errors portlet, it displays the following message along with the data:
Click here to configure more pollers.
You can click the here link to launch the Poller Management page. The Poller Management page allows you to configure more pollers.
Table 6-17 displays the Interface Errors portlet details.
You can customize and configure the Interface Errors portlet.
Table 6-17 TOP-N Interface Errors Portlet Details
Field Description
Interface OUT Errors
Device Name Name of the device. For example, 3500XL.
You can click the Device Name link to launch the Device Center page.
Interface Displays the Interfaces such as Gigabit Ethernet 1/1 (Gi3/3), Gigabit Ethernet 5/7 (Gi5/7) and so on.
You can click the Interface link to launch the Interface report page
IFOutErrors (pkts/sec) Packets in each second of the outgoing interface errors.
Interface IN Errors
Device Name Name of the device. For example, 3500XL.
You can click the Device Name link to launch the Device Center page.
Interface Interfaces such as Gigabit Ethernet 1/1 (Gi3/3), Gigabit Ethernet 5/7 (Gi5/7) and so on.
You can click the Interface link to launch the Interface report page
IFInErrors (pkts/sec) Packets in each second of the incoming interface errors.
6-24Monitoring and Troubleshooting with Cisco Prime LAN Management Solution 4.1
OL-24371-01
Chapter 6 Monitoring DashboardTOP-N Interface Utilization
To configure Interface Errors portlet:
Step 1 Move the mouse over the title bar of the Interface Errors portlet to view the icons.
Step 2 Click the configuration icon.
You can:
• Select the minute and hour from the Refresh Every drop-down list to change the Refresh time. The items in the portlet get refreshed at the changed refresh time that you set.
• Select the number of rows to be displayed in the portlet from the No. of rows to be displayed drop-down list.
For example, if you select 10, then ten rows will be displayed in the portlet.
• Select the time interval from the Time Interval drop-down list.
For example, if you select 7 Days, the Interface Errors for the last seven days will be displayed.
Step 3 Click Save to view the portlet with the configured settings.
TOP-N Interface UtilizationThe Interface Utilization portlet displays information on the devices with the highest and lowest utilization based on the configuration.
If there are no data in the TOP-N Interface Utilization portlet, it displays the following message:
No data found. Click here to configure pollers. Please check HUMPortal.log for more details.
You can click the here link to launch the Poller Management page. The Poller Management page allows you to configure pollers.
If there is data in the TOP-N Interface Utilization portlet, it displays the following message along with the data:
Click here to configure more pollers.
You can click the here link to launch the Poller Management page. The Poller Management page allows you to configure more pollers.
Table 6-18 displays the Interface Utilization portlet details:
Table 6-18 TOP-N Interface Utilization Portlet Details
Field Description
Device Name Name of the device. For example, 3500XL.
You can click the Device Name link to launch the Device Center page.
Interface Interfaces such as Gigabit Ethernet 1/1 (Gi3/3), Gigabit Ethernet 5/7 (Gi5/7) and so on.
You can click the Interface link to launch the Interface report page
Tx% Percentage of transmitted utilization.
Rx% Percentage of received utilization.
6-25Monitoring and Troubleshooting with Cisco Prime LAN Management Solution 4.1
OL-24371-01
Chapter 6 Monitoring DashboardTOP-N Interface Utilization
The Top N calculations and sorting will be done based on the sum of the percentage of the packets transmitted (Tx%) and the percentage of the packets received (Rx%).
Table 6-19 displays the color and the percentage of transmitted packets.
Table 6-20 displays the color and the percentage of the received packets.
You can configure and customize the Interface Utilization portlet.
To configure Interface Utilization portlet:
Step 1 Move the mouse over the title bar of the Interface Utilization portlet to view the icons.
Step 2 Click the configuration icon.
You can:
• Select the minute and hour from the Refresh Every drop-down list to change the Refresh time. The items in the portlet get refreshed at the changed refresh time that you set.
• Select the number of rows to be displayed in the portlet from the No. of rows to be displayed drop-down list.
For example, if you select five, then five rows will be displayed in the portlet.
• Select the Sort Order Top N radio button to sort the utilization in ascending order or Bottom N radio button to sort the utilization in descending order.
• Select the time interval from the Time Interval drop-down list.
For example, if you select 7 Days, the details of the Interface Utilization for the last seven days will be displayed.
Step 3 Click Save to view the portlet with the configured settings.
Table 6-19 Color and the Percentage of Packets Transmitted
Color Percentage of Packets Transmitted (Tx%)
Green Transmitted packets from 0 to 50%.
Yellow Transmitted packets from 50 to 70%
Orange Transmitted packets from 70 to 90%
Red Transmitted packets from 90 to100%
Table 6-20 Color and the Percentage of Packets Received
Color Percentage of Packets Received (Rx%)
Green Received packets from 0 to 50%
Yellow Received packets from 50 to 70%
Orange Received packets from 70 to 90%
Red Received packets from 90 to 100%
6-26Monitoring and Troubleshooting with Cisco Prime LAN Management Solution 4.1
OL-24371-01
Chapter 6 Monitoring DashboardTOP-N Memory Utilization
TOP-N Memory UtilizationThe Memory Utilization portlet displays information about the memory usage of all devices.
It also displays the device name, instance name and the percentage of minimum, maximum and average memory utilized.
No data found. Click here to configure pollers. Please check HUMPortal.log for more details.
You can click the here link to launch the Poller Management page. The Poller Management page allows you to configure pollers.
If there is data in the TOP-N Memory Utilization portlet, it displays the following message along with the data:
Click here to configure more pollers.
You can click the here link to launch the Poller Management page. The Poller Management page allows you to configure more pollers.
Table 6-21 displays the color and the percentage of the memory utilization of the device.
Note The Avg % is displayed by default in the portlet. However, the Max% and Min % have to be configured to view it in the portlet.
Table 6-22 displays the Memory Utilization portlets
You can configure and customize the Memory Utilization portlet.
Table 6-21 Color and Memory Utilization of the Device
Color Memory Utilization of the Device in Percentage
Green Memory utilization of the device from 0 to 50%
Yellow Memory utilization of the device from 50 to 70%
Orange Memory utilization of the device from 70 to 90%
Red Memory utilization of the device from 90 to 100%
Table 6-22 TOP-N Memory Utilization Portlet Details
Field Description
Device Name Name of the device. For example, 3500XL.
You can click the Device Name link to launch the Device Center page.
Instance Name Instance name such as DRAM, FLASH, MALLOC, Processor and so on.
MIN (%) Percentage of the minimum memory utilized by the device.
MAX% Percentage of the maximum memory utilized by the device.
AVG % Percentage of average memory utilized by the device.
6-27Monitoring and Troubleshooting with Cisco Prime LAN Management Solution 4.1
OL-24371-01
Chapter 6 Monitoring DashboardTOP-N-POE Utilization
To configure Memory Utilization portlet:
Step 1 Move the mouse over the title bar of the Memory Utilization portlet to view the icons.
Step 2 Click the configuration icon. You can:
• Select the minute and hour from the Refresh Every drop-down list to change the Refresh time. The items in the portlet get refreshed at the changed refresh time that you set.
• Select the number of rows to be displayed in the portlet from the No. of rows to be displayed drop-down list.
For example, if you select 5, then five rows will be displayed in the portlet.
• Select the Max or Min check box to display both the maximum or minimum field in the portlet.
• Select the Time interval from the Time Interval drop-down list.
For example, if you select 1 Hour, then the memory utilization for the last one hour will be displayed.
Step 3 Click Save to view the portlet with the configured settings.
TOP-N-POE Utilization The power utilization summary of network devices is displayed as PSE wise and port wise components in the TOP-N-POE Utilization portlet.
In this portlet you can configure components, such as PSE-wise summary and port-wise summary.
This portlet also displays the minimum, maximum and average power utilization of network devices in the LMS.
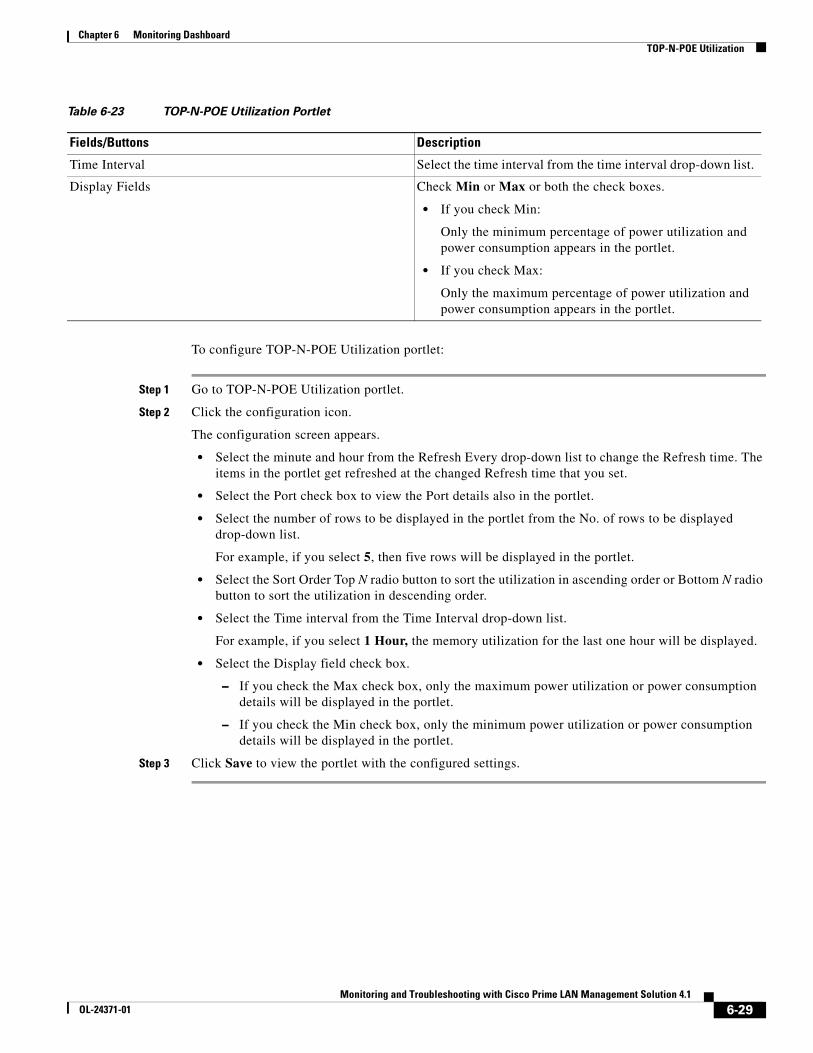
Table 6-23 TOP-N-POE Utilization Portlet
Fields/Buttons Description
Auto Refresh Check the Auto Refresh check box for the data to be refreshed at the given interval.
Refresh Every Select the hour and minute from the Refresh Every drop-down list.
Report By default, the PSE reports appear. However, you can check Port to view the details.
No.of Reports to be displayed Select the number of reports to be displayed in the portlet from the drop down list.
Sort Order Select either Top N or Bottom N radio button.
• Select Top N radio button to sort the utilization in ascending order.
• Select Bottom N radio button to sort the utilization in descending order.
6-28Monitoring and Troubleshooting with Cisco Prime LAN Management Solution 4.1
OL-24371-01
Chapter 6 Monitoring DashboardTOP-N-POE Utilization
To configure TOP-N-POE Utilization portlet:
Step 1 Go to TOP-N-POE Utilization portlet.
Step 2 Click the configuration icon.
The configuration screen appears.
• Select the minute and hour from the Refresh Every drop-down list to change the Refresh time. The items in the portlet get refreshed at the changed Refresh time that you set.
• Select the Port check box to view the Port details also in the portlet.
• Select the number of rows to be displayed in the portlet from the No. of rows to be displayed drop-down list.
For example, if you select 5, then five rows will be displayed in the portlet.
• Select the Sort Order Top N radio button to sort the utilization in ascending order or Bottom N radio button to sort the utilization in descending order.
• Select the Time interval from the Time Interval drop-down list.
For example, if you select 1 Hour, the memory utilization for the last one hour will be displayed.
• Select the Display field check box.
– If you check the Max check box, only the maximum power utilization or power consumption details will be displayed in the portlet.
– If you check the Min check box, only the minimum power utilization or power consumption details will be displayed in the portlet.
Step 3 Click Save to view the portlet with the configured settings.
Time Interval Select the time interval from the time interval drop-down list.
Display Fields Check Min or Max or both the check boxes.
• If you check Min:
Only the minimum percentage of power utilization and power consumption appears in the portlet.
• If you check Max:
Only the maximum percentage of power utilization and power consumption appears in the portlet.
Table 6-23 TOP-N-POE Utilization Portlet
Fields/Buttons Description
6-29Monitoring and Troubleshooting with Cisco Prime LAN Management Solution 4.1
OL-24371-01
Chapter 6 Monitoring DashboardTOP-N CPU Utilization
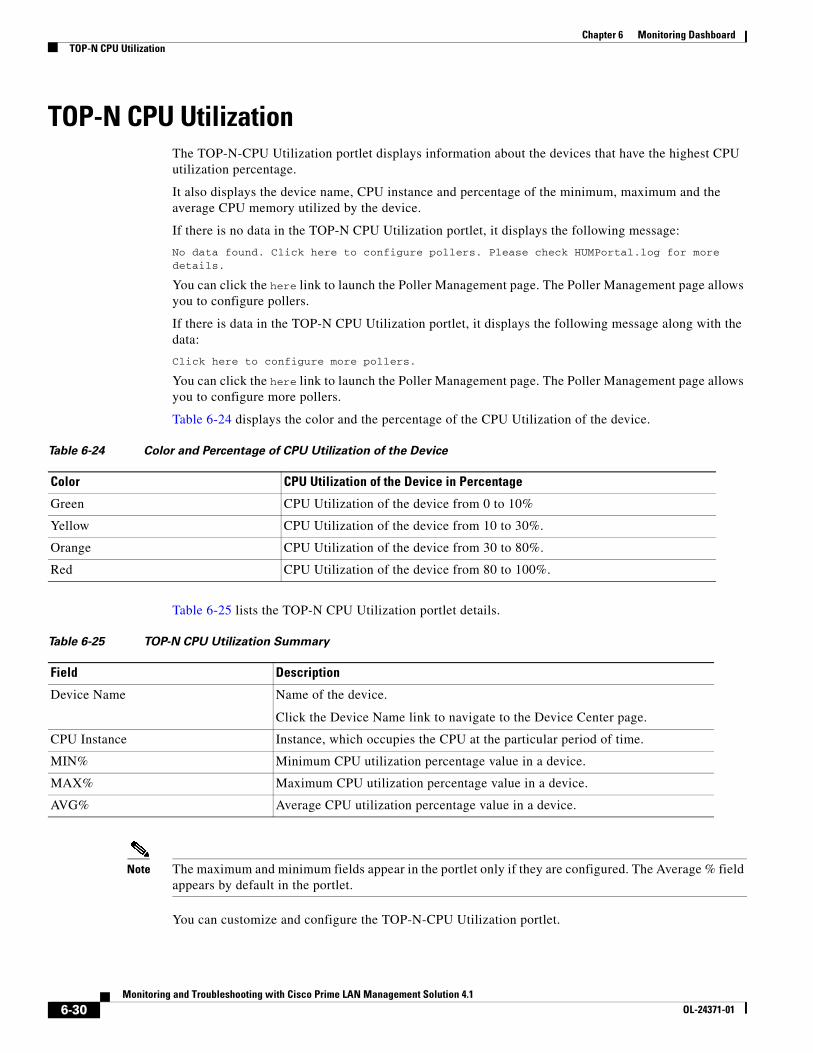
TOP-N CPU UtilizationThe TOP-N-CPU Utilization portlet displays information about the devices that have the highest CPU utilization percentage.
It also displays the device name, CPU instance and percentage of the minimum, maximum and the average CPU memory utilized by the device.
If there is no data in the TOP-N CPU Utilization portlet, it displays the following message:
No data found. Click here to configure pollers. Please check HUMPortal.log for more details.
You can click the here link to launch the Poller Management page. The Poller Management page allows you to configure pollers.
If there is data in the TOP-N CPU Utilization portlet, it displays the following message along with the data:
Click here to configure more pollers.
You can click the here link to launch the Poller Management page. The Poller Management page allows you to configure more pollers.
Table 6-24 displays the color and the percentage of the CPU Utilization of the device.
Table 6-25 lists the TOP-N CPU Utilization portlet details.
Note The maximum and minimum fields appear in the portlet only if they are configured. The Average % field appears by default in the portlet.
You can customize and configure the TOP-N-CPU Utilization portlet.
Table 6-24 Color and Percentage of CPU Utilization of the Device
Color CPU Utilization of the Device in Percentage
Green CPU Utilization of the device from 0 to 10%
Yellow CPU Utilization of the device from 10 to 30%.
Orange CPU Utilization of the device from 30 to 80%.
Red CPU Utilization of the device from 80 to 100%.
Table 6-25 TOP-N CPU Utilization Summary
Field Description
Device Name Name of the device.
Click the Device Name link to navigate to the Device Center page.
CPU Instance Instance, which occupies the CPU at the particular period of time.
MIN% Minimum CPU utilization percentage value in a device.
MAX% Maximum CPU utilization percentage value in a device.
AVG% Average CPU utilization percentage value in a device.
6-30Monitoring and Troubleshooting with Cisco Prime LAN Management Solution 4.1
OL-24371-01
Chapter 6 Monitoring DashboardPerformance Threshold Information
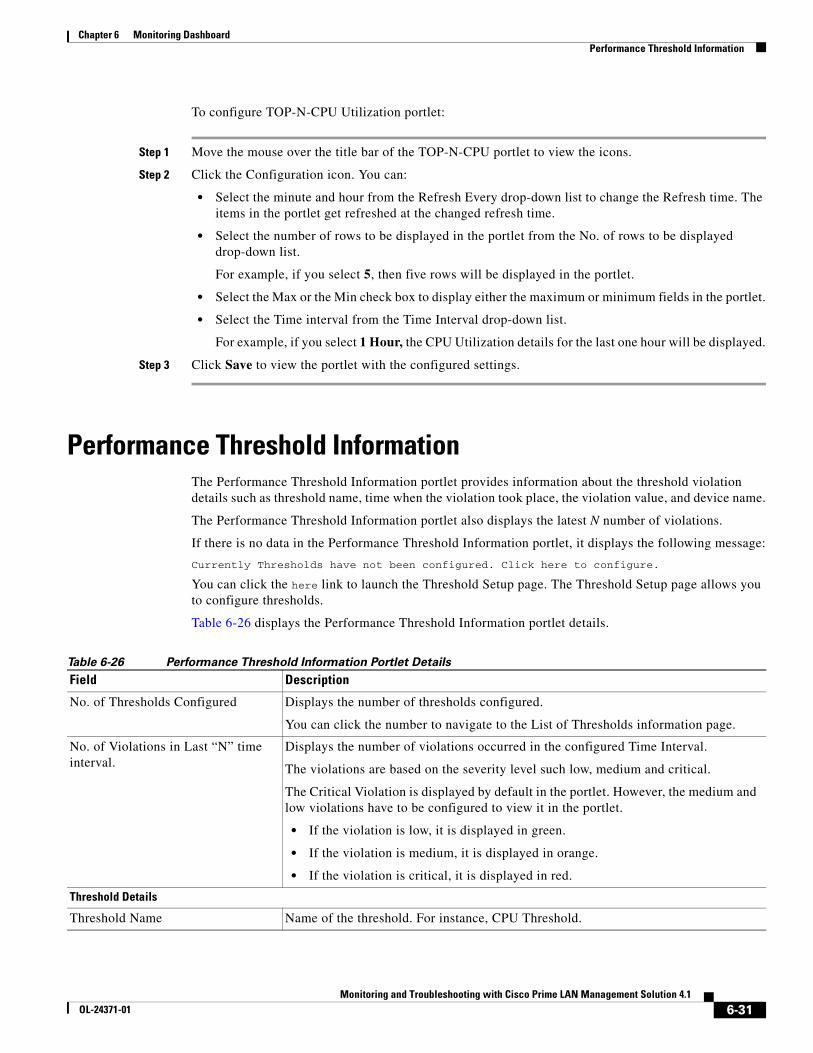
To configure TOP-N-CPU Utilization portlet:
Step 1 Move the mouse over the title bar of the TOP-N-CPU portlet to view the icons.
Step 2 Click the Configuration icon. You can:
• Select the minute and hour from the Refresh Every drop-down list to change the Refresh time. The items in the portlet get refreshed at the changed refresh time.
• Select the number of rows to be displayed in the portlet from the No. of rows to be displayed drop-down list.
For example, if you select 5, then five rows will be displayed in the portlet.
• Select the Max or the Min check box to display either the maximum or minimum fields in the portlet.
• Select the Time interval from the Time Interval drop-down list.
For example, if you select 1 Hour, the CPU Utilization details for the last one hour will be displayed.
Step 3 Click Save to view the portlet with the configured settings.
Performance Threshold InformationThe Performance Threshold Information portlet provides information about the threshold violation details such as threshold name, time when the violation took place, the violation value, and device name.
The Performance Threshold Information portlet also displays the latest N number of violations.
If there is no data in the Performance Threshold Information portlet, it displays the following message:
Currently Thresholds have not been configured. Click here to configure.
You can click the here link to launch the Threshold Setup page. The Threshold Setup page allows you to configure thresholds.
Table 6-26 displays the Performance Threshold Information portlet details.
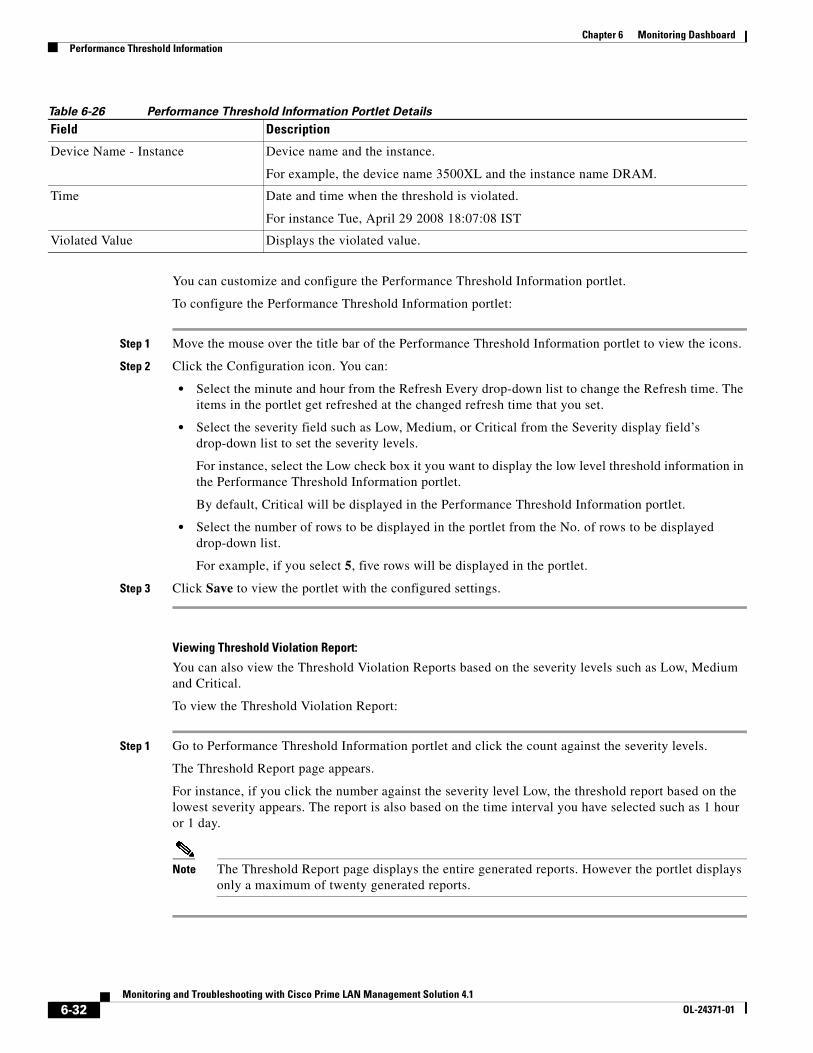
Table 6-26 Performance Threshold Information Portlet Details
Field Description
No. of Thresholds Configured Displays the number of thresholds configured.
You can click the number to navigate to the List of Thresholds information page.
No. of Violations in Last “N” time interval.
Displays the number of violations occurred in the configured Time Interval.
The violations are based on the severity level such low, medium and critical.
The Critical Violation is displayed by default in the portlet. However, the medium and low violations have to be configured to view it in the portlet.
• If the violation is low, it is displayed in green.
• If the violation is medium, it is displayed in orange.
• If the violation is critical, it is displayed in red.
Threshold Details
Threshold Name Name of the threshold. For instance, CPU Threshold.
6-31Monitoring and Troubleshooting with Cisco Prime LAN Management Solution 4.1
OL-24371-01
Chapter 6 Monitoring DashboardPerformance Threshold Information
You can customize and configure the Performance Threshold Information portlet.
To configure the Performance Threshold Information portlet:
Step 1 Move the mouse over the title bar of the Performance Threshold Information portlet to view the icons.
Step 2 Click the Configuration icon. You can:
• Select the minute and hour from the Refresh Every drop-down list to change the Refresh time. The items in the portlet get refreshed at the changed refresh time that you set.
• Select the severity field such as Low, Medium, or Critical from the Severity display field’s drop-down list to set the severity levels.
For instance, select the Low check box it you want to display the low level threshold information in the Performance Threshold Information portlet.
By default, Critical will be displayed in the Performance Threshold Information portlet.
• Select the number of rows to be displayed in the portlet from the No. of rows to be displayed drop-down list.
For example, if you select 5, five rows will be displayed in the portlet.
Step 3 Click Save to view the portlet with the configured settings.
Viewing Threshold Violation Report:
You can also view the Threshold Violation Reports based on the severity levels such as Low, Medium and Critical.
To view the Threshold Violation Report:
Step 1 Go to Performance Threshold Information portlet and click the count against the severity levels.
The Threshold Report page appears.
For instance, if you click the number against the severity level Low, the threshold report based on the lowest severity appears. The report is also based on the time interval you have selected such as 1 hour or 1 day.
Note The Threshold Report page displays the entire generated reports. However the portlet displays only a maximum of twenty generated reports.
Device Name - Instance Device name and the instance.
For example, the device name 3500XL and the instance name DRAM.
Time Date and time when the threshold is violated.
For instance Tue, April 29 2008 18:07:08 IST
Violated Value Displays the violated value.
Table 6-26 Performance Threshold Information Portlet Details
Field Description
6-32Monitoring and Troubleshooting with Cisco Prime LAN Management Solution 4.1
OL-24371-01
Chapter 6 Monitoring DashboardPerformance TrendWatch Information
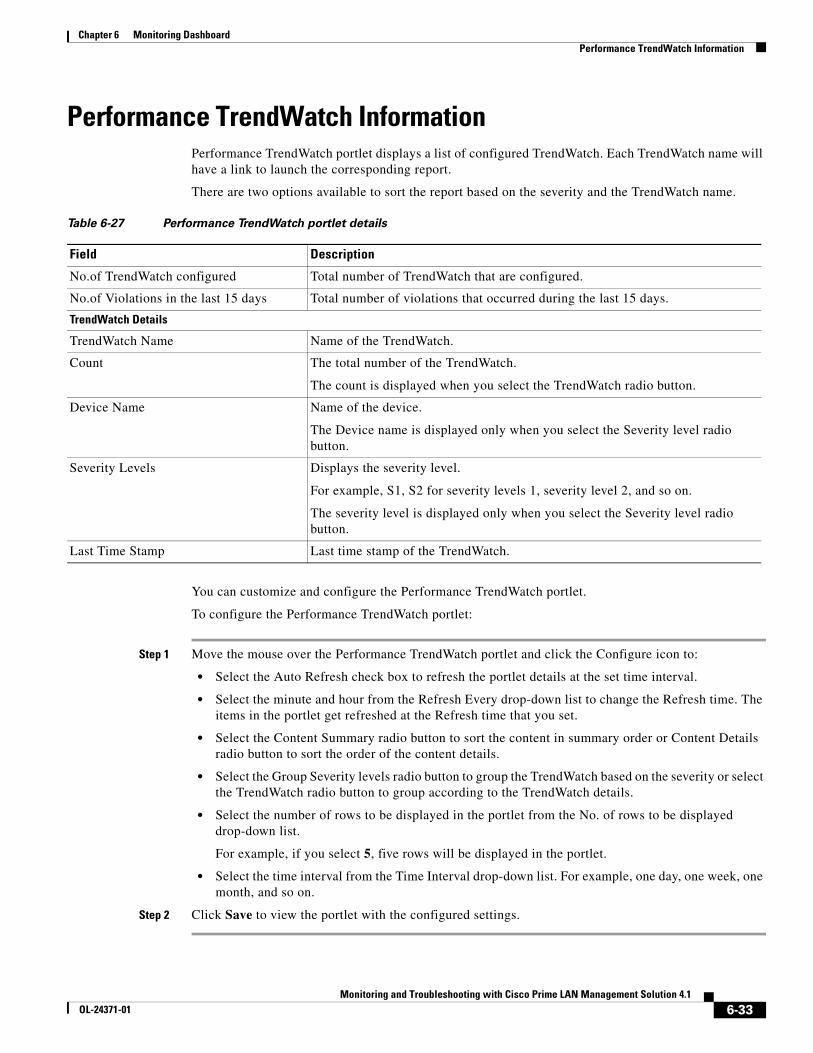
Performance TrendWatch InformationPerformance TrendWatch portlet displays a list of configured TrendWatch. Each TrendWatch name will have a link to launch the corresponding report.
There are two options available to sort the report based on the severity and the TrendWatch name.
You can customize and configure the Performance TrendWatch portlet.
To configure the Performance TrendWatch portlet:
Step 1 Move the mouse over the Performance TrendWatch portlet and click the Configure icon to:
• Select the Auto Refresh check box to refresh the portlet details at the set time interval.
• Select the minute and hour from the Refresh Every drop-down list to change the Refresh time. The items in the portlet get refreshed at the Refresh time that you set.
• Select the Content Summary radio button to sort the content in summary order or Content Details radio button to sort the order of the content details.
• Select the Group Severity levels radio button to group the TrendWatch based on the severity or select the TrendWatch radio button to group according to the TrendWatch details.
• Select the number of rows to be displayed in the portlet from the No. of rows to be displayed drop-down list.
For example, if you select 5, five rows will be displayed in the portlet.
• Select the time interval from the Time Interval drop-down list. For example, one day, one week, one month, and so on.
Step 2 Click Save to view the portlet with the configured settings.
Table 6-27 Performance TrendWatch portlet details
Field Description
No.of TrendWatch configured Total number of TrendWatch that are configured.
No.of Violations in the last 15 days Total number of violations that occurred during the last 15 days.
TrendWatch Details
TrendWatch Name Name of the TrendWatch.
Count The total number of the TrendWatch.
The count is displayed when you select the TrendWatch radio button.
Device Name Name of the device.
The Device name is displayed only when you select the Severity level radio button.
Severity Levels Displays the severity level.
For example, S1, S2 for severity levels 1, severity level 2, and so on.
The severity level is displayed only when you select the Severity level radio button.
Last Time Stamp Last time stamp of the TrendWatch.
6-33Monitoring and Troubleshooting with Cisco Prime LAN Management Solution 4.1
OL-24371-01
Chapter 6 Monitoring DashboardTOP-N Environmental Temperature
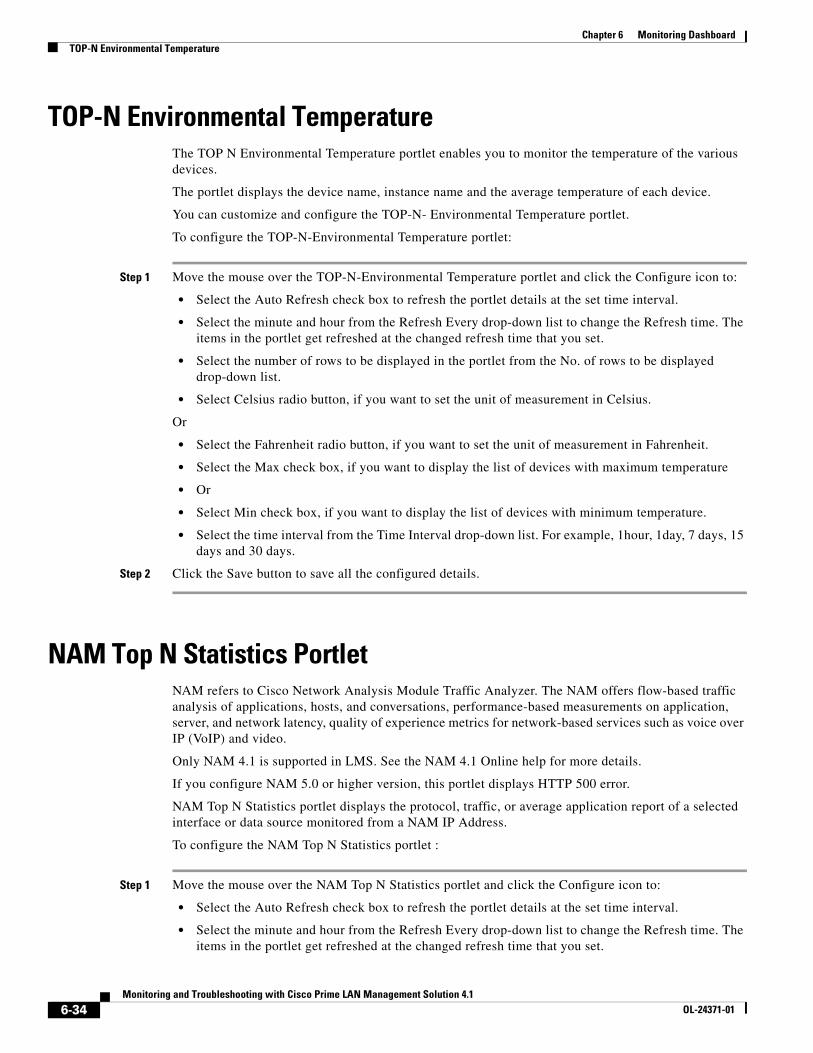
TOP-N Environmental Temperature The TOP N Environmental Temperature portlet enables you to monitor the temperature of the various devices.
The portlet displays the device name, instance name and the average temperature of each device.
You can customize and configure the TOP-N- Environmental Temperature portlet.
To configure the TOP-N-Environmental Temperature portlet:
Step 1 Move the mouse over the TOP-N-Environmental Temperature portlet and click the Configure icon to:
• Select the Auto Refresh check box to refresh the portlet details at the set time interval.
• Select the minute and hour from the Refresh Every drop-down list to change the Refresh time. The items in the portlet get refreshed at the changed refresh time that you set.
• Select the number of rows to be displayed in the portlet from the No. of rows to be displayed drop-down list.
• Select Celsius radio button, if you want to set the unit of measurement in Celsius.
Or
• Select the Fahrenheit radio button, if you want to set the unit of measurement in Fahrenheit.
• Select the Max check box, if you want to display the list of devices with maximum temperature
• Or
• Select Min check box, if you want to display the list of devices with minimum temperature.
• Select the time interval from the Time Interval drop-down list. For example, 1hour, 1day, 7 days, 15 days and 30 days.
Step 2 Click the Save button to save all the configured details.
NAM Top N Statistics PortletNAM refers to Cisco Network Analysis Module Traffic Analyzer. The NAM offers flow-based traffic analysis of applications, hosts, and conversations, performance-based measurements on application, server, and network latency, quality of experience metrics for network-based services such as voice over IP (VoIP) and video.
Only NAM 4.1 is supported in LMS. See the NAM 4.1 Online help for more details.
If you configure NAM 5.0 or higher version, this portlet displays HTTP 500 error.
NAM Top N Statistics portlet displays the protocol, traffic, or average application report of a selected interface or data source monitored from a NAM IP Address.
To configure the NAM Top N Statistics portlet :
Step 1 Move the mouse over the NAM Top N Statistics portlet and click the Configure icon to:
• Select the Auto Refresh check box to refresh the portlet details at the set time interval.
• Select the minute and hour from the Refresh Every drop-down list to change the Refresh time. The items in the portlet get refreshed at the changed refresh time that you set.
6-34Monitoring and Troubleshooting with Cisco Prime LAN Management Solution 4.1
OL-24371-01
Chapter 6 Monitoring DashboardNAM Attribute Value
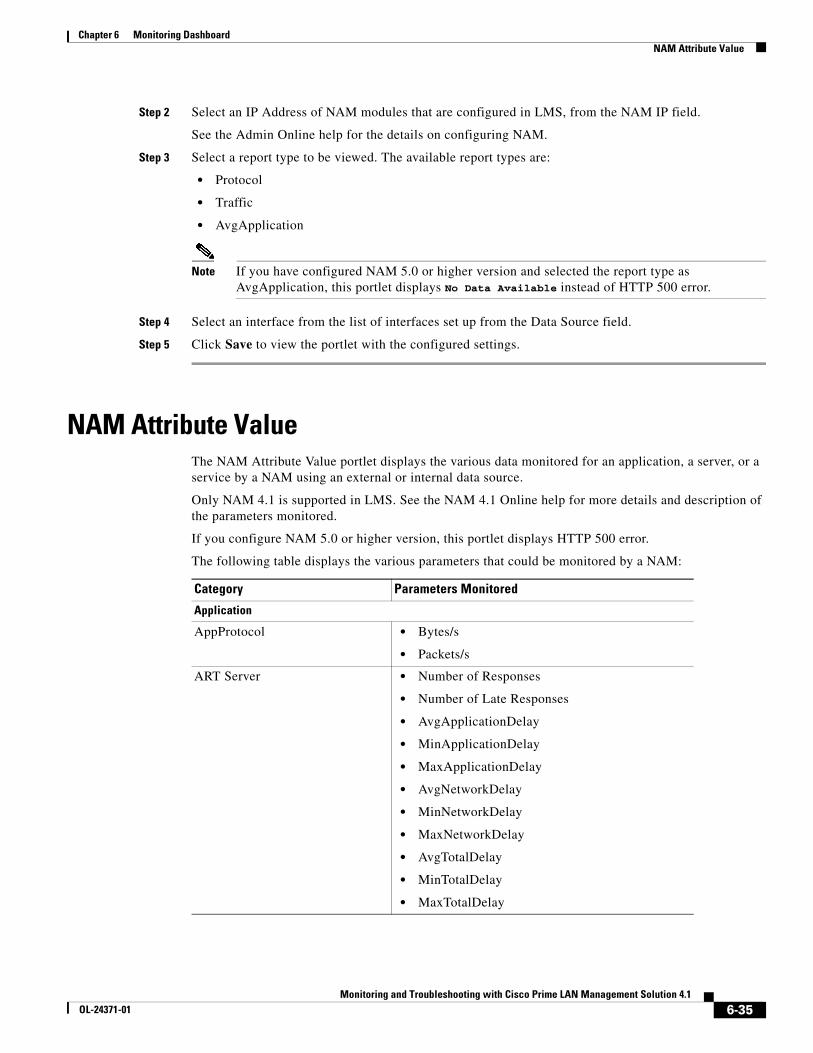
Step 2 Select an IP Address of NAM modules that are configured in LMS, from the NAM IP field.
See the Admin Online help for the details on configuring NAM.
Step 3 Select a report type to be viewed. The available report types are:
• Protocol
• Traffic
• AvgApplication
Note If you have configured NAM 5.0 or higher version and selected the report type as AvgApplication, this portlet displays No Data Available instead of HTTP 500 error.
Step 4 Select an interface from the list of interfaces set up from the Data Source field.
Step 5 Click Save to view the portlet with the configured settings.
NAM Attribute Value The NAM Attribute Value portlet displays the various data monitored for an application, a server, or a service by a NAM using an external or internal data source.
Only NAM 4.1 is supported in LMS. See the NAM 4.1 Online help for more details and description of the parameters monitored.
If you configure NAM 5.0 or higher version, this portlet displays HTTP 500 error.
The following table displays the various parameters that could be monitored by a NAM:
Category Parameters Monitored
Application
AppProtocol • Bytes/s
• Packets/s
ART Server • Number of Responses
• Number of Late Responses
• AvgApplicationDelay
• MinApplicationDelay
• MaxApplicationDelay
• AvgNetworkDelay
• MinNetworkDelay
• MaxNetworkDelay
• AvgTotalDelay
• MinTotalDelay
• MaxTotalDelay
6-35Monitoring and Troubleshooting with Cisco Prime LAN Management Solution 4.1
OL-24371-01
Chapter 6 Monitoring DashboardNAM Attribute Value
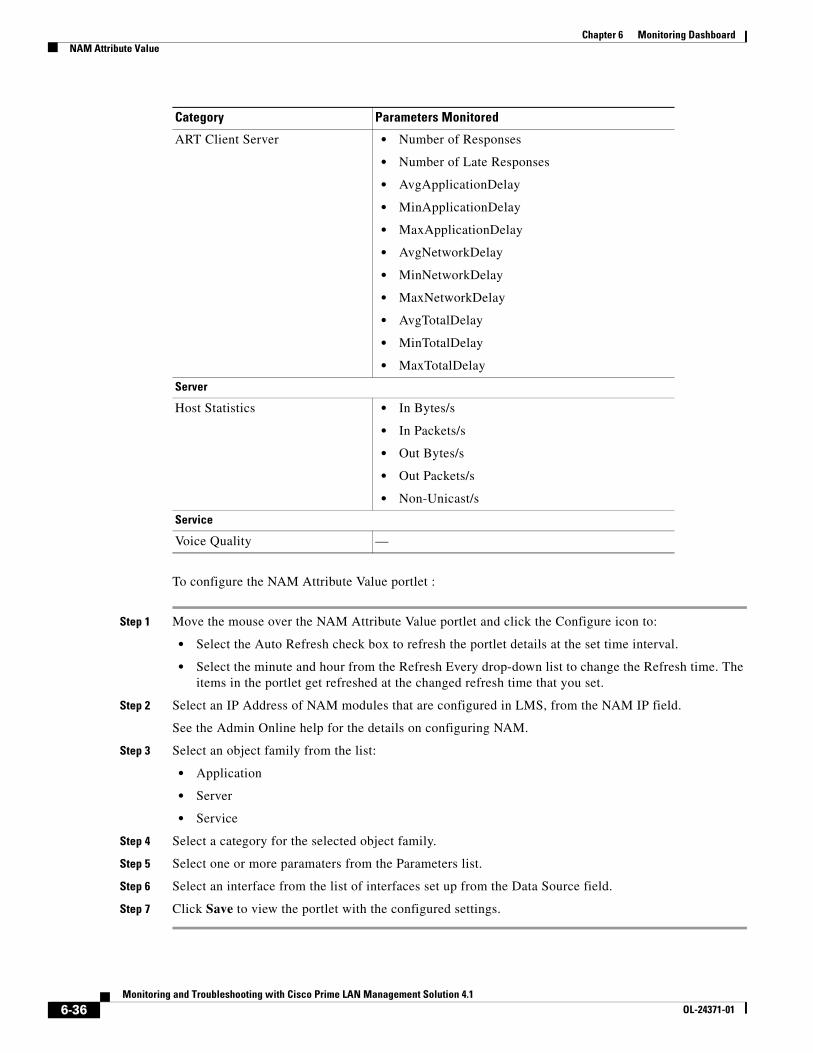
To configure the NAM Attribute Value portlet :
Step 1 Move the mouse over the NAM Attribute Value portlet and click the Configure icon to:
• Select the Auto Refresh check box to refresh the portlet details at the set time interval.
• Select the minute and hour from the Refresh Every drop-down list to change the Refresh time. The items in the portlet get refreshed at the changed refresh time that you set.
Step 2 Select an IP Address of NAM modules that are configured in LMS, from the NAM IP field.
See the Admin Online help for the details on configuring NAM.
Step 3 Select an object family from the list:
• Application
• Server
• Service
Step 4 Select a category for the selected object family.
Step 5 Select one or more paramaters from the Parameters list.
Step 6 Select an interface from the list of interfaces set up from the Data Source field.
Step 7 Click Save to view the portlet with the configured settings.
ART Client Server • Number of Responses
• Number of Late Responses
• AvgApplicationDelay
• MinApplicationDelay
• MaxApplicationDelay
• AvgNetworkDelay
• MinNetworkDelay
• MaxNetworkDelay
• AvgTotalDelay
• MinTotalDelay
• MaxTotalDelay
Server
Host Statistics • In Bytes/s
• In Packets/s
• Out Bytes/s
• Out Packets/s
• Non-Unicast/s
Service
Voice Quality —
Category Parameters Monitored
6-36Monitoring and Troubleshooting with Cisco Prime LAN Management Solution 4.1
OL-24371-01
Chapter 6 Monitoring DashboardIPSLA Collector Information
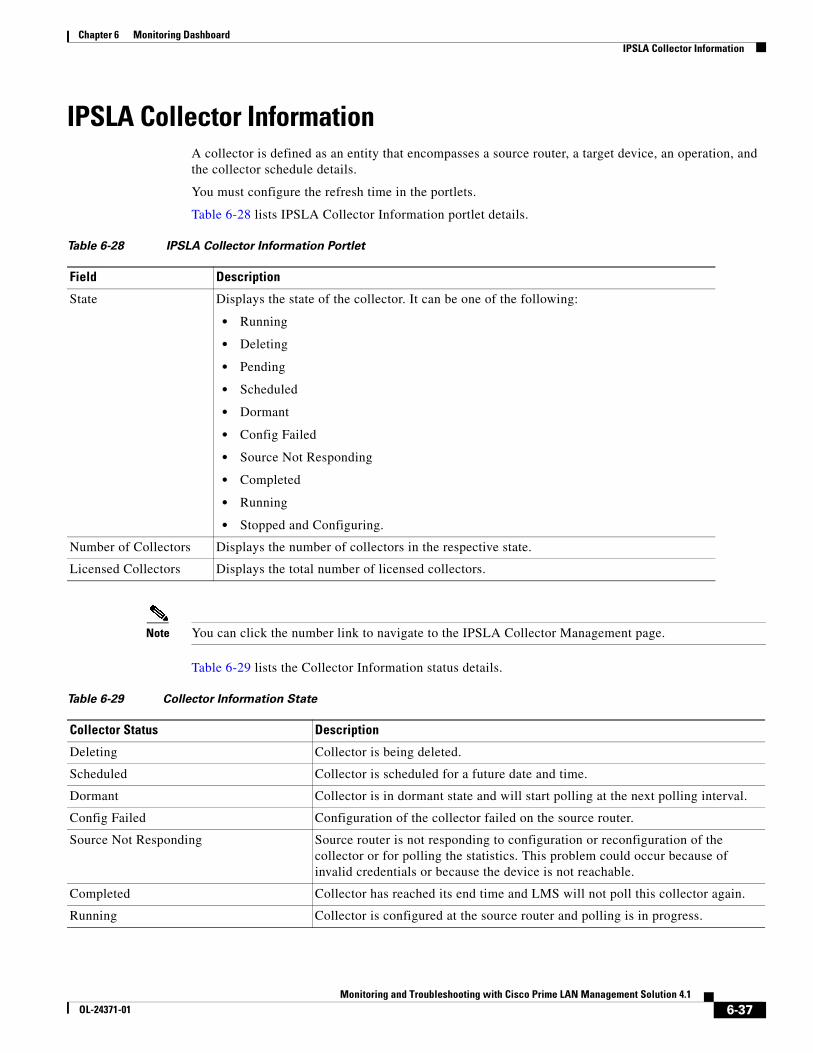
IPSLA Collector InformationA collector is defined as an entity that encompasses a source router, a target device, an operation, and the collector schedule details.
You must configure the refresh time in the portlets.
Table 6-28 lists IPSLA Collector Information portlet details.
Note You can click the number link to navigate to the IPSLA Collector Management page.
Table 6-29 lists the Collector Information status details.
Table 6-28 IPSLA Collector Information Portlet
Field Description
State Displays the state of the collector. It can be one of the following:
• Running
• Deleting
• Pending
• Scheduled
• Dormant
• Config Failed
• Source Not Responding
• Completed
• Running
• Stopped and Configuring.
Number of Collectors Displays the number of collectors in the respective state.
Licensed Collectors Displays the total number of licensed collectors.
Table 6-29 Collector Information State
Collector Status Description
Deleting Collector is being deleted.
Scheduled Collector is scheduled for a future date and time.
Dormant Collector is in dormant state and will start polling at the next polling interval.
Config Failed Configuration of the collector failed on the source router.
Source Not Responding Source router is not responding to configuration or reconfiguration of the collector or for polling the statistics. This problem could occur because of invalid credentials or because the device is not reachable.
Completed Collector has reached its end time and LMS will not poll this collector again.
Running Collector is configured at the source router and polling is in progress.
6-37Monitoring and Troubleshooting with Cisco Prime LAN Management Solution 4.1
OL-24371-01
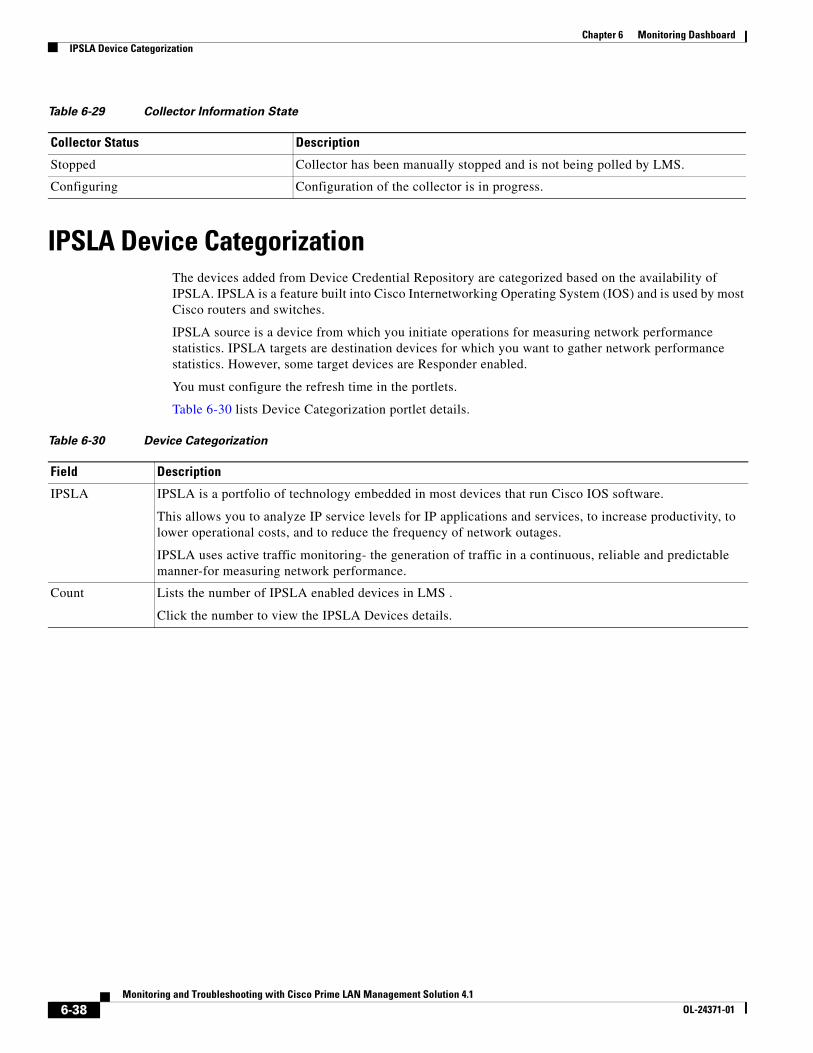
Chapter 6 Monitoring DashboardIPSLA Device Categorization
IPSLA Device CategorizationThe devices added from Device Credential Repository are categorized based on the availability of IPSLA. IPSLA is a feature built into Cisco Internetworking Operating System (IOS) and is used by most Cisco routers and switches.
IPSLA source is a device from which you initiate operations for measuring network performance statistics. IPSLA targets are destination devices for which you want to gather network performance statistics. However, some target devices are Responder enabled.
You must configure the refresh time in the portlets.
Table 6-30 lists Device Categorization portlet details.
Stopped Collector has been manually stopped and is not being polled by LMS.
Configuring Configuration of the collector is in progress.
Table 6-29 Collector Information State
Collector Status Description
Table 6-30 Device Categorization
Field Description
IPSLA IPSLA is a portfolio of technology embedded in most devices that run Cisco IOS software.
This allows you to analyze IP service levels for IP applications and services, to increase productivity, to lower operational costs, and to reduce the frequency of network outages.
IPSLA uses active traffic monitoring- the generation of traffic in a continuous, reliable and predictable manner-for measuring network performance.
Count Lists the number of IPSLA enabled devices in LMS .
Click the number to view the IPSLA Devices details.
6-38Monitoring and Troubleshooting with Cisco Prime LAN Management Solution 4.1
OL-24371-01