Embed Size (px)
Citation preview

Monitoring Ground Deformation from Space : Airborne- LiDAR and Radar Interferometry
中國文化大學地質學系 陳柔妃助理教授E-MAIL:[email protected]
103年度全國地科教師專業成長研習活動
大屯山地區的地質與監測技術

Quantitative analysis of topography using LiDAR
• Airborne laser swath mapping (ALSM) consistently provides data good enough to produce 1m digital elevation models (DEMs)
• Ground-based systems can be used for finer scale analysis of millimeter to centimeter scale features
• These datasets are more than just pretty pictures; many important research questions have become testable as a result of this technology

Airborne Laser Scanning
• ALS/LiDAR is an active remote sensing technology that measures distance with reflected laser light.• 1st developed in 1960 by Hughes Aircraft inc.• Modern computers and DGPS make it practical.• Typically used in very accurate mapping of topography.• New technologies and applications are currently being developed.

• The position of the aircraft is known (from DGPS and IMU).• Measures distance to surfaces by timing the outgoing laser pulse and the corresponding return (s).• Distance = time*(speed of light)/2• By keeping track of the angle at which the laser was fired: you can calculate the X, Y, Z position of each “return”.• Requires extremely accurate timing and a very fast computer.
ALS mapping concepts

3rd return from ground
1st return from tree top
2nd return from branches1st (and only)
return from ground
Multiple reflections of laser pulse

fly line elevation of point cloud
echoesreflection intensity classification
DSM DTM Reference images
Point cloud data processing

What is differences between images sources? Example in the Siaoyoukeng area

Topographic map used in CGS LiDAR project

What is surface deformation in Volcanoes area?Possible magma intrusion scenario with surface uplift, followed by eruption and subsidence
Stage 1: Inflation begins as magma moves into the volcano or as pressure increases in the magma chamber
Stage 2: As magma chamber inflates, the ground surface above it is displaced.
Stage 3: After an eruption, the magma chamber deflates. Ground surface subsides with potential formation of crater.
How do we measure volcano deformation?Observatories are set up on all active volcanoes that threaten the human population. These are designed to monitor and potentially to predict the eruptive behaviour of the volcano in question.
Seismicity
Deformation
Gas Output
(on volcano and remote sensing techniques)

Why we need using InSAR techniques?
geodetic techniques
tomographic studies
Global Positioning System (GPS),
borehole sensors
(dilatometers and tiltmeters)
precise leveling to characterize
ground deformation
constrain volcanic models
Mt. Etna’s deep plumbing system: tomographic analysis

How satellite radar interferometry worksImage Product Options: 35 possibilities Positions – cross-track viewing incidence
angles
Sketch of measuring volcanic activity by satellite radar interferometry[Image courtesy of Tim Masterlark, UW-Madison Ph.D. almunus]
Multipass interferometric SAR (InSAR)SAR interferometry needs at least (i) two radars or (ii) radar imaging from two places
Return signal from satellite holds the key strength or amplitude of the return signal round trip distance from the satellite to the
ground and back again

What Kind of Synthetic Aperture Radar (SAR) is best?
Paul A Rosen(Jet Propulsion Laboratory, California Institute of Technology)
Frequency (wavelength)
Light interacts most strongly with objects on the sizes of the wavelength
Wavelengths a measure of surface and subsurface scale sizes
L-band greatly improves correlation
ERS/Radarsat (C-band) vs JERS/ALOS (L-band)
Polarimetric Spaceborne SAR sensors
Pottier and Ferro, 2008(University of Rennes1, IETR-UMR CNRS)
Interferogram showing deformation of Akutan lsland (October 1994 ot June 1997), draped over shaded-relief map of the island (Lu et al., 2005)
Forest:
Dry soils:
Ice:

Italy’s Mt. Etna breathing exercises
InSAR data processing and interpretation of results courtesy of Paul Lundgren, Jet Propulsion Laboratory from USGS-VHP InSAR Research Group.
An interferogram is a map of the relative changes in the distance between the satellite andsurface of the earth, expressed as differences in phase. The interferometric techniquemeasures ground deformation with a precision of 2.8 cm (~1 inch).

InSAR vs PS
SAR (Synthetic Apterture Radar) InSAR (Interferometric SAR)
Amplitude ,Phase, Unwrapping DInSAR (Differential InSAR) PSInSAR (Persistent Scatterers InSAR)
Select pixels with stable scattering behavior over time Only focus on “good” pixelsInSAR
– Spatial coherence @ 1 time– Need neighborhoods of good pts
PS– Coherence @ 1 point– Need > 15-20 scenes
Long Valley Caldera (Hooper et al., 2004)
StaMPS method (Hooper et al. 2004 and 2009)

SABS 范凱婷(2012)PS-InSAR 周鋒泯(2009) PS-InSAR 范凱婷(2012)
TCP-InSAR
Comparison of Satellite Radar Sensors

TCP (Temporarily Coherence Point ) InSAR identify dense coherent points from
one image pair only
TCP are radar targets exhibiting stable radar returns: buildings, man-made objects, pipelines, antenna, poles,outcrops, exposed rocks...
Paul A Rosen 2011(Jet Propulsion Laboratory, California Institute of Technology)
What is a Temporarily Coherence Point?
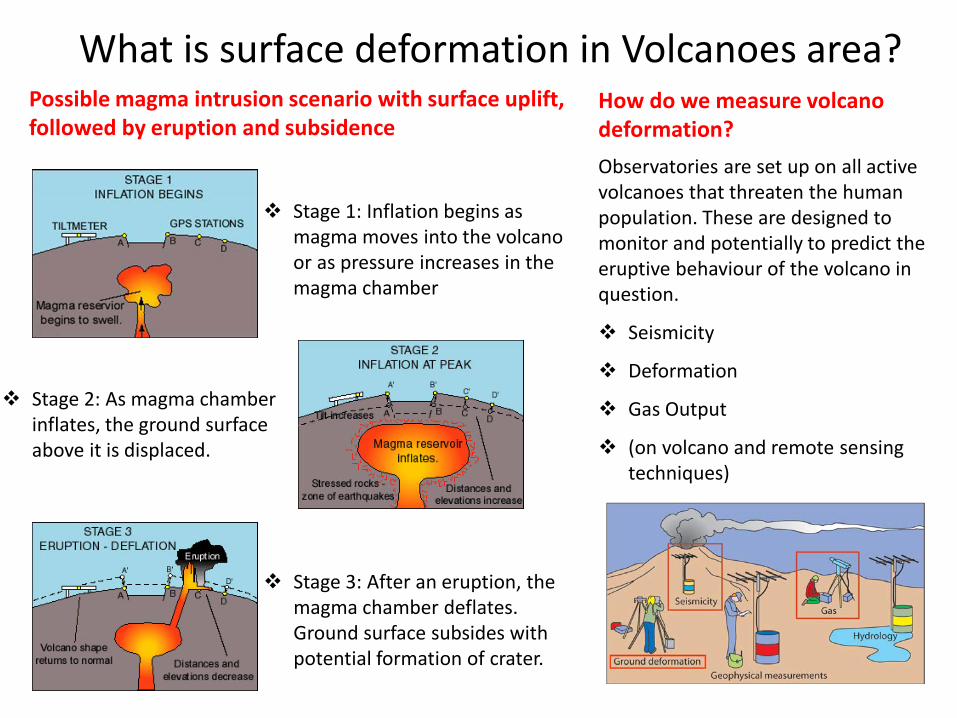
ALOS/ PALSA Datasets in the YangminshanNo. DATA No. DATA1. 20070112 11. 20090720
2. 20070227 12. 20091020
3. 20070830 13. 20100120
4. 20071015 14. 20100307
5. 20070715 15. 20100723
6. 20071130 16. 20100907
7. 20080115 17. 20101023
8. 20080601 18. 20101208
9. 20080717 19. 20110123
10. 20081017 20. 20110310

Temporarily Coherence Point InSAR validation

Actual phaseπ
-π
π
-π
Typical unwrapped phaseπ
-π
Wrapped (measured) phase
The Absolute Phase Determination Ground control reference points can be used to determine the absolute phase ambiguity
Long Valley Caldera (Ferretti et al., 2010)


The Basic Idea…
DateGoal: Solve for the deformation history that, in a least-squared sense, fits the set of observations (i.e., interferograms),
Many different methods (e.g., Lundgren et al. (2001), Schmidt & Burgmann, 2003), but SBAS (Berardino et al. (2002)) is perhaps most common one
Future work Displacement rate and time series
Conventionally, TCP-InSAR uses all the images of the dataset and selects those pixels that show a trend in time consistent with the applied model for velocity: average displacement rate and time series for such pixels are computed.

Future work Combine Ascending and descending orbits
The combination of the motion of the satellite and the motion of the earth makes it possible to look at the same area of interest from two opposite acquisition geometries.