Embed Size (px)
Citation preview
252 IEEE JOURNAL OF SELECTED TOPICS IN APPLIED EARTH OBSERVATIONS AND REMOTE SENSING VOL 4 NO 2 JUNE 2011
Monitoring Landscape Change for LANDFIRE Using Multi-Temporal Satellite Imagery and Ancillary Data
James E Vogelmann Jay R Kost Brian Tolk Stephen Howard Karen Short Xuexia Chen Associate Member IEEE Chengquan Huang Kari Pabst and Matthew G Rollins
AbstractmdashLANDFIRE is a large interagency project designed to provide nationwide spatial data for fire management applicashytions As part of the effort many 2000 vintage Landsat Thematic Mapper and Enhanced Thematic Mapper plus data sets were used in conjunction with a large volume of field information to generate detailed vegetation type and structure data sets for the entire United States In order to keep these data sets current and relevant to resource managers there was strong need to develop an approach for updating these products We are using three difshyferent approaches for these purposes These include 1) updating using Landsat-derived historic and current fire burn information derived from the Monitoring Trends in Burn Severity project 2) incorporating vegetation disturbance information derived from time series Landsat data analysis using the Vegetation Change Tracker and 3) developing data products that capture subtle intra-state disturbance such as those related to insects and disease using either Landsat or the Moderate Resolution Imaging Specshytroradiometer (MODIS) While no one single approach provides all of the land cover change and update information required we believe that a combination of all three captures most of the disturbance conditions taking place that have relevance to the fire community
Index TermsmdashLandscape monitoring LANDFIRE Landsat MODIS time series analyses
I INTRODUCTION
I N RESPONSE to the many large and severe fires that ocshycurred in the United States during the latter part of the twenshy
tieth century the United States Secretaries of Agriculture and Interior developed the National Fire Plan in August 2000 [1] This plan covers a wide array of fire-related issues including enshysuring sufficient wildland firefighting capacity in the future reshyhabilitating landscapes affected by wildland fire reducing hazshyardous wildland fuel and providing assistance to communities
Manuscript received October 30 2009 accepted February 01 2010 Date of publication April 12 2010 date of current version May 20 2011 The work of J Kost and B Tolk was supported by USGS Contract 08HQCN0005 The work of X Chen and K Pabst was supported by USGS Contract 08HQCN0007
J E Vogelmann S Howard and M G Rollins are with the USGS Earth Reshysources Observation and Science (EROS) Center Sioux Falls SD 57198 USA
J R Kost and B Tolk are with Stinger Ghaffarian Technologies USGS Earth Resources Observation and Science (EROS) Center Sioux Falls SD 57198 USA
K Short is with Systems for Environmental Management Missoula MT 59801 USA
X Chen and K Pabst are with the ASRC Research and Technology Solushytions (ARTS) USGS Earth Resources Observation and Science (EROS) Center Sioux Falls SD 57198 USA
C Huang is with the Department of Geography University of Maryland Colshylege Park MD 20742 USA
Color versions of one or more of the figures in this paper are available online at httpieeexploreieeeorg
Digital Object Identifier 101109JSTARS20102044478
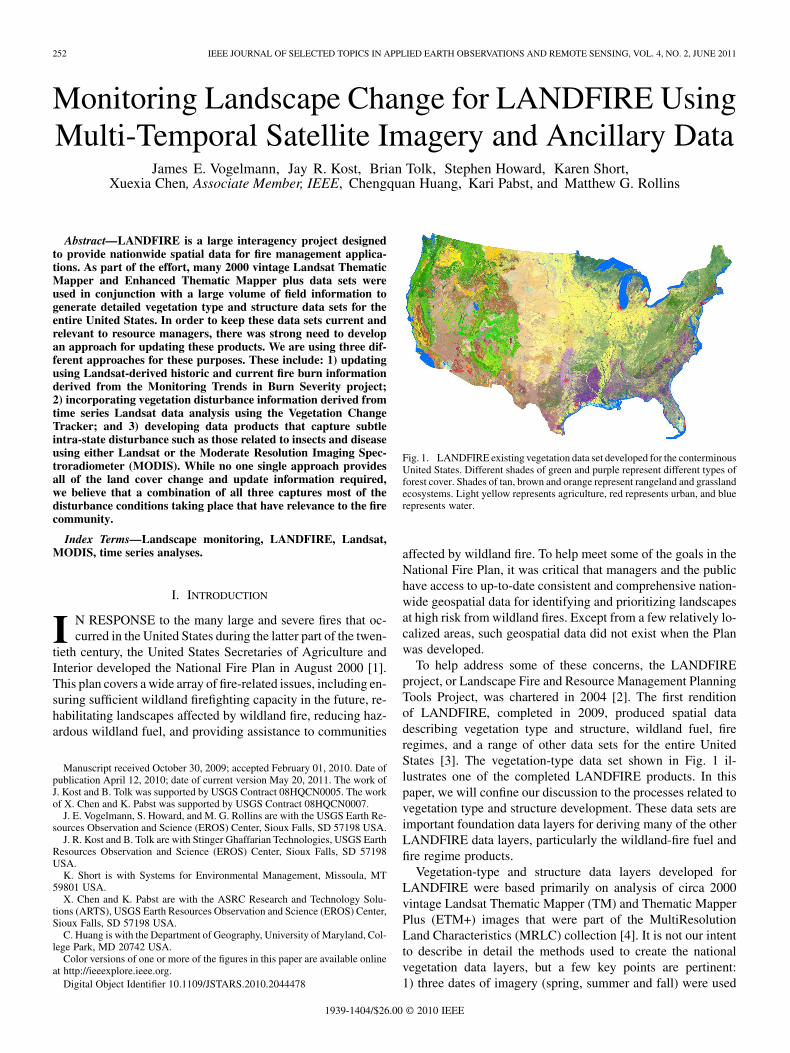
Fig 1 LANDFIRE existing vegetation data set developed for the conterminous United States Different shades of green and purple represent different types of forest cover Shades of tan brown and orange represent rangeland and grassland ecosystems Light yellow represents agriculture red represents urban and blue represents water
affected by wildland fire To help meet some of the goals in the National Fire Plan it was critical that managers and the public have access to up-to-date consistent and comprehensive nationshywide geospatial data for identifying and prioritizing landscapes at high risk from wildland fires Except from a few relatively loshycalized areas such geospatial data did not exist when the Plan was developed
To help address some of these concerns the LANDFIRE project or Landscape Fire and Resource Management Planning Tools Project was chartered in 2004 [2] The first rendition of LANDFIRE completed in 2009 produced spatial data describing vegetation type and structure wildland fuel fire regimes and a range of other data sets for the entire United States [3] The vegetation-type data set shown in Fig 1 ilshylustrates one of the completed LANDFIRE products In this paper we will confine our discussion to the processes related to vegetation type and structure development These data sets are important foundation data layers for deriving many of the other LANDFIRE data layers particularly the wildland-fire fuel and fire regime products
Vegetation-type and structure data layers developed for LANDFIRE were based primarily on analysis of circa 2000 vintage Landsat Thematic Mapper (TM) and Thematic Mapper Plus (ETM+) images that were part of the MultiResolution Land Characteristics (MRLC) collection [4] It is not our intent to describe in detail the methods used to create the national vegetation data layers but a few key points are pertinent 1) three dates of imagery (spring summer and fall) were used
1939-1404$2600 copy 2010 IEEE
253 VOGELMANN et al MONITORING LANDSCAPE CHANGE FOR LANDFIRE USING MULTI-TEMPORAL SATELLITE IMAGERY AND ANCILLARY DATA
to train classification models 2) classification data sets were developed via supervised classification using decision and reshygression tree approaches [5] 3) a database consisting of several hundred thousand georeferenced field points known as the LANDFIRE Reference Database (LFRDB) was used to train the algorithms 4) the existing vegetation legend was based on NatureServersquos Ecological Systems classes which represents a nationally consistent midscale classification of vegetation units [6] 5) the vegetation structure data included canopy density (binned into 10 percentage classes) and canopy height (binned into several classes depending on life form type) and 6) a large number of ldquoancillaryrdquo spatial data sets were used to develop the final data products including data from the National Land Cover Database [7] digital elevation model data and soils data
The development of the LANDFIRE vegetation data layers required a full time team of over ten individuals representing fields of geography ecology and computer science and the project took about five years to complete As such it is not the type of endeavor that one would consider doing annually or even biennially Nonetheless potential users of the LANDshyFIRE data expressed concern early on in the project that the data sets being developed would be ldquoout-of-daterdquo for their areas of interest Thus it became evident at an early stage of the project that in order for LANDFIRE to be relevant to many users for a long period of time we would need to develop methods and approaches that would enable us to update the data sets on a regshyular basis and thus keep the data sets current and relevant
In fact the LANDFIRE Executive Charter (available at httpwwwlandfiregov) already had a provision for updating the LANDFIRE project to regularly update data products This directive is and will be instrumental in transitioning LANDshyFIRE from a project to a program and its implementation will be imperative for maintaining the timeliness and quality of products as the landscape changes The general update schedule for the LANDFIRE Program will be at biannual and decadal intervals with the first update scheduled for completion by October 2010 Biannual updating will involve modifying the original LANDFIRE data sets with interannual disturbance information (ie updating just those areas that have been determined to have undergone recent changes) while decadal ldquoupdatingrdquo is likely to consist of major remapping activities
Recently the USGS began providing Landsat imagery to users over the Internet at no cost [8] which effectively ended an era whereby Landsat data charges severely limited the scope and types of land-cover projects that could be undertaken Until reshycently the generation of any type of Landsat-based wall-to-wall US land-cover data set renewed annually would most likely have been considered cost prohibitive impractical and untenshyable Although Landsat data cost is no longer a barrier to impleshymenting large-area operational land-cover monitoring projects many other major challenges remain
The LANDFIRE updating process hereafter referred to as Remote Sensing of Landscape Change (RSLC) has four main elements These are 1) acquisition and compilation of field data 2) wildfire burn mapping as being done by the Monishytoring Trends in Burn Severity (MTBS) project 3) updating and analysis using the Vegetation Change Tracker (VCT [9]) and 4) mapping and incorporation of subtle intra-state changes
such as those related to insects and disease In this paper one of our objectives is to report the progress that we have made towards developing an operational land cover monitoring cashypacity with the LANDFIRE While there is still much research to be done the first three elements are reasonably well develshyoped and are approaching operational status whereas the fourth (related to insects and disease) is still largely in the research and development phase In addition to providing some of our positive results we will also share some of the challenges and potential problems that we foresee
II FIELD DATA
LANDFIRE mapping was supported by a vast database of field-sampled information known as the LANDFIRE Refshyerence Database (LFRDB) This and newly acquired field information continues to be an integral part of the RSLC effort The LFRDB currently comprises vegetation and fuel data from approximately 800000 geo-referenced sampling units located throughout the United States These field data were amassed by capitalizing on the existing information resources of outside entities such as the USFS Forest Inventory and Analysis (FIA) Program the USGS National Gap Analysis Program and state natural heritage programs Vegetation data drawn from these sources for use in LANDFIRE include natural community occurrence records estimates of canopy cover and height per plant taxon and measurements (eg diameter height crown ratio crown class density) of individual trees Fuel data include biomass estimates of downed woody material percentage cover and height of shrub and herb layers and canopy base height estimates Digital photos of the sampled units are archived when available While we will touch on some key points here Toney et al [10] explain in detail how these types of field data specifically those collected by FIA have been acquired incorporated into the LFRDB and used in LANDFIRE
Existing programs such as FIA have afforded LANDFIRE a wealth of useful data from forested systems including releshyvant measurements of millions of individual trees Data from non-forest systems have proven less readily available To help fill apparent gaps in data coverage LANDFIRE field crews were dispatched in the early stages of the national effort to collect data following The Fire Effects Monitoring and Inventory Protocol (FIREMON) [11] in target areas Efforts remain underway to acshyquire data from underrepresented areas and vegetation types and to incorporate additional records that will help inform LANDshyFIRE updates and enhance our monitoring capacity including re-measurements of sites already in the LFRDB At present the FIA Program is a key source of these repeated measures We are currently looking to additional monitoring efforts with pershymanent sampling arrays particularly in rangelands to augment the re-measurement data in the LFRDB as well as exploring use of the USFS Fire and Fuels Extension to the Forest Vegetation Simulator (FVS-FFE) [12] as a tool to model the development of stands that have not been repeatedly sampled in the field Inshyputs for FVS-FFE can be generated by querying the LFRDB
To meet all of the needs of LANDFIRE several key attributes must be systematically derived from the acquired data and also included in the LFRDB These attributes include existing and
254 IEEE JOURNAL OF SELECTED TOPICS IN APPLIED EARTH OBSERVATIONS AND REMOTE SENSING VOL 4 NO 2 JUNE 2011
potential vegetation type in the form of NatureServersquos Ecologshyical Systems [6] [10] tree canopy cover and height predicted from spatially explicit empirical models [13] uncompacted crown ratios [14] and several canopy fuel metrics (eg bulk density) derived from the FuelCalc program [15] At various stages in data compilation including after the attribution of Ecological Systems records are carefully screened for inforshymation or spatial errors Questionable data are either identified accordingly or removed from the LFRDB depending on conshyfidence in the assessment The remaining data points are then associated with a number of ancillary datasets via a series of spatial overlays These datasets include the Landsat image suite the National Land Cover Database [7] the digital elevashytion model and derivatives [16] soil depth and texture layers [17] and a set of 42 simulated biophysical gradient layers (eg evapotranspiration soil temperature degree days) The latter are generated using WX-BGC an ecosystem simulator derived from BIOME-BGC [18] and GMRS-BGC [19] The extracted values from each of these overlays are archived in the LFRDB for potential use as predictor variables in the mapping process
In 2008 LANDFIRE began developing a geodatabase augmenting the LFRDB to accommodate field records of treatshyments disturbances and other events that have considerably altered vegetation or fuel conditions since 1999 and which must be accounted for to accurately update the 2000-vintage LANDFIRE data As with the LFRDB this new ldquoEventsrdquo datashybase draws heavily upon the existing information resources of outside programs such as the USFS Forest Activity Tracking System Attributes that must be associated with each event include a brief description of the occurrence and the year in which it occurred Additional information sought but not required includes an indication of the severity of each event The bulk of the viable data acquired to date have come from federal agencies which often archive their fire and other acshytivity records in public or corporate clearinghouses Geospatial records of non-wildfire activities taking place on non-federal lands particularly private holdings are proving harder to come by and are relatively few in the LANDFIRE Events database
III MONITORING TRENDS IN BURN SEVERITY
A General Overview
Sponsored by the Wildland Fire Leadership Council (WFLC) the Monitoring Trends in Burn Severity (MTBS) project is a five-year effort that commenced in 2006 The project was initiated in response to a General Accounting Ofshyfice recommendation to develop and implement a standardized comprehensive approach to assess burn severity across the various land management agencies It was also initiated to monitor the effectiveness of the National Fire Plan and Healthy Forest Restoration Act A major goal of the project is to provide nation-wide baseline information to assess synoptically the environmental impacts and trends of fire Fire is a major agent of landscape change especially throughout the western and southeastern United States and the MTBS data sets are an important component of RSLC
Many previous investigations have shown the utility of satelshylite-based multispectral data to assess and monitor ecosystems
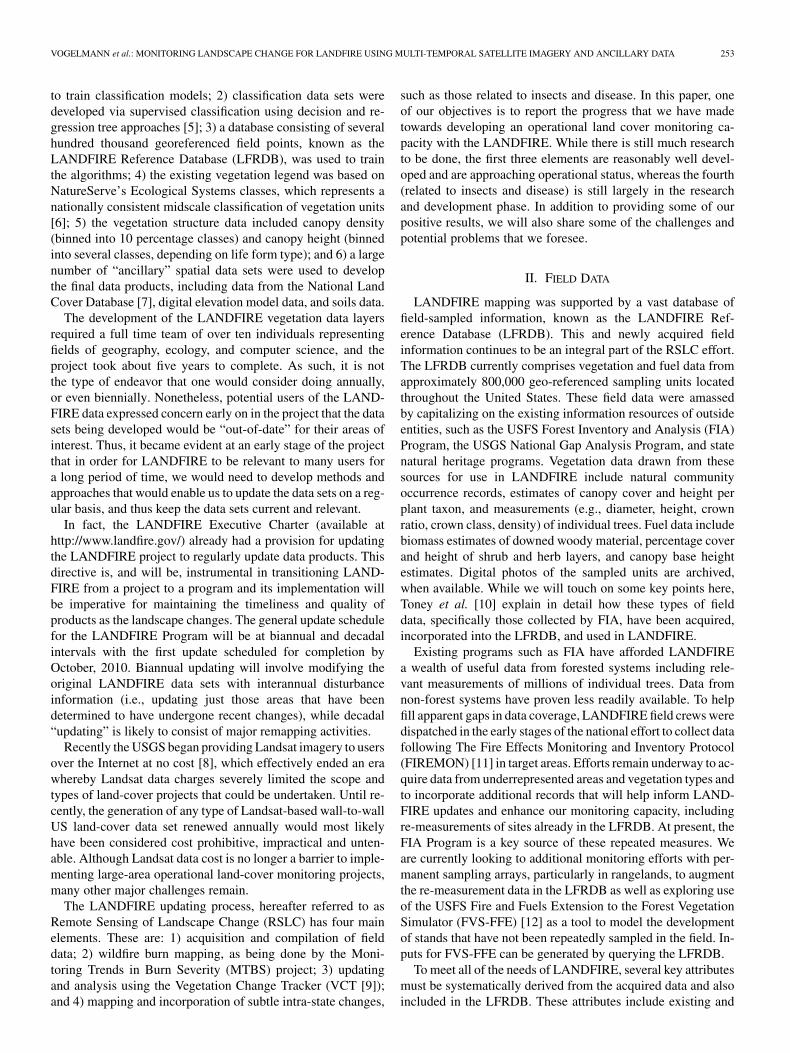
Fig 2 Fire Occurrence Database recorded fires (1984ndash2008) in the lower 48 states The large fires were mapped by the Monitoring Trends in Burn Severity project Note mis-located fires in Atlantic Ocean and number of fires reported between TX and NM
[20]ndash[23] Assessing the severity of present-day fires is feasible using a number of existing satellite platforms but due to limited spatial extent and temporal depth providing a comprehensive historical baseline of detailed information using some of these platforms is not possible The MTBS project was implemented to take advantage of satellite-based techniques advances in computing capacity and the existing long-term archive of Landsat satellite data covering the United States The project is a joint effort between the US Forest Servicersquos Remote Sensing Applications Center (RSAC) and the US Geological Surveyrsquos Earth Resources Observation and Science Center (EROS) Center and its mandate is to map the severity of all ldquolargerdquo fires that have occurred in the United States since 1984 ldquoLargerdquo is defined as greater than 1000 acres in the western US and greater than 500 acres in the eastern US
For the MTBS project ldquoburn severityrdquo refers to the effects of fire on the above-ground biomass This definition is adapted from that of the term ldquofire severityrdquo in the National Wildfire Coordination Group (NWCG) Glossary of Wildland Fire Terms [24] ldquoDegree to which a site has been altered or disrupted by fire loosely the product of fire intensity and residence timerdquo Furthermore burn severity is presumed to 1) occur on a grashydient 2) manifest as a mosaic within a fire perimeter and 3) be ldquomappablerdquo using remote-sensing techniques
B Fire Occurrence Database
An integral component of the MTBS project is a comprehenshysive fire-occurrence database (FOD) This information supports the effort to identify appropriate Landsat imagery Over 28000 historical fire records (1984ndash2008) from all federal land manshyagement agencies along with comparable information from states have been compiled into a FOD providing information on fire locations and dates This database has some imperfecshytions including duplication of fire data points and geospatial errors but despite these occasional problems the data base is a valuable starting point for MTBS mapping Locations of 25700 fires included in the FOD for the conterminous US are shown in Fig 2
255 VOGELMANN et al MONITORING LANDSCAPE CHANGE FOR LANDFIRE USING MULTI-TEMPORAL SATELLITE IMAGERY AND ANCILLARY DATA
Fig 3 Example of monitoring trends in burn severity mapping process
C Assessment Strategies
The MTBS project is based upon the USGS archive of Landsat TM and ETM+ imagery dating back to 1984 Using the fire location date and assessment strategy as a guide imagery from the archive is selected for analysis Because a fire occurs at a ldquomomentrdquo in time selecting the best imagery to capture its effects is an important consideration The MTBS project draws upon three different assessment strategies 1) extended assessment (EA) 2) initial assessment (IA) and 3) single-scene assessment For both EA and IA images from two dates (one prefire and one postfire) are compared to assess fire severity For EA the post-fire image is selected to represent the ldquopeak of greenrdquo during the next growing season By this means some delayed mortality can be accounted for in the assessment This approach is generally used for forest and some shrub-land fires For IA the postfire image is selected to represent conditions soon after the fire is out This approach is used for some shrubland and grassland fires when the fire scar vanishes quickly due to vegetation recovery or weathering Single-Scene Assessment is done sparingly and only when suitable prefire imagery is not available commonly due to cloud cover For any two-scene assessment (EA or IA) it is important to match the phenology and illumination geometry of the scenes as best possible in order to assess changes due to fire not changes due to seasonality or other temporal artifacts
D Image Processing
All imagery is precision terrain corrected and calibrated to at-satellite reflectance Thematic Mapper and Enhanced Thematic Mapper + data sets are preferred in part because the second shortwave infrared band (Band 7 208ndash235 m) from this source has been found to be very effective for burn mapshyping Using an algorithm similar to the Normalized Difference Vegetation Index (NDVI) band 7 is combined with the near
m) to derive the normalized infrared band (Band 4 076ndash090 burn ratio (NBR)
Burn severity is determined after the pre-fire and post-fire imshyages are selected NBR data sets are generated and difference images are calculated from the pre- and post-fire NBR data sets (dNBR Fig 3)
E Burn Severity Assessment
Relatively high dNBR values in the resulting spatial data sets are interpreted as areas of vegetation loss In other words burn severity mapping as described here rests on the assumption that higher dNBR values are evidence of more severe effects of fire (ie a greater loss of aboveground vegetation) This assumption has been tested and supported by the analysis of data collected from several thousand field sites visited over the last decade [21] Using this foundation skilled analysts interpret the dNBR image to categorize burn severity into five thematic classes High Moderate Low Unburned to Low and Increased Greenness (areas with more vegetation after the fire) Using on-screen digitizing analysts create a perimeter for each fire using the dNBR data sets and original Landsat imagery as a guide The thematic burn severity image is then intersected with land cover and other thematic layers (administrative water sheds etc) to generate burn severity statistics (eg number of acres of evergreen forest burned at high severity or moderate severity etc) Metadata are generated for each fire including information about fire date and size imagery used and thresholds chosen Finally the inputs and results for each fire assessment are bundled and made available via the internet For additional information and data download see httpmtbsgov or httpmtbscrusgsgovviewer
256 IEEE JOURNAL OF SELECTED TOPICS IN APPLIED EARTH OBSERVATIONS AND REMOTE SENSING VOL 4 NO 2 JUNE 2011
Fig 4 An abridged representation of the process for creating Remote Sensing of Landscape Change products
IV THE VEGETATION CHANGE TRACKER
A General Overview
The overall LANDFIRE mapping effort began over five years ago using circa 2000 vintage Landsat imagery Both the users of the data as well as project management understood that an effort would be needed to bring the LANDFIRE data up-toshydate in order to retain relevancy and value An effort known as ldquoRefreshrdquo was initiated to make the data more current and applicable to the user community ldquoRapid Refreshrdquo was the first component of the Refresh update strategy and was completed in June 2008 This effort focused on quickly updating LANDFIRE data products in areas affected by recent (1999ndash2008) wildland fire disturbances using MTBS data A more comprehensive efshyfort utilizing both the MTBS and the LANDFIRE Events datashybase is currently underway While this information has become an important part of RSLC it became apparent early on that we needed a more automated and ldquoglobalrdquo process for mapping and incorporating disturbance information This led to the developshyment of the Vegetation Change Tracker (VCT)
B Vegetation Change Tracker
The VCT is an automated and highly efficient algorithm for mapping changes in forest cover The algorithm uses Landsat time series stacks (LTSS) which are defined as sequences of
Landsat images with a nominal temporal interval (eg one image every year or every two years) for a particular location LTSS images have been geometrically corrected to achieve subpixel geolocation accuracy and have high levels of radioshymetric consistency achieved using best available calibration coefficients and calculation of reflectance [9] The VCT first converts the LTSS images into spectral indexes that are meashysures of the likelihood of each pixel being a forest pixel and then tracks these indexes over time Changes are detected by looking for sharp decreases in forest likelihood as reflected by these indices Fig 4 shows the primary processes for creating RSLC products using VCT in a simplified diagram
A major strength of the VCT process is that it enables the proshycessing of an unprecedented amount of Landsat data to derive the changedisturbance products Landsat imagery dating back to 1984 and up to 2009 (preferably one scene for every year) is compiled into stacks referred to as Landsat time series stacks (LTSS Fig 4) These stacks are compiled for every Landsat World Reference System (WRS) pathrow falling within the conterminous United States A LTSS can consist of up to 28 Landsat images and we estimate that over 30000 Landsat imshyages will be utilized for mapping the conterminous US The imshyages used are generally 90 cloud-free and are geometrically referenced to the Albers Equal Area projection and converted to at-sensor reflectance The principle of the VCT algorithm is
257 VOGELMANN et al MONITORING LANDSCAPE CHANGE FOR LANDFIRE USING MULTI-TEMPORAL SATELLITE IMAGERY AND ANCILLARY DATA
Fig 5 Typical integrated forest -score (IFZ) temporal profiles of major forest cover change processes (andashc) and non-forest (d) that are used to characterize different change processes From [9] (a) Persisting forest (b) Forest disturbance (c) Afforestation (d) Persisting non-forest
based on the following known properties of forest disturbance and post-disturbance recovery processes [9]
bull During the growing season forest is one of the darkest vegshyetated surfaces in satellite images in many spectral bands [25]ndash[27]
bull Undisturbed naturally growing forests typically have relshyatively stable spectral signatures from one year to another
bull A disturbance generally results in an abrupt spectral change
bull Depending on the nature of the disturbance the resultant change signal in the spectral data can last several years or longer For disturbances followed by post-disturbance recovery it takes many years for trees to reestablish while a conversion of forest to non-forest land uses will result in non-forest signals in the years following the change
The VCT algorithm works by simultaneously evaluating all obshyservations provided by a LTSS for each pixel and determines the land cover and change process for that pixel based on its spec-tralndashtemporal properties The algorithm consists of two major processes The first is individual image masking and normalshyization In this step each image is analyzed independently to create a mask in which confident forest pixels are identified In addition water cloud cloud shadow cloud edge and snow are flagged and output as a mask image The established confishydent forest pixels are then used as a reference to normalize all pixels in that image and several indexes (which are measures of the likelihood of those pixels being forest pixels) are calculated Once this step is complete for all images of a LTSS the derived indices as well as the masks are used in a time series analysis process to produce forest change products
The time series analysis of forest cover is used to detershymine change and non-change classes and to derive a suite of attributes for characterizing the detected changes It is based primarily on the physical interpretation of the integrated forest
-score (IFZ) [9] In short the IFZ measures the likelihood of a pixel being a forest pixel its value should change in response to forest change Fig 5 shows typical temporal profiles of the IFZ for major land cover and forest change processes For persisting forest land where no major disturbance occurred during the years being monitored the IFZ value stays low and is relatively stable throughout the monitoring period [Fig 5(a)] A significant increase in the IFZ value indicates the occurrence of a disturbance in that year A sequence of gradually decreasing IFZ values following that disturbance represents the regenerashytion process of a new forest stand [Fig 5(b)] Conversion from non-forest to forest (afforestation) or regeneration of a forest stand from a disturbance that occurred before the first LTSS acquisition is identified by the gradual decrease of the IFZ from high values to the level of undisturbed forests [Fig 5(c)] Finally Fig 5(d) shows persisting non-forest as high and variable throughout the time series While certain crops may be spectrally similar to forest and can have low IFZ values during certain seasons their IFZ values likely will fluctuate as surface conditions change from one year to another due to harvest and crop rotation
To further illustrate the application of the IFZ we have inshycluded a time series of Landsat image subsets showing a disturshybance occurring between 1989 and 1990 which later regenershyates back into full-canopy forest (Fig 6) The plus ( ) sign inshydicates the location of the IFZ values plotted on the graph below the images Note how the persisting forest shows consistent low
258 IEEE JOURNAL OF SELECTED TOPICS IN APPLIED EARTH OBSERVATIONS AND REMOTE SENSING VOL 4 NO 2 JUNE 2011
Fig 6 A visual representation of how the Vegetation Change Tracker algorithm detects a forest disturbance
values leading up to 1989 (indicating persisting forest) after which a disturbance (clear cut) occurs The IFZ values jump sharply between those two years and then slowly return back to a consistent trend of low values approximately nine years folshylowing the disturbance
For each disturbance detected by the VCT a disturbance year and several disturbance magnitude measures are calculated to characterize that disturbance These measures are output as spashytial products It should be noted that first-order change products only indicate if and when a disturbance occurred Determining the cause and severity of the disturbances are completed in subshysequent processes as described in the following step
C Vegetation Change Tracker Product Attribution and Cleanup
A final RSLC product must not only show where the disturshybances occurred but also indicate a date of disturbance (to the nearest year) a cause of disturbance (referred to as causality) as well as the severity of the disturbance Combinations of VCT output products (disturbance magnitude disturbance year burn ratios etc) are used in conjunction with other multi-temporal data sources such as those from Monitoring Trends in Burn Severity (MTBS) and the LANDFIRE Events database to inshyfuse the necessary attributes into a final change product This entire process is shown in Fig 4
Disturbance date is assigned to a change product by analyzing the ldquoYear of Disturbancerdquo data set ndash a standard VCT product For a typical forest disturbance the IFZ value increases sharply
following a consecutive period of low IFZ values [Fig 5(b)] While the actual occurrence of the disturbance is somewhere beshytween the acquisition dates of the two consecutive images that show the sharp increase disturbance year is defined by the acshyquisition year of the later image In cases where an image gap occurs the year of disturbance year could be late by the number of years between the two images Having one image for each year of analysis would eliminate this issue but acquisition of at least one good scene for each pathrow every year is not assured due to issues of cloud cover and image quality
Disturbance magnitude refers to the spectral change resulting from a disturbance The VCT calculates three disturbance magshynitudes with the first using the IFZ the second using the Normalized Difference Vegetation Index (NDVI) and the third using the Normalized Burn Ratio (NBR) [9] These disturbance magnitude products are used (either individually or in comshybination) to derive regional severity of change information whereby severity is attributed as three classes (high medium or low) Severity levels are developed through interactive assessshyment using standard deviation information from the disturbance magnitude products
Assigning causality is the final attributing activity and this is largely a ldquohands-onrdquo process In the majority of cases the VCT changes are assumed to be related to forest cutting acshytivity Other possible disturbances include fire insects and disshyease or blow down To determine if any of these latter disturshybances are a factor we rely on ancillary data sources such as the MTBS or the LANDFIRE Events database While the VCT
259 VOGELMANN et al MONITORING LANDSCAPE CHANGE FOR LANDFIRE USING MULTI-TEMPORAL SATELLITE IMAGERY AND ANCILLARY DATA
Fig 7 A representation of a finalized VCT-derived disturbance product showing forest clearing disturbances near Samantha AL The color shades represent the year of disturbance (red = 2000 blue = 2001 green = 2002 and orange = 2003) whereas the color intensity represents the severity of change (lighter color represents less severe disturbance)
process captures many of the more severe types of forest change (eg clear cutting high severity fire) it is not as effective at capshyturing the more subtle types of change (eg thinning prescribed fire) especially in non-forested ecosystems In these cases the LANDFIRE Events data help to supplement the VCT change inshyformation by providing the spatial location and extent of these lesser-detectable disturbances Additionally analysts spend a notable amount of time analyzing the various input images and their associated VCT-derived datasets (such as NBR and NDVI) to help determine andor refine the disturbance causes Causality determination is a current area of interest and research
Because VCT change products are computed pixel by pixel the first-order output products are usually replete with single-pixel (or small groupings of pixels) disturbances (Fig 4) LANDFIRE managers determined that disturbed areas of fewer than 50 contiguous pixels (approximately 45 ha) as too small for the purposes of large area updating Therefore before the attributed RSLC product is complete it must be ldquocleanedrdquo by removing the ldquounwantedrdquo disturbance pixels The cleaning process is accomplished by using standard image processing techniques where clusters of pixels are verified as having either greater than 49 or less than 50 contiguous pixels If there are fewer than 50 contiguous pixels they are purged
D Final RSLC Product
As a final step the data are examined for possible mapping inaccuracies or other possible errors through visual inspection or analyst-driven processing In many cases heads-up editing using standard image processing tools are used to remove ershyrors andor make final adjustments to the data The final RSLC product is a stack of thematic raster layers where each layer represents a year of disturbance with severity and causality atshytributed to each disturbance pixel Our first goal for LANDFIRE updating is to generate change data from 1999 through 2009 but ultimately our plans are to generate annual change information dating back to 1984 A subset of a final RSLC product is shown in Fig 7 This product then becomes a baseline product used to update other LANDFIRE data sets (eg existing vegetation) through use of successional modeling and related techniques
V INSECTS AND DISEASE
A General Overview
As described earlier in this paper we have made significant headway in terms of developing approaches for monitoring major land cover changes related to logging and fire Howshyever there are also many more subtle ldquowithin-staterdquo changes occurring across landscapes including those related to insect damage wind pollution climate and succession These types of changes tend to be relatively difficult to detect and to assign causality using remote-sensing technology Nonetheless the cumulative impacts of these types of ldquosubtlerdquo changes can have substantial impacts on various ecosystem processes and result in changes in carbon balance biogeochemical cycling microclimate patterns of biodiversity and fire [28]ndash[31]
There are a number of reasons why detection and monitoring of gradual ecosystem change using remote sensing technology can be problematic In the past such assessments could be hinshydered by the cost of the data With free access to the Landsat data archive as well as access to various derived Moderate Resolushytion Imaging Spectroradiometer (MODIS) and Advanced Very High Resolution Radiometer (AVHRR) products this problem should be alleviated Other issues that have mired research of gradual ecosystem change include but are not limited to the following 1) insufficient understanding of normal spectral conshyditions and variability which compromises our ability to detect ldquoabnormalrdquo spectral conditions 2) availability of adequate field information to aid analytical processes and 3) lack of image data acquired at appropriate times In spite of these difficulshyties successful investigations using remote sensing for detecting and monitoring subtle and gradual within-state changes have been reported [32]ndash[34] For updating LANDFIRE data sets we will focus primarily on identifying disturbances related to major within-state changes Some of the more obvious examples inshyclude major insect outbreaks such as those caused by the mounshytain pine beetle spruce budworm and gypsy moth [35]ndash[37]
B Methodology for Detecting Insect and Disease Damage
One of the difficulties of developing operational methodology for assessing insect damage is that the spectral responses differ depending upon insect species and host species As an example the western spruce budworm is a defoliator [38] and the deshyfoliation caused by the budworm is a multi-year event While most trees can withstand single defoliation events mortality will occur after repeated defoliation over successive years Such reshypeated defoliation will cause gradual changes in the health of the conifer tree species affected Conversely the mountain pine bark beetle is a borer and infestations caused by this insect imshypact the trees rapidly with a predictable series of green to red to grey vegetation color phases [39] [40] Mortality caused by pine borers can be very rapid following the initial outbreak and thus the spectral changes of the conifer tree canopies can simshyilarly be very rapid following outbreak We do not believe that development of a single approach for mapping and monitoring damage caused by a variety of insects impacting a wide variety of tree species is likely Rather we believe that it will be better to employ a suite of methods for assessing insect damage and
260 IEEE JOURNAL OF SELECTED TOPICS IN APPLIED EARTH OBSERVATIONS AND REMOTE SENSING VOL 4 NO 2 JUNE 2011
Fig 8 Comparison between MODIS-derived NDVI difference images between 2003 and 2008 (left) and insect damage mapped by the Forest Health Monitoring Program in the southern Rocky Mountains of Colorado and Wyoming In the left image red indicates the largest seasonal NDVI decrease orange represents moderate NDVI decreases and white indicates low NDVI decreases In the Forest Health Monitoring data (right) red indicates where insect damage was mapped in three or more years whereas white represents areas mapped as insect damage in two years
that the particular approach employed will be specific to the inshysect and the trees involved
In previous work we have demonstrated several different apshyproaches that appear promising for operational insect damage mapping and monitoring In one study we were able to use Landsat time series data for mapping the multiple defoliations caused by the western spruce budworm [36] The general apshyproach employed included the following 1) acquisition of a multi-year Landsat time series data set (preferentially selecting for late summer and early autumn scenes) 2) generating regresshysion statistics of time versus spectral index for each pixel in the time series 3) developing spatial data layers depicting the stashytistics including slope and statistical significance of the time versus spectral index relationship and 4) comparing with spashytial insect damage information acquired aerially by the Forest Health Monitoring program (FHM) [41] to verify that the patshyterns developed from the imagery were reasonable This particshyular approach can be especially appropriate for detecting mapshyping and monitoring gradual changes taking place over multiple years For this approach to work it is important that remotely-sensed data be normalized in some manner such as conversion to at-sensor reflectance Selection of the appropriate spectral index will depend upon the perturbation being investigated but in the case of western spruce budworm both Short-waveNear infrared index (SWIRNIR) [42] [43] and Normalized Differshyence Vegetation Index (NDVI) were found to be useful While the latter was not as effective as the former both were shown to work
In assessments of pine beetle damage the regression apshyproach that worked well for detecting western spruce budworm did not work largely because the damage caused by this particular insect is rapid and gradual spectral change is not
characteristic of mountain pine beetle damage However we did find that traditional ldquobeforendashafterrdquo difference data images produced using either NDVI or SWIRNIR differences captured the damage quite well We also found another approach to be particularly useful which includes the following 1) acquisition of biweekly or weekly MODIS-derived NDVI composites [44] from throughout multiple growing seasons (eg 2000 through 2008) 2) generating the median NDVI value for each yearrsquos growing season for each pixel 3) deriving images that depict deviations from the median NDVI values for each pixel and 4) comparing reference information such as that acquired by the FHM program An image depicting MODIS-derived change information in an area experiencing significant mounshytain pine beetle damage is shown in Fig 8 adjacent to insect damage information provided by FHM In this case general patterns between MODIS change and FHM are reasonably similar although MODIS detected a number of ldquochangesrdquo not mapped as damage by FHM One of our caveats regarding use of MODIS data (and other sources of remotely-sensed data) for change assessments is that seasonality and phenology can have marked influences on remotely-sensed signals and that it can be difficult to separate the changes that we are interested in mapping (in this case insect damage) from other types of change (eg seasonality) and that we need to be cautious in interpreting spectral changes In Fig 8 the most significant MODIS spectral changes are related to the pine beetle damage and in general we believe that MODIS data should be very useful for capturing US-scale interannual patterns of insect damage At the same time we strongly suspect that some of the changes in Fig 8 (most notably in the eastern part of the MODIS-derived change product) are related to seasonality issues and we need a way to reduce ldquofalse alarmsrdquo related to
261 VOGELMANN et al MONITORING LANDSCAPE CHANGE FOR LANDFIRE USING MULTI-TEMPORAL SATELLITE IMAGERY AND ANCILLARY DATA
these types of events Nonetheless we believe that the MODIS data were effective in depicting insect damage and we believe that the similar approaches using other sensors such as the Landsat TM and using other indices such as the SWIRNIR will also be effective in detecting pine beetle damage It is noteworthy that while the spatial resolution of the MODIS is much coarser than TMETM+ (250 m for visible and NIR channels of MODIS versus 30 m for Landsat TMETM+) the high temporal frequency of MODIS data acquisitions helps to compensate for the spatial resolution issues The generation of weekly and biweekly composites from MODIS data [44] facilitates the use of the data making inter-annual comparisons much more routine which is one step closer to operational monitoring As yet insects and disease information has not been incorporated into the RSLC but the long range plans include doing so
VI CONCLUSIONS FUTURE RESEARCH OPPORTUNITIES
AND CHALLENGES
A General Overview
One of the major values of LANDFIRE is that it provides consistent and complete spatial products of the United States relevant to many regional to national scale applications [2] A major challenge for us will be not only to keep the data sets current but also to be able to do this in an efficient and cost effective manner At present our goal is to update the land cover data sets on an annual to biennial basis While we have made good progress towards meeting this goal there are a number of technical challenges facing us and we anticipate that we will need to continue refining the process in the foreseeable future Following are a few key areas that we believe will be important research topics for us over the next several years
B Alternative Sources of Remotely-Sensed Data
Both Landsat 5 and Landsat 7 missions are well beyond their design lives and could malfunction at any time The successor to Landsats 5 and 7 is planned for launch in December 2012 and thus it is possible that we could have a Landsat data gap in the near future This would adversely impact all aspects of LANDshyFIRE updating We are currently in the process of identifying and evaluating potential alternative data sources of satellite imshyagery for updating LANDFIRE data sets Some previous studies [45] [46] have made headway towards using some of these alshyternative sensors for filling a potential data gap From our own work it appears that the spectral and radiometric properties of AWiFS are very suitable for updating LANDFIRE data sets From our analyses we believe that we will be able to inter-calishybrate AWiFS and Landsat data and be able to use one source of information to replace the other if necessary
C Structure Mapping
Landsat data can provide extensive spatial coverage of forest structure in the horizontal dimension and are useful for canopy percentage cover estimation However these data sets are relshyatively insensitive for assessing the vertical dimension Thus forest canopy height which is an important variable for modshyeling fire fuel has been a challenge to quantify adequately for
the LANDFIRE project With the development of new sensors such as Lidar and InSAR new data fusion methods have demonshystrated improvements in canopy height estimation [47] [48] Further investigation and application of these methods on the national scale will bring in a revolution of canopy height mapshyping for the next generation LANDFIRE products Once a good canopy height data layer is developed for any given point in time we will be able to incorporate VCT-derived change inshyformation and model ensuing height changes based on canopy growth models
D Development of Automatic Methods for Assigning Change Causality
While the VCT is very good at detecting forest changes that have taken place the algorithm does not assign causality to the changes Thus we know what has changed but not necessarily what it has changed to The types of changes can have large efshyfects on fire fuel As an example a harvested forest will have difshyferent fire fuel conditions than a similar forest burned by wildshyfire In addition the two will have different growth trajectories that will also modify fire fuel conditions Thus far during our updating process we have spent a lot of time assigning causality and much of this work has been done using largely manual methods As yet we do not have an easy way to assign causality to changed pixels Automatic or semi-automatic assignment of causality of these changes is a topic that we are beginning to exshyplore We envision that assessments that include regional-based assessments of change such as FIA and UGSS Trends data [49] when used in conjunction with the VCT data output will facilshyitate the labeling process
E Extending MTBS Data Using Multispectral Scanner Data
Currently MTBS has been characterizing wildland fire mostly using Landsat TM and ETM+ data Indexes that use the shortwave infrared (TM band 7) tend to be better at charactershyizing burn severity than indexes that do not use this spectral region such as the NDVI Nonetheless the NDVI can be useful for mapping at least general wildand fire and severity characteristics We would like to add to the MTBS baseline by including assessments derived from Multispectral Scanner (MSS) data collected from 1972 through 1984 MSS data do not have the spatial resolution of the TMETM+ sensors nor do they have the radiometric fidelity or spectral resolution of the more advanced sensors Despite these limitations we believe that MSS data will be useful for providing general fire trends that occurred during this time period which will help put the more recent fires into a better historical context
F Data Availability
For VCT to work effectively good time series data either at annual or biennial intervals are advantageous It is also imporshytant that individual data sets being analyzed within the LTSS represent similar phenological conditions Unfortunately many parts of the country are very cloudy and acquisition of good quality data meeting these requirements is not guaranteed One possible solution is to use composite images comprised of the ldquobest pixelrdquo for a given scene representing a particular time peshyriod For instance if several partly cloudy scenes are the best
262 IEEE JOURNAL OF SELECTED TOPICS IN APPLIED EARTH OBSERVATIONS AND REMOTE SENSING VOL 4 NO 2 JUNE 2011
data sets for summer of a particular year we can use various compositing approaches to ldquocreaterdquo a good data set for that time period to use in the LTSS Previous studies [50]ndash[52] have demonstrated that such composites can be generated efficiently and consistently and hold much promise for filling potential gaps in data sets As a corollary to this we do not believe that we will be able to use the VCT approach for Alaska or Hawaii due to a paucity of available data sets to create a good LTSS For these areas we will likely need to use MODIS data to generate time series information The best approaches for incorporating MODIS data into the LANDFIRE updating process has not been worked out yet
G Other RSLC Research Topics
While VCT has been shown to be very effective at mapshyping changes related to forest harvesting additional refinement needs to be done so that it is also effective in non-forested enshyvironments Much of the western United States is shrubland and many of these areas burn frequently and are of great conshycern to natural resource managers Currently the characterizashytion of these areas using VCT has had mixed success Addishytional work will need to be done to spectrally characterize non-forested changes and then this information will need to be inshycorporated into the VCT algorithm
H Final Thoughts
Developing a nationwide operational terrestrial monitoring system using remotely-sensed data sets requires signifishycant commitment and resources While developing national wall-to-wall land cover change data sets has been a priority for many groups over the last several decades [53] [54] we are just now at the point where we are beginning to implement these goals There are still significant challenges ahead of us but we believe that the research community as a whole is making great strides towards developing such a system While the work described in this paper has a strong focus on disturbance proshycesses related to LANDFIRE we believe that the RSLC data sets described will have application to a broader community
ACKNOWLEDGMENT
The authors thank personnel of the Department of the Interior Office of Wildland Fire Coordination US Forest Service Office of Fire and Aviation Management and Science and Application Branch of the Center for Earth Earth Resources Observation and Science (EROS) Additionally the authors thank L Yang and G Xian for helpful reviews of a previous version of this manuscript
REFERENCES
[1] The National Fire Plan NFP 2009 [Online] Available wwwhealthyshyforestsandrangelandsgov
[2] The LANDFIRE Charter USDA and DOI 2004 [Online] Available wwwlandfiregov
[3] M G Rollins ldquoLANDFIRE A nationally consistent vegetation wild-land fire and fuel assessmentrdquo Int J Wildland Fire vol 18 no 3 pp 235ndash249 May 2009
[4] C Homer J Dewitz J Fry M Coan N Hossain C Larson N Herold A McKerrow J N VanDriel and J Wickham ldquoCompletion of the 2001 national land cover database for the conterminous United Statesrdquo Photogrammetric Engineering and Remote Sensing vol 73 no 4 pp 337ndash341 Apr 2007
[5] J R Quinlan C45 Programs for Machine Learning San Mateo CA Morgan Kaufmann 1993
[6] P Comer D Faber-Langendoen R Evans S Gawler C Josse G Kittel S Menard M Pyne M Reid K Schulz K Snow and J Teague Ecological Systems of the United States A Working Classhysification of US Terrestrial Systems Arlington VA NatureServe 2003
[7] C Homer C Huang L Yang B Wylie and M Coan ldquoDevelopshyment of a 2001 national landcover database for the United Statesrdquo Photogrammetric Engineering and Remote Sensing vol 70 no 7 pp 829ndash840 Jul 2004
[8] C E Woodcock et al ldquoFree access to Landsat imageryrdquo Science vol 320 no 5879 p 1011 May 2008
[9] C Huang S N Goward J G Masek N Thomas Z Zhu and J E Vogelmann ldquoAn automated approach for reconstructing recent forest disturbance history using dense Landsat time series stacksrdquo Remote Sensing of Environment 2009 DOI101016jrse200908 017
[10] C Toney M Rollins K Short T Frescino R Tymcio and B Peshyterson R E McRoberts G A Reams P C Van Deusen and W H McWilliams Eds ldquoUse of FIA plot data in the LANDFIRE Projectrdquo in Proc 7th Annu Forest Inventory and Analysis Symp Portland ME Oct 3ndash6 2005 pp 309ndash319
[11] D C Lutes R E Keane J F Caratti C H Key N C Benson S Sutherland and L J Gangi FIREMON Fire Effects Monitoring and Inventory System US Department of Agriculture Forest Service Rocky Mountain Research Station Fort Collins CO Gen Tech Rep RMRS-GTR-164-CD 2006
[12] E Reinhardt and C L Crookston The Fire and Fuels Extension to the Forest Vegetation Simulator US Department of Agriculture Forest Service Rocky Mountain Research Station Ogden UT Gen Tech Rep RMRS-GTR-116 2003
[13] C Toney J D Shaw and M D Nelson W McWilliams G Moisen and R Czaplewski Eds ldquoA stem-map model for predicting tree canopy cover of Forest Inventory and Analysis (FIA) plotsrdquo in Proc Forest Inventory and Analysis Symp 2008 Park City UT Oct 21ndash23 2008 Proc RMRS-P-56CD
[14] C Toney and M C Reeves ldquoEquations to convert compacted crown ratio to uncompacted crown ratio for trees in the Interior Westrdquo Western J Applied Forestry vol 24 no 2 pp 76ndash82 Apr 2009
[15] E Reinhardt D Lutes and J Scott P L Andrews and B W Butler Eds ldquoFuelCalc A method for estimating fuel characteristicsrdquo in Fuels ManagementndashHow to Measure Success Conf Proc Portland OR Mar 28ndash30 2006 pp 273ndash282 Proc RMRS-P-41
[16] Elevation Derivatives for National Applications USGS 2005 [Online] Available httpednausgsgov
[17] State Soil Geographic (STATSGO) Database USDA NRCS 2005 [Online] Available httpwwwncgcnrcsusdagovprodshyuctsdatasetsstatsgoindexhtml
[18] S W Running and E R Hunt ldquoGeneralization of a forest ecosystem process model for other biomes BIOME-BGC and an application for global scale modelsrdquo in Scaling Physiological Processes Leaf to Globe Burlington MA Academic Press 1993 pp 141ndash157
[19] R E Keane M G Rollins C H McNicoll and R A Parsons Preshydictive Landscape Modeling Using Gradient-Based Sampling Remote Sensing and Ecosystem Simulation US Department of Agriculture Forest Service Rocky Mountain Research Station Fort Collins CO 2002 Gen Tech Rep RMRS-GTR-92
[20] J Epting D Verbyla and B Sorbel ldquoEvaluation of remotely sensed indexes for assessing burn severity in interior Alaska using Landsat TM and ETM+rdquo Remote Sensing of Environment vol 96 no 3ndash4 pp 328ndash339 Jun 2005
[21] C H Key and N C BensonD C Lutes Landscape Assessment Ground Measure of Severity The Composite Burn Index FIREMON Fire Effects Monitoring and Inventory System USDA Forest Service Rocky Mountain Research Station Ogden UT 2005 General Technical Report RMRSGTR-164-CDLA1-LA51
[22] J D Miller and S R Yool ldquoMapping forest post-fire canopy conshysumption in several overstory types using multi-temporal Landsat TM and ETM datardquo Remote Sensing of Environment vol 82 no 2ndash3 pp 481ndash496 Oct 2002
[23] A Singh ldquoDigital change detection techniques using remotely-sensed datardquo Int J Remote Sensing vol 10 no 6 pp 989ndash1003 Jun 1989
[24] Glossary of Wildland Fire Terminology NWCG 2009 [Online] Availshyable httpwwwnwcggovpmspubsglossaryindexhtm
[25] J E Colwell ldquoVegetation canopy reflectancerdquo Remote Sensing of Enshyvironment vol 3 no 3 pp 174ndash183 Mar 1974
263 VOGELMANN et al MONITORING LANDSCAPE CHANGE FOR LANDFIRE USING MULTI-TEMPORAL SATELLITE IMAGERY AND ANCILLARY DATA
[26] S N S N Goward K F Huemmrich and R H Waring ldquoVisibleshynear infrared spectral reflectance of landscape components in western Oregonrdquo Remote Sensing of Environment vol 47 no 2 pp 190ndash203 Feb 1994
[27] K F Huemmrich and S N Goward ldquoVegetation canopy PAR absorpshytance and NDVI An assessment for ten tree species with the SAIL modelrdquo Remote Sensing of Environment vol 61 no 2 pp 254ndash269 Aug 1997
[28] G M Lovett C D Canham M A Arthur K C Weathers and R D Fitzhugh ldquoForest ecosystem responses to exotic pests and pathogens in eastern North Americardquo BioScience vol 56 no 5 pp 395ndash405 May 2006
[29] G L W Perry and J D A Millington ldquoSpatial modeling of successhysion-disturbance dynamics in forest ecosystems Concepts and examshyplesrdquo Perspectives in Plant Ecology Evolution and Systematics vol 9 no 3ndash4 pp 191ndash210 Mar 2008
[30] M G Turner ldquoLandscape ecology What is the state of the sciencerdquo Annu Rev Ecology Evolution and Systematics vol 36 pp 319ndash344 Dec 2005
[31] T J Parker K M Clancy and R L Mathiasen ldquoInteractions among fire insects and pathogens in coniferous forests of the interior western United States and Canadardquo Agricultural and Forest Entomology vol 8 pp 167ndash189 Aug 2006
[32] R D Beck R S Maxwell V H Treat and H C Dethloff ldquoTimeless Heritage A History of the Forest Service in the Southwestrdquo US Dept Agriculture Forest Service FS-409 1988
[33] A T Roder J Hill B Duguy J A Alloza and R Vallejo ldquoUsing long time series of Landsat data to monitor fire events and post-fire dynamics and identify driving factors A case study in the Ayora region (eastern Spain)rdquo Remote Sensing of Environment vol 112 no 1 pp 259ndash273 Jan 2008
[34] S M Souza and D Roberts ldquoMapping forest degradation in the Amazon region with Ikonos imagesrdquo Int J Remote Sensing vol 26 no 3 pp 425ndash429 Mar 2005
[35] W A Kurz C C Dymond G Stinson G J Rampley E T Neilson A L Caroll T Ebata and L Safranyik ldquoMountain pine beetle and forest carbon feedback to climate changerdquo Nature vol 452 no 7190 pp 987ndash990 Apr 2008
[36] J E Vogelmann B Tolk and Z Zhu ldquoMonitoring forest changes in the southwestern United States using multitemporal Landsat datardquo Remote Sensing of Environment vol 113 no 8 pp 1739ndash1748 Aug 2009
[37] K M De Beurs and P A Townsend ldquoEstimating the effect of gypsy moth defoliation using MODISrdquo Remote Sensing of Environment vol 112 no 10 pp 3983ndash3990 Oct 2008
[38] D G Fellen and J E Dewey ldquoWestern spruce budwormrdquo USDA Forest Service Forest Insect and Disease Leaflet vol 53 1982
[39] L E Maclauchlin J E Brooks and J C Hodge ldquoAnalysis of historic western spruce budworm defoliation in south central British Columbiardquo Forest Ecology and Management vol 226 no 1ndash3 pp 351ndash356 May 2006
[40] M A Wulder C C Dymond J C White D G Leckie and A L Caroll ldquoSurveying mountain pine beetle damage of forests A review of remote sensing opportunitiesrdquo Forest Ecology and Management vol 221 no 1ndash3 pp 27ndash41 Jan 2006
[41] USDA Nov 2009 [Online] Available httpwwwfsfedus [42] J E Vogelmann and B N Rock ldquoAssessing forest damage in high-elshy
evation coniferous forests in Vermont and New Hampshire using Theshymatic Mapper datardquo Remote Sensing of Environment vol 24 no 2 pp 227ndash246 Mar 1988
[43] J E Vogelmann ldquoComparison between two vegetation indexes for measuring different types of forest damage in the northeastern United Statesrdquo Int J Remote Sensing vol 11 no 12 pp 2281ndash2297 Dec 1990
[44] C B Jenkerson and G Schmidt W T Pecora Ed ldquoeMODIS product access for large scale monitoringrdquo in 17th Memorial Symp Remote Sensing Denver CO Nov 16ndash20 2008
[45] G Chander ldquoInitial Data Characterization Science Utility and Misshysion Capability Evaluation of Candidate Landsat Mission Data Gap Sensorsrdquo Technical Report Landsat Data Gap Study 2007 [Online] Available httpcalvalcrusgsgovLDGSTphp
[46] M A Wulder J C White S N Goward J G Masek J R Irons M Herold W B Cohen T R Loveland and C E Woodcock ldquoLandsat continuity Issues and opportunities for land cover monitoringrdquo Remote Sensing of Environment vol 112 no 3 pp 955ndash969 Mar 2008
[47] A T Hudak M A Lefsky W B Cohen and M Berterretche ldquoInshytegration of lidar and Landsat ETM+ data for estimating and mapping forest canopy heightrdquo Remote Sensing of Environment vol 82 no 2ndash3 pp 397ndash416 Oct 2002
[48] W S Walker J M Kellndorfer E LaPoint M Hoppus and J West-fall ldquoAn empirical InSAR-optical fusion approach to mapping vegetashytion canopy heightrdquo Remote Sensing of Environment vol 109 no 4 pp 482ndash499 Aug 2007
[49] T R Loveland T L Sohl S V Stehman A L Gallant K L Sayler and D E Napton ldquoA strategy for estimating the rates of recent United States land-cover changesrdquo Photogrammetric Engineering and Remote Sensing vol 68 no 10 pp 1091ndash1099 Oct 2002
[50] D P Roy J Ju P Lewis C Schaaf F Gao M Hansen and E Lindquist ldquoMulti-temporal MODIS-Landsat data fusion for relative rashydiometric normalization gap filling and prediction of Landsat datardquo Remote Sensing of Environment vol 112 no 6 pp 3112ndash3130 Jun 2008
[51] D P Roy J Ju K Kline P L Scaramuzza V Kovalskyy M Hansen T R Loveland E Vermote and C Zhang ldquoWeb-enabled Landsat Data (WELD) Landsat ETM+ composited mosaics of the contermishynous United Statesrdquo Remote Sensing of Environment 2009 DOI10 1016jrse200908011
[52] J Ju and D P Roy ldquoThe availability of cloud-free Landsat ETM+ data over the conterminous United States and globallyrdquo Remote Sensing of Environment vol 112 no 3 pp 1196ndash1211 Mar 2008
[53] ldquoFacing Tomorrowrsquos ChallengesmdashUS Geological Survey Science in the Decade 2007ndash2017rdquo USGS 2007 US Geological Survey Circular 1309 x + 70 p
[54] ldquoGrand Challenges in Environmental Sciencesrdquo National Research Council National Academy Press Washington DC 2001
James E Vogelmann received the PhD degree in plant biology from Indiana University Bloomington IN
He is a Research Ecologist at the USGS Center for Earth Resources Observation and Science (EROS) His research interests and publications focus on the use of Landsat data and other sources of geospatial information for mapping characterizing and monishytoring vegetation condition across large areas He is currently a member of the Landsat Science Team
Jay R Kost received the MS degree in space studies from the University of North Dakota Grand Forks ND in 1990
He has been with the USGS EROS since 1997 and currently works as a Senior Scientist on the LANDFIRE project His background includes multi-disciplinary work in spatial data management land cover and change mapping wetland science and fire science
Brian Tolk received the MA degree in geography from the University of Nebraska Lincoln in 1996 specializing in remote sensing and GIS
Working under various contractors he has been employed at the USGS EROS Sioux Falls SD since 1998 His research interests include landcoverland use change detection and remote sensing of water quality
264 IEEE JOURNAL OF SELECTED TOPICS IN APPLIED EARTH OBSERVATIONS AND REMOTE SENSING VOL 4 NO 2 JUNE 2011
Stephen Howard received the MS degree in geography from the South Dakota State University Brookings SD in 1984
He has been at the USGS EROS since 1985 His research interests include vegetation mapping and monitoring using satellite data
Karen Short received the BS degree in wildlife and fisheries science from the University of Arizona Tucson and the PhD degree in organismal biology and ecology from the University of Montana Misshysoula
She is a Research Scientist with Systems for Envishyronmental Management Missoula MT She has conshyducted much of her research in conjunction with preshyscribed fires in southwestern national parks studying responses of plants insects and birds to the burns She is currently the Reference Data Administrator for
the national LANDFIRE Project on contract through the Missoula Fire Sciences Laboratory
Xuexia Chen (Arsquo08) received the PhD degree in atmosphere environment and water resources from the South Dakota School of Mines and Technology Rapid City SD in 2004
She is currently a Senior Scientist with ASRC Research and Technology Solutions contractor to USGS EROS For the past ten years she has been working on image relative normalization spectral unmixing burn severity detection and fire combusted biomass estimation She has been heavily involved in mapping LANDFIRE existing vegetation
and structure since 2004 Dr Chen is currently a member of the American Geophysical Union (AGU)
the Sigma Xi and the Institute of Electrical and Electronics Engineers (IEEE)
post-fire effects
Chengquan Huang received the BS and MS degrees from Peking University China and the PhD degree from the University of Maryland College Park
He is a member of the Research Faculty in the Geshyography Department of the University of Maryland His research interests include characterization and monitoring of land cover biomass and ecosystem dynamics by integrating satellite and non-satellite observations
Kari Pabst received the BA degree in biology from Augustana College Sioux Falls SD and will graduate with the MS degree in geography from South Dakota State University Brookings SD in May 2010
She is employed by ASRC Research and Techshynology Solutions as a contractor to the USGS EROS She supports Fire Science and is currently working on the Monitoring Trends in Burn Severity Project Her research interests include fire ecology and using remote sensing and GIS as tools to map and monitor
Matthew G Rollins received the MS degree in forestry from the University of Montana and the PhD degree from the University of Arizona
He is Wildland Fire Science Team lead at the USGS EROS in Sioux Falls SD His recent research has included assessing changes in fire and landscape patterns under different wildland fire management scenarios relating fire regimes to landscape-scale biophysical gradients and climate variability and developing predictive landscape models of fire frequency fire effects and fuel characteristics
253 VOGELMANN et al MONITORING LANDSCAPE CHANGE FOR LANDFIRE USING MULTI-TEMPORAL SATELLITE IMAGERY AND ANCILLARY DATA
to train classification models 2) classification data sets were developed via supervised classification using decision and reshygression tree approaches [5] 3) a database consisting of several hundred thousand georeferenced field points known as the LANDFIRE Reference Database (LFRDB) was used to train the algorithms 4) the existing vegetation legend was based on NatureServersquos Ecological Systems classes which represents a nationally consistent midscale classification of vegetation units [6] 5) the vegetation structure data included canopy density (binned into 10 percentage classes) and canopy height (binned into several classes depending on life form type) and 6) a large number of ldquoancillaryrdquo spatial data sets were used to develop the final data products including data from the National Land Cover Database [7] digital elevation model data and soils data
The development of the LANDFIRE vegetation data layers required a full time team of over ten individuals representing fields of geography ecology and computer science and the project took about five years to complete As such it is not the type of endeavor that one would consider doing annually or even biennially Nonetheless potential users of the LANDshyFIRE data expressed concern early on in the project that the data sets being developed would be ldquoout-of-daterdquo for their areas of interest Thus it became evident at an early stage of the project that in order for LANDFIRE to be relevant to many users for a long period of time we would need to develop methods and approaches that would enable us to update the data sets on a regshyular basis and thus keep the data sets current and relevant
In fact the LANDFIRE Executive Charter (available at httpwwwlandfiregov) already had a provision for updating the LANDFIRE project to regularly update data products This directive is and will be instrumental in transitioning LANDshyFIRE from a project to a program and its implementation will be imperative for maintaining the timeliness and quality of products as the landscape changes The general update schedule for the LANDFIRE Program will be at biannual and decadal intervals with the first update scheduled for completion by October 2010 Biannual updating will involve modifying the original LANDFIRE data sets with interannual disturbance information (ie updating just those areas that have been determined to have undergone recent changes) while decadal ldquoupdatingrdquo is likely to consist of major remapping activities
Recently the USGS began providing Landsat imagery to users over the Internet at no cost [8] which effectively ended an era whereby Landsat data charges severely limited the scope and types of land-cover projects that could be undertaken Until reshycently the generation of any type of Landsat-based wall-to-wall US land-cover data set renewed annually would most likely have been considered cost prohibitive impractical and untenshyable Although Landsat data cost is no longer a barrier to impleshymenting large-area operational land-cover monitoring projects many other major challenges remain
The LANDFIRE updating process hereafter referred to as Remote Sensing of Landscape Change (RSLC) has four main elements These are 1) acquisition and compilation of field data 2) wildfire burn mapping as being done by the Monishytoring Trends in Burn Severity (MTBS) project 3) updating and analysis using the Vegetation Change Tracker (VCT [9]) and 4) mapping and incorporation of subtle intra-state changes
such as those related to insects and disease In this paper one of our objectives is to report the progress that we have made towards developing an operational land cover monitoring cashypacity with the LANDFIRE While there is still much research to be done the first three elements are reasonably well develshyoped and are approaching operational status whereas the fourth (related to insects and disease) is still largely in the research and development phase In addition to providing some of our positive results we will also share some of the challenges and potential problems that we foresee
II FIELD DATA
LANDFIRE mapping was supported by a vast database of field-sampled information known as the LANDFIRE Refshyerence Database (LFRDB) This and newly acquired field information continues to be an integral part of the RSLC effort The LFRDB currently comprises vegetation and fuel data from approximately 800000 geo-referenced sampling units located throughout the United States These field data were amassed by capitalizing on the existing information resources of outside entities such as the USFS Forest Inventory and Analysis (FIA) Program the USGS National Gap Analysis Program and state natural heritage programs Vegetation data drawn from these sources for use in LANDFIRE include natural community occurrence records estimates of canopy cover and height per plant taxon and measurements (eg diameter height crown ratio crown class density) of individual trees Fuel data include biomass estimates of downed woody material percentage cover and height of shrub and herb layers and canopy base height estimates Digital photos of the sampled units are archived when available While we will touch on some key points here Toney et al [10] explain in detail how these types of field data specifically those collected by FIA have been acquired incorporated into the LFRDB and used in LANDFIRE
Existing programs such as FIA have afforded LANDFIRE a wealth of useful data from forested systems including releshyvant measurements of millions of individual trees Data from non-forest systems have proven less readily available To help fill apparent gaps in data coverage LANDFIRE field crews were dispatched in the early stages of the national effort to collect data following The Fire Effects Monitoring and Inventory Protocol (FIREMON) [11] in target areas Efforts remain underway to acshyquire data from underrepresented areas and vegetation types and to incorporate additional records that will help inform LANDshyFIRE updates and enhance our monitoring capacity including re-measurements of sites already in the LFRDB At present the FIA Program is a key source of these repeated measures We are currently looking to additional monitoring efforts with pershymanent sampling arrays particularly in rangelands to augment the re-measurement data in the LFRDB as well as exploring use of the USFS Fire and Fuels Extension to the Forest Vegetation Simulator (FVS-FFE) [12] as a tool to model the development of stands that have not been repeatedly sampled in the field Inshyputs for FVS-FFE can be generated by querying the LFRDB
To meet all of the needs of LANDFIRE several key attributes must be systematically derived from the acquired data and also included in the LFRDB These attributes include existing and
254 IEEE JOURNAL OF SELECTED TOPICS IN APPLIED EARTH OBSERVATIONS AND REMOTE SENSING VOL 4 NO 2 JUNE 2011
potential vegetation type in the form of NatureServersquos Ecologshyical Systems [6] [10] tree canopy cover and height predicted from spatially explicit empirical models [13] uncompacted crown ratios [14] and several canopy fuel metrics (eg bulk density) derived from the FuelCalc program [15] At various stages in data compilation including after the attribution of Ecological Systems records are carefully screened for inforshymation or spatial errors Questionable data are either identified accordingly or removed from the LFRDB depending on conshyfidence in the assessment The remaining data points are then associated with a number of ancillary datasets via a series of spatial overlays These datasets include the Landsat image suite the National Land Cover Database [7] the digital elevashytion model and derivatives [16] soil depth and texture layers [17] and a set of 42 simulated biophysical gradient layers (eg evapotranspiration soil temperature degree days) The latter are generated using WX-BGC an ecosystem simulator derived from BIOME-BGC [18] and GMRS-BGC [19] The extracted values from each of these overlays are archived in the LFRDB for potential use as predictor variables in the mapping process
In 2008 LANDFIRE began developing a geodatabase augmenting the LFRDB to accommodate field records of treatshyments disturbances and other events that have considerably altered vegetation or fuel conditions since 1999 and which must be accounted for to accurately update the 2000-vintage LANDFIRE data As with the LFRDB this new ldquoEventsrdquo datashybase draws heavily upon the existing information resources of outside programs such as the USFS Forest Activity Tracking System Attributes that must be associated with each event include a brief description of the occurrence and the year in which it occurred Additional information sought but not required includes an indication of the severity of each event The bulk of the viable data acquired to date have come from federal agencies which often archive their fire and other acshytivity records in public or corporate clearinghouses Geospatial records of non-wildfire activities taking place on non-federal lands particularly private holdings are proving harder to come by and are relatively few in the LANDFIRE Events database
III MONITORING TRENDS IN BURN SEVERITY
A General Overview
Sponsored by the Wildland Fire Leadership Council (WFLC) the Monitoring Trends in Burn Severity (MTBS) project is a five-year effort that commenced in 2006 The project was initiated in response to a General Accounting Ofshyfice recommendation to develop and implement a standardized comprehensive approach to assess burn severity across the various land management agencies It was also initiated to monitor the effectiveness of the National Fire Plan and Healthy Forest Restoration Act A major goal of the project is to provide nation-wide baseline information to assess synoptically the environmental impacts and trends of fire Fire is a major agent of landscape change especially throughout the western and southeastern United States and the MTBS data sets are an important component of RSLC
Many previous investigations have shown the utility of satelshylite-based multispectral data to assess and monitor ecosystems
Fig 2 Fire Occurrence Database recorded fires (1984ndash2008) in the lower 48 states The large fires were mapped by the Monitoring Trends in Burn Severity project Note mis-located fires in Atlantic Ocean and number of fires reported between TX and NM
[20]ndash[23] Assessing the severity of present-day fires is feasible using a number of existing satellite platforms but due to limited spatial extent and temporal depth providing a comprehensive historical baseline of detailed information using some of these platforms is not possible The MTBS project was implemented to take advantage of satellite-based techniques advances in computing capacity and the existing long-term archive of Landsat satellite data covering the United States The project is a joint effort between the US Forest Servicersquos Remote Sensing Applications Center (RSAC) and the US Geological Surveyrsquos Earth Resources Observation and Science Center (EROS) Center and its mandate is to map the severity of all ldquolargerdquo fires that have occurred in the United States since 1984 ldquoLargerdquo is defined as greater than 1000 acres in the western US and greater than 500 acres in the eastern US
For the MTBS project ldquoburn severityrdquo refers to the effects of fire on the above-ground biomass This definition is adapted from that of the term ldquofire severityrdquo in the National Wildfire Coordination Group (NWCG) Glossary of Wildland Fire Terms [24] ldquoDegree to which a site has been altered or disrupted by fire loosely the product of fire intensity and residence timerdquo Furthermore burn severity is presumed to 1) occur on a grashydient 2) manifest as a mosaic within a fire perimeter and 3) be ldquomappablerdquo using remote-sensing techniques
B Fire Occurrence Database
An integral component of the MTBS project is a comprehenshysive fire-occurrence database (FOD) This information supports the effort to identify appropriate Landsat imagery Over 28000 historical fire records (1984ndash2008) from all federal land manshyagement agencies along with comparable information from states have been compiled into a FOD providing information on fire locations and dates This database has some imperfecshytions including duplication of fire data points and geospatial errors but despite these occasional problems the data base is a valuable starting point for MTBS mapping Locations of 25700 fires included in the FOD for the conterminous US are shown in Fig 2
255 VOGELMANN et al MONITORING LANDSCAPE CHANGE FOR LANDFIRE USING MULTI-TEMPORAL SATELLITE IMAGERY AND ANCILLARY DATA
Fig 3 Example of monitoring trends in burn severity mapping process
C Assessment Strategies
The MTBS project is based upon the USGS archive of Landsat TM and ETM+ imagery dating back to 1984 Using the fire location date and assessment strategy as a guide imagery from the archive is selected for analysis Because a fire occurs at a ldquomomentrdquo in time selecting the best imagery to capture its effects is an important consideration The MTBS project draws upon three different assessment strategies 1) extended assessment (EA) 2) initial assessment (IA) and 3) single-scene assessment For both EA and IA images from two dates (one prefire and one postfire) are compared to assess fire severity For EA the post-fire image is selected to represent the ldquopeak of greenrdquo during the next growing season By this means some delayed mortality can be accounted for in the assessment This approach is generally used for forest and some shrub-land fires For IA the postfire image is selected to represent conditions soon after the fire is out This approach is used for some shrubland and grassland fires when the fire scar vanishes quickly due to vegetation recovery or weathering Single-Scene Assessment is done sparingly and only when suitable prefire imagery is not available commonly due to cloud cover For any two-scene assessment (EA or IA) it is important to match the phenology and illumination geometry of the scenes as best possible in order to assess changes due to fire not changes due to seasonality or other temporal artifacts
D Image Processing
All imagery is precision terrain corrected and calibrated to at-satellite reflectance Thematic Mapper and Enhanced Thematic Mapper + data sets are preferred in part because the second shortwave infrared band (Band 7 208ndash235 m) from this source has been found to be very effective for burn mapshyping Using an algorithm similar to the Normalized Difference Vegetation Index (NDVI) band 7 is combined with the near
m) to derive the normalized infrared band (Band 4 076ndash090 burn ratio (NBR)
Burn severity is determined after the pre-fire and post-fire imshyages are selected NBR data sets are generated and difference images are calculated from the pre- and post-fire NBR data sets (dNBR Fig 3)
E Burn Severity Assessment
Relatively high dNBR values in the resulting spatial data sets are interpreted as areas of vegetation loss In other words burn severity mapping as described here rests on the assumption that higher dNBR values are evidence of more severe effects of fire (ie a greater loss of aboveground vegetation) This assumption has been tested and supported by the analysis of data collected from several thousand field sites visited over the last decade [21] Using this foundation skilled analysts interpret the dNBR image to categorize burn severity into five thematic classes High Moderate Low Unburned to Low and Increased Greenness (areas with more vegetation after the fire) Using on-screen digitizing analysts create a perimeter for each fire using the dNBR data sets and original Landsat imagery as a guide The thematic burn severity image is then intersected with land cover and other thematic layers (administrative water sheds etc) to generate burn severity statistics (eg number of acres of evergreen forest burned at high severity or moderate severity etc) Metadata are generated for each fire including information about fire date and size imagery used and thresholds chosen Finally the inputs and results for each fire assessment are bundled and made available via the internet For additional information and data download see httpmtbsgov or httpmtbscrusgsgovviewer
256 IEEE JOURNAL OF SELECTED TOPICS IN APPLIED EARTH OBSERVATIONS AND REMOTE SENSING VOL 4 NO 2 JUNE 2011
Fig 4 An abridged representation of the process for creating Remote Sensing of Landscape Change products
IV THE VEGETATION CHANGE TRACKER
A General Overview
The overall LANDFIRE mapping effort began over five years ago using circa 2000 vintage Landsat imagery Both the users of the data as well as project management understood that an effort would be needed to bring the LANDFIRE data up-toshydate in order to retain relevancy and value An effort known as ldquoRefreshrdquo was initiated to make the data more current and applicable to the user community ldquoRapid Refreshrdquo was the first component of the Refresh update strategy and was completed in June 2008 This effort focused on quickly updating LANDFIRE data products in areas affected by recent (1999ndash2008) wildland fire disturbances using MTBS data A more comprehensive efshyfort utilizing both the MTBS and the LANDFIRE Events datashybase is currently underway While this information has become an important part of RSLC it became apparent early on that we needed a more automated and ldquoglobalrdquo process for mapping and incorporating disturbance information This led to the developshyment of the Vegetation Change Tracker (VCT)
B Vegetation Change Tracker
The VCT is an automated and highly efficient algorithm for mapping changes in forest cover The algorithm uses Landsat time series stacks (LTSS) which are defined as sequences of
Landsat images with a nominal temporal interval (eg one image every year or every two years) for a particular location LTSS images have been geometrically corrected to achieve subpixel geolocation accuracy and have high levels of radioshymetric consistency achieved using best available calibration coefficients and calculation of reflectance [9] The VCT first converts the LTSS images into spectral indexes that are meashysures of the likelihood of each pixel being a forest pixel and then tracks these indexes over time Changes are detected by looking for sharp decreases in forest likelihood as reflected by these indices Fig 4 shows the primary processes for creating RSLC products using VCT in a simplified diagram
A major strength of the VCT process is that it enables the proshycessing of an unprecedented amount of Landsat data to derive the changedisturbance products Landsat imagery dating back to 1984 and up to 2009 (preferably one scene for every year) is compiled into stacks referred to as Landsat time series stacks (LTSS Fig 4) These stacks are compiled for every Landsat World Reference System (WRS) pathrow falling within the conterminous United States A LTSS can consist of up to 28 Landsat images and we estimate that over 30000 Landsat imshyages will be utilized for mapping the conterminous US The imshyages used are generally 90 cloud-free and are geometrically referenced to the Albers Equal Area projection and converted to at-sensor reflectance The principle of the VCT algorithm is
257 VOGELMANN et al MONITORING LANDSCAPE CHANGE FOR LANDFIRE USING MULTI-TEMPORAL SATELLITE IMAGERY AND ANCILLARY DATA
Fig 5 Typical integrated forest -score (IFZ) temporal profiles of major forest cover change processes (andashc) and non-forest (d) that are used to characterize different change processes From [9] (a) Persisting forest (b) Forest disturbance (c) Afforestation (d) Persisting non-forest
based on the following known properties of forest disturbance and post-disturbance recovery processes [9]
bull During the growing season forest is one of the darkest vegshyetated surfaces in satellite images in many spectral bands [25]ndash[27]
bull Undisturbed naturally growing forests typically have relshyatively stable spectral signatures from one year to another
bull A disturbance generally results in an abrupt spectral change
bull Depending on the nature of the disturbance the resultant change signal in the spectral data can last several years or longer For disturbances followed by post-disturbance recovery it takes many years for trees to reestablish while a conversion of forest to non-forest land uses will result in non-forest signals in the years following the change
The VCT algorithm works by simultaneously evaluating all obshyservations provided by a LTSS for each pixel and determines the land cover and change process for that pixel based on its spec-tralndashtemporal properties The algorithm consists of two major processes The first is individual image masking and normalshyization In this step each image is analyzed independently to create a mask in which confident forest pixels are identified In addition water cloud cloud shadow cloud edge and snow are flagged and output as a mask image The established confishydent forest pixels are then used as a reference to normalize all pixels in that image and several indexes (which are measures of the likelihood of those pixels being forest pixels) are calculated Once this step is complete for all images of a LTSS the derived indices as well as the masks are used in a time series analysis process to produce forest change products
The time series analysis of forest cover is used to detershymine change and non-change classes and to derive a suite of attributes for characterizing the detected changes It is based primarily on the physical interpretation of the integrated forest
-score (IFZ) [9] In short the IFZ measures the likelihood of a pixel being a forest pixel its value should change in response to forest change Fig 5 shows typical temporal profiles of the IFZ for major land cover and forest change processes For persisting forest land where no major disturbance occurred during the years being monitored the IFZ value stays low and is relatively stable throughout the monitoring period [Fig 5(a)] A significant increase in the IFZ value indicates the occurrence of a disturbance in that year A sequence of gradually decreasing IFZ values following that disturbance represents the regenerashytion process of a new forest stand [Fig 5(b)] Conversion from non-forest to forest (afforestation) or regeneration of a forest stand from a disturbance that occurred before the first LTSS acquisition is identified by the gradual decrease of the IFZ from high values to the level of undisturbed forests [Fig 5(c)] Finally Fig 5(d) shows persisting non-forest as high and variable throughout the time series While certain crops may be spectrally similar to forest and can have low IFZ values during certain seasons their IFZ values likely will fluctuate as surface conditions change from one year to another due to harvest and crop rotation
To further illustrate the application of the IFZ we have inshycluded a time series of Landsat image subsets showing a disturshybance occurring between 1989 and 1990 which later regenershyates back into full-canopy forest (Fig 6) The plus ( ) sign inshydicates the location of the IFZ values plotted on the graph below the images Note how the persisting forest shows consistent low
258 IEEE JOURNAL OF SELECTED TOPICS IN APPLIED EARTH OBSERVATIONS AND REMOTE SENSING VOL 4 NO 2 JUNE 2011
Fig 6 A visual representation of how the Vegetation Change Tracker algorithm detects a forest disturbance
values leading up to 1989 (indicating persisting forest) after which a disturbance (clear cut) occurs The IFZ values jump sharply between those two years and then slowly return back to a consistent trend of low values approximately nine years folshylowing the disturbance
For each disturbance detected by the VCT a disturbance year and several disturbance magnitude measures are calculated to characterize that disturbance These measures are output as spashytial products It should be noted that first-order change products only indicate if and when a disturbance occurred Determining the cause and severity of the disturbances are completed in subshysequent processes as described in the following step
C Vegetation Change Tracker Product Attribution and Cleanup
A final RSLC product must not only show where the disturshybances occurred but also indicate a date of disturbance (to the nearest year) a cause of disturbance (referred to as causality) as well as the severity of the disturbance Combinations of VCT output products (disturbance magnitude disturbance year burn ratios etc) are used in conjunction with other multi-temporal data sources such as those from Monitoring Trends in Burn Severity (MTBS) and the LANDFIRE Events database to inshyfuse the necessary attributes into a final change product This entire process is shown in Fig 4
Disturbance date is assigned to a change product by analyzing the ldquoYear of Disturbancerdquo data set ndash a standard VCT product For a typical forest disturbance the IFZ value increases sharply
following a consecutive period of low IFZ values [Fig 5(b)] While the actual occurrence of the disturbance is somewhere beshytween the acquisition dates of the two consecutive images that show the sharp increase disturbance year is defined by the acshyquisition year of the later image In cases where an image gap occurs the year of disturbance year could be late by the number of years between the two images Having one image for each year of analysis would eliminate this issue but acquisition of at least one good scene for each pathrow every year is not assured due to issues of cloud cover and image quality
Disturbance magnitude refers to the spectral change resulting from a disturbance The VCT calculates three disturbance magshynitudes with the first using the IFZ the second using the Normalized Difference Vegetation Index (NDVI) and the third using the Normalized Burn Ratio (NBR) [9] These disturbance magnitude products are used (either individually or in comshybination) to derive regional severity of change information whereby severity is attributed as three classes (high medium or low) Severity levels are developed through interactive assessshyment using standard deviation information from the disturbance magnitude products
Assigning causality is the final attributing activity and this is largely a ldquohands-onrdquo process In the majority of cases the VCT changes are assumed to be related to forest cutting acshytivity Other possible disturbances include fire insects and disshyease or blow down To determine if any of these latter disturshybances are a factor we rely on ancillary data sources such as the MTBS or the LANDFIRE Events database While the VCT
259 VOGELMANN et al MONITORING LANDSCAPE CHANGE FOR LANDFIRE USING MULTI-TEMPORAL SATELLITE IMAGERY AND ANCILLARY DATA
Fig 7 A representation of a finalized VCT-derived disturbance product showing forest clearing disturbances near Samantha AL The color shades represent the year of disturbance (red = 2000 blue = 2001 green = 2002 and orange = 2003) whereas the color intensity represents the severity of change (lighter color represents less severe disturbance)
process captures many of the more severe types of forest change (eg clear cutting high severity fire) it is not as effective at capshyturing the more subtle types of change (eg thinning prescribed fire) especially in non-forested ecosystems In these cases the LANDFIRE Events data help to supplement the VCT change inshyformation by providing the spatial location and extent of these lesser-detectable disturbances Additionally analysts spend a notable amount of time analyzing the various input images and their associated VCT-derived datasets (such as NBR and NDVI) to help determine andor refine the disturbance causes Causality determination is a current area of interest and research
Because VCT change products are computed pixel by pixel the first-order output products are usually replete with single-pixel (or small groupings of pixels) disturbances (Fig 4) LANDFIRE managers determined that disturbed areas of fewer than 50 contiguous pixels (approximately 45 ha) as too small for the purposes of large area updating Therefore before the attributed RSLC product is complete it must be ldquocleanedrdquo by removing the ldquounwantedrdquo disturbance pixels The cleaning process is accomplished by using standard image processing techniques where clusters of pixels are verified as having either greater than 49 or less than 50 contiguous pixels If there are fewer than 50 contiguous pixels they are purged
D Final RSLC Product
As a final step the data are examined for possible mapping inaccuracies or other possible errors through visual inspection or analyst-driven processing In many cases heads-up editing using standard image processing tools are used to remove ershyrors andor make final adjustments to the data The final RSLC product is a stack of thematic raster layers where each layer represents a year of disturbance with severity and causality atshytributed to each disturbance pixel Our first goal for LANDFIRE updating is to generate change data from 1999 through 2009 but ultimately our plans are to generate annual change information dating back to 1984 A subset of a final RSLC product is shown in Fig 7 This product then becomes a baseline product used to update other LANDFIRE data sets (eg existing vegetation) through use of successional modeling and related techniques
V INSECTS AND DISEASE
A General Overview
As described earlier in this paper we have made significant headway in terms of developing approaches for monitoring major land cover changes related to logging and fire Howshyever there are also many more subtle ldquowithin-staterdquo changes occurring across landscapes including those related to insect damage wind pollution climate and succession These types of changes tend to be relatively difficult to detect and to assign causality using remote-sensing technology Nonetheless the cumulative impacts of these types of ldquosubtlerdquo changes can have substantial impacts on various ecosystem processes and result in changes in carbon balance biogeochemical cycling microclimate patterns of biodiversity and fire [28]ndash[31]
There are a number of reasons why detection and monitoring of gradual ecosystem change using remote sensing technology can be problematic In the past such assessments could be hinshydered by the cost of the data With free access to the Landsat data archive as well as access to various derived Moderate Resolushytion Imaging Spectroradiometer (MODIS) and Advanced Very High Resolution Radiometer (AVHRR) products this problem should be alleviated Other issues that have mired research of gradual ecosystem change include but are not limited to the following 1) insufficient understanding of normal spectral conshyditions and variability which compromises our ability to detect ldquoabnormalrdquo spectral conditions 2) availability of adequate field information to aid analytical processes and 3) lack of image data acquired at appropriate times In spite of these difficulshyties successful investigations using remote sensing for detecting and monitoring subtle and gradual within-state changes have been reported [32]ndash[34] For updating LANDFIRE data sets we will focus primarily on identifying disturbances related to major within-state changes Some of the more obvious examples inshyclude major insect outbreaks such as those caused by the mounshytain pine beetle spruce budworm and gypsy moth [35]ndash[37]
B Methodology for Detecting Insect and Disease Damage
One of the difficulties of developing operational methodology for assessing insect damage is that the spectral responses differ depending upon insect species and host species As an example the western spruce budworm is a defoliator [38] and the deshyfoliation caused by the budworm is a multi-year event While most trees can withstand single defoliation events mortality will occur after repeated defoliation over successive years Such reshypeated defoliation will cause gradual changes in the health of the conifer tree species affected Conversely the mountain pine bark beetle is a borer and infestations caused by this insect imshypact the trees rapidly with a predictable series of green to red to grey vegetation color phases [39] [40] Mortality caused by pine borers can be very rapid following the initial outbreak and thus the spectral changes of the conifer tree canopies can simshyilarly be very rapid following outbreak We do not believe that development of a single approach for mapping and monitoring damage caused by a variety of insects impacting a wide variety of tree species is likely Rather we believe that it will be better to employ a suite of methods for assessing insect damage and
260 IEEE JOURNAL OF SELECTED TOPICS IN APPLIED EARTH OBSERVATIONS AND REMOTE SENSING VOL 4 NO 2 JUNE 2011
Fig 8 Comparison between MODIS-derived NDVI difference images between 2003 and 2008 (left) and insect damage mapped by the Forest Health Monitoring Program in the southern Rocky Mountains of Colorado and Wyoming In the left image red indicates the largest seasonal NDVI decrease orange represents moderate NDVI decreases and white indicates low NDVI decreases In the Forest Health Monitoring data (right) red indicates where insect damage was mapped in three or more years whereas white represents areas mapped as insect damage in two years
that the particular approach employed will be specific to the inshysect and the trees involved
In previous work we have demonstrated several different apshyproaches that appear promising for operational insect damage mapping and monitoring In one study we were able to use Landsat time series data for mapping the multiple defoliations caused by the western spruce budworm [36] The general apshyproach employed included the following 1) acquisition of a multi-year Landsat time series data set (preferentially selecting for late summer and early autumn scenes) 2) generating regresshysion statistics of time versus spectral index for each pixel in the time series 3) developing spatial data layers depicting the stashytistics including slope and statistical significance of the time versus spectral index relationship and 4) comparing with spashytial insect damage information acquired aerially by the Forest Health Monitoring program (FHM) [41] to verify that the patshyterns developed from the imagery were reasonable This particshyular approach can be especially appropriate for detecting mapshyping and monitoring gradual changes taking place over multiple years For this approach to work it is important that remotely-sensed data be normalized in some manner such as conversion to at-sensor reflectance Selection of the appropriate spectral index will depend upon the perturbation being investigated but in the case of western spruce budworm both Short-waveNear infrared index (SWIRNIR) [42] [43] and Normalized Differshyence Vegetation Index (NDVI) were found to be useful While the latter was not as effective as the former both were shown to work
In assessments of pine beetle damage the regression apshyproach that worked well for detecting western spruce budworm did not work largely because the damage caused by this particular insect is rapid and gradual spectral change is not
characteristic of mountain pine beetle damage However we did find that traditional ldquobeforendashafterrdquo difference data images produced using either NDVI or SWIRNIR differences captured the damage quite well We also found another approach to be particularly useful which includes the following 1) acquisition of biweekly or weekly MODIS-derived NDVI composites [44] from throughout multiple growing seasons (eg 2000 through 2008) 2) generating the median NDVI value for each yearrsquos growing season for each pixel 3) deriving images that depict deviations from the median NDVI values for each pixel and 4) comparing reference information such as that acquired by the FHM program An image depicting MODIS-derived change information in an area experiencing significant mounshytain pine beetle damage is shown in Fig 8 adjacent to insect damage information provided by FHM In this case general patterns between MODIS change and FHM are reasonably similar although MODIS detected a number of ldquochangesrdquo not mapped as damage by FHM One of our caveats regarding use of MODIS data (and other sources of remotely-sensed data) for change assessments is that seasonality and phenology can have marked influences on remotely-sensed signals and that it can be difficult to separate the changes that we are interested in mapping (in this case insect damage) from other types of change (eg seasonality) and that we need to be cautious in interpreting spectral changes In Fig 8 the most significant MODIS spectral changes are related to the pine beetle damage and in general we believe that MODIS data should be very useful for capturing US-scale interannual patterns of insect damage At the same time we strongly suspect that some of the changes in Fig 8 (most notably in the eastern part of the MODIS-derived change product) are related to seasonality issues and we need a way to reduce ldquofalse alarmsrdquo related to
261 VOGELMANN et al MONITORING LANDSCAPE CHANGE FOR LANDFIRE USING MULTI-TEMPORAL SATELLITE IMAGERY AND ANCILLARY DATA
these types of events Nonetheless we believe that the MODIS data were effective in depicting insect damage and we believe that the similar approaches using other sensors such as the Landsat TM and using other indices such as the SWIRNIR will also be effective in detecting pine beetle damage It is noteworthy that while the spatial resolution of the MODIS is much coarser than TMETM+ (250 m for visible and NIR channels of MODIS versus 30 m for Landsat TMETM+) the high temporal frequency of MODIS data acquisitions helps to compensate for the spatial resolution issues The generation of weekly and biweekly composites from MODIS data [44] facilitates the use of the data making inter-annual comparisons much more routine which is one step closer to operational monitoring As yet insects and disease information has not been incorporated into the RSLC but the long range plans include doing so
VI CONCLUSIONS FUTURE RESEARCH OPPORTUNITIES
AND CHALLENGES
A General Overview
One of the major values of LANDFIRE is that it provides consistent and complete spatial products of the United States relevant to many regional to national scale applications [2] A major challenge for us will be not only to keep the data sets current but also to be able to do this in an efficient and cost effective manner At present our goal is to update the land cover data sets on an annual to biennial basis While we have made good progress towards meeting this goal there are a number of technical challenges facing us and we anticipate that we will need to continue refining the process in the foreseeable future Following are a few key areas that we believe will be important research topics for us over the next several years
B Alternative Sources of Remotely-Sensed Data
Both Landsat 5 and Landsat 7 missions are well beyond their design lives and could malfunction at any time The successor to Landsats 5 and 7 is planned for launch in December 2012 and thus it is possible that we could have a Landsat data gap in the near future This would adversely impact all aspects of LANDshyFIRE updating We are currently in the process of identifying and evaluating potential alternative data sources of satellite imshyagery for updating LANDFIRE data sets Some previous studies [45] [46] have made headway towards using some of these alshyternative sensors for filling a potential data gap From our own work it appears that the spectral and radiometric properties of AWiFS are very suitable for updating LANDFIRE data sets From our analyses we believe that we will be able to inter-calishybrate AWiFS and Landsat data and be able to use one source of information to replace the other if necessary
C Structure Mapping
Landsat data can provide extensive spatial coverage of forest structure in the horizontal dimension and are useful for canopy percentage cover estimation However these data sets are relshyatively insensitive for assessing the vertical dimension Thus forest canopy height which is an important variable for modshyeling fire fuel has been a challenge to quantify adequately for
the LANDFIRE project With the development of new sensors such as Lidar and InSAR new data fusion methods have demonshystrated improvements in canopy height estimation [47] [48] Further investigation and application of these methods on the national scale will bring in a revolution of canopy height mapshyping for the next generation LANDFIRE products Once a good canopy height data layer is developed for any given point in time we will be able to incorporate VCT-derived change inshyformation and model ensuing height changes based on canopy growth models
D Development of Automatic Methods for Assigning Change Causality
While the VCT is very good at detecting forest changes that have taken place the algorithm does not assign causality to the changes Thus we know what has changed but not necessarily what it has changed to The types of changes can have large efshyfects on fire fuel As an example a harvested forest will have difshyferent fire fuel conditions than a similar forest burned by wildshyfire In addition the two will have different growth trajectories that will also modify fire fuel conditions Thus far during our updating process we have spent a lot of time assigning causality and much of this work has been done using largely manual methods As yet we do not have an easy way to assign causality to changed pixels Automatic or semi-automatic assignment of causality of these changes is a topic that we are beginning to exshyplore We envision that assessments that include regional-based assessments of change such as FIA and UGSS Trends data [49] when used in conjunction with the VCT data output will facilshyitate the labeling process
E Extending MTBS Data Using Multispectral Scanner Data
Currently MTBS has been characterizing wildland fire mostly using Landsat TM and ETM+ data Indexes that use the shortwave infrared (TM band 7) tend to be better at charactershyizing burn severity than indexes that do not use this spectral region such as the NDVI Nonetheless the NDVI can be useful for mapping at least general wildand fire and severity characteristics We would like to add to the MTBS baseline by including assessments derived from Multispectral Scanner (MSS) data collected from 1972 through 1984 MSS data do not have the spatial resolution of the TMETM+ sensors nor do they have the radiometric fidelity or spectral resolution of the more advanced sensors Despite these limitations we believe that MSS data will be useful for providing general fire trends that occurred during this time period which will help put the more recent fires into a better historical context
F Data Availability
For VCT to work effectively good time series data either at annual or biennial intervals are advantageous It is also imporshytant that individual data sets being analyzed within the LTSS represent similar phenological conditions Unfortunately many parts of the country are very cloudy and acquisition of good quality data meeting these requirements is not guaranteed One possible solution is to use composite images comprised of the ldquobest pixelrdquo for a given scene representing a particular time peshyriod For instance if several partly cloudy scenes are the best
262 IEEE JOURNAL OF SELECTED TOPICS IN APPLIED EARTH OBSERVATIONS AND REMOTE SENSING VOL 4 NO 2 JUNE 2011
data sets for summer of a particular year we can use various compositing approaches to ldquocreaterdquo a good data set for that time period to use in the LTSS Previous studies [50]ndash[52] have demonstrated that such composites can be generated efficiently and consistently and hold much promise for filling potential gaps in data sets As a corollary to this we do not believe that we will be able to use the VCT approach for Alaska or Hawaii due to a paucity of available data sets to create a good LTSS For these areas we will likely need to use MODIS data to generate time series information The best approaches for incorporating MODIS data into the LANDFIRE updating process has not been worked out yet
G Other RSLC Research Topics
While VCT has been shown to be very effective at mapshyping changes related to forest harvesting additional refinement needs to be done so that it is also effective in non-forested enshyvironments Much of the western United States is shrubland and many of these areas burn frequently and are of great conshycern to natural resource managers Currently the characterizashytion of these areas using VCT has had mixed success Addishytional work will need to be done to spectrally characterize non-forested changes and then this information will need to be inshycorporated into the VCT algorithm
H Final Thoughts
Developing a nationwide operational terrestrial monitoring system using remotely-sensed data sets requires signifishycant commitment and resources While developing national wall-to-wall land cover change data sets has been a priority for many groups over the last several decades [53] [54] we are just now at the point where we are beginning to implement these goals There are still significant challenges ahead of us but we believe that the research community as a whole is making great strides towards developing such a system While the work described in this paper has a strong focus on disturbance proshycesses related to LANDFIRE we believe that the RSLC data sets described will have application to a broader community
ACKNOWLEDGMENT
The authors thank personnel of the Department of the Interior Office of Wildland Fire Coordination US Forest Service Office of Fire and Aviation Management and Science and Application Branch of the Center for Earth Earth Resources Observation and Science (EROS) Additionally the authors thank L Yang and G Xian for helpful reviews of a previous version of this manuscript
REFERENCES
[1] The National Fire Plan NFP 2009 [Online] Available wwwhealthyshyforestsandrangelandsgov
[2] The LANDFIRE Charter USDA and DOI 2004 [Online] Available wwwlandfiregov
[3] M G Rollins ldquoLANDFIRE A nationally consistent vegetation wild-land fire and fuel assessmentrdquo Int J Wildland Fire vol 18 no 3 pp 235ndash249 May 2009
[4] C Homer J Dewitz J Fry M Coan N Hossain C Larson N Herold A McKerrow J N VanDriel and J Wickham ldquoCompletion of the 2001 national land cover database for the conterminous United Statesrdquo Photogrammetric Engineering and Remote Sensing vol 73 no 4 pp 337ndash341 Apr 2007
[5] J R Quinlan C45 Programs for Machine Learning San Mateo CA Morgan Kaufmann 1993
[6] P Comer D Faber-Langendoen R Evans S Gawler C Josse G Kittel S Menard M Pyne M Reid K Schulz K Snow and J Teague Ecological Systems of the United States A Working Classhysification of US Terrestrial Systems Arlington VA NatureServe 2003
[7] C Homer C Huang L Yang B Wylie and M Coan ldquoDevelopshyment of a 2001 national landcover database for the United Statesrdquo Photogrammetric Engineering and Remote Sensing vol 70 no 7 pp 829ndash840 Jul 2004
[8] C E Woodcock et al ldquoFree access to Landsat imageryrdquo Science vol 320 no 5879 p 1011 May 2008
[9] C Huang S N Goward J G Masek N Thomas Z Zhu and J E Vogelmann ldquoAn automated approach for reconstructing recent forest disturbance history using dense Landsat time series stacksrdquo Remote Sensing of Environment 2009 DOI101016jrse200908 017
[10] C Toney M Rollins K Short T Frescino R Tymcio and B Peshyterson R E McRoberts G A Reams P C Van Deusen and W H McWilliams Eds ldquoUse of FIA plot data in the LANDFIRE Projectrdquo in Proc 7th Annu Forest Inventory and Analysis Symp Portland ME Oct 3ndash6 2005 pp 309ndash319
[11] D C Lutes R E Keane J F Caratti C H Key N C Benson S Sutherland and L J Gangi FIREMON Fire Effects Monitoring and Inventory System US Department of Agriculture Forest Service Rocky Mountain Research Station Fort Collins CO Gen Tech Rep RMRS-GTR-164-CD 2006
[12] E Reinhardt and C L Crookston The Fire and Fuels Extension to the Forest Vegetation Simulator US Department of Agriculture Forest Service Rocky Mountain Research Station Ogden UT Gen Tech Rep RMRS-GTR-116 2003
[13] C Toney J D Shaw and M D Nelson W McWilliams G Moisen and R Czaplewski Eds ldquoA stem-map model for predicting tree canopy cover of Forest Inventory and Analysis (FIA) plotsrdquo in Proc Forest Inventory and Analysis Symp 2008 Park City UT Oct 21ndash23 2008 Proc RMRS-P-56CD
[14] C Toney and M C Reeves ldquoEquations to convert compacted crown ratio to uncompacted crown ratio for trees in the Interior Westrdquo Western J Applied Forestry vol 24 no 2 pp 76ndash82 Apr 2009
[15] E Reinhardt D Lutes and J Scott P L Andrews and B W Butler Eds ldquoFuelCalc A method for estimating fuel characteristicsrdquo in Fuels ManagementndashHow to Measure Success Conf Proc Portland OR Mar 28ndash30 2006 pp 273ndash282 Proc RMRS-P-41
[16] Elevation Derivatives for National Applications USGS 2005 [Online] Available httpednausgsgov
[17] State Soil Geographic (STATSGO) Database USDA NRCS 2005 [Online] Available httpwwwncgcnrcsusdagovprodshyuctsdatasetsstatsgoindexhtml
[18] S W Running and E R Hunt ldquoGeneralization of a forest ecosystem process model for other biomes BIOME-BGC and an application for global scale modelsrdquo in Scaling Physiological Processes Leaf to Globe Burlington MA Academic Press 1993 pp 141ndash157
[19] R E Keane M G Rollins C H McNicoll and R A Parsons Preshydictive Landscape Modeling Using Gradient-Based Sampling Remote Sensing and Ecosystem Simulation US Department of Agriculture Forest Service Rocky Mountain Research Station Fort Collins CO 2002 Gen Tech Rep RMRS-GTR-92
[20] J Epting D Verbyla and B Sorbel ldquoEvaluation of remotely sensed indexes for assessing burn severity in interior Alaska using Landsat TM and ETM+rdquo Remote Sensing of Environment vol 96 no 3ndash4 pp 328ndash339 Jun 2005
[21] C H Key and N C BensonD C Lutes Landscape Assessment Ground Measure of Severity The Composite Burn Index FIREMON Fire Effects Monitoring and Inventory System USDA Forest Service Rocky Mountain Research Station Ogden UT 2005 General Technical Report RMRSGTR-164-CDLA1-LA51
[22] J D Miller and S R Yool ldquoMapping forest post-fire canopy conshysumption in several overstory types using multi-temporal Landsat TM and ETM datardquo Remote Sensing of Environment vol 82 no 2ndash3 pp 481ndash496 Oct 2002
[23] A Singh ldquoDigital change detection techniques using remotely-sensed datardquo Int J Remote Sensing vol 10 no 6 pp 989ndash1003 Jun 1989
[24] Glossary of Wildland Fire Terminology NWCG 2009 [Online] Availshyable httpwwwnwcggovpmspubsglossaryindexhtm
[25] J E Colwell ldquoVegetation canopy reflectancerdquo Remote Sensing of Enshyvironment vol 3 no 3 pp 174ndash183 Mar 1974
263 VOGELMANN et al MONITORING LANDSCAPE CHANGE FOR LANDFIRE USING MULTI-TEMPORAL SATELLITE IMAGERY AND ANCILLARY DATA
[26] S N S N Goward K F Huemmrich and R H Waring ldquoVisibleshynear infrared spectral reflectance of landscape components in western Oregonrdquo Remote Sensing of Environment vol 47 no 2 pp 190ndash203 Feb 1994
[27] K F Huemmrich and S N Goward ldquoVegetation canopy PAR absorpshytance and NDVI An assessment for ten tree species with the SAIL modelrdquo Remote Sensing of Environment vol 61 no 2 pp 254ndash269 Aug 1997
[28] G M Lovett C D Canham M A Arthur K C Weathers and R D Fitzhugh ldquoForest ecosystem responses to exotic pests and pathogens in eastern North Americardquo BioScience vol 56 no 5 pp 395ndash405 May 2006
[29] G L W Perry and J D A Millington ldquoSpatial modeling of successhysion-disturbance dynamics in forest ecosystems Concepts and examshyplesrdquo Perspectives in Plant Ecology Evolution and Systematics vol 9 no 3ndash4 pp 191ndash210 Mar 2008
[30] M G Turner ldquoLandscape ecology What is the state of the sciencerdquo Annu Rev Ecology Evolution and Systematics vol 36 pp 319ndash344 Dec 2005
[31] T J Parker K M Clancy and R L Mathiasen ldquoInteractions among fire insects and pathogens in coniferous forests of the interior western United States and Canadardquo Agricultural and Forest Entomology vol 8 pp 167ndash189 Aug 2006
[32] R D Beck R S Maxwell V H Treat and H C Dethloff ldquoTimeless Heritage A History of the Forest Service in the Southwestrdquo US Dept Agriculture Forest Service FS-409 1988
[33] A T Roder J Hill B Duguy J A Alloza and R Vallejo ldquoUsing long time series of Landsat data to monitor fire events and post-fire dynamics and identify driving factors A case study in the Ayora region (eastern Spain)rdquo Remote Sensing of Environment vol 112 no 1 pp 259ndash273 Jan 2008
[34] S M Souza and D Roberts ldquoMapping forest degradation in the Amazon region with Ikonos imagesrdquo Int J Remote Sensing vol 26 no 3 pp 425ndash429 Mar 2005
[35] W A Kurz C C Dymond G Stinson G J Rampley E T Neilson A L Caroll T Ebata and L Safranyik ldquoMountain pine beetle and forest carbon feedback to climate changerdquo Nature vol 452 no 7190 pp 987ndash990 Apr 2008
[36] J E Vogelmann B Tolk and Z Zhu ldquoMonitoring forest changes in the southwestern United States using multitemporal Landsat datardquo Remote Sensing of Environment vol 113 no 8 pp 1739ndash1748 Aug 2009
[37] K M De Beurs and P A Townsend ldquoEstimating the effect of gypsy moth defoliation using MODISrdquo Remote Sensing of Environment vol 112 no 10 pp 3983ndash3990 Oct 2008
[38] D G Fellen and J E Dewey ldquoWestern spruce budwormrdquo USDA Forest Service Forest Insect and Disease Leaflet vol 53 1982
[39] L E Maclauchlin J E Brooks and J C Hodge ldquoAnalysis of historic western spruce budworm defoliation in south central British Columbiardquo Forest Ecology and Management vol 226 no 1ndash3 pp 351ndash356 May 2006
[40] M A Wulder C C Dymond J C White D G Leckie and A L Caroll ldquoSurveying mountain pine beetle damage of forests A review of remote sensing opportunitiesrdquo Forest Ecology and Management vol 221 no 1ndash3 pp 27ndash41 Jan 2006
[41] USDA Nov 2009 [Online] Available httpwwwfsfedus [42] J E Vogelmann and B N Rock ldquoAssessing forest damage in high-elshy
evation coniferous forests in Vermont and New Hampshire using Theshymatic Mapper datardquo Remote Sensing of Environment vol 24 no 2 pp 227ndash246 Mar 1988
[43] J E Vogelmann ldquoComparison between two vegetation indexes for measuring different types of forest damage in the northeastern United Statesrdquo Int J Remote Sensing vol 11 no 12 pp 2281ndash2297 Dec 1990
[44] C B Jenkerson and G Schmidt W T Pecora Ed ldquoeMODIS product access for large scale monitoringrdquo in 17th Memorial Symp Remote Sensing Denver CO Nov 16ndash20 2008
[45] G Chander ldquoInitial Data Characterization Science Utility and Misshysion Capability Evaluation of Candidate Landsat Mission Data Gap Sensorsrdquo Technical Report Landsat Data Gap Study 2007 [Online] Available httpcalvalcrusgsgovLDGSTphp
[46] M A Wulder J C White S N Goward J G Masek J R Irons M Herold W B Cohen T R Loveland and C E Woodcock ldquoLandsat continuity Issues and opportunities for land cover monitoringrdquo Remote Sensing of Environment vol 112 no 3 pp 955ndash969 Mar 2008
[47] A T Hudak M A Lefsky W B Cohen and M Berterretche ldquoInshytegration of lidar and Landsat ETM+ data for estimating and mapping forest canopy heightrdquo Remote Sensing of Environment vol 82 no 2ndash3 pp 397ndash416 Oct 2002
[48] W S Walker J M Kellndorfer E LaPoint M Hoppus and J West-fall ldquoAn empirical InSAR-optical fusion approach to mapping vegetashytion canopy heightrdquo Remote Sensing of Environment vol 109 no 4 pp 482ndash499 Aug 2007
[49] T R Loveland T L Sohl S V Stehman A L Gallant K L Sayler and D E Napton ldquoA strategy for estimating the rates of recent United States land-cover changesrdquo Photogrammetric Engineering and Remote Sensing vol 68 no 10 pp 1091ndash1099 Oct 2002
[50] D P Roy J Ju P Lewis C Schaaf F Gao M Hansen and E Lindquist ldquoMulti-temporal MODIS-Landsat data fusion for relative rashydiometric normalization gap filling and prediction of Landsat datardquo Remote Sensing of Environment vol 112 no 6 pp 3112ndash3130 Jun 2008
[51] D P Roy J Ju K Kline P L Scaramuzza V Kovalskyy M Hansen T R Loveland E Vermote and C Zhang ldquoWeb-enabled Landsat Data (WELD) Landsat ETM+ composited mosaics of the contermishynous United Statesrdquo Remote Sensing of Environment 2009 DOI10 1016jrse200908011
[52] J Ju and D P Roy ldquoThe availability of cloud-free Landsat ETM+ data over the conterminous United States and globallyrdquo Remote Sensing of Environment vol 112 no 3 pp 1196ndash1211 Mar 2008
[53] ldquoFacing Tomorrowrsquos ChallengesmdashUS Geological Survey Science in the Decade 2007ndash2017rdquo USGS 2007 US Geological Survey Circular 1309 x + 70 p
[54] ldquoGrand Challenges in Environmental Sciencesrdquo National Research Council National Academy Press Washington DC 2001
James E Vogelmann received the PhD degree in plant biology from Indiana University Bloomington IN
He is a Research Ecologist at the USGS Center for Earth Resources Observation and Science (EROS) His research interests and publications focus on the use of Landsat data and other sources of geospatial information for mapping characterizing and monishytoring vegetation condition across large areas He is currently a member of the Landsat Science Team
Jay R Kost received the MS degree in space studies from the University of North Dakota Grand Forks ND in 1990
He has been with the USGS EROS since 1997 and currently works as a Senior Scientist on the LANDFIRE project His background includes multi-disciplinary work in spatial data management land cover and change mapping wetland science and fire science
Brian Tolk received the MA degree in geography from the University of Nebraska Lincoln in 1996 specializing in remote sensing and GIS
Working under various contractors he has been employed at the USGS EROS Sioux Falls SD since 1998 His research interests include landcoverland use change detection and remote sensing of water quality
264 IEEE JOURNAL OF SELECTED TOPICS IN APPLIED EARTH OBSERVATIONS AND REMOTE SENSING VOL 4 NO 2 JUNE 2011
Stephen Howard received the MS degree in geography from the South Dakota State University Brookings SD in 1984
He has been at the USGS EROS since 1985 His research interests include vegetation mapping and monitoring using satellite data
Karen Short received the BS degree in wildlife and fisheries science from the University of Arizona Tucson and the PhD degree in organismal biology and ecology from the University of Montana Misshysoula
She is a Research Scientist with Systems for Envishyronmental Management Missoula MT She has conshyducted much of her research in conjunction with preshyscribed fires in southwestern national parks studying responses of plants insects and birds to the burns She is currently the Reference Data Administrator for
the national LANDFIRE Project on contract through the Missoula Fire Sciences Laboratory
Xuexia Chen (Arsquo08) received the PhD degree in atmosphere environment and water resources from the South Dakota School of Mines and Technology Rapid City SD in 2004
She is currently a Senior Scientist with ASRC Research and Technology Solutions contractor to USGS EROS For the past ten years she has been working on image relative normalization spectral unmixing burn severity detection and fire combusted biomass estimation She has been heavily involved in mapping LANDFIRE existing vegetation
and structure since 2004 Dr Chen is currently a member of the American Geophysical Union (AGU)
the Sigma Xi and the Institute of Electrical and Electronics Engineers (IEEE)
post-fire effects
Chengquan Huang received the BS and MS degrees from Peking University China and the PhD degree from the University of Maryland College Park
He is a member of the Research Faculty in the Geshyography Department of the University of Maryland His research interests include characterization and monitoring of land cover biomass and ecosystem dynamics by integrating satellite and non-satellite observations
Kari Pabst received the BA degree in biology from Augustana College Sioux Falls SD and will graduate with the MS degree in geography from South Dakota State University Brookings SD in May 2010
She is employed by ASRC Research and Techshynology Solutions as a contractor to the USGS EROS She supports Fire Science and is currently working on the Monitoring Trends in Burn Severity Project Her research interests include fire ecology and using remote sensing and GIS as tools to map and monitor
Matthew G Rollins received the MS degree in forestry from the University of Montana and the PhD degree from the University of Arizona
He is Wildland Fire Science Team lead at the USGS EROS in Sioux Falls SD His recent research has included assessing changes in fire and landscape patterns under different wildland fire management scenarios relating fire regimes to landscape-scale biophysical gradients and climate variability and developing predictive landscape models of fire frequency fire effects and fuel characteristics
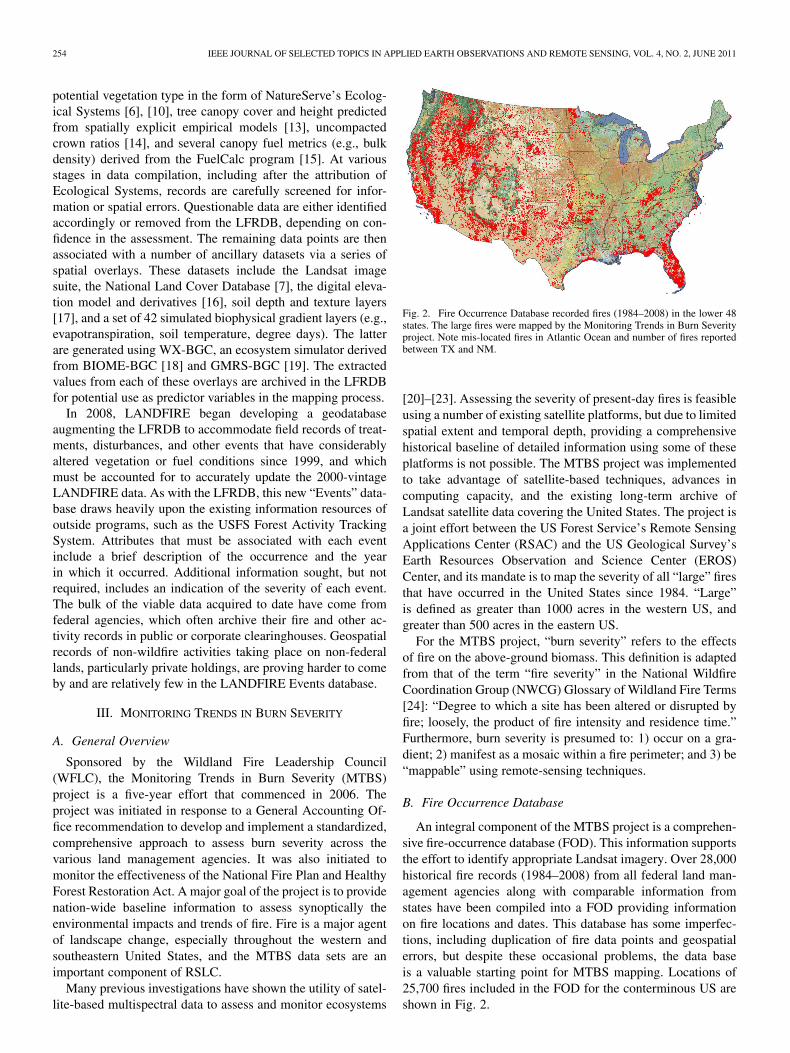
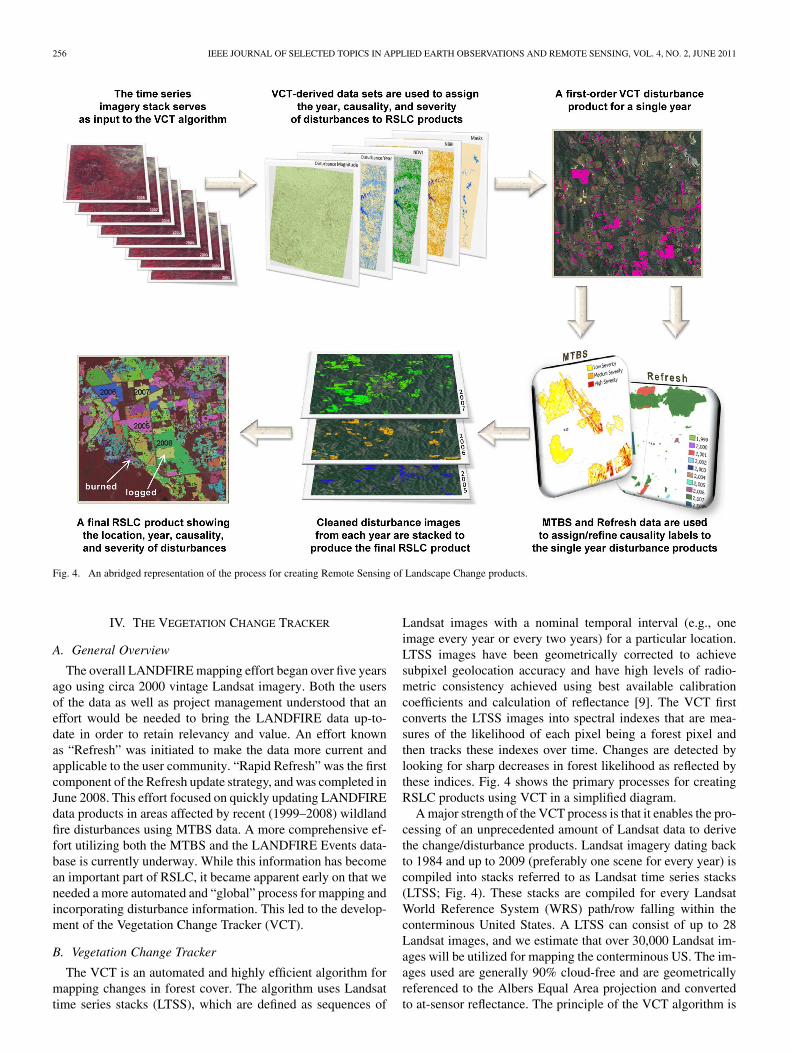
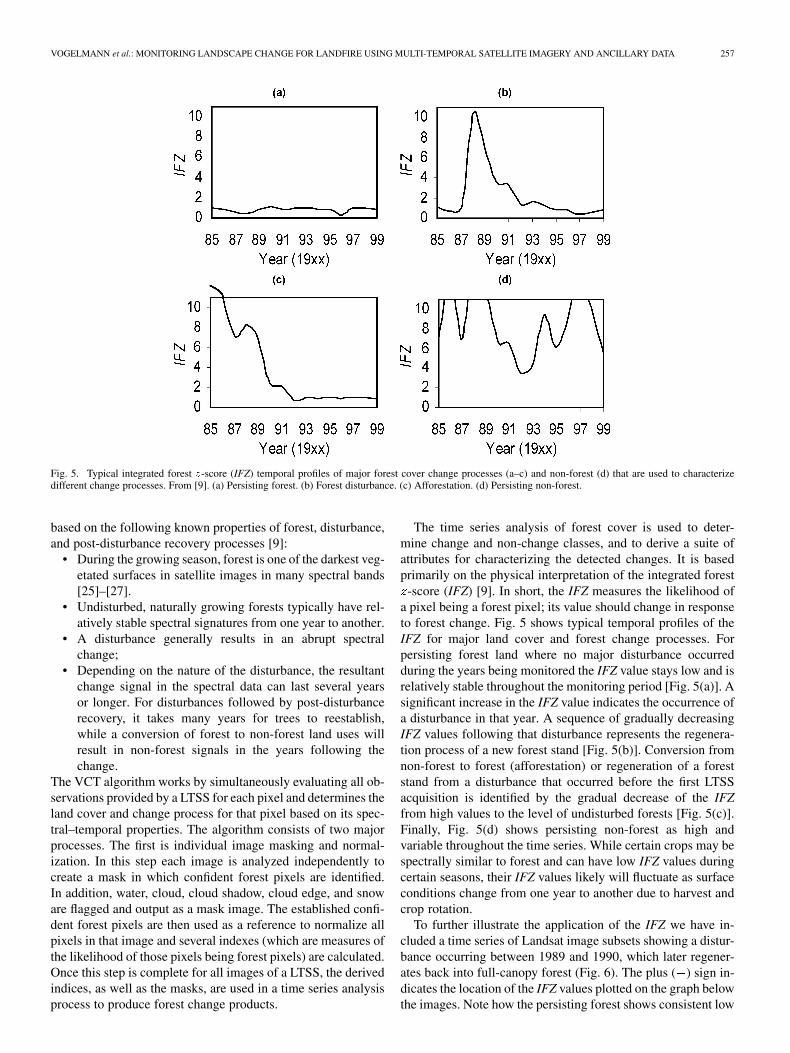
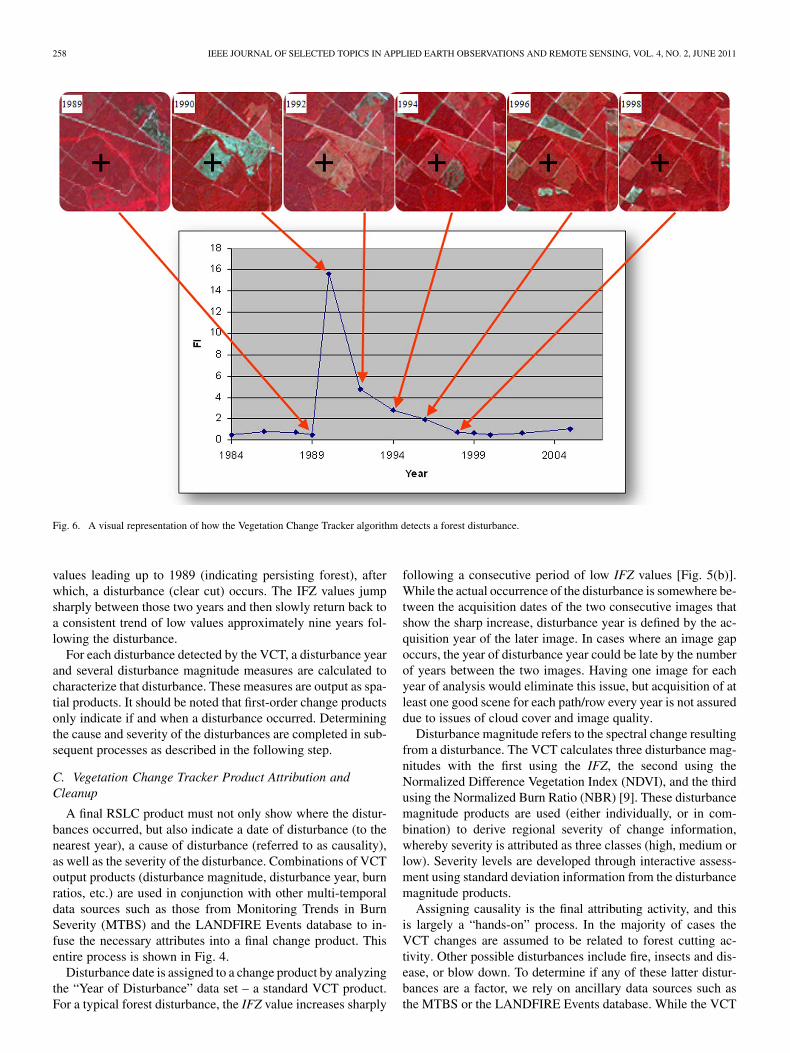
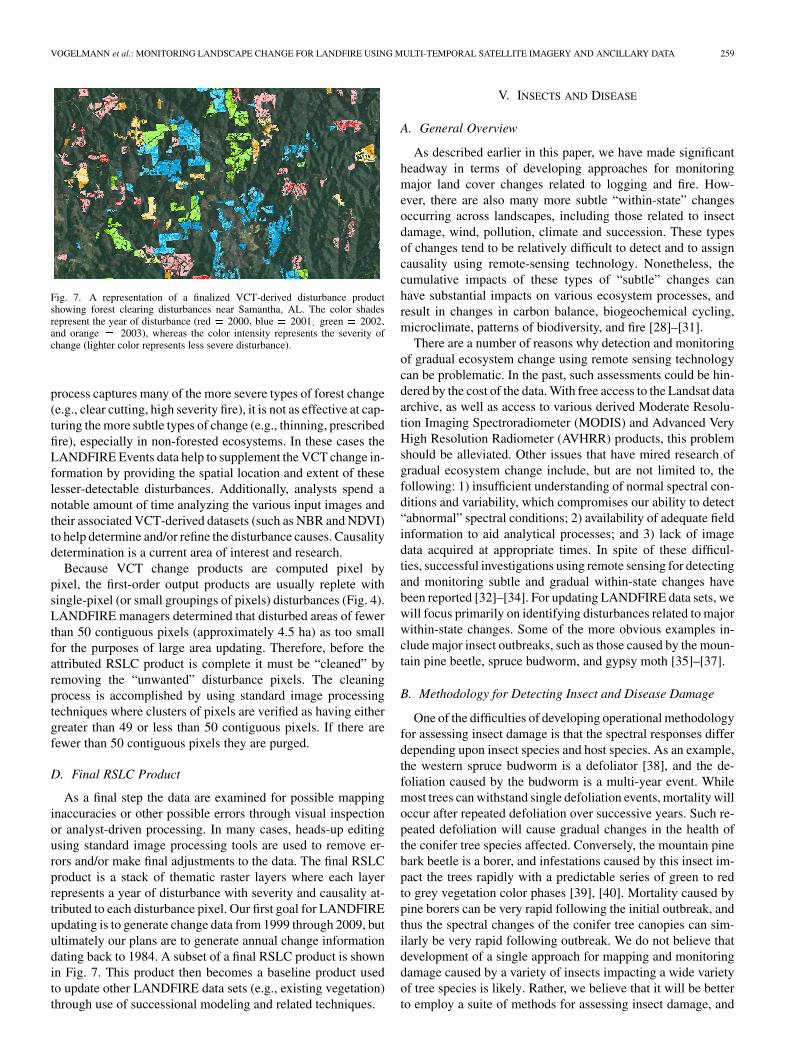
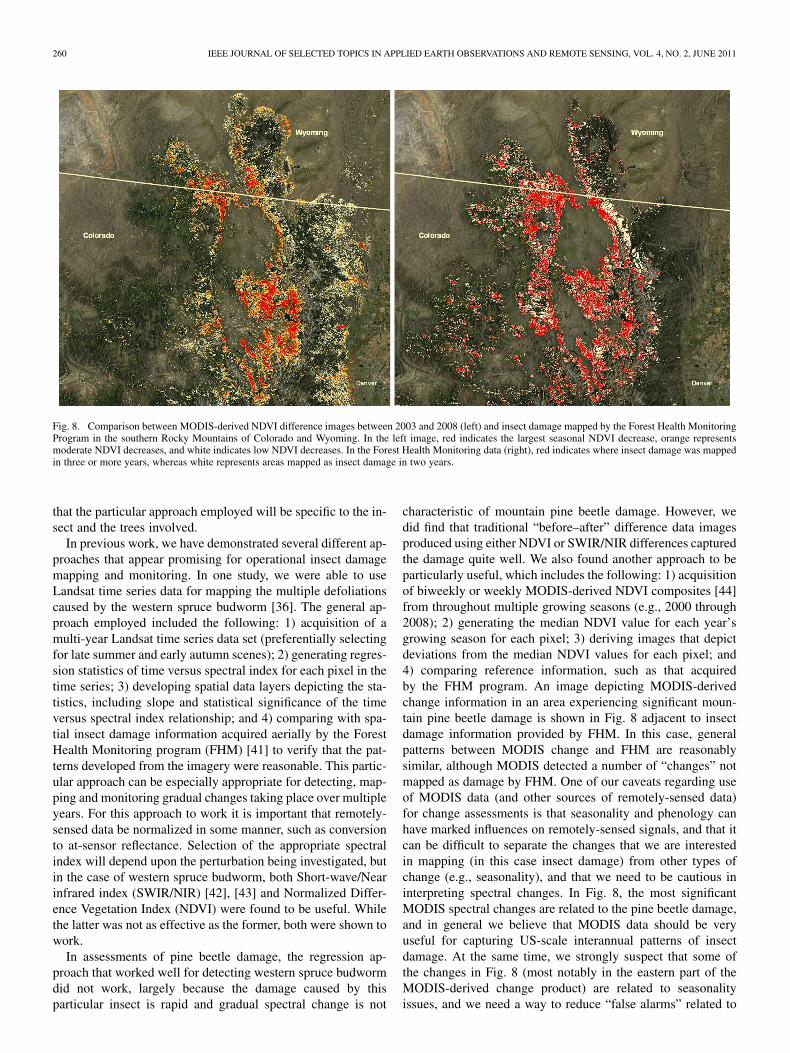

![Example of Change in a LANDFIRE Refresh 2008 · Example of Change in a LANDFIRE Refresh 2008 [1.1.0] Product Reflecting an Incorporated Disturbance LF 2001 Existing Vegetation Cover](https://img.pdfslide.net/doc/110x75/5d38958a88c99366578c81d7/example-of-change-in-a-landfire-refresh-2008-example-of-change-in-a-landfire.jpg)