Embed Size (px)
Citation preview

MONITORING ANDTUNING ORACLE -
CHAPTER 22 PART 1
This material is extracted from the first half of Chapter 22 of Configuring and TuningDatabases on the Solaris Platform, by Allan N. Packer, (c) 2002, Sun MicrosystemsPress. The second half of the chapter will appear in the August edition of Sun Blue-Prints Online. Chapter 21, Drill-Down Monitoring of Database Servers, was presentedin the June 2002 edition of Sun BluePrints Online.
In this chapter we consider tuning recommendations for Oracle in both OLTPand DSS environments after first examining methods of monitoring and con-figuring Oracle. We also explore Oracle9i enhancements that supportdynamic reconfiguration, and we investigate issues related to crash recovery.
M a n a g i n g O r a c l e B e h a v i o rOracle can be monitored and managed with Oracle Enterprise Manager(OEM), a powerful GUI-based tool that allows detailed monitoring of allaspects of database behavior and that supports database management. Ora-cle also provides access to the database information stored in its memory-res-ident performance tables (often referred to simply as system tables). Thisinformation can be retrieved either with SQL or supplied scripts. In this sec-tion we discuss these monitoring methods, explore ways of displaying andchanging Oracle tunable parameters, and consider explain plans (query exe-cution plans).
Running Administrative CommandsStarting and shutting down Oracle require special privileges, as do altersystem statements. The method of connecting to Oracle to run administra-tive commands has changed more than once over the last few releases; thedifferent methods for the major versions are shown below.
1

2 Monitor ing and Tuning Oracle - Chapter 22 Par t 1
Before Oracle7.3, the sqldba command was used as shown in the follow-ing example based on Oracle7.1.3.
From Oracle7.3, the most commonly used command was svrmgrl , asshown in the following example based on Oracle 8.0.5.
From Oracle9i, svrmgrl is no longer supported. The approved connectionmethod is based on the sqlplus command. This method also works with ear-lier versions of Oracle, such as Oracle8 and Oracle8i. The connection can beachieved in two steps, as shown in the example below, which is based onOracle8.1.5.
The same effect can be achieved with a single command, as shown in thefollowing example based on Oracle9.0.1.
alameda% sqldba mode=line
SQL*DBA: Release 7.1.3.2.0 - Production on Mon Aug 6 12:10:17 2001Copyright (c) Oracle Corporation 1979, 1994. All rights reserved.
Oracle7 Server Release 7.1.3.2.0 - Production ReleaseWith the parallel query optionPL/SQL Release 2.1.3.2.0 - Production
SQLDBA> connect internalConnected.
1.oracle8 svrmgrl
Oracle Server Manager Release 3.0.5.0.0 - Production
(c) Copyright 1997, Oracle Corporation. All Rights Reserved.
Oracle8 Enterprise Edition Release 8.0.5.0.0 - ProductionPL/SQL Release 8.0.5.0.0 - Production
SVRMGR> connect internalConnected.
oracle8.1.5% sqlplus /nolog
SQL*Plus: Release 8.1.5.0.0 - Production on Mon Aug 6 12:16:19 2001
(c) Copyright 1999 Oracle Corporation. All rights reserved.
SQL> connect / as sysdbaConnected.

Managing Oracle Behavior 3
Throughout the rest of this chapter, I use “sysdba ” as an abbreviation ofthe command sequences used to connect to Oracle to run administrative com-mands. You should substitute the appropriate command for your Oraclerelease (sqldba , svrmgrl , or sqlplus ).
Viewing Current Oracle Tunable Parameters
You can display parameter settings for the current Oracle instance by run-ning the show parameters command as sysdba . You can also display thesettings for a single parameter or a group of parameters. For example, to dis-play all settings for parameters containing the string block , run the follow-ing command as sysdba :
Changing Tunable Parameters for Oracle
Most Oracle tunables reside in a file called init${ORACLE_SID}.ora (usu-ally referred to as init.ora ), where $ORACLE_SID is the environment vari-able used to set the instance ID of the current Oracle instance. Theinit.ora file is typically located in the $ORACLE_HOME/dbs directory.
This file allows the database administrator to set values for the tunableparameters that determine the behavior of the Oracle instance. Systemdefault values are used for any parameters that are not set. The parametervalues in the init.ora file are only used when Oracle is started.
Some parameters can be changed dynamically with the set clause of thealter system commands; the number of such parameters has increasedwith recent versions of Oracle.
pae280% sqlplus "/ as sysdba"
SQL*Plus: Release 9.0.1.0.0 - Production on Mon Aug 6 12:19:15 2001
(c) Copyright 2001 Oracle Corporation. All rights reserved.
Connected to an idle instance.
SQL> show parameter block
NAME TYPE VALUE------------------------------------ ------- ------------db_block_buffers integer 8192db_block_checking boolean FALSEdb_block_checksum boolean FALSEdb_block_lru_latches integer 1db_block_max_dirty_target integer 8192db_block_size integer 2048db_file_multiblock_read_count integer 8hash_multiblock_io_count integer 0sort_multiblock_read_count integer 2

4 Monitor ing and Tuning Oracle - Chapter 22 Par t 1
Some sites also use a config.ora file, referenced from init.ora with theifile parameter, to store static parameters such as db_name anddb_block_size .
Making Dynamic Parameter Changes Persistent
Oracle9i introduced a method of storing and maintaining configurationparameters based on a new Server Parameter File (spfile ). As we have seen,tunable parameters can be changed dynamically with the set clause of thealter system statement. The spfile allows such changes to survive adatabase reboot. Without the spfile , all changes are lost when the databaseis shut down; unless the database administrator remembers to separatelyupdate the init.ora file, changes do not persistent across database reboots.
An spfile can be created from an init.ora file by the following state-ment run as sysdba :
It is not actually necessary to supply the spfile name; if no name is spec-ified, the name and location of the new spfile will default to$ORACLE_HOME/dbs/spfile$ORACLE_SID.ora . The spfile is a binary filethat must not be manually edited; changes should be made with the altersystem statement instead.
After an spfile is created, the database must be shut down and restartedbefore the file takes effect. If a startup command is issued without a pfileclause, the server parameter file will be used rather than the init.ora file.You can still boot Oracle with the init.ora file by supplying a pfile clauseidentifying the init.ora file. The new SPFILE configuration parameter canbe used to specify the location of the spfile .
When parameters are modified with the alter system statement, ascope clause can be used to specify the scope of the change. Supported val-ues are:
• scope=spfile . The change is made to the spfile only. Changes toboth dynamic and static parameters take effect only when the databaseis next started.
• scope=memory . The change is applied to the running instance only andtakes immediate effect for dynamic parameters. This option is not sup-ported for static parameters.
• scope=both . The change is applied to both the spfile and the run-ning instance and takes immediate effect for dynamic parameters. Thisoption is not supported for static parameters.
SQL> create spfile='$ORACLE_HOME/dbs/spfileaccts.ora' 2 from pfile='$ORACLE_HOME/dbs/initaccts.ora'; File created.

Managing Oracle Behavior 5
The default scope is both if the database was started with an spfile , andmemory if it was not.
A parameter can be returned to its system default value with the followingstatement:
You can create an init.ora file from an spfile with the following com-mand:
The file names can be eliminated if default names are used for init.oraand spfile .
Finally, the current active parameters can be viewed with the showparameters statement or by querying the v$parameter view (or thev$parameter2 view). The v$spparameter view displays the current con-tents of the spfile , or NULL values if the spfile is not in use.
Viewing and Changing Hidden Parameters
As well as the init.ora parameters described above, Oracle includes a num-ber of hidden init.ora parameters, each of which begins with an under-score (_). These hidden parameters can be set in the init.ora file just as forthe normal parameters. There are occasions when modifying a hidden param-eter can prove beneficial for performance reasons, and later in this chapter Iidentify some situations where modifying a hidden parameter might be help-ful.
Let me issue an Important Disclaimer, though: the parameters are hid-den by Oracle for a reason! Before changing them on a production system,discuss your plans with Oracle support. I will take no responsibility for data-base corruption or other problems resulting from your unsupported use ofhidden parameters, and you should expect Oracle and Sun to take the sameposition.
That said, the following query will display hidden parameters for Oracle8and later releases:
The isdefault column shows whether the current value for this parame-ter is the default (true or false ). Note that similar information can be
alter system set parameter = '';
create pfile=’$ORACLE_HOME/dbs/backup_initaccts.orafrom spfile=’$ORACLE_HOME/dbs/spfileaccts.ora’
select a.ksppinm "name", a.ksppdesc "description",b.ksppstvl "current", b.ksppstdf "isdefault"from x$ksppi a, x$ksppcv bwhere a.indx = b.indxand substr(a.ksppinm,1,1) = '_'order by a.ksppinm;

6 Monitor ing and Tuning Oracle - Chapter 22 Par t 1
obtained from Oracle7, although that release only provides the x$ksppi view,and not the x$ksppcv view.
On the book website (http://www.solarisdatabases.com) I have included ascript called _params that simplifies this process for Oracle8 and laterreleases. If run with no parameters, it displays all hidden parameters. If astring is passed to the script, it displays all hidden parameters matching thestring.
Monitoring Error MessagesOracle writes error, warning, and notification messages to thealert${ORACLE_SID}.log file, located in the $ORACLE_HOME/rdbms/logdirectory (unless an alternate directory has been specified with theBACKGROUND_DUMP_DEST parameter). This file is often referred to simply asalert.log . The alert log is a good first place to visit when trying to under-stand and resolve problems with an Oracle instance.
Using Oracle Enterprise ManagerOracle Enterprise Manager (OEM) provides access to database monitoringand administration capabilities with an intuitive graphical user interface.OEM displays the buffer cache hit rate and many other important Oraclemetrics.
Since the Oracle8.1.6 release, the OEM console runs on Solaris as well ason Windows platforms. To invoke the OEM console, run the oemapp com-mand from the command line (after first ensuring that your DISPLAY envi-ronment variable is set appropriately):
It may first be necessary to run the Enterprise Manager ConfigurationAssistant program, emca, to create a repository.
Rather than considering OEM in any detail, in this chapter I focus on thelower-level data provided by scripts in the hope that such a focus will offermore insight into the underlying mechanisms used by Oracle.
Monitoring Oracle System TablesOracle maintains a number of internal views that record statistics about thedatabase and offers scripts that present the same information in a moreunderstandable fashion.
v$ ViewsOracle’s internal views have names starting with v$ . Although they appear tobe tables, they are actually internal memory structures that are not persis-tent—that is, they only exist while the instance is active.
oracle% oemapp console &

Managing Oracle Behavior 7
A few examples of v$ views are given in the following list:
• v$system_event: Shows a summary of all the events waited for in theinstance since it started.
• v$session_event: Shows a summary of all the events the session haswaited for since it started.
• v$session_wait: Shows the current waits for a session. This view isan important starting point for finding current bottlenecks.
• v$sysstat : Shows system statistics.• v$sesstat : Shows system session statistics.• v$session : Shows user-session-related information.• v$parameter : Shows session parameters. To see the current parameter
settings, try running the following command as sysdba :select name, value from v$parameter
The v$system_parameter view shows systemwide parameters for theinstance.
• v$waitstat : Shows buffer wait statistics (the number of times a userprocess had to wait for various buffers).
• v$filestat : Shows file access statistics.
We will encounter a number of other v$ views later in this chapter.
The utlbstat and utlestat ScriptsAlthough all the v$ views can be accessed with standard SQL statements,Oracle provides a simpler mechanism in the form of two scripts, utlb-stat.sql and utlestat.sql . The first is run at the start of a measure-ment interval, and the second at the end of the measurement interval. Theresults are saved in a file called report.txt in the current directory. Manyof the more important v$ views are represented in this report. Before run-ning the scripts, make sure that Oracle is collecting timed statistics. If thetimed_statistics parameter is set to false , you can change it dynami-cally as sysdba with the following command:
The parameter can be reset to false in the same way after the scriptshave been run.
You can also permanently set the timed_statistics parameter to truein init.ora. The CPU overhead associated with timed statistics is small,and Oracle recommends setting the parameter permanently.
The way to run the utlbstat and utlestat scripts is shown below:
alter system set timed_statistics = true;
oracle$ sqlplus ”/ as sysdba”<< Various messages deleted >>SQL> @$ORACLE_HOME/rdbms/admin/utlbstat<< Pause for a suitable period of time... >><< Database activity during this period will be reported >>SQL> @$ORACLE_HOME/rdbms/admin/utlestat

8 Monitor ing and Tuning Oracle - Chapter 22 Par t 1
A sample report.txt for Oracle9i is presented later in this chapter, alongwith detailed comments and monitoring suggestions.
The Statspack ScriptsOracle8.1.6 also introduced the statspack scripts. These scripts report infor-mation similar to that reported by the utlbstat and utlestat scripts,although more data is collected and some useful ratios are calculated for you.The utlbstat /utlestat scripts will eventually be phased out—this chapterfocuses on their output rather than statspack output because they cover abroader range of releases.
For detailed information about installing and running the statspackscripts, refer to $ORACLE_HOME/rdbms/admin/spdoc.txt in the Oracle9irelease and $ORACLE_HOME/rdbms/admin/statspack.doc in the Oracle8irelease.
After installation (carried out with the spcreate.sql script for Oracle9iand with the statscre.sql script for Oracle8i), as sysdba you create snap-shots in the following way:
To create a report, run the spreport.sql script (Oracle9i) or thestatsrep.sql script (Oracle8i). The following example shows the appropri-ate syntax for Oracle9i.
As this example illustrates, the ? character can be used instead of$ORACLE_HOME within sqlplus .
This script prompts for the IDs of two previously created snapshots and,after prompting for a report file name, creates a report based on activityoccurring between the two snapshots.
Generating Explain Plans
Before retrieving data in response to a query, the database optimizer deter-mines how best to access the data. In practice, especially for DSS queries,there is often more than one path the optimizer can choose (for example,either to retrieve the data with an index or directly from the base table). Thesequence of steps the optimizer chooses is referred to as a query executionplan, or explain plan (the role of the database optimizer is discussed in detailin Chapter 8).
In an ideal world, the optimizer would always choose the optimal plan. Thereal world is rarely so straightforward, unfortunately. So because the queryplan is so important, especially to DSS performance, it is often necessary toprovide the optimizer with hints that can be embedded in SQL statements.
SQL> connect perfstat/perfstatSQL> execute statspack.snap;
SQL> @?/rdbms/admin/spreport

Managing Oracle Behavior 9
As previously stated, it is beyond the scope of this book to cover applica-tion and SQL tuning. Nonetheless, it is sometimes useful to know how to gen-erate an execution plan for an SQL statement.
As of Oracle 7.3, generating an explain plan from sqlplus is as easy asrunning the set autotrace on command before running the query. Notethat if the plan_table has not already been created, you will need to runthe $ORACLE_HOME/rdbms/admin/utlxplan.sql script first:
An example of autotrace is shown below.
SQL> @?/rdbms/admin/utlxplan
Table created.
SQL> set autotrace on SQL> select scale, power, company 2 from tpcd 3 where company like ’%Sun%’ 4 order by scale, power;
SCALE POWER COMPANY---------- ---------- ------------------------------ 30 702.8 Sun 100 13738.7 Sun 300 2009.5 Sun 300 3270.6 Sun 300 8113.2 Sun 1000 8870.6 Sun 1000 12931.9 Sun 1000 70343.7 Sun 1000 121824.7 Sun
9 rows selected.
Execution Plan---------------------------------------------------------- 0 SELECT STATEMENT Optimizer=CHOOSE 1 0 SORT (ORDER BY) 2 1 TABLE ACCESS (FULL) OF ’TPCD’
Statistics---------------------------------------------------------- 203 recursive calls 4 db block gets 58 consistent gets 17 physical reads 60 redo size 894 bytes sent via SQL*Net to client 715 bytes received via SQL*Net from client 4 SQL*Net roundtrips to/from client 5 sorts (memory) 0 sorts (disk) 9 rows processed

10 Monitor ing and Tuning Oracle - Chapter 22 Par t 1
Explain plans can also be generated with the utlxplan script. Thismethod, which also works with earlier versions of Oracle, is illustrated below.Once again, if the plan_table has not already been created, you will need torun the utlxplan.sql script, as shown.
When using this method of printing explain plans, it is simplest to executethe following SQL command between explain plans:
Note that the first statement, which runs the utlxplan script, only needsto be run once (it creates the PLAN_TABLE table).
As of Oracle 7.2, the select statement above can be enhanced as follows:
SQL> @$ORACLE_HOME/rdbms/admin/utlxplan
Table created.
SQL> explain plan 2 set Statement_ID = ’TEST’ 3 for 4 select a.invoice_date 5 from gl_je_lines a, gl_je_headers b 6 where je_line_num = 1 7 and a.je_header_id = b.je_header_id 8 order by invoice_date desc;
Explained.
SQL> select 2 LPAD(’ ’,2*Level)|| 3 Operation||’ ’||Options||’ ’|| 4 decode(Object_Owner,NULL,’’, 5 Object_Owner||’. ’||Object_Name)||’ ’|| 6 decode(Optimizer,NULL,’’,Optimizer) 7 Q_Plan 8 from PLAN_TABLE 9 connect by prior ID = Parent_ID and Statement_ID =’TEST’ 10 start with ID = 0 and Statement_ID = ’TEST’;
Q_PLAN------------------------------------------------------------ SELECT STATEMENT RULE SORT ORDER BY NESTED LOOPS TABLE ACCESS FULL GL. GL_JE_HEADERS ANALYZED TABLE ACCESS BY ROWID GL. GL_JE_LINES ANALYZED INDEX UNIQUE SCAN GL. GL_JE_LINES_U1 ANALYZED
6 rows selected.
delete from PLAN_TABLE where Statement_ID = ’TEST’;
selectLPAD(’ ’,2*Level)||

Managing Oracle Behavior 11
Oracle9i introduced a new view—v$sql_plan —that provides access to theexecution plans for recently executed cursors. The information provided issimilar to that produced by an explain plan statement. Unlike theexplain plan statement, which shows a theoretical plan, the v$sql_planview shows the actual plan that was used.
Calculating the Buffer Cache Hit RateAs we saw in Chapter 7, the buffer cache hit rate plays an important role indatabase performance, especially for OLTP workloads. The Oracle buffercache is sized according to the db_block_buffers parameter in init.ora(or the db_cache_size parameter in Oracle9i).
The statspack report shows the buffer cache hit rate (under Buffer HitRatio for Oracle8.1.6, and under Buffer Hit % for later releases). Thereport.txt file produced by the utlbstat and utlestat scripts does notcalculate the hit rate, although all the necessary information is there.
The Buffer Cache Hit Rate FormulaThe buffer cache hit rate can be calculated from the variables listed below(not all of them are used for all Oracle releases):
• physical reads : The number of read requests that required a block tobe read from disk.
• physical reads direct : The number of read requests that read ablock from disk, bypassing the buffer cache. Reads carried out duringparallel table scans, for example, bypass the buffer cache.
• physical reads direct (LOB) : The number of large-object (LOB)read requests that read a block from disk, bypassing the buffer cache.
• db block gets : Incremented when blocks are read for update andwhen segment header blocks are read.
• consistent gets : The number of times a consistent read wasrequested for a block.This statistic measures the number of block accesses involving SystemChange Number (SCN) checks. The SCN is a unique number assignedby Oracle to data file and block headers in ascending sequence to iden-
Operation||’ ’||Options||’ ’||decode(Object_Owner,NULL,’’,Object_Owner||’. ’||Object_Name)||’ ’||decode(Optimizer,NULL,’’,Optimizer)||’ ’||decode(Cost,NULL,’’, ’ Cost=’||Cost|| ’ Rows Expected=’||Cardinality)Q_Planfrom PLAN_TABLEconnect by prior ID = Parent_ID and Statement_ID = ’TEST’start with ID = 0 and Statement_ID = ’TEST’;

12 Monitor ing and Tuning Oracle - Chapter 22 Par t 1
tify transaction modifications. It is checked to ensure that data is up-to-date. If the SCN for a row has changed since the transaction started,then the row must have been updated by another transaction; thebefore-image of the row will have been stored in a rollback segment.The SCN is incremented as changes are made to data. Each row (andthe block in which it is stored) holds a copy of the SCN that was currentwhen the row was last changed. When the block is flushed to disk by theDatabase Writers, the SCN on disk will match the SCN for the sameblock in the buffer cache.Oracle uses the SCN to ensure that data remains consistent and toassist in recovery after a crash. During roll-forward recovery, if the SCNfor a block on disk is the same or later than the SCN in the redo log,there is no need to roll forward the transaction.
Figure 1 shows the formula for calculating the cache hit rate before theOracle8i releases.
Figure 1 Oracle Buffer Cache Hit Rate Formula before Oracle8i
Figure 2 shows the formula for calculating the cache hit rate for theOracle8.1.5 and Oracle8.1.6 releases.
Figure 2 Oracle Buffer Cache Hit Rate Formula for Oracle8.1.5/8.1.6
For Oracle8.1.7 and Oracle9i, use the formula shown in Figure 3 to calcu-late the buffer cache hit rate.
Figure 3 Oracle Buffer Cache Hit Rate Formula for Oracle8.1.7/9i
Cache Hit Rate PredictionOracle9i introduced a new view—v$db_cache_advice —to help with thechallenging task of determining the optimal size for the buffer cache. Beforethis view can be used, the following statement must be executed:
alter system set db_cache_advice = on;
cachehitrate 1 physicalreadsdbblockgets consistentgets+( )
--------------------------------------------------------------------------------- –
100×=
cachehitrate 1 physicalreads physicalreadsdirect–dbblockgets consistentgets physicalreadsdirect–+( )
--------------------------------------------------------------------------------------------------------------------------------------------- –
100×=
1 physicalreads physicalreadsdirect– physicalreadsdirectLOB–dbblockgets consistentgets physicalreadsdirect– physicalreadsdirectLOB–+( )
--------------------------------------------------------------------------------------------------------------------------------------------------------------------------------------------------------------------- –
100×

Monitor ing Oracle wi th ut lbsta t/ut lestat 13
This statement will cause approximately 100 bytes to be allocated in theshared pool per buffer and will also result in a small CPU overhead. Theshared pool memory can be preallocated by setting the db_cache_adviceparameter to ready or on in init.ora before the database is started. Thedefault value for db_cache_advice is off .
After a workload has been running for a time, the view can be queried. Thecollecting of statistics is terminated when the db_cache_advice parameteris set to off or to ready .
The v$db_cache_advice view reports the estimated number of physicalreads that would have been required for 20 different buffer cache sizes, rang-ing from 10% of the current size to 200% of the current size. The informationhelps you to assess the likely impact on the I/O subsystem of either decreas-ing or increasing the size of the buffer cache.
M o n i t o r i n g O r a c l e w i t h u t l b s t a t / u t l e s t a tTo illustrate the process of monitoring Oracle, we examine an Oracle9ireport.txt file created with the utlbstat.sql and utlestat.sqlscripts (described in “The utlbstat and utlestat Scripts” on page 7). The reportis interspersed with comments about some of the highlights; my objective isto explore the main statistics that might require action rather than toattempt to explain every item.
Note that although we follow the order used by report.txt , the best wayto begin understanding instance behavior is to examine wait events. Thestatspack scripts recognize this by reporting the top five wait events almostat the beginning of the report.
The Library CacheThe first section of the report deals with the library cache. The library cachestores SQL and PL/SQL statements for reuse by other applications (in theSQL AREA), and also caches other objects for Oracle’s internal use.
SQL> column library format a12 trunc;SQL> column pinhitratio heading ‘PINHITRATI’;SQL> column gethitratio heading ‘GETHITRATI’;SQL> column invalidations heading ‘INVALIDATI’;SQL> set numwidth 10;SQL> Rem Select Library cache statistics.The pin hit rate should be high.SQL> select namespace library, 2 gets, 3 round(decode(gethits,0,1,gethits)/decode(gets,0,1,gets),3) 4 gethitratio, 5 pins, 6 round(decode(pinhits,0,1,pinhits)/decode(pins,0,1,pins),3) 7 pinhitratio, 8 reloads, invalidations 9 from stats$lib;

14 Monitor ing and Tuning Oracle - Chapter 22 Par t 1
Gets measure the number of times Oracle set up a reference to objects inthe cache, and pins measure the number of times objects were referenced.The gethitratio and pinhitratio should be as close to 1 as possible (atleast .95), and reloads should be no more than 2% of gets . These elementscannot be individually tuned, but increasing the size of the shared pool (theshared_pool_size parameter in init.ora ) can help improve the hitratios.
User Connections
The next section of the report deals with database connections.
LIBRARY GETS GETHITRATI PINS PINHITRATI RELOADS INVALIDATI ------------ -------- ---------- --------- ---------- -------- ----------BODY 1172 1 1172 .999 1 0 CLUSTER 0 1 0 1 0 0 INDEX 818 .001 818 .001 0 0 JAVA DATA 0 1 0 1 0 0 JAVA RESOURC 0 1 0 1 0 0 JAVA SOURCE 0 1 0 1 0 0 OBJECT 0 1 0 1 0 0 PIPE 0 1 0 1 0 0 SQL AREA 517004 .986 2246870 .991 9115 4878 TABLE/PROCED 26899 .974 1739839 .999 1254 0 TRIGGER 0 1 0 1 0 0
11 rows selected.
SQL> column “Statistic” format a27 trunc;SQL> column “Per Transaction” heading “Per Transact”;SQL> column ((start_users+end_users)/2) heading “((START_USER”SQL> set numwidth 12;SQL> Rem The total is the total value of the statistic between the timeSQL> Rem bstat was run and the time estat was run. Note that the estatSQL> Rem script logs on to the instance so the per_logon statistics willSQL> Rem always be based on at least one logon.SQL> select ‘Users connected at ‘,to_char(start_time, ‘dd-mon-yy hh24:mi:ss’),’:’,start_users from stats$dates;
‘USERSCONNECTEDAT’------------------------
TO_CHAR(START_TIME ----------------------
‘-
START_USERS------------
Users connected at 17-aug-01 10:01:30 : 41
SQL> select ‘Users connected at ‘,to_char(end_time, ‘dd-mon-yy hh24:mi:ss’),’:’,end_users from stats$dates;
‘USERSCONNECTEDAT’------------------------
TO_CHAR(END_TIME,’---------------------
‘-
END_USERS-----------
Users connected at 17-aug-01 10:31:24 : 41
SQL> select ‘avg # of connections: ‘,((start_users+end_users)/2) from stats$dates;
‘AVG#OFCONNECTIONS:’---------------------
((START_USER------------
avg # of connections: 41

Monitor ing Oracle wi th ut lbsta t/ut lestat 15
The number of connections at the start and end of the monitoring periodand the average number of connections all help track user connectivity. Notethat connections do not necessarily equate to users, though, since some usersmay have more than one connection and administrative scripts (including theone used to create this report) also count as connections. Conversely, transac-tion monitors allow multiple users to share a single connection.
The duration of the monitoring period is also shown at the end of thereport. In this case it was almost exactly 30 minutes.
Database StatisticsThe statistics below include some of the most important measures to be moni-tored. If you examine the SQL command that generated these results, youwill notice that only statistics with non-zero values are reported. Conse-quently, if you run utlbstat /utlestat again later, you might find that newrows appear in this section of the report and other rows may have disap-peared.
SQL> select n1.name “Statistic”, 2 n1.change “Total”, 3 round(n1.change/trans.change,2) “Per Transaction”, 4 round(n1.change/((start_users + end_users)/2),2) “Per Logon”, 5 round(n1.change/(to_number(to_char(end_time, ‘J’))*60*60*24 - 6 to_number(to_char(start_time, ‘J’))*60*60*24 + 7 to_number(to_char(end_time, ‘SSSSS’)) - 8 to_number(to_char(start_time, ‘SSSSS’))) 9 , 2) “Per Second” 10 from 11 stats$stats n1, 12 stats$stats trans, 13 stats$dates 14 where 15 trans.name=’user commits’ 16 and n1.change != 0 17 order by n1.name;
Statistic-----------------------
Total---------
PerTransact--------
Per Logon---------
Per Second----------
CR blocks created 11909 .04 290.46 6.64Cached Commit SCN reference 158232 .49 3859.32 88.2DBWR buffers scanned 590396 1.82 14399.9 329.09DBWR checkpoint buffers wri 704570 2.18 17184.63 392.74DBWR checkpoints 2 0 .05 0DBWR free buffers found 402083 1.24 9806.9 224.13DBWR lru scans 22320 .07 544.39 12.44DBWR make free requests 22320 .07 544.39 12.44DBWR summed scan depth 590396 1.82 14399.9 329.09DBWR transaction table writ 68 0 1.66 .04DBWR undo block writes 32991 .1 804.66 18.39

16 Monitor ing and Tuning Oracle - Chapter 22 Par t 1
SQL*Net roundtrips to/from 421556 1.3 10281.85 234.98background checkpoints comp 2 0 .05 0background checkpoints star 2 0 .05 0background timeouts 3947 .01 96.27 2.2branch node splits 1210 0 29.51 .67buffer is not pinned count 7280085 22.48 177563.05 4058.02buffer is pinned count 1530511 4.73 37329.54 853.13bytes received via SQL*Net 101119623 312.28 2466332.27 56365.45bytes sent via SQL*Net to c 235602857 727.59 5746411.15 131328.24calls to get snapshot scn: 501750 1.55 12237.8 279.68calls to kcmgas 408813 1.26 9971.05 227.88calls to kcmgcs 83029 .26 2025.1 46.28cleanouts and rollbacks - c 8645 .03 210.85 4.82cleanouts only - consistent 4922 .02 120.05 2.74cluster key scan block gets 6431181 19.86 156858.07 3584.83cluster key scans 6431132 19.86 156856.88 3584.8commit cleanout failures: b 1 0 .02 0commit cleanout failures: b 69 0 1.68 .04commit cleanout failures: c 303 0 7.39 .17commit cleanout failures: c 676 0 16.49 .38commit cleanouts 4006646 12.37 97723.07 2233.36commit cleanouts successful 4005597 12.37 97697.49 2232.77consistent changes 11959 .04 291.68 6.67consistent gets 10345798 31.95 252336.54 5766.89consistent gets - examinati 2841078 8.77 69294.59 1583.66cursor authentications 26 0 .63 .01data blocks consistent read 11954 .04 291.56 6.66db block changes 13297163 41.06 324321.05 7412.02db block gets 9020588 27.86 220014.34 5028.2deferred (CURRENT) block cl 2208212 6.82 53858.83 1230.89dirty buffers inspected 42360 .13 1033.17 23.61enqueue releases 423982 1.31 10341.02 236.34enqueue requests 423997 1.31 10341.39 236.34enqueue waits 11430 .04 278.78 6.37execute count 2275386 7.03 55497.22 1268.33free buffer inspected 42398 .13 1034.1 23.63free buffer requested 763898 2.36 18631.66 425.81hot buffers moved to head o 831102 2.57 20270.78 463.27immediate (CR) block cleano 13567 .04 330.9 7.56immediate (CURRENT) block c 530423 1.64 12937.15 295.66leaf node splits 66072 .2 1611.51 36.83logons cumulative 2 0 .05 0messages received 320324 .99 7812.78 178.55messages sent 320326 .99 7812.83 178.55native hash arithmetic exec 4836175 14.94 117955.49 2695.75no work - consistent read g 6989419 21.58 170473.63 3896opened cursors cumulative 121 0 2.95 .07parse count (failures) 1 0 .02 0parse count (hard) 5 0 .12 0parse count (total) 120 0 2.93 .07physical reads 678283 2.09 16543.49 378.08physical reads direct 94 0 2.29 .05physical writes 935315 2.89 22812.56 521.36physical writes direct 94 0 2.29 .05physical writes non checkpo 603082 1.86 14709.32 336.17prefetched blocks 1558 0 38 .87

Monitor ing Oracle wi th ut lbsta t/ut lestat 17
Note that four sets of values are reported for each statistic:
• Total. This value shows the total number of events of this type duringthe monitoring interval.
• Per Transaction. This column is normalized according to the numberof user commits (you will notice a value of 1 for that row). Note thatthe rate of user commits can provide an alternate measure of applica-tion workload in the absence of higher-level information about businesstransactions (such as the number of invoices processed during a speci-fied period of time).
• Per Logon. Normalizing the statistic according to the number of logons(user connections) can help in predicting the impact of changing thenumber of users and user connections. Bear in mind, though, thatlogged-on connections may not all be active.
recursive calls 2034976 6.28 49633.56 1134.32redo blocks written 4683822 14.46 114239.56 2610.83redo buffer allocation retr 72 0 1.76 .04redo entries 6864072 21.2 167416.39 3826.13redo log space requests 72 0 1.76 .04redo size 2276348068 7029.82 55520684.59 1268867.37redo synch writes 328737 1.02 8017.98 183.24redo wastage 46160068 142.55 1125855.32 25730.25redo writes 186021 .57 4537.1 103.69rollback changes - undo rec 39610 .12 966.1 22.08rollbacks only - consistent 3257 .01 79.44 1.82rows fetched via callback 173830 .54 4239.76 96.9serializable aborts 12052 .04 293.95 6.72session logical reads 19366372 59.81 472350.54 10795.08session pga memory 50759728 156.76 1238042.15 28294.16session pga memory max 50653084 156.43 1235441.07 28234.72session uga memory 38770192 119.73 945614.44 21611.03session uga memory max 38828836 119.91 947044.78 21643.72shared hash latch upgrades 450999 1.39 10999.98 251.39shared hash latch upgrades 2 0 .05 0sorts (disk) 857 0 20.90 .48sorts (memory) 71791 .22 1751 40.02sorts (rows) 1924399 5.94 46936.56 1072.69summed dirty queue length 263847 .81 6435.29 147.07switch current to new buffe 11 0 .27 .01table fetch by rowid 201420 .62 4912.68 112.27table scan blocks gotten 3002 .01 73.22 1.67table scan rows gotten 948 0 23.12 .53table scans (short tables) 12 0 .29 .01transaction rollbacks 4917 .02 119.93 2.74user calls 421017 1.3 10268.71 234.68user commits 323813 1 7897.88 180.5user rollbacks 13640 .04 332.68 7.6write clones created in for 356 0 8.68 .2
100 rows selected.

18 Monitor ing and Tuning Oracle - Chapter 22 Par t 1
• Per Second. This value helps put the totals in perspective. For exam-ple, the I/O capability of a disk is usually expressed in I/Os per second,so knowing that 935,315 physical writes were completed is not as usefulas knowing that on average 521 physical writes were completed per sec-ond. Early versions of Oracle did not include this useful column.
The Buffer Cache Hit RateUsing the Oracle9i cache hit rate equation presented earlier in this chapterand the information reported above, we can calculate the cache hit rate forthe monitoring interval:
Buffer Cache Hit Rate= (1 − ((678283 − 94 − 0) ÷ (9020588 + 10345798 − 94 − 0) ) )
× 100= 96.5%
Given a cache hit rate of 96.5%, the miss rate is 3.5%—a miss rate thatcould probably be reduced.
Is the hit rate acceptable? Given the rate of physical reads (approximately380 per second) and the rate of physical writes (approximately 520 per sec-ond), the average disk I/O rate is 900 I/Os per second. That load could proba-bly be handled by fifteen 7200 rpm disks or twelve 10000 rpm disks, althoughit would be wise to configure up to 50% more disks to allow for peaks of I/Oactivity.
If 20 to 25 disks are in use for the database and the I/O is balanced evenlyacross all the disks, it may not be necessary to try to improve the cache hitrate. On the other hand, if fewer disks are in use and they are heavily uti-lized, reducing the miss rate might significantly improve performance, pro-vided adequate memory is available for the purpose (never increase the sizeof the buffer cache so much that applications begin to page). Remember, too,that increasing the cache size will make little change to the rate of physicalwrites.
The issues related to monitoring the buffer cache hit rate and sizing thebuffer cache are explored in more detail in Chapter 7 of Configuring and Tun-ing Databases on the Solaris Platform, beginning with “Monitoring the BufferCache” on page 76.
Other Statistics to MonitorWe conclude this section of the report.txt file by considering a few high-lights from the long list of statistics reported by utlbstat and utlestat .
• dirty buffers inspected . This statistic measures the number oftimes a shadow process found a dirty buffer on the least recently used(LRU) list. Normally the Database Writers find such dirty buffers andmove them to a linked list of dirty buffer headers. If the Database Writ-ers are working effectively, this statistic should be zero (and thereforenot appear in the report) or have a low value. Adding more DatabaseWriters (the db_writer_processes parameter in init.ora ) should

Monitor ing Oracle wi th ut lbsta t/ut lestat 19
help resolve a problem of this type. In this case, dirty buffers have beenfound 24 times a second, or on average for one in eight transactions, sug-gesting that the number of Database Writers could be usefullyincreased.
• redo log space requests . This statistic measures the number oftimes shadow processes stalled waiting for log file space. A commonmyth is that the statistic reports the number of times a process stallsduring commits because there was not enough room in the log buffer.Stalls can occur during checkpoints.
• sorts (disk) and sorts (memory) . The first of these statistics mea-sures the number of sorts that spill to the temporary tablespace becausethey could not fit in the memory allocated by the sort_area_sizeparameter in init.ora . The second statistic shows the number of sortsthat were able to complete in memory without resorting to the tempo-rary tablespace. The report above shows 857 sorts to disk over a 30-minute period compared to 71,791 sorts in memory. So just over 1% ofall sorts spilled to disk, at a rate of less than one per minute. There islittle reason to increase sort_area_size in this case.
• table scans (short tables) and table scans (long tables) . Thefirst of these statistics shows the number of table scans carried out onshort tables (less than or equal to 5 blocks in length) or on tables thathave been flagged as cached.
Tables can be specified as cached when the table is created, or later withthe alter table command from sqlplus (for example, alter tablecustomer cache; ). Normally, blocks read during a full table scan aremarked as least recently used, and the space they consume is quicklyreclaimed. By contrast, blocks read from cached tables during a tablescan are treated as most recently used blocks. Caching small, heavilyaccessed tables can improve performance in some cases.
The second statistic shows the number of table scans on larger tables(none appeared in the report). Large table scans should be avoided inOLTP environments since they impact overall system performance andlower the buffer cache hit rate. Creating appropriate indexes or modify-ing the application can overcome the problem.
Systemwide Wait Events
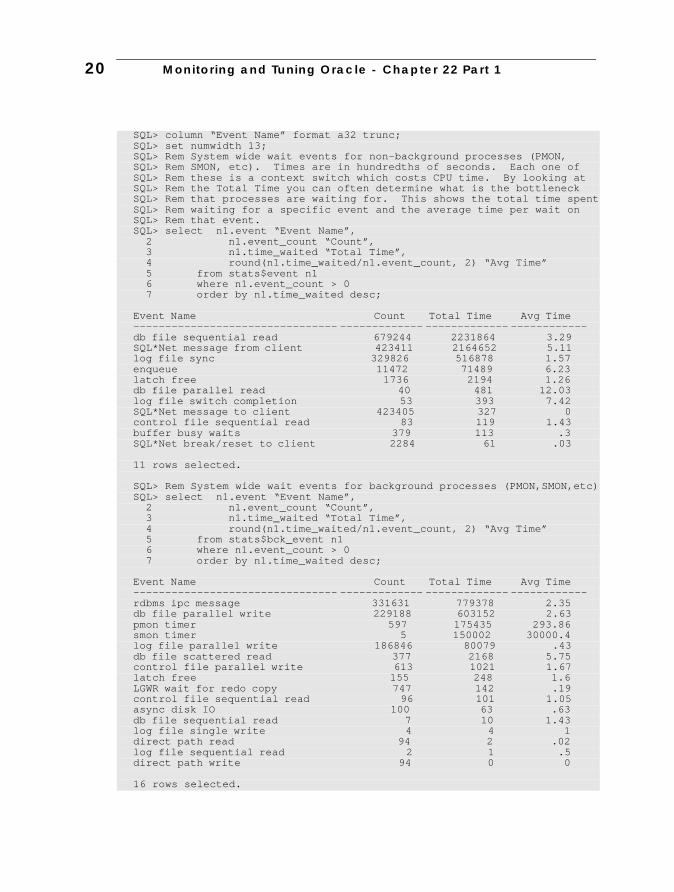
You can dynamically view the events reported in the next section of thereport.txt file by querying the v$system_event and v$session_eventviews as sysdba . The report below breaks down the wait events into two cat-egories: nonbackground processes and background processes, where back-ground processes are Oracle system processes like PMON, SMON, and LGWR. Thewait events are sorted in descending order of total time spent waiting (inunits of hundredths of seconds).
20 Monitor ing and Tuning Oracle - Chapter 22 Par t 1
SQL> column “Event Name” format a32 trunc;SQL> set numwidth 13;SQL> Rem System wide wait events for non-background processes (PMON,SQL> Rem SMON, etc). Times are in hundredths of seconds. Each one ofSQL> Rem these is a context switch which costs CPU time. By looking atSQL> Rem the Total Time you can often determine what is the bottleneckSQL> Rem that processes are waiting for. This shows the total time spentSQL> Rem waiting for a specific event and the average time per wait onSQL> Rem that event.SQL> select n1.event “Event Name”, 2 n1.event_count “Count”, 3 n1.time_waited “Total Time”, 4 round(n1.time_waited/n1.event_count, 2) “Avg Time” 5 from stats$event n1 6 where n1.event_count > 0 7 order by n1.time_waited desc;
Event Name Count Total Time Avg Time -------------------------------- ------------- ------------- ------------ db file sequential read 679244 2231864 3.29 SQL*Net message from client 423411 2164652 5.11 log file sync 329826 516878 1.57 enqueue 11472 71489 6.23 latch free 1736 2194 1.26 db file parallel read 40 481 12.03 log file switch completion 53 393 7.42 SQL*Net message to client 423405 327 0 control file sequential read 83 119 1.43 buffer busy waits 379 113 .3 SQL*Net break/reset to client 2284 61 .03
11 rows selected.
SQL> Rem System wide wait events for background processes (PMON,SMON,etc)SQL> select n1.event “Event Name”, 2 n1.event_count “Count”, 3 n1.time_waited “Total Time”, 4 round(n1.time_waited/n1.event_count, 2) “Avg Time” 5 from stats$bck_event n1 6 where n1.event_count > 0 7 order by n1.time_waited desc;
Event Name Count Total Time Avg Time -------------------------------- ------------- ------------- ------------ rdbms ipc message 331631 779378 2.35 db file parallel write 229188 603152 2.63 pmon timer 597 175435 293.86 smon timer 5 150002 30000.4 log file parallel write 186846 80079 .43 db file scattered read 377 2168 5.75 control file parallel write 613 1021 1.67 latch free 155 248 1.6 LGWR wait for redo copy 747 142 .19 control file sequential read 96 101 1.05 async disk IO 100 63 .63 db file sequential read 7 10 1.43 log file single write 4 4 1 direct path read 94 2 .02 log file sequential read 2 1 .5 direct path write 94 0 0
16 rows selected.

Monitor ing Oracle wi th ut lbsta t/ut lestat 21
The SQL*Net message from client wait event simply means that theshadow process is waiting for the client to do something. Consequently, sub-stantial wait times for this event do not usually indicate a problem (unlessthe waits are due to network delays). The converse event, SQL*Net messageto client , shows the delay when shadow processes send messages to cli-ents; large delays could indicate network problems.
Wait events that should be monitored include those in the following list:
• free buffer waits . A lot of time spent waiting for free buffers sug-gests that the Database Writers are not flushing dirty buffers fastenough to keep up with demand. This event does not appear in thereport above, but if it should appear as a major wait event, try increas-ing the db_writer_processes parameter in init.ora .
• buffer busy waits . Buffer busy waits occur when shadow processeswere unable to access a buffer because it was in use by another process.The report above shows a tiny number of waits of this type. If buffer busy waits are one of the top wait events in terms of percent-age of time waited, check the v$waitstat view to find out what type ofblocks are affected (this information is also presented later inreport.txt , in “Buffer Busy Wait Statistics” on page 27).You can also check the v$session_wait view to find out the file ID (theP1 column) and the block ID (the P2 column) of the affected block. Thefile ID can be used to query the dba_extents view (you will need to adda where file_id = n clause, where n is the file ID from thev$session_wait view) to get the details of the segment that the blockID falls within.Each data block supports a limited number of concurrent accesses forupdate or delete operations; a table with a large number of rows perblock and high concurrency can experience frequent buffer busy waitevents as a result. The INITRANS parameter determines the number ofconcurrent accesses (the default is 1 for tables and 2 for indexes). If thesegment identified in v$session_wait belongs to a table or index, youcould increase the INITRANS storage parameter. The INITRANS param-eter can only be set during table or index creation, so it may be neces-sary to drop and recreate the table or index.For tables subject to high insert concurrency, increase the FREELISTSstorage parameter to improve performance if the buffer busy waitevents are related to inserts. The FREELISTS parameter also must bespecified at create time.
• enqueues . Although this wait event appears in the report above, thenumber of events and wait time do not suggest a problem. If enqueuewaits represent a high proportion of the time spent waiting, you can tryto identify the enqueue waited for. Oracle9i provides a view—v$enqueue_stat —for this purpose; see statspack for more informa-tion before Oracle9i. Enqueue waits are a symptom of some other prob-lem.

22 Monitor ing and Tuning Oracle - Chapter 22 Par t 1
Latch Wait Events
Latch wait information can be obtained from the v$latch view. When a latchis not available, in some cases the requesting process may spin (that is, con-sume CPU) for a time before trying again, depending on the nature of thelatch request. If the latch is still unavailable, the process will go to sleep andtry again when it wakes up. The next section of report.txt deals withlatches of this type. The same information can also be obtained from thename, gets , misses , and sleeps columns in the v$latch view.
The subsequent section deals with no-wait latches. Processes unable toacquire latches requested in this way do not sleep, but time out and retryimmediately. The immediate_gets and immediate_misses columns inv$latch also provide this information.
When monitoring latches, check the hit ratio, which indicates the degree ofcontention on the latch. Check also the number of gets, which indicates howhot (that is, how much in demand) a latch is, and the number of sleeps, whichindicates the number of times the process had to sleep while waiting for thelatch.
The worst-case scenario with latches is that a process will be preempted bythe operating system while holding a high-contention latch. Database perfor-mance for some Solaris systems (particularly midrange systems) improves ifthe CPU allocation available to processes is increased. This issue and its reso-lution are discussed in “The TS Class” on page 220 of Configuring and Tun-ing Databases on the Solaris Platform.
Latches with Waits
The first section of the latch report deals with latches with waits.
SQL> column latch_name format a18 trunc;SQL> set numwidth 11;SQL> Rem Latch statistics. Latch contention will show up as a large value forSQL> Rem the ‘latch free’ event in the wait events above.SQL> Rem Sleeps should be low.The hit_ratio should be high.SQL> select name latch_name, gets, misses, 2 round((gets-misses)/decode(gets,0,1,gets),3) 3 hit_ratio, 4 sleeps, 5 round(sleeps/decode(misses,0,1,misses),3) “SLEEPS/MISS” 6 from stats$latches 7 where gets != 0 8 order by name;
LATCH_NAME-----------------------
GETS--------
MISSES--------
HIT-RATIO----------
SLEEPS--------
SLEEPS/MISS-----------
FIB s.o chain latc 8 0 1 0 0 FOB s.o list latch 75 0 1 0 0 active checkpoint 135993 82 .999 4 .049

Monitor ing Oracle wi th ut lbsta t/ut lestat 23
No-Wait Latches
The remainder of this section of the report deals with no-wait latches. It isfollowed by suggestions on latch monitoring.
cache buffers chai 67102082 5408 1 131 .024 cache buffers lru 1211707 386 1 8 .021 channel handle poo 4 0 1 0 0 channel operations 582 0 1 0 0 checkpoint queue l 5377441 1310 1 92 .07 child cursor hash 12 0 1 0 0 dml lock allocatio 110 0 1 0 0enqueue hash chain 859206 1146 .999 117 .102 enqueues 1047133 820 .999 23 .028 event group latch 2 0 1 0 0 hash table column 4 0 1 0 0 ktm global data 5 0 1 0 0 latch wait list 958 0 1 0 0 library cache 4660957 12857 .997 465 .036 list of block allo 892019 301 1 44 .146 loader state objec 4 0 1 0 0messages 1158227 551 1 42 .076 multiblock read ob 834 0 1 0 0 ncodef allocation 29 0 1 0 0 post/wait queue la 655696 1722 .997 152 .088 process allocation 2 0 1 0 0 process group crea 4 0 1 0 0 redo allocation 7233318 20538 .997 374 .018 redo copy 136 80 .412 93 1.163 redo writing 1166363 1394 .999 140 .1 row cache objects 121417 7 1 0 0 sequence cache 3 0 1 0 0 session allocation 334950 295 .999 7 .024 session idle bit 1009326 512 .999 26 .051 session switching 29 0 1 0 0 shared pool 224 0 1 0 0 sort extent pool 34 0 1 0 0 transaction alloca 1263687 2378 .998 77 .032 transaction branch 29 0 1 0 0 undo global data 1376947 2983 .998 77 .026 user lock 4 0 1 0 0
39 rows selected.
SQL> set numwidth 16SQL> Rem Statistics on no_wait gets of latches. A no_wait get does notSQL> Rem wait for the latch to become free, it immediately times out.SQL> select name latch_name, 2 immed_gets nowait_gets, 3 immed_miss nowait_misses, 4 round((immed_gets/(immed_gets+immed_miss)), 3) 5 nowait_hit_ratio 6 from stats$latches 7 where immed_gets + immed_miss != 0 8 order by name;
LATCH_NAME NOWAIT_GETS NOWAIT_MISSES NOWAIT_HIT_RATIO ------------------ ---------------- ---------------- ---------------- cache buffers chai 806427 38 1 cache buffers lru 763359 1090 .999 process allocation 2 0 1 redo copy 6861266 55595 .992

24 Monitor ing and Tuning Oracle - Chapter 22 Par t 1
The hit_ratio should be close to 1. The following list indicates the mainlatches to monitor:
• cache buffers chains . When searching for a block in the cache, ashadow process uses a hashing algorithm to find the appropriate hashbucket and then follows a hash chain to scan for the block. Fewer hashbuckets means longer hash chains, more searching, and higher conten-tion on the cache buffers chains latch. Inefficient SQL statements,such as heavily accessed statements using indexes that are not highlyselective, can cause high contention for this latch.
Identify the scale of any potential problem with the following SQL (forOracle8 and later releases) as sysdba :
• cache buffers lru chains . This latch protects the LRU chain. Highcontention could indicate that the Database Writers are not operatingefficiently, for example, due to a slow or overloaded I/O subsystem.
• library cache . A number of factors contribute to high library cachelatch contention. Sometimes you can alleviate the contention simply byincreasing the size of the shared pool (the shared_pool_size parame-ter in init.ora ). Other changes that might be necessary to relievelibrary cache contention include those in the following list:
• Keep large SQL statements into the shared pool (with thedbms_shared_pool.keep procedure).
• Use bind variables to reduce SQL statement parsing. For example,the following two statements are parsed and stored independentlyin the shared pool, even though they are almost identical:
The preferred approach is to use a bind variable (for example,:cust_id ) and to assign the value for cust_id to the bind vari-able. The two statements can then be consolidated into a singlestatement:
Use of bind variables reduces latch contention and also reduces thepressure on free space in the shared pool.
• Fully qualify object names. For example, use:
select count(*) from x$bh;select dbarfil “File”, dbablk “Block”, count(*) from x$bh group by dbafil, dbablk having count(*) > 1;
select cust_name from customer where cust_id = 12345;select cust_name from customer where cust_id = 23456;
select cust_name from customer where cust_id = :cust_id;
select * from accts.customer;

Monitor ing Oracle wi th ut lbsta t/ut lestat 25
rather than:
• Flush the shared pool if fragmentation occurs (run the altersystem flush shared_pool command as sysdba ). Fragmenta-tion problems are typically accompanied by the ORA-4031 errormessage: More shared memory is needed than was allocatedin the shared pool . Note that flushing the shared pool providesshort-term relief at the cost of a short-term performance hit butdoes not solve the problem. The previous suggestions should pro-vide longer-term solutions.
• redo copy . If the hit ratio is low for the redo copy latch, it may bepossible to reduce the contention by increasing the number of redocopy latches with the hidden _log_simultaneous_copies parame-ter in init.ora . Normally this parameter is based on the number ofCPUs on the system. Do not change this parameter in Oracle9i. Formore information on hidden parameters, including caveats, refer to“Viewing and Changing Hidden Parameters” on page 5.
The second half of Chapter 22 will appear in the August edition of Sun BluePrintsOnline. The chapter is extracted from Configuring and Tuning Databases on theSolaris Platform, by Allan N. Packer, (c) 2002, Sun Microsystems Press.
select * from customer;

26 Monitor ing and Tuning Oracle - Chapter 22 Par t 1


![Best Practices for Oracle Monitoring with Oracle Extended Agent. - IBM · PDF fileBest Practices for Oracle Monitoring with Oracle Extended Agent. Document version [0.3] [Byline for](https://img.pdfslide.net/doc/110x75/5a705d237f8b9ac0538bea20/best-practices-for-oracle-monitoring-with-oracle-extended-agent-ibm-pdf.jpg)