Embed Size (px)
Citation preview
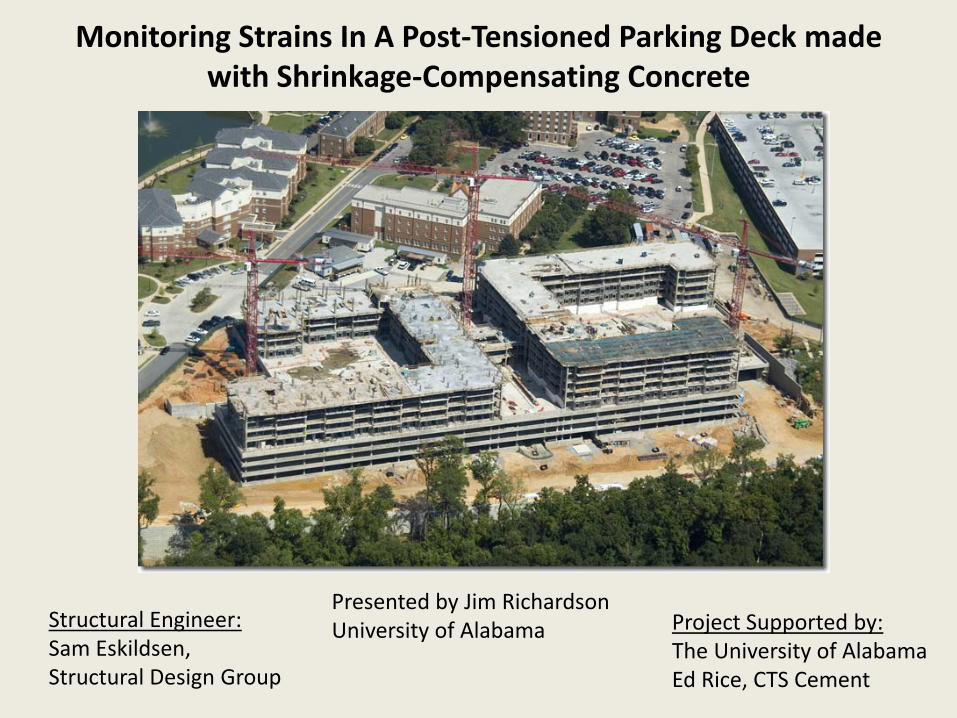
Monitoring Strains In A Post-Tensioned Parking Deck made with Shrinkage-Compensating Concrete
Project Supported by:The University of AlabamaEd Rice, CTS Cement
Presented by Jim RichardsonUniversity of AlabamaStructural Engineer:
Sam Eskildsen, Structural Design Group
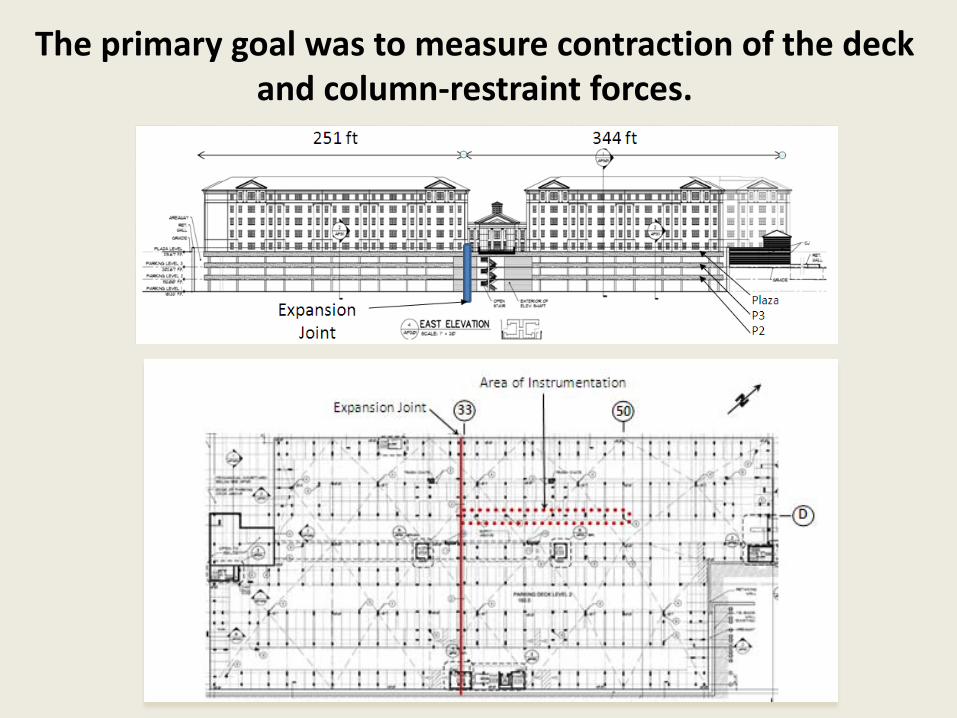
The primary goal was to measure contraction of the deck and column-restraint forces.

Sensors were located in regions of anticipated maximum restraint forces (1st story columns at slab perimeter).
Elevation View of Parking Deck
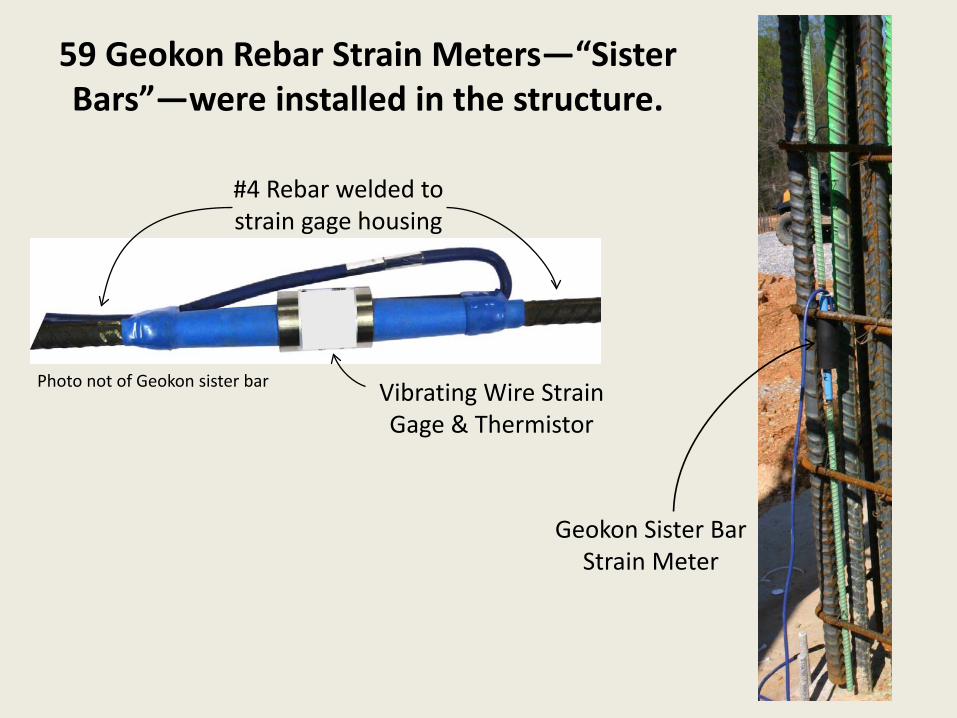
59 Geokon Rebar Strain Meters—“Sister Bars”—were installed in the structure.
Vibrating Wire Strain Gage & Thermistor
#4 Rebar welded to strain gage housing
Photo not of Geokon sister bar
Geokon Sister Bar Strain Meter

Stain meters were installed one above the other in slab.
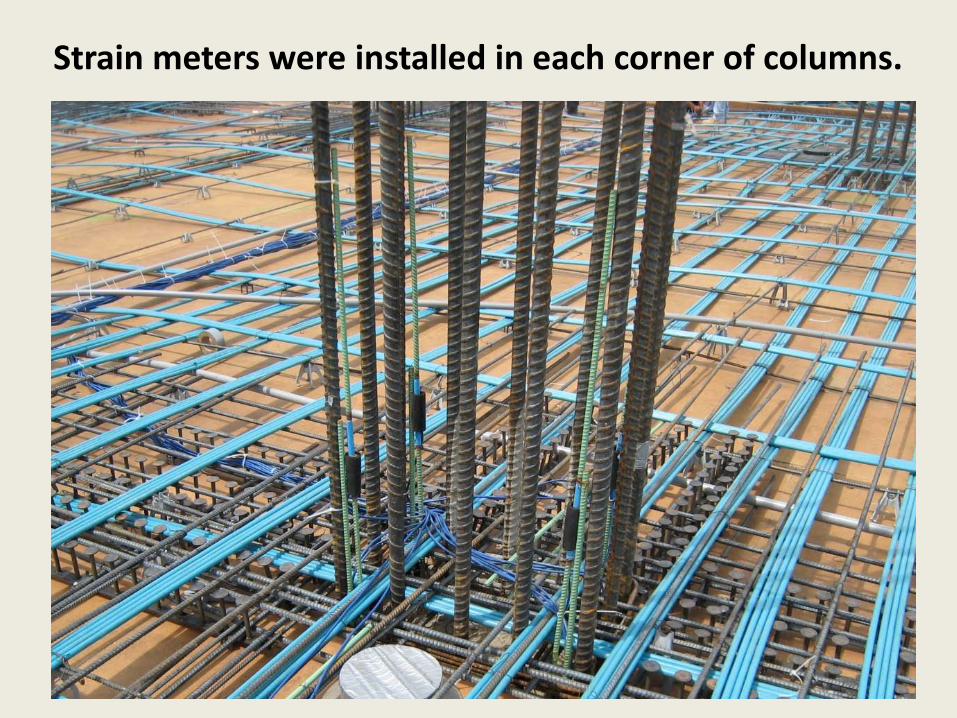
Strain meters were installed in each corner of columns.
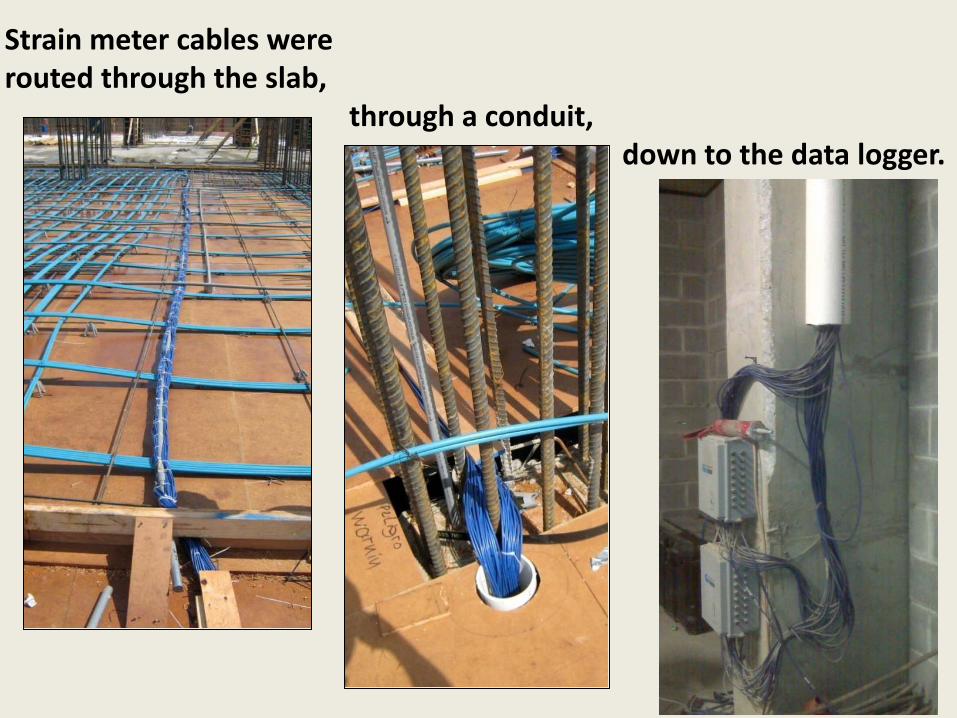
Strain meter cables were routed through the slab,
through a conduit, down to the data logger.
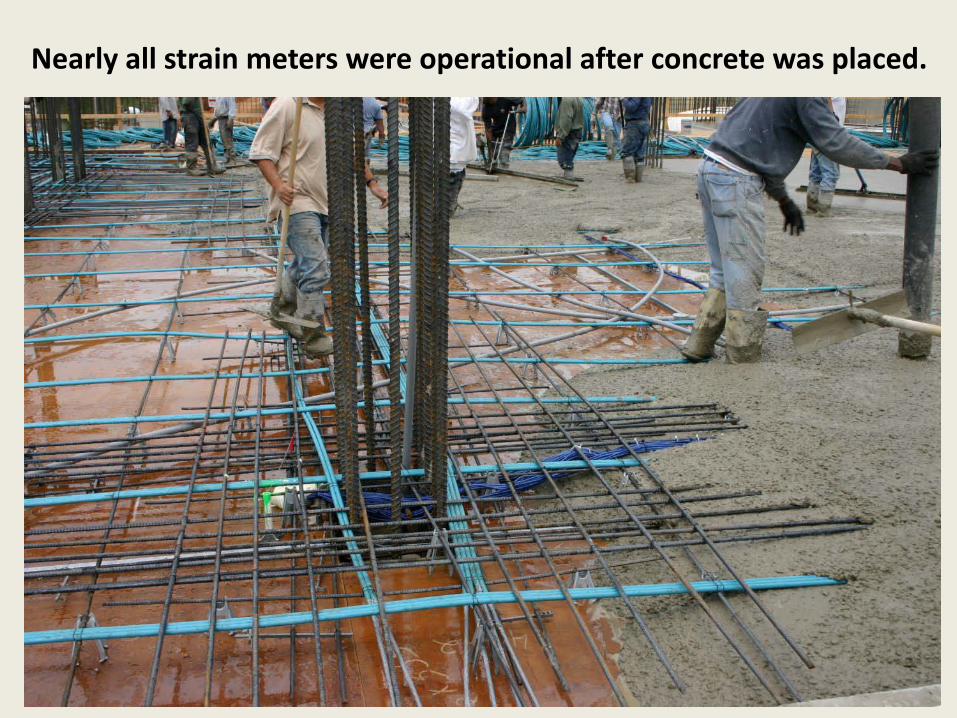
Nearly all strain meters were operational after concrete was placed.
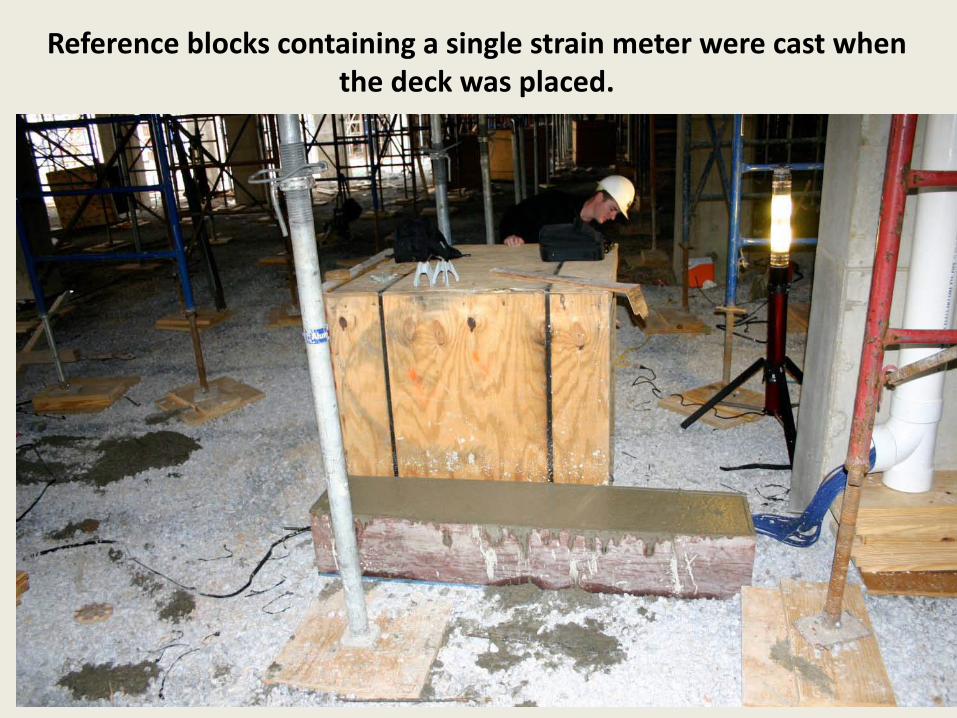
Reference blocks containing a single strain meter were cast when the deck was placed.
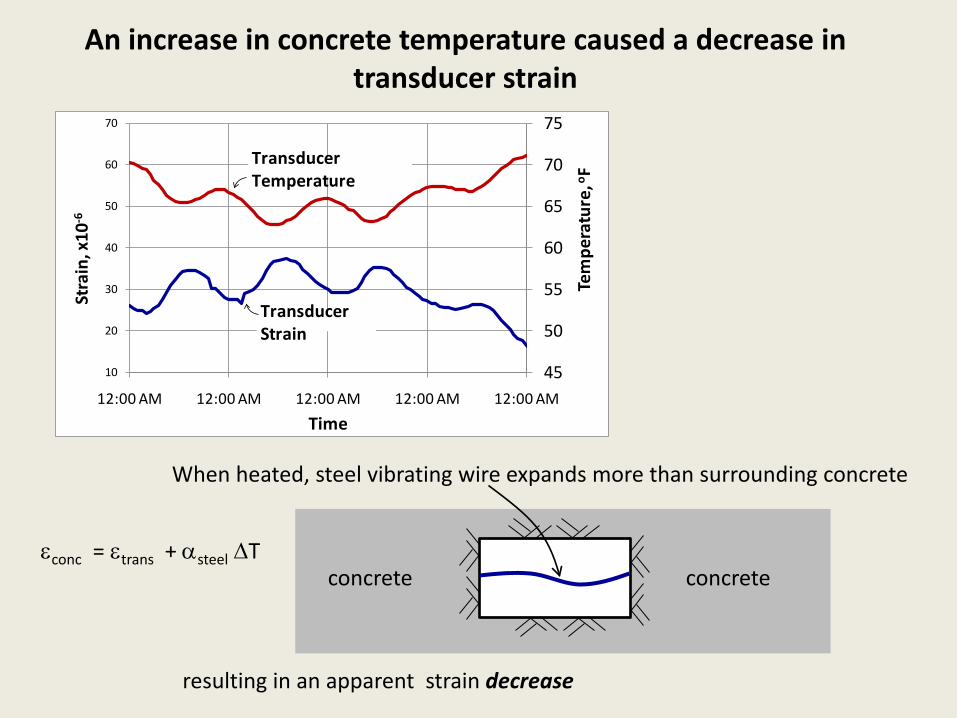
An increase in concrete temperature caused a decrease in transducer strain
concreteconcrete
When heated, steel vibrating wire expands more than surrounding concrete
resulting in an apparent strain decrease
45
50
55
60
65
70
75
10
20
30
40
50
60
70
12:00 AM 12:00 AM 12:00 AM 12:00 AM 12:00 AM
Tem
pera
ture
, o F
Stra
in, x
10-6
Time
TransducerTemperature
TransducerStrain
εconc = εtrans + αsteel ∆T
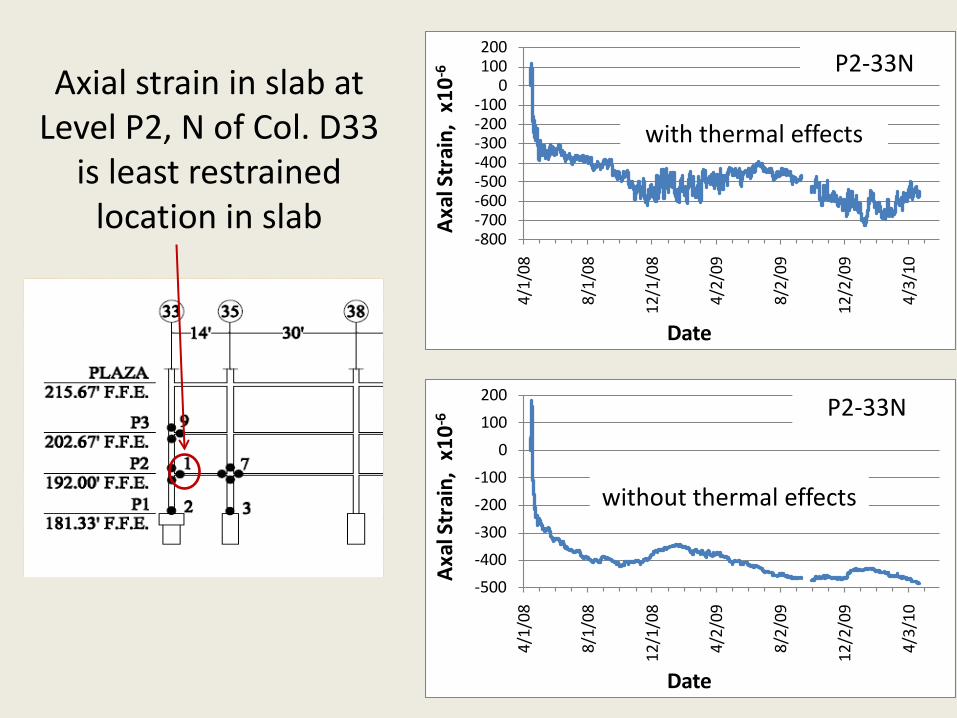
Axial strain in slab at Level P2, N of Col. D33
is least restrained location in slab
-800-700-600-500-400-300-200-100
0100200
4/1/
08
8/1/
08
12/1
/08
4/2/
09
8/2/
09
12/2
/09
4/3/
10
Axa
l Str
ain,
x10
-6
Date
-500
-400
-300
-200
-100
0
100
200
4/1/
08
8/1/
08
12/1
/08
4/2/
09
8/2/
09
12/2
/09
4/3/
10
Axa
l Str
ain,
x10
-6
Date
with thermal effects
without thermal effects
P2-33N
P2-33N
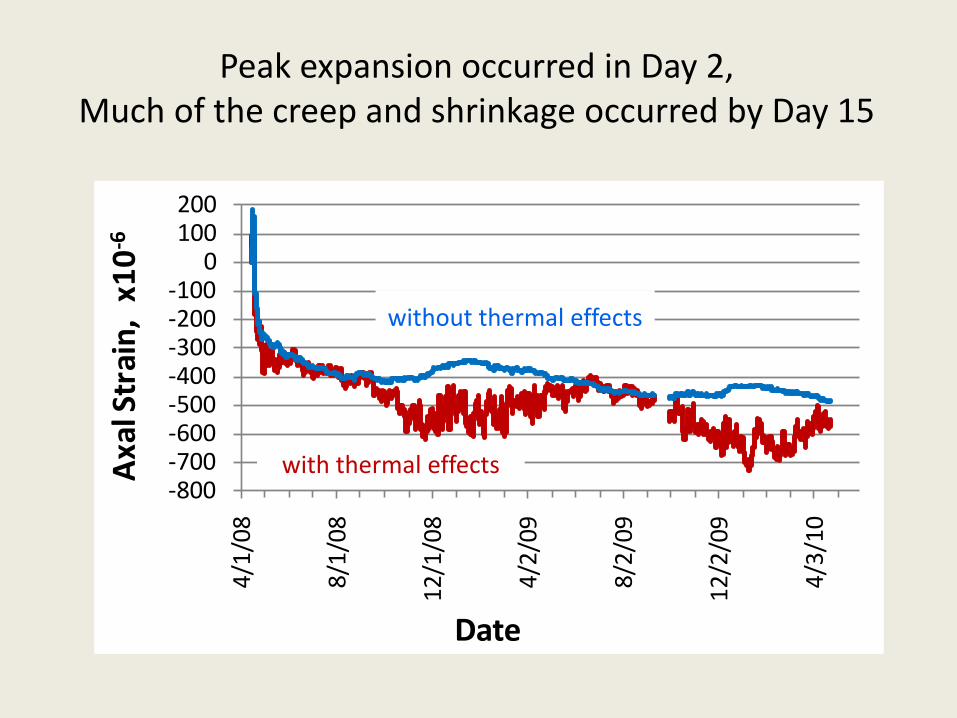
Peak expansion occurred in Day 2,Much of the creep and shrinkage occurred by Day 15
-800-700-600-500-400-300-200-100
0100200
4/1/
08
8/1/
08
12/1
/08
4/2/
09
8/2/
09
12/2
/09
4/3/
10
Axa
l Str
ain,
x10
-6
Date
with thermal effects
without thermal effects
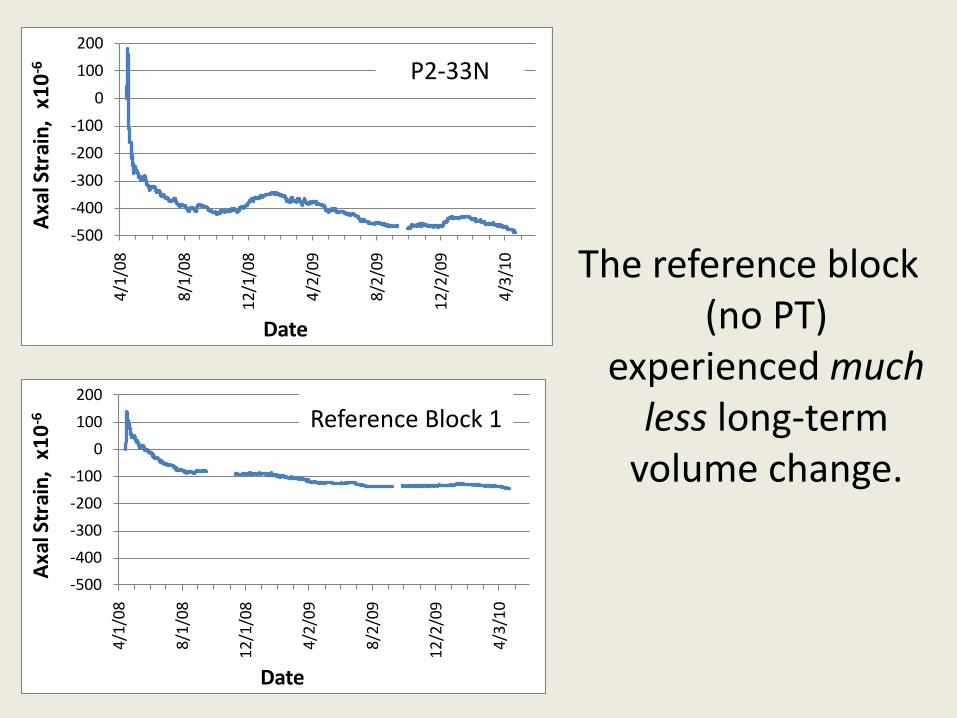
The reference block (no PT)
experienced muchless long-term
volume change.
-500
-400
-300
-200
-100
0
100
200
4/1/
08
8/1/
08
12/1
/08
4/2/
09
8/2/
09
12/2
/09
4/3/
10
Axa
l Str
ain,
x10
-6
Date
-500
-400
-300
-200
-100
0
100
200
4/1/
08
8/1/
08
12/1
/08
4/2/
09
8/2/
09
12/2
/09
4/3/
10
Axa
l Str
ain,
x10
-6
Date
P2-33N
Reference Block 1
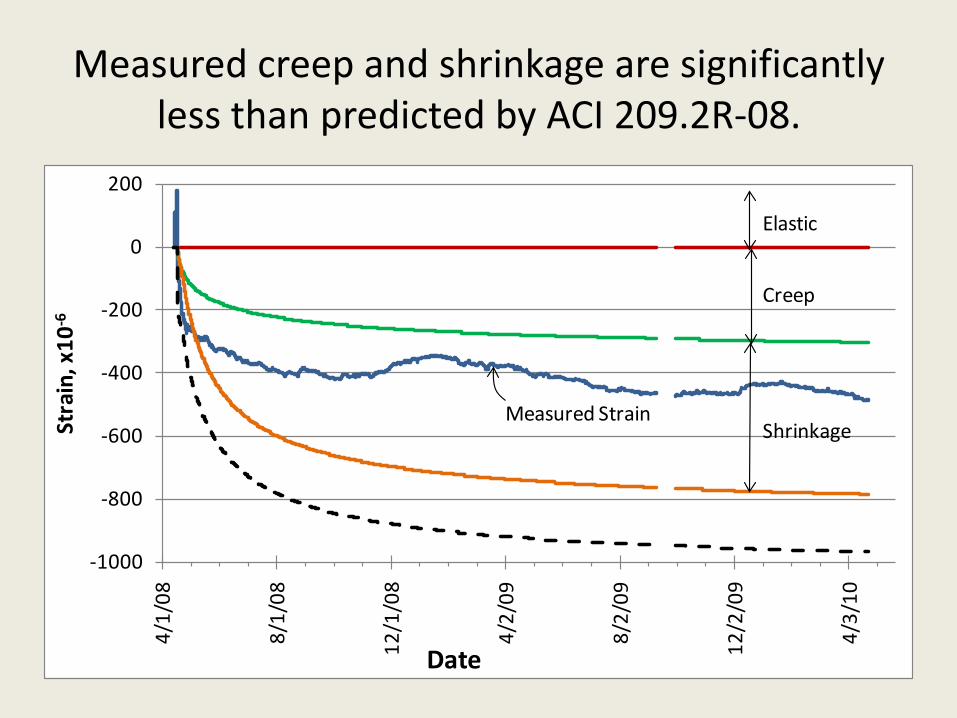
Measured creep and shrinkage are significantly less than predicted by ACI 209.2R-08.
-1000
-800
-600
-400
-200
0
2004/
1/08
8/1/
08
12/1
/08
4/2/
09
8/2/
09
12/2
/09
4/3/
10
Stra
in, x
10-6
Date
Elastic
Creep
ShrinkageMeasured Strain
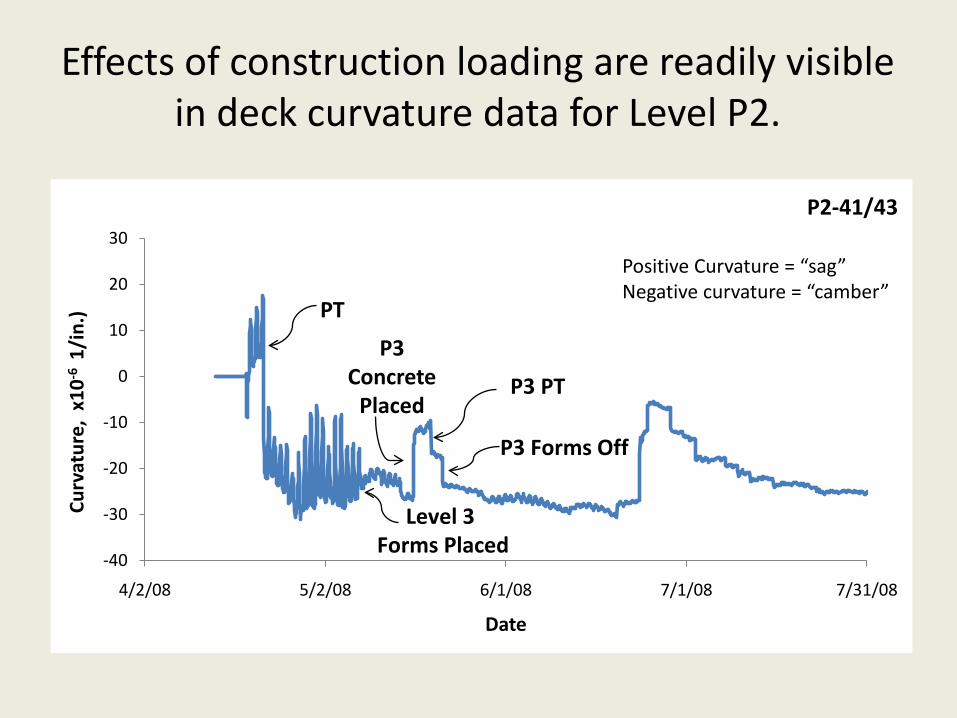
Effects of construction loading are readily visible in deck curvature data for Level P2.
-40
-30
-20
-10
0
10
20
30
4/2/08 5/2/08 6/1/08 7/1/08 7/31/08
Curv
atur
e, x
10-6
1/i
n.)
Date
P2-41/43
P3 PT
Level 3 Forms Placed
P3 Forms Off
PT
P3Concrete
Placed
Positive Curvature = “sag”Negative curvature = “camber”
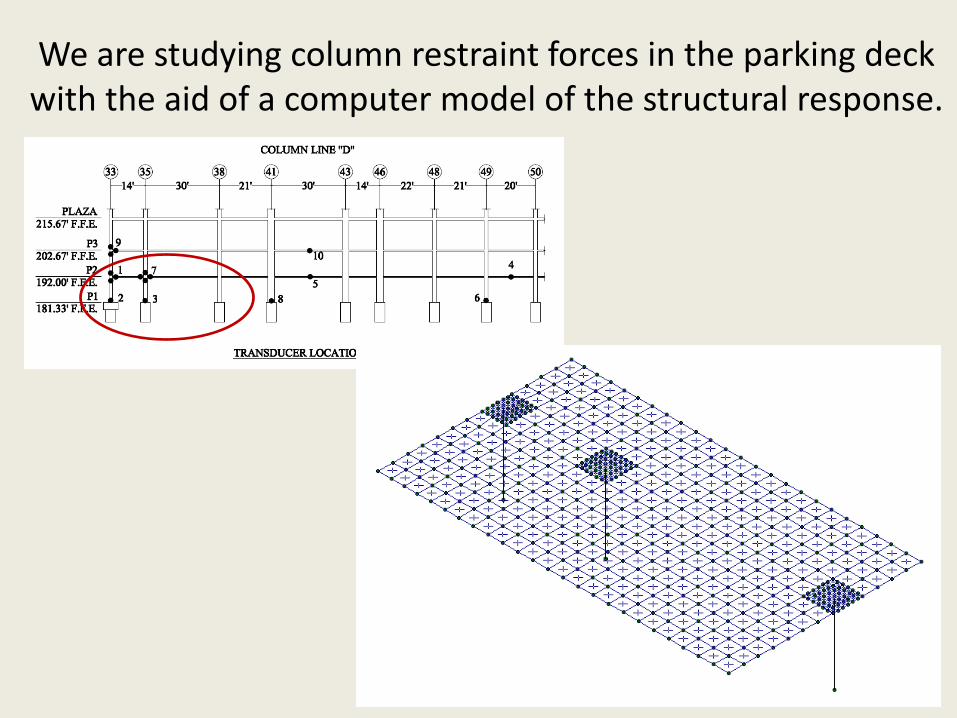
We are studying column restraint forces in the parking deck with the aid of a computer model of the structural response.
0.0
10.0
20.0
30.0
40.0
50.0
60.0
70.0
80.0
90.0
100.0
-250
-200
-150
-100
-50
0
50
100
150
4/13
/08
4/14
/08
4/15
/08
4/16
/08
4/17
/08
4/18
/08
4/19
/08
4/20
/08
4/21
/08
Tem
p(°F
)
Axi
al S
trai
n (με)
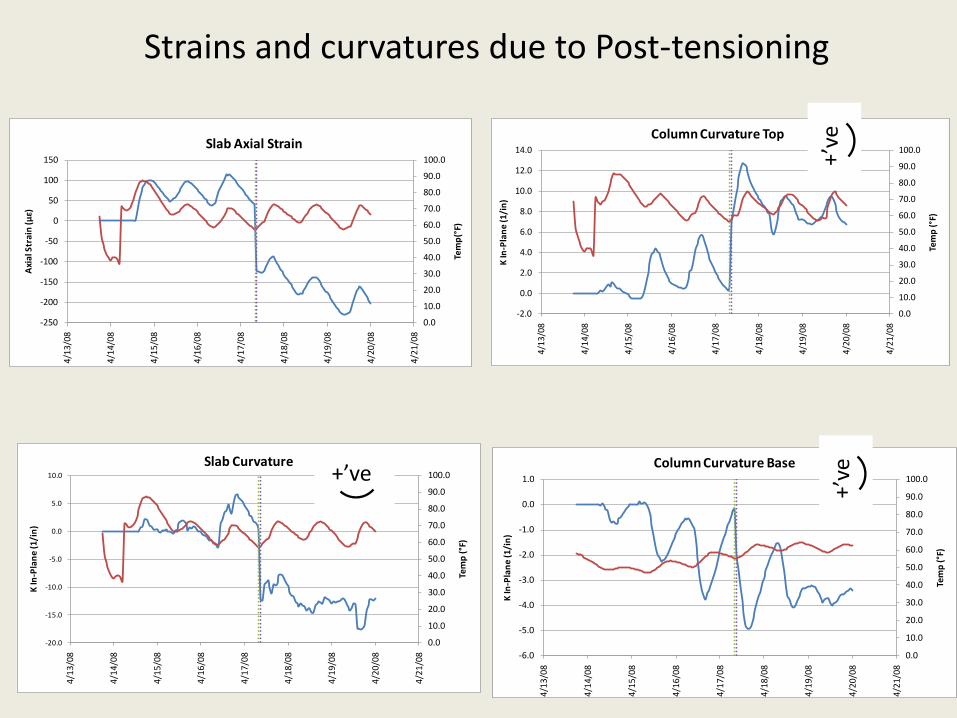
Slab Axial Strain
0.0
10.0
20.0
30.0
40.0
50.0
60.0
70.0
80.0
90.0
100.0
-6.0
-5.0
-4.0
-3.0
-2.0
-1.0
0.0
1.0
4/13
/08
4/14
/08
4/15
/08
4/16
/08
4/17
/08
4/18
/08
4/19
/08
4/20
/08
4/21
/08
Tem
p (°
F)
K In
-Pla
ne (1
/in)
Column Curvature Base
0.0
10.0
20.0
30.0
40.0
50.0
60.0
70.0
80.0
90.0
100.0
-20.0
-15.0
-10.0
-5.0
0.0
5.0
10.0
4/13
/08
4/14
/08
4/15
/08
4/16
/08
4/17
/08
4/18
/08
4/19
/08
4/20
/08
4/21
/08
Tem
p (°
F)
K In
-Pla
ne (1
/in)
Slab Curvature
0.0
10.0
20.0
30.0
40.0
50.0
60.0
70.0
80.0
90.0
100.0
-2.0
0.0
2.0
4.0
6.0
8.0
10.0
12.0
14.0
4/13
/08
4/14
/08
4/15
/08
4/16
/08
4/17
/08
4/18
/08
4/19
/08
4/20
/08
4/21
/08
Tem
p (°
F)
K In
-Pla
ne (1
/in)
Column Curvature Top
Strains and curvatures due to Post-tensioning
+’ve
+’ve
+’ve

We would like to thank the following people for their continued support of this project:
• Sam Eskildsen and Mike Jones
Structural Design Group, Birmingham, AL.
• Ed Rice and Ed Russell
CTS Cement
• Ken Bondy
Post-Tensioning Institute