Embed Size (px)
Citation preview
Monitoring(and(evaluating(progress(towards(universal(health(coverage(in(
Brazil!!
!!
Mauricio!L.!Barreto!1,!Davide!Rasella!1,!Daiane!Machado!1,!Rosana!Aquino!1,!Diana!Lima!1,!Leila!Garcia!2,!Alexandra!Crispim!2,!Jackson!Santos!1,!Juan!Escalante!3,!Estela!Aquino!1,!Claudia!Travassos!4!!
!!
1. Instituto de Saúde Coletiva, Federal University of Bahia, Salvador, Brazil 2. National Institute in Science, Technology and Innovation in Health (CITECS), Salvador,
Brazil 3. Instituto de Pesquisa Econômica Aplicada, Brasília, Brazil 4. Federal University of Santa Catarina, Floranopólis, Brazil 5. Secretaria de Vigilância a Saúde, Ministry of Health, Brasília, Brazil 6. Instituto de Comunicação e Informação Científica e Tecnológica em Saúde (ICICT) /
FIOCRUZ, Rio de Janeiro, Brazil
! 1


• Since! 1988,! Brazil! has! developed! a! dynamic,! complex! ! health!system!(the!Unified!Health!System;!SUS),!which!is!based!on!the!principles!of!health!as!a!ci*zen’s!right!and!the!state’s!duty.!!
• The!SUS!aims!to!provide!comprehensive,!universal,!preven*ve!and! cura*ve! care! through! decentralized! management! and!provision! of! health! services,! and! promotes! community!parUcipaUon!at!all!administraUve!levels.!!
• The!Brazilian!Health!Sector!Reform!occurred!at!the!same!*me!as! democra*za*on,! and! was! spearheaded! by! health!professionals! and! individuals! in! civil! society! movements! and!organisaUons.!!
Introduc*on!
4

Federal!Cons*tu*on,!art.!196!(1988)!
! “health( is( a( right(of( all( citizens( and(a(duty(of(the( state,( granted( by( social( and( economic(policies( aimed( to( reduce( the( risk( of( diseases(and( the( universal( and( equitable( access( to(actions( and( services( to( its( promotion,(protection(and(recovery”.(


GINI Index – Social Inequalities
The Gini index is a measure of statistical dispersion and is used as a measure of inequality of wealth (eg. income) distribution. It varies from 0 to 1, where a value of 0 corresponds to perfect equality and a value of 1 corresponds to perfect inequality

!!!!!!!!Recent!Trends!in!Gini!Index!in!Brazil ! !!!
0.538
0.544
0.551
0.558
0.565 0.568
0.580
0.586
0.592
0.591
0.597 0.599
0.599 0.597
0.52
0.54
0.56
0.58
0.60
1994 1998 2002 2006 2010
Coe
ficie
nte
de G
ini
Ano
0,7 %/year 30
34
38
42
46
50
1900 1920 1940 1960 1980
Coe
ficie
nte
de G
ini
Ano
0.2 ponto/ano 27 anos
0.5%/year
16 ys.
30
34
38
42
46
50
1900 1920 1940 1960 1980
Coe
ficie
nte
de G
ini
Ano
0.6 %/ year 15 ys
UK!
USA!
Brazil

How!long!will!take!to!reach!the!level!of!other!large!federa*ve!countries?!!
30
34
38
42
46
50
54
58
62
1976 1980 1984 1988 1992 1996 2000 2004 2008
Gin
i Coe
ficie
nt
Year
Brasil
Mexico
EUA
Canada
hiperinflação
0,7 pontos Gini/ ano
4 anos
22 anos
10 anos
USA
Canada
Brazil
Mexico

Infant!Mortality!Rates!
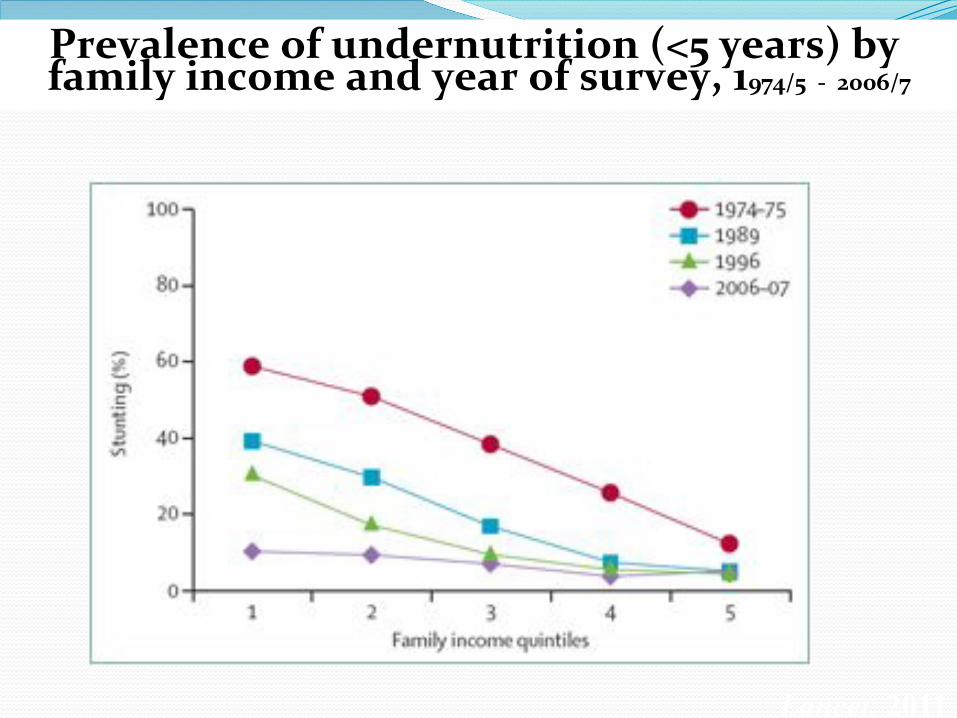
Prevalence(of(undernutrition((<5(years)(by(family(income(and(year(of(survey,(1974/5((J((2006/7(
Lancet, 2011

! To!explore!how!far!has!Brazil!advanced!in!terms!of!Universal!Health! Coverage! (UHC)! and! equity! regarding:! health!determinants,!primary,!secondary!and!terUary!care,!and!costs!for!individual!and!families.!
!!! To!contribute!to!the!defini*on!a!set!of!indicators!to!monitor!health!coverage!and!equity!at!an!internaUonal!level.!
Objec*ves!
12

13

(! Data!at!the!aggregate!level:!!
!!!!!!!!Health!StaUsUcs!made!available!by!the!Brazilian!Ministry!of!Health!(Datasus)!from!!!!!!!!!!!rouUnely!collected!data:!!!!!!!!!!!!W!Mortality!InformaUon!System!W!SIM!!!!!!!!!!!!W!InformaUon!System!on!Live!Births!W!SINASC!!!!!!!!!!!!W!NoUfiable!Diseases!InformaUon!System–!SINAN!!!!!!!!!!!!W!Primary!Care!InformaUon!System!W!SIAB!!!!!!!!!!!!W!OutpaUent!InformaUon!System!W!SIA!!!!!!!!!!!!W!Hospital!InformaUon!System!W!SIH!!!!!!!!!!!For!socioeconomic!and!demographic!variables!data!from!the!Brazilian!InsUtute!of!!
Geography!and!StaUsUcs!and!from!the!Human!Development!Atlas!of!the!UNDP.!
! Data!at!the!individual!level:!!
!!!!!!!W!Health!Supplement!of!NaUonal!Household!Sample!Surveys!(PNAD):!1998W2003W2008!!!!!!!!W!Family!Expenditure!Surveys!(POF):!1996W2003W2009!!!!!!!!W!Surveillance!System!of!Risk!and!ProtecUve!Factors!for!Chronic!NonWCommunicable!!!!!!!!!!!!!Diseases!!through!Telephone!Interviews!(VIGITEL)!(
Methods:!Data!Sources!
14

(((! Data! at! the! aggregate! level:! !MunicipaliUes! have! been! straUfied! according! to! quinUles! of! their!
Human!Development! Index! (HDI)! at! the!baseline! year!of! 2000.! Indicators!under! study!have!been!calculated! for! each! quinUle! as! the! raUo! between! the! sum! of! the! outcome! in! the! municipaliUes!divided!by!the!sum!of!the!populaUon.!For!each!indicator!quinUles!trends!!have!been!represented!in!graphs.!
! This!analysis!allow! to! show!not!only!how!the!average!poverty! level!of! the!municipality! can!affect!health! service! uUlizaUon! and! outcomes,! but! also! –! in! case! of! health! services! placed! only! in! rich!urban! municipaliUes! –! how! the! same! aspects! could! be! affected! by! other! barriers! of! access!(geografical,!cultural,!economical).!
! Data! at! the! individual! level:! ! For! each! survey! subjects! have! been! straUfied! in! quinUles! of! their!income!or!–!if!income!was!not!available!W!schooling!level.!For!each!indicator!trends!of!the!quinUles!have!been!represented!in!graphs.!
! This!analysis!allow!to!show!how!individual!income!or!schooling!level!could!affect!the!outcome!under!study,!indipendently!form!the!place!of!residence!of!the!subjects!(ex.!rural!or!urban).!!
Methods:!Analysis!
2000! 2010!1st$quin)le$ 15.1! 16.3!2nd$quin)le$ 18.9! 20.8!3rd$quin)le$ 19.5! 22.1!4th$quin)le$ 29.0! 33.2!5th$quin)le$ 86.9! 97.9!
Total!popula*on!!(millions)!of!each!!HDI!quin*le,!2000Z2010!
(
15

Health!Determinants!!and!Risk!Factors!
16

17

FIGURE!3:!Trends!in!percentage!of!housing!without!piped!water!according!to!quin*les!of!municipal!lDH.!
Data!Source:!IBGE!Note:!The!small!graph!refers!absolute!difference!and!rate!ra*o!between!the!richer!and!the!poorer!quin*les.!
0!
10!
20!
30!
40!
50!
60!
70!
80!
90!
100!
1991! 2000! 2010!
1st!quinUl!
2nd!quinUl!
3rd!quinUl!
4th!quinUl!
5th!quinUl!
Overall!
0!
10!
20!
0!
50!
100!
1991! 2000! 2010!
Ra*o
!
Diffe
rence!
diff! raUo!
18
Absence!of!Piped!Water!
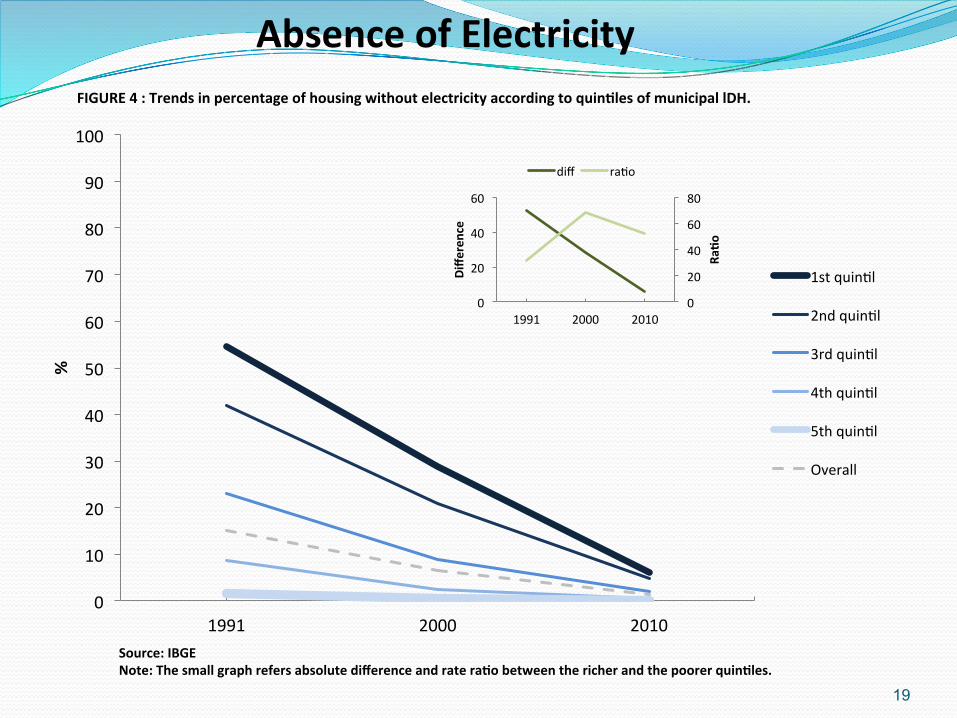
Absence!of!Electricity!FIGURE!4!:!Trends!in!percentage!of!housing!without!electricity!according!to!quin*les!of!municipal!lDH.!
Source:!IBGE!Note:!The!small!graph!refers!absolute!difference!and!rate!ra*o!between!the!richer!and!the!poorer!quin*les.!
0!
10!
20!
30!
40!
50!
60!
70!
80!
90!
100!
1991! 2000! 2010!
%!
1st!quinUl!
2nd!quinUl!
3rd!quinUl!
4th!quinUl!
5th!quinUl!
Overall!
0!
20!
40!
60!
80!
0!
20!
40!
60!
1991! 2000! 2010!
Ra*o
!
Diffe
rence!
diff! raUo!
19

20

Primary!Health!Care!
21

22

FIGURE!7:!!!Vaccina*on!coverage!according!to!quin*les!of!municipal!HDI.!!
Data!Source:!Na*onal!Immuniza*on!Program!(PNI)!!
0.0!10.0!20.0!30.0!40.0!50.0!60.0!70.0!80.0!90.0!100.0!
2003! 2004! 2005! 2006! 2007! 2008! 2009! 2010! 2011!
1st!quintil!
2nd!quintil!
3rd!quintil!
4th!quintil!
5th!quintil!
Series6!
0.0!
10.0!
20.0!
30.0!
40.0!
50.0!
60.0!
70.0!
80.0!
90.0!
100.0!
2003! 2004! 2005! 2006! 2007! 2008! 2009! 2010! 2011!
1st!quintil!
2nd!quintil!
3rd!quintil!
4th!quintil!
5th!quintil!
Total!
DPT!(Tetravalent)!!
Measles!(SRC)!!
23
Vaccina*on!Coverage!

FIGURE!8:!Trends!in!percentage!of!pregnant!women!without!any!prenatal!visit!at!the!moment!of!delivery!according!to!quin*les!of!municipal!HDI.!
Data!Source:!MS/SVS/DASIS!Z!Sistema!de!Informações!sobre!Nascidos!Vivos!Z!SINASC!Note:!The!small!graph!refers!absolute!difference!and!rate!ra*o!between!the!PNV!of!the!richer!and!the!poorer!quin*les.!
0!
5!
10!
15!
20!
25!
30!
2000! 2001! 2002! 2003! 2004! 2005! 2006! 2007! 2008! 2009! 2010!
%!
1st!quinUl!
2nd!quinUl!
3rd!quinUl!
4th!quinUl!
5th!quinUl!
Overall!
0!1!2!3!4!5!6!
0!2!4!6!8!
10!12!
2000! 2005! 2010!
Ra*o
!
Diffe
rence!
diff! raUon!
24
Prenatal!visits!

25
Secondary!Health!Care!

26

!FIGURE!14:!Trends!in!percentage!of!delivery!at!the!hospital!according!to!quin*les!of!municipal!HDI.!!
Data!Source:!Sistema!de!Informações!sobre!Nascidos!Vivos!Z!SINASC!Note:!The!small!graph!refers!absolute!difference!and!rate!ra*o!between!the!!the!richer!and!the!poorer!quin*les.!
0!
10!
20!
30!
40!
50!
60!
70!
80!
90!
100!
2000! 2001! 2002! 2003! 2004! 2005! 2006! 2007! 2008! 2009! 2010! 2011!
%!
1st!quinUl!
2nd!quinUl!
3rd!quinUl!
4th!quinUl!
5th!quinUl!
Overall!
0.0!
0.2!
0.4!
0.6!
0.8!
1.0!
1.2!
0!
2!
4!
6!
8!
10!
2000! 2005! 2010!
Ra*o
!
Diffe
rence!
diff! raUo!
27
Delivery!at!the!Hospital!

Data!Source:!Sistema!de!Informações!sobre!Nascidos!Vivos!Z!SINASC!Note:!The!small!graph!refers!absolute!difference!and!rate!ra*o!between!!the!richer!and!the!poorer!quin*les.!
!FIGURE!15:!Trends!in!percentage!of!cesarean!delivery!according!to!IDH!quin*les!of!municipali*es!.!
0!
10!
20!
30!
40!
50!
60!
70!
80!
2000! 2001! 2002! 2003! 2004! 2005! 2006! 2007! 2008! 2009! 2010! 2011!
%!
1st!quinUl!
2nd!quinUl!
3rd!quinUl!
4th!quinUl!
5th!quinUl!
Overall!
0.0!
0.2!
0.4!
0.6!
0.8!
0!
10!
20!
30!
40!
2000! 2005! 2010!
Ra*o
!
Diffe
rence!
diff!! raUo!
28
Cesarean!Delivery!

Ter*ary!Health!Care!
29

30
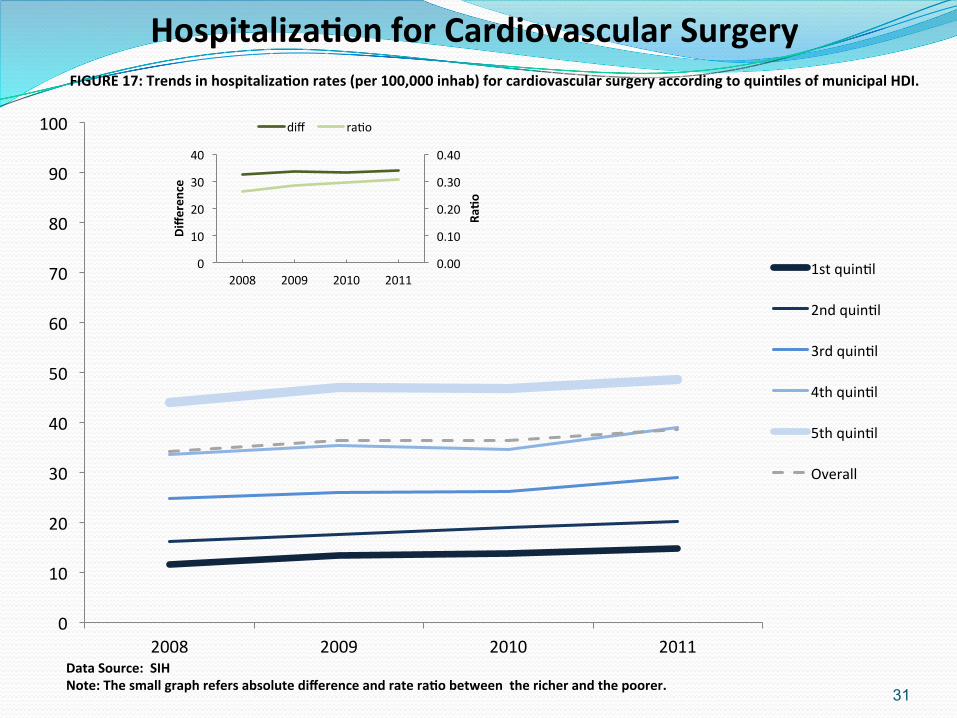
Hospitaliza*on!for!Cardiovascular!Surgery!!FIGURE!17:!Trends!in!hospitaliza*on!rates!(per!100,000!inhab)!for!cardiovascular!surgery!according!to!quin*les!of!municipal!HDI.!
Data!Source:!!SIH!Note:!The!small!graph!refers!absolute!difference!and!rate!ra*o!between!!the!richer!and!the!poorer.!
0!
10!
20!
30!
40!
50!
60!
70!
80!
90!
100!
2008! 2009! 2010! 2011!
1st!quinUl!
2nd!quinUl!
3rd!quinUl!
4th!quinUl!
5th!quinUl!
Overall!
0.00!
0.10!
0.20!
0.30!
0.40!
0!
10!
20!
30!
40!
2008! 2009! 2010! 2011!
Ra*o
!
Diffe
rence!
diff! raUo!
31

0!
10!
20!
30!
40!
50!
60!
70!
80!
90!
100!
2008! 2009! 2010! 2011!
1st!quinUl!
2nd!quinUl!
3rd!quinUl!
4th!quinUl!
5th!quinUl!
Overall!
!FIGURE!29:!Trends!in!number!of!hemodialysis!!per!1,000!inhabitants!per!year!according!!to!quin*les!of!municipal!HDI.!
Data!Source:!SIA!Note:!The!small!graph!refers!absolute!difference!and!rate!ra*o!between!!the!richer!and!the!poorer!quin*les.!
0.00!0.10!0.20!0.30!0.40!0.50!
0!10!20!30!40!50!
2008! 2009! 2010! 2011!
Ra*o
!
Diffe
rence!
diff! raUo!
32
Hemodialysis!

!FIGURE!30:!Trends!in!number!of!kidney!transplanta*ons!per!100,000!inhabitants!per!year!according!to!quin*les!of!municipal!HDI.!
Data!Source:!!SIH!Note:!The!small!graph!refers!absolute!difference!and!rate!ra*o!between!!the!richer!and!the!poorer.!
Kidney!Transplanta*on!
0!
1!
2!
3!
4!
5!
6!
7!
8!
9!
10!
2000! 2001! 2002! 2003! 2004! 2005! 2006! 2007! 2008! 2009! 2010! 2011!
1st!quinUl!
2nd!quinUl!
3rd!quinUl!
4th!quinUl!
5th!quinUl!
Overall!
0.00!
0.04!
0.08!
0.12!
0.16!
0.20!
0.0!
0.5!
1.0!
1.5!
2.0!
2.5!
3.0!
2000! 2005! 2010!
Ra*o
!
Diffe
rence!
diff! raUo!
33

34

!FIGURE!16:!Trends!in!rate!of!admissions!to!hospital!!(per!100!inhabitants)!in!individuals!30Z59!years!old!in!the!past!12!months!according!to!income!classes!in!minimum!wages.!!
0.0!
0.2!
0.4!
0.6!
0.8!
1.0!
0.0!
0.5!
1.0!
1.5!
2.0!
2.5!
3.0!
3.5!
1998! 2003! 2008!
Ra*o
!
ifferen
ce!
diff! raUo!
0!
2!
4!
6!
8!
10!
12!
14!
16!
18!
20!
1998! 2003! 2008!
<!1!Minimum!wage!
!1!W!2!Minimum!wages!
!2!W!3!Minimum!wages!
3!W!5!Minimum!wages!
>!!5!!Minimum!wages!
Overall!
Data!Source:!PNAD!Note:!The!small!graph!refers!absolute!difference!and!rate!ra*o!!between!!the!richer!and!the!poorer.!
35
Reported!Hospitaliza*on!

Health!Outcomes!
36

!FIGURE!31:!!Trends!in!underZfive!mortality!rates!according!to!HDI!quin*les!of!municipali*es!selected!for!the!quality!of!vital!informa*on.!
Data!Source:!SIM!Note:!The!small!graph!refers!absolute!difference!and!rate!ra*o!between!!the!U5MR!of!the!richer!and!the!poorer!quin*les.!
0!
10!
20!
30!
40!
50!
60!
70!
80!
2000! 2001! 2002! 2003! 2004! 2005! 2006! 2007! 2008! 2009! 2010! 2011!
Mortality!rate!(x10
3 )!!
1st!quinUl!
2nd!quinUl!
3rd!quinUl!
4th!quinUl!
5th!quinUl!
Overall!
0.0!
0.5!
1.0!
1.5!
2.0!
2.5!
0!
5!
10!
15!
20!
25!
2000! 2005! 2010!
Ra*o
!
Diffe
rence!
diff! raUo!
37
UnderZfive!Mortality!

FIGURE!32:!Trends!in!underZfive!mortality!rates!from!diarrhoea!according!to!IDH!quin*les!of!municipali*es!selected!for!the!quality!of!vital!informa*on.!
0!
1!
2!
3!
4!
5!
6!
7!
8!
9!
10!
2000! 2001! 2002! 2003! 2004! 2005! 2006! 2007! 2008! 2009! 2010! 2011!
Mortality!rate!(!x103)!!
1st!quinUl!
2nd!quinUl!
3rd!quinUl!
4th!quinUl!
5th!quinUl!
Overall!
0!
1!
2!
3!
4!
5!
6!
0!2!4!6!8!
10!12!14!16!
2000! 2005! 2010!
Ra*o
!
Diffe
rence!
raUo! diff!
UnderZfive!Mortality!From!Diarrhoea!
Data!Source:!SIM!Note:!The!small!graph!refers!absolute!difference!and!rate!ra*o!between!!the!U5MR!of!the!richer!and!the!poorer!quin*les.! 38

39
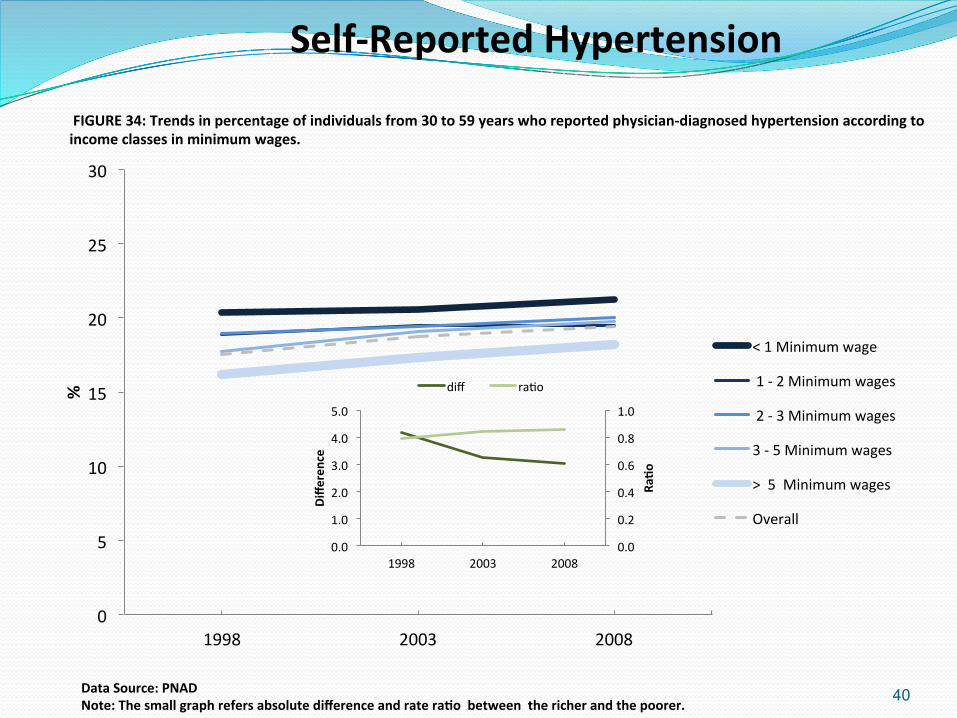
Data!Source:!PNAD!Note:!The!small!graph!refers!absolute!difference!and!rate!ra*o!!between!!the!richer!and!the!poorer.!
0.0!
0.2!
0.4!
0.6!
0.8!
1.0!
0.0!
1.0!
2.0!
3.0!
4.0!
5.0!
1998! 2003! 2008!
Ra*o
!
Diffe
rence!
diff! raUo!
!FIGURE!34:!Trends!in!percentage!of!individuals!from!30!to!59!years!who!reported!physicianZdiagnosed!hypertension!according!to!income!classes!in!minimum!wages.!
0!
5!
10!
15!
20!
25!
30!
1998! 2003! 2008!
%!
<!1!Minimum!wage!
!1!W!2!Minimum!wages!
!2!W!3!Minimum!wages!
3!W!5!Minimum!wages!
>!!5!!Minimum!wages!
Overall!
40
SelfZReported!Hypertension!
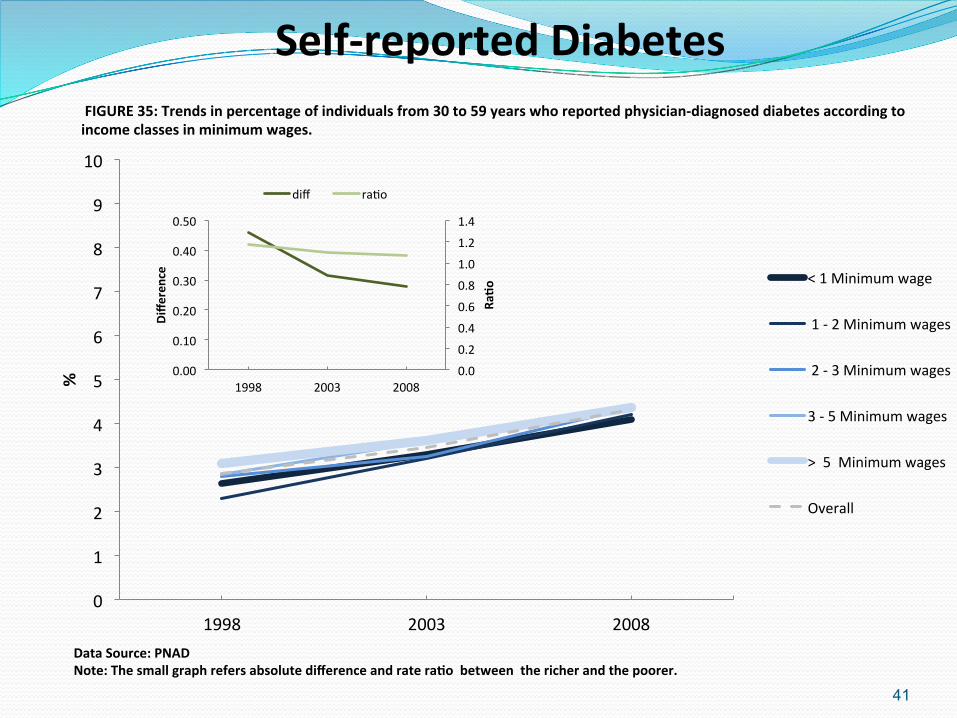
SelfZreported!Diabetes!
Data!Source:!PNAD!Note:!The!small!graph!refers!absolute!difference!and!rate!ra*o!!between!!the!richer!and!the!poorer.!!
!FIGURE!35:!Trends!in!percentage!of!individuals!from!30!to!59!years!who!reported!physicianZdiagnosed!diabetes!according!to!income!classes!in!minimum!wages.!
0.0!
0.2!
0.4!
0.6!
0.8!
1.0!
1.2!
1.4!
0.00!
0.10!
0.20!
0.30!
0.40!
0.50!
1998! 2003! 2008!
Ra*o
!
Diffe
rence!
diff! raUo!
0!
1!
2!
3!
4!
5!
6!
7!
8!
9!
10!
1998! 2003! 2008!
%!
<!1!Minimum!wage!
!1!W!2!Minimum!wages!
!2!W!3!Minimum!wages!
3!W!5!Minimum!wages!
>!!5!!Minimum!wages!
Overall!
41

Health!Expenditure!
42
43

Discussion!
44

Summary!Points!!! <!The!Brazilian!National!Health!System!(SUS)!has!guaranteed!
access!to!free!health!care!for!the!population!over!the!last!25!years,!but!one<quarter!of!Brazilians!(among!the!richest)!are!covered!by!private!health!plans.!!
! <!The!relative!abundance!of!administrative!and!survey!data,!at!the!aggregate!and!individual!levels,!has!allowed!for!the!analysis!of!the!evolution!of!a!wide!range!of!health!determinants,!health!outcomes,!and!health!coverage!indicators!during!recent!years.!Using!an!integrated!approach!and!following!a!theoretical!framework,!recent!trends!in!several!health!outcomes!and!health!coverage!indicators!using!concentration!indices,!differences,!and!relative!inequality!measures!were!analyzed.!
! <!Primary!health!care,!in!particular!through!the!expansion!of!the!Family!Health!Program,!succeeded!in!guaranteeing!near!universal!coverage,!in!particular!in!immunizations!and!antenatal!care.!!Secondary!and!tertiary!care!coverage!is!expanding!however,!while!large!social!and!geographical!!inequalities!still!persist.!!
45

Summary!Points!!
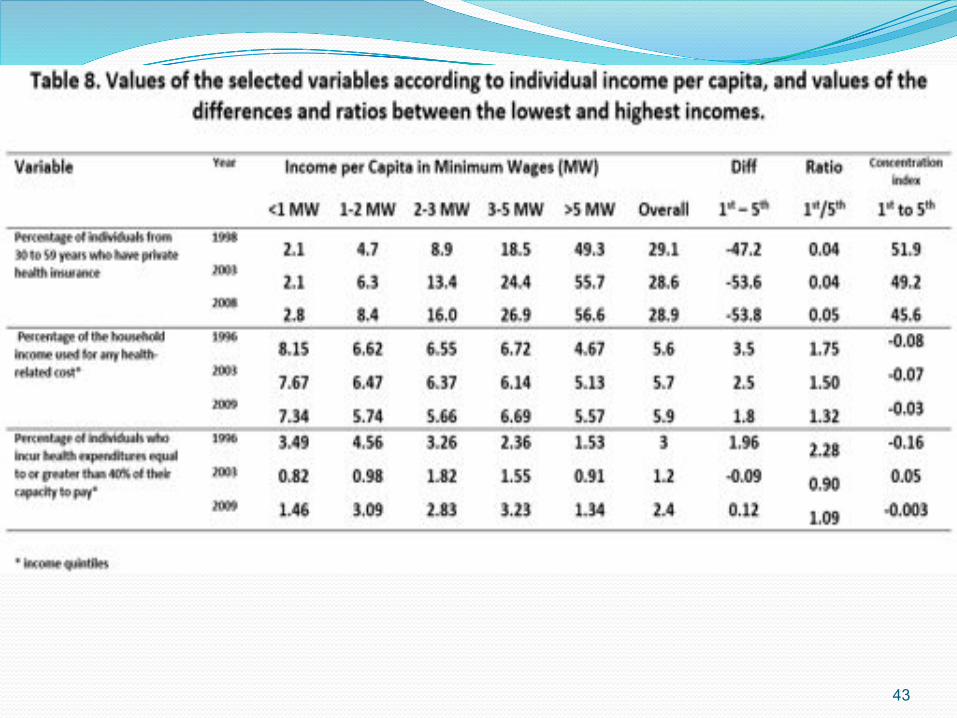
! <!Health!expenditures!are!higher!but!decreasing!in!the!poorest!quintiles!of!the!population,!and!catastrophic!health!expenditures!are!minimal!but!still!present,!particularly!in!middle<income!households.!
! <!The!overall!effect!of!the!SUS!on!the!health!outcomes!investigated!is!positive,!and!remarkable!decreases!have!been!registered!in!childhood!mortality,!particularly!that!associated!with!poverty<related!diseases.!
! <!The!SUS!is!expanding!coverage!overall,!increasing!access!to!all!levels!of!care,!with!some!important!positive!trends!toward!equity;!however,!under<financing!and!inequalities,!in!particular!!in!secondary!and!tertiary!health!care!still!persist.!
46

Recommenda*ons!!! To!strengthen!!monitoring!and!evaluation!Unified!Health!System!(SUS),!
defining!a!set!of!indicators!interconnected!by!a!consolidated!framework!that!must!reflect!the!several!levels,!components!and!effects!of!the!unified!heath!system,!relevant!health!determinants!and!health!outcomes,!with!greater!focus!on!equity;!!
! Make!of!the!efforts!to!the!new!generation!of!health!information!systems!in!development,!including!the!individual!SUS!card,!to!be!integrated!in!the!monitoring!and!evaluation!efforts;!!
! Integrate!to!SUS!health!information!systems!relevant!data!on!health!care!generated!by!private!health!plans;!
! To!strengthen!initiatives!directed!to!expand!and!integrate!primary!health!care!(PSF)!!with!secondary!and!tertiary!care!!through!the!establishment!of!healthcare!regions,!underpinning!the!organisation!of!healthcare!networks!(hierarchy,!territorialisation!and!coordination),!making!all!the!efforts!to!decrease!social!and!geographical!inequities;!
! Increase!funding!–!guarantee!through!law!enforcement,!cut!of!public!subsidies!and!investments!in!the!private!health!sector.!
47