Embed Size (px)
Citation preview
All 100989644iSe «1M^1S74 C 1 NeS-PUB-C I!
A
NBS MONOGRAPH 138
MeV Total Neutron Cross Sections

NATIONAL BUREAU OF STANDARDS
Tlie Nflfionsl Bua-au of Slandards ' was eslahlished by an acl of Coagtess March 3, 1901.The RurcJii^ overall goar is (o strcnglticn and advance Ihc Nation's science and lechnoloEyunJ laiililJii' ihL-(f clTi-i:livc applicjtrion for public bcncfil. To this end, (he Bureau conductsfCM.Mrch :iiiJ proudcs Ilia basis tor ihe Nniion's physical measurenienl system. (2) scicnUfic.ii.ll icL-linolotfk.il ^^^^Kts for industry and (overnnienL. t3 I a leclmical basis for equity in trade,jnil UP k,.hniL.,l ,^v^LL^ lo p.omole public safely. The Bureau consists of the Instilute for
for Malerials Research. Ihe Institute for Applied Technoloey.iences and Technology, and the Office for InformaUon Programs'.
THE INSHTUTE FOR BASIC STANDARDS provides the central basis within the Unitedoiint.> •.: .i i^:mp„.-.t jnd LOOMStcm lyMem of physical mcasurcmeni; coordinates that systemiMNF nii.iiTiii..MLiu .^Ml:m^ of Oihcr naiions and furnishes essential services leading lo accurate
• " phiMi^-i me.^^u.cmEnts ihroughoui Ihe Nation's scientific community, industry'.•'^ "^"-^ riiL iMMiiuie consiiii of a Cvnier for Radiation Research, an Office of Meas-
iiremeni >en'icci anu the followinE divisions:
Applied Malhemalics — Electricity — Mechanics — Heat — Optical Physics NuclearScicflcei' — Applied Radiation ' — Quantum Electronics ' — Electromagnetics' Timeand Ficquengy^ - Laboratory Astrophysics' — Cryogenics'.
THE INSTITUTE FOR MATERIALS RESEARCH conducts materiah research leading loimprov(d mclhod^ of mea.,urcm(nl. standards, and data on the properties of well-chataelerizedmaicnaK needed by indusliy, commerce, educational institutions, and Government; providesiidvi.prv dnd fc-L-art-h scrvji-^-s lo other Government agencies; and develops, produces, anddnlril.iji.-i standard reference malerials. TTie In.iMule consists of the Office of StandardReference Materials and ihe following divisions:
Analyiical Chemistry — Polymeis — Metallurgy — Inorganic Malerials — ReactorRadiation — Physical Chemistry.
THE INSTTFUTE FOR APPLIED TECHNOLOGY provides technical services to promotethe u« of available (echnojogy and to faeilitalc technological innovation in industry andGomnmcnl; cooptfriiics niih public and private organizations leading to the development oftechnological siandaiLk uncluding mandatory safety standards), codes and methods of test;
cchnica] advice and services to Gov. agencies upon requesL The Instituter for Building Technology and Ihe following divisions and office
Engineering and Produci Slandards — Weights and Measures — Invenuon and Innova-tion - Product Evaluation Technology ~ Electronic Technology _ Technical Analysis" ""suremeni Engineering ~ Structures, Materials and Life Safety' — Building
Environment'— Technical Evaluation and Application ' — Fire Technology,
THE msrrrU-re for COMPLrreR sciences and technology conducts researchand provides technical «rviccs designed to aid Government agencies in improving cost elTec-iivencss >n the conduct of their programs through the selection, acquisition, and effectiveui.lizatmn of automatic data processing equipment; and sen-es as the principal focus withinne cKcutive branch for Ihe development of Federal standards for automatic data processingequipment, techniques, and computer languages. The Institute consists of Ihe followinRdivisions:
"
Compule, Ser^^ices - Systems and Software - Computer Systems Engineering - informa-tion Technology.
Ic^^iM"*^^ ^^'^ 'NrORMAT70N PROGRAMS promotes opiir.
CoverPtneraied within NBS and other agencies of Ihc Federal
u sv^t r f'
-''7'"''"''' '
'''"^l^f""'^"' '--^ National Sumdard Reference Data System and
Mr-,./"" 'I'l^lVMi tcnicrs dealing with the broader aspects of the National
acccs ,"
I "'"I"PP'OP""'* to ensure that the NBS slaff has optimum
ofganiz^ihonal unilv
"iformalion of ihc world. The Office consists of the following
plUr f - 'nformalion Activities - Office of TechnicalPublications - Library - Office of Iniemational Relations.
wLttroc, ^^i,^^""""" " Gullhenbu,,, M.rytiuiJ. unlm oihe,wi« noted; m=i1tns addrewPan Ccnler Im Radljllon Roeuch,Lwjitd ai Bouldtr, Cf.|or,do Som.Fin ..f Tdt CerlCf (or BuUdin

JUL 1 6 1974
u 55fc
1-10
0.2
MeV Total Neutron Cross Sections
Robert B. Schwartz, Roald A. Sohrack. and H. Thompson Heaton, H
Nuclear Sciences DhisionInstitute for Basic Standards
1/ . S .National Bureau of StandardsWashinglon, D.C. 20234
U.S. DEPARTMENT OF COMMERCE, Frederick B. Denf, Secre/(
NATIONAL BUREAU OF STANDARDS. Richard W. Roberls, D/recfor
Issued January 1974
Library of Congress Catalog Numben 73-600276
National Bureau of Standards Monograph 138
Not- Bur, Siflod. (U^.), MonofT. 138, 160 pages (Jan. 1974)
CODEN: NBSMA6
UJ. GOVERNMENT PRINTING OFFICEWASHINGTON: 1971
For sale by the SupcrinLcndenI cf Documeni,, U.S. Govemmenl Printine Offic*. Wttahin(n<.n. D.C. 20102(Order by SD Caialog No. 013,44:136). Price 13.60
Slocl: Number 0303-01 189

Contents
CROSS SECTION CURVES
1. Introduction..
Curves
APPENDIX-EXPERIMENTAL TECHNIQUESAl. Experimental Arrangement
A2. Electron Linear Accelerator ^ ^A3. Neutron Producing Target
A4. Instrumentation ^ ^A5. Monitoring ^ ^A6. Sample Thickness Considerations
A7. Corrections to the Data. . „A-6A8. Summary
- A-7A9. References
A-7
iii

I

MeV Total Neutron Cross Sections*
Robert B. Schwartz, Roald A. Schrack, and H. Thompson Heaton. II
Thia report ia a compilation of the MeV neutron total cross section data measured at the NationalBureau of Standard, over the past several years. The measurements eenerally span the enersy in-terval from 0.5 to 15 or 20 MeV; data are presented in graphical form for twelve normally occurringelements, plus the separated isotopes ="U. ="U, and ""Pu. An appendix is included which gives com-plete details of the experimental technique.
Key words; MeV neutrons; neutron time-of-flight; neutron total cross sections
1. Introduction
This report is a compilation of the MeV Total Neutron Cross Section data measured
fLTf fv.
B^eau ot Standards. The neutron tirae-of-fiight method wasused for the measurements, tvith the NBS electron linear accelerator as the pulsedneutron source. The measurements were made over the energy range 0.5 to 20 MeV(in some cases, only to 15 MeV). Except for the uranium and plutonium isotopes, themeasurements were made on the naturally occurring isotopic mixtures of the elementsin question In each case, the data are presented in the form of graphs, both linearand logarithmic. Descriptive notes are also included for each element, giving detailsconcerning the samples.
Most of these data have not as yet been formally published. In most cases how-ever the data have been presented orally at various meetings of the American Phys-
tatksLiterature Reference" is given which refers to the abstracts for these
Details of the experimental technique are given in the appendix.
I.l. Quality of Data
A. Energy Resolution
At low energies the resolution is largely determined by the neutron detectorthickness (12.7 cm); at high energies the electronic response function plays the dom-inant role. For our 40 m (light path, the resolution varies from 0.2 ns/m at 500 keVto 0.08 ns/m at 15 MeV. The resolution as a function of ein the appendix.
nergy is shown in figure 5
B. Energy Scale Uncertainty
The energy scale uncertainty is 0.04 ns/m. There is excellent agreement betweenour energy assignments and, for example, the precision neutron energy determina-tions of Davis and Noda (NucL Phys. AI34, 361 (1969)).
C. .Absolute .Accuracy
The absolute accuracy of the data is estimated to be within ±1 percent Thisestimate is based largely on the excellent « 1%) internal consistency of data takenmth ditferent sample thicknesses, and under different experimental conditions, aswell as the excellent l< 1%) agreement between our hydrogen data (Schwartz et alPhys. Letters SOB, 36 (19691) and previously measured values, as represented by theshape-independent effective range theory. Detailed comparisons between our dataand those from other laboratories will be given in later publications; we simply statehere that such comparisons have generally shoivn good agreement consistent withour estimated 1 percent accuracy.
D. Statistical Precision
The statistical errors are generally 1 percent to 2 percent per point, but somewhatpoorer at the extreme high and low energy regions of our data. In any case, the sta-tistical errors are indicated by the usual vertical hnes at every tenth point on ourcurves, except in cases where the error bars are smaller than the points.
1.2. Experimental Technique
A brief account of our experimental setup has been given previously (R. B.Schwartz, H. T. Heaton II, and R. A. Schrack, Proc. Symposium Neutron Standardsand Flux Normalization, AEC Conf-701002, Argonne, Illinois, p. 377 (October 21,1970)). This description is brought up to date, and further details given, in theappendix.
lupported in part by the U.S. Defense Nucl r Agency. Washington, D.C. i
1


HYDROGEN
Sample materia!: polyethylene (CHOx
open: high-purity carbon
Sample diameter: 12.7 cm
Sample thickne! 18.3 cm)! = 1.438 atoms/barn of hydrogei
Analysis: polyethylene: stochastic ratio of hydrogen to carbon within 0.04 percent of theoretical value
carbon: Volatile and nonvolatile contamination less than 0.01 percent
Literature Reference: R. B. Schwartz, R. A. Schrack, and H. T. Heaton II. Physics Letters SOB, 36 (1969); also, Proc.
Symp. Neutron Standards and Flux Normalization. AEC CONF-701002. Argonne, Illinois, p. 57
(Oct. 21, 1970).
Comments: Equality of carbon atoms/barn in the carbon and polyethylene samples can be seen from the absence of
structure in the observed hydrogen cross section. The statistical precision is degraded where there
are large peaks in the carbon cross section (e.g., 2.1 MeV), but there are no net fluctuations.
3

4

4.0 5.0 6.0 7.0 8.0 9.0 10.0 20. 30- 40.
NEUTRON ENERGY ,MEV


NEUTRON ENERGY .MEV7


COZ 3
CCm
COtoCD
LJ
(X
"11 r "1
I r
I I I I I I I I L_
-1 1 1 1 1
1I
1 r n 1 r
_i II I L-
15 . 20 .
NEUTRON ENERGY .MEV9
25 .
H
CO3
cn
zCD
1—
(_)
2 LUCO
COCO
CdCJ
RL1
1
—
Q1—


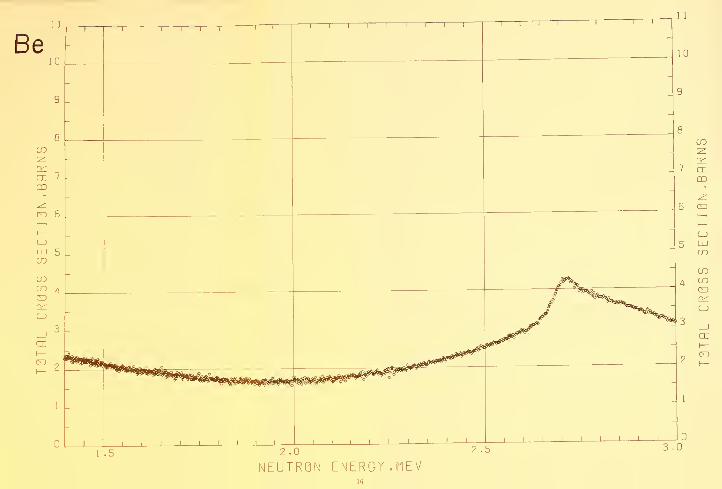
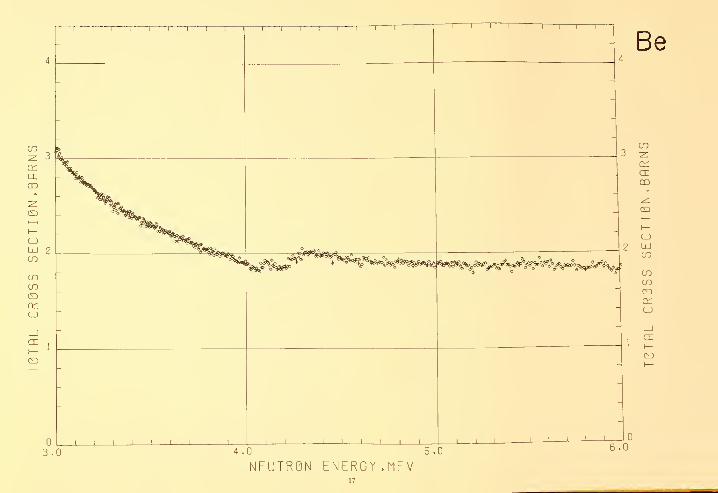
BERYLLIUM
Sample Material: metallic beryllium
Sample Diameter; 12.7 cm
Sample Thicknesses: 3.3 cm; ti=0.4069 atoms/bam
7.65 cm; n=0.9447
Analysis: s= 99.39 percent beryllium
principal impurity: < 0.6 percent oxygen
Literature Reference: R. A. Schrack, R. B. Schwartz, and H. T. Heaton II, Bull. Am. Phys. Soc. 16,495 (1971).
11


10
0 . ll
4 .0 5.0 6-0 7 .0 .0 9.0 10.0
NEUTRQN20 . 30 .
ENERGY , MEV
0 .
1
40 .


CECD
UJ 2LO
COCOCD
LJ
6.0
CECD
LJUJto
OJ
CDcc(_>
(X
CJ
J 1 1 L_
8.0 10 .
I 0
12.
NEUTRON ENERGY .MEV

Be4
15 . 20 .
NEUTRON ENERGY ,nEV
25 .
crCD
COCOCD01CJ
CE


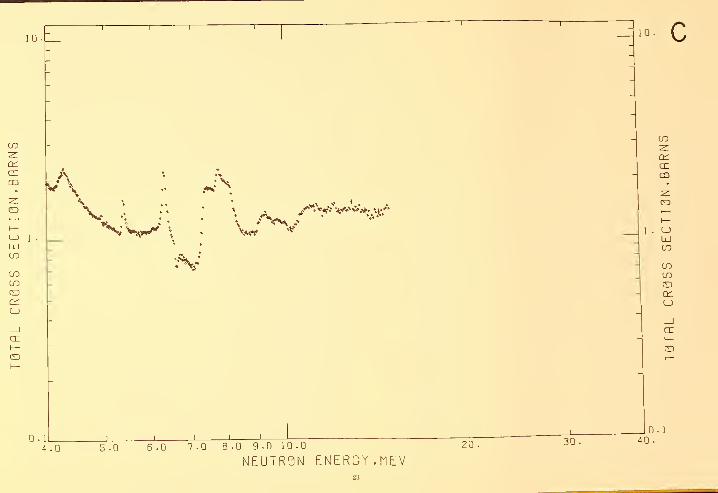
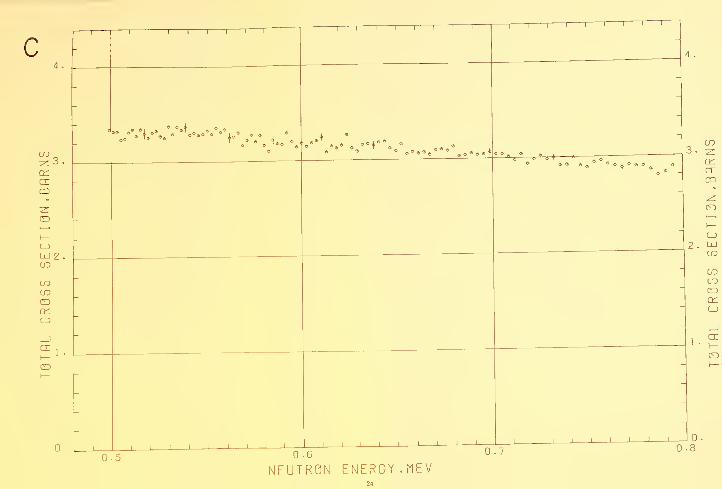
CARBON
Sample Material: pressed graphite
Sample Diameter: 12.7 cm; 5.08 cm.
Sample Thickness: 5.08 cm ?? = 0.4803 atoms/bam
10.16 cm 7i=0.9557 atoms/barn
17.78 cm » = 1.6750 atoms/barn
Analysis: volatile components < .01 percent
nonvolatile components < .01 percent
Literature Reference: R. B. Schwartz, H. T. Heaton II, and R. A. Schrack, Bull. Am. Phys. Soc. 15, 567 (1970).
Comments: Density fluctuations within a sample are less than 1 percent. There was no evidence of absorption
impurities on exposure to air.
21

T
0 . iL
5.0 6 .0 7.0 8 . 0 9.0 10.0
NEUTRON ENERGY ,MEV
10 .
crCO
LJLUtn
LDtoCDOCLJ
crI—
c
crCD
LJUJ 2 .
cn
Qct:
(_)
11 1 1 1 1
1 1
1
1 1— i 1 1 1 1 11
—1—1—1—1— 1 1 1 1
1
<
© « ®« oo * * * ® <» A .
-« * —
-
-
-
11-1 -1
—
1 1 1 r 1 1 1 J 1 1
n
-
-1—1
—
T 0
ccCO
2 .
LJUJCO
COCOCDQlCJ
crI—CD
NEUTR0N ENERGY ,hEV24

-1 1i i
1 r"1
1 1 r
4 .
0 . _J I I I L_ _l I 1 L_
0 .8 1.0 1-2
NEUTRQN ENERGY . MEV
C4 .
LJLUto
CO
(_)
_)crI
—


3 .
encrCD
LJuj 2 .
CO
1 .
i T—1
1—1—1—11111 —1
1 1 11—1—1—1
1
4
-
%^
»^
* V- O
/
1 1 1 1 1 1 1 —1 1
—
1 1 1 1 1 1 1 1 1
c
a:
m
(_)
UJto
toto
aiLJ
cr
0 .
3.0NEUTRQN ENERGY .flEV

c
cnGO
LjJ 2 .
to
O
cr
6.0
1 1 1 1 1 1 1 11
i— I 1 1 1 1 1 1 1
—1—i—1 1 1 1 1 1
'
--
9
>
-
^„
1 1 1 1 1 1 1—1—1
—
1 1 1 1 1 1 1 1 1
3 .
m
2 . LjJ
to
totoOq;tJ
1 .
tr
0 .
NEUTRON ENERGY ,(1EV

LJUJ 2 .
CO
0 .
1 1 1 11
1 1 1 1 1 1 1 11
1 1 11
1 1 ^ 1
1 1 1 1
4
-
--
i' T
-
1 11 1 1
1 11 1 1 1 1 1 1 _l 1 1
—
-
1 1 1
CCCO
CJUJto
COCO
QlLJ
_JCC
CD
0 .
NEUTRQN ENERGY .MEV29


NITROGEN
Sample Material: liquid nitrogen
Sample Diameter: 12.7 cm
Sample Thickness; 27.9 cm, n - 0.9684 atoms/barn
13.5 cm. n= 0.4683
Literature Reference: H. T. Heaton 11, R. B. Schwartz, and R- A. Schrack, Bull. Am. Phys. Soc. 15, 568 (1970).
CommentB- Special dewars were constructed witl, end windows of known thickness of pyrex. Open runs were madeComments, bpe
^^^^^^^ t^am. The nitrogen cross section was also obtamed by run_
ning melamine (CH,N.) against polyethylene ICH-.). A powdered sample of ""'^''^o C
atoms/barn of nitrogen was run aga.nst a sample of polyethene havmg the same number of atoms of C
and H Figure A shows the ratio of cross sections obtained using melamme and liquid ratrogen.
Figure A,
31


10
T
\
0 . iL
4 .0 5.0 5.0 7.0 8.0 9.0 10.0
NEUTRON ENERGY .MEV
,0. N
crOD
1 . U
en
CD
LJ
ex
CD
Jo.40 .


N
crCD
LU 2
toto
u
1 1 1 1 1
1 1 1
1
—1—i—[—i—1—1—1
i 1
1 11 T i
1
11
'
4
-
-
1—1—1—1
—
•
1 1 ^ \ \ \ \L 1
1
1
12
cc:
crQD
LJLUto
eoCOCDq;ej
_iccI—
NEUTRON ENERGY ,riEV38

-I1 1 r -1 1 1
1r-
N
ccCD
crca
QJ 2CO
COCOoLJ
cr
E3
' I I I 1_ I I I L_I I I I 1
L_
20 .25 .
NEUTRON ENERGY ,MEV39
2 bJCO
COcn
CEI—CD


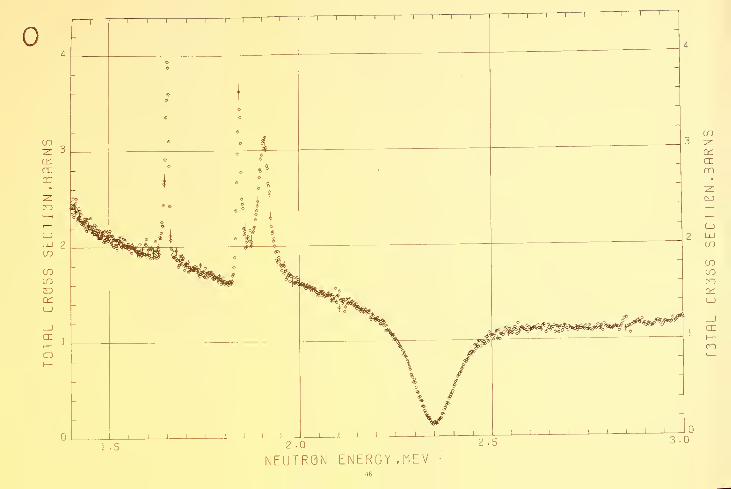
OXYGEN
Sample Material:
open:
Sample diameter:
Sample thickness:
Literature Referen
quartz (Si02) single crystals
semiconductor grade silicon
5.08 cm
7.54 cm; n= 0.396 atoms/barn
29.98 cm; n = 1.576 atomsAiam
R. A. Schrack, R. B. Schwartz, and H. T. Heaton II, Bull. Am. Phys. Soc. 17. 555 (1972).
whe« there are large peaks in the silicon cross section (e.g., 570 keV), but there are no net fluctuations.
41

10.
1
1
A
\
O.ll t I1 1 1 4; o 3 4.
0.4 0.5 0.6 0.7 0.8 0.9 1.0 •
NEUTRQN ENERGY .MEV

0 . IL
4 .0 5.0 6.0 7.0 8.0 9.0 10.0
NEUTRON ENERGY ,MEV
20 .
300 . 1
40 .


I

5.0
1 \ 1 1 1 1 1
1'
—1
1 1 1 1 1
i1 1
1 1 T1 r 1 1 '
^
-
-
-
— o
V:f ;/ %
1 1 1 1 1 1—1
—
\—1—1
—
—1 ^
-
Ill
crCO
<_)
UJLO
COLO
LJ
_JH
NEUTRON ENERGY ,nEV

NEUTRON ENERGY .tlEV


ALUMINUM
Sample Material: metallic aluminum plate
Sample Diameter: 12.7 cm
Sample Thickness: 11.3 cm, u= 0.6858 atoms/barn
A„a„,,s: The samples were fabricated fron, 1100 .rade a.u„,i„u,„. The principa, impurities were 0.62 percent iron
and 0.16 percent copper. AU other impurities were less than 0.1 percent.
51


10
crI—CD
"jTo sTo tli tTo 8 .0 9 .Q 10 -0
NEUTRON ENERGY ,riEV
10 .
0 .
1
20 .
30 . 40 .


4
Al
ccCD
UJ 2CO
LO
* ^»
cc
1 I I 1 L
3 .04.0 5.0
NEUTRON ENERGY .MEV
cccn
2 LU
COCOaCJ
6.0

6.0NEUTRQN ENERGY ,MEV

Al4
crCD
crCD
COCO
u
CE
15 .
J 1 1 L,
20 .
I I I I1
L.
25 .
NEUTRON ENERGY .MEV
CO
COCO(3CC
CX


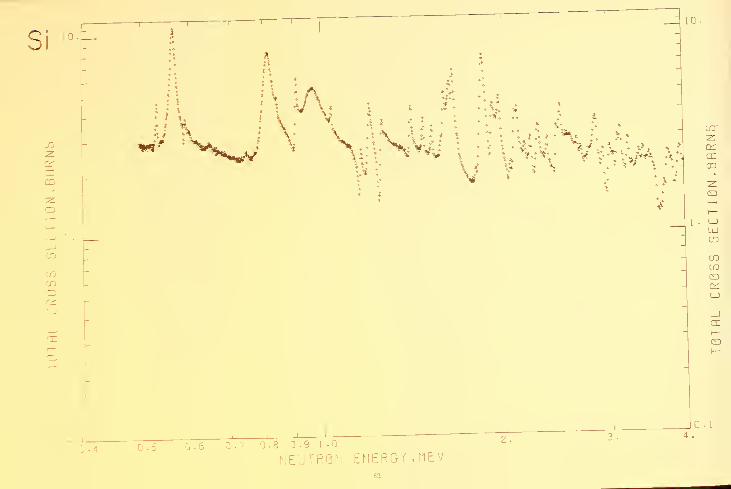
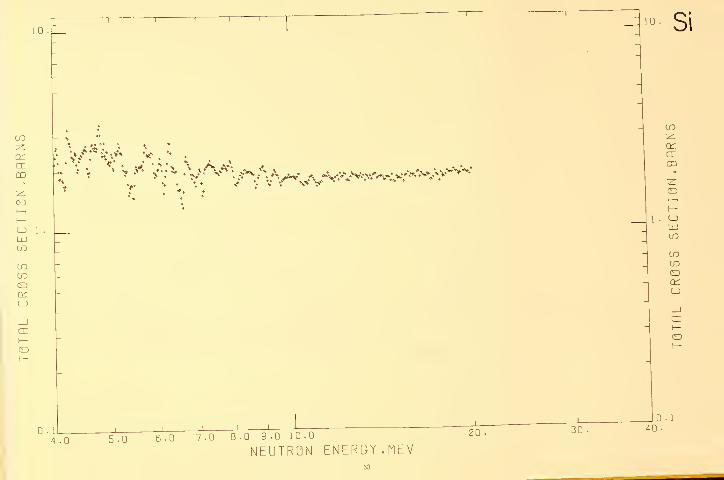
SILICON
Sample Material: polycrystalline silicon bar
Sample Diameter: 5.08 cm
Sample Tliickness: 4.6 cm. i. - 0.2294 atoms/barn
17.9 cm. « = 0.8957 atoms/barn
Literature Reference: E. A. SchraC. R. B. Schwart. and H. T. Heaton 11. Bull. Am. Phys. See. 16, 495 ,1971).
Comments: The samples were semiconductor grade silicon having impurity levels < 10-.
61
10.
crCD
1 • uUJ
en
Q
crI—
Q.ll0.4 Q . S Q • 7 0.8 0 . 9 1-0
MEUTRQM ENERGY , MEV
0 .
1
4 .
10
CECO
LJ 1
LULO
LOCOCDCCC-J
CL
CD
0 .
1
4 .0 5.0 6.0 7.0 .0 9.0 10.0
NEUTRON ENERGY ,MEV
20 .
30 .
10 .
Si
CLCO
LJLUCO
COCO
CKLJ
crI—CD
0 .
1
40 .


NEUTRQN ENERGY , liEV

Si
CD
LU 2LO
LOLOCDcrLJ
-1 1 1 r
cr
6.0 1.0
exCD
2 UJLO
LOLO
crLJ
crI—CD
10 .
1 2 .
NEUTRQN ENERGY ,MEV

NEUTRON ENERGY ,MEVm


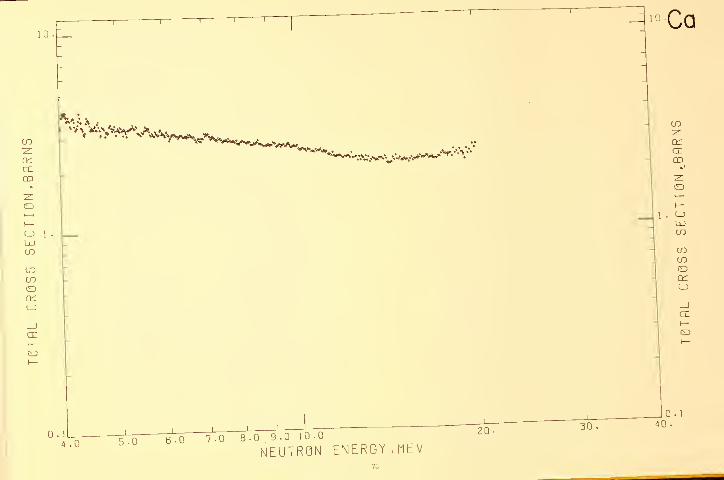
CALCIUM
Sample Material: metallic calcium
Sample Diameter: 12.7 cm
Sample Thickness: U.f) cm, 0.3331 atoms/barn
44.7 cm, )!= 1.027 atoms/barn
Analysis- The samples were fabricated from 99 percent purity metal and placed m me al contamers to prevent exces-Analysis.
J^^e-mp^^._^^
^ .^^ spectrograph.c analysis of tl,e samples d.sclosed'^'''-^"'f^lfj^^^^^^^
concentration were magnesium and strontium, both present .n concentrations greater than 0.1 percent but
less than 1 percent.
Literature Reference: R. A. Schrack, R. E. Schwartz, and H. T. Heaton II. Bull. Am. Phys. Soc. 17, 555(1972).
71

Co10..
cccrCD
(_> 1
COCO
LJ
CCI—
0 . IL
0 .
1- * •
0.5 0.6 0.7 0.8 0.9 1.0
NEUTRQN ENERGY ,MEV
3 .
ccCD
0 . il
4 .0
__u20

0.5 0-6
MEUTRQM ENERGY .MEV


az ' Uco
o 6
LU 5CO
LOLOOct:
(_)
1 .5 2.0
IMEUTRQN ENERGY .MEV

3.04.0 5.0
NEUTRON ENERGY .MEV

O "1
k4 .
6.0
ct;
CE03
2 uj
(JO
CDa:
CL
8.012 .
NEUTRON ENERGY .MEV

4
Ca
cr.
azCD
LU 2to
COCOCD
J I I L I I I 1 1 L1 5 .
20 .
25 .
NEUTRON ENERGY .MEV
LJ
2 LU
COCOCD
LJ


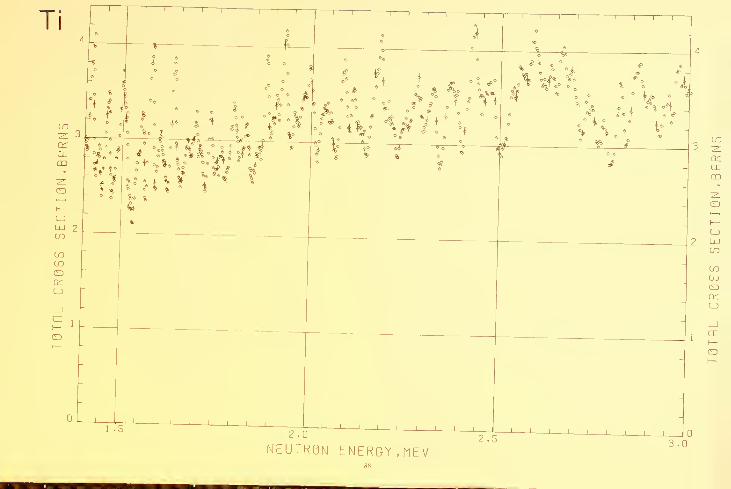
TITANIUM
Sample Material: metallic titanium bar
Sample Diameter: 12.7 cm
Sample Thickness: 10.7 cm, n - 0.6368 atoms/barn
Literature Reference: R. B. Schwartz, R. A. Schrack, and H. T. Heaton 11, Ball. An,. Phys. Soc. 14, 494 (1969).
Analysis: A qualitative spectro^aphic analysis ctthe san«,le showed no impurit.es at levels greater than 0.1 percent.
81

Ti10 .
crCD
l-J 1
COCO
LJ
crI—
0 • IL
0 . Q.5 0.5 0-? 0.8 0.9 1.0
^ NEUTRON ENERGY ,hEV
2 .
10 .
crCD
LJLUCO
COCOoccLJ
_lCC1—
10.1

ccCD
ccCD
LJ 1
LULO
COLOCDQ£LJ
CE1—
LOLOCDCHLJ
CC1
—
CD
0 . 1
0 . u4.0 5.0 6-0 7 .0 .0 9.0 10-0
NEUTRQN
20 30 . 40 .
ENERGY , MEV


1
1
~iI
i r 11 r
I I
1 r "1I
i r 1 1
1 0
1 0
_ 9
-J I u-1
1 L_
NEUTRON ENERGY, nEV1 .2
-J 1 1 I I 0
1 . 4
Ti~i
1 I1 r
~i 1
i
1 r
crcrCD
LJLlj 2LO
LOto
LJ
5? ^ '
, a**
~i 1i r n i r-
1 .5-I 1
1 L_
2.0-I
1 1 I I -I1 1 L
NEUTRQN ENERGY, MEV2.5
CLm
LJLUCO
LOLOCE3
CKLJ
CC
3.0

4
14
Ai
3.0-J I L _l I I L_ -J I I L_
"•0 5.0
NEUTRQN ENERGY ,nEV6.0


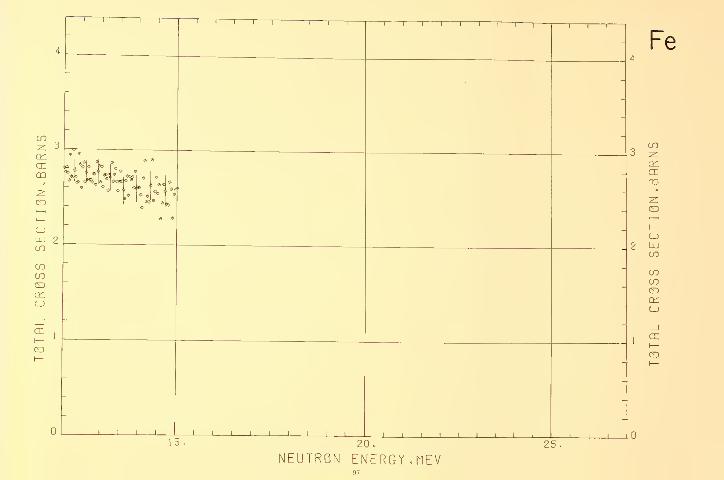
IRON
Sample Material: metallic iron
Sample Diameter: 12.7 cm
Sample Thickness: 2.94 cm. n = 0.2490 atoms/barn
11.8 cm, « = 0.9997 atoms/barn
Analysis: The samples were fabricated of SAE 1017 steel containing 0.9 percent manganese. The presence of themanganese may, at worst, introduce spurious fluctuations of up to 3 percent in amplitude in the energyregion where there are sharp resonances (< 2 MeV) and should have negligible effect at higher energiel

10 .
t y • •
• • »•
3 / i
3
(_1
LlJ
LO
toCO
CC
O-'* 0-5 0.6 0.7 0.8 0.9 1.0
NEUTRQN ENERGY, flEV
3 .
0 . 1

0 . il
4 .0 5-0 6.0 7.0 8.0 9.0 10.
0
NEUTRQN ENERGY, MEV20 . 30 .
10.
0 . 1
40 .


10
LOZcr 7
CD
O 6
LO
COt/7 4Oq;LJ
txI—CD
III r > 1 , , 1
1 r•
-r1 1
^—1—i—1
—\
—1—1
—
-
-
--
-
g
ii> c :»
^
+ * .° «
1—1_ 1 1 1 1 1 1 1 , 1
1
1
10
Fe
CO
6 CD
LJ5 UJ
LO
LO4 LO
CDCCLJ
(X
o CD
NEUTRQN ENERGY ,MEV1 . 4

Fe
QlCECO
CD 6
[_)
LUin
CO00 4oLJ
_Jcr
1
n
1 1 1 1 1 1
—1— 11
—1 1 1
1 r 1 1 1 1
—1 1 1 1 1 1 1 1 1
9 _
-
-
-
- .?'
*A t » * 4
. til/'. %l 4%/'/^
/ > ! / ^r. ;
« f
V
f
1
1 .J
—1
' ' ' ' 1 1 1 1
' 7 . n1 1 L 1
_
—1 11 1 L 1 , , , r
a:ccCD
CO
q;(_)
cr)—
NEUTRON ENERGY, MEV

ccCD
UJCO
LOto
11 1 r 1
1 1 1 p—
" ]
11 1 1
—1—1—1—1—1
—1 1 1
1 r—1
, 1 1
^
I \}
-
-
-
0 4 .r1 1 1 1_ 1 1 1 1
1
r r
-
1 1 1 1 1 1 11 ,
Fe
cr
LJUJCO
COCO
cc(_)
_lcc
NEUTRON ENERGY, MEV95

Fe
CD
in
LJ
OL
6.0-I 1 1 1 I I
I I
n 1 r
ccccCD
-I 1 1 1 II I
COQU
cr
CD
•0 10.
NEUTR0N ENERGY , MEV
-I I I I I
12 .
cr03
toCOCD
1 1
r\ 1
1 1 T i
1 1 1 1 1
1 1 1 1 1 1 1—1
1
1 1 1 1
--
*
-
--
-
1 1 1 1 1 1 1 I 1 1 1 1 1 1
1 11 1 1 1 1 1 1
1 1 1
1 5 .
Fe
a:CO
COCO
CJ
crI—
20 .
NEUTRON ENERGY .MEV97
25 .


NICKEL
Sample Material: nickel 200 cold drawn rod
Sample Diameter: 5.08 cm
Sample Thickness: 4.46 cm, 71=0.4047
11.37 cm, n= 1.032
Analysis: Qualitative spectro^raphic analysis of the sample showed no impurities greater than 0.1 percent.
99

10 .
cr
C-J 1
mCO
o
0 . II
0.4
i 5
0-5 0.6 0.7 0.80.91.0NEUTRON ENERGY .MEV
2 . 3 .

• II! 1 1 I I I
4-0 5.0 6.0 7.0 8.0 9.0 10.0
NEUTRON ENERGY ,MEV101
10 .
20 . 30 .
0 . 1
40 .


1
1
1 0
LOZq:ex 7
CD
CD 6
LU
CD
LJ
CCI—GD
0.8
~1—1—1—1
—1
1 1 1 1 1 1 1 1 1 1
_
-
-
-
*
« «p ^
f ^
— r-
—"1 ^
IIQ
—' \ \ 1—1 1 1 1 1 I 1 1 ,
1
1
10
crOD
6 CD
(_)
5 uuCO
UD4 OD
CDai(_)
enI—
o CD
1 .2
NEUTRQN ENERGY. MEV103
1 .4

1
1
1 1 1 1 1 1 1 1 1 11
11 1 1 1 1 1 1
1 1 1 1 1 1 1 1 1
_
-
- -
-
as
-
s| > j\: \fi^% V
-
1 1 ! 1 1 1 1 1 1 11 II
-
r
ccccOD
CD 6
(_)
UJCO
COCD
_icr
NEUTRON ENERGY ,MEV104

1
1
10
COzq;CE 7
QD
CD G
LjJ 5on
to 4C3
LJ
0
3.0
~l1
1—i—1
—1
—1—i
—,
—1 1 1 1 1 1 1 1 1
1 1
~1—1—1—1—1—1—1
—
-
-
-
-
-
Ill —1—1—1 1 1 1 1 . ,
-
1 1 1 1 1 1 1 1 1
4-0 5.0
NEUTRON ENERGY ,MEV
crCECD
CJLULO
COCO£DCCLJ
crI
—
CD
6.0

Ni
1
1
10
tozcr 7
CD 6
LJLU 5to
toto 4
QlLJ
cr;
—
CD
0
6.0
1 1 1 1 1 1 1 1 1 1 1 1 1 1 1 1 1 1 1 1 1 1 1I i I 1
-
-
- -
-
-
-
1 1 1 1 1 1 1 1 1
-
—1—1
8.0 10.
NEUTRON ENERGY .MEV106
10
to
1°^
I CC
6 CD
(_J
5 LUto
to
4. toCDCCLJ
a:
CD
12 ,

1
1
10
zCE 7
CD
COto 4
LJ
cr
1—1—1—1—i
—1
1 1 1 1 1 T \ 1
1 1 1 1 1 1 T 11
1 1 1
-
-
-
-
-
-
-
%
1 1 1 1 11
1 1 1 1 1 1 1 1 1
-
- 1 1 1
10
in
(_)
LUCO
COCOoocLJ
_lCE
NEUTRON ENERGY. MEV107


LEAD
Sample Material: metallic lead sheet
Sample Diameter: 12.7 em
Sample Thickness: 7.6 cm, 71 = 0.2614 atoms/barn
Analysis: A qualitative spectrographic analysis was made on the sample; the principal impurity was copper presentto less than 0.1 percent. All other impurities were less than 0,01 percentPP", present
109

D U i) 1 • U
NEUTRQN ENERGY ,MEV

.0 9.0 10 .0
NEUTRQN ENERGY ,MEV
0 .
1


1
1
Pb
COzaicrCD
zQ 6
(_)
LUto
COCOoccCJ
I
CEI
—
ED
1
1 1 1 1 1 1 1 1 1 1 1 1 1 1 1 1 1 1 1 i [ 1 1 1 1 1 1
_
-
1
%
^ifttf I'
—
* la i
? ^ f
^
-
11 1 t 1 1 1 i : J
-
I 1 1 1 1 1 1 1 1
1
1
2.0
NEUTRQN ENERGY, riEV
crCD
6 CD
COCOCDcr.
CJ
cr
2 .5 3.0


1
1
Pb10
d 7
CD
CD 6
LlJ 5LO
COCO 4CDa:LJ
cr
"T 1 1 1 1 1 1 1 r T \ 1 1 1 1 1 r -11 ] 1
\ I r 1 1
10
crCO
6 Q
6-0-J 1 L 1 I I
I I I -I—I I I I
COCOoa:LJ
cr
•0 10.
NEUTRQN ENERGY .MEV
-I—1 I I I I
1 2 .

NEUTR0N ENERGY, MEV

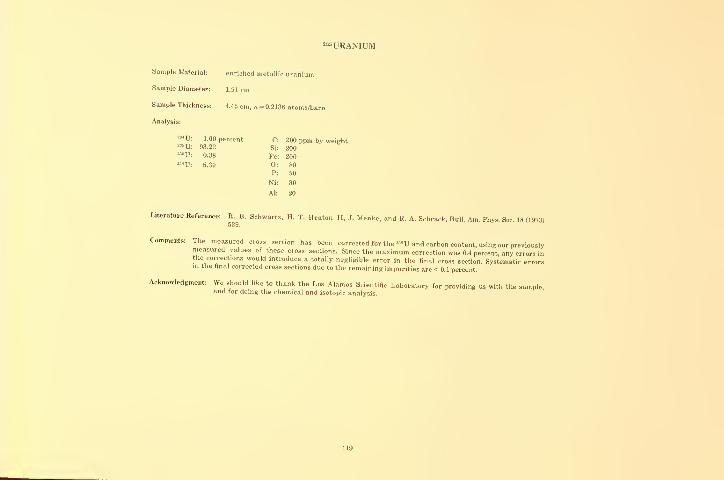
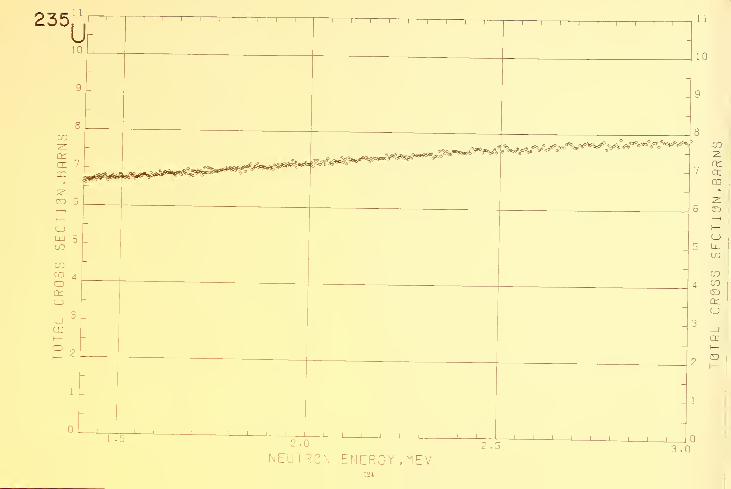
URANIUM
Sample Material:
Sample Diameter:
Sample Thickness:
Analysis:
enriched metallic uranium
1.91 cm
4.45 cm, w = 0.2136 atoms/barn
1.00 percent
93.22
0.38
5.39
C: 200 ppm by weightSi: 200
Pe: 200
0: 80
P: 50
Ni: 30
Al: 20
Literature Reference:
Comments: The
R. B. Schv/artz, H. T. Healon II. J. Menke. and R. A. Schrack, Bull. Am. Phvs. Soc. 18 (1973)539.
asured cross section has been corrected for the ""U and carbon content, using our previouslynieasured values of these cross sections. Since the maximum correction was 0.4 percent any errors inthe corrections would introduce a totally negligible error in the final cross section. Systematic errorsin the ftnal corrected cross sections due to the remainingimpurities are < 0.1 percent.
Acknowledgment: We should like to thank the Los Alamos Scientific Laboratory for providing us with the sample,and for doing the chemical and isotopic analysis.
119

1 . CJUJCO
0 . IL
0
.
0-5 0.6 0.7 0.8 0.9 1 .0
NEUTRON ENERGY .MEV
0 .
1
4 .

O.i4-0 5.0 6.0 tTo 8.0 9.0 ICO
'
NEUTRON ENERGY. MEV20 . 30 .
_ 10 .
235U
ccenCD
CJcuCO
COCOoCJ
ccI—
_J0.140 .


NEUTRON ENERGY, NEV123
NE-UTRQN ENERGY ,I1EV124

00 4CDaiLJ
1
1
23510
crI—
1
3.0-I 1 1 1 I
I I •
4 .0-J 1 1 1 I I
NEUTRQN ENERGY ,f1EV
5.0-I—I—I—I—I I I I
I
6.0

235
ccCD
CJUJCO
COLOOOL(_J
I
CC
CD
1 1 1 1 1 1 1 1 1 1
1
lit, 1 1 1 1 1
1 1 1 1 1 1 1 1 1
3 _-
- ^^^^.^ -
-_
-
1 ! 1 1 1 1 1 , ,
1 n1 1 1 1 1 1 r 1 1
-
1 1 1
1
1
10
COzenm
6 CD
CJLUCO
COCOCDQCLJ
I
cr
CD
NEUTRQN ENERGY. flEV126

1 0
crcr 7
m
C3 6
UJ 5CO
COCO 4OQC
-11 I I L_ -J 1 1 1 I I
15. 20 .
-I 1 1 1I I
NEUTRQN ENERGY. MEV25 .


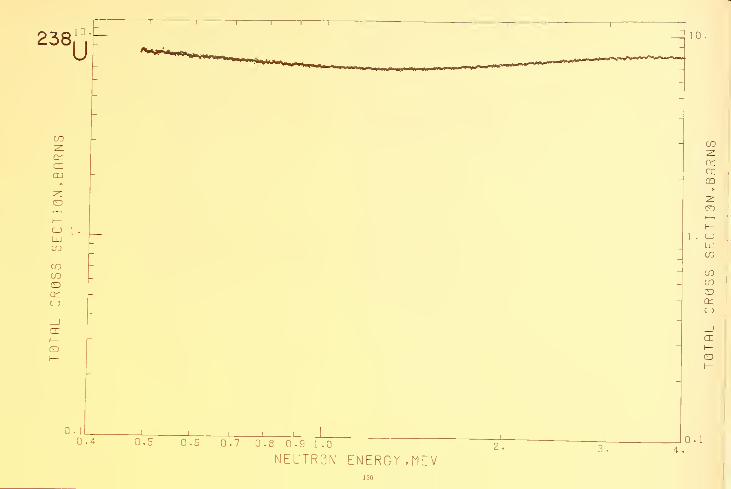
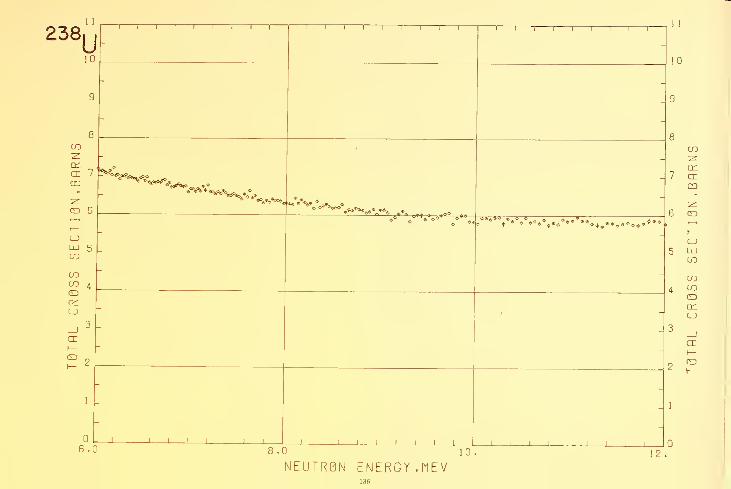
""'URANIUM
Sample Material: depicted uranium metal
Sample Sizes: 5.08 cm diam; 1.91 cm thick5.08 cm diam; 4.45 cm thick,1.91 cm diam; 4.45 cm thick;
= 0.0914
- 0.2128
= 0.2132
Analysis:
"U: 0.19 percent"U: 99.80
350 ppm by weight400
100
85
30
15
Literature Reference: R^B. Schwartz, H. T. Heaton I,, Menke, and R. A. Schraok, Bull. Ann. Phys. Soc. 18 a9,3,
Comments:
l'—^^^^^^^^^^^^in the corrections would introduce a Slfn Jl lreT the' "/nil' '""""'T V'the final, corrected, cross section due to tL gLtriti"e: a^Vrptr^nt'''^'™'""
Acknowledgment: We should like to thank the Los Alamos Scientific r =h , ,
andforperformingthechemicalandTs^topTc anafysi '"
119
238^~i 1 1 r
ccCD
<-> 1 .
COCO
cc
cr
-1 1 I I I
0-4 0.5 0.6 0.7 0.8 0.91.0
NEUTRQN ENERGY, MEV4 .

o.iL4.0 5.0 6.0 7.0 8.0 9.0 10.0
NEUTRON ENERGY .MEV20. 30 .
_J0.140 .

238i
CD
o 6
CJLUCO
uoCOoCJ
I
ex
CD
1
J
1 1 1 1 1 1 1 1 T1 1 1 1 1 1 1 1 -T 1 1 1 1 1 1 1 1 1
4-_
-
_
-
-
-
n; ! 1 1 1 1 1 1 1
1 —1 1 1 1 1 \ 1 11
-
—1—1—1 1 1 1 1 1 I
NEUTRON ENERGY. MEV132

COzq;enm
(_>
LU
UD
oct:
_icr
'' 1 ' I—T 1 1 1
'
'
<1 1 > 1 1
1
3 _
-
--
—1 1 1 1 1 1 1 1 11
8 1 .
—1
—
\—1—1 1 ] ,1
,
T .
—t
1 1 1 1 1 1 11
1
1
1
23810
U
crCD
UJCO
COCOoct:
C_)
_icr
NEUTRQN ENERGY. MEV

2381
1
u10 ,
CO
CE 7
CD
o 6
LlJ 5CO
COCO 4
crI—o
"T 1 1 r
1 .5
nI
I I I i
\ 1 r n 1 1 1 1 r
-I 1 1 I II I I I -I 1 1 I 1 I I
I I
1 1
10
CO
1°^
I CECD
6 CD
C_)
UJCO
COCOaC_>
cc
o
2 .0
NEUTRQN ENERGY , MEV134
2.5-I 1 1 1 i 1 I I I
3.0

1 I 11 1 1 r
4.0
""1I
1 1 r 1 1
23810
U
5.0-J 1 1 1 1 I I
I
COz
CD
z:6 o
5 LU
NEUTRQN ENERGY, [1EV135
6.0
ID4 Ol
GD
cr
(ED
10
W5 * *
® © ©"^a Srt.®*
7 cr
6 CD
LJLULO
LOCOOce
cr
o
6.0-J \ 1 1 1 I
I I I -J I I I I I u8.0 10.
NEUTRON ENERGY, flEV
-J 1 1 I L_
12 ,

1
1
10
toz:
az 7
""Ii I
1\ 1
i r
GD 6
LJLjJ 5CO
COCO 4CDCKLJ
CE
CD
-I 1 1 1 1 1 \ I II I I I I
I
1 5 .
1 1
23810
U
ccm
6 CD
5 LU
COCOCDCKCD
cr
CD
- 1
20 .
-I 1 1—I 1 1 1 1 I I
I I
NEUTRQN ENERGY. MEV25 .


^"'PLUTONIUM
Sample Material: plutonium metal
Sample Diameter: L91 cm
Sample Thickness: 4.45
Analysis:
n = 0.2207 otoms/gran-
0.01 percent
0.37
0.02
260 ppm by weight15
15
10
Literature Reference: R, B, Schwartz. H. T. Heaton II, J. MenUe, and R. A. Schrack, Bull. Am. Phys. S„c. 18,1973, 539
139

239 10
Pu
crCD
U 1
CO
CJ
cr
o
O-ll '1
i 1 1 II
I n :0-4 0.5 oTs oTt 0.8 0.9 1 .0 2.^.
NEUTRON ENERGY, riEV

a;CO
_jcr
t—
II1 I I I I I
4-0 5.0 6.0 7.0 8.0 9.010.0
NEUTRQN ENERGY, flEV
141
20.I
30 .
_J0. 1
40 .

10
Ol : L -I ! 1 ! I L.
0.6
NEUTRON ENERGY .MEV142
-J I ! L_
0.7-J 1 1 I u
0.8

1
NEUTRQN ENERGY ,MEVH3

239r
to
crm
LUto
tocn
(_)
crI
—
CD
1
1
J
1 1 1 1 1 1 1 1 1
—1—i—1 1 1 1 1 1 1
_
-
- -
--
-
1 —i—1—I—1—1 1 \ 11 1—1—1—1—1 1 1 1 1 1
-
—1—1—1 1
1
1
10
crCO
uUJto
toCO
a:u
_j
cc
I—
o
NEUTRQN ENERGY. MEV

COzCE /
CD
CD 6'
'
1
—
LJLU 5CO
COCO 4
CCLJ
-_l3
CT1—
21—
'III -1i r
i T
—
1
11 1 ~r 1 1
i1 1
11 1 1
-11 1 1
3 _
-
-
-
-
-
-
n <
1 1 1 L 1 1 1 1
,
-
1 _—1— 1 1 1 1 1
,
1
1
23910
NeUTRQN ENERGY. HEV

2391
1
Pu1 0
-T 1 1 1 1 1 1 r
toz.q;CE 7
CD
O 6
LJLU 5CO
COCO 4
ce(J
az
T 1 1 T ~1I T"
1 1
COz
7 cx
6 CD
t—LJLlJ
CO
COCOCDcc;
C_)
CE
CD
0


AI. Experimental ArrangementFigure 1 is a bird's eye view of our tarect area w» n, i j t
electron linear accelerator as a source of Su^rons The h ' f
"
of tlic picture, and passes throuT."'"'"^o"" Tlie beam enters from tile bottom
monitor' Since'tl,is se s ZJned f^rboZw"'"".'"""''"'"
neutron cross section measuremeS^ ireautmenrr"^^^^^^^For cross section measurementTthe mamet i^T^ 1 ? f'i " """"""^tion. The electron beam ererges' from thfrna™ t"^
f"""^"
our neutron producing target
Appendix-Experimental Techniques
PZ IONIZATION CHAM6E
NEUTRON SOURCE
NEUTRON TIME-OF-FLIGHTEXPERIMENTAL AREA
iRT PHOTOMULTIPLIER
ELECTRON BEAM LINE
FIGUBE 1 . Neutron time-of-flight target area.
' Figureain brackets indicate the lit«ratur« references at the end of the appendix.
^^etr'an™?,!""""""? " "> evacuated flight path.The transmission samples are placed three meters from the neutron source.
A2. Electron Linear Accelerator
„nl "^r^accelerator has been described previously [2J, and hence
™l'rbe''Ltt"°n:dh:Jr" tlme.of.fllgi;t'ixpeHmrt:
BO nfeV The'T 'f' ">'"'»''«'"'="t» the linac is generally run at about
hirer ihanthh T'f" °' ""ifary, as long as it is considerablyhigher than the highest energy neutrons to be measured. On the other hand, once theenergy ,s chosen, ,t must remain stable over the course of a measuremen (several
?hetrar, [h 1 '^'^" ""^ P"' "< *e neutron spectrum remaTns the same
'he^'eutroli'p^o^^ctj L"rge^'"""^^ ' '^'"'"^
and since the' vilTdT'''/"' "^'^f™ ""'^ Pe-- "eam burst,and since the yield of neutrons is fairly high, only very low beam currents are reouired
Ts IvTtr : "V °' APP-imately ten times more currentIS available in a 2 ns wide pulse.
whi I''!l'l'"'"' '"'"I""'" ™"'entional triode gun,= driven by a special pulserwhich allows a wide range of pulse widths: from several microseconds down to less
puls"es p"er "cord™ ™" " '° ^ " --ePe'i'i"" "te of 720
The average dark current is generally held to 0.01 percent of the average beamcurrent, and hence causes no problem.^..igcueam
The beam spot size is - 3 mm in diameter.Once tuned up. the linac is generally quite stable in operation. Specifically thebeam spot is stable in size and position, the beam current fluctuates by less than 10
percent, the energy remains within the 2 percent limits and the pulse shape remains
takinj"'^'^ '''^^ ""''''''J' "ery important for accurate data
A3. Neutron Producing Target
To some extent, it is possible to "tailor" the neutron spectrum by the choice ofneutron producing target. Very generally, in the McV energy range, higher Z targetsproduce more neutrons, but of low energy and lower Z materials will give fewer neu-trons, but of higher energy. The observed spectrum will, of course, be modified by thevariation in the detector efficiency ns a function of energy. In our early measurements(which only went to - 5 MeV neutron energy), cadmium targets 1 to 2 cm thick wereused. The yield from cadmium tails off sharply above about 6 MeV, however so a combination of - 0.1 cm tungsten, backed by - 3 cm beryllium is now used. The tungstenprovides the low energy neutrons and also acts as an efficient bremsstrahlung radiator
' Applied Radiation Corporation Model 10. (Thi. particular piece of equipment, and certain other com-merciai e,uipment. instrumenU and materials are identified in thi. Monosraph in order to .dequatelyspecify the experimental procedure. In no case does such identification imply recommendation or endorse-ment by the National Bureau of Standards, nor does it imply that the material or equipment identified isnecessarily the best svaiiabie (or the purpose.)
equipment loentined is

for the beryllium which, in turn, supplies the higher energy neutrons. The differencein thickness between the W and the Be is typical of the difference in yields betweenhigh Z and low Z materials. The use of a target which is mainly low-Z is also importantin solving some of the problems associated with the gamma flash, as will be discussedin section A4.3.
A4. Instrumentation
A4.1. Detector and Fast Timing Electronics
The main function of the fast electronics is simply to provide a "start" signal,related in time to the production of the neutrons, and a "stop" signal, similarly relatedin time to the detection of a neutron at the end of the flight path. These signals arethen analyzed and encoded by a Time Interval Counter, (sec. A4.3)
A block diagram of the electronics is shown in figure 2. Not included are such an-cillary' units as fanoiits, pulse shapers, and delay cables, nor do we show the slowelectronics necessary to produce the logic signals for the on-line data handling system.
Figure 2. Btot^k diagram of electronics.
The shower developed when the electron beam strikes the neutron producing tar-get impinges upon a bare RCA 931A phototube (i.e., no scintillator is used). The photo-tube anode signal is fed to a zero crossing discriminator [3] whose output furnishes the"start" signal The start signal performs several functions. It is fed to the Time
Interval Counter, initiates delayed gates and a marker generator, and is scaled by thecomputer.
The neutron ("stop") detector is a 13 in. diam. by 5 in thick NE 21P liquid scintil-
lator, viewed by 3 Amperex type 58AVP photomulti pliers. The anode signals are fedto zero cross-over discriminators [3]. The outputs of the zero crossing discriminatorsgo to a Two-Out-of-Three [4] coincidence gate and an OR gate.
The Two-Out-of-Three coincidence requirement reduces the noise counts.The actual "stop" timing is derived from the output of the OR circuit. Before
each run, the delays among the three phototubes and zero crossing discriminators arecarefully matched so that the centroids of the timing distributions for the three tubesare exactly coincident in time (i.e.. total spread less than 200 ps) at the input to theOR circuit. For each individual event, however, there will generally be some spreadin the time of arrival of the three pulses. Since the Time Interval Counter is triggeredby the leading edge of its input pulse, timing from the output of the OR circuit meansthat the timing is actually determined by whichever of the (nominally coincident)pulses arrives first. This procedure makes the best use of the timing information fromthe scintillator.
Signals from dynode 14 of each phototube are summed in a fast adder-discrimi-nator. Since the gains of the phototubes are carefully matched, this provides a con-venient method for setting the overall bias level, which is usually set at about 160keV energy neutrons.
The outputs of the Two-Out-of-Three coincidence, the "OR" and the fast adder-discriminator are suitably shaped and delayed, and applied to the inputs of an ANDcircuit, along mth the output of a delayed gate generator which is used to define thetiming range and hence the energy range. If no neutron is detected during the time thedelayed gate is open, the marker pulse generator provides an artificial stop pulse whichresets the Time Interval Counter.
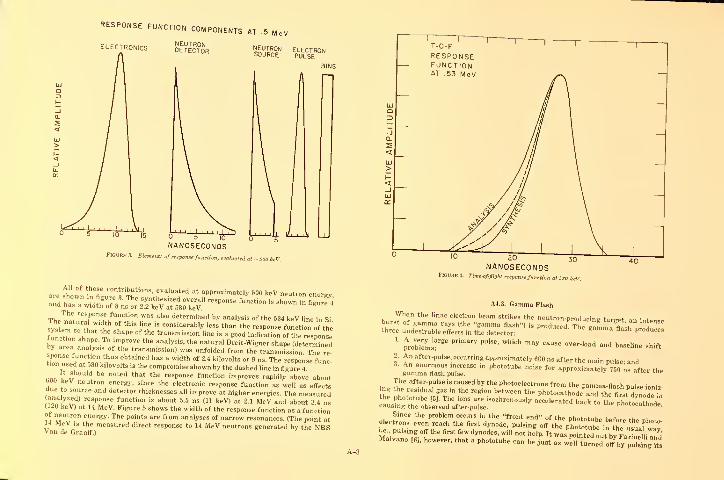
A4.2. System Response Function
We have used two approaches in determining the response function of our system:synthesis and analysis. In the synthesis approach, we fold all the known contributionsto the response function to obtain the final overall response function. We have usedcontributions from the following sources:
1. Electronic response function2. Neutron detector thickness
3. Neutron source thickness
4. Electron beam pulse width5. Timing channel bin width
The electronic response function was determined by a coincidence technique using^^Na y rays. For y rays whose pulse height was approximately equal to that of 0.5 MeVneutrons, the response function was 3.5 ns FWHM. The detector and source responsefunctions are truncated exponentials determined by the mean free path of the neu-trons and their flight time in the medium. The electron beam pulse shape was assumedto be a 2 ns wide Gaussian, as determined from measurements of the gamma flashshape through thick absorbers.
* Manufactured by Nuclear Enterprises, Inc.
RESPONSE FUNCTION COMPONENTS AT .5
NANOSECONDSFIGURE 3. Ehme„U of ,„po,„e /,,„ei,'„„, „alM<:i al-Sm k,V.
All of these contributions, evaluated at approximately 600 keV neutron ener«,
t--^^:^^-t^:^ "The response function was also determined by analysis of the 634 keV line in Si
svstem soThaTth "i '^T." -"-derably less than the response function of the
^unctl sht! T itransmission line is a good indication of the response
£ a ea anaLr^TT' " '^-''-^^e"" -hape (determinedby a, ea analysis of the transmission) was unfolded from the transmission. The re-sponse function thus obtained has a width of 2.4 kilovolts or 9 ns. The response func-tion used at 530 kilovolts is the compromise shown by the dashed line in figure 4
rnn i,' •f,'"'"''''=''P<>"''e function improves rapidly above aboutmil keV neutron energy, since the electronic response function as well as effectsdue to source and detector thicknesses all improve at higher energies. The measuredana yzed) response function is about 6.5 ns (11 keV) at 2.1 IMeV and about 3 4 ns
(120 keV) at 14 MeV. Figure 5 shows the width of the response function as a function
Va m"i'™""""•'Sy- The points are from analyses of narrow resonances. (The point at
14 MeV is the measured direct response to 14 MeV neutrons generated by the NBSVan de Graaff.)
A4.3. Gamma Flash
When the linac electron beam strikes the neutron-producing target an inten..
th^ :^csrbrr:tisrctr'' -^--^ ./.i^Xot-::
pro'blemsr^'""""
2. An after-pulse, occurring approximately (iOO ns after the main pulse- and
gamrrshVuTse""approximately 750 ^s after the
The after-pulse is caused by the photoelectrons from the gamma-flash pulse ionizng the residual gas in the region between the photocathode and the first d mode t:"str^obird"afrpX'^-"°"°-'^ - th^pttti^^:
elector :^e?rcrtbrfirst"dytd::7:'sir:"t?e%ttr^^^^^^i e., pulsing off the first few dynodes, w^ll not h?lp It was potted m^
"sua way
Malvano [6,, however, that a phototube can ^.Vi:rS.trZ'oilTSL:t

focus electrode. In our case, we are not really concerned with turning off the photo-tube per se: our object is specifically to reverse the electrostatic field near the photo-cathode so that the enormous number of photoelectrons generated by the gammaflash are not accelerated down the photocathode-first dynode space. We do this byapplying a 600 volt negative pulse to the focus electrode of the 58AVP during thegamma flash.
Figure 6 shows the electrostatic field lines in the front end of a 58AVP as mappedout on an analog electrostatic field plotter. (For clarity, we show the field lines whichwould exist with the photocathode at ground and -1-2600 volts on the anode; in actualpractice the anode is at ground and -2600 volts is applied to the cathode.) Figure 6ashows the field lines during normal operation; figure 6b shows the field lines with-600 volts applied to the focus. Note the reversal of the field at the photocathode.so that photoelectrons are not accelerated down to the first dynode.
After the applied pulse, the photomultiplier gain recovers as rapidly as the pulsedecays, which in our case is about 100 ns (caused mainly by the stray capacity of theleads and the phototubes.)
This method of ehminating the after-pulse also, of course, essentially eliminatesmost of the primary gamma flash pulse itself. Further details of the phototube pulsingas well as a circuit diagram of the pulser, have already been published [7].
While the phototube becomes rather noisy for several microseconds after theapplied pulse, the Two-out-of-Three coincidence requirement eliminates this as a
58 AVP FIELD DISTRIBUTIONS
-600 Volt Pulse
Figure 6. Electrostatic field linen in the type 5SAVP photcnnuitiplier.
The upper part of the figure shows the field lines when the -GOO volt pulse is appliedto the focus electrode, G,. The lower part of the fi^re shows the applied voltages andresultant field lines during normal operation. For clarity, the voltages shown are thosewhich would exist with the photocathode at ground and +2600 volts on the anode- Inactual use, the anode is run at dc RTound and -2600 volts is applied to the cathode. Thefield lines are, of course, the same in either case.
problem. A much more serious noise problem is caused by the gamma flash itself.While the noise from the gamma flash pulse decays after about 750 ns, it is so intenseduring this period that a significant number of accidental coincidences are recorded.Requiring a three-fold (rather than 2/3) coincidence helps, but results in an appreciableloss of smaller pulses. In addition to pulsing off the phototube, it was also found neces-sary to reduce the intensity of the gamma flash by using a 1 inch thick tungstenfilter in the beam and by using a neutron-producing target consisting largely of low-Zmaterial (see sec. A3). In this way, we are able to make accurate measurements out toabout 20 MeV, or 500 ns after the gamma flash pulse.
A4.4. Time Interval Counter
As indicated earlier, the "start" and "stop" signals are analyzed by the TimeInterval Counter. This is a commercial digital timing device^ with one nanosecond
' Manufactured by Eldorado Electrodata Corporation.

and is mthin one m." " ">"ker generator based on such a standard,
is stirtef put' ge^t^r td'foi" H' ^o-ter
source. When properlfad^Tsted the ZZH^l '''v'"""r "
which cancels out in a L„Lisstonmett::e°^^"
A4.5. Energy Calibration
Our system allows convenient, absolute enerev calihr.tinn <R„ i, . »
f^:^rj^^-^j;:-Lr--drt^^^2^rp-^JCtir:'rz^:e^rri-^Since the ™dths of the timing channels on the counter are known, th a srtves an absolute measurement of the neutron time-of-flight. A measurement of th? path "enihthen gives a direct measurement of the neutron energy
tainSes i„"'th"",""""""^ Pnniarily from uncer-tainties n the timing measurements. These include nonlinearities of the TimeCounter, long.term (i.e., a few days) drifts in the timing, and systematic timing differcnces between neutrons and gamma rays. The non-linearities and long term driftshave both been carefully checked, and are less than 1 ns and V. ns, respectively While
lor„h ^7 l'°in the timing response of the scintilla-
tor-phototubes-discrimmators between neutrons and gammas, it is known that NEdoes not show any difference in response between neutrons and gammas. Theslewing between small pulses (due to low energy neutrons) and large pulses (from thegamma flash) is approximately 1 ns.The path length has been measured with a geodimeter» to an accuracy of 0 02
percent: this contributes a neghgible error to the energy scale uncertainty. A minorproblem arises due to the detector thickness. The detector is approximately 4 meantree paths thick at 0.6 MeV, and 0.3 mean free paths at 20 MeV. Therefore (he lowenergy neutrons effectively stop near the front face of the scintillator, whereas, on theaverage, the high energy neutrons stop nearer the center. Thus, the effective pathlength IS greater for high-energy than for low energy neutrons. This difference inpath length (amounting to almost 0.1%) can, however, easily be calculated and is cor-rected for.
The final energies are all calculated relativistically.Taking all the above factors into consideration, the over-all uncertainty in the
energy scale determination is 0.04 ns/m (e.g.. ± 3 keV at a neutron energy of 2 MeV).Below about 2 MeV this compares very favorably with the best work reported from
Van de Graaff accelerators. At higher energies, some high-accuracy Van de Graaffexperiments [8] have smaller errors, but, in any case, the time-of-flight method has
' We are grateful to Mr. George Lesley of the U.S. Coast and Geodetic Survey for making thismeasurement.
the great virtue of allowing a direct measurement. It is worth noting that there is
renorted hvThlw " our energy scale and thatreported by the Wisconsin group [8] (i.e., agreement within - 8 keV at 6 MeV neutronenergy).
A4.6. Data Handling
The data from the Time Interval Counter, as well as the counts from the moni-tors various scalers clocks, etc. are all handled by the NBS on-line data handlingsystem The general features of this system have been described previously [9], anda detailed report of our use of the system has been published [10); hence, only themajor features will be reviewed here.
The on-line data handling system has been constructed around an XDS 920 com-puter. (16K core memory, 24 bit word, and 8ms cycle time). The modular concept hasbeen applied to both the software and hardware design of the system. Associated withthe 80 levels of priority interrupts are programs used to record the experimental data.The priority hierachy insures that the most important data will be recorded flrstafter which lime the computer can do more routine functions, such as present a CRTdisplay, output the data etc.
A5. Monitoring
Two monitors are used: a secondary emission monitor (SEM) to monitor the elec-tron beam, and an NBS P2 ionization chamber (11) which monitors the shower createdin the neutron producing target. The ratios among the monitor counts and the totalneutron counts are printed out periodically during an experiment. The constancy ofthese ratios during the course of the experiment is a measure of the overall stability
It IS important to note, however, that the spread in value of these ratios only repre-sents an upper limit to the error caused by any errors in monitoring. This is because inovir transmission measurements the samples are cycled in and out every twentyminutes. Hence drifts, with time constants long compared to twenty minutes vrillcancel out.
'
A5.I. Secondary Emission Monitor
The secondary emission monitor (SEM) consists of three aluminum foils eachapproximately 1 mg/cm= thick. A thin layer of platinum (- 25 Mg/cm') is evaporatedon the aluminum surfaces to reduce ageing effects. Although work in this laboratoryindicates that an SEM may not give very reproducible results for high (> 20 /lA) elec-tron beam currents, the SEM is satisfactory for the low currents (- 100 nanoamps)used in this experiment. The ratio of neutron counts to SEM readings show RMSfluctuations of ~ Vh percent during the course of an experiment (i e two to threedays).
A5.2. Ionization Chamber
The more stable of our two monitors is a conventional NBS P2 ionization chamber[111. The P2 is placed immediately behind the neutron producing target, and henceeffectively monitors the shower produced in this target. Although the P2 may over-load (due to recombination effects) at high currents, again, as in the case of the SEM,at the low currents used in these experiments there is no sign of overloading. Theneutron-to-P2 ratios fluctuate by ± Vi percent during the course of an experiment.

A6. Sample Thickness Considerations
It had been customary to use fairJy thin samples-SO percent to 70 percent aver-age transniission-in total cross section measurements. In a low background situa-tion, however, there are two factors which argue for the use of thicker samples-say,< 15 percent transmission.
First, Rose and Shapiro [13] long ago showed that where the backgi'ound is low,the optimum sample for minimum statistical error is approximately two mean freepaths thick; i.e., transmission ~ 15 percent.
Secondly, the over-all cross-section accuracy (as opposed to the statistical preci-
sion) may be improved by the use of a thick sample. This is easily seen: since T= e^"",
where T is the measured transmission, n is the areal density of the sample (in units, of,
say, atoms/barn) and cr is the total cross section,
fl<T 1 dT
(We call the dimensionless quantity iicr tlie "sample thickness.")Thus, for example, an error in normalization will give a constant fractional error
in the trans »nission. Equation (1) shows that for this case, the resultant error in thecross section may be reduced by simply running a thick sample. Equation (1) also ex-plains why a particular cross section measurement may be accurate where the crosssection cr is high, but have large fractional errors where a is low.
On the other hand, eq (1) does not, of course, mean that one can achieve arbitrarilysmall errors in the final measured cross section by using arbitrarily thick samples.In addition to losing statistical precision for samples whose thickness is far fromoptimum, for very thick samples (»a- >5; T < 1%) the in-scattering correction (seesec. A7.3) becomes large and difficult to calculate, even in good geometry. More im-portant, for thick samples, the background correction becomes large, and the ever-present uncertainties in the background can become the dominant error.
In addition, if the instrumental resolution width is wider than the natural width ofany structure to be measured, the observed peak cross sections will be higher forthinner samples. In other words, a thick sample worsens the apparent resolution.This is sometimes referred to as a "beam hardening" effect.
A final complication derives from the simple fact that cross sections vary mthenergy, hence a particular sample which is "thick" at one energy may be very "thin"at another energy.
Thus, while it is clear that the sample thickness has an important function in de-termining the quality of a total cross section measurement, the procedure for choosingthe "n" value of the sample is much less clear. Careful consideration must be given toall the sources of error in a particular experiment, as well as the use to which thefinal data will be put, before the optimum sample thickness can be sensibly chosen. Inour case, the background is very low and well-behaved (see sec. A7.1). In addition, animportant use of our data was to be as input in neutron transport calculations; fordeep-penetration calculations the minima in the cross section are most important.Thus, relatively large "«" values seem to be called for. Such samples might, however,be too thick to give any useful information in regions where the cross section is high"hence we generally ran with two different samples. The value for the thickersample was commonly > 1; "n" for the thinner sample was a factor of 2 to 4 less.
We thus had samples appropriate to cover a wide range of cross section values and,
in addition, the data from the two samples provided an important check on internalconsistency. (The exact "i>" values used are listed for each element in the main bodyof this report. It will be seen that even the "thin" samples are rather thicker than hasbeen customary in this type of measurement.)
A7. Corrections to the Data
A7.1. Background
The background is measured by simply inserting a "shadow bar" (32 cm of copperplus 15 cm of polyethylene) in place of the transmission sample. The backgi-ound count-ing rate is generally less than 0.3 percent of the open beam counting rate. About halfof the background is due to cosmic rays and natural room background, and the otherhalf is associated with the linac beam. The background is flat and structureless, andquite constant during the course of a run.
We have investigated the question of whether the true background is adequatelydetermined by this simple shadow-bar measurement. We have, for example, measuredcounting rates with the detector off-axis, at "long" times-of-flight between machinebursts, -with the beam purposely missteered, with various combinations of shieldingand beam stops, etc. We find no significant background beyond that measured with theshadow bar technique. We note that our cross section measurements tend to be ratherimmune to background caused by neutrons which scatter off the walls of the measure-ment room and return to the detector, since such an event must occur within 4 fis ofthe beam burst (at which time our gate closes) and must give a pulse larger than a160 keV recoil proton.
The "black resonance" technique commonly used to measure backgrounds in theeV and keV regions can not be used in the same way in the MeV region, simply becausethe peak heights are so much lower. Nevertheless, a measurement with black (oralmost black) resonances does provide a valuable check on backgrounds determinedfrom shadow bar measurements. This was generally the case in our "thick" samplemeasurements and the results (albeit often with rather poor statistics) were consistentwith our assumed background. The 2.95 MeV resonance in carbon, for example, wasstudied with a quite thick sample {n = 1,2) for which the transmission T was 2.4 percent,and with a thinner sample {n = 0.48) with 7'= 23 percent. The final value for the peakcross section was the same for the two samples, despite the factor often difference intransmission, indicating that the background was accurately known.
A7.2. Dead Time
With a low duty cycle machine (maximum rep. rate = 720 pulses per second) andan electronic system which will only record one count per pulse, it is difficult to obtaingood counting statistics in each of several thousand channels in a reasonable amountof running time. In addition to optimizing the sample thickness (sec. A6). it is alsonecessary to run at high counting rates, which unfortunately, means that large deadtime corrections are required. In practice we select a beam current such that duringthe "open" runs, an average of one neutron per burst is detected bv the "stop" detectorFor this case, Poisson statistics show that the average number of neutrons actuallyrecorded by the electronics is (1-1/e) per burst, and in the last timing channel (lowestenergy neutrons) the ratio of true counts to recorded counts is equal to e.
For a -one-shot" electronic system which completely recovers between pulses.It has been shown, [14] however, that to first order the dead-time correction is a sim-

SpecSy;"'""'"" --'-"^ .-ntities.
recorded counts tro^cZnIZ :LtTH-l7 " ^"^ °'
the c^r::;r°:^r:;^?i o;:r-r-o^d^^r^c^Lr:;:.^^-^-"-^-^-^=i^'Sic5f~^
iiffj.lt""^'^ "P^'^ions experimentally, primarily' by running atdifferent neutron counfn,; rates and by recording "fiat" timing spectra from radioactive sources at counting rates equivalent to those obtained under actuaT^unnin,
troduce negligibly small errors ,n tlie final result. This is further verified by the goodagreement between thick and thin sample measurements.By us.ng thick samples and counting at relatively high rates, in ~ 60 hours ofrunning time the statistical errors are approximately 2 percent over most of the 3500
channels.
A7.3. Inscattering
The good geometry which is intrinsic in a time-of-flight experiment almost auto-matically insures that the inscattering correction will be small.
The fractional change in the total cross section, due to inscattering is givenby (16);
icr, ri-)!-...-) ro-(0)l
where
n is the sample-to-source solid angle,r-. is the detector-to-sample solid angle,
is the detector-to-source solid angle,cr(0) is the scattering cross section at 0°, in b/sr.
and ^rZL'^n'^?^ ^™ "inscattering index" by Foster
LneSriy 0 or Ls' ' ?* °" ' ^ '^<^ -cond termgeneral y O.o or less. The last term, which is essentially a multiple scattering correction to the in-scattenng varies betwppn i q e . ... .
^^'"'"s
these measurement, H.„ 1 ^ sample thicknesses used in
ir,yToTari::t'her"re: g:f„ir:7yT^:er^ —AS. Summary
In the appendix we have described the NBS system for making accurate totalcross section measurements in the MeV energy region, the main body of th?s Mono
future ™bl,"^°' "^'^ — ™* this system.In future publications we will discuss some of these measurements in detail, and makecomparisons with results from other laboratories.
We should like to thank Julian Whittaker for his inestimable contributions to theelectronics and instrumentation. It is very doubtful that this program would havesucceeded without his active assistance.
A9. References
't:;r.u„"„ aecc'Sp ^lz' ""'°"n,"- »" ^maiizaiion, AtL CUNI--701002, Argonne, Illinois, p. 377 {Oct 21 1970)
m wk'.';'
r^'/^t^Accelerator Conf., Loa Alamos, New Mexico, p. 20 (Sept. 1666).
[3] Whitlaker.J.IC.IEEETranB.onNudearScienceNS-n.No1 399(1966)
(4) Whittaker, J. K., Nucl. In8tr.andMeth.45. 138(1966)[51 Mor^„.G^A Smith. H. M .„d W...e™.„, R., ,EEE Tr.n.. Nucl. Sd. NS-I4. N,. 1. 443,1967,; Shin.
' ^' Glavint.. C, and Rawhns, J, A.. Nuel. Instr. and Meth. 58. 363 (1968)I6j t anneUi. U., and Maivano, R., Kev. Sci. Instr. 29. 699 (1958,
S "''"°»' ""' K- B.. Nucl. In.tr. and Meth. 77. 176(1970,[8] Davia. J. C, and Noda. F. T,. Nuel. Phya. A134. 361 (1969,191 Broh.rj. J. B, IEEE Tr.n,. Nuc). Sd. NS-13, Nu. 1. 192 (1966,; Wyakuff, J. M., I.e. cil. 199.
[101 Heaton, H. T, 11. Nat. Bur. Stand. (U.S., Tach. Not. 516. 31 paee. (Jan 1970)
M i! i ""•<•" 18 P«e«> (J^ne 1952).[121 M. l.r. D. W.. Past Neutron Phy.ic. Part II, Chapter V. A., p. 986. J. B. Maiion and J. L Fo.l.r Ed.(Intersdence Publishers, New York, 1963,.
u o.
i.. r owier. tda.
[13] Rose, M. E., and Shapiro, M. M., Phya. Rev. 74, 1863 (1948,.(14) Boilmeer L^M^, arid Thomas, G E., Rev. Sci. Iratr. B2. '1044 (1961); Kirkbride, J.. Yate.. E, C. andCrandall, D. G., Nucl. Instr. and Meth. 52, 293 (1967).
[15] Bratenahl, A., Peterson, J. M., and Stoering. J. P., Phya, Rev. 110, 927 (1957)[16] Foster, D. G., Jr., and Glasgow, D. W.. Phya. Rev. C3, 576 (1971).

roBM HBS-INA ll-iD
U.S. DEPT. OF COMM.I
1. PUBLICATION OB REPORT NO. Gov't Accession"BIBLIOGRAPHIC DATA No
nccession
SHEET NBS MN-138
J. Recipieni's Accession No.
4. TITLE AND SUBTITLE
NeV Total Neutron Cross Sections
January 1974
6. Perfonning Otgnoization Code
7- AUTHOB(S)
R.B. Schwartz, R.A. Schrack, and H.T. Heaton II8. PerformiDg Orgnoizanon
9- PERFORMING ORGANIZATION NAME AND ADDRESS
NATIONAL BUREAU OF STANDARDSDEPART^^ENT OF COMMERCEWASHINGTON. D.C. 20234
10. Propecty'Task/Work Uiiir No.
2A1022211. Contcact/Granr No.
12. Sponsoring OigooizQiion Name and Address
Same as No . 9
,
13. Ti-pe of Reporr & Period
FinalH. ^onsotiag Agency Code
. ^ ^repoxt is a compilation of the McV neutron total cross sectiondata measured at the National Bureau of Standards oirer the past several years. Themeasurements generally span the energy Interval from 0.5 to 15 or 20 MeV- data are
Cotoo^f2&,S1S^'"' '"S^ti"''"'^l^'^ normally occurring elements, plus the separa
t^e e^^e i J , ?\ "PP^""" '"^l"<led which gives complete deiailthe experimental technique.
ted
of
1'. KEV TORDS (Al„h»k,„>.i —Mev neutrons-, neutron time-of- flight . neutron tot., „
11 I nii-noil,! 11 51 A 1 tMtJVT
\K} UNLIMITED.
'-^TON?]""^'''''''STRIBm-ION. DO NOT RELEASE
19. SECURITY CLASS(THIS REPORT)
UNCLASSIFIED
^1- NO. OF PAGES
160
20. SECURITY CLASS(THIS PAGE)
UNCLASSIFIED
22. Price
«3.60

NBS TECHNICAL PUBLICATIONS
PtmOBICAlS
JOURNAL OF RESEARCH rcporL, N„;„„„Bureau of Standards rcsrarch and devclopmtnt inpuysrcs matlirmaucs. and chcmislry. Comprchensivrscien^hc papers jivc complcir details of tlie worktncluding laboralorr data, experimental procedures'and tl,eon,t,cal and mathematical analpes. flluslratedwith phmocraphs, drawings, and charts. Includeslistinss of other NBS papers as issued,
Pitblisheii in two ifcliom, availablr separately:
• Physics anil Chemistry (Section A)Papers of interest primarily to scientists worlcinq inhese fields, Tht, section covers a broad ranw ofphysical and chemtcal research, with major cmdtasison standards of physical measurement, fundaincnlalconslant,s, and properties of matter. Issued six limes
'''^"^,VS?"''"'I""?''"": Domestic, ,$17.00; For-
eign, ,1121,25,
• Mathematical Sciences (Section B)
.Studies and compilations desii^ied mainly for themathematician and theoretical ptiysicisi Topics inmathematical statistics, theory of experiment desim,numerical ,inaly,is, iheoretical physics and chemistrj',logical desn.,1 and pro-rammin,- of compuiei, andcomputer svsu-ms. Short numerical tables. Issued tiuar-terly. Annual subscripiion i Domestic, $9.00; Foreiem$11.25.
',
r men.
DIMENSIONS, NBSThe best single source of infoimalion concerning theBureau's measurement, research, developmental, co-operative, and publication activities, this monthlypublication is designed for the layman and also forthe industry-oriented individual whose daily workinvolves intimate contact with science and technology—/or cngttteeri, clf^mists, l>hysicists, reiearcli man-agers, protlucl-t/etiehptneni managers, and companyMfcutiucj. Annual subscription: Domestic S6 50 For.eign, $8.25.
NONPEmODICAlS
Applidl Mathematics Scries. Mathematical tablesmanuals, and studies.
Building Science Series. Research results, testmoihods. and performance criteria of building ma-terials, components, systems, and structures.
Handbooks. Recommended codes of engineeringand industrial practice (including safety codes) de-veloped in cooperation with interested industries,professional organizations, and regul.itory bodies.
Special Publications. Proceedings of NBS confer-ences, bibliographies, annual reports, wall chartspamphlets, etc.
Monographs. M,ijor contributions to the technicalliterature on various suhjVcIs related to the Bureau'sscientific and lechnical actis'lties.
National Standard Reference Data Series.NSRDS provides tiuantitative data on the physicaland chemical properties of materials, compiled fromthe world s literaiure and critically evaluated.
Product Standards. Provide requirements for sizestypes, quality, and methods for testing s-arious indus-trial products. ,These standards are developed co-operatively with interested Government and industry.groups and provide the basis for common understand-ing of product characteristics for both buyers andsellers. Their use is voluntary.
Technical Notes. This series consists of communi-al.ons and i. pon,
i covering both ollier-agencv andNBS-sponsored worhl of limited or transitory interest.
Federal Information Processing StandardsPub icalions. This series is the official publicationwithin the Federal Govemmeni for infoilnation onstandards adopted and promulgated under the PublicLaw 89-306, and Bureau of ihe Bud.get Circular A-S6enliiled, Standardization of Data Elements and Codesin Data Systems.
Consumer Information Series. Practical informa-lion. based on NliS research and experience, cover-ing areas of interest to the consumer. Easily under-standable language and illustrations provide usefulbackground knowledge for shopping in today's tech-nological marketplace.
fllflUOGRAPHIC SUBSCRIPIIOM SERVICESThe following current-awareness and litera-ture-survey bibliographies are issued peri-odically by the Bureau:
Cryogenic Data Center Current AwarenessService (Publications and Reports of Interestin Cryogenics). A literature survey issued
5?nnn''rsubscription; Domestic.
520.00; foreign. $25.00.
Liquified Natural Gas. A literature surveyissued quarterly. Annual subscription: $20.00.
Superconducting Devices and MateriaU. Aliterature survey issued quarterly. Annualsubscription: $20.00. Send subscription ordersand remittances for the preceding biblio-graphic services to the U.S. Department ofCommerce, National Technical InformationService, Springfield, Va. 22161.
Electromagnetic Metrology Current Aware-ness Service (Abstracts of Selected Articleson Measurement Techniques and Standardsot t-lectromagnetic Quantities from D-Cto MiUimeter-Wave Frequencies). Issuedmonthly. Annual subscription: $100.00 (Spe-cial rates for multi-subscription). Sendsubscription order and remittance to thetlectroniagnetic Metrology InformationLenter, Electromagnetics Division, NationalBureau of Standards, Boulder, Colo. 80302
Order NBS publications (except Bibliographic Subscription Seivice,)

OFFICIAL BUSINESSP05TACE AND fEES PAID
U.S. OEPAnTMENI OF COMMERCE