Embed Size (px)
Citation preview
Tomingley Gold Project
Monthly Environmental Monitoring Report –
March 2015

Tomingley Gold Project
Monthly Environmental Monitoring Report –
March 2015
TABLE OF REVISIONS
Revision Number Revision Date Prepared By Comments
Revision 1 Mark Williams Submitted for Information

TABLE OF CONTENTS
1. INTRODUCTION AND SCOPE ....................................................................................................... 4
2. WEATHER FOR THIS MONTH ....................................................................................................... 4
2.1 WEATHER STATION DATA .................................................................................................. 4
TGO WEATHER DATA IS PRESENTED BELOW. ......................................................................... 4
3. MONITORING LOCATIONS ............................................................................................................ 6
FIGURE 2 INDICATES THE LOCATION OF WHERE MONITORING IS UNDERTAKEN FOR THE PROJECT. ANY ADDITIONAL MONITORING UNDERTAKEN WILL BE DISCUSSED WITHIN THE BODY OF THIS REPORT. ........................................................................................ 6
4. AIR QUALITY MONITORING ................................................................................................................ 8
3.1 PM10 MONITORING ............................................................................................................. 8
3.2 DEPOSITIONAL DUST .......................................................................................................... 9
3.3 HIGH VOLUME AIR SAMPLER - TOTAL SUSPENDED PARTICULATES .......................... 9
5. NOISE MONITORING .................................................................................................................... 10
4.1 REAL-TIME NOISE MONITORING ..................................................................................... 10
4.2 HAND HELD NOISE MONITORING ........................ ERROR! BOOKMARK NOT DEFINED.
EFFORTS HAVE BEEN MADE TO IDENTIFY THE SOURCES OF THE NOISE AND REDUCE THE IMPACT OF NOISE ON THE COMMUNITY. ..................................................
6. SURFACE WATER MONITORING ............................................................................................... 11
5.1 GUNDONG CREEK ............................................................................................................. 11
5.2 SEDIMENTATION PONDS .................................................................................................. 11
7. GROUNDWATER MONITORING .................................................................................................. 11
GROUNDWATER MONITORING IS CARRIED OUT QUARTERLY. ........................................... 11
8. BLAST MONITORING ................................................................................................................. 132 9. RESIDUE STORAGE FACILITY...……………………………………………………………………….12 WAD CYANIDE DATA 10. BIODIVERSITY MONITORING………………………………..………………………………………...12

TOMINGLEY GOLD OPERATIONS LTD MONTHLY ENVIRONMENTAL MONITORING REPORT Tomingley Gold Project March 2015
4
1. I N T R O D U C T I O N A N D S C O P E This Monthly Environmental Monitoring Report has been prepared to collate environmental monitoring data undertaken for the Tomingley Gold Project during the month of March 2015.
This report also compares data collected to targets and provides commentary on environmental issues during the month.
2. W E AT H E R F O R M A R C H 2 0 1 5
2.1 WEATHER STATION DATA
TGO weather data is presented below.
Figure 1. March 2015 wind monitoring station data

TOMINGLEY GOLD OPERATIONS LTD MONTHLY ENVIRONMENTAL MONITORING REPORT Tomingley Gold Project March 2015
5
2.2 RAINFALL DATA
Table 1. March 2015 rainfall data.
February Amount (millimetres)
11/03/2015 0.6
12/03/2015 5.4
24/03/2015 10.2
Total Approximately 16.2mm
TOMINGLEY GOLD OPERATIONS LTD MONTHLY ENVIRONMENTAL MONITORING REPORT Tomingley Gold Project March 2015
6
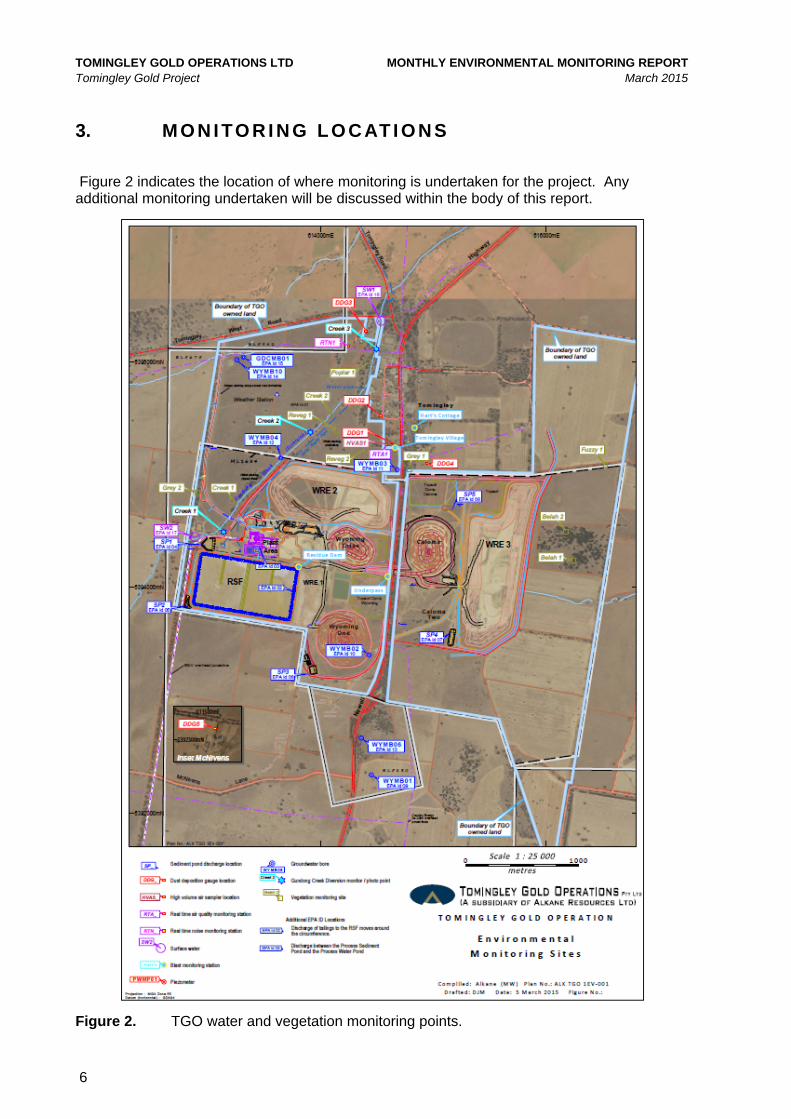
3. M O N I TO R I N G L O C AT I O N S
Figure 2 indicates the location of where monitoring is undertaken for the project. Any additional monitoring undertaken will be discussed within the body of this report.
Figure 2. TGO water and vegetation monitoring points.

TOMINGLEY GOLD OPERATIONS LTD MONTHLY ENVIRONMENTAL MONITORING REPORT Tomingley Gold Project March 2015
7
Figure 3 indicates the location of environmental and survey monitoring points on and around the Residue Storage Facility.
Figure 3. Residue Storage Facility monitoring points.

TOMINGLEY GOLD OPERATIONS LTD MONTHLY ENVIRONMENTAL MONITORING REPORT Tomingley Gold Project March 2015
8
4. A I R Q U A L I T Y M O N I TO R I N G
4.1 PM10 MONITORING
PM10 is measured via a Tapered Element Oscillating Microbalance (TEOM) located at the southern edge of the Tomingley Village. This machine transmits real-time data via the internet to a computer located on site.
The Performance Criteria for PM10 has been set at an Annual Average of 30ug/m3 and a 24-Hour Average of 50ug/m3. The 24 Hour Average was exceeded seven times this month.
Table 2. Real time dust monitoring
TOMINGLEY GOLD OPERATIONS LTD MONTHLY ENVIRONMENTAL MONITORING REPORT Tomingley Gold Project March 2015
9
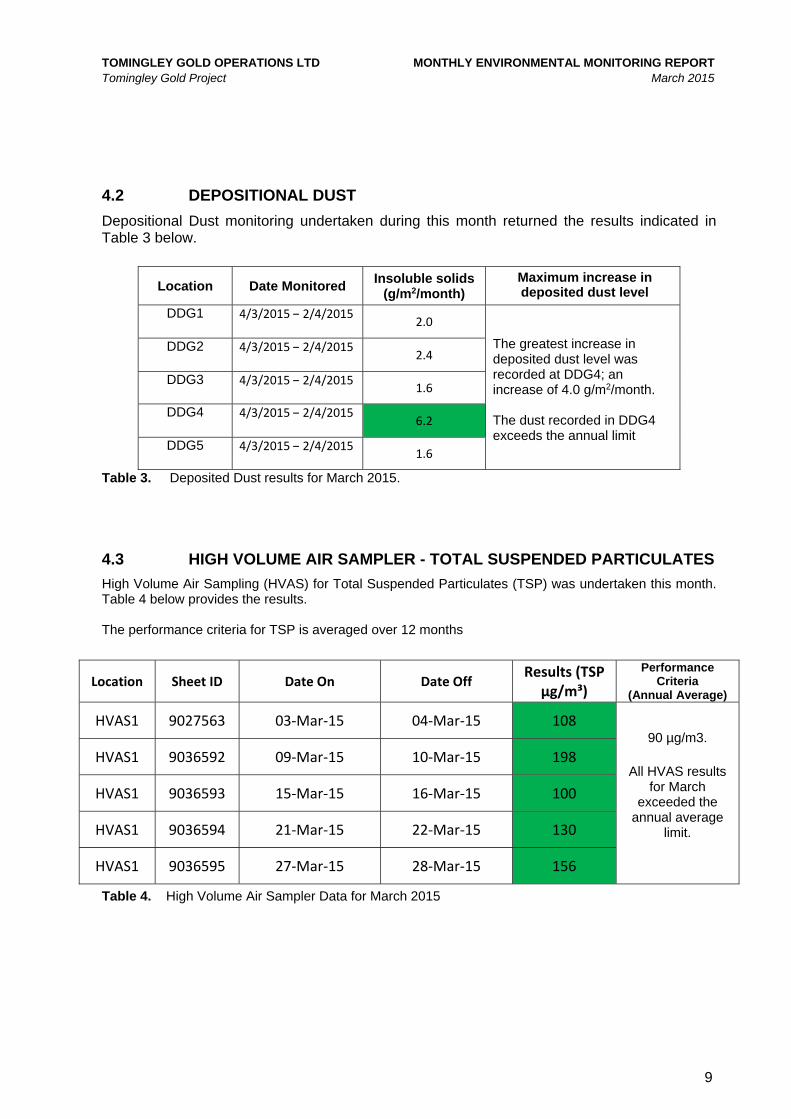
4.2 DEPOSITIONAL DUST
Depositional Dust monitoring undertaken during this month returned the results indicated in Table 3 below.
Table 3. Deposited Dust results for March 2015.
4.3 HIGH VOLUME AIR SAMPLER - TOTAL SUSPENDED PARTICULATES
High Volume Air Sampling (HVAS) for Total Suspended Particulates (TSP) was undertaken this month. Table 4 below provides the results. The performance criteria for TSP is averaged over 12 months
Table 4. High Volume Air Sampler Data for March 2015
Location Date Monitored Insoluble solids
(g/m2/month) Maximum increase in deposited dust level
DDG1 4/3/2015 – 2/4/2015
2.0 The greatest increase in deposited dust level was recorded at DDG4; an increase of 4.0 g/m2/month. The dust recorded in DDG4 exceeds the annual limit
DDG2 4/3/2015 – 2/4/20152.4
DDG3 4/3/2015 – 2/4/20151.6
DDG4 4/3/2015 – 2/4/20156.2
DDG5 4/3/2015 – 2/4/20151.6
Location Sheet ID Date On Date Off Results (TSP
µg/m³)
Performance Criteria
(Annual Average)
HVAS1 9027563 03‐Mar‐15 04‐Mar‐15 108
90 µg/m3.
All HVAS results for March
exceeded the annual average
limit.
HVAS1 9036592 09‐Mar‐15 10‐Mar‐15 198
HVAS1 9036593 15‐Mar‐15 16‐Mar‐15 100
HVAS1 9036594 21‐Mar‐15 22‐Mar‐15 130
HVAS1 9036595 27‐Mar‐15 28‐Mar‐15 156

TOMINGLEY GOLD OPERATIONS LTD MONTHLY ENVIRONMENTAL MONITORING REPORT Tomingley Gold Project March 2015
10
5. N O I S E M O N I TO R I N G
5.1 REAL-TIME NOISE MONITORING
See real-time noise monitoring data presented below.
Figure 4. Fixed, real time noise monitoring data.

TOMINGLEY GOLD OPERATIONS LTD MONTHLY ENVIRONMENTAL MONITORING REPORT Tomingley Gold Project March 2015
11
6. S U R FA C E WAT E R M O N I TO R I N G
6.1 GUNDONG CREEK
Gundong Creek did not run the reporting period and hence water sampling did not occur.
6.2 SEDIMENTATION PONDS
No discharge or water testing occurred this month.
7. G R O U N D WAT E R M O N I TO R I N G
Groundwater monitoring is carried out quarterly and was completed in March 2015. Due to an administrative error resulted in Ammonia boing overlooked for this analysis.
Parameter WYMB01 WYMB02 WYMB03 WYMB04 WYMB06 WYMB10 GDCMB01
Total suspended solids
32 <5 <5 22 38 14 378
Total dissolved solids
7760 14600 14200 18700 8650 19300 390
Ionic balance 13.9 0.27 0.90 1.98 8.86 0.97 9.22
pH (lab) 7.51 7.39 7.23 7.38 7.90 7.36 6.95
pH (Field) 10.74 8.92 8.51 10.05 11.91 9.61 9.15
Electrical conductivity (Lab)
12200 22800 21500 27300 13000 28500 506
Electrical conductivity (Field)
13030 24410 23040 29900 13890 31100 540
Ammonia
Alkalinity 362 1080 1220 1020 1160 965 55
Arsenic (mg/L)
0.005 0.003 0.002 <0.01 0.036 <0.01 0.004
Bicarbonate (mg/L)
362 1080 1220 1020 1160 965 55
Cadmium (mg/L)
<0.0001 <0.0001 <0.0001 <0.001 0.0002 <0.001 <0.0001
Calcium (dissolved)
239 134 171 254 101 220 2
Carbonate <1 <1 <1 <1 <1 <1 <1

TOMINGLEY GOLD OPERATIONS LTD MONTHLY ENVIRONMENTAL MONITORING REPORT Tomingley Gold Project March 2015
12
Parameter WYMB01 WYMB02 WYMB03 WYMB04 WYMB06 WYMB10 GDCMB01
Chromium 0.005 0.001 <0.001 <0.01 0.005 <0.01 0.017
Chloride (mg/L)
3840 6950 6420 8590 2920 2690 13
Copper 0.012 0.003 0.001 <0.01 0.018 <0.01 0.015
Cyanide (free)
<0.004 <0.004 <0.004 <0.004 <0.004 <0.004 <0.004
Cyanide (total)
0.01 <0.004 <0.004 <0.004 0.077 <0.004 <0.004
WAD Cyanide
<0.004 <0.004 <0.004 <0.004 <0.004 <0.004 <0.004
Hardness 1480 1960 2340 3060 1370 2690 13
Iron (total) 2.77 0.52 0.08 1.63 2.52 1.67 16.4
Lead 0.053 0.012 <.001 0.012 0.056 <0.01 0.012
Magnesium (mg/L)
214 395 466 588 271 521 2
Mercury (mg/L)
<0.0001 0.0002 <0.0001 <0.0001 <0.0001 0.0001 <0.0001
Nickel (mg/L) 0.006 0.002 0.041 <0.01 0.041 <0.01 0.01
Nitrate (mg/L)
0.02 0.69 0.37 0.13 0.18 0.51 14.6
Phosphate (mg/L)
0.12 0.25 0.15 >0.03 0.06 0.37 0.09
Potassium 5 10 15 18 7 23 1
Sodium (dissolved)
1820 5060 4500 5590 2230 6110 95
Sulphates (mg/L)
1360 1940 2010 2600 2070 2920 22
Zinc (mg/L) 0.097 0.027 0.034 0.095 0.133 <0.05 0.033
Standing water level below top of casing (m)
38.56 59.10 54.27 62.59 37.17 72.20 2.17

TOMINGLEY GOLD OPERATIONS LTD MONTHLY ENVIRONMENTAL MONITORING REPORT Tomingley Gold Project March 2015
13
8. B L A S T M O N I TO R I N G Blasts are carried out in all open cut pits and vibration and decibels are monitored from several locations. Below are the vibration results recorded from the monitors at Harts Cottage and Tomingley Village.
Table 5. Blast monitoring
9. R E S I D U E S TO R A G E FA C I L I T Y
Residue from the processing plant is discharged into the Residue Storage Facility or RSF. The Environmental Protection Licences dictates that the Weak Acid Dissociable (WAD) Cyanide found in this residue must be less than 20 milligrams per litre for 90% of the time and less than 30 milligrams per litre for 100% of the time. The WAD results for this month are:
Monthly average: 4.219 ppm Daily maximum: 13.295 ppm on 2 March. Daily minimum: 0.675 ppm on 25 March. Number of exceedances: zero
10. B I O D I V E R S I T Y M O N I TO R I N G The number of fauna deaths during the month was one
o A Central Bearded Dragon, Pogona vitticeps, vehicle interaction.
EventKey Event Date/Time Max R (mm/s) Max AB (Pa) Max AB (dBL) Monitor location
60842 TMG052 30/03/2015 16:48 0.23 3.79 105.5 Harts Cottage
60817 TMG051 28/03/2015 13:02 0.19 3.11 103.8 Harts Cottage
60646 TMG050 23/03/2015 13:04 0.18 2.56 102.2 Harts Cottage
60645 TMG04Z 23/03/2015 12:57 0.27 3.1 103.8 Harts Cottage
60634 TMG04Y 21/03/2015 12:58 0.28 3.51 104.9 Harts Cottage
60563 TMG04X 18/03/2015 12:59 0.13 1.09 94.7 Harts Cottage
60529 TMG04W 17/03/2015 13:01 0.27 1.6 98 Harts Cottage
60507 TMG04V 16/03/2015 13:00 0.18 1.06 94.5 Harts Cottage
60376 TMG04U 9/03/2015 12:55 0.26 6.53 110.3 Harts Cottage
60332 TMG04T 6/03/2015 12:56 0.56 11.68 115.3 Harts Cottage
60285 TMG04S 4/03/2015 13:05 0.43 2.91 103.3 Harts Cottage
60842 TMG052 30/03/2015 16:48 0.26 4 106 Tomingley Village
60817 TMG051 28/03/2015 13:02 0.29 3.78 105.5 Tomingley Village
60646 TMG050 23/03/2015 13:04 0.21 2.23 100.9 Tomingley Village
60645 TMG04Z 23/03/2015 12:57 0.32 3.2 104.1 Tomingley Village
60634 TMG04Y 21/03/2015 12:58 0.3 4.75 107.5 Tomingley Village
60563 TMG04X 18/03/2015 12:59 0.16 1.43 97.1 Tomingley Village
60529 TMG04W 17/03/2015 13:01 0.35 1.9 99.5 Tomingley Village
60507 TMG04V 16/03/2015 13:00 0.2 1.55 97.8 Tomingley Village
60376 TMG04U 9/03/2015 12:55 0.31 7.75 111.8 Tomingley Village
60332 TMG04T 6/03/2015 12:56 0.53 15.49 117.8 Tomingley Village
60285 TMG04S 4/03/2015 13:05 0.49 3.67 105.3 Tomingley Village
TOMINGLEY GOLD OPERATIONS LTD MONTHLY ENVIRONMENTAL MONITORING REPORT Tomingley Gold Project March 2015
14
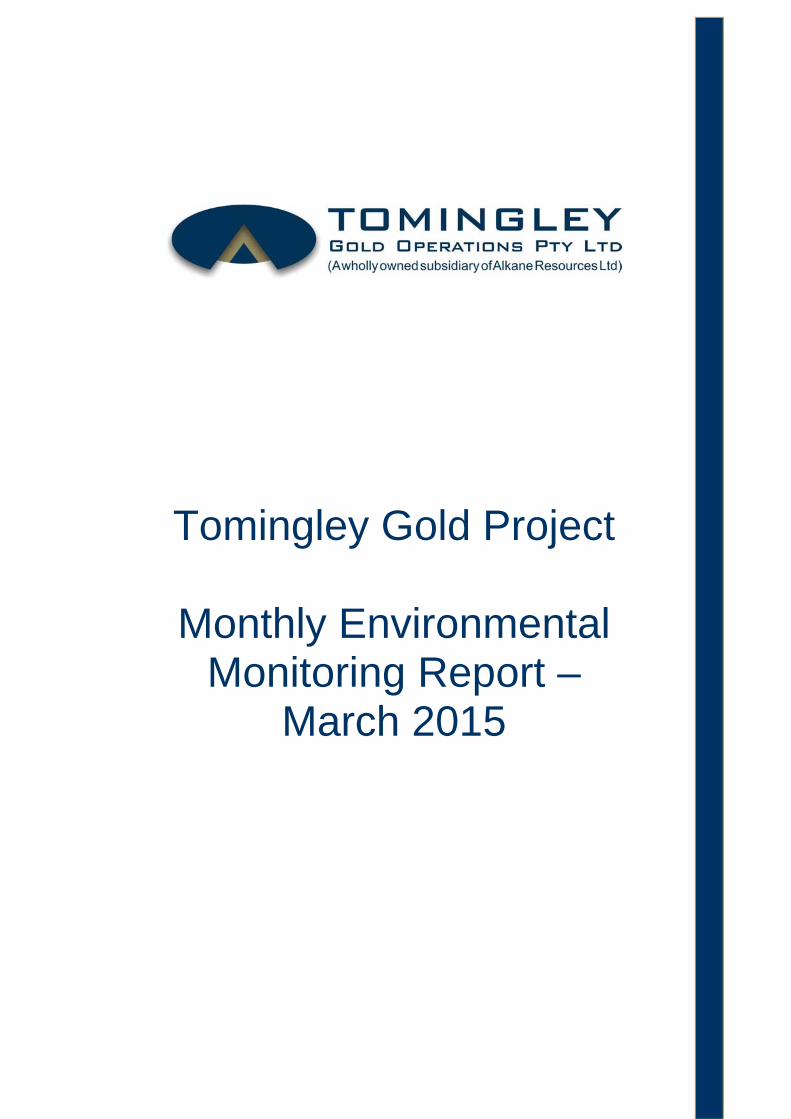
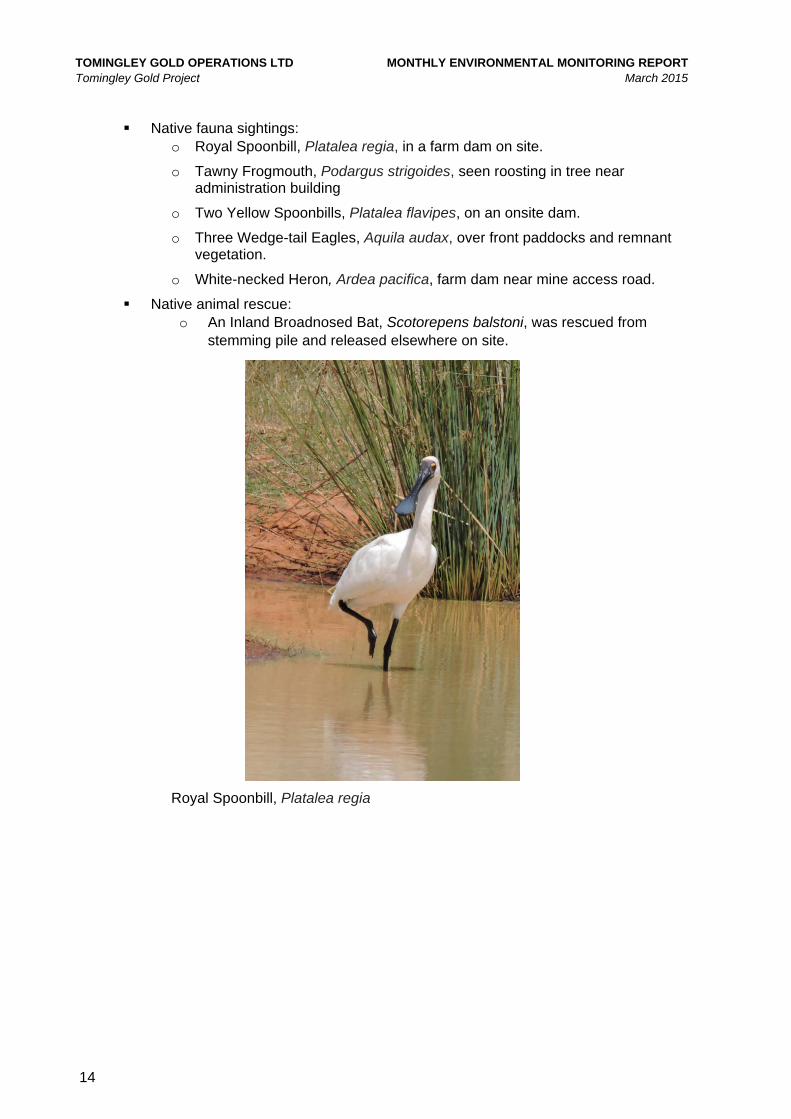
Native fauna sightings: o Royal Spoonbill, Platalea regia, in a farm dam on site.
o Tawny Frogmouth, Podargus strigoides, seen roosting in tree near administration building
o Two Yellow Spoonbills, Platalea flavipes, on an onsite dam.
o Three Wedge-tail Eagles, Aquila audax, over front paddocks and remnant vegetation.
o White-necked Heron, Ardea pacifica, farm dam near mine access road.
Native animal rescue: o An Inland Broadnosed Bat, Scotorepens balstoni, was rescued from
stemming pile and released elsewhere on site.
Royal Spoonbill, Platalea regia

TOMINGLEY GOLD OPERATIONS LTD MONTHLY ENVIRONMENTAL MONITORING REPORT Tomingley Gold Project March 2015
15
Tawny Frogmouth, Podargus strigoides