Embed Size (px)
Citation preview
ISSN 0388-0605
MONTHLY FINANCE REVIEW
June 2017
No. 527
Policy Research Institute
MINISTRY OF FINANCE
JAPAN
MONTHLY FINANCE REVIEW
June. 2017 (No.527)
CONTENTS
STATISTICS(Released by Ministry of Finance)
A. Balance of the Fiscal Loan Fund (20 Apr.) ............................................................. 2
B. Trade Statistics (27 Apr.) ....................................................................................... 4
C. Taxes and Stamp Revenues (28 Apr.) .................................................................... 8
D. Receipts and Payments of the Treasury Funds with the Private Sector (2 May.) ....... 12
E. Official Reserve Assets at the End of Periods (10 May.) ........................................ 16
F. Balance of Payments (11 May.) ........................................................................... 18
G. International Transaction in Securities (Monthly; Based on reports from
designated major investors) (11 May.) .................................................................. 22
H. The balance of Offshore Accounts (18 May.) ........................................................ 24
I. Central Government Debt (10 May.) ................................................................. 26
PUBLIC RELATIONS & PRESS RELEASE A. The Joint Statement of The 20th ASEAN+3 Finance Ministers’ Meeting
(5 May 2017 / Yokohama, Japan) (5 May.) ............................................................. 30
B. Bilateral Swap Arrangement between Japan and Malaysia (5 May.) ....................... 38
C. Signing of the fourth Bilateral Swap Arrangement between Japan and Thailand
(5 May.) ...................................................................................................................... 39
D. 17th Trilateral Finance Ministers and Central Bank Governors' Meeting Joint
Message(May 5, 2017, Yokohama, Japan) (5 May.) ................................................ 40
E. Joint Press Release of the Sixth China-Japan Finance Dialogue (6 May.) .............. 43
F. Statement at the 50th Annual Meeting of the ADB (Yokohama, Japan / May 6,
2017) (6 May.) .......................................................................................................... 45
G. Statement at the 26th Annual Meeting of the EBRD (Nicosia, Cyprus / May 10,
2017) (10 May.) ........................................................................................................ 51
H. COMMUNIQUÉ ,G7 Finance Ministers and Central Banks’ Governors Meeting
(Bari, Italy, May 12-13, 2017) (13 May.) .................................................................. 55
I. Tax Convention with Estonia Agreed in Principle (15 May.) ..................................... 63
J. New Tax Convention with Denmark Agreed in Principle (15 May.) ......................... 64
K. Statement at the Annual Meetings of 52nd AfDB / 43rd AfDF (Ahmedabad, India
/ May 23, 2017) (23 May.) ....................................................................................... 65
L. Tax Convention with Iceland Agreed in Principle (29 May.) .................................... 72
APPENDIX
A. Quarterly Estimates of GDP, Jan.-Mar. 2017 (The 1st preliminary) (18 May.) ....... 74
B. Monthly Economic Report (May) (24 May.) .............................................................. 76
MAIN ECONOMIC INDICATORS OF JAPAN .......................................................... 80

STATISTICS
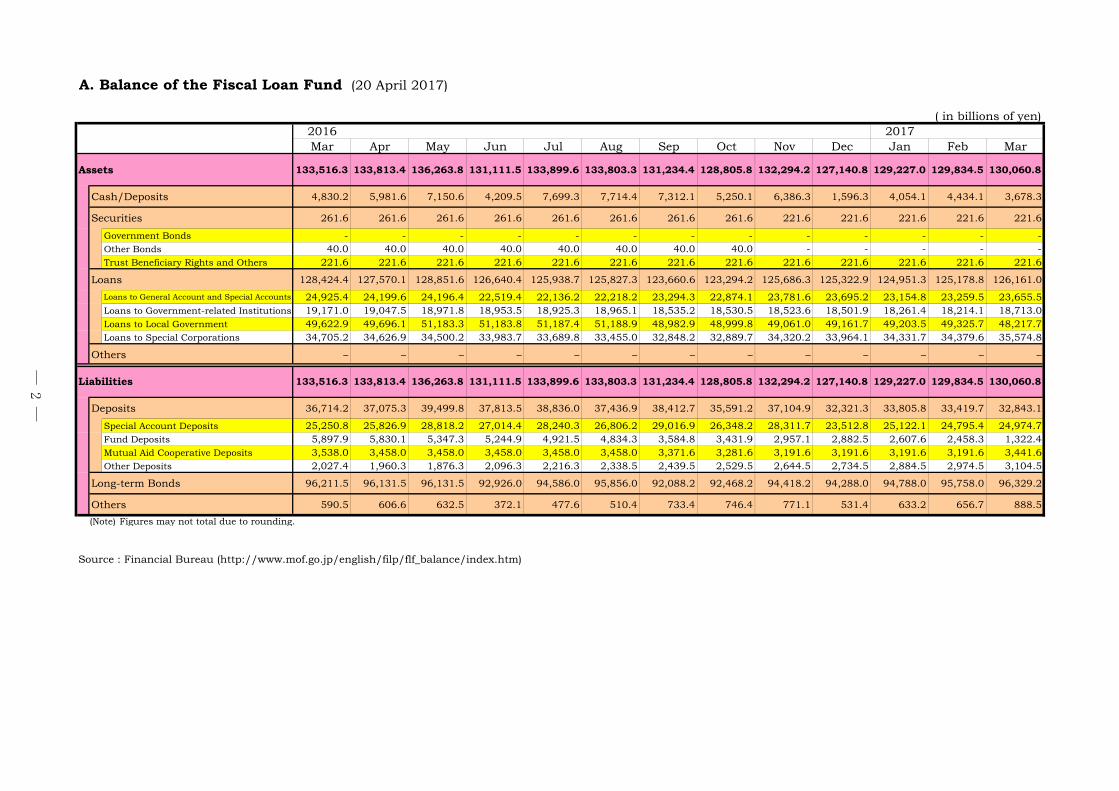
A. Balance of the Fiscal Loan Fund (20 April 2017)
( in billions of yen)2016 2017Mar Apr May Jun Jul Aug Sep Oct Nov Dec Jan Feb Mar
Assets 133,516.3 133,813.4 136,263.8 131,111.5 133,899.6 133,803.3 131,234.4 128,805.8 132,294.2 127,140.8 129,227.0 129,834.5 130,060.8
Cash/Deposits 4,830.2 5,981.6 7,150.6 4,209.5 7,699.3 7,714.4 7,312.1 5,250.1 6,386.3 1,596.3 4,054.1 4,434.1 3,678.3
Securities 261.6 261.6 261.6 261.6 261.6 261.6 261.6 261.6 221.6 221.6 221.6 221.6 221.6
Government Bonds - - - - - - - - - - - - -Other Bonds 40.0 40.0 40.0 40.0 40.0 40.0 40.0 40.0 - - - - -Trust Beneficiary Rights and Others 221.6 221.6 221.6 221.6 221.6 221.6 221.6 221.6 221.6 221.6 221.6 221.6 221.6
Loans 128,424.4 127,570.1 128,851.6 126,640.4 125,938.7 125,827.3 123,660.6 123,294.2 125,686.3 125,322.9 124,951.3 125,178.8 126,161.0
Loans to General Account and Special Accounts 24,925.4 24,199.6 24,196.4 22,519.4 22,136.2 22,218.2 23,294.3 22,874.1 23,781.6 23,695.2 23,154.8 23,259.5 23,655.5Loans to Government-related Institutions 19,171.0 19,047.5 18,971.8 18,953.5 18,925.3 18,965.1 18,535.2 18,530.5 18,523.6 18,501.9 18,261.4 18,214.1 18,713.0Loans to Local Government 49,622.9 49,696.1 51,183.3 51,183.8 51,187.4 51,188.9 48,982.9 48,999.8 49,061.0 49,161.7 49,203.5 49,325.7 48,217.7Loans to Special Corporations 34,705.2 34,626.9 34,500.2 33,983.7 33,689.8 33,455.0 32,848.2 32,889.7 34,320.2 33,964.1 34,331.7 34,379.6 35,574.8
Others – – – – – – – – – – – – –
Liabilities 133,516.3 133,813.4 136,263.8 131,111.5 133,899.6 133,803.3 131,234.4 128,805.8 132,294.2 127,140.8 129,227.0 129,834.5 130,060.8
Deposits 36,714.2 37,075.3 39,499.8 37,813.5 38,836.0 37,436.9 38,412.7 35,591.2 37,104.9 32,321.3 33,805.8 33,419.7 32,843.1
Special Account Deposits 25,250.8 25,826.9 28,818.2 27,014.4 28,240.3 26,806.2 29,016.9 26,348.2 28,311.7 23,512.8 25,122.1 24,795.4 24,974.7Fund Deposits 5,897.9 5,830.1 5,347.3 5,244.9 4,921.5 4,834.3 3,584.8 3,431.9 2,957.1 2,882.5 2,607.6 2,458.3 1,322.4Mutual Aid Cooperative Deposits 3,538.0 3,458.0 3,458.0 3,458.0 3,458.0 3,458.0 3,371.6 3,281.6 3,191.6 3,191.6 3,191.6 3,191.6 3,441.6Other Deposits 2,027.4 1,960.3 1,876.3 2,096.3 2,216.3 2,338.5 2,439.5 2,529.5 2,644.5 2,734.5 2,884.5 2,974.5 3,104.5
Long-term Bonds 96,211.5 96,131.5 96,131.5 92,926.0 94,586.0 95,856.0 92,088.2 92,468.2 94,418.2 94,288.0 94,788.0 95,758.0 96,329.2
Others 590.5 606.6 632.5 372.1 477.6 510.4 733.4 746.4 771.1 531.4 633.2 656.7 888.5
(Note) Figures may not total due to rounding.
Source : Financial Bureau (http://www.mof.go.jp/english/filp/flf_balance/index.htm)
― 2 ―
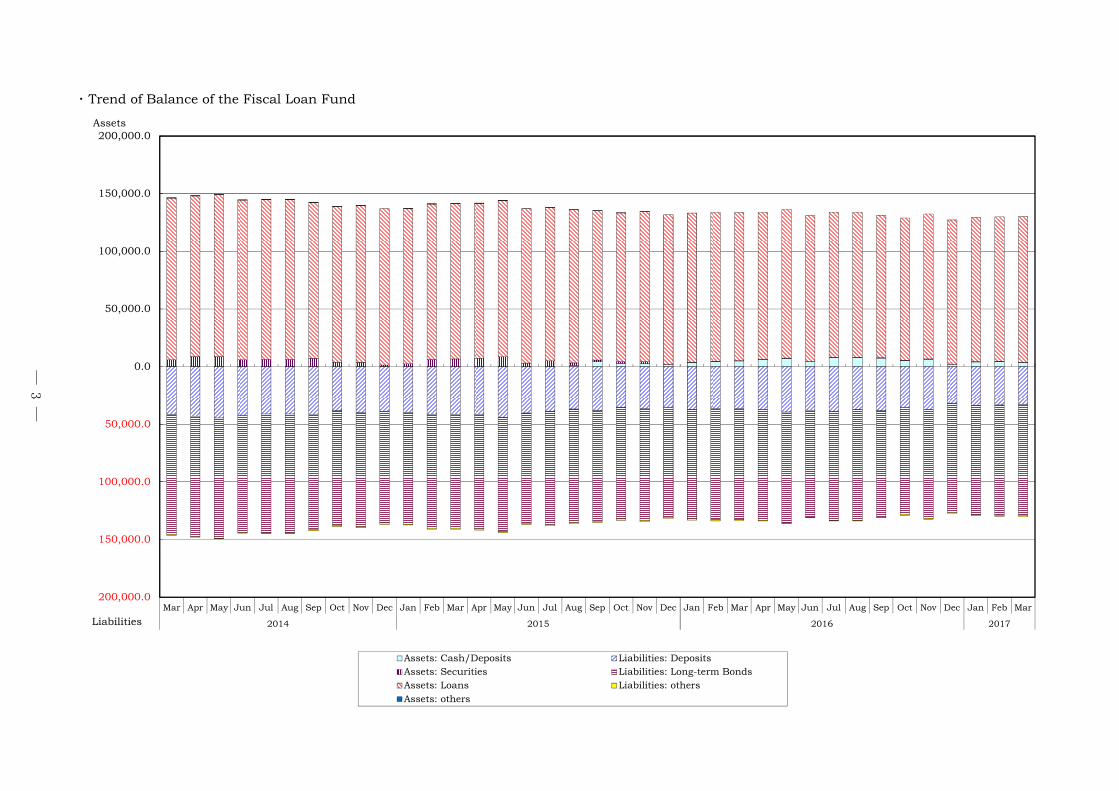
・ Trend of Balance of the Fiscal Loan Fund
200,000.0
150,000.0
100,000.0
50,000.0
0.0
50,000.0
100,000.0
150,000.0
200,000.0
Mar Apr May Jun Jul Aug Sep Oct Nov Dec Jan Feb Mar Apr May Jun Jul Aug Sep Oct Nov Dec Jan Feb Mar Apr May Jun Jul Aug Sep Oct Nov Dec Jan Feb Mar
2014 2015 2016 2017
Assets: Cash/Deposits Liabilities: DepositsAssets: Securities Liabilities: Long-term BondsAssets: Loans Liabilities: othersAssets: others
Assets
Liabilities
― 3 ―
B. Trade Statistics (27 April 2017)
1.Value of Exports and Imports by Area (Country) ( in 100 millions of yen )
2016* 2017Mar Apr May Jun Jul Aug Sep Oct Nov Dec Jan** Feb** Mar(P)
Total Exports 64,568 58,896 50,919 60,253 57,284 53,164 59,689 58,702 59,564 66,789 54,220 63,475 72,296Imports 57,119 50,783 51,393 53,389 52,239 53,510 54,824 53,891 58,099 60,430 65,139 55,364 66,156Balance 7,449 8,113 -473 6,865 5,045 -346 4,866 4,812 1,465 6,359 -10,919 8,111 6,140
Asia Exports 33,185 30,728 27,691 31,505 30,439 29,273 31,215 31,225 32,356 37,401 28,873 34,864 38,607Imports 29,110 25,693 25,566 27,128 25,615 26,329 28,653 27,339 28,865 29,218 33,608 24,884 32,178Balance 4,075 5,034 2,125 4,377 4,825 2,943 2,562 3,886 3,491 8,183 -4,735 9,980 6,428
P.R.China Exports 11,161 10,349 9,020 10,438 10,297 9,691 9,930 10,748 11,032 13,011 8,870 11,966 12,995Imports 14,684 13,314 13,039 13,800 12,973 13,139 15,406 14,175 14,886 14,845 17,976 10,809 16,194Balance -3,524 -2,965 -4,019 -3,361 -2,676 -3,448 -5,477 -3,427 -3,854 -1,835 -9,106 1,157 -3,200
Hong Kong Exports 3,296 2,962 2,661 3,255 2,821 2,662 3,322 2,955 3,472 3,670 2,627 3,622 3,599Imports 340 105 89 325 86 84 328 89 238 151 110 85 348Balance 2,956 2,857 2,572 2,930 2,735 2,577 2,994 2,866 3,234 3,520 2,517 3,538 3,250
Taiwan Exports 3,626 3,312 3,365 3,701 3,588 3,527 3,770 3,667 3,517 4,213 3,235 3,921 4,060Imports 2,111 2,017 1,996 1,917 2,054 2,011 2,076 1,997 2,139 2,146 2,350 2,033 2,337Balance 1,515 1,296 1,368 1,784 1,534 1,516 1,694 1,670 1,378 2,068 885 1,889 1,723
Korea Exports 4,392 4,120 3,791 3,988 4,090 4,108 4,284 4,185 4,304 5,068 4,447 4,741 5,665Imports 2,279 2,016 2,196 2,259 2,200 2,165 2,145 2,266 2,415 2,742 2,718 2,457 2,678Balance 2,112 2,104 1,595 1,729 1,890 1,944 2,139 1,919 1,889 2,326 1,729 2,284 2,986
Singapore Exports 1,951 1,821 1,639 2,033 1,640 1,603 1,665 1,573 1,904 2,414 2,096 1,909 2,446Imports 732 630 603 714 610 691 649 701 676 669 766 855 848Balance 1,219 1,190 1,036 1,319 1,030 912 1,016 871 1,228 1,745 1,330 1,055 1,598
Thailand Exports 2,591 2,534 2,129 2,545 2,471 2,388 2,538 2,550 2,458 2,735 2,370 2,616 2,824Imports 1,933 1,718 1,700 1,866 1,717 1,757 1,723 1,867 1,892 1,903 1,937 1,918 2,162Balance 658 816 429 679 753 631 816 683 566 832 433 699 662
Malaysia Exports 1,239 1,150 1,003 1,083 1,079 1,016 1,103 1,062 1,100 1,197 1,001 1,117 1,314Imports 1,877 1,362 1,397 1,494 1,347 1,472 1,513 1,431 1,627 1,698 1,957 1,809 1,939Balance -638 -213 -395 -411 -268 -456 -410 -369 -527 -501 -956 -692 -625
Indonesia Exports 1,134 1,005 992 847 1,072 962 1,087 1,067 1,085 1,153 992 1,177 1,372Imports 1,844 1,536 1,495 1,556 1,560 1,550 1,532 1,597 1,735 1,717 2,013 1,714 1,872Balance -709 -531 -503 -709 -487 -588 -445 -530 -650 -564 -1,022 -537 -500
Philippines Exports 974 939 872 935 940 950 956 960 924 966 876 959 1,192Imports 813 779 802 825 780 866 845 893 844 851 828 834 945Balance 162 160 69 110 160 84 112 67 80 115 48 124 247
Vietnam Exports 1,244 1,221 1,069 1,331 1,178 1,096 1,186 1,228 1,203 1,414 1,059 1,392 1,416Imports 1,411 1,323 1,388 1,472 1,414 1,630 1,479 1,448 1,526 1,603 1,792 1,329 1,713Balance -167 -103 -319 -142 -235 -534 -293 -221 -324 -189 -733 63 -297
India Exports 866 683 630 778 720 744 794 661 743 835 728 790 976Imports 466 410 450 419 406 402 388 402 424 426 526 490 519Balance 401 273 180 360 314 342 406 259 319 410 202 300 457
(Asia NIEs) Exports 13,264 12,215 11,456 12,977 12,139 11,901 13,041 12,380 13,197 15,365 12,404 14,194 15,770Imports 5,462 4,768 4,885 5,216 4,950 4,951 5,198 5,054 5,468 5,707 5,944 5,429 6,212Balance 7,802 7,447 6,572 7,762 7,189 6,950 7,842 7,326 7,729 9,658 6,461 8,765 9,557
(ASEAN) Exports 9,298 8,823 7,827 8,902 8,508 8,119 8,680 8,578 8,849 10,045 8,509 9,302 10,709Imports 9,017 7,662 7,633 8,266 7,749 8,362 8,145 8,277 8,618 8,761 9,732 8,835 9,885Balance 280 1,161 194 637 759 -243 535 300 231 1,285 -1,223 467 823
Oceania Exports 1,586 1,690 1,561 1,818 1,833 1,752 1,743 1,756 1,615 1,543 1,866 2,107 1,964Imports 3,209 2,952 2,686 2,678 3,050 2,995 3,264 3,299 3,730 3,920 3,962 3,889 4,198Balance -1,623 -1,262 -1,125 -861 -1,217 -1,243 -1,521 -1,543 -2,115 -2,377 -2,096 -1,782 -2,234
Australia Exports 1,193 1,303 1,214 1,320 1,426 1,410 1,396 1,296 1,298 1,229 1,424 1,499 1,574Imports 2,764 2,530 2,291 2,236 2,601 2,604 2,821 2,907 3,237 3,482 3,597 3,492 3,702Balance -1,571 -1,226 -1,077 -916 -1,175 -1,195 -1,424 -1,611 -1,939 -2,253 -2,173 -1,992 -2,127
New Zealand Exports 201 196 160 189 223 176 218 218 222 245 176 219 245Imports 227 218 240 276 224 203 180 198 204 206 179 166 224Balance -26 -22 -80 -86 -2 -26 38 20 18 39 -3 52 21
North America Exports 13,934 12,797 10,347 12,934 12,477 10,379 12,558 12,774 12,864 14,449 11,142 13,126 14,796Imports 7,104 6,696 7,020 6,889 6,659 6,904 6,637 7,009 7,219 7,483 7,576 6,926 8,413Balance 6,829 6,101 3,327 6,044 5,818 3,475 5,921 5,765 5,645 6,966 3,566 6,200 6,383
U S A Exports 13,074 12,006 9,703 12,181 11,825 9,713 11,675 11,970 12,112 13,698 10,540 12,232 13,532Imports 6,235 5,879 6,249 6,007 5,896 6,139 5,808 6,177 6,309 6,507 6,552 6,121 7,254Balance 6,839 6,126 3,454 6,174 5,929 3,574 5,867 5,793 5,804 7,191 3,988 6,111 6,278
Canada Exports 859 791 644 752 652 666 883 805 752 750 602 894 1,264Imports 865 811 767 876 757 761 825 828 906 970 1,019 801 1,153Balance -5 -20 -123 -124 -105 -95 58 -24 -155 -220 -417 93 111
Latin America Exports 3,151 2,688 2,095 3,024 2,029 2,110 2,879 2,274 2,276 2,188 2,718 2,333 3,538Imports 2,242 2,119 2,175 2,170 2,463 1,971 2,069 2,013 2,546 2,349 2,576 2,569 2,575Balance 909 569 -80 854 -434 139 811 262 -270 -161 142 -236 963
Brazil Exports 320 238 257 272 261 259 237 229 230 277 234 267 320Imports 736 627 566 593 519 468 522 523 631 576 492 560 590Balance -416 -389 -309 -321 -258 -209 -286 -294 -401 -299 -258 -293 -270
― 4 ―
2016* 2017Mar Apr May Jun Jul Aug Sep Oct Nov Dec Jan** Feb** Mar(P)
Mexico Exports 961 1,053 814 948 946 926 1,056 1,026 1,023 1,088 871 980 1,188Imports 459 407 463 430 631 480 475 489 710 669 563 443 619Balance 503 646 351 518 316 446 581 537 313 419 308 537 569
Chile Exports 156 139 134 139 113 129 172 137 115 171 211 184 135Imports 484 474 524 540 442 484 396 381 458 451 826 692 478Balance -328 -335 -389 -401 -330 -355 -225 -244 -343 -280 -615 -508 -343
West Europe Exports 8,124 7,156 5,883 6,842 6,759 6,094 7,003 6,769 6,534 7,242 6,137 7,209 8,670Imports 7,336 6,976 6,949 7,048 7,141 7,182 6,925 7,265 7,578 7,875 7,377 7,113 7,931Balance 788 180 -1,066 -207 -382 -1,089 78 -497 -1,044 -634 -1,239 95 738
Germany Exports 1,670 1,732 1,406 1,617 1,607 1,445 1,632 1,684 1,474 1,798 1,468 1,669 1,888Imports 2,085 1,867 1,984 1,839 1,904 1,997 2,070 1,962 1,999 2,172 2,036 1,980 2,174Balance -415 -135 -578 -222 -297 -551 -438 -278 -524 -374 -569 -311 -286
United Exports 1,618 1,183 1,088 1,273 1,318 1,093 1,401 1,045 1,202 1,164 1,006 1,280 1,737Kingdom Imports 694 590 547 532 513 556 483 763 615 596 603 561 729
Balance 924 592 540 741 805 536 918 282 587 568 403 720 1,008France Exports 605 580 480 513 534 525 538 544 557 612 466 674 595
Imports 922 907 956 810 858 826 1,010 883 969 1,039 968 926 865Balance -317 -327 -476 -297 -324 -300 -472 -339 -412 -427 -502 -252 -270
Netherlands Exports 1,112 1,207 958 1,029 1,072 953 1,149 1,045 966 1,217 1,019 1,154 1,222Imports 275 189 267 193 184 196 259 167 197 178 189 193 284Balance 837 1,018 691 836 888 757 890 878 769 1,039 830 961 937
Italy Exports 939 411 318 357 375 313 419 385 406 404 342 446 474Imports 795 688 779 833 864 838 710 732 878 880 814 805 934Balance 145 -277 -462 -476 -489 -525 -291 -347 -472 -476 -472 -359 -460
Belgium Exports 590 546 472 549 492 459 512 493 480 568 497 568 595Imports 207 240 232 197 261 154 196 264 203 240 254 202 225Balance 383 307 240 352 231 305 316 229 277 328 243 366 370
Switzerland Exports 326 234 203 302 268 339 255 439 324 275 253 297 764Imports 633 889 521 699 644 668 676 725 583 847 674 650 777Balance -307 -656 -318 -397 -375 -329 -422 -287 -259 -572 -421 -353 -13
Sweden Exports 138 154 110 151 134 125 123 124 122 135 110 138 148Imports 176 207 201 173 243 194 175 205 231 201 232 195 222Balance -38 -53 -90 -22 -108 -69 -52 -82 -108 -66 -122 -57 -74
Ireland Exports 91 77 79 60 48 50 61 76 74 69 66 62 83Imports 366 320 334 681 591 670 299 581 734 544 346 540 452Balance -275 -244 -255 -621 -543 -620 -239 -505 -660 -475 -280 -478 -368
Spain Exports 261 295 223 274 273 236 262 260 236 273 193 239 299Imports 337 334 342 344 333 298 340 317 323 303 387 266 360Balance -76 -40 -119 -70 -60 -62 -78 -56 -87 -31 -193 -27 -60
Central and Exports 1,156 1,030 916 1,278 1,205 1,003 1,145 1,171 984 1,041 962 1,165 1,242East Europe, Imports 1,827 1,371 1,417 1,399 1,390 1,658 1,586 1,501 1,615 1,924 1,960 1,997 1,924Russia Balance -671 -342 -501 -121 -186 -655 -441 -330 -632 -883 -999 -832 -682
Russia Exports 487 422 383 504 554 429 519 558 429 431 435 527 540Imports 1,257 888 973 899 887 1,097 1,026 951 1,092 1,330 1,304 1,464 1,301Balance -771 -465 -590 -395 -332 -668 -507 -393 -663 -899 -869 -937 -761
(EU) Exports 7,902 7,025 5,779 6,627 6,656 5,907 6,871 6,505 6,333 7,110 5,966 7,007 8,010Imports 6,841 6,228 6,517 6,511 6,677 6,734 6,503 6,804 7,181 7,159 6,914 6,596 7,327Balance 1,061 797 -738 116 -22 -827 368 -299 -849 -49 -948 411 683
Middle East Exports 2,545 2,070 1,800 2,197 1,860 1,933 2,448 2,089 2,160 2,231 1,750 2,026 2,480Imports 5,588 4,351 4,983 5,396 5,479 5,866 5,135 4,823 5,904 6,757 7,400 7,259 8,133Balance -3,043 -2,281 -3,183 -3,199 -3,619 -3,933 -2,687 -2,734 -3,745 -4,526 -5,650 -5,232 -5,654
U A E Exports 829 634 536 832 662 588 822 702 742 841 659 784 982Imports 1,537 1,038 1,499 1,612 1,809 1,688 1,522 1,155 1,766 2,056 2,009 1,889 1,993Balance -708 -404 -963 -780 -1,147 -1,100 -700 -453 -1,025 -1,215 -1,350 -1,106 -1,010
Saudi Arabia Exports 515 568 484 442 358 392 436 378 400 444 271 289 407Imports 1,769 1,559 1,713 1,677 1,670 1,968 1,500 1,801 2,065 2,402 2,817 2,653 3,097Balance -1,254 -991 -1,229 -1,235 -1,311 -1,576 -1,064 -1,423 -1,665 -1,958 -2,545 -2,364 -2,690
Kuwait Exports 173 122 121 147 120 150 193 170 158 157 143 140 128Imports 466 309 368 322 334 402 386 365 435 446 635 689 601Balance -293 -188 -246 -175 -213 -252 -193 -196 -277 -289 -492 -549 -472
Iran Exports 42 51 32 36 44 63 75 59 66 110 49 56 160Imports 252 3 281 466 428 277 449 243 367 366 436 484 493Balance -211 47 -249 -431 -384 -214 -374 -184 -302 -256 -387 -427 -334
Africa Exports 887 737 626 656 681 620 698 644 775 694 773 645 1,000Imports 702 624 596 680 442 604 555 641 641 903 680 727 802Balance 185 112 30 -24 239 16 143 3 134 -209 92 -82 198
South Africa Exports 220 215 162 207 212 189 230 202 174 237 177 227 236Imports 322 359 347 387 270 410 406 417 380 508 337 372 426Balance -102 -144 -185 -179 -58 -221 -177 -215 -206 -271 -160 -145 -190
(Notes) 1. The value of exports is based upon the F.O.B.value, while the value of imports is based upon the C. I. F.value.2."Singapore" is included in both "ASIA NIEs" and "ASEAN".3."(P)" means Provisional. "*" and "**"means "fixed" and "detailed".
― 5 ―
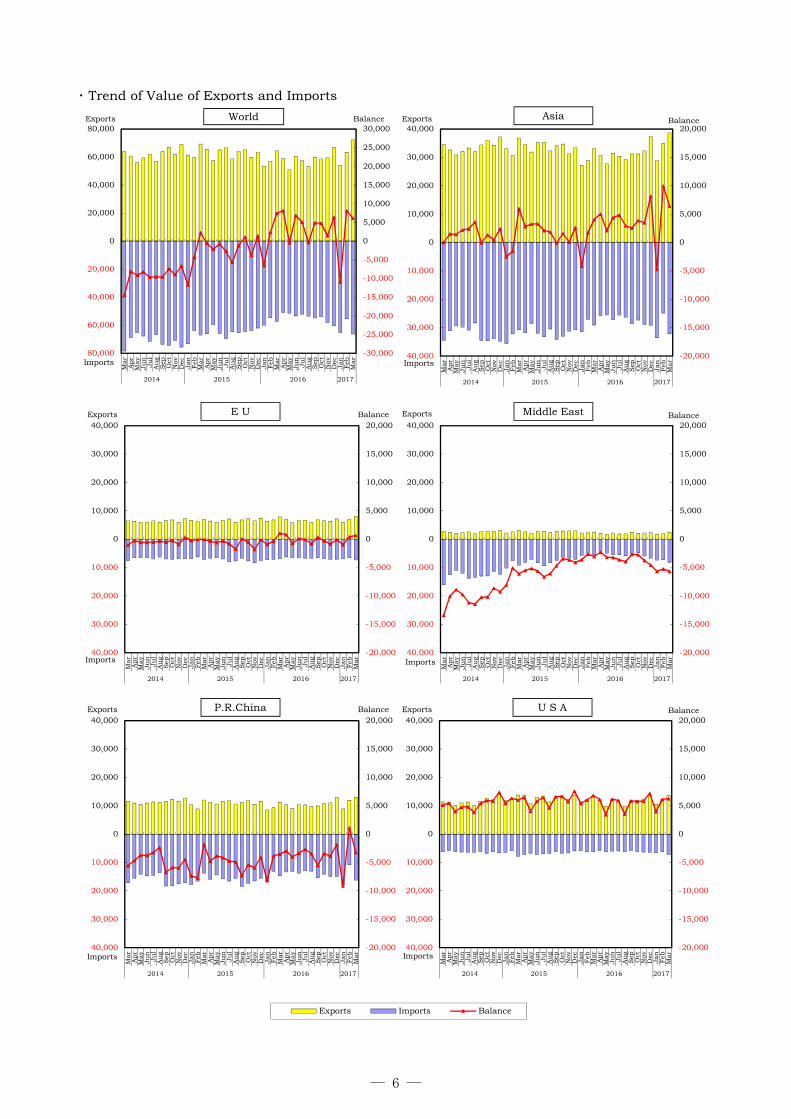
・ Trend of Value of Exports and Imports
-30,000
-25,000
-20,000
-15,000
-10,000
-5,000
0
5,000
10,000
15,000
20,000
25,000
30,000
80,000
60,000
40,000
20,000
0
20,000
40,000
60,000
80,000M
ar
Apr
May
Ju
nJu
lA
ug
Sep Oct
Nov
Dec
Jan
Feb
Mar
Apr
May
Ju
nJu
lA
ug
Sep Oct
Nov
Dec
Jan
Feb
Mar
Apr
May
Ju
nJu
lA
ug
Sep Oct
Nov
Dec
Jan
Feb
Mar
2014 2015 2016 2017
Exports Imports Balance
Exports
Imports
World Balance
-20,000
-15,000
-10,000
-5,000
0
5,000
10,000
15,000
20,000
40,000
30,000
20,000
10,000
0
10,000
20,000
30,000
40,000
Mar
Apr
May
Ju
nJu
lA
ug
Sep Oct
Nov
Dec
Jan
Feb
Mar
Apr
May
Ju
nJu
lA
ug
Sep Oct
Nov
Dec
Jan
Feb
Mar
Apr
May
Ju
nJu
lA
ug
Sep Oct
Nov
Dec
Jan
Feb
Mar
2014 2015 2016 2017
AsiaExports
Imports
Balance
-20,000
-15,000
-10,000
-5,000
0
5,000
10,000
15,000
20,000
40,000
30,000
20,000
10,000
0
10,000
20,000
30,000
40,000
Mar
Apr
May
Ju
nJu
lA
ug
Sep Oct
Nov
Dec
Jan
Feb
Mar
Apr
May
Ju
nJu
lA
ug
Sep Oct
Nov
Dec
Jan
Feb
Mar
Apr
May
Ju
nJu
lA
ug
Sep Oct
Nov
Dec
Jan
Feb
Mar
2014 2015 2016 2017
E UExports
Imports
Balance
-20,000
-15,000
-10,000
-5,000
0
5,000
10,000
15,000
20,000
40,000
30,000
20,000
10,000
0
10,000
20,000
30,000
40,000
Mar
Apr
May
Ju
nJu
lA
ug
Sep Oct
Nov
Dec
Jan
Feb
Mar
Apr
May
Ju
nJu
lA
ug
Sep Oct
Nov
Dec
Jan
Feb
Mar
Apr
May
Ju
nJu
lA
ug
Sep Oct
Nov
Dec
Jan
Feb
Mar
2014 2015 2016 2017
Middle EastExports
Imports
Balance
-20,000
-15,000
-10,000
-5,000
0
5,000
10,000
15,000
20,000
40,000
30,000
20,000
10,000
0
10,000
20,000
30,000
40,000
Mar
Apr
May
Ju
nJu
lA
ug
Sep Oct
Nov
Dec
Jan
Feb
Mar
Apr
May
Ju
nJu
lA
ug
Sep Oct
Nov
Dec
Jan
Feb
Mar
Apr
May
Ju
nJu
lA
ug
Sep Oct
Nov
Dec
Jan
Feb
Mar
2014 2015 2016 2017
P.R.ChinaExports
Imports
Balance
-20,000
-15,000
-10,000
-5,000
0
5,000
10,000
15,000
20,000
40,000
30,000
20,000
10,000
0
10,000
20,000
30,000
40,000
Mar
Apr
May
Ju
nJu
lA
ug
Sep Oct
Nov
Dec
Jan
Feb
Mar
Apr
May
Ju
nJu
lA
ug
Sep Oct
Nov
Dec
Jan
Feb
Mar
Apr
May
Ju
nJu
lA
ug
Sep Oct
Nov
Dec
Jan
Feb
Mar
2014 2015 2016 2017
U S AExports
Imports
Balance
― 6 ―
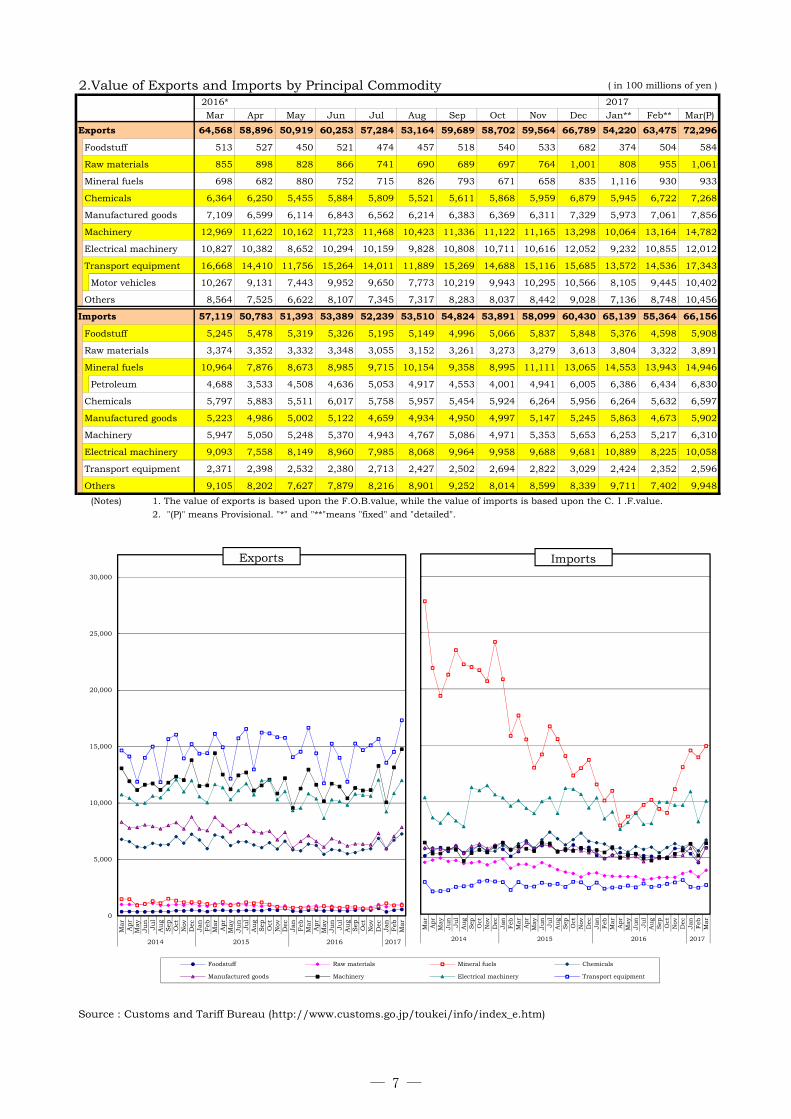
2.Value of Exports and Imports by Principal Commodity ( in 100 millions of yen )
2016* 2017Mar Apr May Jun Jul Aug Sep Oct Nov Dec Jan** Feb** Mar(P)
Exports 64,568 58,896 50,919 60,253 57,284 53,164 59,689 58,702 59,564 66,789 54,220 63,475 72,296
Foodstuff 513 527 450 521 474 457 518 540 533 682 374 504 584
Raw materials 855 898 828 866 741 690 689 697 764 1,001 808 955 1,061
Mineral fuels 698 682 880 752 715 826 793 671 658 835 1,116 930 933
Chemicals 6,364 6,250 5,455 5,884 5,809 5,521 5,611 5,868 5,959 6,879 5,945 6,722 7,268
Manufactured goods 7,109 6,599 6,114 6,843 6,562 6,214 6,383 6,369 6,311 7,329 5,973 7,061 7,856
Machinery 12,969 11,622 10,162 11,723 11,468 10,423 11,336 11,122 11,165 13,298 10,064 13,164 14,782
Electrical machinery 10,827 10,382 8,652 10,294 10,159 9,828 10,808 10,711 10,616 12,052 9,232 10,855 12,012
Transport equipment 16,668 14,410 11,756 15,264 14,011 11,889 15,269 14,688 15,116 15,685 13,572 14,536 17,343
Motor vehicles 10,267 9,131 7,443 9,952 9,650 7,773 10,219 9,943 10,295 10,566 8,105 9,445 10,402
Others 8,564 7,525 6,622 8,107 7,345 7,317 8,283 8,037 8,442 9,028 7,136 8,748 10,456
Imports 57,119 50,783 51,393 53,389 52,239 53,510 54,824 53,891 58,099 60,430 65,139 55,364 66,156
Foodstuff 5,245 5,478 5,319 5,326 5,195 5,149 4,996 5,066 5,837 5,848 5,376 4,598 5,908
Raw materials 3,374 3,352 3,332 3,348 3,055 3,152 3,261 3,273 3,279 3,613 3,804 3,322 3,891
Mineral fuels 10,964 7,876 8,673 8,985 9,715 10,154 9,358 8,995 11,111 13,065 14,553 13,943 14,946
Petroleum 4,688 3,533 4,508 4,636 5,053 4,917 4,553 4,001 4,941 6,005 6,386 6,434 6,830
Chemicals 5,797 5,883 5,511 6,017 5,758 5,957 5,454 5,924 6,264 5,956 6,264 5,632 6,597
Manufactured goods 5,223 4,986 5,002 5,122 4,659 4,934 4,950 4,997 5,147 5,245 5,863 4,673 5,902
Machinery 5,947 5,050 5,248 5,370 4,943 4,767 5,086 4,971 5,353 5,653 6,253 5,217 6,310
Electrical machinery 9,093 7,558 8,149 8,960 7,985 8,068 9,964 9,958 9,688 9,681 10,889 8,225 10,058
Transport equipment 2,371 2,398 2,532 2,380 2,713 2,427 2,502 2,694 2,822 3,029 2,424 2,352 2,596
Others 9,105 8,202 7,627 7,879 8,216 8,901 9,252 8,014 8,599 8,339 9,711 7,402 9,948
(Notes) 1. The value of exports is based upon the F.O.B.value, while the value of imports is based upon the C.Ⅰ.F.value.2. "(P)" means Provisional. "*" and "**"means "fixed" and "detailed".
Source : Customs and Tariff Bureau (http://www.customs.go.jp/toukei/info/index_e.htm)
0
5,000
10,000
15,000
20,000
25,000
30,000
Mar
Apr
May
Ju
nJu
lA
ug
Sep Oct
Nov
Dec
Jan
Feb
Mar
Apr
May
Ju
nJu
lA
ug
Sep Oct
Nov
Dec
Jan
Feb
Mar
Apr
May
Ju
nJu
lA
ug
Sep Oct
Nov
Dec
Jan
Feb
Mar
2014 2015 2016 2017
Foodstuff Raw materials Mineral fuels Chemicals
Manufactured goods Machinery Electrical machinery Transport equipment
Mar
Apr
May
Ju
nJu
lA
ug
Sep Oct
Nov
Dec
Jan Feb
Mar
Apr
May
Ju
nJu
lA
ug
Sep Oct
Nov
Dec
Jan Feb
Mar
Apr
May
Ju
nJu
lA
ug
Sep Oct
Nov
Dec
Jan Feb
Mar
2014 2015 2016 2017
Exports Imports
― 7 ―
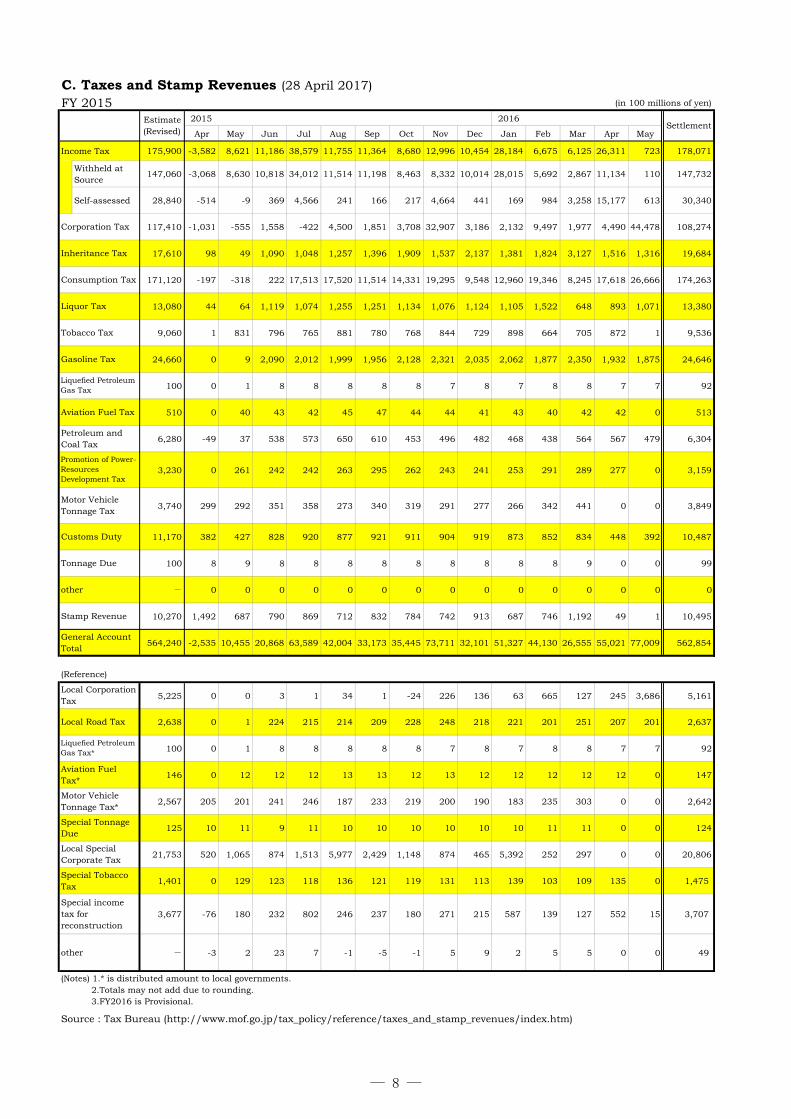
C. Taxes and Stamp Revenues (28 April 2017)FY 2015 (in 100 millions of yen)
2015 2016
Apr May Jun Jul Aug Sep Oct Nov Dec Jan Feb Mar Apr May
Income Tax 175,900 -3,582 8,621 11,186 38,579 11,755 11,364 8,680 12,996 10,454 28,184 6,675 6,125 26,311 723 178,071
Withheld atSource
147,060 -3,068 8,630 10,818 34,012 11,514 11,198 8,463 8,332 10,014 28,015 5,692 2,867 11,134 110 147,732
Self-assessed 28,840 -514 -9 369 4,566 241 166 217 4,664 441 169 984 3,258 15,177 613 30,340
117,410 -1,031 -555 1,558 -422 4,500 1,851 3,708 32,907 3,186 2,132 9,497 1,977 4,490 44,478 108,274
17,610 98 49 1,090 1,048 1,257 1,396 1,909 1,537 2,137 1,381 1,824 3,127 1,516 1,316 19,684
171,120 -197 -318 222 17,513 17,520 11,514 14,331 19,295 9,548 12,960 19,346 8,245 17,618 26,666 174,263
13,080 44 64 1,119 1,074 1,255 1,251 1,134 1,076 1,124 1,105 1,522 648 893 1,071 13,380
9,060 1 831 796 765 881 780 768 844 729 898 664 705 872 1 9,536
24,660 0 9 2,090 2,012 1,999 1,956 2,128 2,321 2,035 2,062 1,877 2,350 1,932 1,875 24,646
100 0 1 8 8 8 8 8 7 8 7 8 8 7 7 92
510 0 40 43 42 45 47 44 44 41 43 40 42 42 0 513
6,280 -49 37 538 573 650 610 453 496 482 468 438 564 567 479 6,304
3,230 0 261 242 242 263 295 262 243 241 253 291 289 277 0 3,159
3,740 299 292 351 358 273 340 319 291 277 266 342 441 0 0 3,849
11,170 382 427 828 920 877 921 911 904 919 873 852 834 448 392 10,487
100 8 9 8 8 8 8 8 8 8 8 8 9 0 0 99
- 0 0 0 0 0 0 0 0 0 0 0 0 0 0 0
10,270 1,492 687 790 869 712 832 784 742 913 687 746 1,192 49 1 10,495
564,240 -2,535 10,455 20,868 63,589 42,004 33,173 35,445 73,711 32,101 51,327 44,130 26,555 55,021 77,009 562,854
(Reference)
5,225 0 0 3 1 34 1 -24 226 136 63 665 127 245 3,686 5,161
2,638 0 1 224 215 214 209 228 248 218 221 201 251 207 201 2,637
100 0 1 8 8 8 8 8 7 8 7 8 8 7 7 92
146 0 12 12 12 13 13 12 13 12 12 12 12 12 0 147
2,567 205 201 241 246 187 233 219 200 190 183 235 303 0 0 2,642
125 10 11 9 11 10 10 10 10 10 10 11 11 0 0 124
21,753 520 1,065 874 1,513 5,977 2,429 1,148 874 465 5,392 252 297 0 0 20,806
1,401 0 129 123 118 136 121 119 131 113 139 103 109 135 0 1,475
3,677 -76 180 232 802 246 237 180 271 215 587 139 127 552 15 3,707
- -3 2 23 7 -1 -5 -1 5 9 2 5 5 0 0 49other
Estimate(Revised)
Corporation Tax
Consumption Tax
Inheritance Tax
Tobacco Tax
Aviation Fuel Tax
Motor VehicleTonnage Tax
Liquor Tax
Local SpecialCorporate Tax
Liquefied PetroleumGas Tax
Settlement
(Notes) 1.* is distributed amount to local governments. 2.Totals may not add due to rounding. 3.FY2016 is Provisional.
Gasoline Tax
other
General AccountTotal
Local CorporationTax
Stamp Revenue
Customs Duty
Tonnage Due
Source : Tax Bureau (http://www.mof.go.jp/tax_policy/reference/taxes_and_stamp_revenues/index.htm)
Special TobaccoTax
Special incometax forreconstruction
Petroleum andCoal Tax
Motor VehicleTonnage Tax*
Aviation FuelTax*
Liquefied PetroleumGas Tax*
Local Road Tax
Promotion of Power-ResourcesDevelopment Tax
Special TonnageDue
― 8 ―
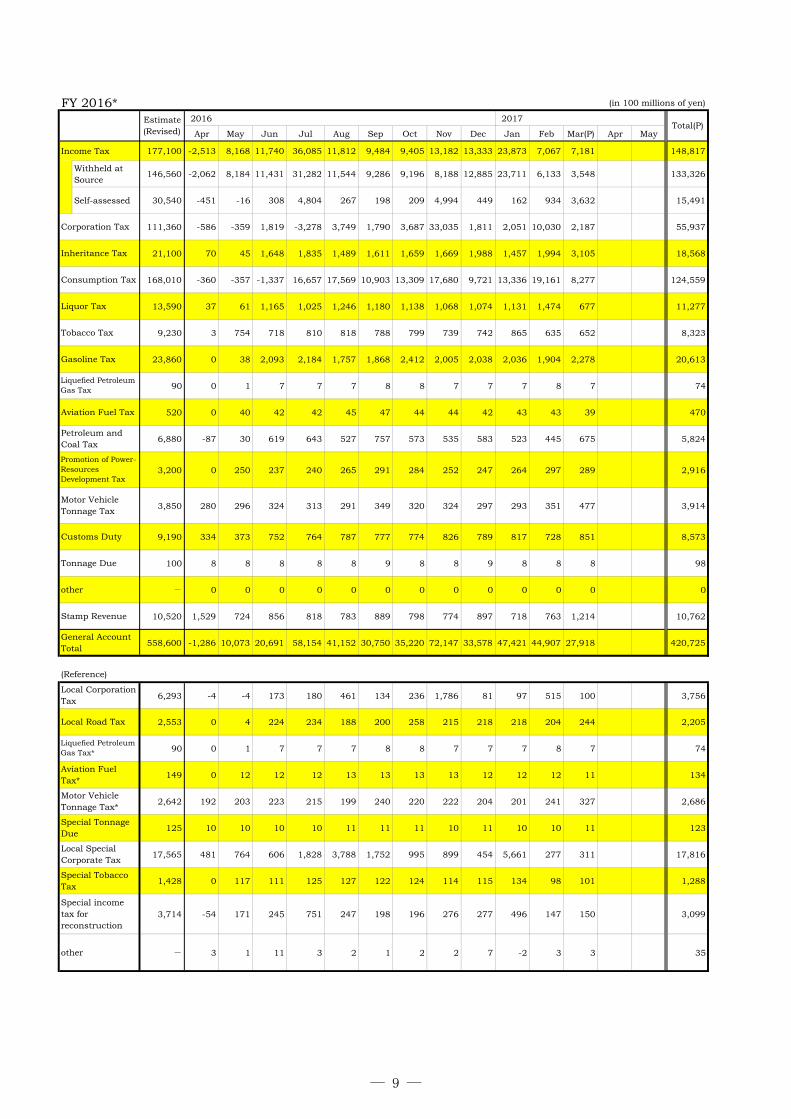
FY 2016* (in 100 millions of yen)
2016 2017
Apr May Jun Jul Aug Sep Oct Nov Dec Jan Feb Mar(P) Apr May
Income Tax 177,100 -2,513 8,168 11,740 36,085 11,812 9,484 9,405 13,182 13,333 23,873 7,067 7,181 148,817
Withheld atSource
146,560 -2,062 8,184 11,431 31,282 11,544 9,286 9,196 8,188 12,885 23,711 6,133 3,548 133,326
Self-assessed 30,540 -451 -16 308 4,804 267 198 209 4,994 449 162 934 3,632 15,491
111,360 -586 -359 1,819 -3,278 3,749 1,790 3,687 33,035 1,811 2,051 10,030 2,187 55,937
21,100 70 45 1,648 1,835 1,489 1,611 1,659 1,669 1,988 1,457 1,994 3,105 18,568
168,010 -360 -357 -1,337 16,657 17,569 10,903 13,309 17,680 9,721 13,336 19,161 8,277 124,559
13,590 37 61 1,165 1,025 1,246 1,180 1,138 1,068 1,074 1,131 1,474 677 11,277
9,230 3 754 718 810 818 788 799 739 742 865 635 652 8,323
23,860 0 38 2,093 2,184 1,757 1,868 2,412 2,005 2,038 2,036 1,904 2,278 20,613
90 0 1 7 7 7 8 8 7 7 7 8 7 74
520 0 40 42 42 45 47 44 44 42 43 43 39 470
6,880 -87 30 619 643 527 757 573 535 583 523 445 675 5,824
3,200 0 250 237 240 265 291 284 252 247 264 297 289 2,916
3,850 280 296 324 313 291 349 320 324 297 293 351 477 3,914
9,190 334 373 752 764 787 777 774 826 789 817 728 851 8,573
100 8 8 8 8 8 9 8 8 9 8 8 8 98
- 0 0 0 0 0 0 0 0 0 0 0 0 0
10,520 1,529 724 856 818 783 889 798 774 897 718 763 1,214 10,762
558,600 -1,286 10,073 20,691 58,154 41,152 30,750 35,220 72,147 33,578 47,421 44,907 27,918 420,725
(Reference)
6,293 -4 -4 173 180 461 134 236 1,786 81 97 515 100 3,756
2,553 0 4 224 234 188 200 258 215 218 218 204 244 2,205
90 0 1 7 7 7 8 8 7 7 7 8 7 74
149 0 12 12 12 13 13 13 13 12 12 12 11 134
2,642 192 203 223 215 199 240 220 222 204 201 241 327 2,686
125 10 10 10 10 11 11 11 10 11 10 10 11 123
17,565 481 764 606 1,828 3,788 1,752 995 899 454 5,661 277 311 17,816
1,428 0 117 111 125 127 122 124 114 115 134 98 101 1,288
3,714 -54 171 245 751 247 198 196 276 277 496 147 150 3,099
- 3 1 11 3 2 1 2 2 7 -2 3 3 35
Tonnage Due
Consumption Tax
Inheritance Tax
Corporation Tax
Estimate(Revised)
Gasoline Tax
Tobacco Tax
Liquor Tax
Special TonnageDue
Special incometax forreconstruction
Total(P)
Local CorporationTax
General AccountTotal
Customs Duty
Motor VehicleTonnage Tax
Promotion of Power-ResourcesDevelopment Tax
Petroleum andCoal Tax
Local SpecialCorporate Tax
Stamp Revenue
Special TobaccoTax
other
Motor VehicleTonnage Tax*
Aviation FuelTax*
Liquefied PetroleumGas Tax*
Local Road Tax
Aviation Fuel Tax
Liquefied PetroleumGas Tax
other
― 9 ―
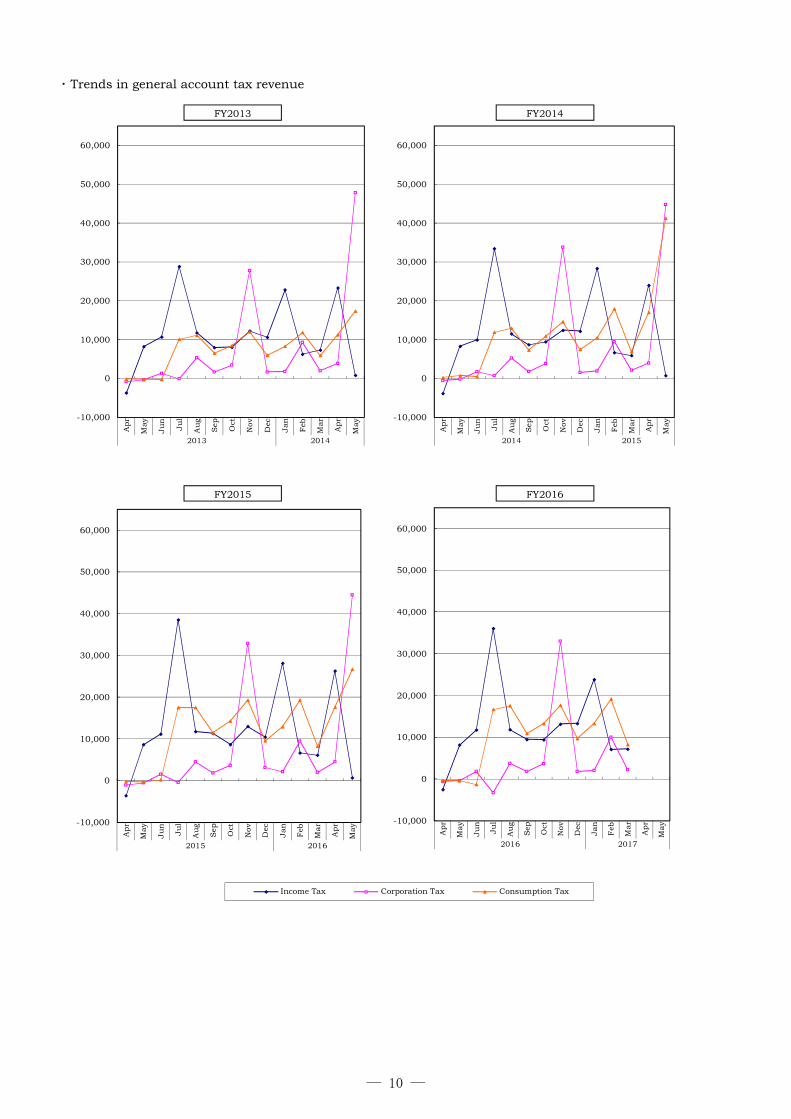
・ Trends in general account tax revenue
-10,000
0
10,000
20,000
30,000
40,000
50,000
60,000
Apr
May
Ju
n
Ju
l
Au
g
Sep Oct
Nov
Dec
Jan Feb
Mar
Apr
May
2015 2016
Income Tax Corporation Tax Consumption Tax
-10,000
0
10,000
20,000
30,000
40,000
50,000
60,000
Apr
May
Ju
n
Ju
l
Au
g
Sep Oct
Nov
Dec
Jan Feb
Mar
Apr
May
2016 2017
-10,000
0
10,000
20,000
30,000
40,000
50,000
60,000
Apr
May
Ju
n
Ju
l
Au
g
Sep Oct
Nov
Dec
Jan Feb
Mar
Apr
May
2013 2014
FY2013
-10,000
0
10,000
20,000
30,000
40,000
50,000
60,000
Apr
May
Ju
n
Ju
l
Au
g
Sep Oct
Nov
Dec
Jan Feb
Mar
Apr
May
2014 2015
FY2014
FY2015 FY2016
― 10 ―
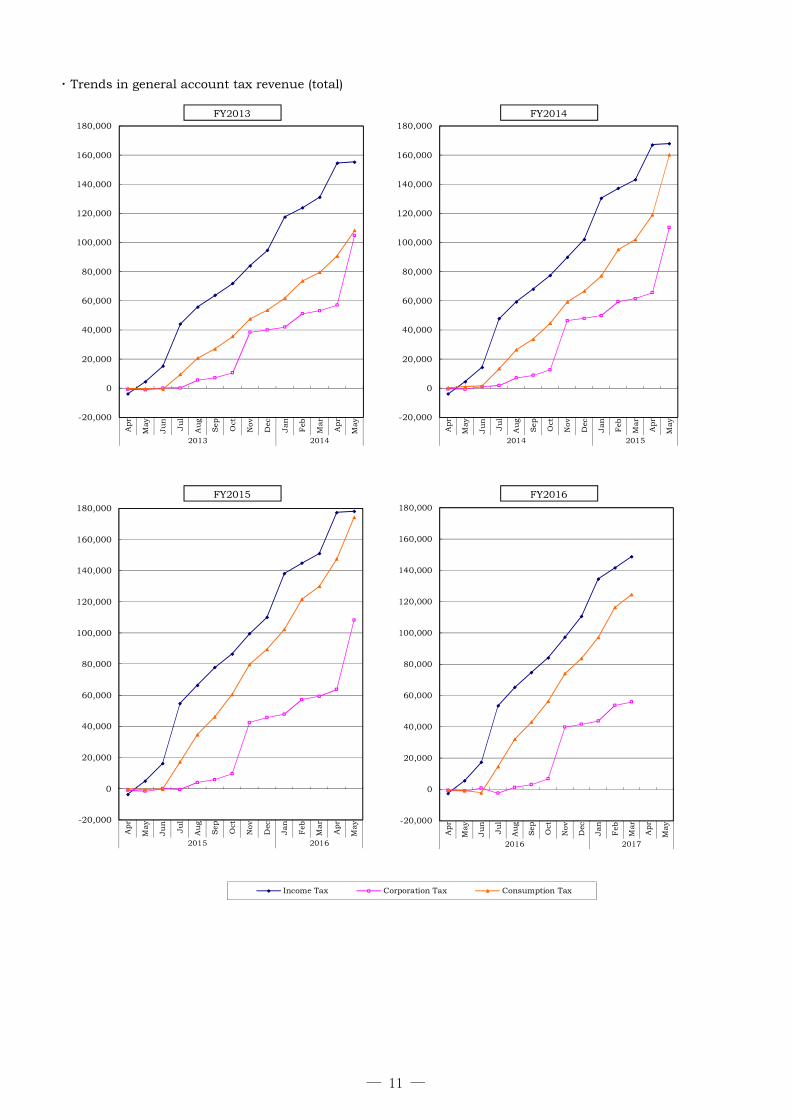
・ Trends in general account tax revenue (total)
-20,000
0
20,000
40,000
60,000
80,000
100,000
120,000
140,000
160,000
180,000
Apr
May
Ju
n
Ju
l
Au
g
Sep Oct
Nov
Dec
Jan Feb
Mar
Apr
May
2015 2016
Income Tax Corporation Tax Consumption Tax
-20,000
0
20,000
40,000
60,000
80,000
100,000
120,000
140,000
160,000
180,000
Apr
May
Ju
n
Ju
l
Au
g
Sep Oct
Nov
Dec
Jan Feb
Mar
Apr
May
2016 2017
-20,000
0
20,000
40,000
60,000
80,000
100,000
120,000
140,000
160,000
180,000A
pr
May
Ju
n
Ju
l
Au
g
Sep Oct
Nov
Dec
Jan Feb
Mar
Apr
May
2013 2014
FY2013
-20,000
0
20,000
40,000
60,000
80,000
100,000
120,000
140,000
160,000
180,000
Apr
May
Ju
n
Ju
l
Au
g
Sep Oct
Nov
Dec
Jan Feb
Mar
Apr
May
2014 2015
FY2014
FY2015 FY2016
― 11 ―
2016
May Jun Jul Aug
Receipts Payments Balance Receipts Payments Balance Receipts Payments Balance Receipts Payments Balance
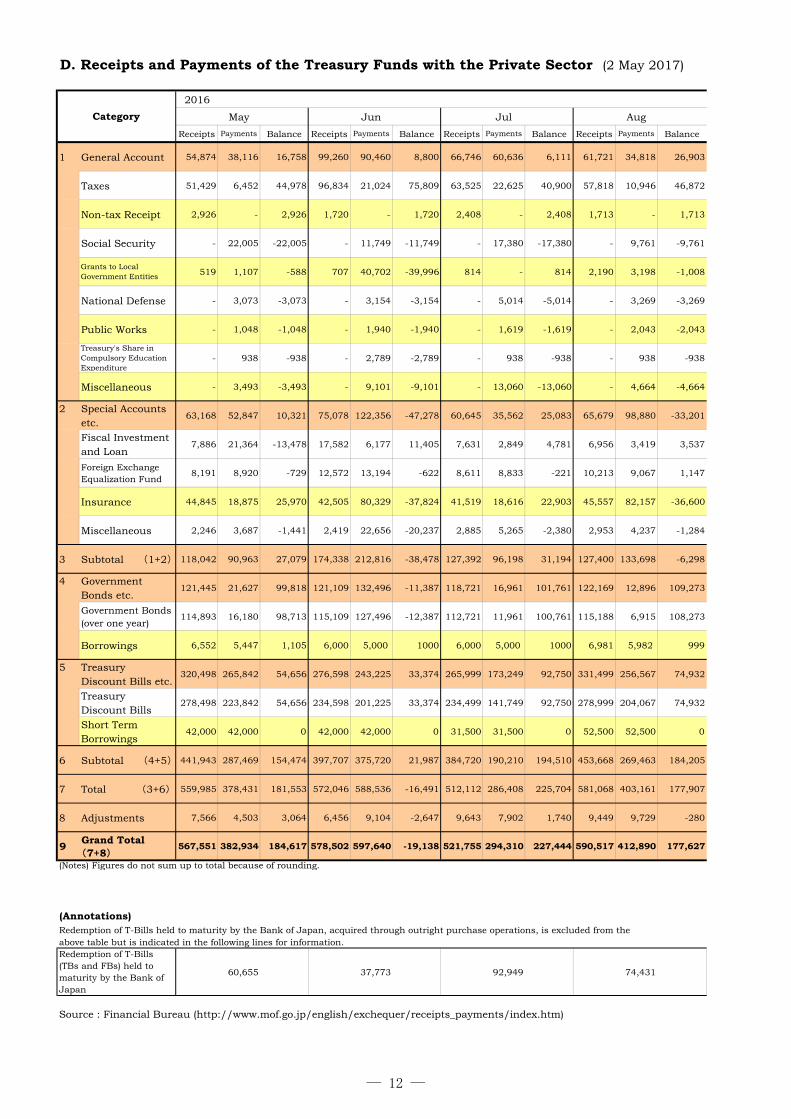
1 General Account 54,874 38,116 16,758 99,260 90,460 8,800 66,746 60,636 6,111 61,721 34,818 26,903
Taxes 51,429 6,452 44,978 96,834 21,024 75,809 63,525 22,625 40,900 57,818 10,946 46,872
Non-tax Receipt 2,926 - 2,926 1,720 - 1,720 2,408 - 2,408 1,713 - 1,713
Social Security - 22,005 -22,005 - 11,749 -11,749 - 17,380 -17,380 - 9,761 -9,761
Grants to LocalGovernment Entities 519 1,107 -588 707 40,702 -39,996 814 - 814 2,190 3,198 -1,008
National Defense - 3,073 -3,073 - 3,154 -3,154 - 5,014 -5,014 - 3,269 -3,269
Public Works - 1,048 -1,048 - 1,940 -1,940 - 1,619 -1,619 - 2,043 -2,043
Treasury's Share inCompulsory EducationExpenditure
- 938 -938 - 2,789 -2,789 - 938 -938 - 938 -938
Miscellaneous - 3,493 -3,493 - 9,101 -9,101 - 13,060 -13,060 - 4,664 -4,664
2 Special Accountsetc.
63,168 52,847 10,321 75,078 122,356 -47,278 60,645 35,562 25,083 65,679 98,880 -33,201
Fiscal Investmentand Loan
7,886 21,364 -13,478 17,582 6,177 11,405 7,631 2,849 4,781 6,956 3,419 3,537
Foreign ExchangeEqualization Fund
8,191 8,920 -729 12,572 13,194 -622 8,611 8,833 -221 10,213 9,067 1,147
Insurance 44,845 18,875 25,970 42,505 80,329 -37,824 41,519 18,616 22,903 45,557 82,157 -36,600
Miscellaneous 2,246 3,687 -1,441 2,419 22,656 -20,237 2,885 5,265 -2,380 2,953 4,237 -1,284
3 Subtotal (1+2) 118,042 90,963 27,079 174,338 212,816 -38,478 127,392 96,198 31,194 127,400 133,698 -6,298
4 GovernmentBonds etc.
121,445 21,627 99,818 121,109 132,496 -11,387 118,721 16,961 101,761 122,169 12,896 109,273
Government Bonds(over one year)
114,893 16,180 98,713 115,109 127,496 -12,387 112,721 11,961 100,761 115,188 6,915 108,273
Borrowings 6,552 5,447 1,105 6,000 5,000 1000 6,000 5,000 1000 6,981 5,982 999
5 TreasuryDiscount Bills etc.
320,498 265,842 54,656 276,598 243,225 33,374 265,999 173,249 92,750 331,499 256,567 74,932
TreasuryDiscount Bills
278,498 223,842 54,656 234,598 201,225 33,374 234,499 141,749 92,750 278,999 204,067 74,932
Short TermBorrowings
42,000 42,000 0 42,000 42,000 0 31,500 31,500 0 52,500 52,500 0
6 Subtotal (4+5) 441,943 287,469 154,474 397,707 375,720 21,987 384,720 190,210 194,510 453,668 269,463 184,205
7 Total (3+6) 559,985 378,431 181,553 572,046 588,536 -16,491 512,112 286,408 225,704 581,068 403,161 177,907
8 Adjustments 7,566 4,503 3,064 6,456 9,104 -2,647 9,643 7,902 1,740 9,449 9,729 -280
9Grand Total(7+8)
567,551 382,934 184,617 578,502 597,640 -19,138 521,755 294,310 227,444 590,517 412,890 177,627
(Notes) Figures do not sum up to total because of rounding.
(Annotations)Redemption of T-Bills held to maturity by the Bank of Japan, acquired through outright purchase operations, is excluded from theabove table but is indicated in the following lines for information.
60,655 37,773 92,949 74,431
Source : Financial Bureau (http://www.mof.go.jp/english/exchequer/receipts_payments/index.htm)
D. Receipts and Payments of the Treasury Funds with the Private Sector (2 May 2017)
Redemption of T-Bills(TBs and FBs) held tomaturity by the Bank ofJapan
Category
― 12 ―
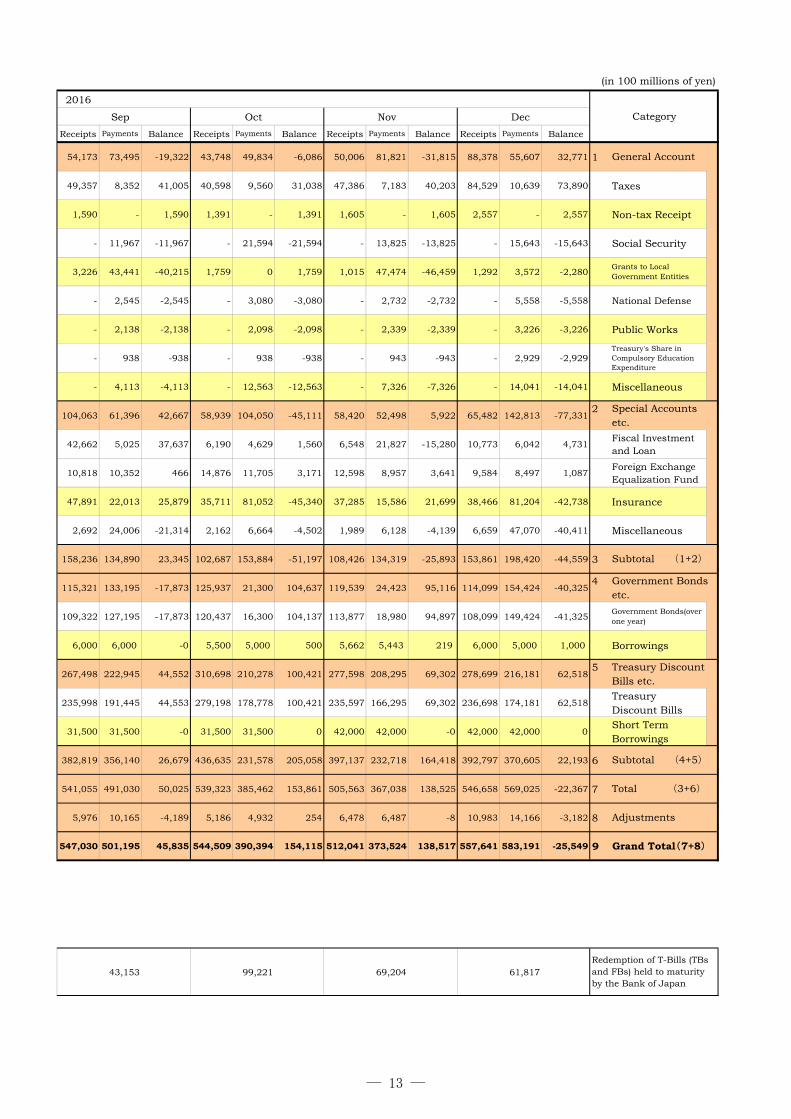
(in 100 millions of yen)
2016
Sep Oct Nov Dec
Receipts Payments Balance Receipts Payments Balance Receipts Payments Balance Receipts Payments Balance
54,173 73,495 -19,322 43,748 49,834 -6,086 50,006 81,821 -31,815 88,378 55,607 32,771 1
49,357 8,352 41,005 40,598 9,560 31,038 47,386 7,183 40,203 84,529 10,639 73,890 Taxes
1,590 - 1,590 1,391 - 1,391 1,605 - 1,605 2,557 - 2,557 Non-tax Receipt
- 11,967 -11,967 - 21,594 -21,594 - 13,825 -13,825 - 15,643 -15,643 Social Security
3,226 43,441 -40,215 1,759 0 1,759 1,015 47,474 -46,459 1,292 3,572 -2,280Grants to LocalGovernment Entities
- 2,545 -2,545 - 3,080 -3,080 - 2,732 -2,732 - 5,558 -5,558 National Defense
- 2,138 -2,138 - 2,098 -2,098 - 2,339 -2,339 - 3,226 -3,226 Public Works
- 938 -938 - 938 -938 - 943 -943 - 2,929 -2,929Treasury's Share inCompulsory EducationExpenditure
- 4,113 -4,113 - 12,563 -12,563 - 7,326 -7,326 - 14,041 -14,041 Miscellaneous
104,063 61,396 42,667 58,939 104,050 -45,111 58,420 52,498 5,922 65,482 142,813 -77,3312
42,662 5,025 37,637 6,190 4,629 1,560 6,548 21,827 -15,280 10,773 6,042 4,731Fiscal Investmentand Loan
10,818 10,352 466 14,876 11,705 3,171 12,598 8,957 3,641 9,584 8,497 1,087Foreign ExchangeEqualization Fund
47,891 22,013 25,879 35,711 81,052 -45,340 37,285 15,586 21,699 38,466 81,204 -42,738 Insurance
2,692 24,006 -21,314 2,162 6,664 -4,502 1,989 6,128 -4,139 6,659 47,070 -40,411 Miscellaneous
158,236 134,890 23,345 102,687 153,884 -51,197 108,426 134,319 -25,893 153,861 198,420 -44,559 3
115,321 133,195 -17,873 125,937 21,300 104,637 119,539 24,423 95,116 114,099 154,424 -40,3254
109,322 127,195 -17,873 120,437 16,300 104,137 113,877 18,980 94,897 108,099 149,424 -41,325Government Bonds(overone year)
6,000 6,000 -0 5,500 5,000 500 5,662 5,443 219 6,000 5,000 1,000 Borrowings
267,498 222,945 44,552 310,698 210,278 100,421 277,598 208,295 69,302 278,699 216,181 62,5185
235,998 191,445 44,553 279,198 178,778 100,421 235,597 166,295 69,302 236,698 174,181 62,518TreasuryDiscount Bills
31,500 31,500 -0 31,500 31,500 0 42,000 42,000 -0 42,000 42,000 0Short TermBorrowings
382,819 356,140 26,679 436,635 231,578 205,058 397,137 232,718 164,418 392,797 370,605 22,193 6
541,055 491,030 50,025 539,323 385,462 153,861 505,563 367,038 138,525 546,658 569,025 -22,367 7
5,976 10,165 -4,189 5,186 4,932 254 6,478 6,487 -8 10,983 14,166 -3,182 8
547,030 501,195 45,835 544,509 390,394 154,115 512,041 373,524 138,517 557,641 583,191 -25,549 9
43,153 99,221 69,204 61,817
Category
Redemption of T-Bills (TBsand FBs) held to maturityby the Bank of Japan
Grand Total(7+8)
Adjustments
General Account
Subtotal (4+5)
Total (3+6)
Special Accountsetc.
Subtotal (1+2)
Government Bondsetc.
Treasury DiscountBills etc.
― 13 ―
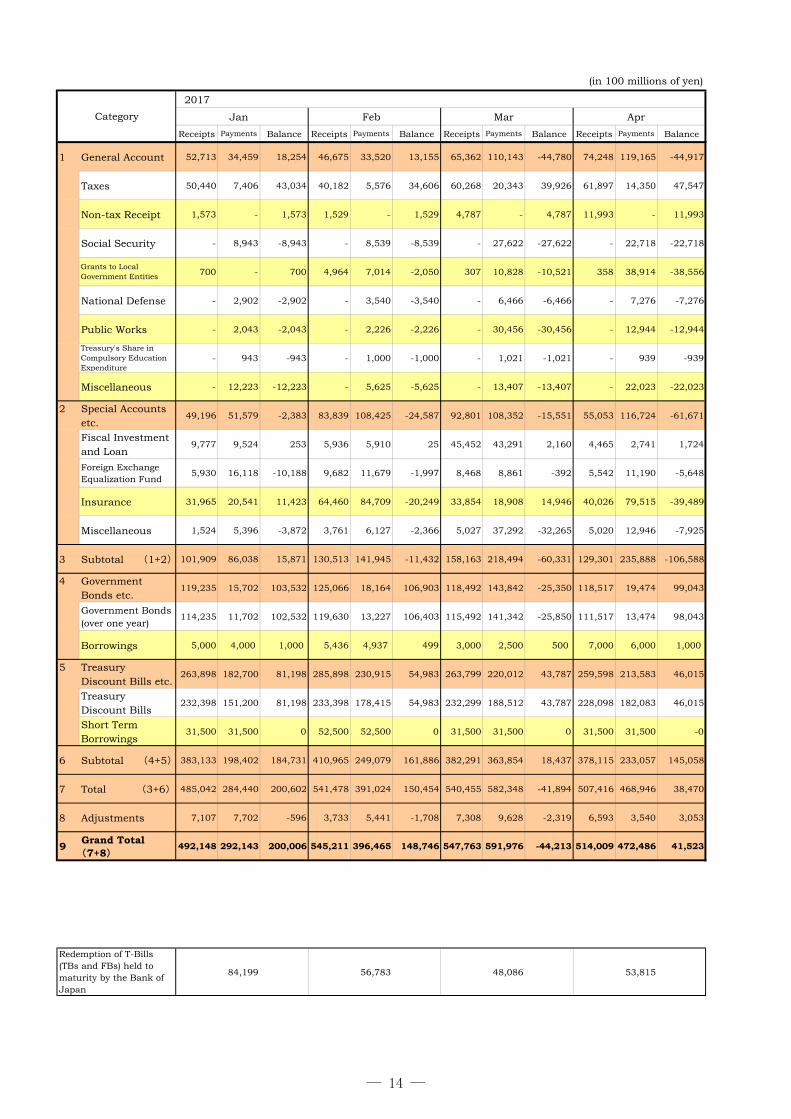
(in 100 millions of yen)
2017
Jan Feb Mar Apr
Receipts Payments Balance Receipts Payments Balance Receipts Payments Balance Receipts Payments Balance
1 General Account 52,713 34,459 18,254 46,675 33,520 13,155 65,362 110,143 -44,780 74,248 119,165 -44,917
Taxes 50,440 7,406 43,034 40,182 5,576 34,606 60,268 20,343 39,926 61,897 14,350 47,547
Non-tax Receipt 1,573 - 1,573 1,529 - 1,529 4,787 - 4,787 11,993 - 11,993
Social Security - 8,943 -8,943 - 8,539 -8,539 - 27,622 -27,622 - 22,718 -22,718
Grants to LocalGovernment Entities 700 - 700 4,964 7,014 -2,050 307 10,828 -10,521 358 38,914 -38,556
National Defense - 2,902 -2,902 - 3,540 -3,540 - 6,466 -6,466 - 7,276 -7,276
Public Works - 2,043 -2,043 - 2,226 -2,226 - 30,456 -30,456 - 12,944 -12,944
Treasury's Share inCompulsory EducationExpenditure
- 943 -943 - 1,000 -1,000 - 1,021 -1,021 - 939 -939
Miscellaneous - 12,223 -12,223 - 5,625 -5,625 - 13,407 -13,407 - 22,023 -22,023
2 Special Accountsetc.
49,196 51,579 -2,383 83,839 108,425 -24,587 92,801 108,352 -15,551 55,053 116,724 -61,671
Fiscal Investmentand Loan
9,777 9,524 253 5,936 5,910 25 45,452 43,291 2,160 4,465 2,741 1,724
Foreign ExchangeEqualization Fund
5,930 16,118 -10,188 9,682 11,679 -1,997 8,468 8,861 -392 5,542 11,190 -5,648
Insurance 31,965 20,541 11,423 64,460 84,709 -20,249 33,854 18,908 14,946 40,026 79,515 -39,489
Miscellaneous 1,524 5,396 -3,872 3,761 6,127 -2,366 5,027 37,292 -32,265 5,020 12,946 -7,925
3 Subtotal (1+2) 101,909 86,038 15,871 130,513 141,945 -11,432 158,163 218,494 -60,331 129,301 235,888 -106,588
4 GovernmentBonds etc.
119,235 15,702 103,532 125,066 18,164 106,903 118,492 143,842 -25,350 118,517 19,474 99,043
Government Bonds(over one year)
114,235 11,702 102,532 119,630 13,227 106,403 115,492 141,342 -25,850 111,517 13,474 98,043
Borrowings 5,000 4,000 1,000 5,436 4,937 499 3,000 2,500 500 7,000 6,000 1,000
5 TreasuryDiscount Bills etc.
263,898 182,700 81,198 285,898 230,915 54,983 263,799 220,012 43,787 259,598 213,583 46,015
TreasuryDiscount Bills
232,398 151,200 81,198 233,398 178,415 54,983 232,299 188,512 43,787 228,098 182,083 46,015
Short TermBorrowings
31,500 31,500 0 52,500 52,500 0 31,500 31,500 0 31,500 31,500 -0
6 Subtotal (4+5) 383,133 198,402 184,731 410,965 249,079 161,886 382,291 363,854 18,437 378,115 233,057 145,058
7 Total (3+6) 485,042 284,440 200,602 541,478 391,024 150,454 540,455 582,348 -41,894 507,416 468,946 38,470
8 Adjustments 7,107 7,702 -596 3,733 5,441 -1,708 7,308 9,628 -2,319 6,593 3,540 3,053
9Grand Total(7+8)
492,148 292,143 200,006 545,211 396,465 148,746 547,763 591,976 -44,213 514,009 472,486 41,523
84,199 56,783 48,086 53,815
Category
Redemption of T-Bills(TBs and FBs) held tomaturity by the Bank ofJapan
― 14 ―
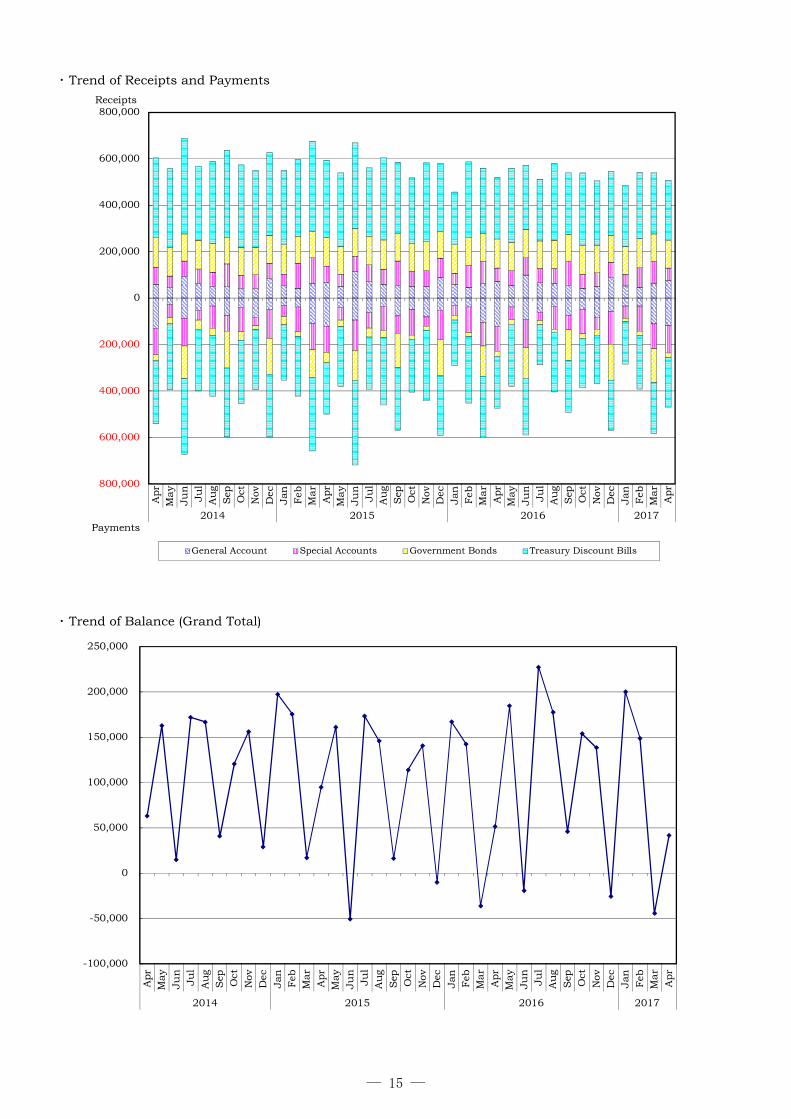
・ Trend of Receipts and Payments
・ Trend of Balance (Grand Total)
800,000
600,000
400,000
200,000
0
200,000
400,000
600,000
800,000
Apr
May
Ju
nJu
lA
ug
Sep Oct
Nov
Dec
Jan Feb
Mar
Apr
May
Ju
nJu
lA
ug
Sep Oct
Nov
Dec
Jan Feb
Mar
Apr
May
Ju
nJu
lA
ug
Sep Oct
Nov
Dec
Jan Feb
Mar
Apr
2014 2015 2016 2017
General Account Special Accounts Government Bonds Treasury Discount Bills
-100,000
-50,000
0
50,000
100,000
150,000
200,000
250,000
Apr
May
Ju
nJu
lA
ug
Sep Oct
Nov
Dec
Jan Feb
Mar
Apr
May
Ju
nJu
lA
ug
Sep Oct
Nov
Dec
Jan Feb
Mar
Apr
May
Ju
nJu
lA
ug
Sep Oct
Nov
Dec
Jan Feb
Mar
Apr
2014 2015 2016 2017
Receipts
Payments
― 15 ―
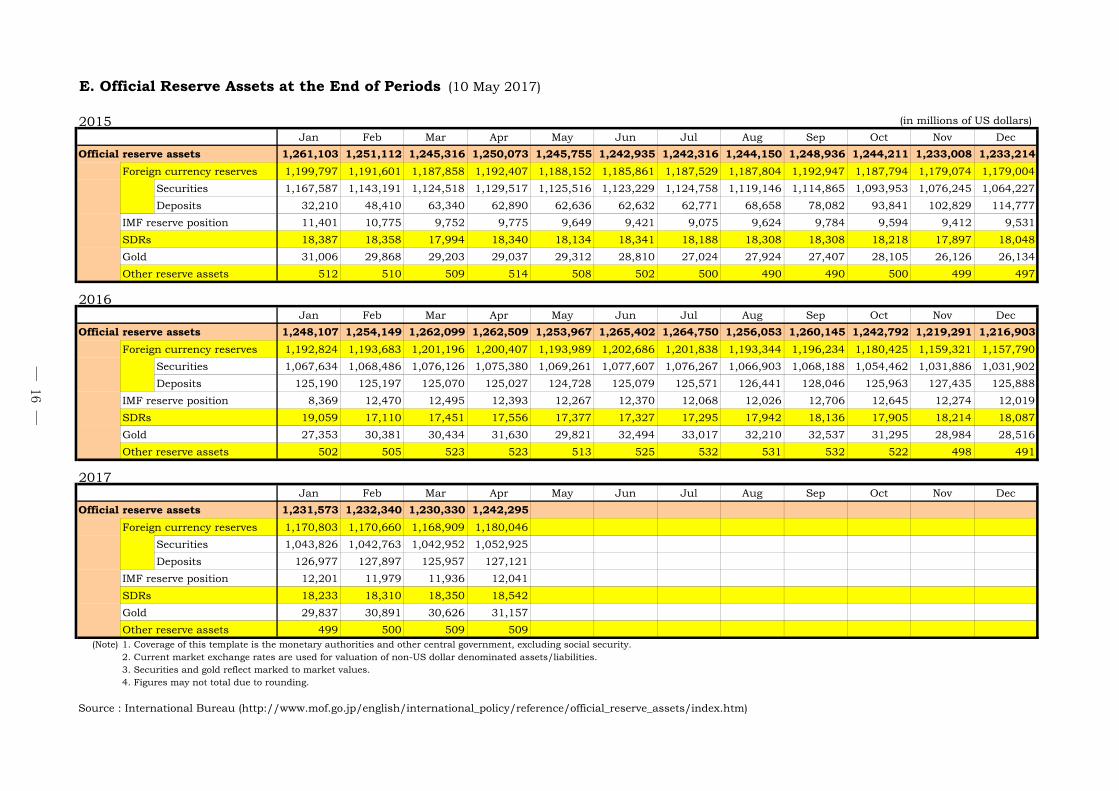
E. Official Reserve Assets at the End of Periods (10 May 2017)
2015 (in millions of US dollars)
Jan Feb Mar Apr May Jun Jul Aug Sep Oct Nov Dec
Official reserve assets 1,261,103 1,251,112 1,245,316 1,250,073 1,245,755 1,242,935 1,242,316 1,244,150 1,248,936 1,244,211 1,233,008 1,233,214
Foreign currency reserves 1,199,797 1,191,601 1,187,858 1,192,407 1,188,152 1,185,861 1,187,529 1,187,804 1,192,947 1,187,794 1,179,074 1,179,004
Securities 1,167,587 1,143,191 1,124,518 1,129,517 1,125,516 1,123,229 1,124,758 1,119,146 1,114,865 1,093,953 1,076,245 1,064,227
Deposits 32,210 48,410 63,340 62,890 62,636 62,632 62,771 68,658 78,082 93,841 102,829 114,777
IMF reserve position 11,401 10,775 9,752 9,775 9,649 9,421 9,075 9,624 9,784 9,594 9,412 9,531
SDRs 18,387 18,358 17,994 18,340 18,134 18,341 18,188 18,308 18,308 18,218 17,897 18,048
Gold 31,006 29,868 29,203 29,037 29,312 28,810 27,024 27,924 27,407 28,105 26,126 26,134
Other reserve assets 512 510 509 514 508 502 500 490 490 500 499 497
2016Jan Feb Mar Apr May Jun Jul Aug Sep Oct Nov Dec
Official reserve assets 1,248,107 1,254,149 1,262,099 1,262,509 1,253,967 1,265,402 1,264,750 1,256,053 1,260,145 1,242,792 1,219,291 1,216,903
Foreign currency reserves 1,192,824 1,193,683 1,201,196 1,200,407 1,193,989 1,202,686 1,201,838 1,193,344 1,196,234 1,180,425 1,159,321 1,157,790
Securities 1,067,634 1,068,486 1,076,126 1,075,380 1,069,261 1,077,607 1,076,267 1,066,903 1,068,188 1,054,462 1,031,886 1,031,902
Deposits 125,190 125,197 125,070 125,027 124,728 125,079 125,571 126,441 128,046 125,963 127,435 125,888
IMF reserve position 8,369 12,470 12,495 12,393 12,267 12,370 12,068 12,026 12,706 12,645 12,274 12,019
SDRs 19,059 17,110 17,451 17,556 17,377 17,327 17,295 17,942 18,136 17,905 18,214 18,087
Gold 27,353 30,381 30,434 31,630 29,821 32,494 33,017 32,210 32,537 31,295 28,984 28,516
Other reserve assets 502 505 523 523 513 525 532 531 532 522 498 491
2017Jan Feb Mar Apr May Jun Jul Aug Sep Oct Nov Dec
Official reserve assets 1,231,573 1,232,340 1,230,330 1,242,295
Foreign currency reserves 1,170,803 1,170,660 1,168,909 1,180,046
Securities 1,043,826 1,042,763 1,042,952 1,052,925
Deposits 126,977 127,897 125,957 127,121
IMF reserve position 12,201 11,979 11,936 12,041
SDRs 18,233 18,310 18,350 18,542
Gold 29,837 30,891 30,626 31,157
Other reserve assets 499 500 509 509(Note) 1. Coverage of this template is the monetary authorities and other central government, excluding social security.
2. Current market exchange rates are used for valuation of non-US dollar denominated assets/liabilities.3. Securities and gold reflect marked to market values.4. Figures may not total due to rounding.
Source : International Bureau (http://www.mof.go.jp/english/international_policy/reference/official_reserve_assets/index.htm)
― 16 ―
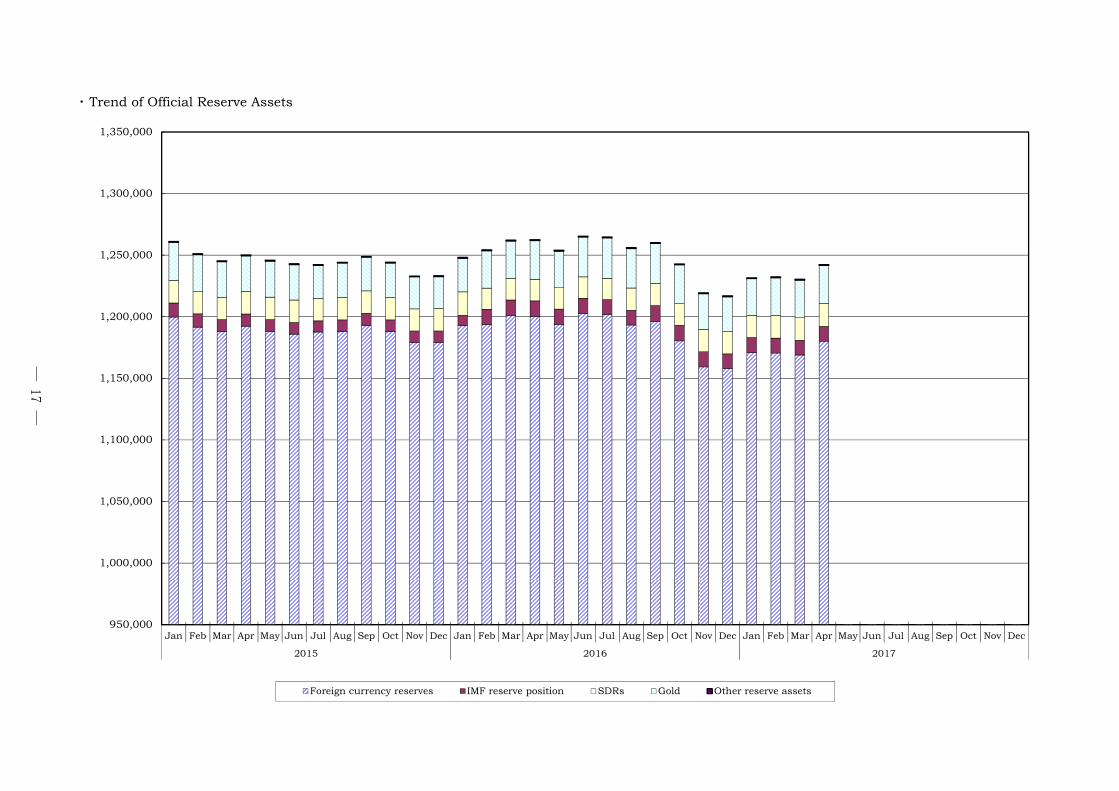
・ Trend of Official Reserve Assets
950,000
1,000,000
1,050,000
1,100,000
1,150,000
1,200,000
1,250,000
1,300,000
1,350,000
Jan Feb Mar Apr May Jun Jul Aug Sep Oct Nov Dec Jan Feb Mar Apr May Jun Jul Aug Sep Oct Nov Dec Jan Feb Mar Apr May Jun Jul Aug Sep Oct Nov Dec
2015 2016 2017
Foreign currency reserves IMF reserve position SDRs Gold Other reserve assets
― 17 ―
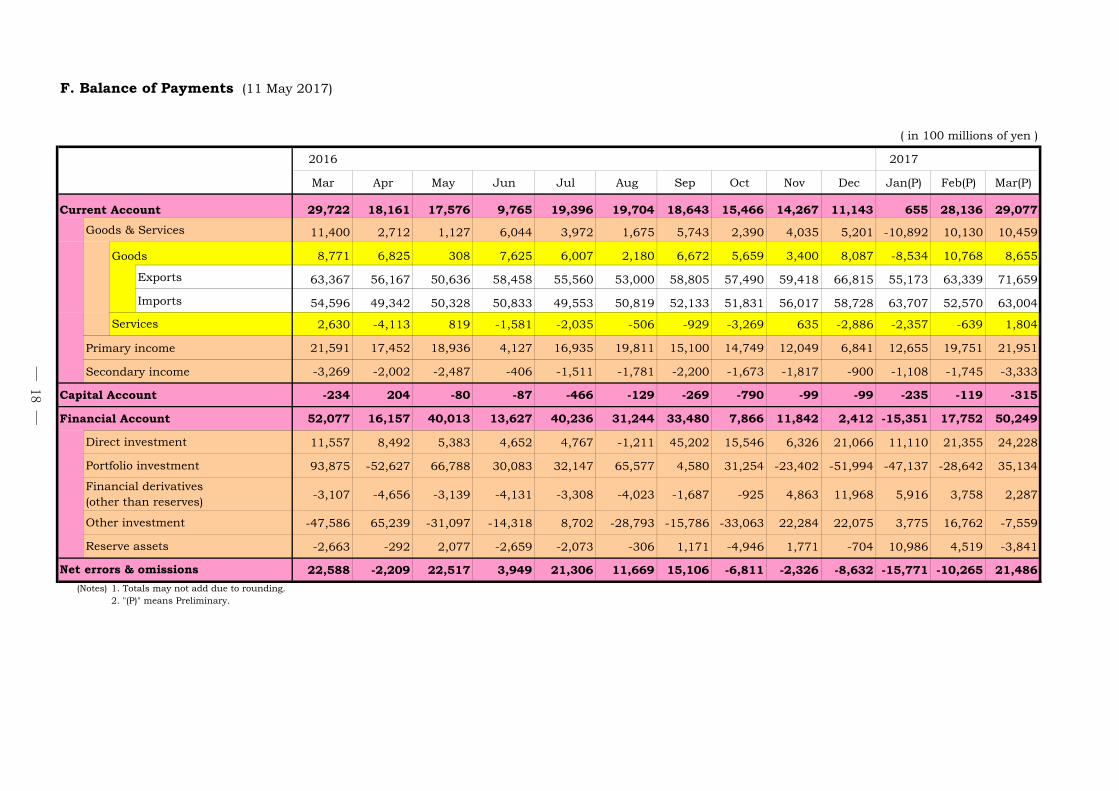
F. Balance of Payments (11 May 2017)
( in 100 millions of yen )
2016 2017
Mar Apr May Jun Jul Aug Sep Oct Nov Dec Jan(P) Feb(P) Mar(P)
Current Account 29,722 18,161 17,576 9,765 19,396 19,704 18,643 15,466 14,267 11,143 655 28,136 29,077
Goods & Services 11,400 2,712 1,127 6,044 3,972 1,675 5,743 2,390 4,035 5,201 -10,892 10,130 10,459
Goods 8,771 6,825 308 7,625 6,007 2,180 6,672 5,659 3,400 8,087 -8,534 10,768 8,655
Exports 63,367 56,167 50,636 58,458 55,560 53,000 58,805 57,490 59,418 66,815 55,173 63,339 71,659
Imports 54,596 49,342 50,328 50,833 49,553 50,819 52,133 51,831 56,017 58,728 63,707 52,570 63,004
2,630 -4,113 819 -1,581 -2,035 -506 -929 -3,269 635 -2,886 -2,357 -639 1,804
Primary income 21,591 17,452 18,936 4,127 16,935 19,811 15,100 14,749 12,049 6,841 12,655 19,751 21,951
Secondary income -3,269 -2,002 -2,487 -406 -1,511 -1,781 -2,200 -1,673 -1,817 -900 -1,108 -1,745 -3,333
Capital Account -234 204 -80 -87 -466 -129 -269 -790 -99 -99 -235 -119 -315
Financial Account 52,077 16,157 40,013 13,627 40,236 31,244 33,480 7,866 11,842 2,412 -15,351 17,752 50,249
11,557 8,492 5,383 4,652 4,767 -1,211 45,202 15,546 6,326 21,066 11,110 21,355 24,228
93,875 -52,627 66,788 30,083 32,147 65,577 4,580 31,254 -23,402 -51,994 -47,137 -28,642 35,134
-3,107 -4,656 -3,139 -4,131 -3,308 -4,023 -1,687 -925 4,863 11,968 5,916 3,758 2,287
-47,586 65,239 -31,097 -14,318 8,702 -28,793 -15,786 -33,063 22,284 22,075 3,775 16,762 -7,559
-2,663 -292 2,077 -2,659 -2,073 -306 1,171 -4,946 1,771 -704 10,986 4,519 -3,841
22,588 -2,209 22,517 3,949 21,306 11,669 15,106 -6,811 -2,326 -8,632 -15,771 -10,265 21,486
(Notes) 1. Totals may not add due to rounding.2. "(P)" means Preliminary.
Services
Direct investment
Portfolio investment
Financial derivatives(other than reserves)
Other investment
Reserve assets
Net errors & omissions
― 18 ―
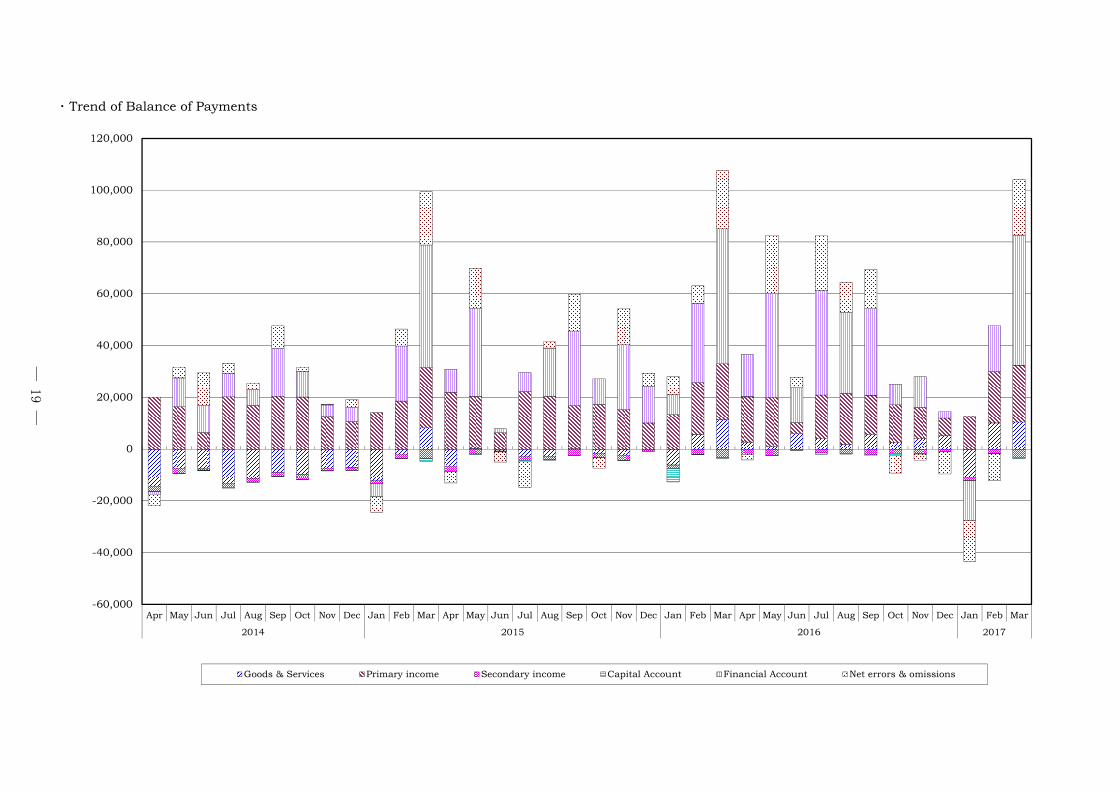
・ Trend of Balance of Payments
-60,000
-40,000
-20,000
0
20,000
40,000
60,000
80,000
100,000
120,000
Apr May Jun Jul Aug Sep Oct Nov Dec Jan Feb Mar Apr May Jun Jul Aug Sep Oct Nov Dec Jan Feb Mar Apr May Jun Jul Aug Sep Oct Nov Dec Jan Feb Mar
2014 2015 2016 2017
Goods & Services Primary income Secondary income Capital Account Financial Account Net errors & omissions
― 19 ―
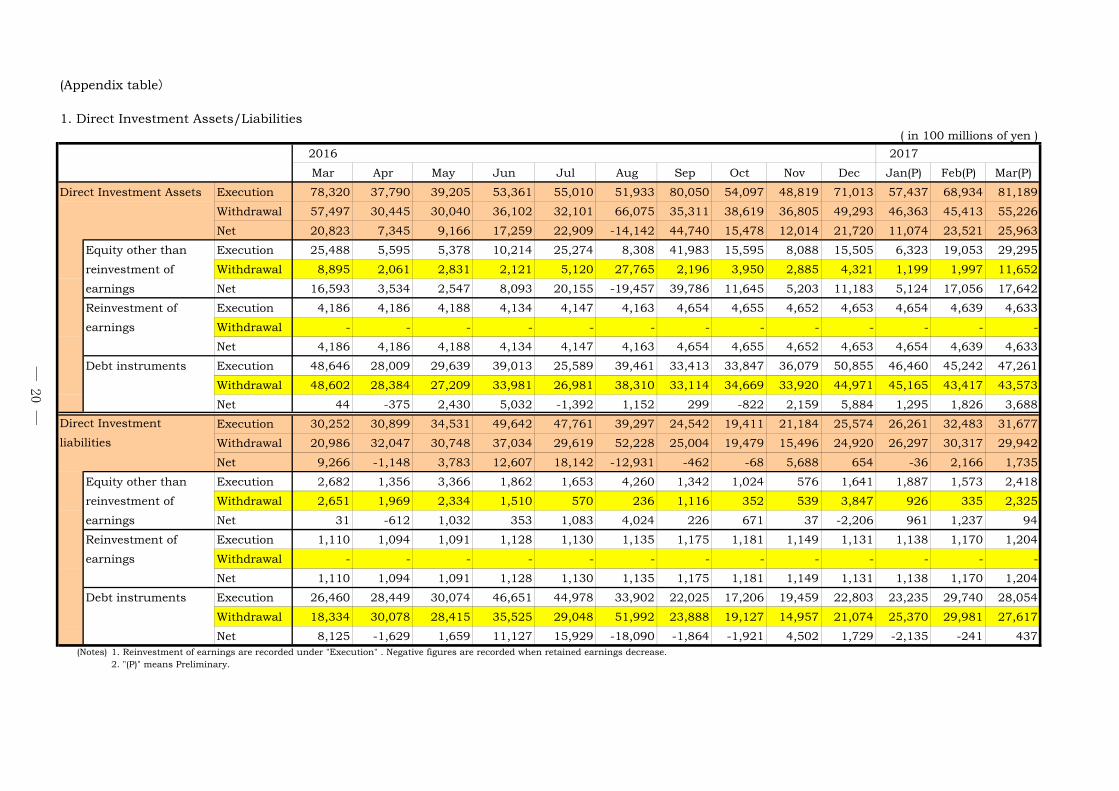
(Appendix table)
1. Direct Investment Assets/Liabilities( in 100 millions of yen )
2016 2017
Mar Apr May Jun Jul Aug Sep Oct Nov Dec Jan(P) Feb(P) Mar(P)
Direct Investment Assets Execution 78,320 37,790 39,205 53,361 55,010 51,933 80,050 54,097 48,819 71,013 57,437 68,934 81,189
Withdrawal 57,497 30,445 30,040 36,102 32,101 66,075 35,311 38,619 36,805 49,293 46,363 45,413 55,226
Net 20,823 7,345 9,166 17,259 22,909 -14,142 44,740 15,478 12,014 21,720 11,074 23,521 25,963
Equity other than Execution 25,488 5,595 5,378 10,214 25,274 8,308 41,983 15,595 8,088 15,505 6,323 19,053 29,295
reinvestment of Withdrawal 8,895 2,061 2,831 2,121 5,120 27,765 2,196 3,950 2,885 4,321 1,199 1,997 11,652
earnings Net 16,593 3,534 2,547 8,093 20,155 -19,457 39,786 11,645 5,203 11,183 5,124 17,056 17,642
Reinvestment of Execution 4,186 4,186 4,188 4,134 4,147 4,163 4,654 4,655 4,652 4,653 4,654 4,639 4,633
earnings Withdrawal - - - - - - - - - - - - -
Net 4,186 4,186 4,188 4,134 4,147 4,163 4,654 4,655 4,652 4,653 4,654 4,639 4,633
Debt instruments Execution 48,646 28,009 29,639 39,013 25,589 39,461 33,413 33,847 36,079 50,855 46,460 45,242 47,261
Withdrawal 48,602 28,384 27,209 33,981 26,981 38,310 33,114 34,669 33,920 44,971 45,165 43,417 43,573
Net 44 -375 2,430 5,032 -1,392 1,152 299 -822 2,159 5,884 1,295 1,826 3,688
Execution 30,252 30,899 34,531 49,642 47,761 39,297 24,542 19,411 21,184 25,574 26,261 32,483 31,677
Withdrawal 20,986 32,047 30,748 37,034 29,619 52,228 25,004 19,479 15,496 24,920 26,297 30,317 29,942
Net 9,266 -1,148 3,783 12,607 18,142 -12,931 -462 -68 5,688 654 -36 2,166 1,735
Equity other than Execution 2,682 1,356 3,366 1,862 1,653 4,260 1,342 1,024 576 1,641 1,887 1,573 2,418
reinvestment of Withdrawal 2,651 1,969 2,334 1,510 570 236 1,116 352 539 3,847 926 335 2,325
earnings Net 31 -612 1,032 353 1,083 4,024 226 671 37 -2,206 961 1,237 94
Reinvestment of Execution 1,110 1,094 1,091 1,128 1,130 1,135 1,175 1,181 1,149 1,131 1,138 1,170 1,204
earnings Withdrawal - - - - - - - - - - - - -
Net 1,110 1,094 1,091 1,128 1,130 1,135 1,175 1,181 1,149 1,131 1,138 1,170 1,204
Debt instruments Execution 26,460 28,449 30,074 46,651 44,978 33,902 22,025 17,206 19,459 22,803 23,235 29,740 28,054
Withdrawal 18,334 30,078 28,415 35,525 29,048 51,992 23,888 19,127 14,957 21,074 25,370 29,981 27,617
Net 8,125 -1,629 1,659 11,127 15,929 -18,090 -1,864 -1,921 4,502 1,729 -2,135 -241 437(Notes) 1. Reinvestment of earnings are recorded under "Execution" . Negative figures are recorded when retained earnings decrease.
2. "(P)" means Preliminary.
liabilities
Direct Investment
― 20 ―
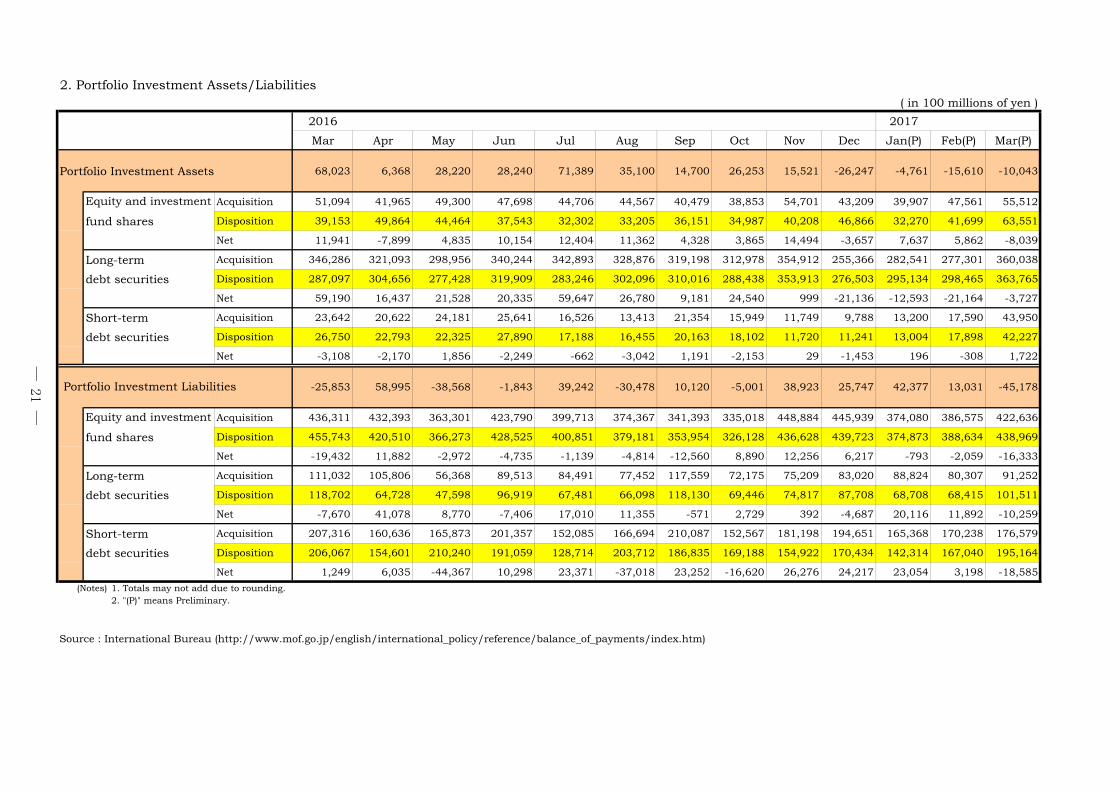
2. Portfolio Investment Assets/Liabilities( in 100 millions of yen )
2016 2017
Mar Apr May Jun Jul Aug Sep Oct Nov Dec Jan(P) Feb(P) Mar(P)
Portfolio Investment Assets 68,023 6,368 28,220 28,240 71,389 35,100 14,700 26,253 15,521 -26,247 -4,761 -15,610 -10,043
Acquisition 51,094 41,965 49,300 47,698 44,706 44,567 40,479 38,853 54,701 43,209 39,907 47,561 55,512
fund shares Disposition 39,153 49,864 44,464 37,543 32,302 33,205 36,151 34,987 40,208 46,866 32,270 41,699 63,551
Net 11,941 -7,899 4,835 10,154 12,404 11,362 4,328 3,865 14,494 -3,657 7,637 5,862 -8,039
Long-term Acquisition 346,286 321,093 298,956 340,244 342,893 328,876 319,198 312,978 354,912 255,366 282,541 277,301 360,038
debt securities Disposition 287,097 304,656 277,428 319,909 283,246 302,096 310,016 288,438 353,913 276,503 295,134 298,465 363,765
Net 59,190 16,437 21,528 20,335 59,647 26,780 9,181 24,540 999 -21,136 -12,593 -21,164 -3,727
Short-term Acquisition 23,642 20,622 24,181 25,641 16,526 13,413 21,354 15,949 11,749 9,788 13,200 17,590 43,950
debt securities Disposition 26,750 22,793 22,325 27,890 17,188 16,455 20,163 18,102 11,720 11,241 13,004 17,898 42,227
Net -3,108 -2,170 1,856 -2,249 -662 -3,042 1,191 -2,153 29 -1,453 196 -308 1,722
-25,853 58,995 -38,568 -1,843 39,242 -30,478 10,120 -5,001 38,923 25,747 42,377 13,031 -45,178
Acquisition 436,311 432,393 363,301 423,790 399,713 374,367 341,393 335,018 448,884 445,939 374,080 386,575 422,636
fund shares Disposition 455,743 420,510 366,273 428,525 400,851 379,181 353,954 326,128 436,628 439,723 374,873 388,634 438,969
Net -19,432 11,882 -2,972 -4,735 -1,139 -4,814 -12,560 8,890 12,256 6,217 -793 -2,059 -16,333
Long-term Acquisition 111,032 105,806 56,368 89,513 84,491 77,452 117,559 72,175 75,209 83,020 88,824 80,307 91,252
debt securities Disposition 118,702 64,728 47,598 96,919 67,481 66,098 118,130 69,446 74,817 87,708 68,708 68,415 101,511
Net -7,670 41,078 8,770 -7,406 17,010 11,355 -571 2,729 392 -4,687 20,116 11,892 -10,259
Short-term Acquisition 207,316 160,636 165,873 201,357 152,085 166,694 210,087 152,567 181,198 194,651 165,368 170,238 176,579
debt securities Disposition 206,067 154,601 210,240 191,059 128,714 203,712 186,835 169,188 154,922 170,434 142,314 167,040 195,164
Net 1,249 6,035 -44,367 10,298 23,371 -37,018 23,252 -16,620 26,276 24,217 23,054 3,198 -18,585
(Notes) 1. Totals may not add due to rounding.2. "(P)" means Preliminary.
Source : International Bureau (http://www.mof.go.jp/english/international_policy/reference/balance_of_payments/index.htm)
Portfolio Investment Liabilities
Equity and investment
Equity and investment
― 21 ―
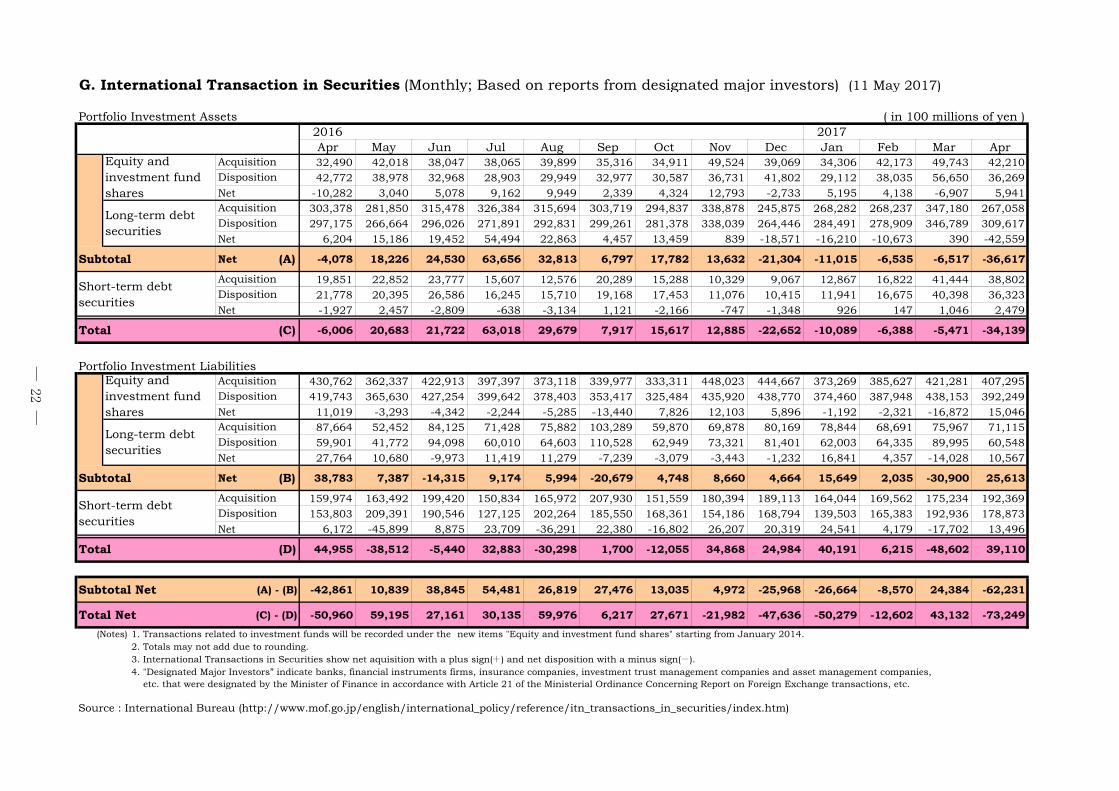
G. International Transaction in Securities (Monthly; Based on reports from designated major investors) (11 May 2017)
Portfolio Investment Assets ( in 100 millions of yen )2016 2017Apr May Jun Jul Aug Sep Oct Nov Dec Jan Feb Mar Apr32,490 42,018 38,047 38,065 39,899 35,316 34,911 49,524 39,069 34,306 42,173 49,743 42,21042,772 38,978 32,968 28,903 29,949 32,977 30,587 36,731 41,802 29,112 38,035 56,650 36,269
Net -10,282 3,040 5,078 9,162 9,949 2,339 4,324 12,793 -2,733 5,195 4,138 -6,907 5,941303,378 281,850 315,478 326,384 315,694 303,719 294,837 338,878 245,875 268,282 268,237 347,180 267,058297,175 266,664 296,026 271,891 292,831 299,261 281,378 338,039 264,446 284,491 278,909 346,789 309,617
Net 6,204 15,186 19,452 54,494 22,863 4,457 13,459 839 -18,571 -16,210 -10,673 390 -42,559
Subtotal Net (A) -4,078 18,226 24,530 63,656 32,813 6,797 17,782 13,632 -21,304 -11,015 -6,535 -6,517 -36,617
19,851 22,852 23,777 15,607 12,576 20,289 15,288 10,329 9,067 12,867 16,822 41,444 38,80221,778 20,395 26,586 16,245 15,710 19,168 17,453 11,076 10,415 11,941 16,675 40,398 36,323
Net -1,927 2,457 -2,809 -638 -3,134 1,121 -2,166 -747 -1,348 926 147 1,046 2,479
Total (C) -6,006 20,683 21,722 63,018 29,679 7,917 15,617 12,885 -22,652 -10,089 -6,388 -5,471 -34,139
Portfolio Investment Liabilities430,762 362,337 422,913 397,397 373,118 339,977 333,311 448,023 444,667 373,269 385,627 421,281 407,295419,743 365,630 427,254 399,642 378,403 353,417 325,484 435,920 438,770 374,460 387,948 438,153 392,249
Net 11,019 -3,293 -4,342 -2,244 -5,285 -13,440 7,826 12,103 5,896 -1,192 -2,321 -16,872 15,04687,664 52,452 84,125 71,428 75,882 103,289 59,870 69,878 80,169 78,844 68,691 75,967 71,11559,901 41,772 94,098 60,010 64,603 110,528 62,949 73,321 81,401 62,003 64,335 89,995 60,548
Net 27,764 10,680 -9,973 11,419 11,279 -7,239 -3,079 -3,443 -1,232 16,841 4,357 -14,028 10,567
Subtotal Net (B) 38,783 7,387 -14,315 9,174 5,994 -20,679 4,748 8,660 4,664 15,649 2,035 -30,900 25,613
159,974 163,492 199,420 150,834 165,972 207,930 151,559 180,394 189,113 164,044 169,562 175,234 192,369153,803 209,391 190,546 127,125 202,264 185,550 168,361 154,186 168,794 139,503 165,383 192,936 178,873
Net 6,172 -45,899 8,875 23,709 -36,291 22,380 -16,802 26,207 20,319 24,541 4,179 -17,702 13,496
Total (D) 44,955 -38,512 -5,440 32,883 -30,298 1,700 -12,055 34,868 24,984 40,191 6,215 -48,602 39,110
Subtotal Net (A) - (B) -42,861 10,839 38,845 54,481 26,819 27,476 13,035 4,972 -25,968 -26,664 -8,570 24,384 -62,231
Total Net (C) - (D) -50,960 59,195 27,161 30,135 59,976 6,217 27,671 -21,982 -47,636 -50,279 -12,602 43,132 -73,249
(Notes) 1. Transactions related to investment funds will be recorded under the new items "Equity and investment fund shares" starting from January 2014.2. Totals may not add due to rounding.3. International Transactions in Securities show net aquisition with a plus sign(+) and net disposition with a minus sign(-).4. "Designated Major Investors” indicate banks, financial instruments firms, insurance companies, investment trust management companies and asset management companies, etc. that were designated by the Minister of Finance in accordance with Article 21 of the Ministerial Ordinance Concerning Report on Foreign Exchange transactions, etc.
Source : International Bureau (http://www.mof.go.jp/english/international_policy/reference/itn_transactions_in_securities/index.htm)
AcquisitionDisposition
Equity andinvestment fundshares
AcquisitionDisposition
Long-term debtsecurities
AcquisitionDisposition
Short-term debtsecurities
Short-term debtsecurities
Equity andinvestment fundshares
Long-term debtsecurities
AcquisitionDisposition
AcquisitionDisposition
AcquisitionDisposition
― 22 ―
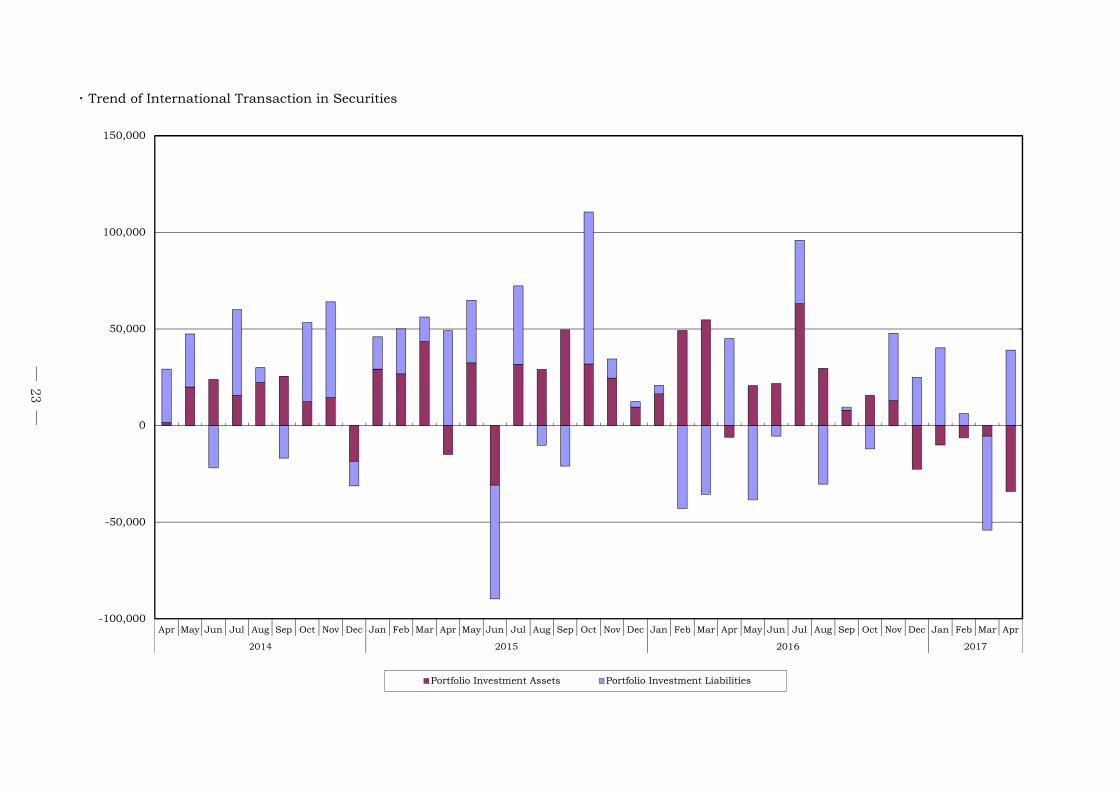
・ Trend of International Transaction in Securities
-100,000
-50,000
0
50,000
100,000
150,000
Apr May Jun Jul Aug Sep Oct Nov Dec Jan Feb Mar Apr May Jun Jul Aug Sep Oct Nov Dec Jan Feb Mar Apr May Jun Jul Aug Sep Oct Nov Dec Jan Feb Mar Apr
2014 2015 2016 2017
Portfolio Investment Assets Portfolio Investment Liabilities
― 23 ―
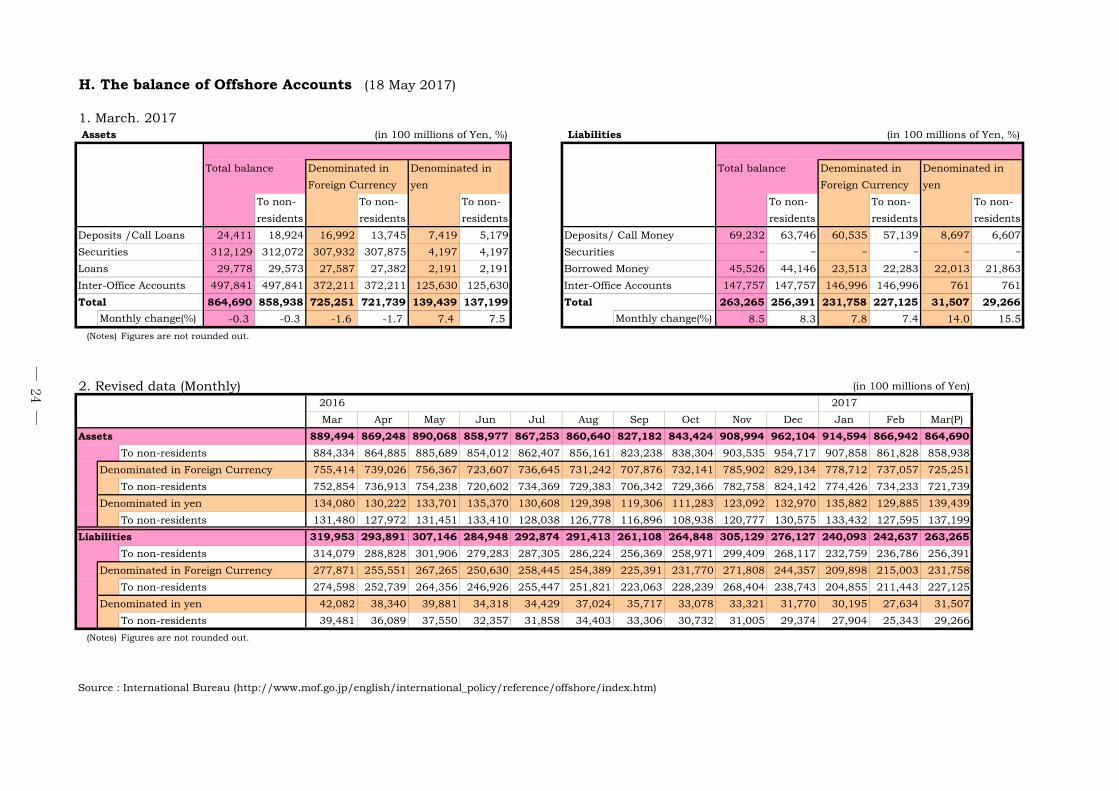
H. The balance of Offshore Accounts (18 May 2017)
1. March. 2017 Assets (in 100 millions of Yen, %) Liabilities (in 100 millions of Yen, %)
Total balance Denominated in Denominated in Total balance Denominated in Denominated in
Foreign Currency yen Foreign Currency yen
To non- To non- To non- To non- To non- To non-
residents residents residents residents residents residents
Deposits /Call Loans 24,411 18,924 16,992 13,745 7,419 5,179 Deposits/ Call Money 69,232 63,746 60,535 57,139 8,697 6,607
Securities 312,129 312,072 307,932 307,875 4,197 4,197 Securities - - - - - -
Loans 29,778 29,573 27,587 27,382 2,191 2,191 Borrowed Money 45,526 44,146 23,513 22,283 22,013 21,863
Inter-Office Accounts 497,841 497,841 372,211 372,211 125,630 125,630 Inter-Office Accounts 147,757 147,757 146,996 146,996 761 761
Total 864,690 858,938 725,251 721,739 139,439 137,199 Total 263,265 256,391 231,758 227,125 31,507 29,266
-0.3 -0.3 -1.6 -1.7 7.4 7.5 8.5 8.3 7.8 7.4 14.0 15.5
(Notes) Figures are not rounded out.
2. Revised data (Monthly) (in 100 millions of Yen)
2016 2017
Mar Apr May Jun Jul Aug Sep Oct Nov Dec Jan Feb Mar(P)
Assets 889,494 869,248 890,068 858,977 867,253 860,640 827,182 843,424 908,994 962,104 914,594 866,942 864,690
To non-residents 884,334 864,885 885,689 854,012 862,407 856,161 823,238 838,304 903,535 954,717 907,858 861,828 858,938
Denominated in Foreign Currency 755,414 739,026 756,367 723,607 736,645 731,242 707,876 732,141 785,902 829,134 778,712 737,057 725,251
To non-residents 752,854 736,913 754,238 720,602 734,369 729,383 706,342 729,366 782,758 824,142 774,426 734,233 721,739
Denominated in yen 134,080 130,222 133,701 135,370 130,608 129,398 119,306 111,283 123,092 132,970 135,882 129,885 139,439
To non-residents 131,480 127,972 131,451 133,410 128,038 126,778 116,896 108,938 120,777 130,575 133,432 127,595 137,199
Liabilities 319,953 293,891 307,146 284,948 292,874 291,413 261,108 264,848 305,129 276,127 240,093 242,637 263,265
To non-residents 314,079 288,828 301,906 279,283 287,305 286,224 256,369 258,971 299,409 268,117 232,759 236,786 256,391
Denominated in Foreign Currency 277,871 255,551 267,265 250,630 258,445 254,389 225,391 231,770 271,808 244,357 209,898 215,003 231,758
To non-residents 274,598 252,739 264,356 246,926 255,447 251,821 223,063 228,239 268,404 238,743 204,855 211,443 227,125
Denominated in yen 42,082 38,340 39,881 34,318 34,429 37,024 35,717 33,078 33,321 31,770 30,195 27,634 31,507
To non-residents 39,481 36,089 37,550 32,357 31,858 34,403 33,306 30,732 31,005 29,374 27,904 25,343 29,266
(Notes) Figures are not rounded out.
Source : International Bureau (http://www.mof.go.jp/english/international_policy/reference/offshore/index.htm)
Monthly change(%)Monthly change(%)
― 24 ―
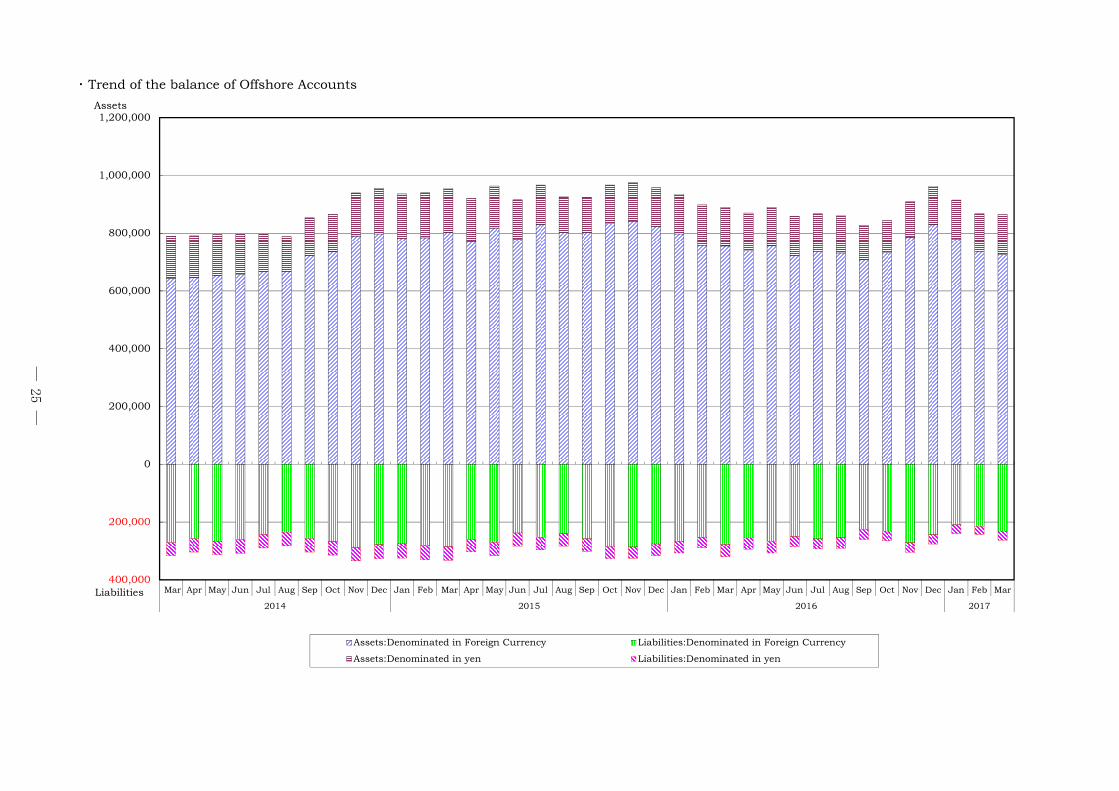
・ Trend of the balance of Offshore Accounts
400,000
200,000
0
200,000
400,000
600,000
800,000
1,000,000
1,200,000
Mar Apr May Jun Jul Aug Sep Oct Nov Dec Jan Feb Mar Apr May Jun Jul Aug Sep Oct Nov Dec Jan Feb Mar Apr May Jun Jul Aug Sep Oct Nov Dec Jan Feb Mar
2014 2015 2016 2017
Assets:Denominated in Foreign Currency Liabilities:Denominated in Foreign Currency
Assets:Denominated in yen Liabilities:Denominated in yen
Assets
Liabilities
― 25 ―
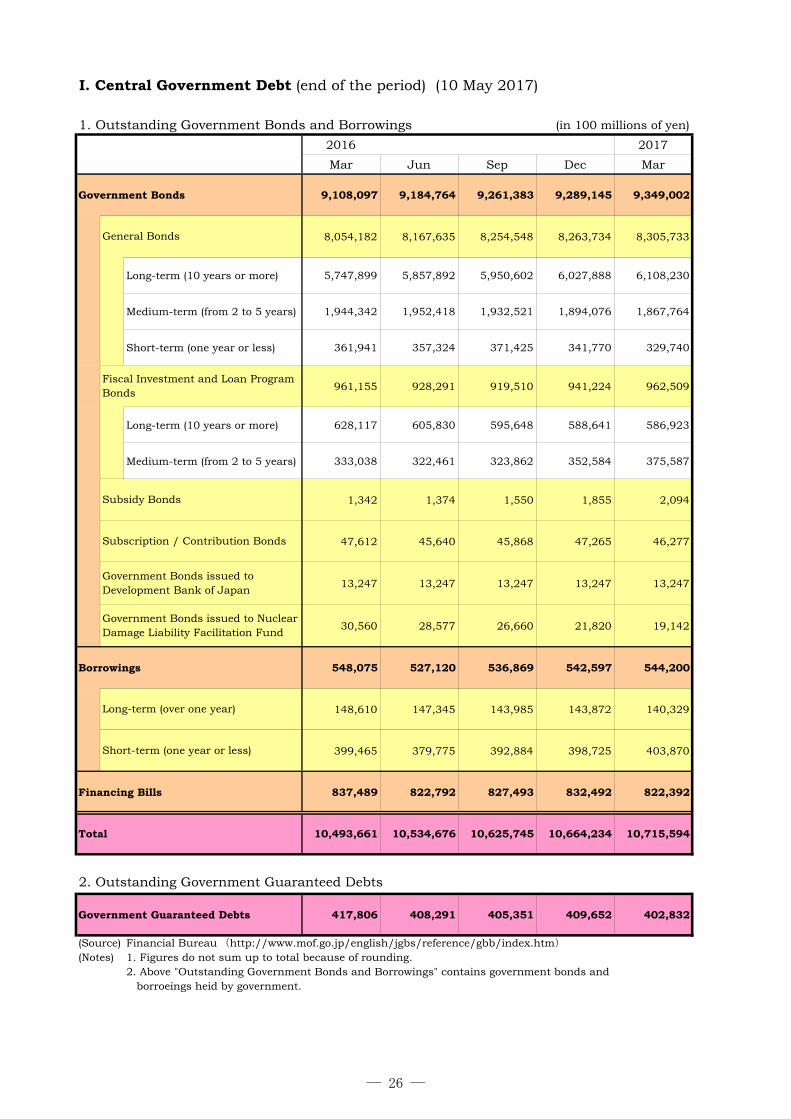
I. Central Government Debt (end of the period) (10 May 2017)
1. Outstanding Government Bonds and Borrowings (in 100 millions of yen)
2016 2017
Mar Jun Sep Dec Mar
Government Bonds 9,108,097 9,184,764 9,261,383 9,289,145 9,349,002
8,054,182 8,167,635 8,254,548 8,263,734 8,305,733
Long-term (10 years or more) 5,747,899 5,857,892 5,950,602 6,027,888 6,108,230
Medium-term (from 2 to 5 years) 1,944,342 1,952,418 1,932,521 1,894,076 1,867,764
Short-term (one year or less) 361,941 357,324 371,425 341,770 329,740
961,155 928,291 919,510 941,224 962,509
Long-term (10 years or more) 628,117 605,830 595,648 588,641 586,923
Medium-term (from 2 to 5 years) 333,038 322,461 323,862 352,584 375,587
1,342 1,374 1,550 1,855 2,094
47,612 45,640 45,868 47,265 46,277
13,247 13,247 13,247 13,247 13,247
30,560 28,577 26,660 21,820 19,142
Borrowings 548,075 527,120 536,869 542,597 544,200
148,610 147,345 143,985 143,872 140,329
399,465 379,775 392,884 398,725 403,870
Financing Bills 837,489 822,792 827,493 832,492 822,392
Total 10,493,661 10,534,676 10,625,745 10,664,234 10,715,594
2. Outstanding Government Guaranteed Debts
Government Guaranteed Debts 417,806 408,291 405,351 409,652 402,832
(Source) Financial Bureau (http://www.mof.go.jp/english/jgbs/reference/gbb/index.htm)
(Notes) 1. Figures do not sum up to total because of rounding.2. Above "Outstanding Government Bonds and Borrowings" contains government bonds and borroeings heid by government.
General Bonds
Fiscal Investment and Loan ProgramBonds
Subsidy Bonds
Long-term (over one year)
Short-term (one year or less)
Government Bonds issued toDevelopment Bank of Japan
Government Bonds issued to NuclearDamage Liability Facilitation Fund
Subscription / Contribution Bonds
― 26 ―
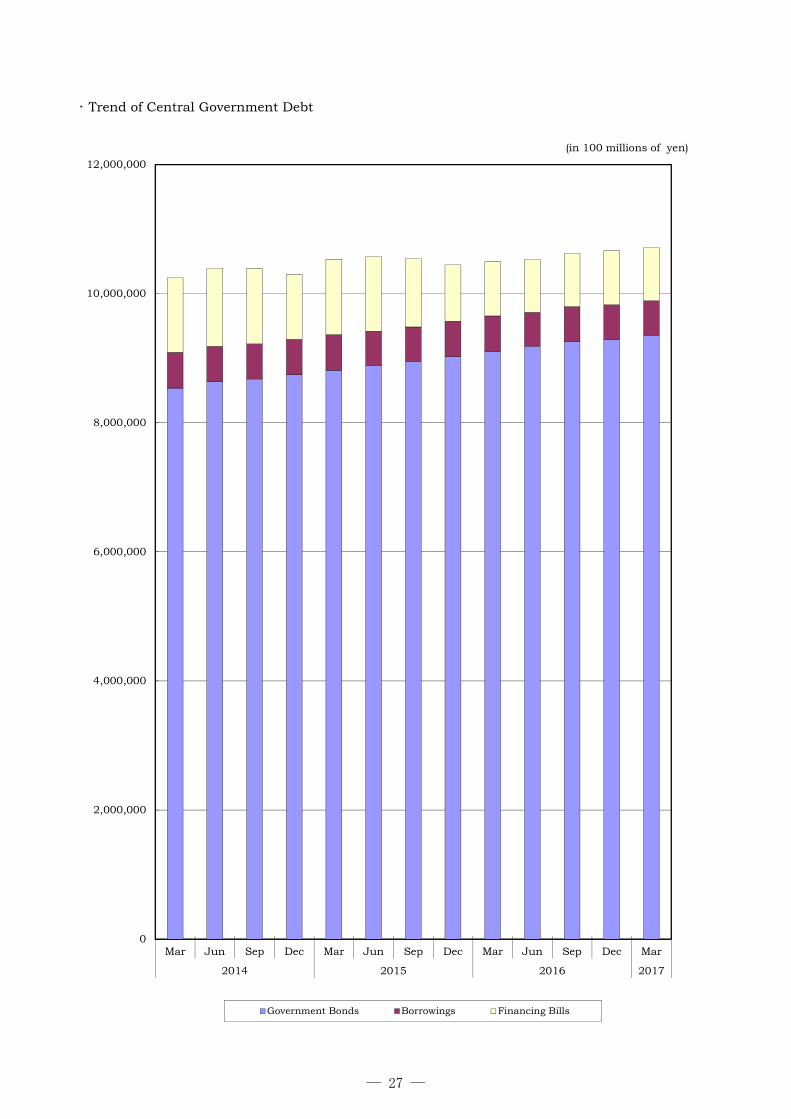
・ Trend of Central Government Debt
0
2,000,000
4,000,000
6,000,000
8,000,000
10,000,000
12,000,000
Mar Jun Sep Dec Mar Jun Sep Dec Mar Jun Sep Dec Mar
2014 2015 2016 2017
Government Bonds Borrowings Financing Bills
(in 100 millions of yen)
― 27 ―


PUBLIC RELATIONS & PRESS RELEASE
A. The Joint Statement of The 20th ASEAN+3 Finance Ministers’ Meeting (5 May 2017 / Yokohama, Japan)
May 5, 2017
― 30 ―
The Joint Statement of the 20th ASEAN+3 Finance Ministers’ and Central Bank Governors’ Meeting
(Yokohama, Japan, May 5th 2017)
I. Introduction 1. We, the Finance Ministers and Central Bank Governors of ASEAN, China, Japan and Korea
(ASEAN+3), convened our 20th meeting in Yokohama, Japan, under the co-chairmanship ofH.E. Carlos G. Dominguez III, Finance Secretary of the Philippines, and H.E. Taro Aso,Deputy Prime Minister and Minister of Finance of Japan. The President of the AsianDevelopment Bank (ADB), the Director of ASEAN+3 Macroeconomic Research Office(AMRO), the Deputy Secretary General of ASEAN, and the Deputy Managing Director of theInternational Monetary Fund (IMF) were also present at our meeting.
2. We exchanged views on recent global and regional economic developments and policyresponses. We reviewed the progress of regional financial cooperation achieved since our lastmeeting in Frankfurt, Germany, including the Chiang Mai Initiative Multilateralisation(CMIM), AMRO and Asian Bond Markets Initiative (ABMI). We also discussed measures tofurther strengthen our regional financial cooperation in the future and agreed on the“Yokohama Vision”, our guiding principles for a more resilient and integrated ASEAN+3(attached as “Annex” to this statement).
II. Recent Economic and Financial Developments in the Region3. We are pleased that the ASEAN+3 region is expected to maintain a relatively robust growth
and will continue to play a leading role in sustaining global growth, supported by regionalmembers’ continuing structural reforms and effective implementation of macroeconomicpolicies. We recognize that global growth is expected to rise with buoyant financial market anda long-awaited cyclical recovery in manufacturing and trade underway. However, risks for theglobal economy remain skewed to the downside, especially over the medium term, withpervasive uncertainties surrounding policies. The sources of uncertainties include an inwardshift in policies, including toward protectionism, and sharper-than-expected financialtightening.
4. Under these circumstances, we reaffirmed our commitment to regional financial cooperation,and support our open and rules-based multilateral trade and investment systems, which willcontinue to strengthen our economies. We also reiterated the importance of utilizing allnecessary policy tools – monetary, fiscal and structural – individually and collectively topromote sustainable, balanced and inclusive growth and to enhance economic and financial
― 31 ―
resilience, taking into account regional members’ specific circumstances. Monetary policy will continue to support economic activity and ensure price stability, consistent with Central Banks’ mandate, but monetary policy alone cannot lead to balanced growth. Fiscal policy should be used flexibly and be growth-friendly, prioritize high-quality investment, and support reforms that would provide opportunities and promote inclusiveness, while ensuring debt as a share of GDP is on a sustainable path. We reaffirmed our commitment to structural reforms that will lift potential growth of the region and enhance member countries’ resilience. These reforms should be appropriately tailored, prioritized and sequenced, depending on country-specific circumstances. We will continue to adopt the appropriate policy mix to achieve balanced growth and financial stability. We will carefully calibrate and clearly communicate our macroeconomic and structural policy actions, including the use of macro-prudential measures, to reduce policy uncertainty, minimize negative spillovers and promote transparency.
5. We recognized the importance and benefits of open capital markets and of improving the system underpinning international capital flows while continuing to enhance the monitoring of capital flows and to strengthen the management of risks stemming from excessive capital flow volatility. An open and resilient financial system is crucial to supporting sustainable growth and development. In this light, we will continue to closely monitor, and if necessary, address emerging risks, particularly those that are systemic, as well as the vulnerabilities in the financial system.
III. Strengthening Regional Financial Cooperation Chiang Mai Initiative Multilateralisation (CMIM)
6. We affirmed our commitment to further strengthen the CMIM as an essential part of the regional financial safety net. In this regard, we welcomed the revision of the CMIM Operational Guidelines to clarify the activation process of the IMF De-linked Portion of the CMIM, as well as the progress in the preparation of the CMIM Conditionality Framework. We also welcomed the Deputies’ endorsement of the assessment methodology on the increase in the IMF De-linked Portion. We appreciated all these efforts and the significant progress that has been made in working towards the potential increase of the IMF De-linked Portion. We look forward to further progress on this issue. It is encouraging to note that the CMIM, with its current size of USD 240 billion, is at the center of our regional financial safety net, complemented by the network of bilateral swap arrangements in the region amounting to more than USD 160 billion.
7. We welcomed the development of the qualification indicators for the CMIM-Precautionary Line, based on the Economic Review and Policy Dialogue (ERPD) Matrix, that consists of key economic and financial indicators of all ASEAN+3 member economies. We look forward to the successful completion of the pilot project for the ERPD Matrix peacetime procedure and progress on ERPD Matrix indicators and benchmarks, in cooperation with AMRO.
― 32 ―
8. We noted that the CMIM also contributes to a stronger global financial safety net with the IMF at its center. In this regard, we welcomed the successful completion of the 7th Test Run which examined the activation of the CMIM arrangement with the IMF program. It has highlighted the importance of improving CMIM’s readiness and effectiveness by (i) addressing issues that are fundamental to the CMIM, (ii) improving CMIM-IMF coordination (including burden sharing, financing conditions and information sharing), and (iii) enhancing AMRO’s capacity. These important works have been included in our plan on the Periodic Review of the CMIM Agreement, and we look forward to strong progress towards this direction by our next meeting, including the reports from the two Working Groups (WGs), one on CMIM fundamental issues and the other on the coordination with IMF. We will deepen our engagement with the IMF with the aim of resolving operational issues that may arise in order to further strengthen the supplementary role of the CMIM in the global financial safety net.
ASEAN+3 Macroeconomic Research Office (AMRO) 9. We are pleased with the finalization of AMRO's Strategic Direction and Medium-term
Implementation Plan (SD&MTIP) as approved by the Deputies. We encouraged AMRO to execute the SD&MTIP and contribute to the region’s macroeconomic and financial stability, by delivering high quality and original surveillance to member economies, and providing strong support for the CMIM. We noted AMRO’s significant efforts in enhancing its surveillance capacity which resulted in the publication of the very first edition of its flagship report, the "ASEAN+3 Regional Economic Outlook”. We look forward to more focused and comprehensive surveillance activities and welcomed AMRO’s "Guidance Note for AMRO Country Surveillance Consultation” to serve as guidelines for its country consultations and regional assessments. We commended the Deputies' endorsement of AMRO's Publication Policy which will promote its accountability and visibility beyond the regional platform and solidify its presence as an international organization. We continue to support AMRO in enhancing its surveillance and organizational capacity to fulfill its mandate as an independent, credible and professional regional organization acting as a trusted policy advisor to members in the ASEAN+3 region.
10. We appreciate AMRO's efforts to support the CMIM activities of ASEAN+3. We expect to enhance AMRO’s role to support members in the implementation of the CMIM. With AMRO's enhanced surveillance capacity, we look forward to its further contribution to ensuring the macroeconomic and financial stability of the region. We expect AMRO’s active participation in the CMIM Periodic Review in coordination with the WGs to enhance the operational readiness of the CMIM.
11. Recognizing that building multi-layered macroeconomic and financial stability mechanism worldwide is key to stability, we encouraged AMRO to explore closer cooperation with global and other regional financial institutions, which would also help enhance AMRO's organizational capacity through information sharing, joint activities and staff exchanges. We
― 33 ―
welcomed the conclusion of a Memorandum of Understanding between AMRO and the ADB to further their cooperation, and look forward to the early conclusion of a Memorandum of Understanding between AMRO and the IMF.
12. We welcomed the establishment of the trust funds in AMRO, with contributions from China, Japan and Korea, boosting the implementation of AMRO's technical assistance program. We reiterated the importance of enhancing surveillance capacity of member economies and encouraged AMRO to continue upgrading and expanding its technical assistance activities according to the needs of members.
13. We commended Director Chang Junhong for her excellent management of AMRO as a full-fledged international organization, and look forward to her continued leadership in guiding AMRO as an independent, credible and reliable surveillance unit.
Asian Bond Markets Initiative (ABMI) 14. We welcomed the significant contribution of the ABMI to developing local currency bond
markets across the region, channeling the region’s large savings to finance its own investment, and mitigating currency and maturity mismatches since its establishment. Beyond the bond markets, we recognized the necessity of expanding ABMI’s role on building up our financial markets as a whole, and further promoting use of local currencies, given increased funding needs in local currencies within the region, as a way of managing heightened volatility in global financial markets.
15. We noted the proposal to increase the capital of the Credit Guarantee and Investment Facility (CGIF), recognized the importance of expanding its guarantee capacity, and look forward to an early decision on this issue. We encouraged continued support and financial contribution from the ADB. In view of massive infrastructure needs in the region, we encouraged CGIF to contribute to fulfilling funding needs through its guarantee to project bonds for infrastructure. We welcomed the effort and steady progress since our last meeting toward implementing the Central Securities Depository (CSD)-Real Time Gross Settlement (RTGS) linkage between BOJ and HKMA in accordance with the roadmap for establishing a regional settlement intermediary in ASEAN+3. We look forward to further cross-border bond issuances under the ASEAN+3 Multi-currency Bond Issuance Framework (AMBIF).
16. We noted the progress of the new study to promote local currency denominated green bond for infrastructure, the expansion of data coverage and analysis of Asian Bonds Online (ABO), in line with the ABMI Medium-Term Road Map. We also welcomed the launch of a new study for ASEAN+3 bonds to be recognized as prime collateral globally. We will strategically implement the technical assistance under the Technical Assistance Coordination Team (TACT), especially to better prepare the recipient countries, which are still dependent on external concessionary loans to cover their fiscal deficit, for the development of their government bond markets.
17. We welcomed the publication of “Good Practices in Developing Bond Market”, which puts
― 34 ―

together the significant achievement in the ASEAN government bond market, and hope that this document will facilitate knowledge sharing among ASEAN+3 members as well as dissemination of our experiences to other regions.
ASEAN+3 Financial Cooperation in Disaster Risk Financing and Insurance 18. In view of the high exposure of ASEAN countries to natural disaster risks, we commended the
progress of the ASEAN Disaster Risk Financing and Insurance Program with the three main components of risk assessment and modelling, public policy and knowledge management and training. We hope this program will lead to strengthening the region’s capacity in disaster risk financing and insurance. Furthermore, building on the past study on disaster risk insurance under Future Priorities of ASEAN+3 Financial Cooperation in 2015, the initiative by Cambodia, Lao PDR and Myanmar to create the Southeast Asia Disaster Risk Insurance Facility (SEADRIF), with initial financial support from Japan, is key to establishing a regional catastrophic risk pool. We also welcomed the agreement of Cambodia, Lao PDR, Myanmar, and Japan to jointly conduct the feasibility study and the preparation for the establishment of the SEADRIF, with technical support from the World Bank. We invite other ASEAN+3 countries to join, and donor partners to support, this initiative.
IV. Conclusion 19. We expressed our appreciation to the governments of the Philippines and Japan for their
excellent arrangements as the co-chairs of the ASEAN+3 Finance Ministers and Central Bank Governors’ Process in 2017. We also thanked Japan for its warm hospitality here in Yokohama.
20. We agreed to meet in Manila, Philippines in 2018. Singapore and Korea will be the co-chairs of the ASEAN+3 Finance Ministers and Central Bank Governors’ Process in 2018.
― 35 ―
Annex
Yokohama Vision -For a more resilient and integrated ASEAN+3 in the future-
(Yokohama, Japan, May 5th 2017) This year marks the 20th anniversary of the Asian Financial Crisis, which caused serious damages to the ASEAN+3 region. After the crisis, individual countries have undertaken significant reforms, and implemented sound macroeconomic policies which have made us more resilient. On the multilateral front, the CMIM was established as a regional financial safety net, with the AMRO functioning as its surveillance unit. The ABMI also facilitated the development of the local currency bond markets, significantly reducing the currency and maturity mismatches in the region. With these improvements, the ASEAN+3 region weathered the Global Financial Crisis in 2008 and the taper tantrum in 2013 with limited adverse impacts in contrast to the rest of the world. However, if we look ahead in the future, we need to be vigilant against various kinds of economic and non-economic risks and shocks. In this light, we recognize the importance of further enhancing economic resilience in the region through our collective efforts, in view of our shared responsibility to contribute to sustainable global growth as one of its major drivers. Furthermore, we also recognize that increased use of local currencies in cross border transactions will contribute to enhancing regional financial stability over the medium term. Against this backdrop, we reaffirm our commitment to strengthening regional financial cooperation along the following pillars, while remaining open to new potential pillars in the future, to achieve a more resilient and integrated ASEAN+3 region. Pillar 1: Enhancement of regional resilience against economic and non-economic shocks Ensure the CMIM is an important part of the global financial safety net, in effective coordination
with the IMF, through further enhancing collaboration between the CMIM and the IMF; Strengthen CMIM’s function as a front runner of regional financial arrangements, building on
clarification of the activation process of IMF De-linked Portion of the CMIM; Appreciate all the efforts and the significant progress that have been made in working towards
the potential increase of the IMF De-linked Portion, and look forward to further progress on this issue;
Enhance AMRO’s capacity and governance to ensure it can support the smooth operation of the CMIM;
Promote the expansion of bilateral swap arrangement networks, including those in local currencies, which complement the CMIM as the regional financial safety net; and
Mitigate the region’s vulnerability to natural disasters, including through the establishment of the South East Asia Disaster Risk Insurance Facility.
― 36 ―
Pillar 2: Promotion of local currency use to support ASEAN financial integration Diversify the local currency funding options available across the region by building up financial
markets, in view of expected increase in local currency funding needs with the progress of the ASEAN financial integration. In this light, we welcome the progress of CSD-RTGS linkages as the regional settlement intermediary that promotes cross-border securities transactions in the region;
Support the deepening of local currency bond markets in the region, including through effective use of CGIF with expanded guarantee capacity;
Utilize the “Good Practices in Developing Bond Market” to share our successful experiences under the ABMI within the region as well as with other regions; and
Continue to strategically implement our technical assistance and support for human resource development through mutual cooperation, with its focus on the bond market area.
We also recognize new challenges are emerging with the changing landscape of the economic and financial situation in this region. Building on the achievements on existing priority areas, we will evaluate those challenges as well as the opportunities from time to time, and explore potential directions and priorities to further broaden and deepen the regional financial cooperation in the future, so as to better serve the purpose of maintaining regional financial resilience and promoting economic integration.
― 37 ―
B. Bilateral Swap Arrangement between Japan and Malaysia
Joint Press Statement
May 5, 2017
1. The Bank of Japan, acting as the agent for the Minister of Finance of Japan, and Bank Negara Malaysia welcomed the agreement-in-principle to conclude a Bilateral Swap Arrangement (BSA) of up to USD 3 billion.
2. The authorities are currently undertaking the necessary actions to complete their respective domestic approval process. This arrangement features a two-way swap, in which both Japan and Malaysia will, upon request, provide US dollars to each other through currency swaps.
3. The authorities in Japan and Malaysia look forward to strengthening bilateral co-operation through this arrangement that will contribute to the stability of financial markets. It will further deepen the economic and trade ties between the two countries.
― 38 ―
C. Signing of the fourth Bilateral Swap Arrangement between Japan
and Thailand
Joint Press Statement
May 5, 2017
1. The Bank of Japan, acting as the agent for the Minister of Finance of Japan, and the Bank of Thailand signed the fourth Bilateral Swap Arrangement (BSA) on May 5, 2017. The arrangement will enable the authorities in Japan and Thailand to swap their local currencies (i.e., Japanese yen and Thai baht respectively) against US dollars. The size of the facility is up to USD 3 billion.
2. The authorities in Japan and Thailand hope that the strengthened bilateral financial cooperation will reinforce stability of the financial markets and further develop growing economic and trade ties between the two countries.
― 39 ―
D. 17th Trilateral Finance Ministers and Central Bank Governors' Meeting Joint Message
(May 5, 2017, Yokohama, Japan)
May 5, 2017
― 40 ―
17th Trilateral Finance Ministers and Central Bank Governors' Meeting Joint Message
(May 5, 2017, Yokohama, Japan)
1. We, Finance Ministers and Central Bank Governors of China, Japan and Korea, held the 17th trilateral meeting in Yokohama, Japan, under the chairmanship of H.E. Ilho Yoo, Deputy Prime Minister and Minister of Strategy and Finance of the Republic of Korea, and exchanged views on the latest developments in the global economy and regional financial cooperation.
2. We discussed current economic developments, growth prospects and potential risk factors in financial markets and underlying economic conditions. We recognize that global growth is expected to rise with buoyant financial market and long-awaited cyclical recovery in manufacturing and trade under way, and ASEAN+3 region is expected to maintain a relatively robust growth. However, downside risks still remain, with pervasive uncertainties surrounding policies. Under the recognition of these economic conditions, we reaffirm the importance of utilizing all necessary policy tools including fiscal and monetary policies and advancing structural reforms to achieve strong, sustainable, balanced and inclusive growth. Furthermore, we will continue high degree of communication and coordination among China, Japan and Korea to cope with possible financial instability in the context of increased uncertainty of global economy and geopolitical tensions. We agree that trade is one of the most important engines of economic growth and development, which contribute to productivity improvements and job creations. We will resist all forms of protectionism.
― 41 ―

3. We discussed our direction of achieving further development of regional financial cooperation in ASEAN+3 and are committed to strengthening regional financial cooperation to secure confidence and ensure financial stability in the ASEAN+3 region. We will work with other regional members to further enhance the readiness and effectiveness of Chiang Mai Initiative Multilateralisation (CMIM). In this regard, we welcome the revision of the CMIM Operational Guidelines to clarify the activation process of the IMF De-linked Portion. We also welcome the results of the 2016 CMIM Test Run, which highlights the importance of addressing CMIM fundamental issues and establishing CMIM-IMF coordination mechanism in the upcoming Periodic Review and look forward to further enhancing the coordination between CMIM and IMF. We agree to make efforts to complete the work on the Periodic Review of the CMIM Agreement by next May.
4. We welcome the ongoing work by ASEAN+3 Macroeconomic Research Office (AMRO) to strengthen its capacity and role in regional macroeconomic surveillance, CMIM support and technical assistance. We expect to enhance AMRO’s role to support members in the implementation of the CMIM and actively participate in the CMIM Periodic Review to enhance the operational readiness of the CMIM. We welcome the significant contribution of the Asian Bond Markets Initiative (ABMI) to developing local currency bond markets. We look forward to disseminating our experience learnt from the ABMI among the region and to other regions. We promote further use of local currencies in the context of the ABMI.
5. We appreciate Japan and Philippines' leadership as the co-chairs of ASEAN+3 Finance Ministers and Central Bank Governors Meeting in 2017. In addition, we agree to support Korea and Singapore to chair the 21th ASEAN+3 Finance Ministers and Central Bank Governors’ Meeting to be held in May 2018.
6. We agree to enhance our cooperation under G20 framework as the premier forum for international economic cooperation, and will work together toward a successful 2017 G20 Hamburg Summit.
7. We believe that the Trilateral Finance Ministers and Central Bank Governors' Meeting will serve as an effective platform for enhanced policy dialogue and coordination, and decided to meet again in Manila, Philippines in May 2018.
― 42 ―
E. Joint Press Release of the Sixth China-Japan Finance Dialogue
May 6, 2017
― 43 ―
Joint Press Release of the Sixth China-Japan Finance Dialogue
1. The Sixth China-Japan Finance Dialogue was held on May 6, 2017 in Yokohama,Japan, under the co-chairmanship of Mr. Taro Aso, Deputy Prime Minister andMinister of Finance of Japan, and Mr. Xiao Jie, Minister of Finance of China, withthe attendance of senior officials from both Ministries of Finance, and seniorCentral Bankers.
2. The Ministers shared the common view that the Dialogue is of importantsignificance for both sides, which contributes to deepening exchange ofmacroeconomic situation and policy measures of the two countries, strengtheningfinancial cooperation, and hence helping further advance cooperation betweenthe two countries in the economic and financial fields.
3. Both sides recognized the necessity of economic restructuring proactively throughexperiences sharing in macroeconomic policies for structural reform in bothcountries, and are committed to deepening communication and coordination ofmacroeconomic policies, and maintaining consultation on major internationaleconomic and financial issues.
4. Both sides emphasized the need to further deepen bilateral pragmaticcooperation in finance, scale up financial cooperation and support collaboration inthe economic, trade and investment fields.
5. Both sides welcomed the successful close of the ASEAN+3 Finance Ministers’and Central Bank Governors’ Meeting and the China-Japan-Korea TrilateralFinance Ministers’ and Central Bank Governors’ Meeting, which were held justbefore the Dialogue, and are committed to closer cooperation hereafter.
6. The two Ministers agreed to hold the Seventh China-Japan Finance Dialogue inChina next year. Both sides agreed to launch joint research on issues of mutualinterest and report the outcomes to the Dialogue.
― 44 ―
F. Statement at the 50th Annual Meeting of the ADB (Yokohama, Japan / May 6, 2017)
May 6, 2017
― 45 ―
Statement by the Honorable Taro Aso, Deputy Prime Minister of Japan
and the Chairperson of the Board of Governors, at the Fiftieth Annual Meeting of the Asian Development Bank
(Yokohama, Japan, May 6, 2017)
1. Introduction
Your Imperial Highness, the Crown Prince, Mr. President, Distinguished Governors, Ladies and
Gentlemen:
We feel greatly honored to hold the 50th Annual Meeting of the Asian Development Bank with the
presence of Your Highness. On behalf of all the Governors and other participants, I would like to
express my profound gratitude.
And I would like to extend my warm welcome to all of you for your participation in this meeting.
Yokohama is one of the most international cities in Japan. It has developed as Japan’s gateway to
the world since the opening of its port some 160 years ago. Thus, it is an appropriate place to hold
this memorable meeting.
This meeting could not have been held without the cooperation of many Yokohama citizens. I would
like to extend my sincere gratitude to the citizens of Yokohama for their warm hospitality.
Also, I am glad that Mr. Nakao was reelected as President last August, winning the confidence of all
members for his strong leadership in managing the Bank.
2. Economic Development of the Asia-Pacific Region
Now, looking back on the half-century since the Bank’s foundation, Asia and the Pacific region, which
was very poor 50 years ago, has made remarkable economic progress. As a result, the poverty rate
has dropped significantly. Today, this region is the driving force of the global economy.
During this process, this region has faced a range of difficulties, such as food shortage, weak
infrastructure, pandemics, natural disasters, and the currency crisis. However, countries have made
great efforts in overcoming them and successfully built a dynamic region. The Bank, as a family
doctor in the region, has made a huge contribution by working closely with these countries and
providing appropriate assistance.
― 46 ―
3. Challenges for the Asia-Pacific Region and Required Responses
The region’s achievement in poverty reduction through economic growth is a proud success story of
development in the world.
But we cannot be complacent.
Over 300 million people still live in poverty in the region. And the region continues to face threats
from natural disasters and pandemics. Moreover, economic development and globalization have
brought about challenges such as widening inequality, aging, climate change and rising volatility in
international capital flows.
To confront these challenges, I believe we should follow two guiding principles of “achieving inclusive
and sustainable economic growth”, and “strengthening resilience against various crises”. And we
should focus on areas such as infrastructure development, strengthening of the health system,
disaster risk management and regional financial cooperation.
(Infrastructure Development)
First, let me talk about infrastructure development. Infrastructure needs in Asia are getting larger both
in terms of quantity and quality due to economic development.
The Bank’s recent estimates point to huge infrastructure needs in developing Asia, amounting to 26
trillion dollars over the next 15 years. Against this backdrop, I would expect the Bank to continue to
promote infrastructure development, and to further mobilize private sector financing including
through PPPs.
I would also like to point out that enhancing quality of infrastructure in terms of lifecycle cost and
environmental and social considerations is important. From this perspective, I welcome the Bank’s
recent decision to introduce new procurement procedures that put more emphasis on quality. I
encourage the Bank to continue to move in this direction.
Japan has been promoting quality infrastructure in Asia in close collaboration with the Bank.
To further strengthen this partnership, I now announce that Japan will provide 40 million dollars over
a 2-year period to the newly-created Bank’s trust fund to promote high level technologies.
I would also like to emphasize that it is critical to utilize infrastructure in an open, transparent and
― 47 ―
non-exclusive manner to enhance its connectivity.
(Strengthening of the Health System)
Second, turning to the issue of health, a stronger health system makes people healthier.
This is important not only for humanitarian and social reasons but also for economic reasons, as
good health contributes to inclusive and sustainable growth.
This issue is particularly relevant in Asia, because Asia is frequently hit by pandemics such as bird flu,
and also because rapid aging is expected to create emerging health challenges such as a growing
demand for elderly care.
The Bank, as a broad-based development institution, is encouraged to further strengthen its
expertise on these social issues to make a meaningful contribution.
Japan achieved universal health coverage ahead of other countries, and accumulated various
expertise and experience on health and elderly care as it has entered into super-aging society.
Based on these strengths, Japan will support Asian countries in addressing health-related challenges.
During this Annual Meeting, the Bank and JICA have just agreed on a framework to promote
collaboration in this area.
(Disaster Risk Management)
Third, on disaster risk management. Natural disasters such as typhoons, floods and earthquakes
occur frequently in Asia, and the risk could intensify due to progress of climate change.
Against this backdrop, the Bank is encouraged to make further efforts in addressing climate change.
Also, I expect the Bank to bolster support in areas such as post-disaster reconstruction and building
of disaster-resilient societies.
With our abundant knowledge and experience, Japan has been actively promoting measures such
as building disaster-resilient infrastructure. In addition, Japan will make further contribution by
working towards the establishment of “Southeast Asia Disaster Risk Insurance” to facilitate swift
mobilization of funding in case of natural disasters.
(Regional Financial Cooperation)
Fourth, on regional financial cooperation.
― 48 ―
As the Asian economy is facing risks stemming from volatile international capital flows, I expect the
Bank to support structural reforms through policy dialogue and loans, to strengthen economic
resilience of its members. Also, the Bank is encouraged to provide prompt crisis response in
collaboration with other international financial institutions.
Japan, as one of Co-chairs of the ASEAN+3 Financial Cooperation Process this year, has been
promoting further enhancement of the CMIM, our regional financial safety net. Also, we have been
advancing more use of local currencies under the ABMI.
In addition, Japan proposed a new type of Bilateral Swap Arrangements, at the Finance Ministers
and Central Bank’s Governors Meeting between ASEAN countries and Japan held yesterday.
Specifically, Japan proposed to enable withdrawal in Japanese yen under the existing BSAs, and
establish a new type of BSA totaling up to 4 trillion yen to address short term liquidity problems.
Through these efforts, Japan will further strengthen financial resilience in Asia.
4. Future Direction of the Bank’s Operations
Now, let me touch on the future direction of the Bank’s operations.
Thanks to the Bank’s support, the Asian region has achieved remarkable economic development,
and the proportion of Upper Middle-Income Countries, or UMICs, has been rising. On the other hand,
the region is faced with more various challenges such as rapid aging, climate change and volatility in
international capital flows.
Against this background, I encourage the Bank to focus more on knowledge-sharing and reform
supporting loans in areas such as health, while continuing to promote infrastructure projects as a
central pillar of its operations. Japan supports that the Bank bolsters its staffing and organization to
implement these operations in an effective manner.
Regarding a balance between support for UMICs and poorer countries, the Bank should in principle
prioritize poorer countries to make effective use of the Bank’s precious resources.
At the same time, the Bank is also expected to address challenges facing UMICs, as such
engagement contributes to further development of the entire region.
Based on these considerations, we believe that the Bank should engage with UMICs in an
― 49 ―
appropriate manner both in terms of volume and quality. Specifically, the Bank should continue its
engagement with UMICs, focusing on knowledge cooperation and support in areas such as
environmental issues with externality and spillovers.
5. Conclusion
Now, let me conclude.
The Bank is currently preparing “Strategy 2030”, its new long-term strategy. I hope that the Bank will
develop a strong strategy taking into consideration various discussions at this Annual Meeting, so
that the Bank will remain a highly relevant institution in the region and contribute to its further
development.
To close my remarks, I would like to commend the Bank for its tremendous achievements over the
past 50 years. And I encourage it to continue playing a central role in regional development under the
strong leadership of President Nakao. Japan remains firmly committed to working hard for the
development of the Asia-Pacific region, in close cooperation with the Bank.
Thank you very much.
― 50 ―
G. Statement at the 26th Annual Meeting of the EBRD (Nicosia, Cyprus / May 10, 2017)
May 10, 2017
― 51 ―
Statement by the Honorable Minoru Kihara, State Minister of Finance, Government of Japan
At the 26th Annual Meeting of the European Bank for Reconstruction and Development Nicosia, Cyprus – May 10th, 2017
1. Introduction
Mr. Chairman, Mr. President, distinguished Governors, ladies and gentlemen,
It is a great honor to have this opportunity to speak at the 26th Annual Meeting of the
European Bank for Reconstruction and Development (EBRD) on behalf of the Government of
Japan. I would like to express my sincere gratitude for the warm welcome extended by the
government of the host country, Cyprus, and by the people of Nicosia. Last year, the EBRD
celebrated its 25th anniversary. Over the years, the international situation surrounding the EBRD
has changed dramatically. The EBRD has expanded its operations beyond the former communist
countries into the Southern and Eastern Mediterranean (SEMED) region. As a result, the profile
of the EBRD’s countries of operations has become more diverse and the notion of an ideal open
market economy has become relative. In consideration of this situation, Japan has high regard for
the EBRD’s adoption last year of the new Transition Concept emphasising the quality of
transition to an open market economy as a timely response.
2. Expectations for the EBRD under the new Transition Concept
We believe that the EBRD should perform well-targeted operations aimed at high-quality
transition to an open market economy taking into consideration the EBRD’s added value, in
pursuing its mission to mitigate the transition gap faced by countries of operations to promote a
sustainable open market economy under the new Transition Concept. Specifically, it is essential
to ensure that the EBRD-supported projects will be targeted to the areas in which the greatest
transition impact can be achieved in order to utilise EBRD’s limited resources in the most
effective and efficient manner. Concerning advanced transition countries, Japan also believes that
it is important to encourage self-sustaining reform while implementing carefully selected
measures and to continue discussions on “graduation” so that they can draw a roadmap for
graduation from EBRD country of operations status.
3. Japan’s proposition on the EBRD’s priorities
Japan would like to share its four priorities for areas in which the EBRD can play an important
role.
― 52 ―
(1) Support for Early Transition Countries (ETCs)
In order to maximise the transition impact within the constraints of limited funding, it is
important to focus efforts on support for Early Transition Countries (ETCs), such as Central
Asian and Caucasian countries, where the transition to an open market economy is lagging. As
support for ETCs is at the core of the EBRD’s mandate, we believe that the EBRD should
continue to prioritise its strong efforts here. In this context, Japan welcomes the EBRD’s recent
re-engagement with Uzbekistan, one of the ETCs, with a Memorandum of Understanding (MOU)
signed between President Shavkat Mirziyoyev and Sir Suma Chakrabarti, President of the EBRD,
in March this year. We expect that EBRD’s support such as providing advisory services for small
and medium-sized enterprises and promoting trade facilitation will steadily proceed and intend to
consider extending our support to promoting such activities, possibly including funding from the
Japan-EBRD Cooperation Fund (JECF).
(2) Quality Infrastructure Investment
In order to achieve sustainable growth, it is necessary to promote “Quality Infrastructure
Investment,” which emphasises the life-cycle cost of projects, safety, resilience against natural
disasters, environment and social standards, capacity building, and skills transfer. Japan believes
that the EBRD’s role in developing quality infrastructure will expand further in the future, given
the continuing substantial demand for infrastructure in EBRD’s countries of operations and the
importance of close collaboration between the public and private sectors in the promotion of
infrastructure development. Based on this view, we intend to continue strongly supporting the
promotion of “Quality Infrastructure Investment” as one of the priority areas of our support
through the JECF.
Many countries of operations need to deal with social alienation and income inequality as
pressing challenges. Japan welcomes the recently adopted Economic Inclusion Strategy, which
focuses on how the EBRD will promote economic inclusion, one of the transition qualities
defined under the new Transition Concept. “Quality Infrastructure Investment” is a concept that
contributes to inclusive growth through the transfer of skills to the local labour force, so Japan
hopes that the EBRD will strongly promote this concept. Moreover, Japan expects that EBRD’s
support and Japan’s skills will be actively brought together through the EBRD’s Representative
Office in Tokyo, which was opened in March last year, so that the skills of Japanese companies
and experts can contribute to the development of EBRD’s countries of operations.
(3) The importance of technical cooperation and policy dialogue
In order for the EBRD to take a tailored approach to countries of operations, which are diverse
with different transition paths towards a desirable open market economy, it is becoming
― 53 ―
increasingly important to promote reform efforts by combining specific investment and loan
projects with technical cooperation (TC) and policy dialogue suited to country-specific
circumstances. Since the EBRD’s inception, we have consistently emphasised this point and
provided TC through the JECF. Recently, we have particularly focused our support on such areas
as quality infrastructure, green economy, local currency lending, and development of local capital
markets. Japan intends to continue supporting tailored approaches to countries of operations while
promoting the sharing of technologies and knowledge developed by Japan’s public and private
sectors.
(4) Ensuring diversity at the EBRD as an international organisation
As indicated in the EBRD’s Diversity and Inclusion Policy, employing a broad range of
personnel with a variety of expertise is extremely important for the EBRD to effectively
implement its mission. In order for the EBRD to steadily perform its mission as an international
organisation while dealing with a variety of global challenges at a time when the profile of
countries of operations has become more diverse and the notion of an ideal open market economy
has become relative, Japan believes that it is essential to approach countries of operations as a
talent-rich organisation by attracting personnel with diverse professional expertise from a broad
range of member countries.
4. Conclusion
Since the Arab Spring, the EBRD has played a major role in the transition to an open market
economy and the development of the private sector in the SEMED countries. Japan believes that
the EBRD should continue to focus its support on the areas where the EBRD can achieve the
maximum transition impact by properly understanding circumstances in countries of operations
and examining the EBRD’s comparative advantages.
Following the adoption of the new Transition Concept last year and the re-evaluation of the
EBRD’s role, the environment in which the EBRD operates has entered a new stage. Going
forward, the EBRD’s operations based on the new Transition Concept will be enhanced. Japan
expects that the EBRD will perform its mission more efficiently than ever under the strong
leadership of Sir Suma Chakrabarti. During this process, we intend to further strengthen our
cooperative relationship with the EBRD through the sharing of our Japanese technology and
knowledge and to contribute to the further development of EBRD’s countries of operations.
― 54 ―
H. COMMUNIQUÉ, G7 Finance Ministers and Central Banks’ Governors Meeting
(Bari, Italy, May 12-13, 2017)
May 13, 2017
― 55 ―
Communiqué, G7 Financ e Ministers and Cen tral Bank Governors M eet ing, B ari 12-13 May, 2017
COMMUNIQUÉ G7 Finance Ministers and Central Banks’ Governors Meeting
Bari, Italy, May 12-13, 2017
1. Global recovery is gaining momentum, yet growth remains moderate and GDP is still below
potential in many countries, with the balance of risks tilted to the downside. At the same
time, longer-term potential growth rates also remain subdued. Against this backdrop, we
reiterate our commitment to international economic and financial cooperation and we
remain determined to use all policy tools - monetary, fiscal and structural - individually and
collectively to achieve our goal of strong, sustainable, balanced and inclusive growth.
Monetary policy should continue to support economic activity and ensure price stability,
consistently with central banks’ mandate. We concur that fiscal policy should be used
flexibly to strengthen growth and job creation, while also enhancing inclusiveness and
ensuring debt as a share of GDP is on a sustainable path. In doing so, we agree on the
importance of improving the quality of public finance, including by prioritising high quality
investment. We remain committed to advancing structural reforms to boost, productivity
and potential output and we support reforms that promote inclusiveness. We are
determined to enhance the implementation of structural reforms, and we will ensure these
are appropriately coordinated with macroeconomic policies. We reaffirm our existing G7
exchange rate commitments to market determined exchange rates and to consult closely
in regard to actions in foreign exchange markets. We reaffirm that our fiscal and monetary
policies have been and will remain oriented towards meeting our respective domestic
objectives using domestic instruments and we will not target exchange rates for
competitive purposes. We underscore the importance of all countries refraining from
competitive devaluation. We reiterate that excess volatility and disorderly movements in
exchange rates can have adverse implications for economic and financial stability. We will
carefully calibrate and clearly communicate our macroeconomic and structural policy
― 56 ―
Communiqué, G7 Finance Ministers and Central Bank Governors Meeting, Bari 12-13 May, 2017
actions to support domestic growth, reduce policy uncertainty, minimize negative
spillovers and promote transparency. We will strive to reduce excessive global imbalances
and in a way that supports global growth. We are working to strengthen the contribution
of trade to our economies.
2. Technological change and global integration have made an important contribution to
raising living standards across the world over recent decades. We will work to enable our
economies and communities to adjust to the pace of change today, so that the global
economy works for everyone. We recognise that the global economy is facing a prolonged
period of modest growth and high and rising inequalities, notably within many countries
and affecting in particular middle and lower income earners. Excessive inequality, also at
the global level, undermines confidence and limits future growth potential. Furthermore,
inequality may contribute to regional disparities and undermine intergenerational mobility,
while jeopardizing social cohesion and putting stress on institutions. The OECD report “A
Fiscal Approach for Inclusive Growth in G7 Countries” provides guidance on the
development of an inclusive growth agenda in our economies.
3. We are committed to ensuring that growth is inclusive, job-rich and benefits all segments
of our societies. We will work to lift actual and potential growth, while ensuring that the
fruits of economic growth are shared more widely. We agreed on the Bari Policy Agenda,
which provides a framework to foster inclusive growth through a broad menu of policy
options. We see value in combining pro-inclusive growth fiscal policy including through the
enhancement of the quality of public finances with structural policies to safeguard
macroeconomic stability and create an enabling environment for broad-based growth. We
recognise the importance of integrating equity objectives into policy-making. In this
context, the IMF report “Gender Budgeting in G7 countries” provides guidance on how to
promote gender equality throughout the budgetary process. We will consider to take into
account the Bari Policy Agenda in our G20 growth strategies.
4. We recognise the critical role that the MDBs play in supporting developing countries to
deliver the 2030 agenda for sustainable development. To fulfill this role, the IFI system as
a whole must make the best possible use of capital and donor contributions, within their
mandates, to collectively achieve long-term development impact. This will also bolster
― 57 ―
Communiqué, G7 Finance Ministers and Central Bank Governors Meeting, Bari 12-13 May, 2017
consensus and political support in our countries around multilateral development
assistance. Against this background, we discussed how the MDBs can scale up their impact,
make better use of their balance sheets, adhere to the highest standards in transparency
and accountability, mobilize greater amounts of truly additional private finance, better
align their approaches and practices in areas where harmonization can increase their
collective impact, support domestic resources mobilization, and complement the work of
the IMF. We have, in particular, considered how the MDBs could improve their
effectiveness and efficiency through better coordination and collaboration, and how they
could report results and track their capacity to deliver, both collectively and individually in
a comparable way.
5. Our intent is to help shaping coherent positions across the governing bodies of the various
MDBs and encourage these institutions to act as a system of complementary actors. We
call on the MDBs to work together on developing a common framework on the concept of
value for money, including harmonized metrics and a joint reporting format to capture key
dimensions of economic efficiency and effectiveness, portfolio quality, and the
additionality of their investments with the private sector.
6. We are strongly committed to further reinforce tools and instruments at our disposal to
effectively counter terrorist financing. To this end, we are committed to enhance
information sharing, domestically and internationally, among relevant authorities and
strengthen cooperation with the private sector. Our Financial Intelligence Units will
continue to work together, share best practices and identify areas to improve international
cooperation and the implementation of international standards, including possible
improvements in domestic regulation and practices, in the context of our different national
frameworks. We strongly support the work of the Financial Action Task Force (FATF) and
the Egmont Group of Financial Intelligence Units in improving the implementation of
international standards and sharing best practices on these issues.
7. We promote and support a robust implementation of sanctions adopted by the Security
Council as a strategic tool for peace and global security. We will employ financial sanctions
against terrorists and their supporters in a targeted and effective manner, and we will
strengthen G7 co-operation on these sanctions. In particular, we commit, where possible,
― 58 ―
Communiqué, G7 Finance Ministers and Central Bank Governors Meeting, Bari 12-13 May, 2017
to co-sponsoring proposed UN listings, considering domestically designating G7 agreed
listings, and strengthening our capacity to make, and respond to, requests from G7
members to freeze terrorist assets. Together, this will help ensure a stronger, more
coordinated G7 approach to financial sanctions.
8. Furthermore, we recall the need to both promote financial inclusion and mitigate terrorism
financing and money laundering risks within the Money and Value Transfer Services (MVTS)
sector. To safeguard the legitimate behaviour of relevant stakeholders, and protect the
international financial system from abuse, including by terrorists and terrorist groups, we
should continue to improve the effective supervision and monitoring of the MVTS sector
including their agents, on a risk-based approach. We agree that criminal and administrative
sanctions should be applied for violations of law and effectively implemented. We
recognise that conducting regular reporting or maintaining updated information relating
to the admission of agents into the MVTS sector are good practices to share.
9. We recognise that vulnerabilities in the antiquities sector can pose challenges in terms of
money laundering and terrorist financing, including with respect to Free Ports and Free
Trade Zones. We encourage FATF and countries to better understand ML/TF vulnerabilities
associated with Free Ports and Free Trade Zones and implement adequate measures to
address them.
10. In addition to enhancing our own efforts to combat illicit finance, we should also
collaborate to strengthen the effective implementation of the AML/CFT regime in the FATF
global network. To that end, in consultation with the IMF, the WB and UNODC, we will work
together to coordinate and improve the delivery of technical assistance, and ask our
AML/CFT financial experts to report back at our next meeting.
11. We welcome the IMF’s Financial Sector Stability Fund (FSSF), a new capacity development
initiative aimed at strengthening financial sector stability in low and lower middle income
countries, which will help foster greater integrity, inclusion and deepening in the financial
system, as well as the ongoing work supported by the IMF’s AML/CFT Topical Trust Funds.
― 59 ―
Communiqué, G7 Finance Ministers and Central Bank Governors Meeting, Bari 12-13 May, 2017
12. We welcome and support the ongoing work to strengthen the institutional basis,
governance and capacity of the FATF. We call on all member states to ensure that the FATF
has the necessary resources and support to effectively fulfil its mandate.
13. Given the importance of tackling the illicit flows linked to modern slavery, migrant
smuggling and human trafficking, we call on FATF to continue to work in this area, including
by updating its typologies and risk indicators.
14. In light of the increasing digitalisation of financial services and the evolving cyber threats
landscape, it is important to pursue effective approaches for assessment of cyber security
at the financial firm and sector level as well. We recognise that the development of
common and shared practices to help timely detection of vulnerabilities in the financial
system is a key element for enhancing the cyber resilience of single financial institutions
and the financial sector as a whole. Given the rapidly evolving nature of cyber risks,
effective cyber security assessment requires that current assessment approaches should
be enhanced and be complemented by practices that are tailored to bolster cyber
resilience, including regular cyber exercises and simulations as well as consideration of how
to most effectively leverage penetration tests. To this end, we mandate the G7 Cyber
Expert Group (G7 CEG) to develop a set of high level and non-binding fundamental
elements for effective assessment of cybersecurity by October 2017. Highly aware of the
cross-border and cross-sector relevance of cyber-threats, we task the G7 CEG to advance
work on the third party risks and the coordination with other critical sectors. Furthermore,
we encourage international coordination and knowledge sharing. Since its inception in
2015, the G7 Cyber Expert Group has developed a high degree of mutual sharing and trust
with a diverse membership providing a unique platform for international coordination on
cyber security. Finally, the G7-CEG should explore other issues of interest related with
cyber security as directed and prioritised by G7 Finance Ministers and Central Banks
Governors.
15. We recognise that cyber incidents represent a growing threat for our economies and that
appropriate economy-wide policy responses are needed. No point of cyberspace can be
absolutely secure as long as cyber threats persist in the surrounding environment; our drive
to strengthen the financial system against cyber attacks can achieve maximum results only
― 60 ―
Communiqué, G7 Finance Ministers and Central Bank Governors Meeting, Bari 12-13 May, 2017
if accompanied by measures that reduce the level of insecurity in cyberspace as a whole.
In turn, economy-wide policies must be based on reliable, impartial, comprehensive and
widely accessible data. We therefore call on the International Organizations and
governmental institutions in partnership with the private sector to enhance sharing of
cyber security information. Definitions, collection methodologies and data sharing, when
appropriate, should be coordinated and consistent across countries and sectors, so that
results are comparable. Sharing national experiences and best practices among all
stakeholders on optimal cybersecurity legislation or relevant regulatory initiatives would
be highly beneficial. Finally, we are following the development of a cyber insurance market
and welcome the ongoing work by OECD with inputs from its members and the OECD
report “Supporting an Effective Cyber Insurance Market”.
16. We remain committed to work for globally fair and modern tax systems and to achieve a
global level playing field for all engaged in economic activities. To this end, timely,
consistent and widespread implementation of the G20/OECD BEPS (Base Erosion and Profit
Shifting) package is crucial. We encourage all relevant and interested countries and
jurisdictions to commit to implement the BEPS package and join the G20/OECD Inclusive
Framework on BEPS. We look forward to the first signing on 7th June 2017 of the
Multilateral Convention to Implement Tax Treaty Related Measures to Prevent BEPS. We
recognise the importance of monitoring and evaluating the developments related to the
digitalization of the economy, and, depending on conclusions of the work by the OECD Task
Force on the Digital Economy (TFDE), developing policy options, as appropriate, to address
related tax challenges with a consistent approach. In this context, we look forward to the
interim report of the OECD TFDE in 2018. We support the work of the OECD and the IMF
on Tax Certainty.
17. Reaffirming our goal to enhance tax transparency at the global level, we join the G20 call
on all jurisdictions to sign and ratify the multilateral Convention on Mutual Administrative
Assistance in Tax Matters and urge all relevant countries and jurisdictions, including all
financial centres which have not yet done so to commit without delay to implementing the
Common Reporting Standard (CRS) on automatic exchange of financial account
information which will commence in September 2017 and to take all necessary actions,
including putting in place domestic legislation, in order to start exchanges under the CRS
― 61 ―
Communiqué, G7 Finance Ministers and Central Bank Governors Meeting, Bari 12-13 May, 2017
by September 2018 at the latest. We expect sufficient progress from jurisdictions that do
not have yet a satisfactory level of implementation of the agreed international standards
on tax transparency and look forward to the OECD’s preparation of a list of non-cooperative
jurisdictions with respect to tax transparency, which will guide our work on defensive
measures against listed jurisdictions. We welcome the work by the FATF and the Global
Forum on Transparency and Exchange of Information for Tax Purposes to improve the
implementation of the international standards on availability of beneficial ownership
information as well as the OECD work in complementary tax areas related to beneficial
ownership.
18. The “Bari Declaration on fighting tax crimes and other illicit financial flows” reflects our
determination to use a holistic approach to fighting against tax and financial crime based
on effective interagency and international cooperation. We support initiatives on
discussing possible ways to address arrangements designed to circumvent reporting under
the CRS or aimed at providing beneficial owners with the shelter of non-transparent
structures, considering also model mandatory disclosure rules.
19. We reaffirm that strengthening the capacity of developing countries to mobilise domestic
resources is critical to the achievement of the global 2030 Agenda for Sustainable
Development. Improving the capacity in tax policy and administration is also crucial for a
global level playing field. To this purpose, we remain committed to the principles of the
Addis Tax Initiative and we support the work of the Platform for Collaboration on Tax,
acknowledging its key role in deepening collaboration between the international
organisations and enhancing effective external support in building tax capacity. We will
continue to support targeted assistance to developing countries in building their tax
capacity. We also welcome new initiatives in the area of tackling tax and financial crime,
like the establishment by the OECD of the Africa Academy for Tax and Financial Crime
Investigation in Kenya.
Bari, May 13, 2017
― 62 ―
I. Tax Convention with Estonia Agreed in Principle
May 15, 2017 Ministry of Finance
[Provisional translation]
1. The Government of Japan and the Government of the Republic of Estonia have agreed in principle on the tax convention between Japan and the Republic of Estonia.
2. This Convention includes provisions for the purposes of clarifying the scope of taxation in the two countries, eliminating international double taxation and preventing tax evasion and avoidance and is expected to promote further mutual investments and economic exchanges between the two countries.
3. This Convention will be signed after the necessary internal procedures have been completed by each of the two Governments. Thereafter, the Convention will enter into force after the completion of the approval process in both countries (in the case of Japan, approval by the Diet is necessary).
― 63 ―

J. New Tax Convention with Denmark Agreed in Principle
May 15, 2017 Ministry of Finance
[Provisional translation]
1. The Government of Japan and the Government of the Kingdom of Denmark have agreed in principle on the new Convention replacing the Convention between Japan and the Kingdom of Denmark for the Avoidance of Double Taxation with respect to Taxes on Income which entered into force in 1968.
2. This new Convention reinforces or introduces provisions for the purposes of clarifying the scope of taxation in the two countries, eliminating international double taxation and preventing tax evasion and avoidance and is expected to promote further mutual investments and economic exchanges between the two countries.
3. This new Convention will be signed after the necessary internal procedures have been completed by each of the two Governments. Thereafter, the new Convention will enter into force after the completion of the approval process in both countries (in the case of Japan, approval by the Diet is necessary).
― 64 ―
K. Statement at the Annual Meetings of 52nd AfDB / 43rd AfDF (Ahmedabad, India / May 23, 2017)
May 23, 2017
― 65 ―

Statement by the Honorable Taku Otsuka, State Minister of Finance, Government of Japan
At the 52nd Annual Meeting of the African Development Bank and the 43rd Annual Meeting of the African Development
Fund Ahmedabad, India
May 23, 2017
1. Introduction
Chairman Jaitley, President Adesina, distinguished
Governors, Ladies and Gentlemen:
I am grateful for this opportunity to speak on behalf of the
Government of Japan.
First of all, I would like to express my gratitude to the
Government of India and the Government of Gujarat for their
warm hospitality. I am greatly delighted that we can discuss
African challenges and prospects here in India, which has
strong geographical and historical ties with Africa.
― 66 ―
2. Cooperation between Japan and ADB towards African
Development
(General Remarks)
We firmly believe that Africa has huge growth potential with
its rich natural resources and a fast growing population.
On the other hand, in recent years, Africa has faced difficult
challenges, such as changes in global commodity prices, Ebola
outbreak, and social instability caused by various factors
including terrorism.
Under such circumstances, President Adesina, with his
“High 5s” policy priority agenda, has been strongly promoting
measures such as infrastructure investment in the energy
sector, industrial development, and improvement of the quality
of life through job creation and the strengthening of the health
system, in an attempt to unleash Africa’s potential.
Japan highly appreciates these strong actions, which will
certainly contribute to the achievement of the Sustainable
Development Goals.
― 67 ―
At TICAD VI, Tokyo International Conference on African
Development, in Nairobi, Kenya, in August last year, Japan set
out three priority areas to advance Africa’s development.
First, economic diversification and industrialization through
quality infrastructure development. Second, the strengthening
of the health system. And third, social stabilization by creating
jobs. These are closely aligned with “High 5s.”
Japan and the Bank are good partners with a shared
development vision for Africa, and Japan attaches great
importance to collaboration with the Bank. This is clearly
demonstrated by Japan’s upgraded contribution to the ADF 14
replenishment. Japan significantly increased its contribution
share, by using both the conventional grant contribution and
newly introduced loan contribution.
(Specific Areas of Cooperation)
Now, let me give you three specific areas where Japan and
the Bank are working together towards African development.
First, let me talk about EPSA, the Enhanced Private Sector
Assistance for Africa.
― 68 ―
It was launched in 2005 with the aim to promote private
sector-led growth. It has achieved significant results, as
demonstrated by our success in meeting the targets of 1 billion
dollars for EPSA 1 and 2 billion dollars for EPSA 2.
On the occasion of TICAD VI, Japan and the Bank agreed
to further bolster the EPSA initiative with the target to deliver
3.3 billion dollars over a 3 year period. It places priority on
promoting quality infrastructure investment, strengthening the
health system and addressing malnutrition. It also includes
special allocation to promote clean coal technologies with a set-
aside amounting to 300 million dollars.
We continue our efforts to steadily implement this important
initiative of EPSA, in close collaboration with the Bank.
Let me turn to the second issue, that is, energy cooperation.
Energy poverty is one of the biggest constraints that hinder
Africa’s industrial development. To address this issue, Africa
needs a balanced and pragmatic energy policy, with an
appropriate mix of both conventional and renewable sources of
energy.
― 69 ―

We believe that coal fired power plants are an important
source of power for Africa, as they are cost-effective and they
can utilize resources abundant in Africa. With clean coal
technologies exemplified by ultra-supercritical technologies, we
can power Africa, while reducing the environmental impact.
To promote clean coal technologies, in addition to EPSA
financing, we believe it is necessary to provide coherent
knowledge support from “upstream project preparation” to
“downstream plant operation and maintenance”. Japan is
engaged in the joint work with the Bank to launch this
comprehensive framework.
Thirdly, let me touch upon the importance of business
cooperation.
The private sector is playing an increasingly pivotal role in
economic growth in Africa. In July this year, the Bank will hold
the second Japan-Africa Business Forum in Tokyo, which will
provide valuable business opportunities.
― 70 ―
Japan highly appreciates the activities of the Bank’s Tokyo
office in organizing this forum. We hope this forum will lead to
the further upgrading of business relations between Africa and
Japan.
3. Conclusion
Now, let me conclude.
Africa is the continent that carries the hopes of this planet.
We strongly believe that the Bank will play a vital role in
translating Africa’s potential into reality.
Japan strongly supports the Bank’s scaled-up efforts to
promote “High 5s” under the splendid leadership of President
Adesina, in order to put Africa on a path toward sustainable and
inclusive growth.
Thank you.
― 71 ―

L. Tax Convention with Iceland Agreed in Principle
May 29, 2017 Ministry of Finance
[Provisional translation]
1. The Government of Japan and the Government of Iceland have agreed in principle on the tax convention between Japan and Iceland.
2. This Convention includes provisions for the purposes of clarifying the scope of taxation in the two countries, eliminating international double taxation and preventing tax evasion and avoidance and is expected to promote further mutual investments and economic exchanges between the two countries.
3. This Convention will be signed after the necessary internal procedures have been completed by each of the two Governments. Thereafter, the Convention will enter into force after the completion of the approval process in both countries (in the case of Japan, approval by the Diet is necessary).
― 72 ―

APPENDIX
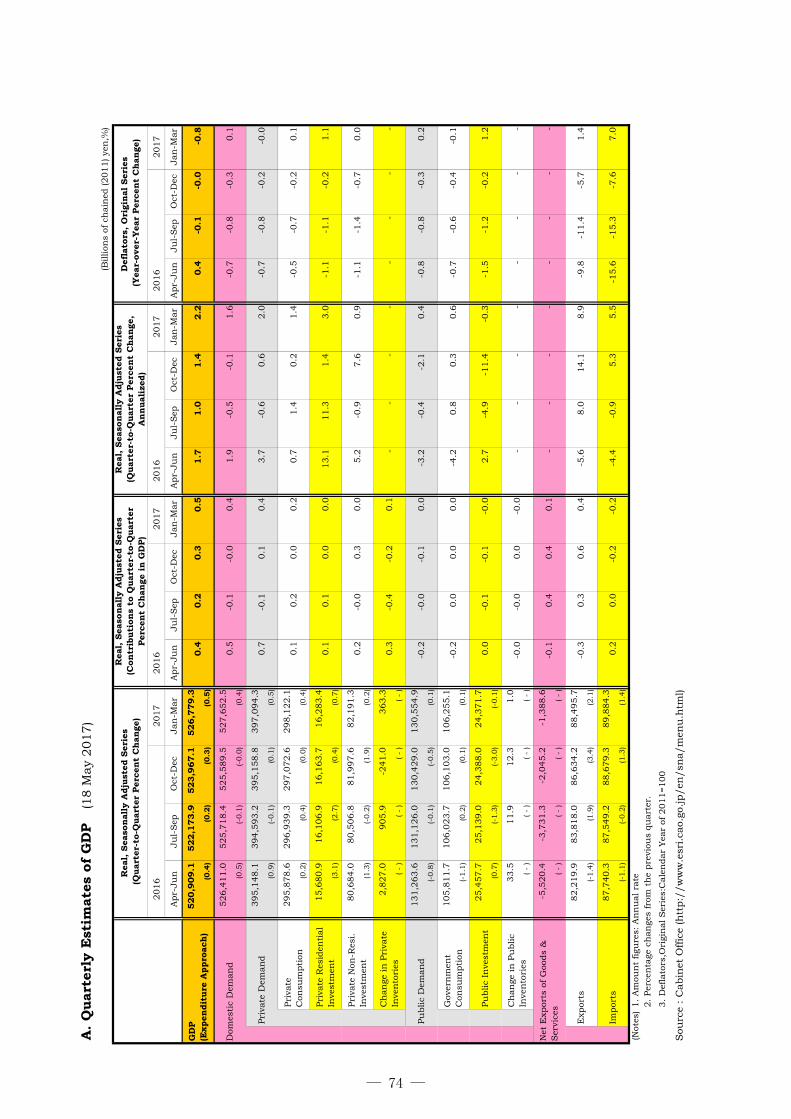
A. Q
uar
terl
y E
stim
ates
of
GD
P (
18 M
ay 2
017)
(Billion
s of
ch
ain
ed (2011) ye
n,%
)
2016
2017
2016
2017
2016
2017
2016
2017
Apr-
Ju
nJu
l-S
epO
ct-D
ecJan
-Mar
Apr-
Ju
nJu
l-S
epO
ct-D
ecJan
-Mar
Apr-
Ju
nJu
l-S
epO
ct-D
ecJan
-Mar
Apr-
Ju
nJu
l-S
epO
ct-D
ecJan
-Mar
520,9
09.1
522,1
73.9
523,9
67.1
526,7
79.3
(0.4
)(0
.2)
(0.3
)(0
.5)
526,4
11.0
525,7
18.4
525,5
89.5
527,6
52.5
(0.5
)(-
0.1
)(-
0.0
)(0
.4)
395,1
48.1
394,5
93.2
395,1
58.8
397,0
94.3
(0.9
)(-
0.1
)(0
.1)
(0.5
)
295,8
78.6
296,9
39.3
297,0
72.6
298,1
22.1
(0.2
)(0
.4)
(0.0
)(0
.4)
15,6
80.9
16,1
06.9
16,1
63.7
16,2
83.4
(3.1
)(2
.7)
(0.4
)(0
.7)
80,6
84.0
80,5
06.8
81,9
97.6
82,1
91.3
(1.3
)(-
0.2
)(1
.9)
(0.2
)
2,8
27.0
905.9
-241.0
363.3
( -
)( -
)( -
)( -
)
131,2
63.6
131,1
26.0
130,4
29.0
130,5
54.9
(-0.8
)(-
0.1
)(-
0.5
)(0
.1)
105,8
11.7
106,0
23.7
106,1
03.0
106,2
55.1
(-1.1
)(0
.2)
(0.1
)(0
.1)
25,4
57.7
25,1
39.0
24,3
88.0
24,3
71.7
(0.7
)(-
1.3
)(-
3.0
)(-
0.1
)
33.5
11.9
12.3
1.0
( -
)( -
)( -
)( -
)
-5,5
20.4
-3,7
31.3
-2,0
45.2
-1,3
88.6
( -
)( -
)( -
)( -
)
82,2
19.9
83,8
18.0
86,6
34.2
88,4
95.7
(-1.4
)(1
.9)
(3.4
)(2
.1)
87,7
40.3
87,5
49.2
88,6
79.3
89,8
84.3
(-1.1
)(-
0.2
)(1
.3)
(1.4
)
(Not
es)
1. A
mou
nt
figu
res:
An
nu
al r
ate
2. Per
cen
tage
ch
ange
s fr
om t
he
pre
viou
s qu
arte
r.
3. D
efla
tors
,Ori
gin
al S
erie
s:C
alen
dar
Yea
r of
2011=100
Sou
rce
: C
abin
et O
ffic
e (h
ttp:/
/w
ww
.esr
i.ca
o.go
.jp/en
/sn
a/m
enu
.htm
l)
-7.6
11.3
--
--
14.1
7.0
-4.2
-5.6
0.1
0.1
-0.1
-0.2
0.7
-0.3
0.3
-0.4
-0.1
-0.0
0.4
-0.6
1.9
0.0
1.4
13.1
0.1
-0.5
3.7
0.0
0.0
0.4
0.1
-0.0
Pri
vate
Dem
and
Pri
vate
Con
sum
pti
on
Pri
vate
Res
iden
tial
Inve
stm
ent
-0.0
0.2
Net
Exp
orts
of G
oods
&S
ervi
ces
0.3
0.2
0.2
0.0
Ch
ange
in
Pu
blic
Inve
nto
ries
-0.2
0.3
0.0
0.0
-0.2
GD
P(E
xpen
dit
ure
Appro
ach
)
Dom
esti
c D
eman
d0.5
-0.1
0.2
0.4
-0.0
-0.9
-0.2
-0.9
5.3
--
-4.4
Pri
vate
Non
-Res
i.In
vest
men
t
Ch
ange
in
Pri
vate
Inve
nto
ries
-0.0
Pu
blic
Dem
and
Gov
ern
men
tC
onsu
mpti
on
Pu
blic
Inve
stm
ent
-0.1
-0.0
-0.1
0.0
-15.6
5.5
8.9
Exp
orts
Impor
ts0.0
0.2
0.4
-0.2
0.6
0.0
-0.1
-0.7
-1.5
-1.2
-0.2
-
--
-
--
1.4
-9.8
-0.2
0.1
-0.3
8.0
0.2
-0.1
-0.4
-0.6
1.2
-0.3
-0.1
1.1
0.0
-1.1
-0.2
-
-0.0
-0.2
-0.8
-0.7
-1.4
-1.1
-0.4
-0.8
-
0.4
-
-0.8
-2.1
7.6
Rea
l, S
easo
nal
ly A
dju
sted
Ser
ies
(Q
uar
ter-
to-Q
uar
ter
Per
cen
t C
han
ge)
Rea
l, S
easo
nal
ly A
dju
sted
Ser
ies
(Quar
ter-
to-Q
uar
ter
Per
cent
Chan
ge,
Annual
ized
)
Rea
l, S
easo
nal
ly A
dju
sted
Ser
ies
(Con
trib
uti
on
s to
Quar
ter-
to-Q
uar
ter
Per
cen
t C
han
ge i
n G
DP)
1.7
1.0
0.5
1.4
2.2
0.3
-5.7
-11.4
-0.8
-0.3
0.1
0.4
-0.7
-0.8
-0.0
-0.7
Def
lato
rs,
Ori
ginal
Ser
ies
(Y
ear-
over
-Yea
r Per
cent
Chan
ge)
-0.1
-0.7
-0.5
-1.1
3.0
0.1
--
-
-15.3-
0.7
- -
-0.0
0.0
5.2
-4.9
-3.2-
0.6
1.6
0.0
2.0
0.1
0.2
1.4
0.9
1.4
0.4
0.6
-11.4
0.4
-
0.3
0.8
2.7
-
― 74 ―
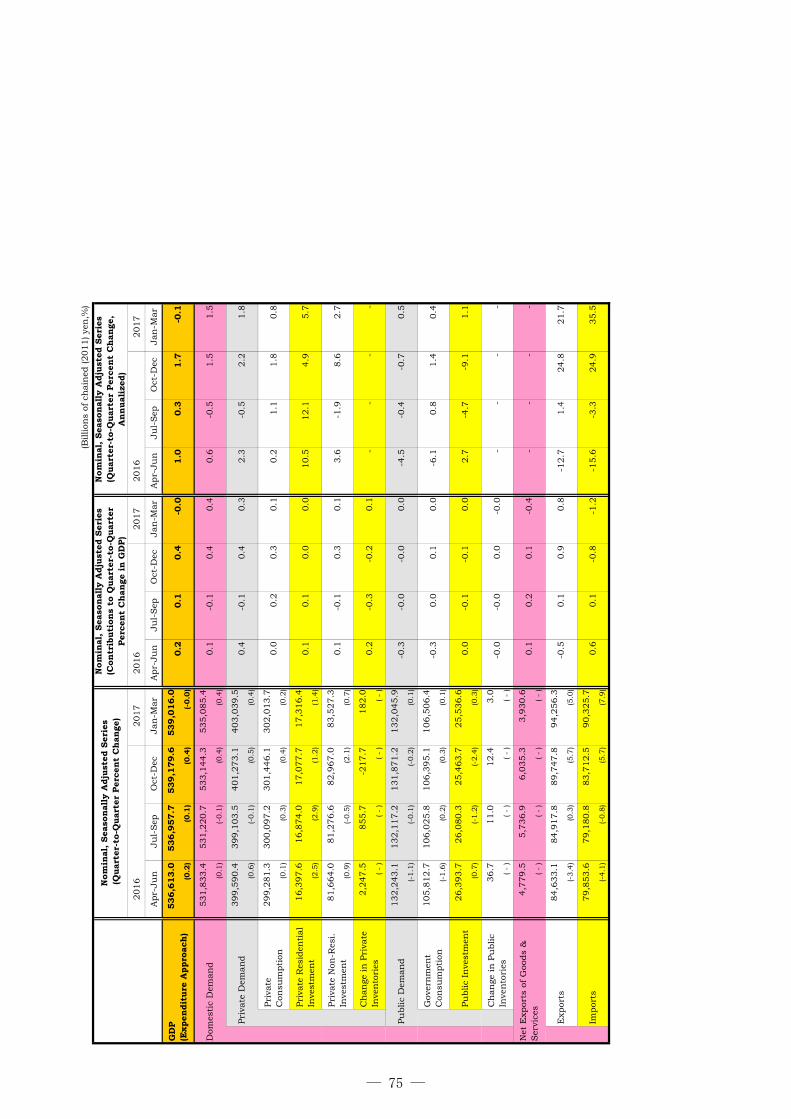
(Billion
s of
ch
ain
ed (2011) ye
n,%
)
2016
2017
2016
2017
2016
2017
Apr-
Ju
nJu
l-S
epO
ct-D
ecJan
-Mar
Apr-
Ju
nJu
l-S
epO
ct-D
ecJan
-Mar
Apr-
Ju
nJu
l-S
epO
ct-D
ecJan
-Mar
536,6
13.0
536,9
57.7
539,1
79.6
539,0
16.0
(0.2
)(0
.1)
(0.4
)(-
0.0
)
531,8
33.4
531,2
20.7
533,1
44.3
535,0
85.4
(0.1
)(-
0.1
)(0
.4)
(0.4
)
399,5
90.4
399,1
03.5
401,2
73.1
403,0
39.5
(0.6
)(-
0.1
)(0
.5)
(0.4
)
299,2
81.3
300,0
97.2
301,4
46.1
302,0
13.7
(0.1
)(0
.3)
(0.4
)(0
.2)
16,3
97.6
16,8
74.0
17,0
77.7
17,3
16.4
(2.5
)(2
.9)
(1.2
)(1
.4)
81,6
64.0
81,2
76.6
82,9
67.0
83,5
27.3
(0.9
)(-
0.5
)(2
.1)
(0.7
)
2,2
47.5
855.7
-217.7
182.0
( -
)( -
)( -
)( -
)
132,2
43.1
132,1
17.2
131,8
71.2
132,0
45.9
(-1.1
)(-
0.1
)(-
0.2
)(0
.1)
105,8
12.7
106,0
25.8
106,3
95.1
106,5
06.4
(-1.6
)(0
.2)
(0.3
)(0
.1)
26,3
93.7
26,0
80.3
25,4
63.7
25,5
36.6
(0.7
)(-
1.2
)(-
2.4
)(0
.3)
36.7
11.0
12.4
3.0
( -
)( -
)( -
)( -
)
4,7
79.5
5,7
36.9
6,0
35.3
3,9
30.6
( -
)( -
)( -
)( -
)
84,6
33.1
84,9
17.8
89,7
47.8
94,2
56.3
(-3.4
)(0
.3)
(5.7
)(5
.0)
79,8
53.6
79,1
80.8
83,7
12.5
90,3
25.7
(-4.1
)(-
0.8
)(5
.7)
(7.9
)
4.9
0.0
0.4
5.7
0.1
1.8
0.1
0.6
-0.1
0.4
0.3
-0.0
1.5
0.8
1.8
0.2
1.1
0.4
-0.5
2.2
0.3
0.1
Dom
esti
c D
eman
d
GD
P(E
xpen
dit
ure
Appro
ach
)
0.1
-0.1
Nom
inal
, Sea
son
ally
Adju
sted
Ser
ies
(Q
uar
ter-
to-Q
uar
ter
Per
cen
t C
han
ge)
Nom
inal
, Sea
son
ally
Adju
sted
Ser
ies
(Con
trib
uti
on
s to
Quar
ter-
to-Q
uar
ter
Per
cen
t C
han
ge i
n G
DP)
0.2
0.4
Pri
vate
Con
sum
pti
on0.0
0.2
0.1
0.0
Pri
vate
Dem
and
0.4
Nom
inal
, Sea
sonal
ly A
dju
sted
Ser
ies
(Quar
ter-
to-Q
uar
ter
Per
cent
Chan
ge,
Annual
ized
)
1.7
2.3
1.0
0.3
-0.5
1.5
-0.1
Pri
vate
Res
iden
tial
Inve
stm
ent
Pri
vate
Non
-Res
i.In
vest
men
t3.6
-1.9
8.6
2.7
0.1
-0.1
0.3
0.1
0.2
-0.3
-0.2
0.1
--
Pu
blic
Dem
and
-4.5
-0.4
-0.7
-0.3
Ch
ange
in
Pri
vate
Inve
nto
ries
-0.0
-0.0
0.0
0.4
0.0
0.1
0.8
Ch
ange
in
Pu
blic
Inve
nto
ries
Gov
ern
men
tC
onsu
mpti
on0.0
-0.3
-0.1
-0.1
0.0
Pu
blic
Inve
stm
ent
0.0
2.7
-4.7
-9.1
1.4
-6.1
-0.0
-0.0
1.1
-0.0
0.0
--
Net
Exp
orts
of G
oods
&S
ervi
ces
--
-0.1
0.2
0.1
-0.4
Exp
orts
0.6
0.1
-0.8
-1.2
-12.7
1.4
24.8
-0.5
0.1
0.9
Impor
ts-1
5.6
-3.3
24.9
35.5
0.8
21.7--
-
0.5-
-
10.5
12.1
― 75 ―
B. Monthly Economic Report May 2017
Provisional translation
Cabinet Office 24 May 2017
Executive Summary Assessment of the current state of the Japanese economy
The Japanese economy is on a moderate recovery, while delayed improvement in part can be seen.
• Private consumption remains in pickup as a whole. • Business investment shows movements of picking up. • Exports is picking up. • Industrial production is picking up. • Corporate profits is improving. Firms' judgment on current business conditions is improving. • The employment situation is improving. • Consumer prices are flat. Concerning short-term prospects, the economy is expected to recover, supported by the effects of
the policies, while employment and income situation is improving. However, attention should be given to the uncertainty in overseas economies and the effects of fluctuations in the financial and capital markets.
Policy stance
The Government will make its utmost efforts to ensure the economy overcomes deflation and achieve economic revitalization and fiscal consolidation simultaneously, in addition to make effort toward the reconstruction and revitalization from the Great East Japan Earthquake. To this end, the Government will decide the "Basic Policies for Economic and Fiscal Management and Reform 2017(provisional)", the "Japan Revitalization Strategy 2017(provisional)", the "Regulatory Reform Work Plan(provisional)", and the "Basic Policies for Overcoming Population Decline and Vitalizing Local Economy in Japan 2017(provisional)". In addition, the Government steadily implements the "Japan's Plan for the Dynamic Engagement of All Citizens". About work style reform, based on the "The action Plan for the Realization of Work Style Reform" decided in March, the Government will submit bills to the Diet at an early date. And the government implements "Economic Measures for Realizing Investment for the Future" and the FY2016 supplementary budget swiftly and steadily in order to overcome deflation completely and pave the way for steady economic growth. The Government also implements the FY2017 budget swiftly and steadily.
Utilizing supplementary budgets etc., the Government will make sure to support for the daily lives of those affected by the 2016 Kumamoto Earthquake, and also work on promoting early recovery of the local economy and industries.
The Government continuously pursues to expand the economic virtuous cycles which cover local areas, SMEs and small-scale businesses, through directing growing corporate profits towards investment, wage increase and further improvement in the employment situation by these measures.
The Government expects the Bank of Japan to achieve the price stability target of two percent in light of economic activity and prices.
― 76 ―
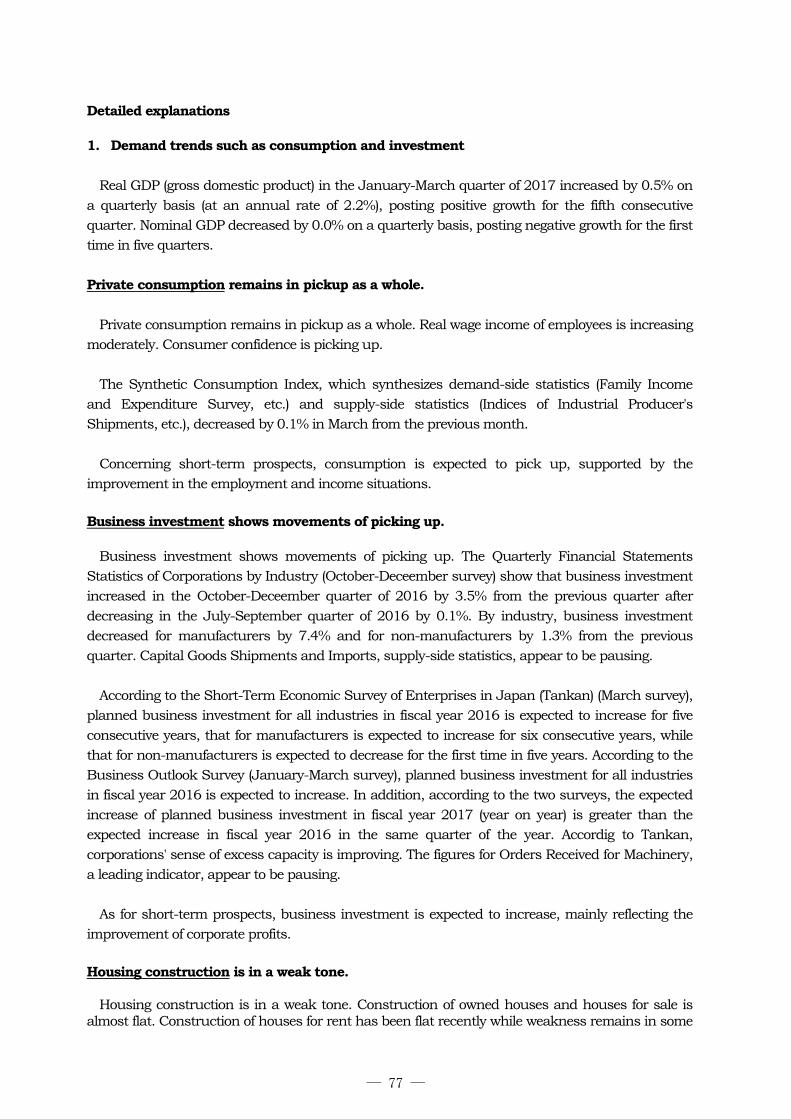
Detailed explanations 1. Demand trends such as consumption and investment
Real GDP (gross domestic product) in the January-March quarter of 2017 increased by 0.5% on a quarterly basis (at an annual rate of 2.2%), posting positive growth for the fifth consecutive quarter. Nominal GDP decreased by 0.0% on a quarterly basis, posting negative growth for the first time in five quarters. Private consumption remains in pickup as a whole.
Private consumption remains in pickup as a whole. Real wage income of employees is increasing moderately. Consumer confidence is picking up. The Synthetic Consumption Index, which synthesizes demand-side statistics (Family Income and Expenditure Survey, etc.) and supply-side statistics (Indices of Industrial Producer's Shipments, etc.), decreased by 0.1% in March from the previous month. Concerning short-term prospects, consumption is expected to pick up, supported by the improvement in the employment and income situations. Business investment shows movements of picking up. Business investment shows movements of picking up. The Quarterly Financial Statements Statistics of Corporations by Industry (October-Deceember survey) show that business investment increased in the October-Deceember quarter of 2016 by 3.5% from the previous quarter after decreasing in the July-September quarter of 2016 by 0.1%. By industry, business investment decreased for manufacturers by 7.4% and for non-manufacturers by 1.3% from the previous quarter. Capital Goods Shipments and Imports, supply-side statistics, appear to be pausing. According to the Short-Term Economic Survey of Enterprises in Japan (Tankan) (March survey), planned business investment for all industries in fiscal year 2016 is expected to increase for five consecutive years, that for manufacturers is expected to increase for six consecutive years, while that for non-manufacturers is expected to decrease for the first time in five years. According to the Business Outlook Survey (January-March survey), planned business investment for all industries in fiscal year 2016 is expected to increase. In addition, according to the two surveys, the expected increase of planned business investment in fiscal year 2017 (year on year) is greater than the expected increase in fiscal year 2016 in the same quarter of the year. Accordig to Tankan, corporations' sense of excess capacity is improving. The figures for Orders Received for Machinery, a leading indicator, appear to be pausing. As for short-term prospects, business investment is expected to increase, mainly reflecting the improvement of corporate profits. Housing construction is in a weak tone.
Housing construction is in a weak tone. Construction of owned houses and houses for sale is almost flat. Construction of houses for rent has been flat recently while weakness remains in some
― 77 ―
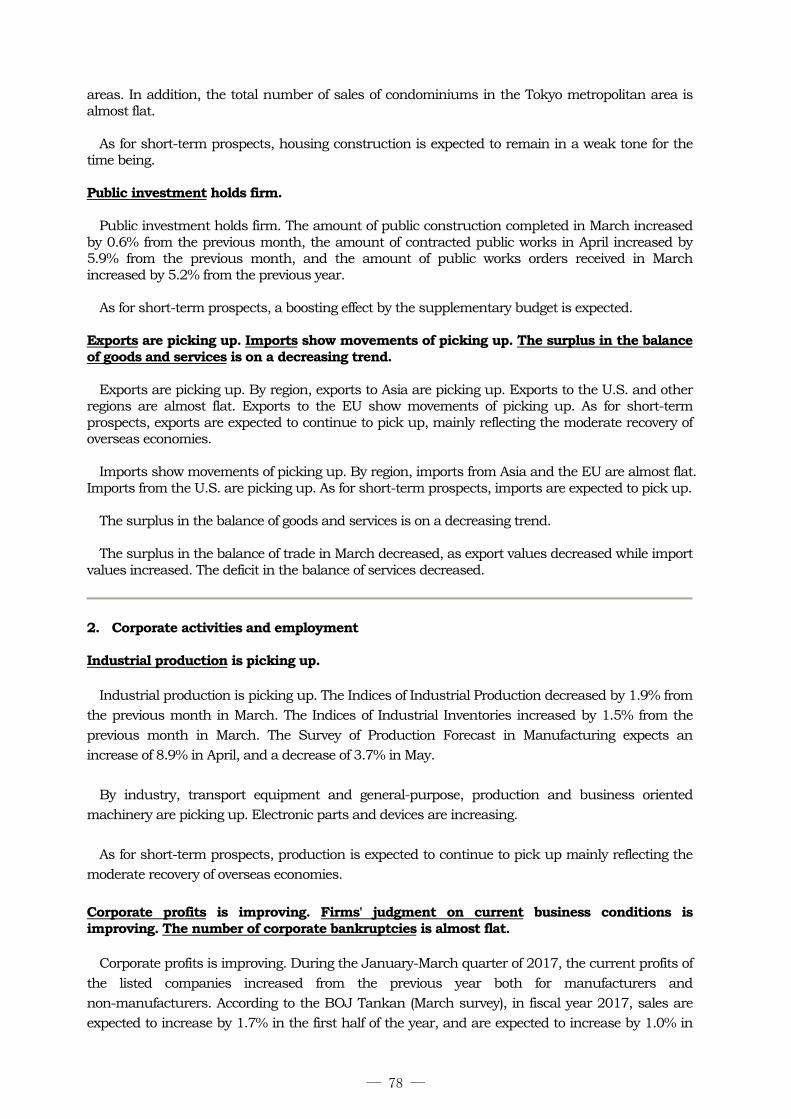
areas. In addition, the total number of sales of condominiums in the Tokyo metropolitan area is almost flat.
As for short-term prospects, housing construction is expected to remain in a weak tone for the
time being. Public investment holds firm. Public investment holds firm. The amount of public construction completed in March increased by 0.6% from the previous month, the amount of contracted public works in April increased by 5.9% from the previous month, and the amount of public works orders received in March increased by 5.2% from the previous year. As for short-term prospects, a boosting effect by the supplementary budget is expected. Exports are picking up. Imports show movements of picking up. The surplus in the balance of goods and services is on a decreasing trend.
Exports are picking up. By region, exports to Asia are picking up. Exports to the U.S. and other regions are almost flat. Exports to the EU show movements of picking up. As for short-term prospects, exports are expected to continue to pick up, mainly reflecting the moderate recovery of overseas economies. Imports show movements of picking up. By region, imports from Asia and the EU are almost flat. Imports from the U.S. are picking up. As for short-term prospects, imports are expected to pick up. The surplus in the balance of goods and services is on a decreasing trend. The surplus in the balance of trade in March decreased, as export values decreased while import values increased. The deficit in the balance of services decreased.
2. Corporate activities and employment
Industrial production is picking up. Industrial production is picking up. The Indices of Industrial Production decreased by 1.9% from the previous month in March. The Indices of Industrial Inventories increased by 1.5% from the previous month in March. The Survey of Production Forecast in Manufacturing expects an increase of 8.9% in April, and a decrease of 3.7% in May. By industry, transport equipment and general-purpose, production and business oriented machinery are picking up. Electronic parts and devices are increasing. As for short-term prospects, production is expected to continue to pick up mainly reflecting the moderate recovery of overseas economies. Corporate profits is improving. Firms' judgment on current business conditions is improving. The number of corporate bankruptcies is almost flat.
Corporate profits is improving. During the January-March quarter of 2017, the current profits of the listed companies increased from the previous year both for manufacturers and non-manufacturers. According to the BOJ Tankan (March survey), in fiscal year 2017, sales are expected to increase by 1.7% in the first half of the year, and are expected to increase by 1.0% in
― 78 ―
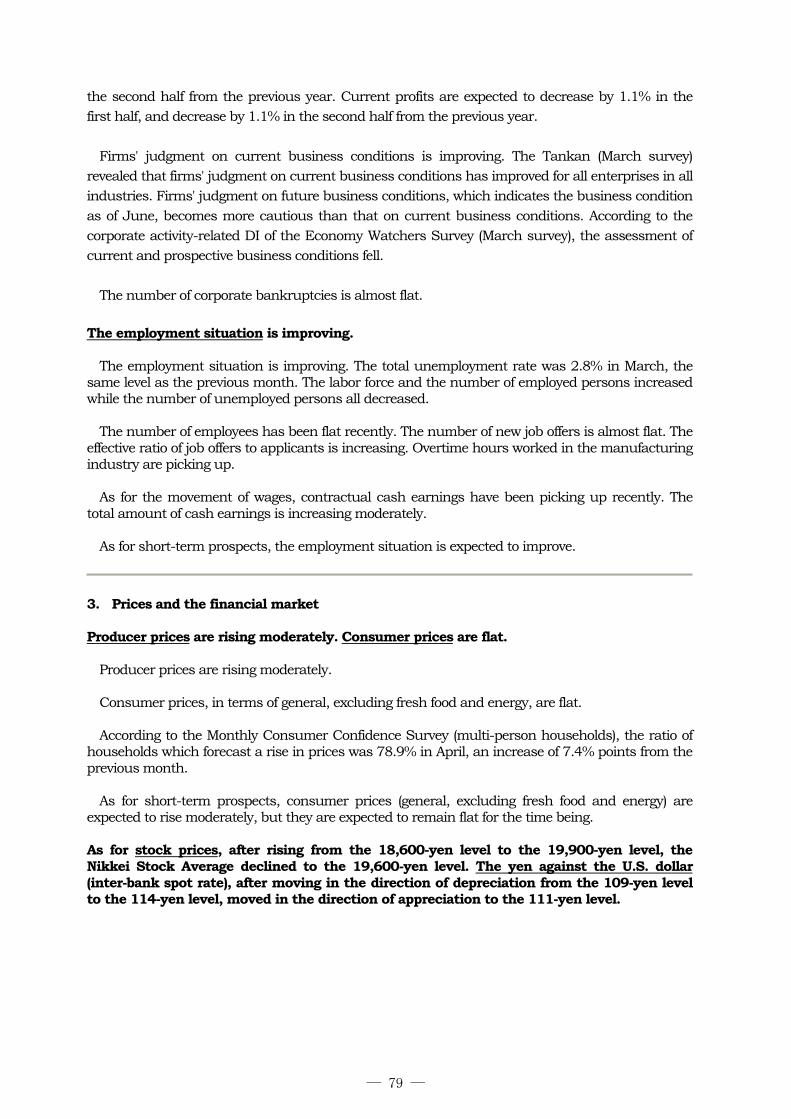
the second half from the previous year. Current profits are expected to decrease by 1.1% in the first half, and decrease by 1.1% in the second half from the previous year. Firms' judgment on current business conditions is improving. The Tankan (March survey) revealed that firms' judgment on current business conditions has improved for all enterprises in all industries. Firms' judgment on future business conditions, which indicates the business condition as of June, becomes more cautious than that on current business conditions. According to the corporate activity-related DI of the Economy Watchers Survey (March survey), the assessment of current and prospective business conditions fell. The number of corporate bankruptcies is almost flat. The employment situation is improving. The employment situation is improving. The total unemployment rate was 2.8% in March, the same level as the previous month. The labor force and the number of employed persons increased while the number of unemployed persons all decreased. The number of employees has been flat recently. The number of new job offers is almost flat. The effective ratio of job offers to applicants is increasing. Overtime hours worked in the manufacturing industry are picking up. As for the movement of wages, contractual cash earnings have been picking up recently. The total amount of cash earnings is increasing moderately. As for short-term prospects, the employment situation is expected to improve.
3. Prices and the financial market Producer prices are rising moderately. Consumer prices are flat.
Producer prices are rising moderately. Consumer prices, in terms of general, excluding fresh food and energy, are flat. According to the Monthly Consumer Confidence Survey (multi-person households), the ratio of households which forecast a rise in prices was 78.9% in April, an increase of 7.4% points from the previous month. As for short-term prospects, consumer prices (general, excluding fresh food and energy) are expected to rise moderately, but they are expected to remain flat for the time being. As for stock prices, after rising from the 18,600-yen level to the 19,900-yen level, the Nikkei Stock Average declined to the 19,600-yen level. The yen against the U.S. dollar (inter-bank spot rate), after moving in the direction of depreciation from the 109-yen level to the 114-yen level, moved in the direction of appreciation to the 111-yen level.
― 79 ―
Main Economic Indicators of Japan
May 2017
Policy Planning & Research Division, Minister's Secretariat,Ministry of Finance
― 80 ―
Note ;
Percentage changes is compared with theprevious period (month).
Percentage changes is compared with the sameperiod (month) of the previous year.
Seasonally Adjusted.
Not seasonally Adjusted.
Nominal value or current price.
Real value.
― 81 ―
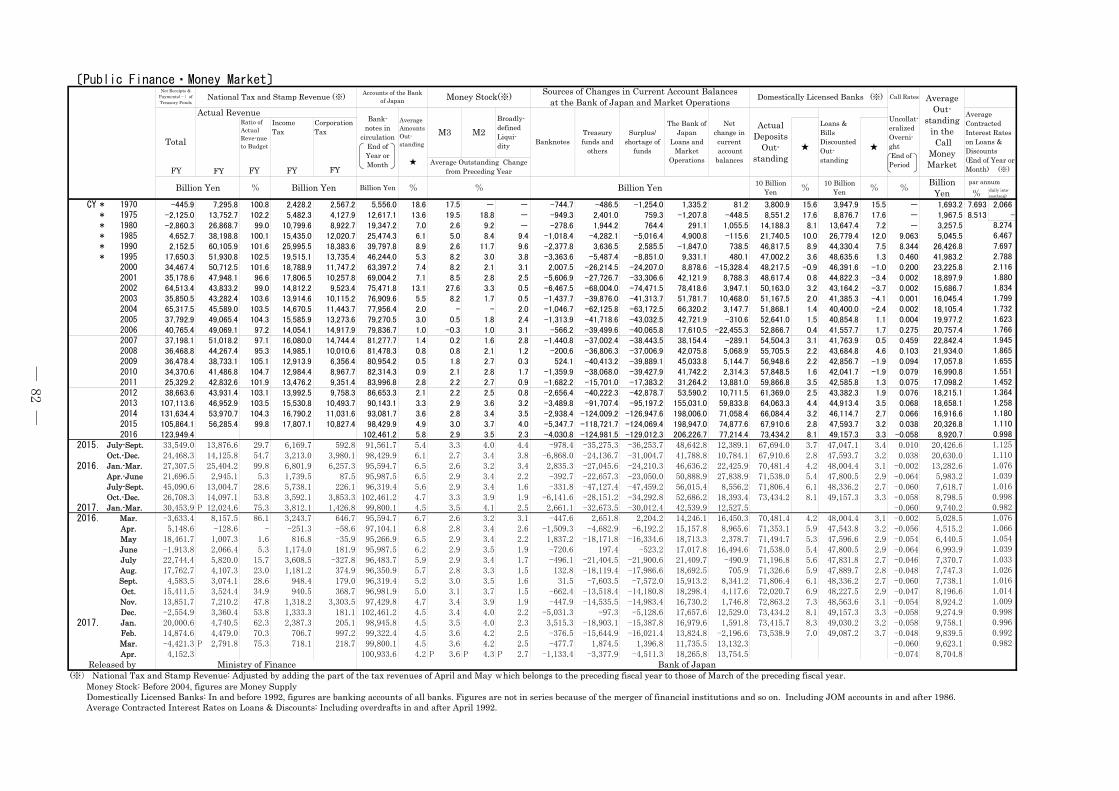
〔Public Finance・Money Market〕
Ratio ofActualReve-nueto Budget
IncomeTax
CorporationTax
★
par annum
%daily inte-rest(sen)
CY * 1970 -445.9 7,295.8 100.8 2,428.2 2,567.2 5,556.0 18.6 17.5 - - -744.7 -486.5 -1,254.0 1,335.2 81.2 3,800.9 15.6 3,947.9 15.5 - 1,693.2 7.693 2,066
CY * 1975 -2,125.0 13,752.7 102.2 5,482.3 4,127.9 12,617.1 13.6 19.5 18.8 - -949.3 2,401.0 759.3 -1,207.8 -448.5 8,551.2 17.6 8,876.7 17.6 - 1,967.5 8.513 -
CY * 1980 -2,860.3 26,868.7 99.0 10,799.6 8,922.7 19,347.2 7.0 2.6 9.2 - -278.6 1,944.2 764.4 291.1 1,055.5 14,188.3 8.1 13,647.4 7.2 - 3,257.5
CY * 1985 4,652.7 38,198.8 100.1 15,435.0 12,020.7 25,474.3 6.1 5.0 8.4 9.4 -1,018.4 -4,282.1 -5,016.4 4,900.8 -115.6 21,740.5 10.0 26,779.4 12.0 9.063 5,045.5
CY * 1990 2,152.5 60,105.9 101.6 25,995.5 18,383.6 39,797.8 8.9 2.6 11.7 9.6 -2,377.8 3,636.5 2,585.5 -1,847.0 738.5 46,817.5 8.9 44,330.4 7.5 8.344 26,426.8
CY * 1995 17,650.3 51,930.8 102.5 19,515.1 13,735.4 46,244.0 5.3 8.2 3.0 3.8 -3,363.6 -5,487.4 -8,851.0 9,331.1 480.1 47,002.2 3.6 48,635.6 1.3 0.460 41,983.2
CY 2000 34,467.4 50,712.5 101.6 18,788.9 11,747.2 63,397.2 7.4 8.2 2.1 3.1 2,007.5 -26,214.5 -24,207.0 8,878.6 -15,328.4 48,217.5 -0.9 46,391.6 -1.0 0.200 23,225.8
CY 2001 35,178.6 47,948.1 96.6 17,806.5 10,257.8 69,004.2 7.1 8.5 2.8 2.5 -5,606.9 -27,726.7 -33,306.6 42,121.9 8,788.3 48,617.4 0.8 44,822.3 -3.4 0.002 18,897.9
CY 2002 64,513.4 43,833.2 99.0 14,812.2 9,523.4 75,471.8 13.1 27.6 3.3 0.5 -6,467.5 -68,004.0 -74,471.5 78,418.6 3,947.1 50,163.0 3.2 43,164.2 -3.7 0.002 15,686.7
CY 2003 35,850.5 43,282.4 103.6 13,914.6 10,115.2 76,909.6 5.5 8.2 1.7 0.5 -1,437.7 -39,876.0 -41,313.7 51,781.7 10,468.0 51,167.5 2.0 41,385.3 -4.1 0.001 16,045.4
CY 2004 65,317.5 45,589.0 103.5 14,670.5 11,443.7 77,956.4 2.0 - - 2.0 -1,046.7 -62,125.8 -63,172.5 66,320.2 3,147.7 51,868.1 1.4 40,400.0 -2.4 0.002 18,105.4
CY 2005 37,792.9 49,065.4 104.3 15,585.9 13,273.6 79,270.5 3.0 0.5 1.8 2.4 -1,313.9 -41,718.6 -43,032.5 42,721.9 -310.6 52,641.0 1.5 40,854.8 1.1 0.004 19,977.2
CY 2006 40,765.4 49,069.1 97.2 14,054.1 14,917.9 79,836.7 1.0 -0.3 1.0 3.1 -566.2 -39,499.6 -40,065.8 17,610.5 -22,455.3 52,866.7 0.4 41,557.7 1.7 0.275 20,757.4
CY 2007 37,198.1 51,018.2 97.1 16,080.0 14,744.4 81,277.7 1.4 0.2 1.6 2.8 -1,440.8 -37,002.4 -38,443.5 38,154.4 -289.1 54,504.3 3.1 41,763.9 0.5 0.459 22,842.4
CY 2008 36,468.8 44,267.4 95.3 14,985.1 10,010.6 81,478.3 0.8 0.8 2.1 1.2 -200.6 -36,806.3 -37,006.9 42,075.8 5,068.9 55,705.5 2.2 43,684.8 4.6 0.103 21,934.0
CY 2009 36,478.4 38,733.1 105.1 12,913.9 6,356.4 80,954.2 0.5 1.8 2.7 0.3 524.1 -40,413.2 -39,889.1 45,033.8 5,144.7 56,948.6 2.2 42,856.7 -1.9 0.094 17,057.8
CY 2010 34,370.6 41,486.8 104.7 12,984.4 8,967.7 82,314.3 0.9 2.1 2.8 1.7 -1,359.9 -38,068.0 -39,427.9 41,742.2 2,314.3 57,848.5 1.6 42,041.7 -1.9 0.079 16,990.8
CY 2011 25,329.2 42,832.6 101.9 13,476.2 9,351.4 83,996.8 2.8 2.2 2.7 0.9 -1,682.2 -15,701.0 -17,383.2 31,264.2 13,881.0 59,866.8 3.5 42,585.8 1.3 0.075 17,098.2
CY 2012 38,663.6 43,931.4 103.1 13,992.5 9,758.3 86,653.3 2.1 2.2 2.5 0.8 -2,656.4 -40,222.3 -42,878.7 53,590.2 10,711.5 61,369.0 2.5 43,382.3 1.9 0.076 18,215.1
CY 2013 107,113.6 46,952.9 103.5 15,530.8 10,493.7 90,143.1 3.3 2.9 3.6 3.2 -3,489.8 -91,707.4 -95,197.2 155,031.0 59,833.8 64,063.3 4.4 44,913.4 3.5 0.068 18,658.1
CY 2014 131,634.4 53,970.7 104.3 16,790.2 11,031.6 93,081.7 3.6 2.8 3.4 3.5 -2,938.4 -124,009.2 -126,947.6 198,006.0 71,058.4 66,084.4 3.2 46,114.7 2.7 0.066 16,916.6
CY 2015 105,864.1 56,285.4 99.8 17,807.1 10,827.4 98,429.9 4.9 3.0 3.7 4.0 -5,347.7 -118,721.7 -124,069.4 198,947.0 74,877.6 67,910.6 2.8 47,593.7 3.2 0.038 20,326.8
CY 2016 123,949.4 102,461.2 5.8 2.9 3.5 2.3 -4,030.8 -124,981.5 -129,012.3 206,226.7 77,214.4 73,434.2 8.1 49,157.3 3.3 -0.058 8,920.7
2015.July-Sept. 33,549.0 13,876.6 29.7 6,169.7 592.8 91,561.7 5.4 3.3 4.0 4.4 -978.4 -35,275.3 -36,253.7 48,642.8 12,389.1 67,694.0 3.7 47,047.1 3.4 0.010 20,426.6
2015.Oct.-Dec. 24,468.3 14,125.8 54.7 3,213.0 3,980.1 98,429.9 6.1 2.7 3.4 3.8 -6,868.0 -24,136.7 -31,004.7 41,788.8 10,784.1 67,910.6 2.8 47,593.7 3.2 0.038 20,630.0
2016.Jan.-Mar. 27,307.5 25,404.2 99.8 6,801.9 6,257.3 95,594.7 6.5 2.6 3.2 3.4 2,835.3 -27,045.6 -24,210.3 46,636.2 22,425.9 70,481.4 4.2 48,004.4 3.1 -0.002 13,282.6
2016.Apr.-June 21,696.5 2,945.1 5.3 1,739.5 87.5 95,987.5 6.5 2.9 3.4 2.2 -392.7 -22,657.3 -23,050.0 50,888.9 27,838.9 71,538.0 5.4 47,800.5 2.9 -0.064 5,983.2
2016.July-Sept. 45,090.6 13,004.7 28.6 5,738.1 226.1 96,319.4 5.6 2.9 3.4 1.6 -331.8 -47,127.4 -47,459.2 56,015.4 8,556.2 71,806.4 6.1 48,336.2 2.7 -0.060 7,618.7
2016.Oct.-Dec. 26,708.3 14,097.1 53.8 3,592.1 3,853.3 102,461.2 4.7 3.3 3.9 1.9 -6,141.6 -28,151.2 -34,292.8 52,686.2 18,393.4 73,434.2 8.1 49,157.3 3.3 -0.058 8,798.5
2017.Jan.-Mar. 30,453.9 P 12,024.6 75.3 3,812.1 1,426.8 99,800.1 4.5 3.5 4.1 2.5 2,661.1 -32,673.5 -30,012.4 42,539.9 12,527.5 -0.060 9,740.2
2016. Mar. -3,633.4 8,157.5 86.1 3,243.7 646.7 95,594.7 6.7 2.6 3.2 3.1 -447.6 2,651.8 2,204.2 14,246.1 16,450.3 70,481.4 4.2 48,004.4 3.1 -0.002 5,028.5
2016. Apr. 5,148.6 -128.6 - -251.3 -58.6 97,104.1 6.8 2.8 3.4 2.6 -1,509.3 -4,682.9 -6,192.2 15,157.8 8,965.6 71,353.1 5.9 47,543.8 3.2 -0.056 4,515.2
2016. May 18,461.7 1,007.3 1.6 816.8 -35.9 95,266.9 6.5 2.9 3.4 2.2 1,837.2 -18,171.8 -16,334.6 18,713.3 2,378.7 71,494.7 5.3 47,596.6 2.9 -0.054 6,440.5
2016. June -1,913.8 2,066.4 5.3 1,174.0 181.9 95,987.5 6.2 2.9 3.5 1.9 -720.6 197.4 -523.2 17,017.8 16,494.6 71,538.0 5.4 47,800.5 2.9 -0.064 6,993.9
2016. July 22,744.4 5,820.0 15.7 3,608.5 -327.8 96,483.7 5.9 2.9 3.4 1.7 -496.1 -21,404.5 -21,900.6 21,409.7 -490.9 71,196.8 5.6 47,831.8 2.7 -0.046 7,370.7
2016. Aug. 17,762.7 4,107.3 23.0 1,181.2 374.9 96,350.9 5.7 2.8 3.3 1.5 132.8 -18,119.4 -17,986.6 18,692.5 705.9 71,326.6 5.9 47,889.7 2.8 -0.048 7,747.3
2016. Sept. 4,583.5 3,074.1 28.6 948.4 179.0 96,319.4 5.2 3.0 3.5 1.6 31.5 -7,603.5 -7,572.0 15,913.2 8,341.2 71,806.4 6.1 48,336.2 2.7 -0.060 7,738.1
2016. Oct. 15,411.5 3,524.4 34.9 940.5 368.7 96,981.9 5.0 3.1 3.7 1.5 -662.4 -13,518.4 -14,180.8 18,298.4 4,117.6 72,020.7 6.9 48,227.5 2.9 -0.047 8,196.6
2016. Nov. 13,851.7 7,210.2 47.8 1,318.2 3,303.5 97,429.8 4.7 3.4 3.9 1.9 -447.9 -14,535.5 -14,983.4 16,730.2 1,746.8 72,863.2 7.3 48,563.6 3.1 -0.054 8,924.2
2016. Dec. -2,554.9 3,360.4 53.8 1,333.3 181.1 102,461.2 4.5 3.4 4.0 2.2 -5,031.3 -97.3 -5,128.6 17,657.6 12,529.0 73,434.2 8.1 49,157.3 3.3 -0.058 9,274.9
2017. Jan. 20,000.6 4,740.5 62.3 2,387.3 205.1 98,945.8 4.5 3.5 4.0 2.3 3,515.3 -18,903.1 -15,387.8 16,979.6 1,591.8 73,415.7 8.3 49,030.2 3.2 -0.058 9,758.1
2017. Feb. 14,874.6 4,479.0 70.3 706.7 997.2 99,322.4 4.5 3.6 4.2 2.5 -376.5 -15,644.9 -16,021.4 13,824.8 -2,196.6 73,538.9 7.0 49,087.2 3.7 -0.048 9,839.5
2017. Mar. -4,421.3 P 2,791.8 75.3 718.1 218.7 99,800.1 4.5 3.6 4.2 2.5 -477.7 1,874.5 1,396.8 11,735.5 13,132.3 -0.060 9,623.1
2017. Apr. 4,152.3 100,933.6 4.2 P 3.6 P 4.3 P 2.7 -1,133.4 -3,377.9 -4,511.3 18,265.8 13,754.5 -0.074 8,704.8
(※) National Tax and Stamp Revenue: Adjusted by adding the part of the tax revenues of April and May which belongs to the preceding fiscal year to those of March of the preceding fiscal year. Money Stock: Before 2004, figures are Money Supply Domestically Licensed Banks: In and before 1992, figures are banking accounts of all banks. Figures are not in series because of the merger of financial institutions and so on. Including JOM accounts in and after 1986. Average Contracted Interest Rates on Loans & Discounts: Including overdrafts in and after April 1992.
Call Rates AverageOut-
standingin the Call
MoneyMarket
Total
Actual RevenueBank-
notes incirculation
End ofYear orMonth
AverageAmountsOut-standing
M3 M2Broadly-definedLiqui-dity Banknotes
Net Receipts &Payments(-)ofTreasury Funds
National Tax and Stamp Revenue (※) Accounts of the Bankof Japan Money Stock(※) Sources of Changes in Current Account Balances
at the Bank of Japan and Market Operations Domestically Licensed Banks (※)
Billion Yen % Billion Yen Billion Yen %
Uncollat-eralizedOverni-ght End ofPeriod
AverageContractedInterest Rateson Loans &Discounts(End of Year orMonth) (※)
★ ★
Average Outstanding Changefrom Preceding Year
Treasuryfunds and
others
Surplus/shortage of
funds
The Bank ofJapan
Loans andMarket
Operations
Netchange incurrent accountbalances
ActualDeposits
Out-standing
Loans &BillsDiscountedOut-standing
2.788
% Billion Yen 10 BillionYen %
10 BillionYen % %
BillionYen
8.2746.4677.697
1.452
2.1161.8801.8341.7991.7321.6231.7661.9451.8651.6551.551
0.982
1.3641.2581.1801.1100.9981.1251.1101.0761.0391.0160.998
0.992
1.0761.0661.0541.0391.0331.0261.0161.0141.0090.9980.996
0.982
Released by Ministry of Finance Bank of Japan
FY FY FY FY FY
― 82 ―
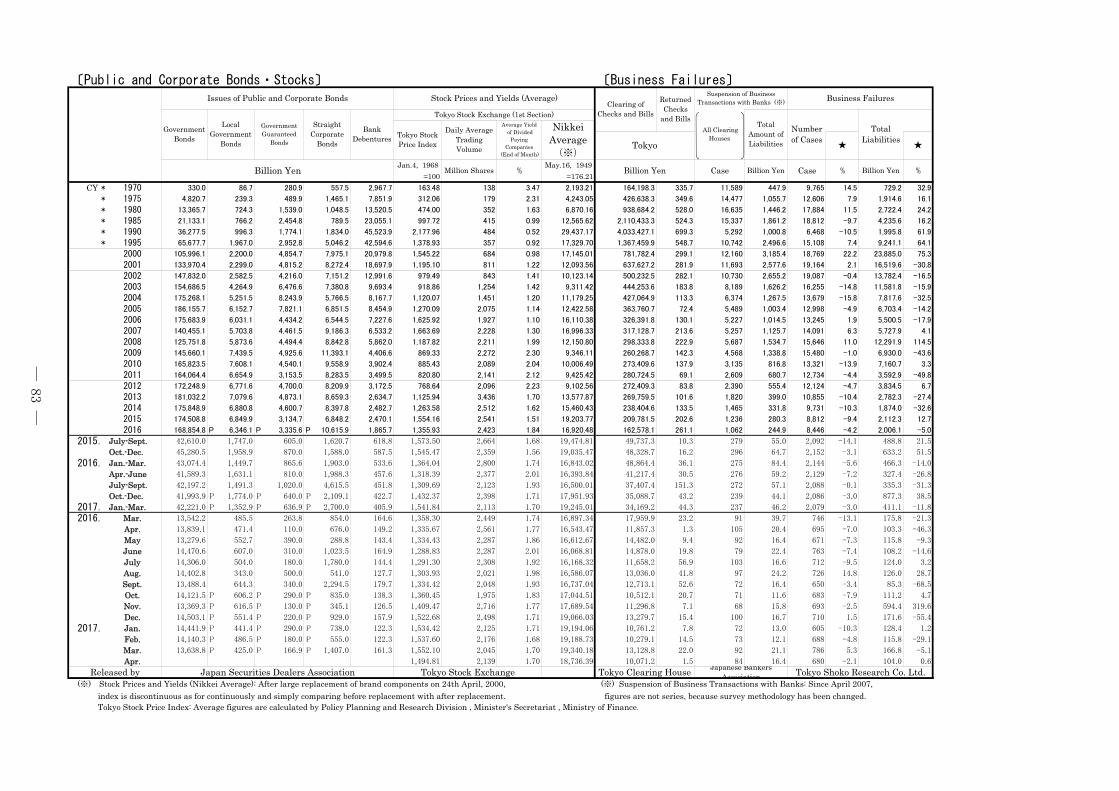
〔Public and Corporate Bonds・Stocks〕 〔Business Failures〕
Jan.4, 1968 May.16, 1949=100 =176.21
CY * 1970 330.0 86.7 280.9 557.5 2,967.7 163.48 138 3.47 2,193.21 164,198.3 335.7 11,589 447.9 9,765 14.5 729.2 32.9
CY * 1975 4,820.7 239.3 489.9 1,465.1 7,851.9 312.06 179 2.31 4,243.05 426,638.3 349.6 14,477 1,055.7 12,606 7.9 1,914.6 16.1
CY * 1980 13,365.7 724.3 1,539.0 1,048.5 13,520.5 474.00 352 1.63 6,870.16 938,684.2 528.0 16,635 1,446.2 17,884 11.5 2,722.4 24.2
CY * 1985 21,133.1 766.2 2,454.8 789.5 23,055.1 997.72 415 0.99 12,565.62 2,110,433.3 524.3 15,337 1,861.2 18,812 -9.7 4,235.6 16.2
CY * 1990 36,277.5 996.3 1,774.1 1,834.0 45,523.9 2,177.96 484 0.52 29,437.17 4,033,427.1 699.3 5,292 1,000.8 6,468 -10.5 1,995.8 61.9
CY * 1995 65,677.7 1,967.0 2,952.8 5,046.2 42,594.6 1,378.93 357 0.92 17,329.70 1,367,459.9 548.7 10,742 2,496.6 15,108 7.4 9,241.1 64.1
CY 2000 105,996.1 2,200.0 4,854.7 7,975.1 20,979.8 1,545.22 684 0.98 17,145.01 781,782.4 299.1 12,160 3,185.4 18,769 22.2 23,885.0 75.3
CY 2001 133,970.4 2,299.0 4,815.2 8,272.4 18,697.9 1,195.10 811 1.22 12,093.56 637,627.2 281.9 11,693 2,577.6 19,164 2.1 16,519.6 -30.8
CY 2002 147,832.0 2,582.5 4,216.0 7,151.2 12,991.6 979.49 843 1.41 10,123.14 500,232.5 282.1 10,730 2,655.2 19,087 -0.4 13,782.4 -16.5
CY 2003 154,686.5 4,264.9 6,476.6 7,380.8 9,693.4 918.86 1,254 1.42 9,311.42 444,253.6 183.8 8,189 1,626.2 16,255 -14.8 11,581.8 -15.9
CY 2004 175,268.1 5,251.5 8,243.9 5,766.5 8,167.7 1,120.07 1,451 1.20 11,179.25 427,064.9 113.3 6,374 1,267.5 13,679 -15.8 7,817.6 -32.5
CY 2005 186,155.7 6,152.7 7,821.1 6,851.5 8,454.9 1,270.09 2,075 1.14 12,422.58 363,760.7 72.4 5,489 1,003.4 12,998 -4.9 6,703.4 -14.2
CY 2006 175,683.9 6,031.1 4,434.2 6,544.5 7,227.6 1,625.92 1,927 1.10 16,110.38 326,391.8 130.1 5,227 1,014.5 13,245 1.9 5,500.5 -17.9
CY 2007 140,455.1 5,703.8 4,461.5 9,186.3 6,533.2 1,663.69 2,228 1.30 16,996.33 317,128.7 213.6 5,257 1,125.7 14,091 6.3 5,727.9 4.1
CY 2008 125,751.8 5,873.6 4,494.4 8,842.8 5,862.0 1,187.82 2,211 1.99 12,150.80 298,333.8 222.9 5,687 1,534.7 15,646 11.0 12,291.9 114.5
CY 2009 145,660.1 7,439.5 4,925.6 11,393.1 4,406.6 869.33 2,272 2.30 9,346.11 260,268.7 142.3 4,568 1,338.8 15,480 -1.0 6,930.0 -43.6
CY 2010 165,823.5 7,608.1 4,540.1 9,558.9 3,902.4 885.43 2,089 2.04 10,006.49 273,409.6 137.9 3,135 816.8 13,321 -13.9 7,160.7 3.3
CY 2011 164,064.4 6,654.9 3,153.5 8,283.5 3,499.5 820.80 2,141 2.12 9,425.42 280,724.5 69.1 2,609 680.7 12,734 -4.4 3,592.9 -49.8
CY 2012 172,248.9 6,771.6 4,700.0 8,209.9 3,172.5 768.64 2,096 2.23 9,102.56 272,409.3 83.8 2,390 555.4 12,124 -4.7 3,834.5 6.7
CY 2013 181,032.2 7,079.6 4,873.1 8,659.3 2,634.7 1,125.94 3,436 1.70 13,577.87 269,759.5 101.6 1,820 399.0 10,855 -10.4 2,782.3 -27.4
CY 2014 175,848.9 6,880.8 4,600.7 8,397.8 2,482.7 1,263.58 2,512 1.62 15,460.43 238,404.6 133.5 1,465 331.8 9,731 -10.3 1,874.0 -32.6
CY 2015 174,508.8 6,849.9 3,134.7 6,848.2 2,470.1 1,554.16 2,541 1.51 19,203.77 209,781.5 202.6 1,236 280.3 8,812 -9.4 2,112.3 12.7
CY 2016 168,854.8 P 6,346.1 P 3,335.6 P 10,615.9 1,865.7 1,355.93 2,423 1.84 16,920.48 162,578.1 261.1 1,062 244.9 8,446 -4.2 2,006.1 -5.0
2015.July-Sept. 42,610.0 1,747.0 605.0 1,620.7 618.8 1,573.50 2,664 1.68 19,474.81 49,737.3 10.3 279 55.0 2,092 -14.1 488.8 21.5
2015.Oct.-Dec. 45,280.5 1,958.9 870.0 1,588.0 587.5 1,545.47 2,359 1.56 19,035.47 48,328.7 16.2 296 64.7 2,152 -3.1 633.2 51.5
2016.Jan.-Mar. 43,074.4 1,449.7 865.6 1,903.0 533.6 1,364.04 2,800 1.74 16,843.02 48,864.4 36.1 275 84.4 2,144 -5.6 466.3 -14.0
2016.Apr.-June 41,589.3 1,631.1 810.0 1,988.3 457.6 1,318.39 2,377 2.01 16,393.84 41,217.4 30.5 276 59.2 2,129 -7.2 327.4 -26.8
2016.July-Sept. 42,197.2 1,491.3 1,020.0 4,615.5 451.8 1,309.69 2,123 1.93 16,500.01 37,407.4 151.3 272 57.1 2,088 -0.1 335.3 -31.3
2016.Oct.-Dec. 41,993.9 P 1,774.0 P 640.0 P 2,109.1 422.7 1,432.37 2,398 1.71 17,951.93 35,088.7 43.2 239 44.1 2,086 -3.0 877.3 38.5
2017.Jan.-Mar. 42,221.0 P 1,352.9 P 636.9 P 2,700.0 405.9 1,541.84 2,113 1.70 19,245.01 34,169.2 44.3 237 46.2 2,079 -3.0 411.1 -11.8
2016. Mar. 13,542.2 485.5 263.8 854.0 164.6 1,358.30 2,449 1.74 16,897.34 17,959.9 23.2 91 39.7 746 -13.1 175.8 -21.3
2016. Apr. 13,839.1 471.4 110.0 676.0 149.2 1,335.67 2,561 1.77 16,543.47 11,857.3 1.3 105 20.4 695 -7.0 103.3 -46.3
2016. May 13,279.6 552.7 390.0 288.8 143.4 1,334.43 2,287 1.86 16,612.67 14,482.0 9.4 92 16.4 671 -7.3 115.8 -9.3
2016. June 14,470.6 607.0 310.0 1,023.5 164.9 1,288.83 2,287 2.01 16,068.81 14,878.0 19.8 79 22.4 763 -7.4 108.2 -14.6
2016. July 14,306.0 504.0 180.0 1,780.0 144.4 1,291.30 2,308 1.92 16,168.32 11,658.2 56.9 103 16.6 712 -9.5 124.0 3.2
2016. Aug. 14,402.8 343.0 500.0 541.0 127.7 1,303.93 2,021 1.98 16,586.07 13,036.0 41.8 97 24.2 726 14.8 126.0 28.7
2016. Sept. 13,488.4 644.3 340.0 2,294.5 179.7 1,334.42 2,048 1.93 16,737.04 12,713.1 52.6 72 16.4 650 -3.4 85.3 -68.5
2016. Oct. 14,121.5 P 606.2 P 290.0 P 835.0 138.3 1,360.45 1,975 1.83 17,044.51 10,512.1 20.7 71 11.6 683 -7.9 111.2 4.7
2016. Nov. 13,369.3 P 616.5 P 130.0 P 345.1 126.5 1,409.47 2,716 1.77 17,689.54 11,296.8 7.1 68 15.8 693 -2.5 594.4 319.6
2016. Dec. 14,503.1 P 551.4 P 220.0 P 929.0 157.9 1,522.68 2,498 1.71 19,066.03 13,279.7 15.4 100 16.7 710 1.5 171.6 -55.4
2017. Jan. 14,441.9 P 441.4 P 290.0 P 738.0 122.3 1,534.42 2,125 1.71 19,194.06 10,761.2 7.8 72 13.0 605 -10.3 128.4 1.2
2017. Feb. 14,140.3 P 486.5 P 180.0 P 555.0 122.3 1,537.60 2,176 1.68 19,188.73 10,279.1 14.5 73 12.1 688 -4.8 115.8 -29.1
2017. Mar. 13,638.8 P 425.0 P 166.9 P 1,407.0 161.3 1,552.10 2,045 1.70 19,340.18 13,128.8 22.0 92 21.1 786 5.3 166.8 -5.1
2017. Apr. 1,494.81 2,139 1.70 18,736.39 10,071.2 1.5 84 16.4 680 -2.1 104.0 0.6
(※) Stock Prices and Yields (Nikkei Average): After large replacement of brand components on 24th April, 2000, (※) Suspension of Business Transactions with Banks: Since April 2007, index is discontinuous as for continuously and simply comparing before replacement with after replacement. figures are not series, because survey methodology has been changed. Tokyo Stock Price Index: Average figures are calculated by Policy Planning and Research Division , Minister's Secretariat , Ministry of Finance.
Clearing ofChecks and Bills
ReturnedChecks
and Bills
Suspension of BusinessTransactions with Banks (※) Business Failures
GovernmentBonds
LocalGovernment
Bonds
GovernmentGuaranteed
Bonds
StraightCorporate
BondsTokyo StockPrice Index
Daily AverageTradingVolume
Average Yield of Divided
PayingCompanies
(End of Month)
NikkeiAverage(※)
Issues of Public and Corporate Bonds Stock Prices and Yields (Average)
Tokyo ★ ★
Billion Yen Million Shares % Billion Yen Case Billion Yen Case
BankDebentures
Tokyo Stock Exchange (1st Section)
All ClearingHouses
TotalAmount ofLiabilities
Numberof Cases
TotalLiabilities
% Billion Yen %
Released by Japan Securities Dealers Association Tokyo Stock Exchange Tokyo Clearing House Japanese BankersAssociation Tokyo Shoko Research Co. Ltd.
― 83 ―
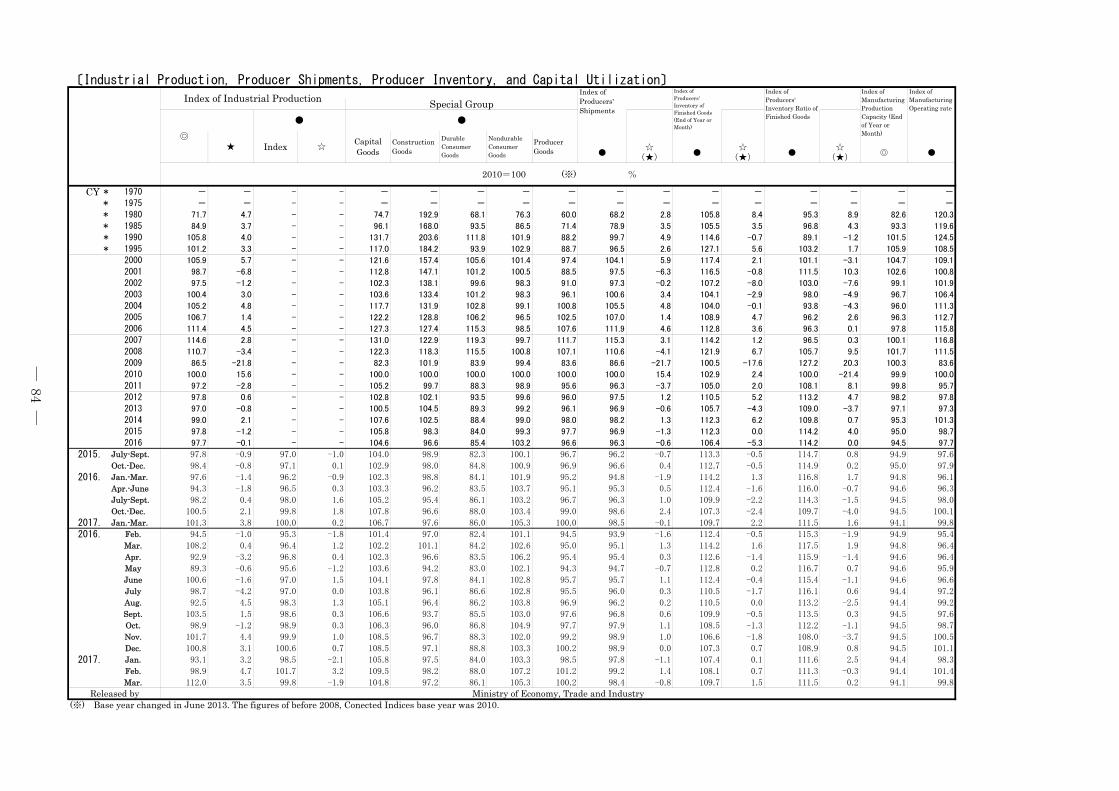
〔Industrial Production, Producer Shipments, Producer Inventory, and Capital Utilization〕
● ● ● ◎ ●
CY * 1970 - - - - - - - - - - - - - - - - -
CY * 1975 - - - - - - - - - - - - - - - - -
CY * 1980 71.7 4.7 - - 74.7 192.9 68.1 76.3 60.0 68.2 2.8 105.8 8.4 95.3 8.9 82.6 120.3
CY * 1985 84.9 3.7 - - 96.1 168.0 93.5 86.5 71.4 78.9 3.5 105.5 3.5 96.8 4.3 93.3 119.6
CY * 1990 105.8 4.0 - - 131.7 203.6 111.8 101.9 88.2 99.7 4.9 114.6 -0.7 89.1 -1.2 101.5 124.5
CY * 1995 101.2 3.3 - - 117.0 184.2 93.9 102.9 88.7 96.5 2.6 127.1 5.6 103.2 1.7 105.9 108.5
CY 2000 105.9 5.7 - - 121.6 157.4 105.6 101.4 97.4 104.1 5.9 117.4 2.1 101.1 -3.1 104.7 109.1
CY 2001 98.7 -6.8 - - 112.8 147.1 101.2 100.5 88.5 97.5 -6.3 116.5 -0.8 111.5 10.3 102.6 100.8
CY 2002 97.5 -1.2 - - 102.3 138.1 99.6 98.3 91.0 97.3 -0.2 107.2 -8.0 103.0 -7.6 99.1 101.9
CY 2003 100.4 3.0 - - 103.6 133.4 101.2 98.3 96.1 100.6 3.4 104.1 -2.9 98.0 -4.9 96.7 106.4
CY 2004 105.2 4.8 - - 117.7 131.9 102.8 99.1 100.8 105.5 4.8 104.0 -0.1 93.8 -4.3 96.0 111.3
CY 2005 106.7 1.4 - - 122.2 128.8 106.2 96.5 102.5 107.0 1.4 108.9 4.7 96.2 2.6 96.3 112.7
CY 2006 111.4 4.5 - - 127.3 127.4 115.3 98.5 107.6 111.9 4.6 112.8 3.6 96.3 0.1 97.8 115.8
CY 2007 114.6 2.8 - - 131.0 122.9 119.3 99.7 111.7 115.3 3.1 114.2 1.2 96.5 0.3 100.1 116.8
CY 2008 110.7 -3.4 - - 122.3 118.3 115.5 100.8 107.1 110.6 -4.1 121.9 6.7 105.7 9.5 101.7 111.5
CY 2009 86.5 -21.8 - - 82.3 101.9 83.9 99.4 83.6 86.6 -21.7 100.5 -17.6 127.2 20.3 100.3 83.6
CY 2010 100.0 15.6 - - 100.0 100.0 100.0 100.0 100.0 100.0 15.4 102.9 2.4 100.0 -21.4 99.9 100.0
CY 2011 97.2 -2.8 - - 105.2 99.7 88.3 98.9 95.6 96.3 -3.7 105.0 2.0 108.1 8.1 99.8 95.7
CY 2012 97.8 0.6 - - 102.8 102.1 93.5 99.6 96.0 97.5 1.2 110.5 5.2 113.2 4.7 98.2 97.8
CY 2013 97.0 -0.8 - - 100.5 104.5 89.3 99.2 96.1 96.9 -0.6 105.7 -4.3 109.0 -3.7 97.1 97.3
CY 2014 99.0 2.1 - - 107.6 102.5 88.4 99.0 98.0 98.2 1.3 112.3 6.2 109.8 0.7 95.3 101.3
CY 2015 97.8 -1.2 - - 105.8 98.3 84.0 99.3 97.7 96.9 -1.3 112.3 0.0 114.2 4.0 95.0 98.7
CY 2016 97.7 -0.1 - - 104.6 96.6 85.4 103.2 96.6 96.3 -0.6 106.4 -5.3 114.2 0.0 94.5 97.7
2015. July-Sept. 97.8 -0.9 97.0 -1.0 104.0 98.9 82.3 100.1 96.7 96.2 -0.7 113.3 -0.5 114.7 0.8 94.9 97.6
2015. Oct.-Dec. 98.4 -0.8 97.1 0.1 102.9 98.0 84.8 100.9 96.9 96.6 0.4 112.7 -0.5 114.9 0.2 95.0 97.9
2016. Jan.-Mar. 97.6 -1.4 96.2 -0.9 102.3 98.8 84.1 101.9 95.2 94.8 -1.9 114.2 1.3 116.8 1.7 94.8 96.1
2016. Apr.-June 94.3 -1.8 96.5 0.3 103.3 96.2 83.5 103.7 95.1 95.3 0.5 112.4 -1.6 116.0 -0.7 94.6 96.3
2016. July-Sept. 98.2 0.4 98.0 1.6 105.2 95.4 86.1 103.2 96.7 96.3 1.0 109.9 -2.2 114.3 -1.5 94.5 98.0
2016. Oct.-Dec. 100.5 2.1 99.8 1.8 107.8 96.6 88.0 103.4 99.0 98.6 2.4 107.3 -2.4 109.7 -4.0 94.5 100.1
2017. Jan.-Mar. 101.3 3.8 100.0 0.2 106.7 97.6 86.0 105.3 100.0 98.5 -0.1 109.7 2.2 111.5 1.6 94.1 99.8
2016. Feb. 94.5 -1.0 95.3 -1.8 101.4 97.0 82.4 101.1 94.5 93.9 -1.6 112.4 -0.5 115.3 -1.9 94.9 95.4
2016. Mar. 108.2 0.4 96.4 1.2 102.2 101.1 84.2 102.6 95.0 95.1 1.3 114.2 1.6 117.5 1.9 94.8 96.4
2016. Apr. 92.9 -3.2 96.8 0.4 102.3 96.6 83.5 106.2 95.4 95.4 0.3 112.6 -1.4 115.9 -1.4 94.6 96.4
2016. May 89.3 -0.6 95.6 -1.2 103.6 94.2 83.0 102.1 94.3 94.7 -0.7 112.8 0.2 116.7 0.7 94.6 95.9
2016. June 100.6 -1.6 97.0 1.5 104.1 97.8 84.1 102.8 95.7 95.7 1.1 112.4 -0.4 115.4 -1.1 94.6 96.6
2016. July 98.7 -4.2 97.0 0.0 103.8 96.1 86.6 102.8 95.5 96.0 0.3 110.5 -1.7 116.1 0.6 94.4 97.2
2016. Aug. 92.5 4.5 98.3 1.3 105.1 96.4 86.2 103.8 96.9 96.2 0.2 110.5 0.0 113.2 -2.5 94.4 99.2
2016. Sept. 103.5 1.5 98.6 0.3 106.6 93.7 85.5 103.0 97.6 96.8 0.6 109.9 -0.5 113.5 0.3 94.5 97.6
2016. Oct. 98.9 -1.2 98.9 0.3 106.3 96.0 86.8 104.9 97.7 97.9 1.1 108.5 -1.3 112.2 -1.1 94.5 98.7
2016. Nov. 101.7 4.4 99.9 1.0 108.5 96.7 88.3 102.0 99.2 98.9 1.0 106.6 -1.8 108.0 -3.7 94.5 100.5
2016. Dec. 100.8 3.1 100.6 0.7 108.5 97.1 88.8 103.3 100.2 98.9 0.0 107.3 0.7 108.9 0.8 94.5 101.1
2017. Jan. 93.1 3.2 98.5 -2.1 105.8 97.5 84.0 103.3 98.5 97.8 -1.1 107.4 0.1 111.6 2.5 94.4 98.3
2017. Feb. 98.9 4.7 101.7 3.2 109.5 98.2 88.0 107.2 101.2 99.2 1.4 108.1 0.7 111.3 -0.3 94.4 101.4
2017. Mar. 112.0 3.5 99.8 -1.9 104.8 97.2 86.1 105.3 100.2 98.4 -0.8 109.7 1.5 111.5 0.2 94.1 99.8
(※) Base year changed in June 2013. The figures of before 2008, Conected Indices base year was 2010.
2010=100 (※) %
Released by Ministry of Economy, Trade and Industry
☆(★)
☆(★)
☆(★)
★ Index ☆CapitalGoods
ConstructionGoods
DurableConsumerGoods
NondurableConsumerGoods
Index ofManufacturingOperating rate
Index of Industrial Production Index ofProducers'Shipments
Index ofProducers'Inventory ofFinished Goods(End of Year orMonth)
Index ofProducers'Inventory Ratio ofFinished Goods
Index ofManufacturingProductionCapacity (Endof Year orMonth)
Special Group
◎
● ●
ProducerGoods
― 84 ―
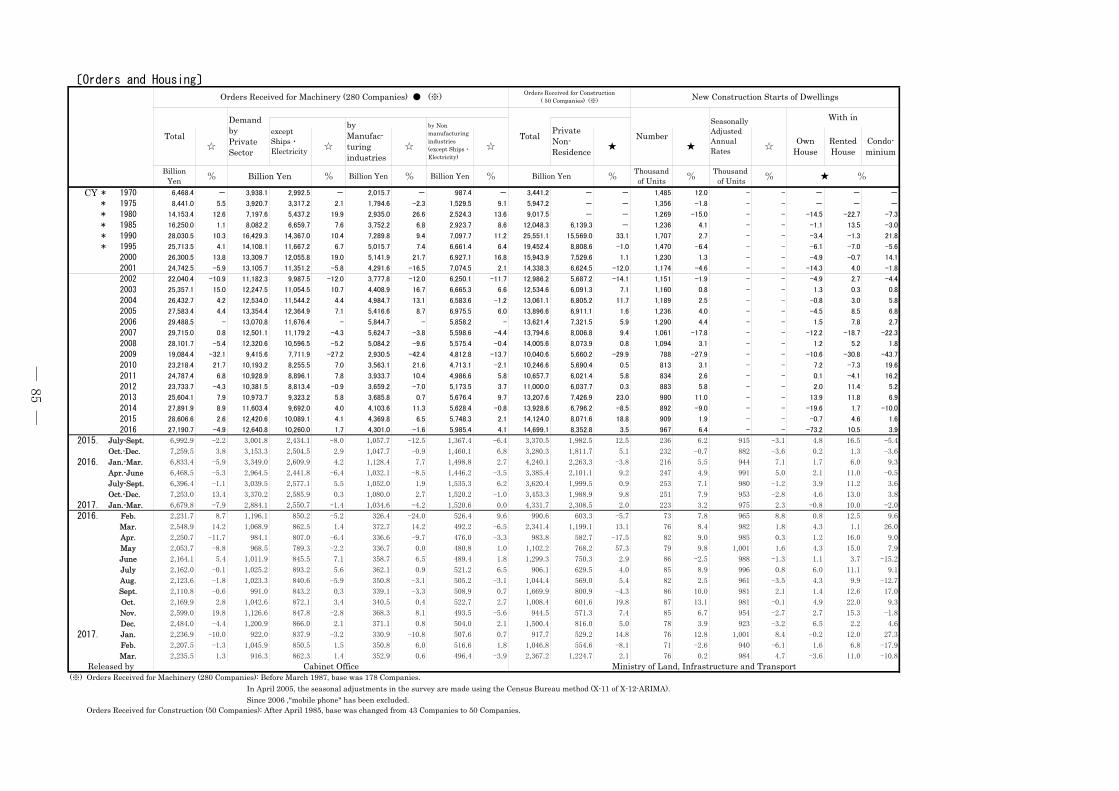
〔Orders and Housing〕
CY * 1970 6,468.4 - 3,938.1 2,992.5 - 2,015.7 - 987.4 - 3,441.2 - - 1,485 12.0 - - - - -
CY * 1975 8,441.0 5.5 3,920.7 3,317.2 2.1 1,794.6 -2.3 1,529.5 9.1 5,947.2 - - 1,356 -1.8 - - - - -
CY * 1980 14,153.4 12.6 7,197.6 5,437.2 19.9 2,935.0 26.6 2,524.3 13.6 9,017.5 - - 1,269 -15.0 - - -14.5 -22.7 -7.3
CY * 1985 16,250.0 1.1 8,082.2 6,659.7 7.6 3,752.2 6.8 2,923.7 8.6 12,048.3 6,139.3 - 1,236 4.1 - - -1.1 13.5 -3.0
CY * 1990 28,030.5 10.3 16,429.3 14,367.0 10.4 7,289.8 9.4 7,097.7 11.2 25,551.1 15,569.0 33.1 1,707 2.7 - - -3.4 -1.3 21.8
CY * 1995 25,713.5 4.1 14,108.1 11,667.2 6.7 5,015.7 7.4 6,661.4 6.4 19,452.4 8,808.6 -1.0 1,470 -6.4 - - -6.1 -7.0 -5.6
CY 2000 26,300.5 13.8 13,309.7 12,055.8 19.0 5,141.9 21.7 6,927.1 16.8 15,943.9 7,529.6 1.1 1,230 1.3 - - -4.9 -0.7 14.1
CY 2001 24,742.5 -5.9 13,105.7 11,351.2 -5.8 4,291.6 -16.5 7,074.5 2.1 14,338.3 6,624.5 -12.0 1,174 -4.6 - - -14.3 4.0 -1.8
CY 2002 22,040.4 -10.9 11,182.3 9,987.5 -12.0 3,777.8 -12.0 6,250.1 -11.7 12,986.2 5,687.2 -14.1 1,151 -1.9 - - -4.9 2.7 -4.4
CY 2003 25,357.1 15.0 12,247.5 11,054.5 10.7 4,408.9 16.7 6,665.3 6.6 12,534.6 6,091.3 7.1 1,160 0.8 - - 1.3 0.3 0.8
CY 2004 26,432.7 4.2 12,534.0 11,544.2 4.4 4,984.7 13.1 6,583.6 -1.2 13,061.1 6,805.2 11.7 1,189 2.5 - - -0.8 3.0 5.8
CY 2005 27,583.4 4.4 13,354.4 12,364.9 7.1 5,416.6 8.7 6,975.5 6.0 13,896.6 6,911.1 1.6 1,236 4.0 - - -4.5 8.5 6.8
CY 2006 29,488.5 - 13,070.8 11,676.4 - 5,844.7 - 5,858.2 - 13,621.4 7,321.5 5.9 1,290 4.4 - - 1.5 7.8 2.7
CY 2007 29,715.0 0.8 12,501.1 11,179.2 -4.3 5,624.7 -3.8 5,598.6 -4.4 13,794.6 8,006.8 9.4 1,061 -17.8 - - -12.2 -18.7 -22.3
CY 2008 28,101.7 -5.4 12,320.6 10,596.5 -5.2 5,084.2 -9.6 5,575.4 -0.4 14,005.6 8,073.9 0.8 1,094 3.1 - - 1.2 5.2 1.8
CY 2009 19,084.4 -32.1 9,415.6 7,711.9 -27.2 2,930.5 -42.4 4,812.8 -13.7 10,040.6 5,660.2 -29.9 788 -27.9 - - -10.6 -30.8 -43.7
CY 2010 23,218.4 21.7 10,193.2 8,255.5 7.0 3,563.1 21.6 4,713.1 -2.1 10,246.6 5,690.4 0.5 813 3.1 - - 7.2 -7.3 19.6
CY 2011 24,787.4 6.8 10,928.9 8,896.1 7.8 3,933.7 10.4 4,986.6 5.8 10,657.7 6,021.4 5.8 834 2.6 - - 0.1 -4.1 16.2
CY 2012 23,733.7 -4.3 10,381.5 8,813.4 -0.9 3,659.2 -7.0 5,173.5 3.7 11,000.0 6,037.7 0.3 883 5.8 - - 2.0 11.4 5.2
CY 2013 25,604.1 7.9 10,973.7 9,323.2 5.8 3,685.8 0.7 5,676.4 9.7 13,207.6 7,426.9 23.0 980 11.0 - - 13.9 11.8 6.9
CY 2014 27,891.9 8.9 11,603.4 9,692.0 4.0 4,103.6 11.3 5,628.4 -0.8 13,928.6 6,796.2 -8.5 892 -9.0 - - -19.6 1.7 -10.0
CY 2015 28,606.6 2.6 12,420.6 10,089.1 4.1 4,369.8 6.5 5,748.3 2.1 14,124.0 8,071.6 18.8 909 1.9 - - -0.7 4.6 1.6
CY 2016 27,190.7 -4.9 12,640.8 10,260.0 1.7 4,301.0 -1.6 5,985.4 4.1 14,699.1 8,352.8 3.5 967 6.4 - - -73.2 10.5 3.9
2015. July-Sept. 6,992.9 -2.2 3,001.8 2,434.1 -8.0 1,057.7 -12.5 1,367.4 -6.4 3,370.5 1,982.5 12.5 236 6.2 915 -3.1 4.8 16.5 -5.4
2015. Oct.-Dec. 7,259.5 3.8 3,153.3 2,504.5 2.9 1,047.7 -0.9 1,460.1 6.8 3,280.3 1,811.7 5.1 232 -0.7 882 -3.6 0.2 1.3 -3.6
2016. Jan.-Mar. 6,833.4 -5.9 3,349.0 2,609.9 4.2 1,128.4 7.7 1,498.8 2.7 4,240.1 2,263.3 -3.8 216 5.5 944 7.1 1.7 6.0 9.3
2016. Apr.-June 6,468.5 -5.3 2,964.5 2,441.8 -6.4 1,032.1 -8.5 1,446.2 -3.5 3,385.4 2,101.1 9.2 247 4.9 991 5.0 2.1 11.0 -0.5
2016. July-Sept. 6,396.4 -1.1 3,039.5 2,577.1 5.5 1,052.0 1.9 1,535.3 6.2 3,620.4 1,999.5 0.9 253 7.1 980 -1.2 3.9 11.2 3.6
2016. Oct.-Dec. 7,253.0 13.4 3,370.2 2,585.9 0.3 1,080.0 2.7 1,520.2 -1.0 3,453.3 1,988.9 9.8 251 7.9 953 -2.8 4.6 13.0 3.8
2017. Jan.-Mar. 6,679.8 -7.9 2,884.1 2,550.7 -1.4 1,034.6 -4.2 1,520.6 0.0 4,331.7 2,308.5 2.0 223 3.2 975 2.3 -0.8 10.0 -2.0
2016. Feb. 2,231.7 8.7 1,196.1 850.2 -5.2 326.4 -24.0 526.4 9.6 990.6 603.3 -5.7 73 7.8 965 8.8 0.8 12.5 9.6
2016. Mar. 2,548.9 14.2 1,068.9 862.5 1.4 372.7 14.2 492.2 -6.5 2,341.4 1,199.1 13.1 76 8.4 982 1.8 4.3 1.1 26.0
2016. Apr. 2,250.7 -11.7 984.1 807.0 -6.4 336.6 -9.7 476.0 -3.3 983.8 582.7 -17.5 82 9.0 985 0.3 1.2 16.0 9.0
2016. May 2,053.7 -8.8 968.5 789.3 -2.2 336.7 0.0 480.8 1.0 1,102.2 768.2 57.3 79 9.8 1,001 1.6 4.3 15.0 7.9
2016. June 2,164.1 5.4 1,011.9 845.5 7.1 358.7 6.5 489.4 1.8 1,299.3 750.3 2.9 86 -2.5 988 -1.3 1.1 3.7 -15.2
2016. July 2,162.0 -0.1 1,025.2 893.2 5.6 362.1 0.9 521.2 6.5 906.1 629.5 4.0 85 8.9 996 0.8 6.0 11.1 9.1
2016. Aug. 2,123.6 -1.8 1,023.3 840.6 -5.9 350.8 -3.1 505.2 -3.1 1,044.4 569.0 5.4 82 2.5 961 -3.5 4.3 9.9 -12.7
2016. Sept. 2,110.8 -0.6 991.0 843.2 0.3 339.1 -3.3 508.9 0.7 1,669.9 800.9 -4.3 86 10.0 981 2.1 1.4 12.6 17.0
2016. Oct. 2,169.9 2.8 1,042.6 872.1 3.4 340.5 0.4 522.7 2.7 1,008.4 601.6 19.8 87 13.1 981 -0.1 4.9 22.0 9.3
2016. Nov. 2,599.0 19.8 1,126.6 847.8 -2.8 368.3 8.1 493.5 -5.6 944.5 571.3 7.4 85 6.7 954 -2.7 2.7 15.3 -1.8
2016. Dec. 2,484.0 -4.4 1,200.9 866.0 2.1 371.1 0.8 504.0 2.1 1,500.4 816.0 5.0 78 3.9 923 -3.2 6.5 2.2 4.6
2017. Jan. 2,236.9 -10.0 922.0 837.9 -3.2 330.9 -10.8 507.6 0.7 917.7 529.2 14.8 76 12.8 1,001 8.4 -0.2 12.0 27.3
2017. Feb. 2,207.5 -1.3 1,045.9 850.5 1.5 350.8 6.0 516.6 1.8 1,046.8 554.6 -8.1 71 -2.6 940 -6.1 1.6 6.8 -17.9
2017. Mar. 2,235.5 1.3 916.3 862.3 1.4 352.9 0.6 496.4 -3.9 2,367.2 1,224.7 2.1 76 0.2 984 4.7 -3.6 11.0 -10.8
(※) Orders Received for Machinery (280 Companies): Before March 1987, base was 178 Companies. In April 2005, the seasonal adjustments in the survey are made using the Census Bureau method (X-11 of X-12-ARIMA). Since 2006 ,"mobile phone" has been excluded. Orders Received for Construction (50 Companies): After April 1985, base was changed from 43 Companies to 50 Companies.
Orders Received for Construction( 50 Companies) (※) New Construction Starts of Dwellings
Total
DemandbyPrivateSector
Total NumberSeasonallyAdjustedAnnualRates
With inexceptShips・Electricity☆ ☆ ☆ ☆
Orders Received for Machinery (280 Companies) ● (※)
OwnHouse
RentedHouse
Condo-minium
byManufac-turingindustries
by Nonmanufacturingindustries(except Ships・Electricity)
PrivateNon-Residence
Billion Yen %
★ ★ ☆
Thousand of Units % ★ %
Released by Cabinet Office Ministry of Land, Infrastructure and Transport
Billion Yen % Billion Yen %Thousandof Units %
BillionYen % Billion Yen %
― 85 ―
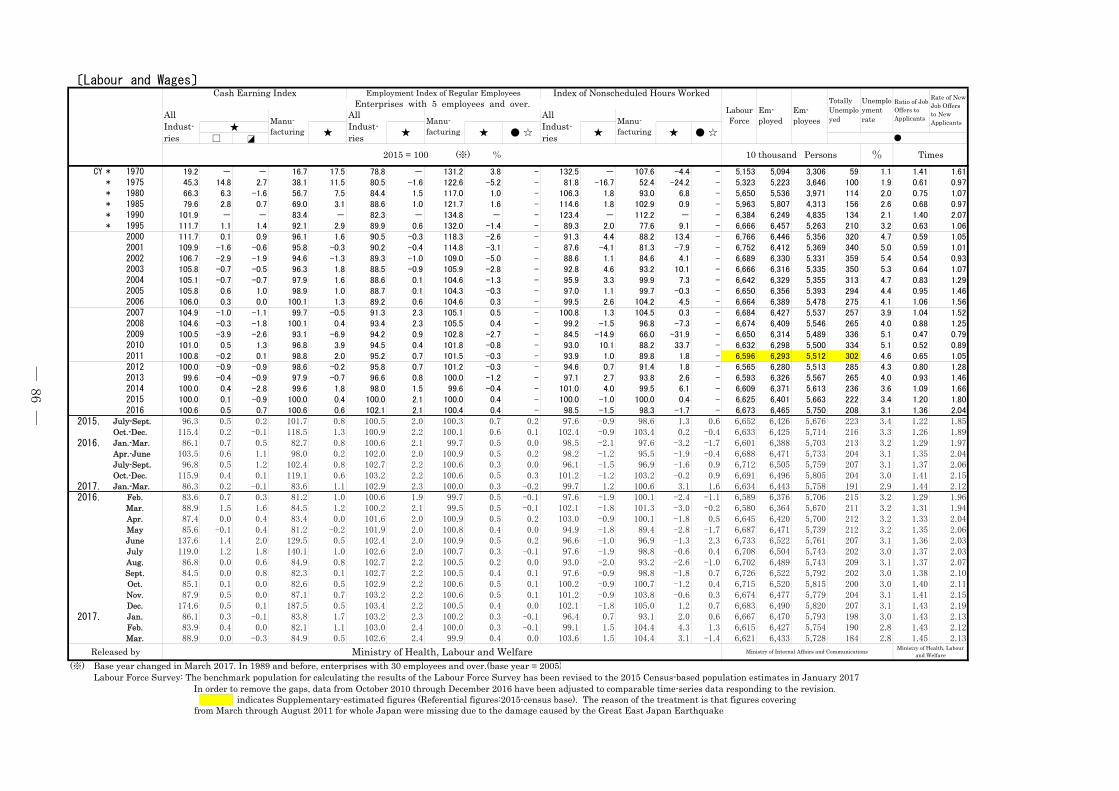
〔Labour and Wages〕
□
CY * 1970 19.2 - - 16.7 17.5 78.8 - 131.2 3.8 - 132.5 - 107.6 -4.4 - 5,153 5,094 3,306 59 1.1 1.41 1.61* 1975 45.3 14.8 2.7 38.1 11.5 80.5 -1.6 122.6 -5.2 - 81.8 -16.7 52.4 -24.2 - 5,323 5,223 3,646 100 1.9 0.61 0.97* 1980 66.3 6.3 -1.6 56.7 7.5 84.4 1.5 117.0 1.0 - 106.3 1.8 93.0 6.8 - 5,650 5,536 3,971 114 2.0 0.75 1.07* 1985 79.6 2.8 0.7 69.0 3.1 88.6 1.0 121.7 1.6 - 114.6 1.8 102.9 0.9 - 5,963 5,807 4,313 156 2.6 0.68 0.97* 1990 101.9 - - 83.4 - 82.3 - 134.8 - - 123.4 - 112.2 - - 6,384 6,249 4,835 134 2.1 1.40 2.07* 1995 111.7 1.1 1.4 92.1 2.9 89.9 0.6 132.0 -1.4 - 89.3 2.0 77.6 9.1 - 6,666 6,457 5,263 210 3.2 0.63 1.06
2000 111.7 0.1 0.9 96.1 1.6 90.5 -0.3 118.3 -2.6 - 91.3 4.4 88.2 13.4 - 6,766 6,446 5,356 320 4.7 0.59 1.052001 109.9 -1.6 -0.6 95.8 -0.3 90.2 -0.4 114.8 -3.1 - 87.6 -4.1 81.3 -7.9 - 6,752 6,412 5,369 340 5.0 0.59 1.012002 106.7 -2.9 -1.9 94.6 -1.3 89.3 -1.0 109.0 -5.0 - 88.6 1.1 84.6 4.1 - 6,689 6,330 5,331 359 5.4 0.54 0.932003 105.8 -0.7 -0.5 96.3 1.8 88.5 -0.9 105.9 -2.8 - 92.8 4.6 93.2 10.1 - 6,666 6,316 5,335 350 5.3 0.64 1.072004 105.1 -0.7 -0.7 97.9 1.6 88.6 0.1 104.6 -1.3 - 95.9 3.3 99.9 7.3 - 6,642 6,329 5,355 313 4.7 0.83 1.292005 105.8 0.6 1.0 98.9 1.0 88.7 0.1 104.3 -0.3 - 97.0 1.1 99.7 -0.3 - 6,650 6,356 5,393 294 4.4 0.95 1.462006 106.0 0.3 0.0 100.1 1.3 89.2 0.6 104.6 0.3 - 99.5 2.6 104.2 4.5 - 6,664 6,389 5,478 275 4.1 1.06 1.562007 104.9 -1.0 -1.1 99.7 -0.5 91.3 2.3 105.1 0.5 - 100.8 1.3 104.5 0.3 - 6,684 6,427 5,537 257 3.9 1.04 1.522008 104.6 -0.3 -1.8 100.1 0.4 93.4 2.3 105.5 0.4 - 99.2 -1.5 96.8 -7.3 - 6,674 6,409 5,546 265 4.0 0.88 1.252009 100.5 -3.9 -2.6 93.1 -6.9 94.2 0.9 102.8 -2.7 - 84.5 -14.9 66.0 -31.9 - 6,650 6,314 5,489 336 5.1 0.47 0.792010 101.0 0.5 1.3 96.8 3.9 94.5 0.4 101.8 -0.8 - 93.0 10.1 88.2 33.7 - 6,632 6,298 5,500 334 5.1 0.52 0.892011 100.8 -0.2 0.1 98.8 2.0 95.2 0.7 101.5 -0.3 - 93.9 1.0 89.8 1.8 - 6,596 6,293 5,512 302 4.6 0.65 1.052012 100.0 -0.9 -0.9 98.6 -0.2 95.8 0.7 101.2 -0.3 - 94.6 0.7 91.4 1.8 - 6,565 6,280 5,513 285 4.3 0.80 1.282013 99.6 -0.4 -0.9 97.9 -0.7 96.6 0.8 100.0 -1.2 - 97.1 2.7 93.8 2.6 - 6,593 6,326 5,567 265 4.0 0.93 1.462014 100.0 0.4 -2.8 99.6 1.8 98.0 1.5 99.6 -0.4 - 101.0 4.0 99.5 6.1 - 6,609 6,371 5,613 236 3.6 1.09 1.662015 100.0 0.1 -0.9 100.0 0.4 100.0 2.1 100.0 0.4 - 100.0 -1.0 100.0 0.4 - 6,625 6,401 5,663 222 3.4 1.20 1.802016 100.6 0.5 0.7 100.6 0.6 102.1 2.1 100.4 0.4 - 98.5 -1.5 98.3 -1.7 - 6,673 6,465 5,750 208 3.1 1.36 2.04
2015. July-Sept. 96.3 0.5 0.2 101.7 0.8 100.5 2.0 100.3 0.7 0.2 97.6 -0.9 98.6 1.3 0.6 6,652 6,426 5,676 223 3.4 1.22 1.85
2015. Oct.-Dec. 115.4 0.2 -0.1 118.5 1.3 100.9 2.2 100.1 0.6 0.1 102.4 -0.9 103.4 0.2 -0.4 6,633 6,425 5,714 216 3.3 1.26 1.89
2016. Jan.-Mar. 86.1 0.7 0.5 82.7 0.8 100.6 2.1 99.7 0.5 0.0 98.5 -2.1 97.6 -3.2 -1.7 6,601 6,388 5,703 213 3.2 1.29 1.97
2016. Apr.-June 103.5 0.6 1.1 98.0 0.2 102.0 2.0 100.9 0.5 0.2 98.2 -1.2 95.5 -1.9 -0.4 6,688 6,471 5,733 204 3.1 1.35 2.04
2016. July-Sept. 96.8 0.5 1.2 102.4 0.8 102.7 2.2 100.6 0.3 0.0 96.1 -1.5 96.9 -1.6 0.9 6,712 6,505 5,759 207 3.1 1.37 2.06
2016. Oct.-Dec. 115.9 0.4 0.1 119.1 0.6 103.2 2.2 100.6 0.5 0.3 101.2 -1.2 103.2 -0.2 0.9 6,691 6,496 5,805 204 3.0 1.41 2.15
2017. Jan.-Mar. 86.3 0.2 -0.1 83.6 1.1 102.9 2.3 100.0 0.3 -0.2 99.7 1.2 100.6 3.1 1.6 6,634 6,443 5,758 191 2.9 1.44 2.12
2016. Feb. 83.6 0.7 0.3 81.2 1.0 100.6 1.9 99.7 0.5 -0.1 97.6 -1.9 100.1 -2.4 -1.1 6,589 6,376 5,706 215 3.2 1.29 1.96
2016. Mar. 88.9 1.5 1.6 84.5 1.2 100.2 2.1 99.5 0.5 -0.1 102.1 -1.8 101.3 -3.0 -0.2 6,580 6,364 5,670 211 3.2 1.31 1.94
2016. Apr. 87.4 0.0 0.4 83.4 0.0 101.6 2.0 100.9 0.5 0.2 103.0 -0.9 100.1 -1.8 0.5 6,645 6,420 5,700 212 3.2 1.33 2.04
2016. May 85.6 -0.1 0.4 81.2 -0.2 101.9 2.0 100.8 0.4 0.0 94.9 -1.8 89.4 -2.8 -1.7 6,687 6,471 5,739 212 3.2 1.35 2.06
2016. June 137.6 1.4 2.0 129.5 0.5 102.4 2.0 100.9 0.5 0.2 96.6 -1.0 96.9 -1.3 2.3 6,733 6,522 5,761 207 3.1 1.36 2.03
2016. July 119.0 1.2 1.8 140.1 1.0 102.6 2.0 100.7 0.3 -0.1 97.6 -1.9 98.8 -0.6 0.4 6,708 6,504 5,743 202 3.0 1.37 2.03
2016. Aug. 86.8 0.0 0.6 84.9 0.8 102.7 2.2 100.5 0.2 0.0 93.0 -2.0 93.2 -2.6 -1.0 6,702 6,489 5,743 209 3.1 1.37 2.07
2016. Sept. 84.5 0.0 0.8 82.3 0.1 102.7 2.2 100.5 0.4 0.1 97.6 -0.9 98.8 -1.8 0.7 6,726 6,522 5,792 202 3.0 1.38 2.10
2016. Oct. 85.1 0.1 0.0 82.6 0.5 102.9 2.2 100.6 0.5 0.1 100.2 -0.9 100.7 -1.2 0.4 6,715 6,520 5,815 200 3.0 1.40 2.11
2016. Nov. 87.9 0.5 0.0 87.1 0.7 103.2 2.2 100.6 0.5 0.1 101.2 -0.9 103.8 -0.6 0.3 6,674 6,477 5,779 204 3.1 1.41 2.15
2016. Dec. 174.6 0.5 0.1 187.5 0.5 103.4 2.2 100.5 0.4 0.0 102.1 -1.8 105.0 1.2 0.7 6,683 6,490 5,820 207 3.1 1.43 2.19
2017. Jan. 86.1 0.3 -0.1 83.8 1.7 103.2 2.3 100.2 0.3 -0.1 96.4 0.7 93.1 2.0 0.6 6,667 6,470 5,793 198 3.0 1.43 2.13
2017. Feb. 83.9 0.4 0.0 82.1 1.1 103.0 2.4 100.0 0.3 -0.1 99.1 1.5 104.4 4.3 1.3 6,615 6,427 5,754 190 2.8 1.43 2.12
2017. Mar. 88.9 0.0 -0.3 84.9 0.5 102.6 2.4 99.9 0.4 0.0 103.6 1.5 104.4 3.1 -1.4 6,621 6,433 5,728 184 2.8 1.45 2.13
(※) Base year changed in March 2017. In 1989 and before, enterprises with 30 employees and over.(base year = 2005) Labour Force Survey: The benchmark population for calculating the results of the Labour Force Survey has been revised to the 2015 Census-based population estimates in January 2017.
In order to remove the gaps, data from October 2010 through December 2016 have been adjusted to comparable time-series data responding to the revision. indicates Supplementary-estimated figures (Referential figures:2015-census base). The reason of the treatment is that figures covering
from March through August 2011 for whole Japan were missing due to the damage caused by the Great East Japan Earthquake.
2015 = 100 (※) % 10 thousand Persons % Times
Released by Ministry of Health, Labour and Welfare Ministry of Internal Affairs and Communications Ministry of Health, Labourand Welfare
★ ● ☆ ★ ★ ● ☆●
TotallyUnemployed
Unemploymentrate
Ratio of JobOffers toApplicants
Rate of NewJob Offersto NewApplicants
Em-ployeesManu-
facturing★★ ★
Cash Earning Index Employment Index of Regular Employees Index of Nonscheduled Hours Worked
LabourForce
Em-ployed
Enterprises with 5 employees and over.AllIndust-ries
Manu-facturing
AllIndust-ries
Manu-facturing
AllIndust-ries
― 86 ―
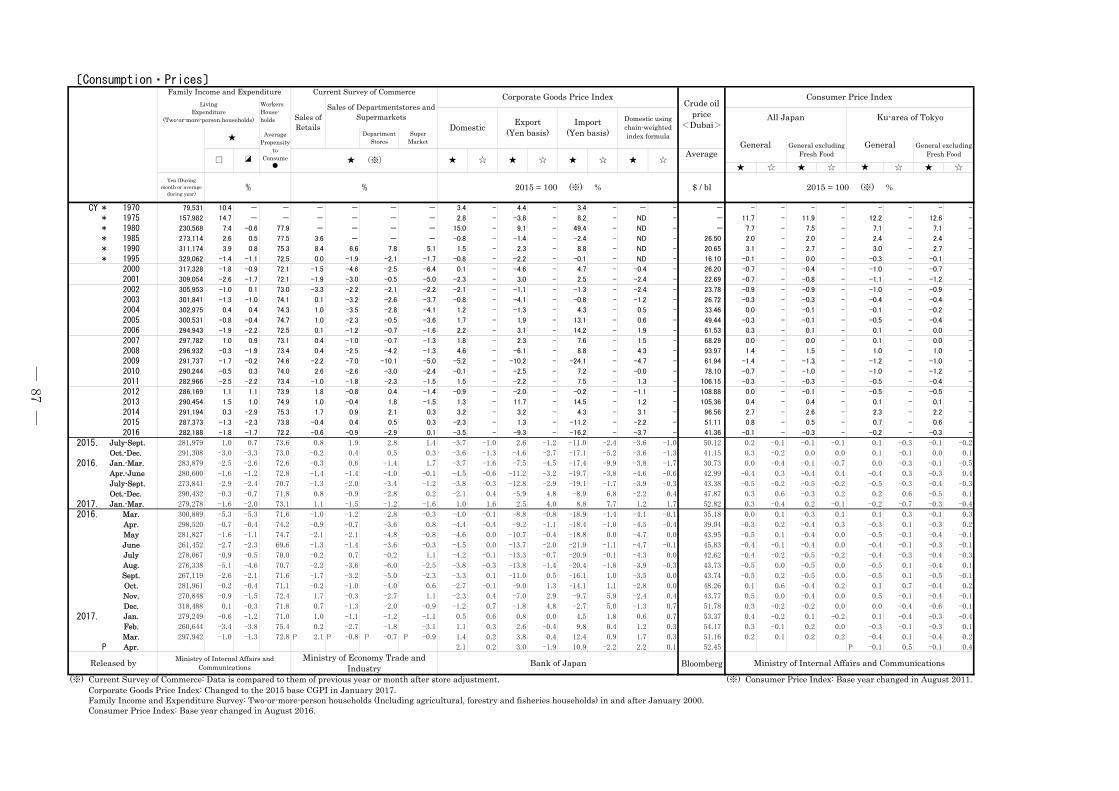
〔Consumption・Prices〕
★ ☆ ★ ☆ ☆ ★ ☆
CY * 1970 79,531 10.4 - - - - - - 3.4 - 4.4 - 3.4 - - - - - - - - - - - -
* 1975 157,982 14.7 - - - - - - 2.8 - -3.8 - 8.2 - ND - - 11.7 - 11.9 - 12.2 - 12.6 -
* 1980 230,568 7.4 -0.6 77.9 - - - - 15.0 - 9.1 - 49.4 - ND - - 7.7 - 7.5 - 7.1 - 7.1 -
* 1985 273,114 2.6 0.5 77.5 3.6 - - - -0.8 - -1.4 - -2.4 - ND - 26.50 2.0 - 2.0 - 2.4 - 2.4 -
* 1990 311,174 3.9 0.8 75.3 8.4 6.6 7.8 5.1 1.5 - 2.3 - 8.8 - ND - 20.65 3.1 - 2.7 - 3.0 - 2.7 -
* 1995 329,062 -1.4 -1.1 72.5 0.0 -1.9 -2.1 -1.7 -0.8 - -2.2 - -0.1 - ND - 16.10 -0.1 - 0.0 - -0.3 - -0.1 -
2000 317,328 -1.8 -0.9 72.1 -1.5 -4.6 -2.5 -6.4 0.1 - -4.6 - 4.7 - -0.4 - 26.20 -0.7 - -0.4 - -1.0 - -0.7 -
2001 309,054 -2.6 -1.7 72.1 -1.9 -3.0 -0.5 -5.0 -2.3 - 3.0 - 2.5 - -2.4 - 22.69 -0.7 - -0.8 - -1.1 - -1.2 -
2002 305,953 -1.0 0.1 73.0 -3.3 -2.2 -2.1 -2.2 -2.1 - -1.1 - -1.3 - -2.4 - 23.78 -0.9 - -0.9 - -1.0 - -0.9 -
2003 301,841 -1.3 -1.0 74.1 0.1 -3.2 -2.6 -3.7 -0.8 - -4.1 - -0.8 - -1.2 - 26.72 -0.3 - -0.3 - -0.4 - -0.4 -
2004 302,975 0.4 0.4 74.3 1.0 -3.5 -2.8 -4.1 1.2 - -1.3 - 4.3 - 0.5 - 33.46 0.0 - -0.1 - -0.1 - -0.2 -
2005 300,531 -0.8 -0.4 74.7 1.0 -2.3 -0.5 -3.6 1.7 - 1.9 - 13.1 - 0.6 - 49.44 -0.3 - -0.1 - -0.5 - -0.4 -
2006 294,943 -1.9 -2.2 72.5 0.1 -1.2 -0.7 -1.6 2.2 - 3.1 - 14.2 - 1.9 - 61.53 0.3 - 0.1 - 0.1 - 0.0 -
2007 297,782 1.0 0.9 73.1 0.4 -1.0 -0.7 -1.3 1.8 - 2.3 - 7.6 - 1.5 - 68.29 0.0 - 0.0 - 0.1 - 0.0 -
2008 296,932 -0.3 -1.9 73.4 0.4 -2.5 -4.2 -1.3 4.6 - -6.1 - 8.8 - 4.3 - 93.97 1.4 - 1.5 - 1.0 - 1.0 -
2009 291,737 -1.7 -0.2 74.6 -2.2 -7.0 -10.1 -5.0 -5.2 - -10.2 - -24.1 - -4.7 - 61.94 -1.4 - -1.3 - -1.2 - -1.0 -
2010 290,244 -0.5 0.3 74.0 2.6 -2.6 -3.0 -2.4 -0.1 - -2.5 - 7.2 - -0.0 - 78.10 -0.7 - -1.0 - -1.0 - -1.2 -
2011 282,966 -2.5 -2.2 73.4 -1.0 -1.8 -2.3 -1.5 1.5 - -2.2 - 7.5 - 1.3 - 106.15 -0.3 - -0.3 - -0.5 - -0.4 -
2012 286,169 1.1 1.1 73.9 1.8 -0.8 0.4 -1.4 -0.9 - -2.0 - -0.2 - -1.1 - 108.88 0.0 - -0.1 - -0.5 - -0.5 -
2013 290,454 1.5 1.0 74.9 1.0 -0.4 1.8 -1.5 1.3 - 11.7 - 14.5 - 1.2 - 105.36 0.4 - 0.4 - 0.1 - 0.1 -
2014 291,194 0.3 -2.9 75.3 1.7 0.9 2.1 0.3 3.2 - 3.2 - 4.3 - 3.1 - 96.56 2.7 - 2.6 - 2.3 - 2.2 -
2015 287,373 -1.3 -2.3 73.8 -0.4 0.4 0.5 0.3 -2.3 - 1.3 - -11.2 - -2.2 - 51.11 0.8 - 0.5 - 0.7 - 0.6 -
2016 282,188 -1.8 -1.7 72.2 -0.6 -0.9 -2.9 0.1 -3.5 - -9.3 - -16.2 - -3.7 - 41.36 -0.1 - -0.3 - -0.2 - -0.3 -
2015. July-Sept. 281,979 1.0 0.7 73.6 0.8 1.9 2.8 1.4 -3.7 -1.0 2.6 -1.2 -11.0 -2.4 -3.6 -1.0 50.12 0.2 -0.1 -0.1 -0.1 0.1 -0.3 -0.1 -0.2
2015. Oct.-Dec. 291,308 -3.0 -3.3 73.0 -0.2 0.4 0.5 0.3 -3.6 -1.3 -4.6 -2.7 -17.1 -5.2 -3.6 -1.3 41.15 0.3 -0.2 0.0 0.0 0.1 -0.1 0.0 0.1
2016. Jan.-Mar. 283,879 -2.5 -2.6 72.6 -0.3 0.6 -1.4 1.7 -3.7 -1.6 -7.5 -4.5 -17.4 -9.9 -3.8 -1.7 30.73 0.0 -0.4 -0.1 -0.7 0.0 -0.3 -0.1 -0.5
2016. Apr.-June 280,600 -1.6 -1.2 72.8 -1.4 -1.4 -4.0 -0.1 -4.5 -0.6 -11.2 -3.2 -19.7 -3.8 -4.6 -0.6 42.99 -0.4 0.3 -0.4 0.4 -0.4 0.3 -0.3 0.4
2016. July-Sept. 273,841 -2.9 -2.4 70.7 -1.3 -2.0 -3.4 -1.2 -3.8 -0.3 -12.8 -2.9 -19.1 -1.7 -3.9 -0.3 43.38 -0.5 -0.2 -0.5 -0.2 -0.5 -0.3 -0.4 -0.3
2016. Oct.-Dec. 290,432 -0.3 -0.7 71.8 0.8 -0.9 -2.8 0.2 -2.1 0.4 -5.9 4.8 -8.9 6.8 -2.2 0.4 47.87 0.3 0.6 -0.3 0.2 0.2 0.6 -0.5 0.1
2017. Jan.-Mar. 279,278 -1.6 -2.0 73.1 1.1 -1.5 -1.2 -1.6 1.0 1.6 2.5 4.0 8.8 7.7 1.2 1.7 52.82 0.3 -0.4 0.2 -0.1 -0.2 -0.7 -0.3 -0.4
2016. Mar. 300,889 -5.3 -5.3 71.6 -1.0 -1.2 -2.8 -0.3 -4.0 -0.1 -8.8 -0.8 -18.9 -1.4 -4.1 -0.1 35.18 0.0 0.1 -0.3 0.1 0.1 0.3 -0.1 0.3
2016. Apr. 298,520 -0.7 -0.4 74.2 -0.9 -0.7 -3.6 0.8 -4.4 -0.4 -9.2 -1.1 -18.4 -1.0 -4.5 -0.4 39.04 -0.3 0.2 -0.4 0.3 -0.3 0.1 -0.3 0.2
2016. May 281,827 -1.6 -1.1 74.7 -2.1 -2.1 -4.8 -0.8 -4.6 0.0 -10.7 -0.4 -18.8 0.0 -4.7 0.0 43.95 -0.5 0.1 -0.4 0.0 -0.5 -0.1 -0.4 -0.1
2016. June 261,452 -2.7 -2.3 69.6 -1.3 -1.4 -3.6 -0.3 -4.5 0.0 -13.7 -2.0 -21.9 -1.1 -4.7 -0.1 45.83 -0.4 -0.1 -0.4 0.0 -0.4 -0.1 -0.3 -0.1
2016. July 278,067 -0.9 -0.5 70.0 -0.2 0.7 -0.2 1.1 -4.2 -0.1 -13.3 -0.7 -20.9 -0.1 -4.3 0.0 42.62 -0.4 -0.2 -0.5 -0.2 -0.4 -0.3 -0.4 -0.3
2016. Aug. 276,338 -5.1 -4.6 70.7 -2.2 -3.6 -6.0 -2.5 -3.8 -0.3 -13.8 -1.4 -20.4 -1.8 -3.9 -0.3 43.73 -0.5 0.0 -0.5 0.0 -0.5 0.1 -0.4 0.1
2016. Sept. 267,119 -2.6 -2.1 71.6 -1.7 -3.2 -5.0 -2.3 -3.3 0.1 -11.0 0.5 -16.1 1.0 -3.5 0.0 43.74 -0.5 0.2 -0.5 0.0 -0.5 0.1 -0.5 -0.1
2016. Oct. 281,961 -0.2 -0.4 71.1 -0.2 -1.0 -4.0 0.6 -2.7 -0.1 -9.0 1.3 -14.1 1.1 -2.8 0.0 48.26 0.1 0.6 -0.4 0.2 0.1 0.7 -0.4 0.2
2016. Nov. 270,848 -0.9 -1.5 72.4 1.7 -0.3 -2.7 1.1 -2.3 0.4 -7.0 2.9 -9.7 5.9 -2.4 0.4 43.77 0.5 0.0 -0.4 0.0 0.5 -0.1 -0.4 -0.1
2016. Dec. 318,488 0.1 -0.3 71.8 0.7 -1.3 -2.0 -0.9 -1.2 0.7 -1.8 4.8 -2.7 5.0 -1.3 0.7 51.78 0.3 -0.2 -0.2 0.0 0.0 -0.4 -0.6 -0.1
2017. Jan. 279,249 -0.6 -1.2 71.0 1.0 -1.1 -1.2 -1.1 0.5 0.6 0.8 0.0 4.5 1.8 0.6 0.7 53.37 0.4 -0.2 0.1 -0.2 0.1 -0.4 -0.3 -0.4
2017. Feb. 260,644 -3.4 -3.8 75.4 0.2 -2.7 -1.8 -3.1 1.1 0.3 2.6 -0.4 9.8 0.4 1.2 0.3 54.17 0.3 -0.1 0.2 0.0 -0.3 -0.1 -0.3 0.1
2017. Mar. 297,942 -1.0 -1.3 72.8 P 2.1 P -0.8 P -0.7 P -0.9 1.4 0.2 3.8 0.4 12.4 0.9 1.7 0.3 51.16 0.2 0.1 0.2 0.2 -0.4 0.1 -0.4 0.2
2017.P Apr. 2.1 0.2 3.0 -1.9 10.9 -2.2 2.2 0.1 52.45 P -0.1 0.5 -0.1 0.4
Bloomberg
(※) Current Survey of Commerce: Data is compared to them of previous year or month after store adjustment. (※) Consumer Price Index: Base year changed in August 2011. Corporate Goods Price Index: Changed to the 2015 base CGPI in January 2017. Family Income and Expenditure Survey: Two-or-more-person households (Including agricultural, forestry and fisheries households) in and after January 2000. Consumer Price Index: Base year changed in August 2016.
Released by Ministry of Internal Affairs andCommunications
Ministry of Economy Trade andIndustry Bank of Japan Ministry of Internal Affairs and Communications
Yen (Duringmonth or average
during year)% % 2015 = 100 (※) % $ / bl 2015 = 100 (※) %
★ ☆ ★ ☆Average
★
GeneralGeneral excludingFresh Food
General excludingFresh Food
General□ ★ (※) ★ ☆ ★ ☆
Export(Yen basis)
Import(Yen basis)
Domestic usingchain-weightedindex formula
Family Income and Expenditure Current Survey of Commerce Corporate Goods Price IndexCrude oil
price<Dubai>
Consumer Price IndexLiving
Expenditure(Two-or-more-person households)
WorkersHouse-holds Sales of
Retails
Sales of Departmentstores andSupermarkets
DomesticAll Japan Ku-area of Tokyo
★ AveragePropensity
toConsume
●
DepartmentStores
SuperMarket
― 87 ―
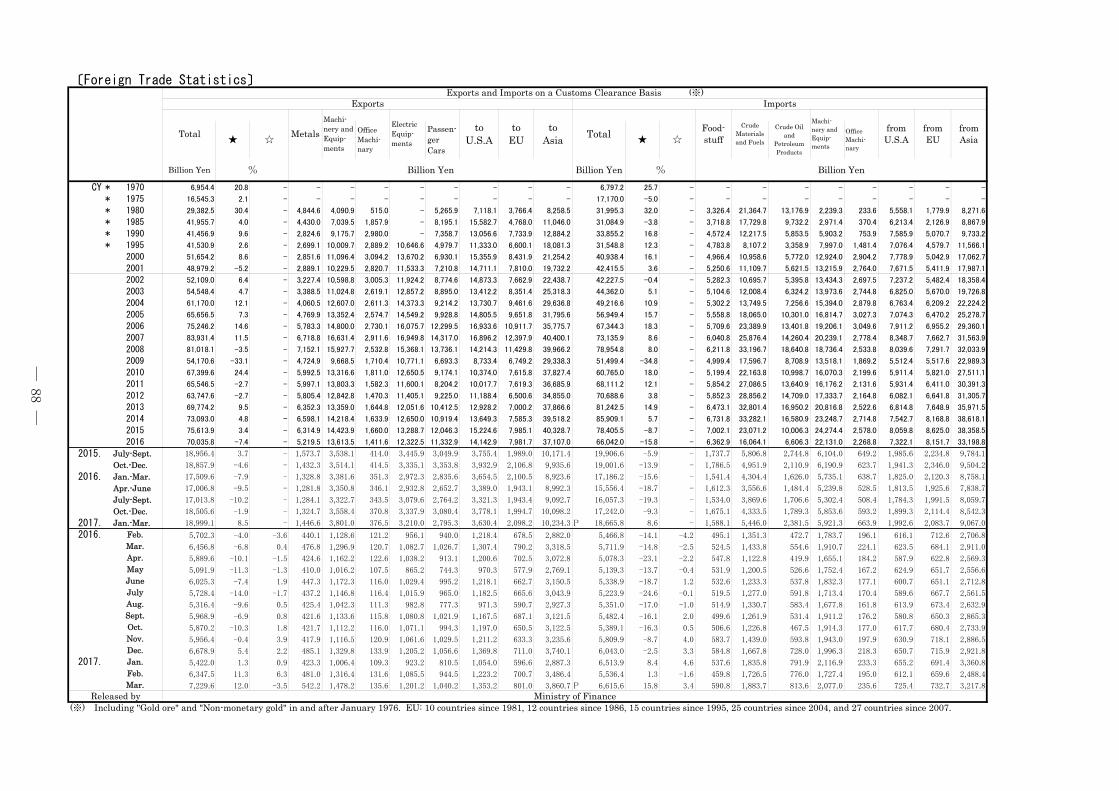
〔Foreign Trade Statistics〕
CY * 1970 6,954.4 20.8 - - - - - - - - - 6,797.2 25.7 - - - - - - - - -
* 1975 16,545.3 2.1 - - - - - - - - - 17,170.0 -5.0 - - - - - - - - -
* 1980 29,382.5 30.4 - 4,844.6 4,090.9 515.0 - 5,265.9 7,118.1 3,766.4 8,258.5 31,995.3 32.0 - 3,326.4 21,364.7 13,176.9 2,239.3 233.6 5,558.1 1,779.9 8,271.6
* 1985 41,955.7 4.0 - 4,430.0 7,039.5 1,857.9 - 8,195.1 15,582.7 4,768.0 11,046.0 31,084.9 -3.8 - 3,718.8 17,729.8 9,732.2 2,971.4 370.4 6,213.4 2,126.9 8,867.9
* 1990 41,456.9 9.6 - 2,824.6 9,175.7 2,980.0 - 7,358.7 13,056.6 7,733.9 12,884.2 33,855.2 16.8 - 4,572.4 12,217.5 5,853.5 5,903.2 753.9 7,585.9 5,070.7 9,733.2
* 1995 41,530.9 2.6 - 2,699.1 10,009.7 2,889.2 10,646.6 4,979.7 11,333.0 6,600.1 18,081.3 31,548.8 12.3 - 4,783.8 8,107.2 3,358.9 7,997.0 1,481.4 7,076.4 4,579.7 11,566.1
2000 51,654.2 8.6 - 2,851.6 11,096.4 3,094.2 13,670.2 6,930.1 15,355.9 8,431.9 21,254.2 40,938.4 16.1 - 4,966.4 10,958.6 5,772.0 12,924.0 2,904.2 7,778.9 5,042.9 17,062.7
2001 48,979.2 -5.2 - 2,889.1 10,229.5 2,820.7 11,533.3 7,210.8 14,711.1 7,810.0 19,732.2 42,415.5 3.6 - 5,250.6 11,109.7 5,621.5 13,215.9 2,764.0 7,671.5 5,411.9 17,987.1
2002 52,109.0 6.4 - 3,227.4 10,598.8 3,005.3 11,924.2 8,774.6 14,873.3 7,662.9 22,438.7 42,227.5 -0.4 - 5,282.3 10,695.7 5,395.8 13,434.3 2,697.5 7,237.2 5,482.4 18,358.4
2003 54,548.4 4.7 - 3,388.5 11,024.8 2,619.1 12,857.2 8,895.0 13,412.2 8,351.4 25,318.3 44,362.0 5.1 - 5,104.6 12,008.4 6,324.2 13,973.6 2,744.8 6,825.0 5,670.0 19,726.8
2004 61,170.0 12.1 - 4,060.5 12,607.0 2,611.3 14,373.3 9,214.2 13,730.7 9,461.6 29,636.8 49,216.6 10.9 - 5,302.2 13,749.5 7,256.6 15,394.0 2,879.8 6,763.4 6,209.2 22,224.2
2005 65,656.5 7.3 - 4,769.9 13,352.4 2,574.7 14,549.2 9,928.8 14,805.5 9,651.8 31,795.6 56,949.4 15.7 - 5,558.8 18,065.0 10,301.0 16,814.7 3,027.3 7,074.3 6,470.2 25,278.7
2006 75,246.2 14.6 - 5,783.3 14,800.0 2,730.1 16,075.7 12,299.5 16,933.6 10,911.7 35,775.7 67,344.3 18.3 - 5,709.6 23,389.9 13,401.8 19,206.1 3,049.6 7,911.2 6,955.2 29,360.1
2007 83,931.4 11.5 - 6,718.8 16,631.4 2,911.6 16,949.8 14,317.0 16,896.2 12,397.9 40,400.1 73,135.9 8.6 - 6,040.8 25,876.4 14,260.4 20,239.1 2,778.4 8,348.7 7,662.7 31,563.9
2008 81,018.1 -3.5 - 7,152.1 15,927.7 2,532.8 15,368.1 13,736.1 14,214.3 11,429.8 39,966.2 78,954.8 8.0 - 6,211.8 33,196.7 18,640.8 18,736.4 2,533.8 8,039.6 7,291.7 32,033.9
2009 54,170.6 -33.1 - 4,724.9 9,668.5 1,710.4 10,771.1 6,693.3 8,733.4 6,749.2 29,338.3 51,499.4 -34.8 - 4,999.4 17,596.7 8,708.9 13,518.1 1,869.2 5,512.4 5,517.6 22,989.3
2010 67,399.6 24.4 - 5,992.5 13,316.6 1,811.0 12,650.5 9,174.1 10,374.0 7,615.8 37,827.4 60,765.0 18.0 - 5,199.4 22,163.8 10,998.7 16,070.3 2,199.6 5,911.4 5,821.0 27,511.1
2011 65,546.5 -2.7 - 5,997.1 13,803.3 1,582.3 11,600.1 8,204.2 10,017.7 7,619.3 36,685.9 68,111.2 12.1 - 5,854.2 27,086.5 13,640.9 16,176.2 2,131.6 5,931.4 6,411.0 30,391.3
2012 63,747.6 -2.7 - 5,805.4 12,842.8 1,470.3 11,405.1 9,225.0 11,188.4 6,500.6 34,855.0 70,688.6 3.8 - 5,852.3 28,856.2 14,709.0 17,333.7 2,164.8 6,082.1 6,641.8 31,305.7
2013 69,774.2 9.5 - 6,352.3 13,359.0 1,644.8 12,051.6 10,412.5 12,928.2 7,000.2 37,866.6 81,242.5 14.9 - 6,473.1 32,801.4 16,950.2 20,816.8 2,522.6 6,814.8 7,648.9 35,971.5
2014 73,093.0 4.8 - 6,598.1 14,218.4 1,633.9 12,650.0 10,919.4 13,649.3 7,585.3 39,518.2 85,909.1 5.7 - 6,731.8 33,282.1 16,580.9 23,248.7 2,714.8 7,542.7 8,168.8 38,618.1
2015 75,613.9 3.4 - 6,314.9 14,423.9 1,660.0 13,288.7 12,046.3 15,224.6 7,985.1 40,328.7 78,405.5 -8.7 - 7,002.1 23,071.2 10,006.3 24,274.4 2,578.0 8,059.8 8,625.0 38,358.5
2016 70,035.8 -7.4 - 5,219.5 13,613.5 1,411.6 12,322.5 11,332.9 14,142.9 7,981.7 37,107.0 66,042.0 -15.8 - 6,362.9 16,064.1 6,606.3 22,131.0 2,268.8 7,322.1 8,151.7 33,198.8
2015. July-Sept. 18,956.4 3.7 - 1,573.7 3,538.1 414.0 3,445.9 3,049.9 3,755.4 1,989.0 10,171.4 19,906.6 -5.9 - 1,737.7 5,806.8 2,744.8 6,104.0 649.2 1,985.6 2,234.8 9,784.1
2015. Oct.-Dec. 18,857.9 -4.6 - 1,432.3 3,514.1 414.5 3,335.1 3,353.8 3,932.9 2,106.8 9,935.6 19,001.6 -13.9 - 1,786.5 4,951.9 2,110.9 6,190.9 623.7 1,941.3 2,346.0 9,504.2
2016. Jan.-Mar. 17,509.6 -7.9 - 1,328.8 3,381.6 351.3 2,972.3 2,835.6 3,654.5 2,100.5 8,923.6 17,186.2 -15.6 - 1,541.4 4,304.4 1,626.0 5,735.1 638.7 1,825.0 2,120.3 8,758.1
2016. Apr.-June 17,006.8 -9.5 - 1,281.8 3,350.8 346.1 2,932.8 2,652.7 3,389.0 1,943.1 8,992.3 15,556.4 -18.7 - 1,612.3 3,556.6 1,484.4 5,239.8 528.5 1,813.5 1,925.6 7,838.7
2016. July-Sept. 17,013.8 -10.2 - 1,284.1 3,322.7 343.5 3,079.6 2,764.2 3,321.3 1,943.4 9,092.7 16,057.3 -19.3 - 1,534.0 3,869.6 1,706.6 5,302.4 508.4 1,784.3 1,991.5 8,059.7
2016. Oct.-Dec. 18,505.6 -1.9 - 1,324.7 3,558.4 370.8 3,337.9 3,080.4 3,778.1 1,994.7 10,098.2 17,242.0 -9.3 - 1,675.1 4,333.5 1,789.3 5,853.6 593.2 1,899.3 2,114.4 8,542.3
2017. Jan.-Mar. 18,999.1 8.5 - 1,446.6 3,801.0 376.5 3,210.0 2,795.3 3,630.4 2,098.2 10,234.3 P 18,665.8 8.6 - 1,588.1 5,446.0 2,381.5 5,921.3 663.9 1,992.6 2,083.7 9,067.0
2016. Feb. 5,702.3 -4.0 -3.6 440.1 1,128.6 121.2 956.1 940.0 1,218.4 678.5 2,882.0 5,466.8 -14.1 -4.2 495.1 1,351.3 472.7 1,783.7 196.1 616.1 712.6 2,706.8
2016. Mar. 6,456.8 -6.8 0.4 476.8 1,296.9 120.7 1,082.7 1,026.7 1,307.4 790.2 3,318.5 5,711.9 -14.8 -2.5 524.5 1,433.8 554.6 1,910.7 224.1 623.5 684.1 2,911.0
2016. Apr. 5,889.6 -10.1 -1.5 424.6 1,162.2 122.6 1,038.2 913.1 1,200.6 702.5 3,072.8 5,078.3 -23.1 -2.2 547.8 1,122.8 419.9 1,655.1 184.2 587.9 622.8 2,569.3
2016. May 5,091.9 -11.3 -1.3 410.0 1,016.2 107.5 865.2 744.3 970.3 577.9 2,769.1 5,139.3 -13.7 -0.4 531.9 1,200.5 526.6 1,752.4 167.2 624.9 651.7 2,556.6
2016. June 6,025.3 -7.4 1.9 447.3 1,172.3 116.0 1,029.4 995.2 1,218.1 662.7 3,150.5 5,338.9 -18.7 1.2 532.6 1,233.3 537.8 1,832.3 177.1 600.7 651.1 2,712.8
2016. July 5,728.4 -14.0 -1.7 437.2 1,146.8 116.4 1,015.9 965.0 1,182.5 665.6 3,043.9 5,223.9 -24.6 -0.1 519.5 1,277.0 591.8 1,713.4 170.4 589.6 667.7 2,561.5
2016. Aug. 5,316.4 -9.6 0.5 425.4 1,042.3 111.3 982.8 777.3 971.3 590.7 2,927.3 5,351.0 -17.0 -1.0 514.9 1,330.7 583.4 1,677.8 161.8 613.9 673.4 2,632.9
2016. Sept. 5,968.9 -6.9 0.8 421.6 1,133.6 115.8 1,080.8 1,021.9 1,167.5 687.1 3,121.5 5,482.4 -16.1 2.0 499.6 1,261.9 531.4 1,911.2 176.2 580.8 650.3 2,865.3
2016. Oct. 5,870.2 -10.3 1.8 421.7 1,112.2 116.0 1,071.1 994.3 1,197.0 650.5 3,122.5 5,389.1 -16.3 0.5 506.6 1,226.8 467.5 1,914.3 177.0 617.7 680.4 2,733.9
2016. Nov. 5,956.4 -0.4 3.9 417.9 1,116.5 120.9 1,061.6 1,029.5 1,211.2 633.3 3,235.6 5,809.9 -8.7 4.0 583.7 1,439.0 593.8 1,943.0 197.9 630.9 718.1 2,886.5
2016. Dec. 6,678.9 5.4 2.2 485.1 1,329.8 133.9 1,205.2 1,056.6 1,369.8 711.0 3,740.1 6,043.0 -2.5 3.3 584.8 1,667.8 728.0 1,996.3 218.3 650.7 715.9 2,921.8
2017. Jan. 5,422.0 1.3 0.9 423.3 1,006.4 109.3 923.2 810.5 1,054.0 596.6 2,887.3 6,513.9 8.4 4.6 537.6 1,835.8 791.9 2,116.9 233.3 655.2 691.4 3,360.8
2017. Feb. 6,347.5 11.3 6.3 481.0 1,316.4 131.6 1,085.5 944.5 1,223.2 700.7 3,486.4 5,536.4 1.3 -1.6 459.8 1,726.5 776.0 1,727.4 195.0 612.1 659.6 2,488.4
2017. Mar. 7,229.6 12.0 -3.5 542.2 1,478.2 135.6 1,201.2 1,040.2 1,353.2 801.0 3,860.7 P 6,615.6 15.8 3.4 590.8 1,883.7 813.6 2,077.0 235.6 725.4 732.7 3,217.8
(※) Including "Gold ore" and "Non-monetary gold" in and after January 1976. EU: 10 countries since 1981, 12 countries since 1986, 15 countries since 1995, 25 countries since 2004, and 27 countries since 2007.
Machi-nery andEquip-ments
ElectricEquip-ments
CrudeMaterialsand Fuels
fromEU
fromAsia☆
Crude Oiland
PetroleumProducts
OfficeMachi-nary
Food-stuff
Machi-nery andEquip-ments
fromU.S.A
OfficeMachi-nary
Passen-gerCars
★to
Asia TotaltoU.S.A
toEUTotal Metals
Released by Ministry of Finance
Billion Yen % Billion Yen Billion Yen % Billion Yen
Exports and Imports on a Customs Clearance Basis (※)Exports Imports
★ ☆
― 88 ―
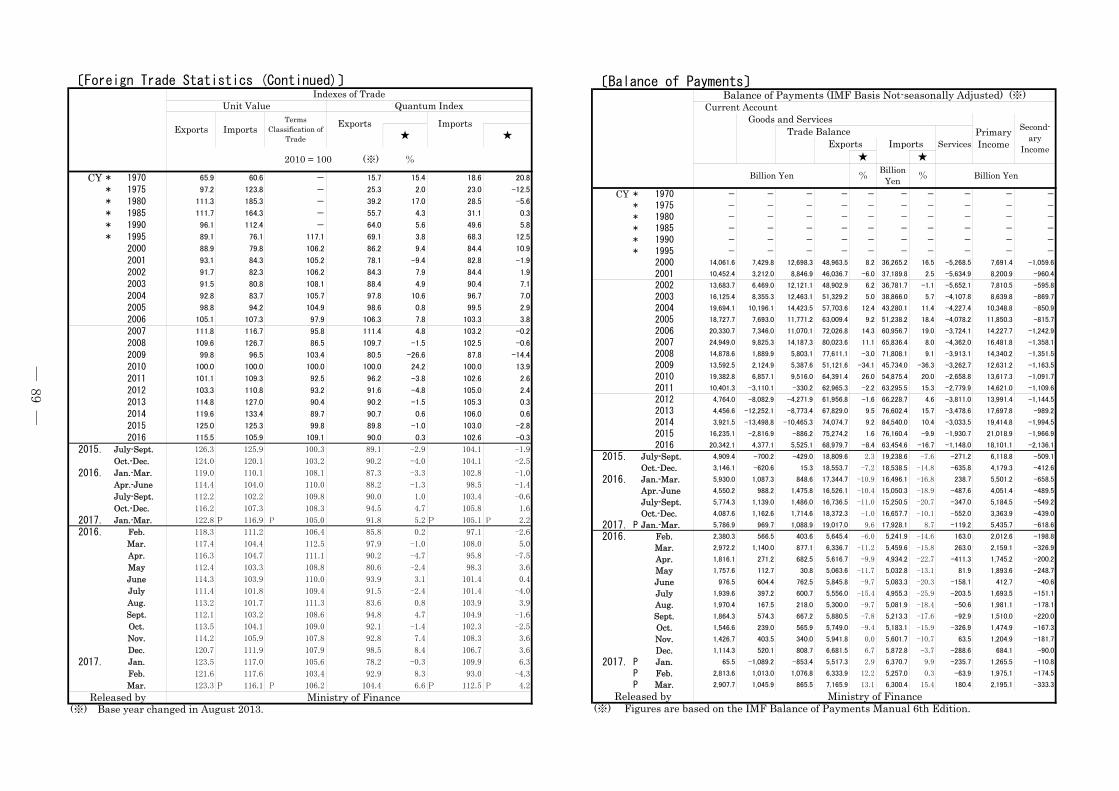
〔Foreign Trade Statistics (Continued)〕
CY * 1970 65.9 60.6 - 15.7 15.4 18.6 20.8
* 1975 97.2 123.8 - 25.3 2.0 23.0 -12.5
* 1980 111.3 185.3 - 39.2 17.0 28.5 -5.6
* 1985 111.7 164.3 - 55.7 4.3 31.1 0.3
* 1990 96.1 112.4 - 64.0 5.6 49.6 5.8
* 1995 89.1 76.1 117.1 69.1 3.8 68.3 12.5
2000 88.9 79.8 106.2 86.2 9.4 84.4 10.9
2001 93.1 84.3 105.2 78.1 -9.4 82.8 -1.9
2002 91.7 82.3 106.2 84.3 7.9 84.4 1.9
2003 91.5 80.8 108.1 88.4 4.9 90.4 7.1
2004 92.8 83.7 105.7 97.8 10.6 96.7 7.0
2005 98.8 94.2 104.9 98.6 0.8 99.5 2.9
2006 105.1 107.3 97.9 106.3 7.8 103.3 3.8
2007 111.8 116.7 95.8 111.4 4.8 103.2 -0.2
2008 109.6 126.7 86.5 109.7 -1.5 102.5 -0.6
2009 99.8 96.5 103.4 80.5 -26.6 87.8 -14.4
2010 100.0 100.0 100.0 100.0 24.2 100.0 13.9
2011 101.1 109.3 92.5 96.2 -3.8 102.6 2.6
2012 103.3 110.8 93.2 91.6 -4.8 105.0 2.4
2013 114.8 127.0 90.4 90.2 -1.5 105.3 0.3
2014 119.6 133.4 89.7 90.7 0.6 106.0 0.6
2015 125.0 125.3 99.8 89.8 -1.0 103.0 -2.8
2016 115.5 105.9 109.1 90.0 0.3 102.6 -0.3
2015. July-Sept. 126.3 125.9 100.3 89.1 -2.9 104.1 -1.9
2015. Oct.-Dec. 124.0 120.1 103.2 90.2 -4.0 104.1 -2.5
2016. Jan.-Mar. 119.0 110.1 108.1 87.3 -3.3 102.8 -1.0
2016. Apr.-June 114.4 104.0 110.0 88.2 -1.3 98.5 -1.4
2016. July-Sept. 112.2 102.2 109.8 90.0 1.0 103.4 -0.6
2016. Oct.-Dec. 116.2 107.3 108.3 94.5 4.7 105.8 1.6
2017. Jan.-Mar. 122.8 P 116.9 P 105.0 91.8 5.2 P 105.1 P 2.2
2016. Feb. 118.3 111.2 106.4 85.8 0.2 97.1 -2.6
2016. Mar. 117.4 104.4 112.5 97.9 -1.0 108.0 5.0
2016. Apr. 116.3 104.7 111.1 90.2 -4.7 95.8 -7.5
2016. May 112.4 103.3 108.8 80.6 -2.4 98.3 3.6
2016. June 114.3 103.9 110.0 93.9 3.1 101.4 0.4
2016. July 111.4 101.8 109.4 91.5 -2.4 101.4 -4.0
2016. Aug. 113.2 101.7 111.3 83.6 0.8 103.9 3.9
2016. Sept. 112.1 103.2 108.6 94.8 4.7 104.9 -1.6
2016. Oct. 113.5 104.1 109.0 92.1 -1.4 102.3 -2.5
2016. Nov. 114.2 105.9 107.8 92.8 7.4 108.3 3.6
2016. Dec. 120.7 111.9 107.9 98.5 8.4 106.7 3.6
2017. Jan. 123.5 117.0 105.6 78.2 -0.3 109.9 6.3
2017. Feb. 121.6 117.6 103.4 92.9 8.3 93.0 -4.3
2017. Mar. 123.3 P 116.1 P 106.2 104.4 6.6 P 112.5 P 4.2
(※) Base year changed in August 2013.
2010 = 100 (※) %
Released by Ministry of Finance
Indexes of TradeUnit Value Quantum Index
Exports ImportsTerms
Classification ofTrade
Exports Imports★ ★
〔Balance of Payments〕
★ ★
CY * 1970 - - - - - - - - - -
- - - -- - - - - -
- - - -- -- - - -
- - - -- -- - - -
- - - - - - - - - -
* 1975* 1980* 1985* 1990* 1995 - - - - - - - - - -
2000 14,061.6 7,429.8 12,698.3 48,963.5 8.2 36,265.2 16.5 7,691.4
2001 10,452.4 3,212.0 8,846.9 46,036.7 -6.0 37,189.8 2.5
-5,268.5
-5,634.9 8,200.9
-1,059.6
-960.4
2002 13,683.7 6,469.0 12,121.1 48,902.9 6.2 36,781.7 7,810.5
2003 16,125.4 8,355.3 12,463.1 51,329.2 5.0 38,866.0 8,639.8
2004 19,694.1 10,196.1 14,423.5 57,703.6 12.4 43,280.1 10,348.8
2005 18,727.7 7,693.0 11,771.2 63,009.4 9.2 51,238.2 11,850.3
-595.8
-869.7
-850.9
-815.7
2006 20,330.7 7,346.0 11,070.1 72,026.8 14.3 60,956.7
-1.1
5.7
11.4
18.4
19.0
-5,652.1
-4,107.8
-4,227.4
-4,078.2
-3,724.1 14,227.7 -1,242.9
2007 24,949.0 9,825.3 14,187.3 80,023.6 11.1 65,836.4 8.0 16,481.8
2008 14,878.6 1,889.9 5,803.1 77,611.1 -3.0 71,808.1 9.1 14,340.2
2009 13,592.5 2,124.9 5,387.6 51,121.6 45,734.0 12,631.2
2010 19,382.8 6,857.1 9,516.0 64,391.4 54,875.4 13,617.3
2011 10,401.3 -3,110.1 -330.2 62,965.3
-34.1
26.0
-2.2 63,295.5
-36.3
20.0
15.3
-4,362.0
-3,913.1
-3,262.7
-2,658.8
-2,779.9 14,621.0
-1,358.1
-1,351.5
-1,163.5
-1,091.7
-1,109.6
2012 4,764.0 -8,082.9 61,956.8 66,228.7 4.6 13,991.4
2013 4,456.6
-4,271.9
-8,773.4 67,829.0 76,602.4 15.7 17,697.8
2014 3,921.5 74,074.7 84,540.0 10.4 19,414.8
2015 16,235.1
-10,465.3
-886.2 75,274.2 76,160.4 -9.9 21,018.9
2016 20,342.1
-12,252.1
-13,498.8
-2,816.9
4,377.1 5,525.1 68,979.7
-1.6
9.5
9.2
1.6
-8.4 63,454.6 -16.7
-3,811.0
-3,478.6
-3,033.5
-1,930.7
-1,148.0 18,101.1
-1,144.5
-989.2
-1,994.5
-1,966.9
-2,136.1
2015. July-Sept. 4,909.4 18,809.6 2.3 19,238.6 -7.6 6,118.8
2015. Oct.-Dec. 3,146.1
-700.2
-620.6 18,553.7 -7.2 18,538.5 4,179.3
2016. Jan.-Mar. 5,930.0 1,087.3 17,344.7 16,496.1 5,501.2
2016. Apr.-June 4,550.2 988.2 16,526.1 15,050.3 4,051.4
2016. July-Sept. 5,774.3 1,139.0 16,736.5 15,250.5 5,184.5
2016. Oct.-Dec. 4,087.6 1,162.6 18,372.3 16,657.7 3,363.9
2017.P Jan.-Mar. 5,786.9 969.7
-429.0
15.3
848.6
1,475.8
1,486.0
1,714.6
1,088.9 19,017.0
-10.9
-10.4
-11.0
-1.0
9.6 17,928.1
-14.8
-16.8
-18.9
-20.7
-10.1
8.7
-271.2
-635.8
238.7
-487.6
-347.0
-552.0
-119.2 5,435.7
-509.1
-412.6
-658.5
-489.5
-549.2
-439.0
-618.6
2016. Feb. 2,380.3 566.5 403.6 5,645.4 -6.0 5,241.9 163.0 2,012.6
2016. Mar. 2,972.2 1,140.0 877.1 6,336.7 5,459.6 263.0 2,159.1
2016. Apr. 1,816.1 271.2 682.5 5,616.7 4,934.2 1,745.2
2016. May 1,757.6 112.7 30.8 5,063.6 5,032.8 1,893.6
2016. June 976.5 604.4 762.5 5,845.8 5,083.3 412.7
2016. July 1,939.6 397.2 600.7 5,556.0 4,955.3 1,693.5
2016. Aug. 1,970.4 167.5 218.0 5,300.0 5,081.9 1,981.1
2016. Sept. 1,864.3 574.3 667.2 5,880.5 5,213.3 1,510.0
2016. Oct. 1,546.6 239.0 565.9 5,749.0 5,183.1 1,474.9
2016. Nov. 1,426.7 403.5 340.0 5,941.8 5,601.7 1,204.9
2016. Dec. 1,114.3 520.1 808.7 6,681.5 5,872.8 684.1
2017.P Jan. 65.5 -853.4 5,517.3 6,370.7 1,265.5
2017.P Feb. 2,813.6 1,076.8 6,333.9 5,257.0
-411.3
81.9
-158.1
-203.5
-50.6
-92.9
-326.9
63.5
-288.6
-235.7
-63.9 1,975.1
2017.P Mar. 2,907.7
-1,089.2
1,013.0
1,045.9 865.5 7,165.9
-11.2
-9.9
-11.7
-9.7
-15.4
-9.7
-7.8
-9.4
0.0
6.7
2.9
12.2
13.1 6,300.4
-14.6
-15.8
-22.7
-13.1
-20.3
-25.9
-18.4
-17.6
-15.9
-10.7
-3.7
9.9
0.3
15.4 180.4 2,195.1
-198.8
-326.9
-200.2
-248.7
-40.6
-151.1
-178.1
-220.0
-167.3
-181.7
-90.0
-110.8
-174.5
-333.3
(※) Figures are based on the IMF Balance of Payments Manual 6th Edition.Released by Ministry of Finance
Balance of Payments (IMF Basis Not-seasonally Adjusted) (※)Current Account
Goods and ServicesPrimaryIncome
Second-ary
Income
Trade BalanceServicesExports Imports
Billion Yen %Billion
Yen % Billion Yen
― 89 ―
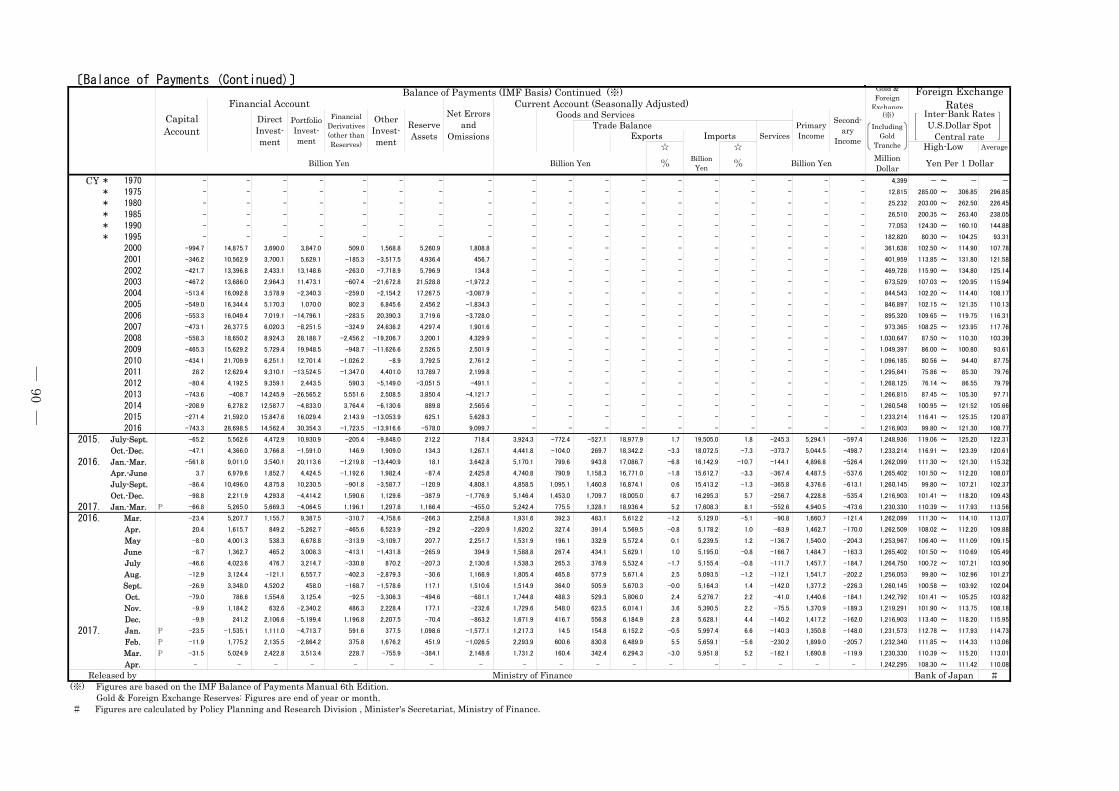
〔Balance of Payments (Continued)〕
(※)
☆ ☆ Average
CY * 1970 - - - - - - - - - - - - - - - - - - 4,399 - ~ - -
* 1975 - - - - - - - - - - - - - - - - - - 12,815 285.00 ~ 306.85 296.85
* 1980 - - - - - - - - - - - - - - - - - - 25,232 203.00 ~ 262.50 226.45
* 1985 - - - - - - - - - - - - - - - - - - 26,510 200.35 ~ 263.40 238.05
* 1990 - - - - - - - - - - - - - - - - - - 77,053 124.30 ~ 160.10 144.88
* 1995 - - - - - - - - - - - - - - - - - - 182,820 80.30 ~ 104.25 93.31
2000 -994.7 14,875.7 3,690.0 3,847.0 509.0 1,568.8 5,260.9 1,808.8 - - - - - - - - - - 361,638 102.50 ~ 114.90 107.78
2001 -346.2 10,562.9 3,700.1 5,629.1 -185.3 -3,517.5 4,936.4 456.7 - - - - - - - - - - 401,959 113.85 ~ 131.80 121.58
2002 -421.7 13,396.8 2,433.1 13,148.6 -263.0 -7,718.9 5,796.9 134.8 - - - - - - - - - - 469,728 115.90 ~ 134.80 125.14
2003 -467.2 13,686.0 2,964.3 11,473.1 -607.4 -21,672.8 21,528.8 -1,972.2 - - - - - - - - - - 673,529 107.03 ~ 120.95 115.94
2004 -513.4 16,092.8 3,578.9 -2,340.3 -259.0 -2,154.2 17,267.5 -3,087.9 - - - - - - - - - - 844,543 102.20 ~ 114.40 108.17
2005 -549.0 16,344.4 5,170.3 1,070.0 802.3 6,845.6 2,456.2 -1,834.3 - - - - - - - - - - 846,897 102.15 ~ 121.35 110.13
2006 -553.3 16,049.4 7,019.1 -14,796.1 -283.5 20,390.3 3,719.6 -3,728.0 - - - - - - - - - - 895,320 109.65 ~ 119.75 116.31
2007 -473.1 26,377.5 6,020.3 -8,251.5 -324.9 24,636.2 4,297.4 1,901.6 - - - - - - - - - - 973,365 108.25 ~ 123.95 117.76
2008 -558.3 18,650.2 8,924.3 28,188.7 -2,456.2 -19,206.7 3,200.1 4,329.9 - - - - - - - - - - 1,030,647 87.50 ~ 110.30 103.39
2009 -465.3 15,629.2 5,729.4 19,948.5 -948.7 -11,626.6 2,526.5 2,501.9 - - - - - - - - - - 1,049,397 86.00 ~ 100.80 93.61
2010 -434.1 21,709.9 6,251.1 12,701.4 -1,026.2 -8.9 3,792.5 2,761.2 - - - - - - - - - - 1,096,185 80.56 ~ 94.40 87.75
2011 28.2 12,629.4 9,310.1 -13,524.5 -1,347.0 4,401.0 13,789.7 2,199.8 - - - - - - - - - - 1,295,841 75.86 ~ 85.30 79.76
2012 -80.4 4,192.5 9,359.1 2,443.5 590.3 -5,149.0 -3,051.5 -491.1 - - - - - - - - - - 1,268,125 76.14 ~ 86.55 79.79
2013 -743.6 -408.7 14,245.9 -26,565.2 5,551.6 2,508.5 3,850.4 -4,121.7 - - - - - - - - - - 1,266,815 87.45 ~ 105.30 97.71
2014 -208.9 6,278.2 12,587.7 -4,833.0 3,764.4 -6,130.6 889.8 2,565.6 - - - - - - - - - - 1,260,548 100.95 ~ 121.52 105.66
2015 -271.4 21,592.0 15,847.6 16,029.4 2,143.9 -13,053.9 625.1 5,628.3 - - - - - - - - - - 1,233,214 116.41 ~ 125.35 120.87
2016 -743.3 28,698.5 14,562.4 30,354.3 -1,723.5 -13,916.6 -578.0 9,099.7 - - - - - - - - - - 1,216,903 99.80 ~ 121.30 108.77
2015. July-Sept. -65.2 5,562.6 4,472.9 10,930.9 -205.4 -9,848.0 212.2 718.4 3,924.3 -772.4 -527.1 18,977.9 1.7 19,505.0 1.8 -245.3 5,294.1 -597.4 1,248,936 119.06 ~ 125.20 122.31
2015. Oct.-Dec. -47.1 4,366.0 3,766.8 -1,591.0 146.9 1,909.0 134.3 1,267.1 4,441.8 -104.0 269.7 18,342.2 -3.3 18,072.5 -7.3 -373.7 5,044.5 -498.7 1,233,214 116.91 ~ 123.39 120.61
2016. Jan.-Mar. -561.8 9,011.0 3,540.1 20,113.6 -1,219.8 -13,440.9 18.1 3,642.8 5,170.1 799.6 943.8 17,086.7 -6.8 16,142.9 -10.7 -144.1 4,896.8 -526.4 1,262,099 111.30 ~ 121.30 115.32
2016. Apr.-June 3.7 6,979.6 1,852.7 4,424.5 -1,192.6 1,982.4 -87.4 2,425.8 4,740.8 790.9 1,158.3 16,771.0 -1.8 15,612.7 -3.3 -367.4 4,487.5 -537.6 1,265,402 101.50 ~ 112.20 108.07
2016. July-Sept. -86.4 10,496.0 4,875.8 10,230.5 -901.8 -3,587.7 -120.9 4,808.1 4,858.5 1,095.1 1,460.8 16,874.1 0.6 15,413.2 -1.3 -365.8 4,376.6 -613.1 1,260,145 99.80 ~ 107.21 102.37
2016. Oct.-Dec. -98.8 2,211.9 4,293.8 -4,414.2 1,590.6 1,129.6 -387.9 -1,776.9 5,146.4 1,453.0 1,709.7 18,005.0 6.7 16,295.3 5.7 -256.7 4,228.8 -535.4 1,216,903 101.41 ~ 118.20 109.43
2017. Jan.-Mar. P -66.8 5,265.0 5,669.3 -4,064.5 1,196.1 1,297.8 1,166.4 -455.0 5,242.4 775.5 1,328.1 18,936.4 5.2 17,608.3 8.1 -552.6 4,940.5 -473.6 1,230,330 110.39 ~ 117.93 113.56
2016. Mar. -23.4 5,207.7 1,155.7 9,387.5 -310.7 -4,758.6 -266.3 2,258.8 1,931.6 392.3 483.1 5,612.2 -1.2 5,129.0 -5.1 -90.8 1,660.7 -121.4 1,262,099 111.30 ~ 114.10 113.07
2016. Apr. 20.4 1,615.7 849.2 -5,262.7 -465.6 6,523.9 -29.2 -220.9 1,620.2 327.4 391.4 5,569.5 -0.8 5,178.2 1.0 -63.9 1,462.7 -170.0 1,262,509 108.02 ~ 112.20 109.88
2016. May -8.0 4,001.3 538.3 6,678.8 -313.9 -3,109.7 207.7 2,251.7 1,531.9 196.1 332.9 5,572.4 0.1 5,239.5 1.2 -136.7 1,540.0 -204.3 1,253,967 106.40 ~ 111.09 109.15
2016. June -8.7 1,362.7 465.2 3,008.3 -413.1 -1,431.8 -265.9 394.9 1,588.8 267.4 434.1 5,629.1 1.0 5,195.0 -0.8 -166.7 1,484.7 -163.3 1,265,402 101.50 ~ 110.69 105.49
2016. July -46.6 4,023.6 476.7 3,214.7 -330.8 870.2 -207.3 2,130.6 1,538.3 265.3 376.9 5,532.4 -1.7 5,155.4 -0.8 -111.7 1,457.7 -184.7 1,264,750 100.72 ~ 107.21 103.90
2016. Aug. -12.9 3,124.4 -121.1 6,557.7 -402.3 -2,879.3 -30.6 1,166.9 1,805.4 465.8 577.9 5,671.4 2.5 5,093.5 -1.2 -112.1 1,541.7 -202.2 1,256,053 99.80 ~ 102.96 101.27
2016. Sept. -26.9 3,348.0 4,520.2 458.0 -168.7 -1,578.6 117.1 1,510.6 1,514.9 364.0 505.9 5,670.3 -0.0 5,164.3 1.4 -142.0 1,377.2 -226.3 1,260,145 100.58 ~ 103.92 102.04
2016. Oct. -79.0 786.6 1,554.6 3,125.4 -92.5 -3,306.3 -494.6 -681.1 1,744.8 488.3 529.3 5,806.0 2.4 5,276.7 2.2 -41.0 1,440.6 -184.1 1,242,792 101.41 ~ 105.25 103.82
2016. Nov. -9.9 1,184.2 632.6 -2,340.2 486.3 2,228.4 177.1 -232.6 1,729.6 548.0 623.5 6,014.1 3.6 5,390.5 2.2 -75.5 1,370.9 -189.3 1,219,291 101.90 ~ 113.75 108.18
2016. Dec. -9.9 241.2 2,106.6 -5,199.4 1,196.8 2,207.5 -70.4 -863.2 1,671.9 416.7 556.8 6,184.9 2.8 5,628.1 4.4 -140.2 1,417.2 -162.0 1,216,903 113.40 ~ 118.20 115.95
2017. Jan. P -23.5 -1,535.1 1,111.0 -4,713.7 591.6 377.5 1,098.6 -1,577.1 1,217.3 14.5 154.8 6,152.2 -0.5 5,997.4 6.6 -140.3 1,350.8 -148.0 1,231,573 112.78 ~ 117.93 114.73
2017. Feb. P -11.9 1,775.2 2,135.5 -2,864.2 375.8 1,676.2 451.9 -1,026.5 2,293.9 600.6 830.8 6,489.9 5.5 5,659.1 -5.6 -230.2 1,899.0 -205.7 1,232,340 111.85 ~ 114.33 113.06
2017. Mar. P -31.5 5,024.9 2,422.8 3,513.4 228.7 -755.9 -384.1 2,148.6 1,731.2 160.4 342.4 6,294.3 -3.0 5,951.8 5.2 -182.1 1,690.8 -119.9 1,230,330 110.39 ~ 115.20 113.01
2017. Apr. - - - - - - - - - - - - - - - - - - 1,242,295 108.30 ~ 111.42 110.08
#
Gold & Foreign Exchange Reserves: Figures are end of year or month.
Released by Ministry of Finance Bank of Japan(※) Figures are based on the IMF Balance of Payments Manual 6th Edition.
# Figures are calculated by Policy Planning and Research Division , Minister's Secretariat, Ministry of Finance.
Billion Yen MillionDollar Yen Per 1 Dollar
OtherInvest-ment
ReserveAssets
Goods and ServicesPrimaryIncome
Second-ary
Income
Inter-Bank RatesU.S.Dollar Spot
Central rate
Billion Yen Billion Yen %Billion
Yen %
Foreign ExchangeRates
CapitalAccount
Financial Account Net Errors
andOmissions
Current Account (Seasonally Adjusted)DirectInvest-ment
PortfolioInvest-ment
FinancialDerivatives(other thanReserves)
Trade BalanceServices
IncludingGold
TrancheExports
Balance of Payments (IMF Basis) Continued (※) Gold &Foreign
Exchange
ImportsHigh-Low
― 90 ―
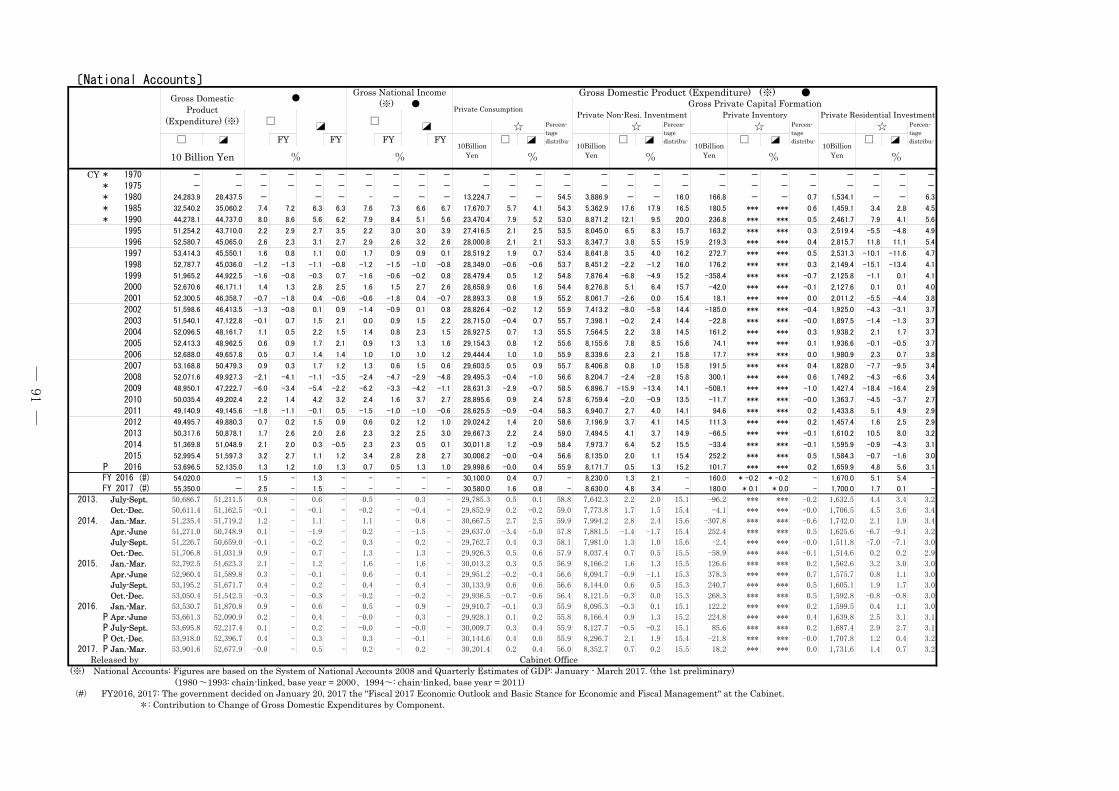
〔National Accounts〕
□ FY FY FY FY □ □ □ □
CY * 1970 - - - - - - - - - - - - - - - - - - - - - - - - - -
* 1975 - - - - - - - - - - - - - - - - - - - - - - - - - -
* 1980 24,283.9 28,437.5 - - - - - - - 13,224.7 - - 54.5 3,886.9 - - 16.0 166.8 - - 0.7 1,534.1 - - 6.3
* 1985 32,540.2 35,060.2 7.4 7.2 6.3 6.3 7.6 7.3 6.6 6.7 17,670.7 5.7 4.1 54.3 5,362.9 17.6 17.9 16.5 180.5 *** *** 0.6 1,459.1 3.4 2.8 4.5
* 1990 44,278.1 44,737.0 8.0 8.6 5.6 6.2 7.9 8.4 5.1 5.6 23,470.4 7.9 5.2 53.0 8,871.2 12.1 9.5 20.0 236.8 *** *** 0.5 2,461.7 7.9 4.1 5.6
1995 51,254.2 43,710.0 2.2 2.9 2.7 3.5 2.2 3.0 3.0 3.9 27,416.5 2.1 2.5 53.5 8,045.0 6.5 8.3 15.7 163.2 *** *** 0.3 2,519.4 -5.5 -4.8 4.9
1996 52,580.7 45,065.0 2.6 2.3 3.1 2.7 2.9 2.6 3.2 2.6 28,000.8 2.1 2.1 53.3 8,347.7 3.8 5.5 15.9 219.3 *** *** 0.4 2,815.7 11.8 11.1 5.4
1997 53,414.3 45,550.1 1.6 0.8 1.1 0.0 1.7 0.9 0.9 0.1 28,519.2 1.9 0.7 53.4 8,641.8 3.5 4.0 16.2 272.7 *** *** 0.5 2,531.3 -10.1 -11.6 4.7
1998 52,787.7 45,036.0 -1.2 -1.3 -1.1 -0.8 -1.2 -1.5 -1.0 -0.8 28,349.0 -0.6 -0.6 53.7 8,451.2 -2.2 -1.2 16.0 176.2 *** *** 0.3 2,149.4 -15.1 -13.4 4.1
1999 51,965.2 44,922.5 -1.6 -0.8 -0.3 0.7 -1.6 -0.6 -0.2 0.8 28,479.4 0.5 1.2 54.8 7,876.4 -6.8 -4.9 15.2 -358.4 *** *** -0.7 2,125.8 -1.1 0.1 4.1
2000 52,670.6 46,171.1 1.4 1.3 2.8 2.5 1.6 1.5 2.7 2.6 28,658.9 0.6 1.6 54.4 8,276.8 5.1 6.4 15.7 -42.0 *** *** -0.1 2,127.6 0.1 0.1 4.0
2001 52,300.5 46,358.7 -0.7 -1.8 0.4 -0.6 -0.6 -1.8 0.4 -0.7 28,893.3 0.8 1.9 55.2 8,061.7 -2.6 0.0 15.4 18.1 *** *** 0.0 2,011.2 -5.5 -4.4 3.8
2002 51,598.6 46,413.5 -1.3 -0.8 0.1 0.9 -1.4 -0.9 0.1 0.8 28,826.4 -0.2 1.2 55.9 7,413.2 -8.0 -5.8 14.4 -185.0 *** *** -0.4 1,925.0 -4.3 -3.1 3.7
2003 51,540.1 47,122.8 -0.1 0.7 1.5 2.1 0.0 0.9 1.5 2.2 28,715.0 -0.4 0.7 55.7 7,398.1 -0.2 2.4 14.4 -22.8 *** *** -0.0 1,897.5 -1.4 -1.3 3.7
2004 52,096.5 48,161.7 1.1 0.5 2.2 1.5 1.4 0.8 2.3 1.5 28,927.5 0.7 1.3 55.5 7,564.5 2.2 3.8 14.5 161.2 *** *** 0.3 1,938.2 2.1 1.7 3.7
2005 52,413.3 48,962.5 0.6 0.9 1.7 2.1 0.9 1.3 1.3 1.6 29,154.3 0.8 1.2 55.6 8,155.6 7.8 8.5 15.6 74.1 *** *** 0.1 1,936.6 -0.1 -0.5 3.7
2006 52,688.0 49,657.8 0.5 0.7 1.4 1.4 1.0 1.0 1.0 1.2 29,444.4 1.0 1.0 55.9 8,339.6 2.3 2.1 15.8 17.7 *** *** 0.0 1,980.9 2.3 0.7 3.8
2007 53,168.8 50,479.3 0.9 0.3 1.7 1.2 1.3 0.6 1.5 0.6 29,603.5 0.5 0.9 55.7 8,406.8 0.8 1.0 15.8 191.5 *** *** 0.4 1,828.0 -7.7 -9.5 3.4
2008 52,071.6 49,927.3 -2.1 -4.1 -1.1 -3.5 -2.4 -4.7 -2.9 -4.8 29,495.3 -0.4 -1.0 56.6 8,204.7 -2.4 -2.8 15.8 300.1 *** *** 0.6 1,749.2 -4.3 -6.6 3.4
2009 48,950.1 47,222.7 -6.0 -3.4 -5.4 -2.2 -6.2 -3.3 -4.2 -1.1 28,631.3 -2.9 -0.7 58.5 6,896.7 -15.9 -13.4 14.1 -508.1 *** *** -1.0 1,427.4 -18.4 -16.4 2.9
2010 50,035.4 49,202.4 2.2 1.4 4.2 3.2 2.4 1.6 3.7 2.7 28,895.6 0.9 2.4 57.8 6,759.4 -2.0 -0.9 13.5 -11.7 *** *** -0.0 1,363.7 -4.5 -3.7 2.7
2011 49,140.9 49,145.6 -1.8 -1.1 -0.1 0.5 -1.5 -1.0 -1.0 -0.6 28,625.5 -0.9 -0.4 58.3 6,940.7 2.7 4.0 14.1 94.6 *** *** 0.2 1,433.8 5.1 4.9 2.9
2012 49,495.7 49,880.3 0.7 0.2 1.5 0.9 0.6 0.2 1.2 1.0 29,024.2 1.4 2.0 58.6 7,196.9 3.7 4.1 14.5 111.3 *** *** 0.2 1,457.4 1.6 2.5 2.9
2013 50,317.6 50,878.1 1.7 2.6 2.0 2.6 2.3 3.2 2.5 3.0 29,667.3 2.2 2.4 59.0 7,494.5 4.1 3.7 14.9 -66.5 *** *** -0.1 1,610.2 10.5 8.0 3.2
2014 51,369.8 51,048.9 2.1 2.0 0.3 -0.5 2.3 2.3 0.5 0.1 30,011.8 1.2 -0.9 58.4 7,973.7 6.4 5.2 15.5 -33.4 *** *** -0.1 1,595.9 -0.9 -4.3 3.1
2015 52,995.4 51,597.3 3.2 2.7 1.1 1.2 3.4 2.8 2.8 2.7 30,008.2 -0.0 -0.4 56.6 8,135.0 2.0 1.1 15.4 252.2 *** *** 0.5 1,584.3 -0.7 -1.6 3.0
P 2016 53,696.5 52,135.0 1.3 1.2 1.0 1.3 0.7 0.5 1.3 1.0 29,998.6 -0.0 0.4 55.9 8,171.7 0.5 1.3 15.2 101.7 *** *** 0.2 1,659.9 4.8 5.6 3.1
54,020.0 - 1.5 - 1.3 - - - - - 30,100.0 0.4 0.7 - 8,230.0 1.3 2.1 - 160.0 * -0.2 * -0.2 - 1,670.0 5.1 5.4 -
55,350.0 - 2.5 - 1.5 - - - - - 30,580.0 1.6 0.8 - 8,630.0 4.8 3.4 - 180.0 * 0.1 * 0.0 - 1,700.0 1.7 0.1 -
2013. July-Sept. 50,686.7 51,211.5 0.8 - 0.6 - 0.5 - 0.3 - 29,785.3 0.5 0.1 58.8 7,642.3 2.2 2.0 15.1 -96.2 *** *** -0.2 1,632.5 4.4 3.4 3.2
2013. Oct.-Dec. 50,611.4 51,162.5 -0.1 - -0.1 - -0.2 - -0.4 - 29,852.9 0.2 -0.2 59.0 7,773.8 1.7 1.5 15.4 -4.1 *** *** -0.0 1,706.5 4.5 3.6 3.4
2014. Jan.-Mar. 51,235.4 51,719.2 1.2 - 1.1 - 1.1 - 0.8 - 30,667.5 2.7 2.5 59.9 7,994.2 2.8 2.4 15.6 -307.8 *** *** -0.6 1,742.0 2.1 1.9 3.4
2014. Apr.-June 51,271.0 50,748.9 0.1 - -1.9 - 0.2 - -1.5 - 29,637.0 -3.4 -5.0 57.8 7,881.5 -1.4 -1.7 15.4 252.4 *** *** 0.5 1,625.6 -6.7 -9.1 3.2
2014. July-Sept. 51,226.7 50,659.0 -0.1 - -0.2 - 0.3 - 0.2 - 29,762.7 0.4 0.3 58.1 7,981.0 1.3 1.0 15.6 -2.4 *** *** -0.0 1,511.8 -7.0 -7.1 3.0
2014. Oct.-Dec. 51,706.8 51,031.9 0.9 - 0.7 - 1.3 - 1.3 - 29,926.3 0.5 0.6 57.9 8,037.4 0.7 0.5 15.5 -58.9 *** *** -0.1 1,514.6 0.2 0.2 2.9
2015. Jan.-Mar. 52,792.5 51,623.3 2.1 - 1.2 - 1.6 - 1.6 - 30,013.2 0.3 0.5 56.9 8,166.2 1.6 1.3 15.5 126.6 *** *** 0.2 1,562.6 3.2 3.0 3.0
2015. Apr.-June 52,960.4 51,589.8 0.3 - -0.1 - 0.6 - 0.4 - 29,951.2 -0.2 -0.4 56.6 8,094.7 -0.9 -1.1 15.3 378.3 *** *** 0.7 1,575.7 0.8 1.1 3.0
2015. July-Sept. 53,195.2 51,671.7 0.4 - 0.2 - 0.4 - 0.4 - 30,133.9 0.6 0.6 56.6 8,144.0 0.6 0.5 15.3 240.7 *** *** 0.5 1,605.1 1.9 1.7 3.0
2015. Oct.-Dec. 53,050.4 51,542.5 -0.3 - -0.3 - -0.2 - -0.2 - 29,936.5 -0.7 -0.6 56.4 8,121.5 -0.3 0.0 15.3 268.3 *** *** 0.5 1,592.8 -0.8 -0.8 3.0
2016. Jan.-Mar. 53,530.7 51,870.8 0.9 - 0.6 - 0.5 - 0.9 - 29,910.7 -0.1 0.3 55.9 8,095.3 -0.3 0.1 15.1 122.2 *** *** 0.2 1,599.5 0.4 1.1 3.0
2016.P Apr.-June 53,661.3 52,090.9 0.2 - 0.4 - -0.0 - 0.3 - 29,928.1 0.1 0.2 55.8 8,166.4 0.9 1.3 15.2 224.8 *** *** 0.4 1,639.8 2.5 3.1 3.1
2016.P July-Sept. 53,695.8 52,217.4 0.1 - 0.2 - -0.0 - -0.0 - 30,009.7 0.3 0.4 55.9 8,127.7 -0.5 -0.2 15.1 85.6 *** *** 0.2 1,687.4 2.9 2.7 3.1
2016.P Oct.-Dec. 53,918.0 52,396.7 0.4 - 0.3 - 0.3 - -0.1 - 30,144.6 0.4 0.0 55.9 8,296.7 2.1 1.9 15.4 -21.8 *** *** -0.0 1,707.8 1.2 0.4 3.2
2017.P Jan.-Mar. 53,901.6 52,677.9 -0.0 - 0.5 - 0.2 - 0.2 - 30,201.4 0.2 0.4 56.0 8,352.7 0.7 0.2 15.5 18.2 *** *** 0.0 1,731.6 1.4 0.7 3.2
(※) National Accounts: Figures are based on the System of National Accounts 2008 and Quarterly Estimates of GDP: January - March 2017. (the 1st preliminary) (1980~1993: chain-linked, base year = 2000、1994~: chain-linked, base year = 2011) (#) FY2016, 2017: The government decided on January 20, 2017 the "Fiscal 2017 Economic Outlook and Basic Stance for Economic and Fiscal Management" at the Cabinet. *: Contribution to Change of Gross Domestic Expenditures by Component.
●Gross National Income
(※) ●
Gross Domestic Product (Expenditure) (※) ●
Private Consumption Gross Private Capital Formation
□ □Private Non-Resi. Inventment Private Inventory Private Residential Investment
☆ Percen-tagedistribu-
☆
%
☆ Percen-tagedistribu-
☆ Percen-tagedistribu-
FY 2016 (#)FY 2017 (#)
Released by Cabinet Office
10 Billion Yen % %10Billion
Yen10Billion
Yen10Billion
Yen10Billion
Yen% % %
Percen-tagedistribu-
Gross DomesticProduct
(Expenditure) (※)
― 91 ―
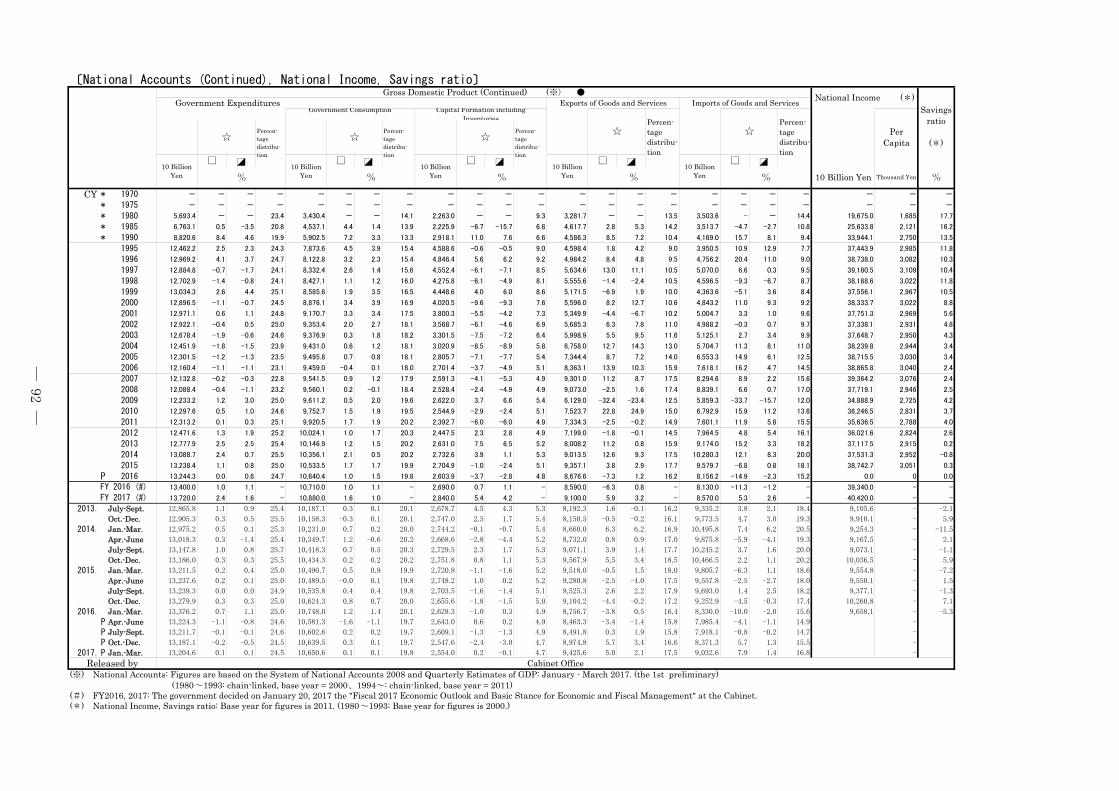
〔National Accounts (Continued), National Income, Savings ratio〕
□ □ □ □ □
CY * 1970 - - - - - - - - - - - - - - - - - - - - - - -
* 1975 - - - - - - - - - - - - - - - - - - - - - - -
* 1980 5,693.4 - - 23.4 3,430.4 - - 14.1 2,263.0 - - 9.3 3,281.7 - - 13.5 3,503.6 - - 14.4 19,675.0 1,685 17.7
* 1985 6,763.1 0.5 -3.5 20.8 4,537.1 4.4 1.4 13.9 2,225.9 -6.7 -15.7 6.8 4,617.7 2.8 5.3 14.2 3,513.7 -4.7 -2.7 10.8 25,633.8 2,121 16.2
* 1990 8,820.6 8.4 4.6 19.9 5,902.5 7.2 3.3 13.3 2,918.1 11.0 7.6 6.6 4,586.3 8.5 7.2 10.4 4,169.0 15.7 8.1 9.4 33,944.1 2,750 13.5
1995 12,462.2 2.5 2.3 24.3 7,873.6 4.5 3.9 15.4 4,588.6 -0.6 -0.5 9.0 4,598.4 1.8 4.2 9.0 3,950.5 10.9 12.9 7.7 37,443.9 2,985 11.8
1996 12,969.2 4.1 3.7 24.7 8,122.8 3.2 2.3 15.4 4,846.4 5.6 6.2 9.2 4,984.2 8.4 4.8 9.5 4,756.2 20.4 11.0 9.0 38,738.0 3,082 10.3
1997 12,884.8 -0.7 -1.7 24.1 8,332.4 2.6 1.4 15.6 4,552.4 -6.1 -7.1 8.5 5,634.6 13.0 11.1 10.5 5,070.0 6.6 0.3 9.5 39,180.5 3,109 10.4
1998 12,702.9 -1.4 -0.8 24.1 8,427.1 1.1 1.2 16.0 4,275.8 -6.1 -4.9 8.1 5,555.6 -1.4 -2.4 10.5 4,596.5 -9.3 -6.7 8.7 38,188.6 3,022 11.8
1999 13,034.3 2.6 4.4 25.1 8,585.6 1.9 3.5 16.5 4,448.6 4.0 6.0 8.6 5,171.5 -6.9 1.9 10.0 4,363.6 -5.1 3.6 8.4 37,556.1 2,967 10.5
2000 12,896.5 -1.1 -0.7 24.5 8,876.1 3.4 3.9 16.9 4,020.5 -9.6 -9.3 7.6 5,596.0 8.2 12.7 10.6 4,843.2 11.0 9.3 9.2 38,333.7 3,022 8.8
2001 12,971.1 0.6 1.1 24.8 9,170.7 3.3 3.4 17.5 3,800.3 -5.5 -4.2 7.3 5,349.9 -4.4 -6.7 10.2 5,004.7 3.3 1.0 9.6 37,751.3 2,969 5.6
2002 12,922.1 -0.4 0.5 25.0 9,353.4 2.0 2.7 18.1 3,568.7 -6.1 -4.6 6.9 5,685.3 6.3 7.8 11.0 4,988.2 -0.3 0.7 9.7 37,338.1 2,931 4.8
2003 12,678.4 -1.9 -0.6 24.6 9,376.9 0.3 1.8 18.2 3,301.5 -7.5 -7.2 6.4 5,998.9 5.5 9.5 11.6 5,125.1 2.7 3.4 9.9 37,648.7 2,950 4.3
2004 12,451.9 -1.8 -1.5 23.9 9,431.0 0.6 1.2 18.1 3,020.9 -8.5 -8.9 5.8 6,758.0 12.7 14.3 13.0 5,704.7 11.3 8.1 11.0 38,239.8 2,944 3.4
2005 12,301.5 -1.2 -1.3 23.5 9,495.8 0.7 0.8 18.1 2,805.7 -7.1 -7.7 5.4 7,344.4 8.7 7.2 14.0 6,553.3 14.9 6.1 12.5 38,715.5 3,030 3.4
2006 12,160.4 -1.1 -1.1 23.1 9,459.0 -0.4 0.1 18.0 2,701.4 -3.7 -4.9 5.1 8,363.1 13.9 10.3 15.9 7,618.1 16.2 4.7 14.5 38,865.8 3,040 2.4
2007 12,132.8 -0.2 -0.3 22.8 9,541.5 0.9 1.2 17.9 2,591.3 -4.1 -5.3 4.9 9,301.0 11.2 8.7 17.5 8,294.6 8.9 2.2 15.6 39,364.2 3,076 2.4
2008 12,088.4 -0.4 -1.1 23.2 9,560.1 0.2 -0.1 18.4 2,528.4 -2.4 -4.9 4.9 9,073.0 -2.5 1.6 17.4 8,839.1 6.6 0.7 17.0 37,719.1 2,946 2.5
2009 12,233.2 1.2 3.0 25.0 9,611.2 0.5 2.0 19.6 2,622.0 3.7 6.6 5.4 6,129.0 -32.4 -23.4 12.5 5,859.3 -33.7 -15.7 12.0 34,888.9 2,725 4.2
2010 12,297.6 0.5 1.0 24.6 9,752.7 1.5 1.9 19.5 2,544.9 -2.9 -2.4 5.1 7,523.7 22.8 24.9 15.0 6,792.9 15.9 11.2 13.6 36,246.5 2,831 3.7
2011 12,313.2 0.1 0.3 25.1 9,920.5 1.7 1.9 20.2 2,392.7 -6.0 -6.0 4.9 7,334.3 -2.5 -0.2 14.9 7,601.1 11.9 5.8 15.5 35,636.5 2,788 4.0
2012 12,471.6 1.3 1.9 25.2 10,024.1 1.0 1.7 20.3 2,447.5 2.3 2.8 4.9 7,199.0 -1.8 -0.1 14.5 7,964.5 4.8 5.4 16.1 36,021.6 2,824 2.6
2013 12,777.9 2.5 2.5 25.4 10,146.9 1.2 1.5 20.2 2,631.0 7.5 6.5 5.2 8,008.2 11.2 0.8 15.9 9,174.0 15.2 3.3 18.2 37,117.5 2,915 0.2
2014 13,088.7 2.4 0.7 25.5 10,356.1 2.1 0.5 20.2 2,732.6 3.9 1.1 5.3 9,013.5 12.6 9.3 17.5 10,280.3 12.1 8.3 20.0 37,531.3 2,952 -0.8
2015 13,238.4 1.1 0.8 25.0 10,533.5 1.7 1.7 19.9 2,704.9 -1.0 -2.4 5.1 9,357.1 3.8 2.9 17.7 9,579.7 -6.8 0.8 18.1 38,742.7 3,051 0.3
P 2016 13,244.3 0.0 0.6 24.7 10,640.4 1.0 1.5 19.8 2,603.9 -3.7 -2.8 4.8 8,676.6 -7.3 1.2 16.2 8,156.2 -14.9 -2.3 15.2 0.0 0 0.0
13,400.0 1.0 1.1 - 10,710.0 1.0 1.1 - 2,690.0 0.7 1.1 - 8,590.0 -6.3 0.8 - 8,130.0 -11.3 -1.2 - 39,340.0 - -
13,720.0 2.4 1.6 - 10,880.0 1.6 1.0 - 2,840.0 5.4 4.2 - 9,100.0 5.9 3.2 - 8,570.0 5.3 2.6 - 40,420.0 - -
2013. July-Sept. 12,865.8 1.1 0.9 25.4 10,187.1 0.3 0.1 20.1 2,678.7 4.5 4.3 5.3 8,192.3 1.6 -0.1 16.2 9,335.2 3.8 2.1 18.4 9,105.6 - -2.1
2013. Oct.-Dec. 12,905.3 0.3 0.5 25.5 10,158.3 -0.3 0.1 20.1 2,747.0 2.5 1.7 5.4 8,150.5 -0.5 -0.2 16.1 9,773.5 4.7 3.0 19.3 9,910.1 - 5.9
2014. Jan.-Mar. 12,975.2 0.5 0.1 25.3 10,231.0 0.7 0.2 20.0 2,744.2 -0.1 -0.7 5.4 8,660.0 6.3 6.2 16.9 10,495.8 7.4 6.2 20.5 9,254.3 - -11.5
2014. Apr.-June 13,018.3 0.3 -1.4 25.4 10,349.7 1.2 -0.6 20.2 2,668.6 -2.8 -4.4 5.2 8,732.0 0.8 0.9 17.0 9,875.8 -5.9 -4.1 19.3 9,167.5 - 2.1
2014. July-Sept. 13,147.8 1.0 0.8 25.7 10,418.3 0.7 0.5 20.3 2,729.5 2.3 1.7 5.3 9,071.1 3.9 1.4 17.7 10,245.2 3.7 1.6 20.0 9,073.1 - -1.1
2014. Oct.-Dec. 13,186.0 0.3 0.3 25.5 10,434.3 0.2 0.2 20.2 2,751.8 0.8 1.1 5.3 9,567.9 5.5 3.4 18.5 10,466.5 2.2 1.1 20.2 10,036.5 - 5.9
2015. Jan.-Mar. 13,211.5 0.2 0.4 25.0 10,490.7 0.5 0.9 19.9 2,720.8 -1.1 -1.6 5.2 9,518.0 -0.5 1.5 18.0 9,805.7 -6.3 1.1 18.6 9,554.8 - -7.2
2015. Apr.-June 13,237.6 0.2 0.1 25.0 10,489.5 -0.0 0.1 19.8 2,748.2 1.0 0.2 5.2 9,280.8 -2.5 -4.0 17.5 9,557.8 -2.5 -2.7 18.0 9,550.1 - 1.5
2015. July-Sept. 13,239.3 0.0 0.0 24.9 10,535.8 0.4 0.4 19.8 2,703.5 -1.6 -1.4 5.1 9,525.3 2.6 2.2 17.9 9,693.0 1.4 2.5 18.2 9,377.1 - -1.3
2015. Oct.-Dec. 13,279.9 0.3 0.3 25.0 10,624.3 0.8 0.7 20.0 2,655.6 -1.8 -1.5 5.0 9,104.2 -4.4 -0.2 17.2 9,252.9 -4.5 -0.3 17.4 10,260.8 - 7.1
2016. Jan.-Mar. 13,376.2 0.7 1.1 25.0 10,748.0 1.2 1.4 20.1 2,628.3 -1.0 0.3 4.9 8,756.7 -3.8 0.5 16.4 8,330.0 -10.0 -2.0 15.6 9,658.1 - -5.3
2016.P Apr.-June 13,224.3 -1.1 -0.8 24.6 10,581.3 -1.6 -1.1 19.7 2,643.0 0.6 0.2 4.9 8,463.3 -3.4 -1.4 15.8 7,985.4 -4.1 -1.1 14.9 -
2016.P July-Sept. 13,211.7 -0.1 -0.1 24.6 10,602.6 0.2 0.2 19.7 2,609.1 -1.3 -1.3 4.9 8,491.8 0.3 1.9 15.8 7,918.1 -0.8 -0.2 14.7 -
2016.P Oct.-Dec. 13,187.1 -0.2 -0.5 24.5 10,639.5 0.3 0.1 19.7 2,547.6 -2.4 -3.0 4.7 8,974.8 5.7 3.4 16.6 8,371.3 5.7 1.3 15.5 -
2017.P Jan.-Mar. 13,204.6 0.1 0.1 24.5 10,650.6 0.1 0.1 19.8 2,554.0 0.2 -0.1 4.7 9,425.6 5.0 2.1 17.5 9,032.6 7.9 1.4 16.8 -
(※) National Accounts: Figures are based on the System of National Accounts 2008 and Quarterly Estimates of GDP: January - March 2017. (the 1st preliminary) (1980~1993: chain-linked, base year = 2000、1994~: chain-linked, base year = 2011)(#) FY2016, 2017: The government decided on January 20, 2017 the "Fiscal 2017 Economic Outlook and Basic Stance for Economic and Fiscal Management" at the Cabinet.(*) National Income, Savings ratio: Base year for figures is 2011. (1980~1993: Base year for figures is 2000.)
Percen-tagedistribu-tion
Gross Domestic Product (Continued) (※) ● National Income (*)Savings
ratio
(*)
Government Expenditures Exports of Goods and Services Imports of Goods and ServicesGovernment Consumption Capital Formation including
Inventories
☆Percen-tagedistribu-tion
☆Percen-tagedistribu-tion
☆Percen-tagedistribu-tion
☆
%
☆Percen-tagedistribu-tion
PerCapita
Released by Cabinet Office
% 10 Billion Yen Thousand Yen %
FY 2016 (#)
FY 2017 (#)
10 BillionYen
10 BillionYen
10 BillionYen
10 BillionYen
10 BillionYen% % %
― 92 ―
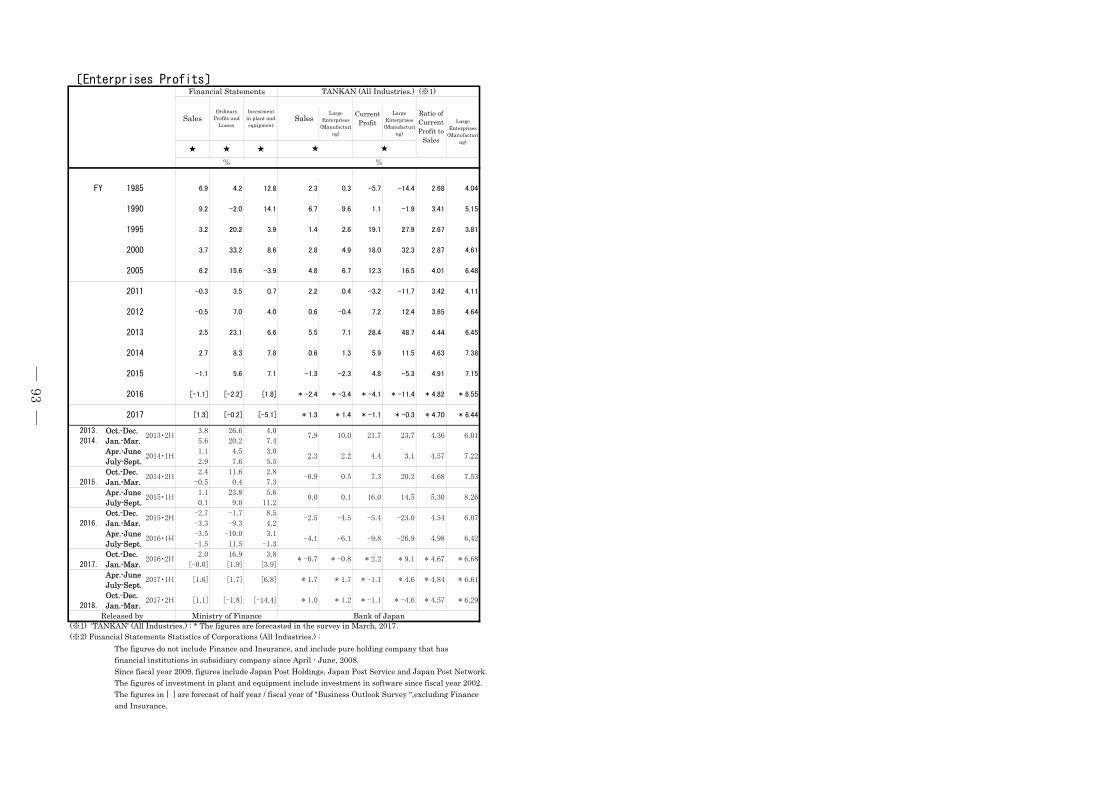
〔Enterprises Profits〕
★ ★ ★
2013. Oct.-Dec. 3.8 26.6 4.0
2014. Jan.-Mar. 5.6 20.2 7.4
2014. Apr.-June 1.1 4.5 3.0
2014. July-Sept. 2.9 7.6 5.5
2014. Oct.-Dec. 2.4 11.6 2.8
2015. Jan.-Mar. -0.5 0.4 7.3
2015. Apr.-June 1.1 23.8 5.6
2015. July-Sept. 0.1 9.0 11.2
2015. Oct.-Dec. -2.7 -1.7 8.5
2016. Jan.-Mar. -3.3 -9.3 4.2
2016. Apr.-June -3.5 -10.0 3.1
2016. July-Sept. -1.5 11.5 -1.3
2016. Oct.-Dec. 2.0 16.9 3.8
2017. Jan.-Mar. [-0.0] [1.9] [3.9]
2017. Apr.-June2017. July-Sept.2017. Oct.-Dec.2018. Jan.-Mar.
(※1) 'TANKAN' (All Industries.) : * The figures are forecasted in the survey in March, 2017. (※2) Financial Statements Statistics of Corporations (All Industries.) : The figures do not include Finance and Insurance, and include pure holding company that has financial institutions in subsidiary company since April - June, 2008. Since fiscal year 2009, figures include Japan Post Holdings, Japan Post Service and Japan Post Network. The figures of investment in plant and equipment include investment in software since fiscal year 2002. The figures in [ ] are forecast of half year / fiscal year of "Business Outlook Survey ",excluding Finance and Insurance.
Financial Statements TANKAN (All Industries.) (※1)
SalesOrdinary
Profits andLosses
Investmentin plant andequipment
Sales CurrentProfit
Ratio ofCurrentProfit to
Sales
LargeEnterprises
(Manufacturing)
LargeEnterprises
(Manufacturing)
LargeEnterprises
(Manufacturing)
★ ★
6.9 4.2 12.8
% %
FY 1985 -5.7 -14.4 2.68 4.042.3 0.3
5.15
1995 3.2 20.2
-2.0 14.1 6.7 9.6 1.1
2.67 3.811.4 2.6 19.1 27.9
2000 3.7 33.2 8.6
3.9
-1.9 3.411990 9.2
4.8 6.7 12.3 16.5 4.01 6.48
4.61
2005 6.2 15.6 -3.9
2.8 4.9 18.0 32.3 2.87
2012 -0.5 7.0
3.5 0.72011 -0.3
4.0
-11.7
0.6 -0.4 7.2 12.4
3.42 4.112.2 0.4 -3.2
3.65 4.64
* 6.55
4.63 7.38
* -2.4 * -3.4 * -4.1 * -11.4
2013 2.5 23.1 6.6 6.455.5 7.1 28.4 48.7 4.44
2015
2014 2.7 8.3 7.8 0.6 1.3 5.9 11.5
[1.8]
-5.3 4.91 7.15
2016 [-1.1] [-2.2]
5.6 7.1 -1.3 -2.3 4.8-1.1
* 4.82
* 6.44
2013・2H 7.9 10.0 21.7 23.7 4.36 6.01
* 1.3 * 1.4 * -1.1 * -0.3 * 4.702017 [1.3] [-0.2] [-5.1]
4.57 7.22
2014・2H -0.9 0.5 7.3 20.2 4.68 7.53
2014・1H 2.3 2.2 4.4 3.1
5.30 8.26
2015・2H -2.5 -4.5 -5.4 -23.0 4.54 6.07
2015・1H 0.0 0.1 16.0 14.5
4.98 6.42
2016・2H * -0.7 * -0.8 * 2.2 * 9.1 * 4.67 * 6.68
2016・1H -4.1 -6.1 -9.8 -26.9
* 1.7 * -1.1 * 4.6 * 4.84 * 6.61
2017・2H [1.1] [-1.8] [-14.4]
2017・1H [1.6] [1.7] [6.8] * 1.7
Released by Ministry of Finance Bank of Japan
* 1.0 * 1.2 * -1.1 * -4.6 * 4.57 * 6.29
― 93 ―

MONTHLY FINANCE REVIEW
Published by Information Service Department Policy Research Institute Ministry of Finance 3-1-1 Kasumigaseki, Chiyoda-ku, Tokyo 100-8940 JAPAN
URL http://www.mof.go.jp/english/pri/publication/mf_review/index.htm

Printed in Japan