Embed Size (px)
Citation preview
Monthly Report: July
FY2022
2
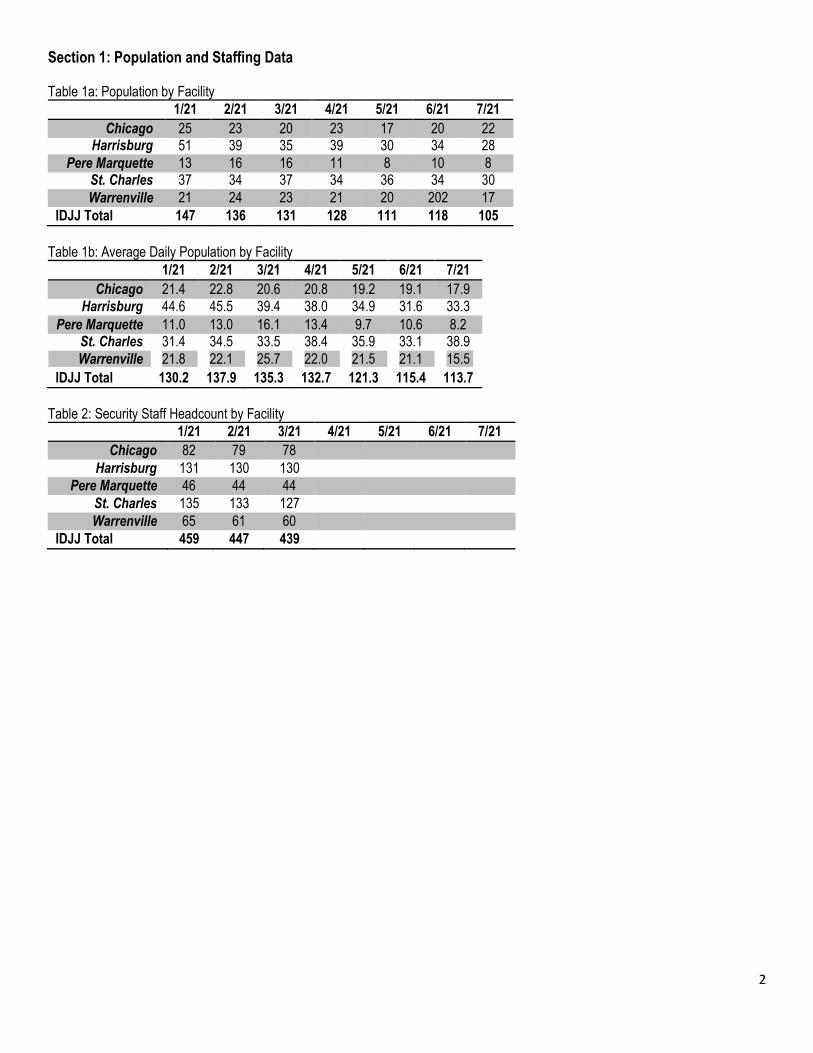
Section 1: Population and Staffing Data
Table 1a: Population by Facility 1/21 2/21 3/21 4/21 5/21 6/21 7/21
Chicago 25 23 20 23 17 20 22 Harrisburg 51 39 35 39 30 34 28
Pere Marquette 13 16 16 11 8 10 8 St. Charles 37 34 37 34 36 34 30 Warrenville 21 24 23 21 20 202 17
IDJJ Total 147 136 131 128 111 118 105
Table 1b: Average Daily Population by Facility 1/21 2/21 3/21 4/21 5/21 6/21 7/21
Chicago 21.4 22.8 20.6 20.8 19.2 19.1 17.9 Harrisburg 44.6 45.5 39.4 38.0 34.9 31.6 33.3
Pere Marquette 11.0 13.0 16.1 13.4 9.7 10.6 8.2 St. Charles 31.4 34.5 33.5 38.4 35.9 33.1 38.9
Warrenville 21.8 22.1 25.7 22.0 21.5 21.1 15.5 IDJJ Total 130.2 137.9 135.3 132.7 121.3 115.4 113.7
Table 2: Security Staff Headcount by Facility 1/21 2/21 3/21 4/21 5/21 6/21 7/21
Chicago 82 79 78 Harrisburg 131 130 130
Pere Marquette 46 44 44 St. Charles 135 133 127 Warrenville 65 61 60
IDJJ Total 459 447 439
July September November
January March May
July September November
January March May
July September November
January March May
July September November
January March May
July September November
January March May
July September
October December
February April
June August
October December
February April June
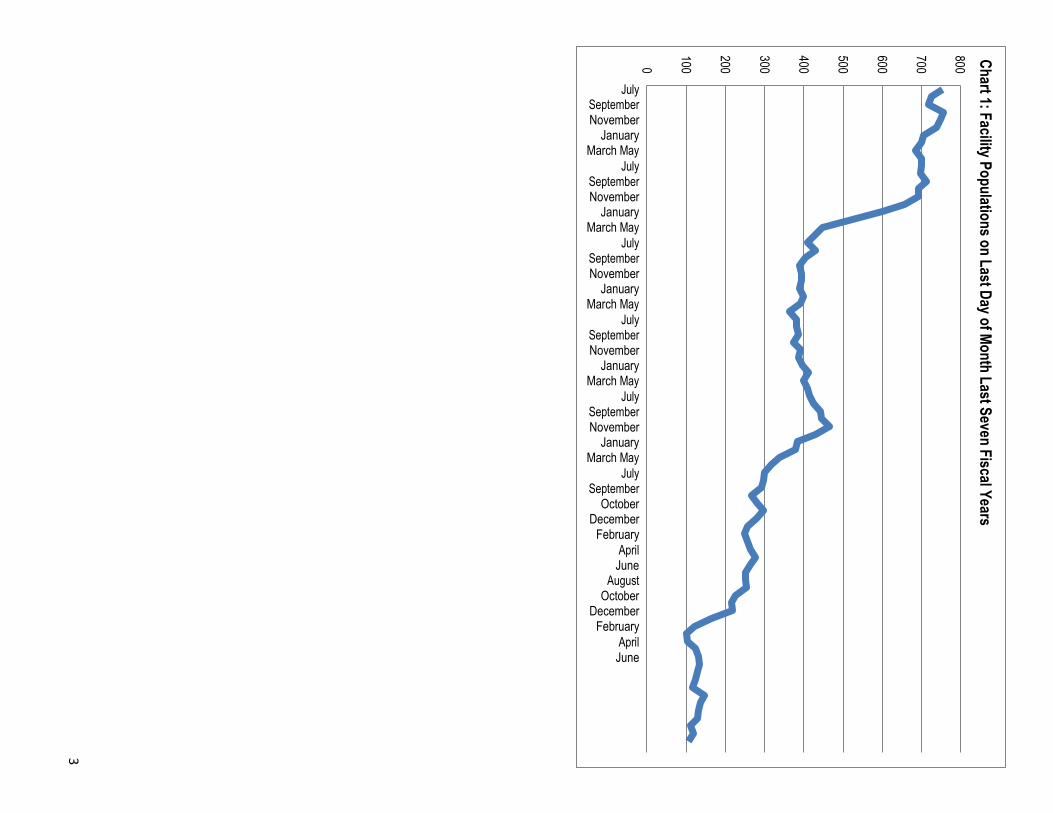
Chart 1: Facility Populations on Last Day of Month Last Seven Fiscal Years 800
700
600
500
400
300
200
100 0
3
4
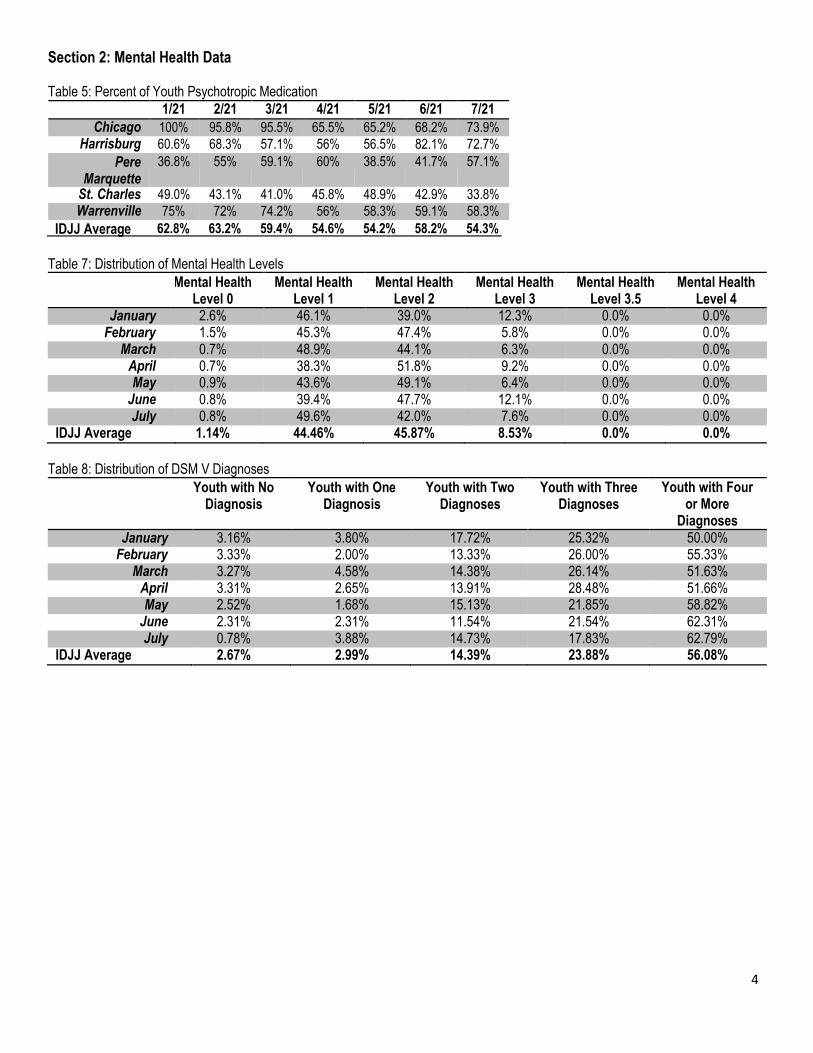
Section 2: Mental Health Data
Table 5: Percent of Youth Psychotropic Medication 1/21 2/21 3/21 4/21 5/21 6/21 7/21
Chicago 100% 95.8% 95.5% 65.5% 65.2% 68.2% 73.9% Harrisburg 60.6% 68.3% 57.1% 56% 56.5% 82.1% 72.7%
Pere Marquette
36.8% 55% 59.1% 60% 38.5% 41.7% 57.1%
St. Charles 49.0% 43.1% 41.0% 45.8% 48.9% 42.9% 33.8% Warrenville 75% 72% 74.2% 56% 58.3% 59.1% 58.3%
IDJJ Average 62.8% 63.2% 59.4% 54.6% 54.2% 58.2% 54.3%
Table 7: Distribution of Mental Health Levels Mental Health
Level 0 Mental Health
Level 1 Mental Health
Level 2 Mental Health
Level 3 Mental Health
Level 3.5 Mental Health
Level 4 January 2.6% 46.1% 39.0% 12.3% 0.0% 0.0%
February 1.5% 45.3% 47.4% 5.8% 0.0% 0.0% March 0.7% 48.9% 44.1% 6.3% 0.0% 0.0%
April 0.7% 38.3% 51.8% 9.2% 0.0% 0.0% May 0.9% 43.6% 49.1% 6.4% 0.0% 0.0%
June 0.8% 39.4% 47.7% 12.1% 0.0% 0.0% July 0.8% 49.6% 42.0% 7.6% 0.0% 0.0%
IDJJ Average 1.14% 44.46% 45.87% 8.53% 0.0% 0.0%
Table 8: Distribution of DSM V Diagnoses Youth with No
Diagnosis Youth with One
Diagnosis Youth with Two
Diagnoses Youth with Three
Diagnoses Youth with Four
or More Diagnoses
January 3.16% 3.80% 17.72% 25.32% 50.00% February 3.33% 2.00% 13.33% 26.00% 55.33%
March 3.27% 4.58% 14.38% 26.14% 51.63% April 3.31% 2.65% 13.91% 28.48% 51.66% May 2.52% 1.68% 15.13% 21.85% 58.82%
June 2.31% 2.31% 11.54% 21.54% 62.31% July 0.78% 3.88% 14.73% 17.83% 62.79%
IDJJ Average 2.67% 2.99% 14.39% 23.88% 56.08%
5
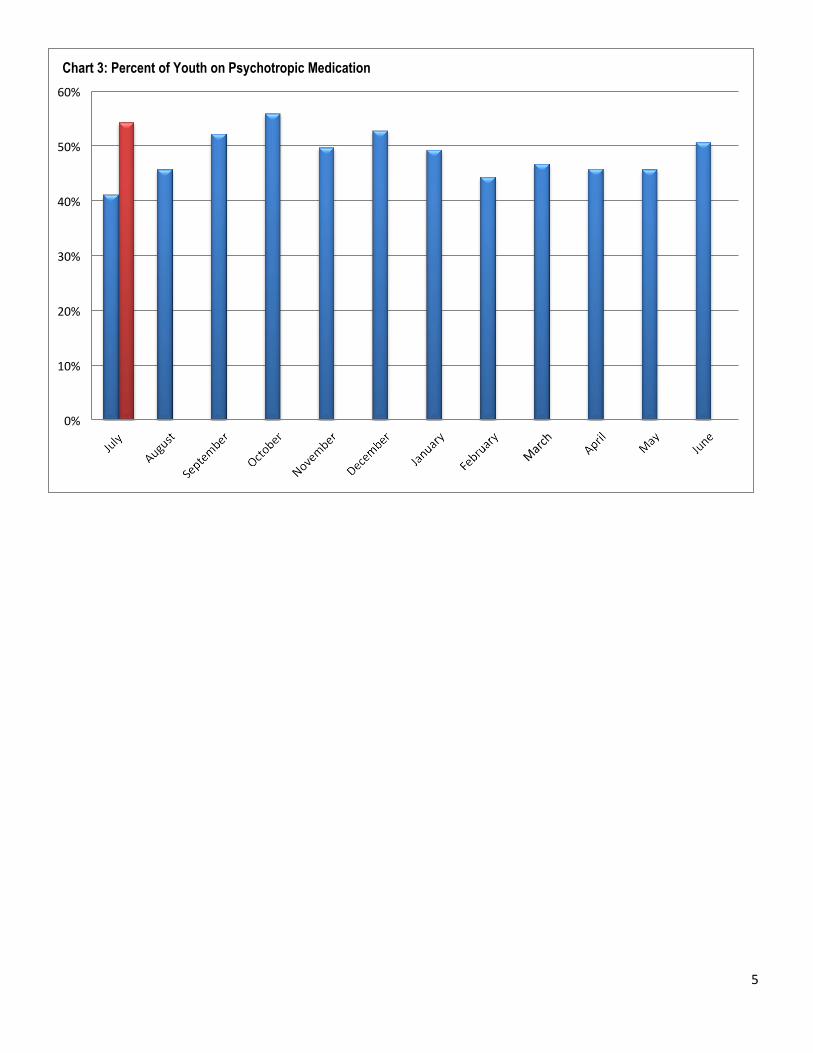
Chart 3: Percent of Youth on Psychotropic Medication 60%
50%
40%
30%
20%
10%
0%
6
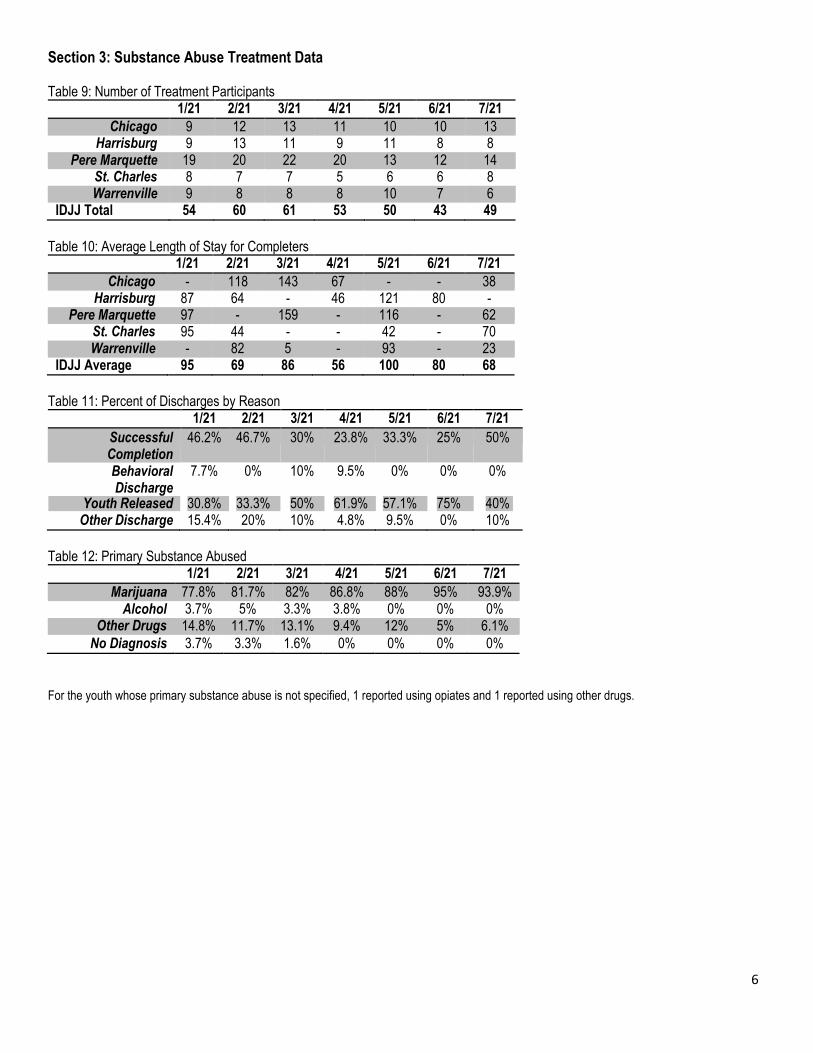
Section 3: Substance Abuse Treatment Data
Table 9: Number of Treatment Participants 1/21 2/21 3/21 4/21 5/21 6/21 7/21
Chicago 9 12 13 11 10 10 13 Harrisburg 9 13 11 9 11 8 8
Pere Marquette 19 20 22 20 13 12 14 St. Charles 8 7 7 5 6 6 8 Warrenville 9 8 8 8 10 7 6
IDJJ Total 54 60 61 53 50 43 49
Table 10: Average Length of Stay for Completers 1/21 2/21 3/21 4/21 5/21 6/21 7/21
Chicago - 118 143 67 - - 38 Harrisburg 87 64 - 46 121 80 -
Pere Marquette 97 - 159 - 116 - 62 St. Charles 95 44 - - 42 - 70 Warrenville - 82 5 - 93 - 23
IDJJ Average 95 69 86 56 100 80 68
Table 11: Percent of Discharges by Reason 1/21 2/21 3/21 4/21 5/21 6/21 7/21
Successful Completion
46.2% 46.7% 30% 23.8% 33.3% 25% 50%
Behavioral Discharge
7.7% 0% 10% 9.5% 0% 0% 0%
Youth Released 30.8% 33.3% 50% 61.9% 57.1% 75% 40% Other Discharge 15.4% 20% 10% 4.8% 9.5% 0% 10%
Table 12: Primary Substance Abused 1/21 2/21 3/21 4/21 5/21 6/21 7/21
Marijuana 77.8% 81.7% 82% 86.8% 88% 95% 93.9% Alcohol 3.7% 5% 3.3% 3.8% 0% 0% 0%
Other Drugs 14.8% 11.7% 13.1% 9.4% 12% 5% 6.1% No Diagnosis 3.7% 3.3% 1.6% 0% 0% 0% 0%
For the youth whose primary substance abuse is not specified, 1 reported using opiates and 1 reported using other drugs.
7
0.00
10.00
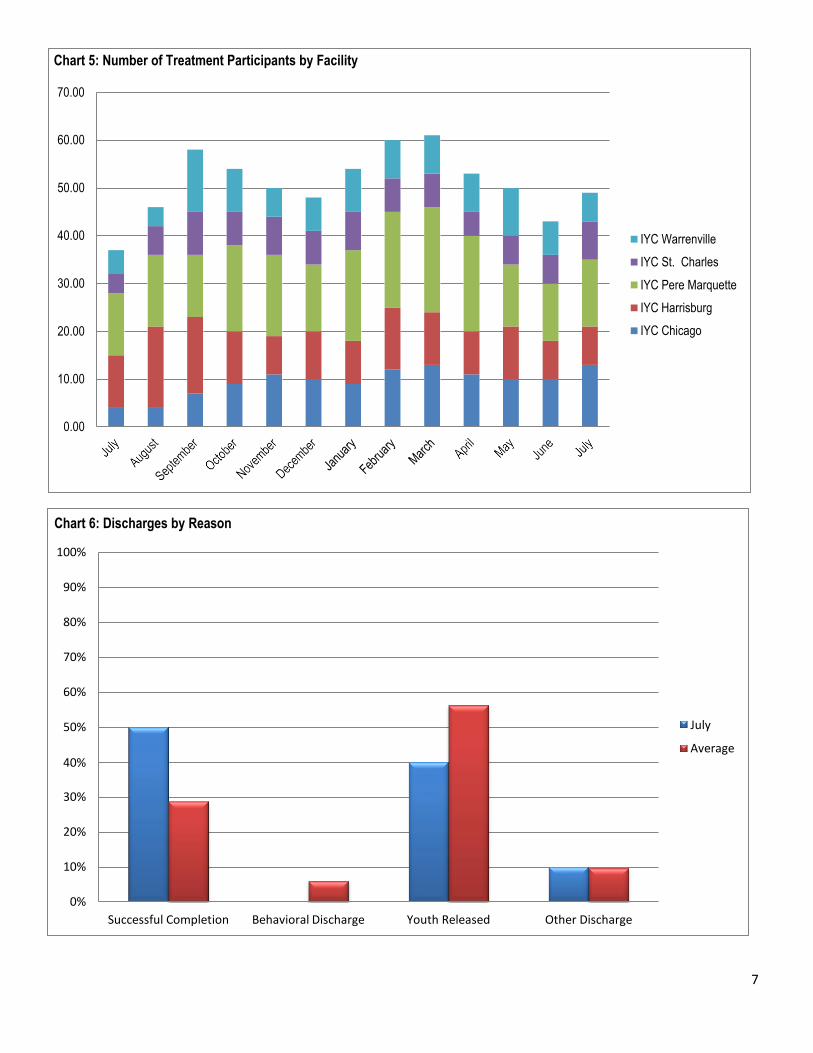
IYC Warrenville IYC St. Charles IYC Pere Marquette IYC Harrisburg IYC Chicago
40.00 30.00 20.00
50.00
60.00
Chart 5: Number of Treatment Participants by Facility 70.00
Chart 6: Discharges by Reason
100%
90%
80%
70%
60%
50% July
Average 40% 30% 20% 10%
0% Successful Completion Behavioral Discharge Youth Released Other Discharge
8
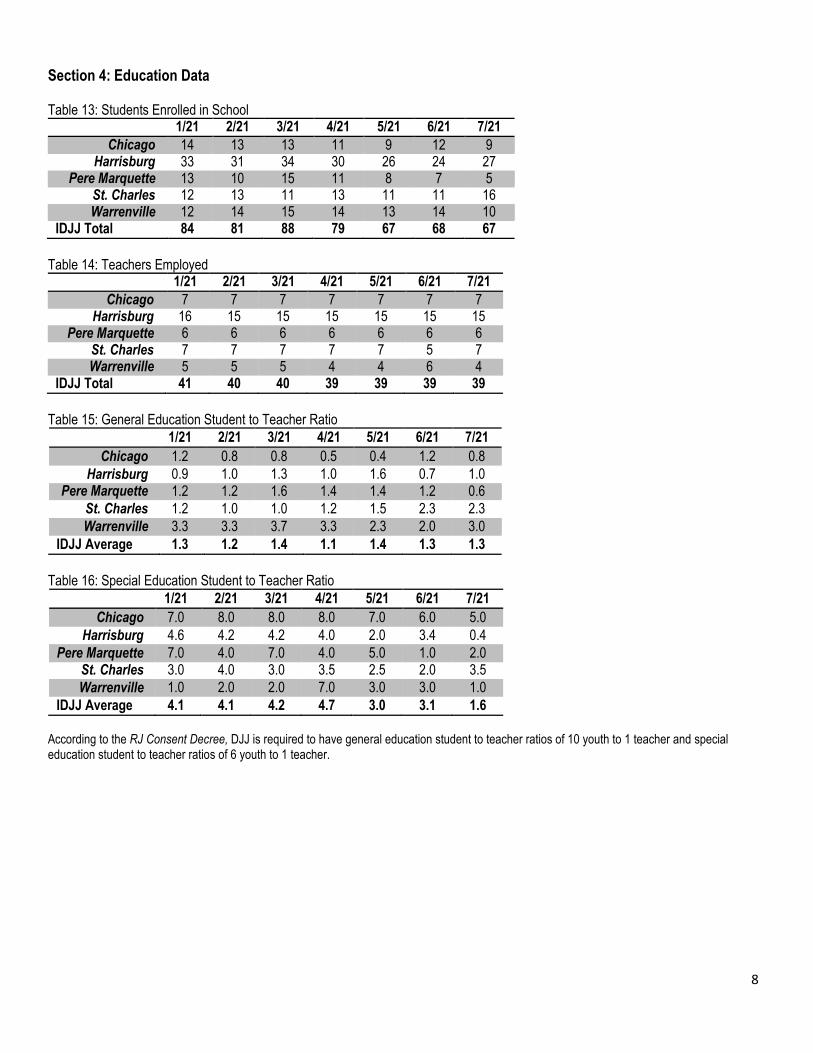
Section 4: Education Data
Table 13: Students Enrolled in School 1/21 2/21 3/21 4/21 5/21 6/21 7/21
Chicago 14 13 13 11 9 12 9 Harrisburg 33 31 34 30 26 24 27
Pere Marquette 13 10 15 11 8 7 5 St. Charles 12 13 11 13 11 11 16 Warrenville 12 14 15 14 13 14 10
IDJJ Total 84 81 88 79 67 68 67
Table 14: Teachers Employed 1/21 2/21 3/21 4/21 5/21 6/21 7/21
Chicago 7 7 7 7 7 7 7 Harrisburg 16 15 15 15 15 15 15
Pere Marquette 6 6 6 6 6 6 6 St. Charles 7 7 7 7 7 5 7 Warrenville 5 5 5 4 4 6 4
IDJJ Total 41 40 40 39 39 39 39
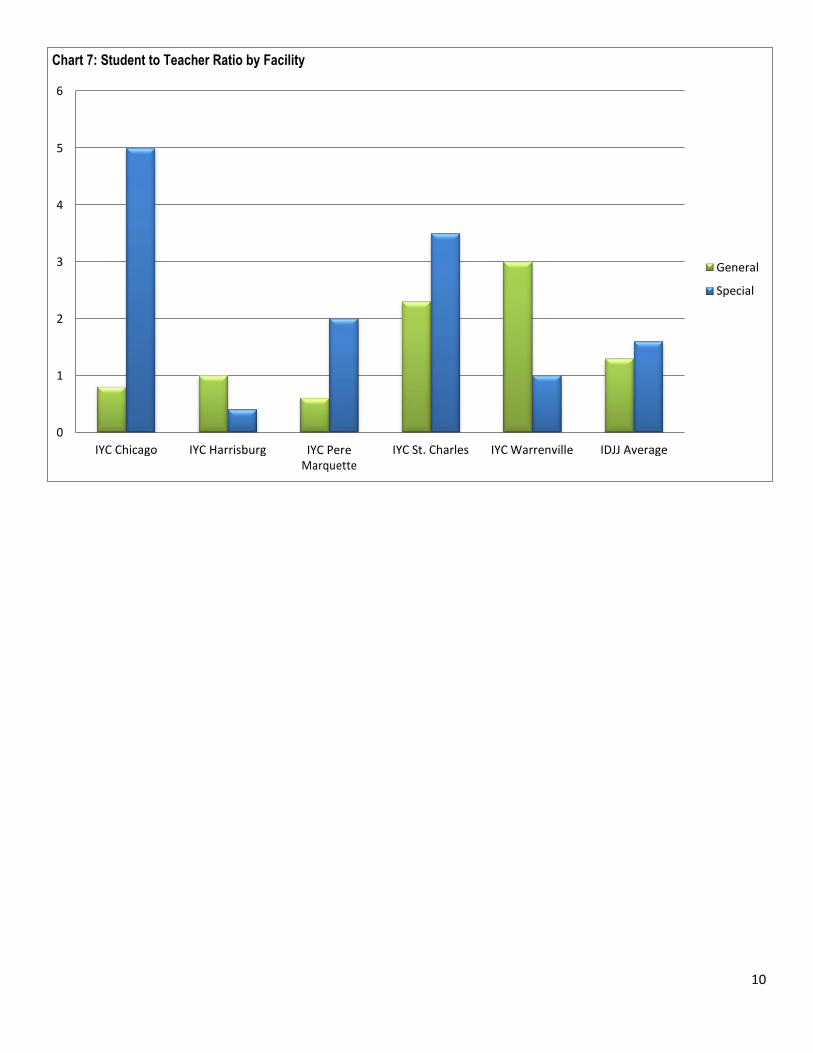
Table 15: General Education Student to Teacher Ratio 1/21 2/21 3/21 4/21 5/21 6/21 7/21
Chicago 1.2 0.8 0.8 0.5 0.4 1.2 0.8 Harrisburg 0.9 1.0 1.3 1.0 1.6 0.7 1.0
Pere Marquette 1.2 1.2 1.6 1.4 1.4 1.2 0.6 St. Charles 1.2 1.0 1.0 1.2 1.5 2.3 2.3 Warrenville 3.3 3.3 3.7 3.3 2.3 2.0 3.0
IDJJ Average 1.3 1.2 1.4 1.1 1.4 1.3 1.3
Table 16: Special Education Student to Teacher Ratio 1/21 2/21 3/21 4/21 5/21 6/21 7/21
Chicago 7.0 8.0 8.0 8.0 7.0 6.0 5.0 Harrisburg 4.6 4.2 4.2 4.0 2.0 3.4 0.4
Pere Marquette 7.0 4.0 7.0 4.0 5.0 1.0 2.0 St. Charles 3.0 4.0 3.0 3.5 2.5 2.0 3.5 Warrenville 1.0 2.0 2.0 7.0 3.0 3.0 1.0
IDJJ Average 4.1 4.1 4.2 4.7 3.0 3.1 1.6
According to the RJ Consent Decree, DJJ is required to have general education student to teacher ratios of 10 youth to 1 teacher and special education student to teacher ratios of 6 youth to 1 teacher.
9
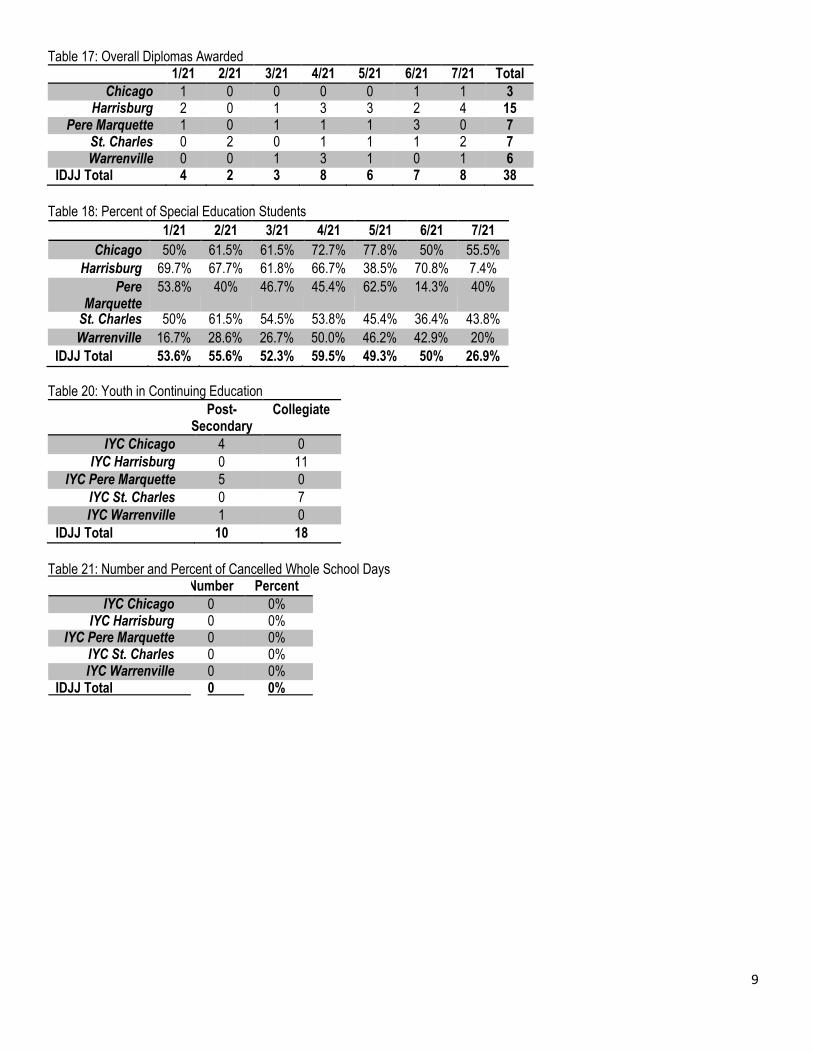
Table 17: Overall Diplomas Awarded 1/21 2/21 3/21 4/21 5/21 6/21 7/21 Total
Chicago 1 0 0 0 0 1 1 3 Harrisburg 2 0 1 3 3 2 4 15
Pere Marquette 1 0 1 1 1 3 0 7 St. Charles 0 2 0 1 1 1 2 7 Warrenville 0 0 1 3 1 0 1 6
IDJJ Total 4 2 3 8 6 7 8 38
Table 18: Percent of Special Education Students 1/21 2/21 3/21 4/21 5/21 6/21 7/21
Chicago 50% 61.5% 61.5% 72.7% 77.8% 50% 55.5% Harrisburg 69.7% 67.7% 61.8% 66.7% 38.5% 70.8% 7.4%
Pere Marquette
53.8% 40% 46.7% 45.4% 62.5% 14.3% 40%
St. Charles 50% 61.5% 54.5% 53.8% 45.4% 36.4% 43.8% Warrenville 16.7% 28.6% 26.7% 50.0% 46.2% 42.9% 20%
IDJJ Total 53.6% 55.6% 52.3% 59.5% 49.3% 50% 26.9%
Table 20: Youth in Continuing Education Post-
Secondary Collegiate
IYC Chicago 4 0 IYC Harrisburg 0 11
IYC Pere Marquette 5 0 IYC St. Charles 0 7 IYC Warrenville 1 0
IDJJ Total 10 18
Table 21: Number and Percent of Cancelled Whole School Days Number Percent
IYC Chicago 0 0% IYC Harrisburg 0 0%
IYC Pere Marquette 0 0% IYC St. Charles 0 0% IYC Warrenville 0 0%
IDJJ Total 0 0%
10
IDJJ Average IYC St. Charles IYC Warrenville IYC Pere Marquette
IYC Harrisburg IYC Chicago 0
1
2
General
Special
3
4
5
Chart 7: Student to Teacher Ratio by Facility
6
11
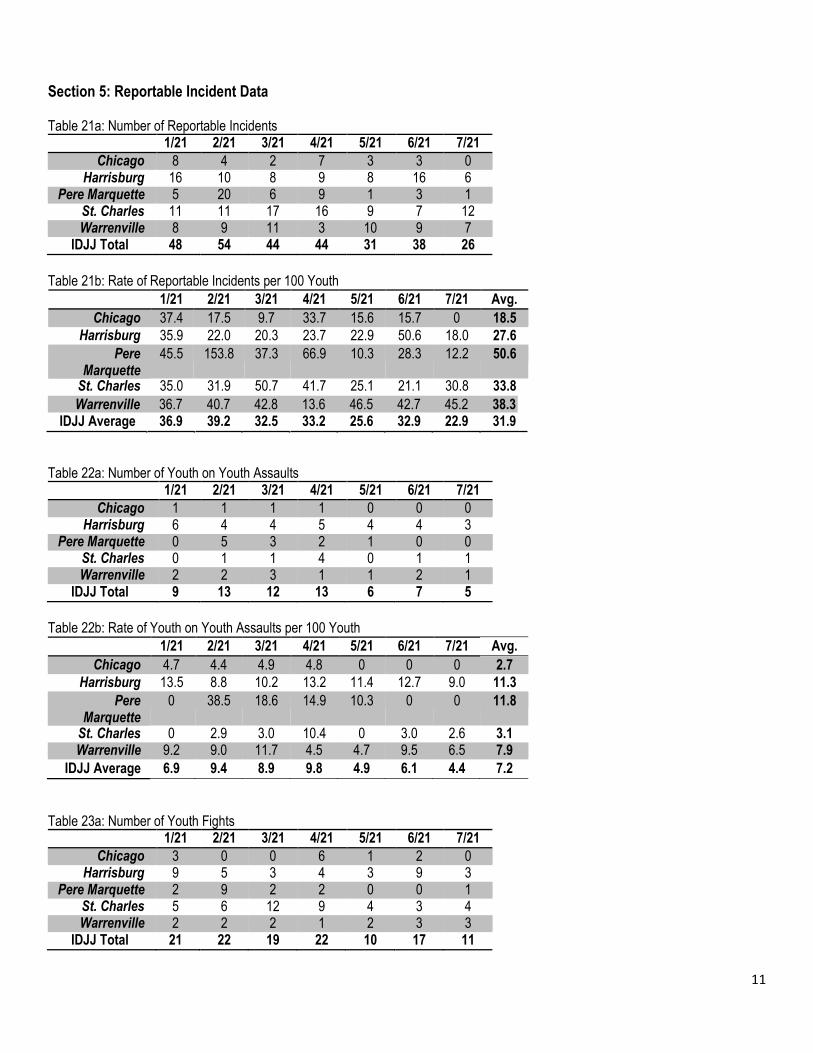
Section 5: Reportable Incident Data
Table 21a: Number of Reportable Incidents 1/21 2/21 3/21 4/21 5/21 6/21 7/21
Chicago 8 4 2 7 3 3 0 Harrisburg 16 10 8 9 8 16 6
Pere Marquette 5 20 6 9 1 3 1 St. Charles 11 11 17 16 9 7 12 Warrenville 8 9 11 3 10 9 7
IDJJ Total 48 54 44 44 31 38 26
Table 21b: Rate of Reportable Incidents per 100 Youth 1/21 2/21 3/21 4/21 5/21 6/21 7/21 Avg.
Chicago 37.4 17.5 9.7 33.7 15.6 15.7 0 18.5 Harrisburg 35.9 22.0 20.3 23.7 22.9 50.6 18.0 27.6
Pere Marquette
45.5 153.8 37.3 66.9 10.3 28.3 12.2 50.6
St. Charles 35.0 31.9 50.7 41.7 25.1 21.1 30.8 33.8 Warrenville 36.7 40.7 42.8 13.6 46.5 42.7 45.2 38.3
IDJJ Average 36.9 39.2 32.5 33.2 25.6 32.9 22.9 31.9
Table 22a: Number of Youth on Youth Assaults 1/21 2/21 3/21 4/21 5/21 6/21 7/21
Chicago 1 1 1 1 0 0 0 Harrisburg 6 4 4 5 4 4 3
Pere Marquette 0 5 3 2 1 0 0 St. Charles 0 1 1 4 0 1 1 Warrenville 2 2 3 1 1 2 1
IDJJ Total 9 13 12 13 6 7 5
Table 22b: Rate of Youth on Youth Assaults per 100 Youth 1/21 2/21 3/21 4/21 5/21 6/21 7/21 Avg.
Chicago 4.7 4.4 4.9 4.8 0 0 0 2.7 Harrisburg 13.5 8.8 10.2 13.2 11.4 12.7 9.0 11.3
Pere Marquette
0 38.5 18.6 14.9 10.3 0 0 11.8
St. Charles 0 2.9 3.0 10.4 0 3.0 2.6 3.1 Warrenville 9.2 9.0 11.7 4.5 4.7 9.5 6.5 7.9
IDJJ Average 6.9 9.4 8.9 9.8 4.9 6.1 4.4 7.2
Table 23a: Number of Youth Fights 1/21 2/21 3/21 4/21 5/21 6/21 7/21
Chicago 3 0 0 6 1 2 0 Harrisburg 9 5 3 4 3 9 3
Pere Marquette 2 9 2 2 0 0 1 St. Charles 5 6 12 9 4 3 4 Warrenville 2 2 2 1 2 3 3
IDJJ Total 21 22 19 22 10 17 11
12
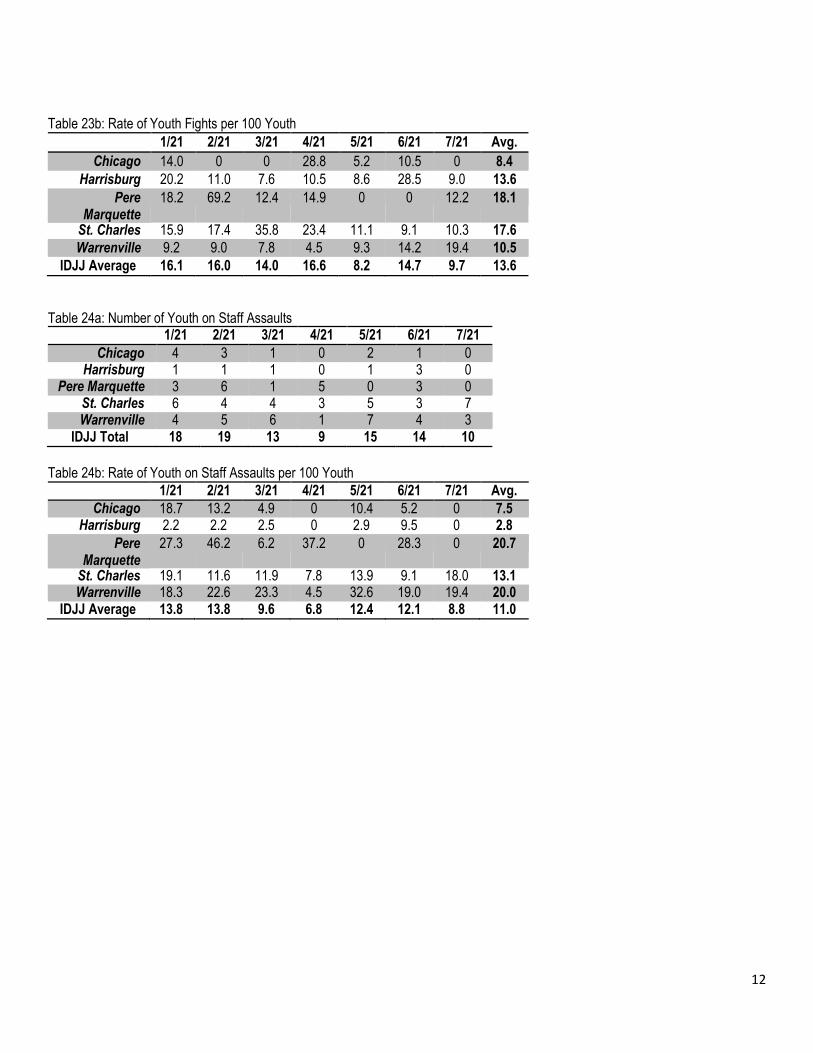
Table 23b: Rate of Youth Fights per 100 Youth 1/21 2/21 3/21 4/21 5/21 6/21 7/21 Avg.
Chicago 14.0 0 0 28.8 5.2 10.5 0 8.4 Harrisburg 20.2 11.0 7.6 10.5 8.6 28.5 9.0 13.6
Pere Marquette
18.2 69.2 12.4 14.9 0 0 12.2 18.1
St. Charles 15.9 17.4 35.8 23.4 11.1 9.1 10.3 17.6 Warrenville 9.2 9.0 7.8 4.5 9.3 14.2 19.4 10.5
IDJJ Average 16.1 16.0 14.0 16.6 8.2 14.7 9.7 13.6
Table 24a: Number of Youth on Staff Assaults 1/21 2/21 3/21 4/21 5/21 6/21 7/21
Chicago 4 3 1 0 2 1 0 Harrisburg 1 1 1 0 1 3 0
Pere Marquette 3 6 1 5 0 3 0 St. Charles 6 4 4 3 5 3 7 Warrenville 4 5 6 1 7 4 3
IDJJ Total 18 19 13 9 15 14 10
Table 24b: Rate of Youth on Staff Assaults per 100 Youth 1/21 2/21 3/21 4/21 5/21 6/21 7/21 Avg.
Chicago 18.7 13.2 4.9 0 10.4 5.2 0 7.5 Harrisburg 2.2 2.2 2.5 0 2.9 9.5 0 2.8
Pere Marquette
27.3 46.2 6.2 37.2 0 28.3 0 20.7
St. Charles 19.1 11.6 11.9 7.8 13.9 9.1 18.0 13.1 Warrenville 18.3 22.6 23.3 4.5 32.6 19.0 19.4 20.0
IDJJ Average 13.8 13.8 9.6 6.8 12.4 12.1 8.8 11.0
13
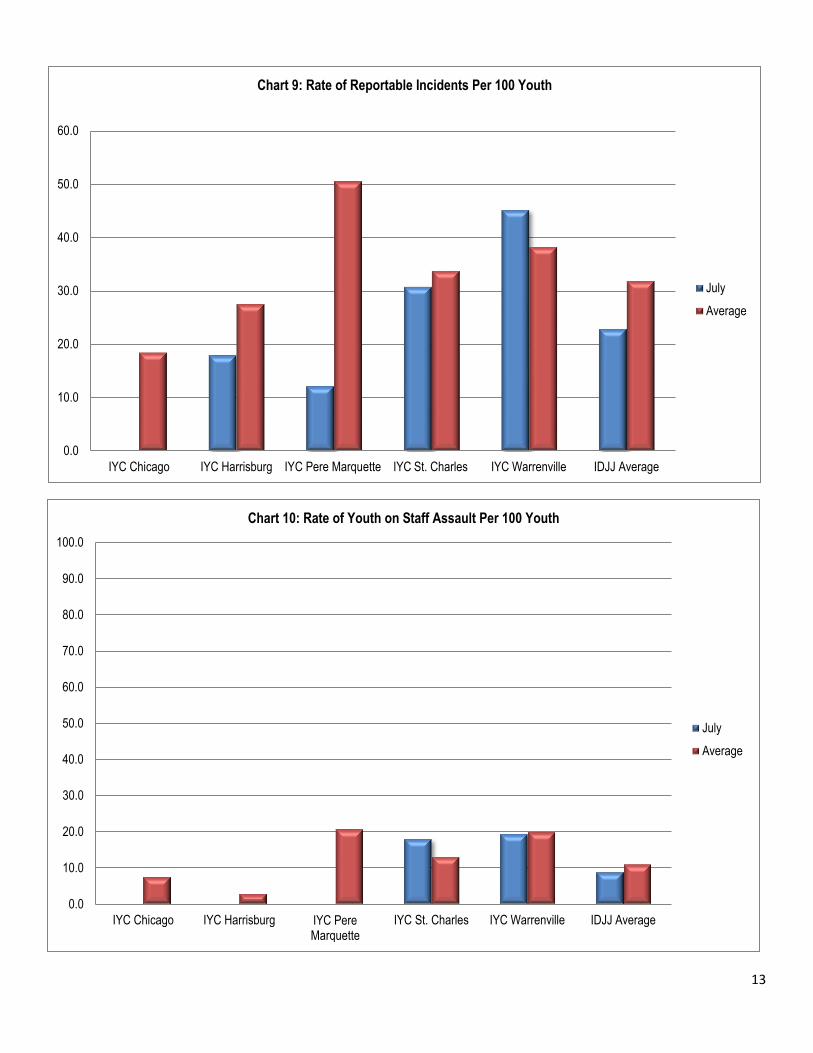
Chart 9: Rate of Reportable Incidents Per 100 Youth
60.0
50.0
40.0
30.0 July Average
20.0
10.0
0.0 IYC Chicago IYC Harrisburg IYC Pere Marquette IYC St. Charles IYC Warrenville IDJJ Average
Chart 10: Rate of Youth on Staff Assault Per 100 Youth 100.0
90.0
80.0
70.0
60.0
50.0
40.0
July Average
30.0 20.0 10.0
0.0 IYC Chicago IYC Harrisburg IYC Pere
Marquette IYC St. Charles IYC Warrenville IDJJ Average
14
Section 6: Indicator Data
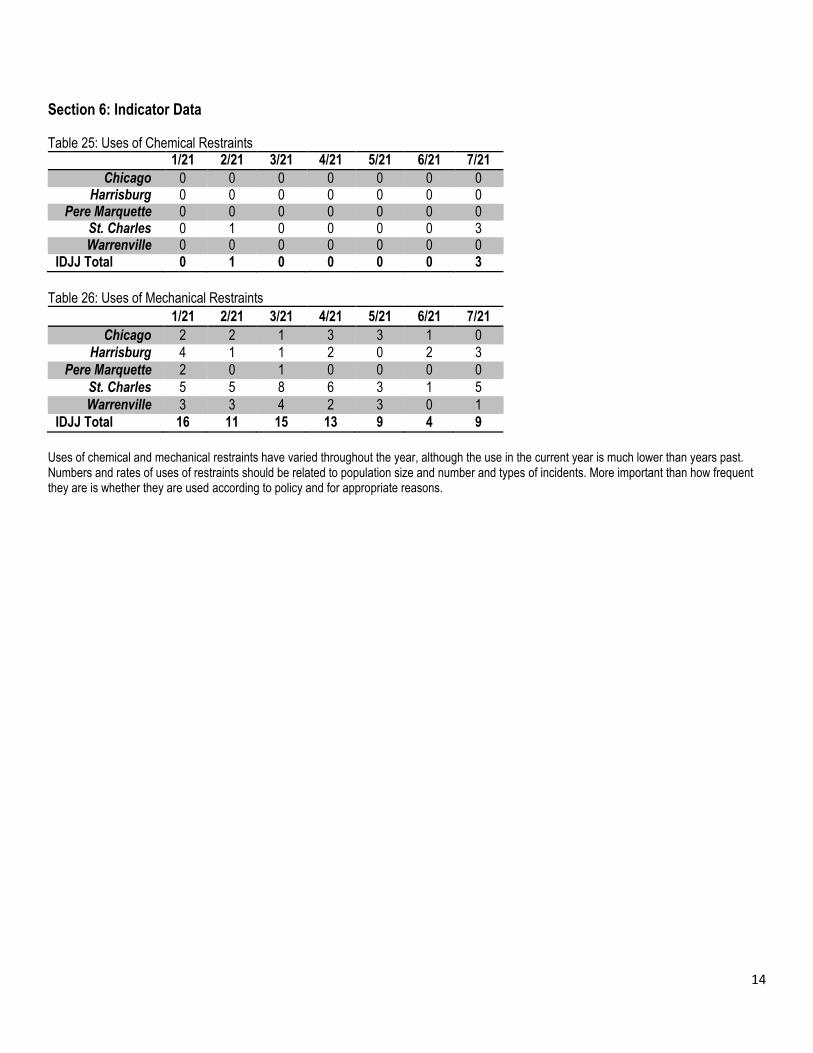
Table 25: Uses of Chemical Restraints 1/21 2/21 3/21 4/21 5/21 6/21 7/21
Chicago 0 0 0 0 0 0 0 Harrisburg 0 0 0 0 0 0 0
Pere Marquette 0 0 0 0 0 0 0 St. Charles 0 1 0 0 0 0 3 Warrenville 0 0 0 0 0 0 0
IDJJ Total 0 1 0 0 0 0 3
Table 26: Uses of Mechanical Restraints 1/21 2/21 3/21 4/21 5/21 6/21 7/21
Chicago 2 2 1 3 3 1 0 Harrisburg 4 1 1 2 0 2 3
Pere Marquette 2 0 1 0 0 0 0 St. Charles 5 5 8 6 3 1 5 Warrenville 3 3 4 2 3 0 1
IDJJ Total 16 11 15 13 9 4 9
Uses of chemical and mechanical restraints have varied throughout the year, although the use in the current year is much lower than years past. Numbers and rates of uses of restraints should be related to population size and number and types of incidents. More important than how frequent they are is whether they are used according to policy and for appropriate reasons.
15
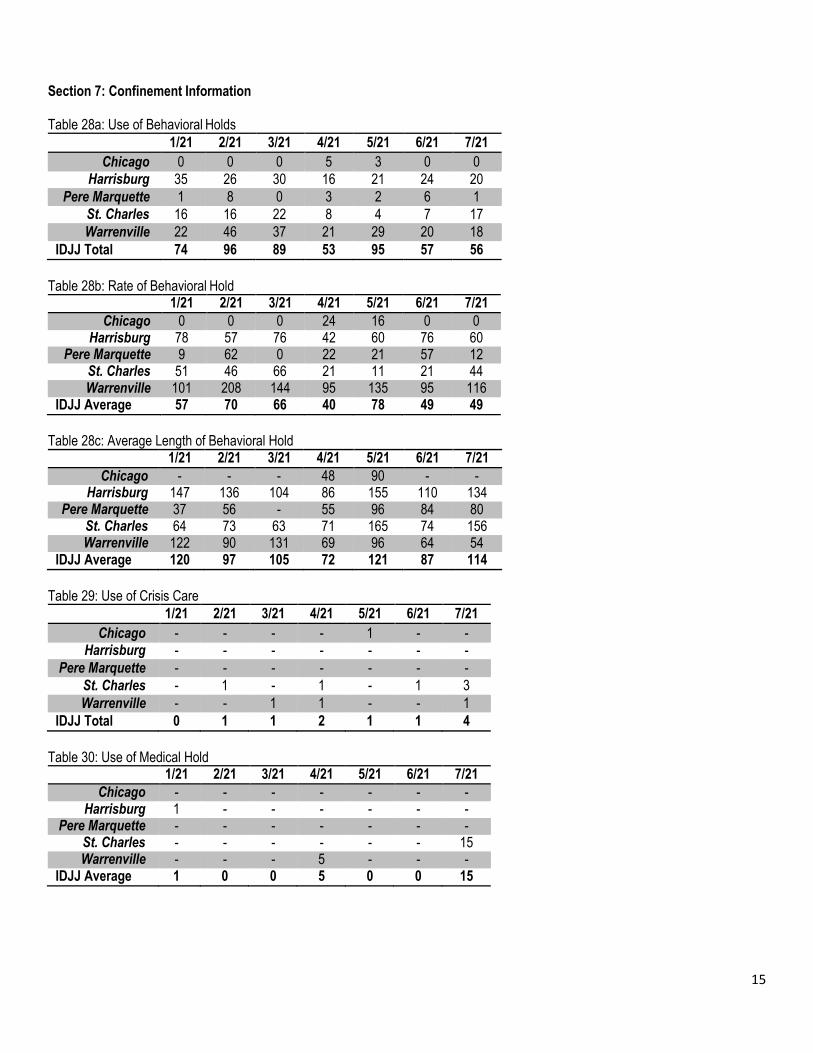
Section 7: Confinement Information
Table 28a: Use of Behavioral Holds 1/21 2/21 3/21 4/21 5/21 6/21 7/21
Chicago 0 0 0 5 3 0 0 Harrisburg 35 26 30 16 21 24 20
Pere Marquette 1 8 0 3 2 6 1 St. Charles 16 16 22 8 4 7 17 Warrenville 22 46 37 21 29 20 18
IDJJ Total 74 96 89 53 95 57 56
Table 28b: Rate of Behavioral Hold 1/21 2/21 3/21 4/21 5/21 6/21 7/21
Chicago 0 0 0 24 16 0 0 Harrisburg 78 57 76 42 60 76 60
Pere Marquette 9 62 0 22 21 57 12 St. Charles 51 46 66 21 11 21 44 Warrenville 101 208 144 95 135 95 116
IDJJ Average 57 70 66 40 78 49 49
Table 28c: Average Length of Behavioral Hold 1/21 2/21 3/21 4/21 5/21 6/21 7/21
Chicago - - - 48 90 - - Harrisburg 147 136 104 86 155 110 134
Pere Marquette 37 56 - 55 96 84 80 St. Charles 64 73 63 71 165 74 156 Warrenville 122 90 131 69 96 64 54
IDJJ Average 120 97 105 72 121 87 114
Table 29: Use of Crisis Care 1/21 2/21 3/21 4/21 5/21 6/21 7/21
Chicago - - - - 1 - - Harrisburg - - - - - - -
Pere Marquette - - - - - - - St. Charles - 1 - 1 - 1 3 Warrenville - - 1 1 - - 1
IDJJ Total 0 1 1 2 1 1 4
Table 30: Use of Medical Hold 1/21 2/21 3/21 4/21 5/21 6/21 7/21
Chicago - - - - - - - Harrisburg 1 - - - - - -
Pere Marquette - - - - - - - St. Charles - - - - - - 15 Warrenville - - - 5 - - -
IDJJ Average 1 0 0 5 0 0 15
16
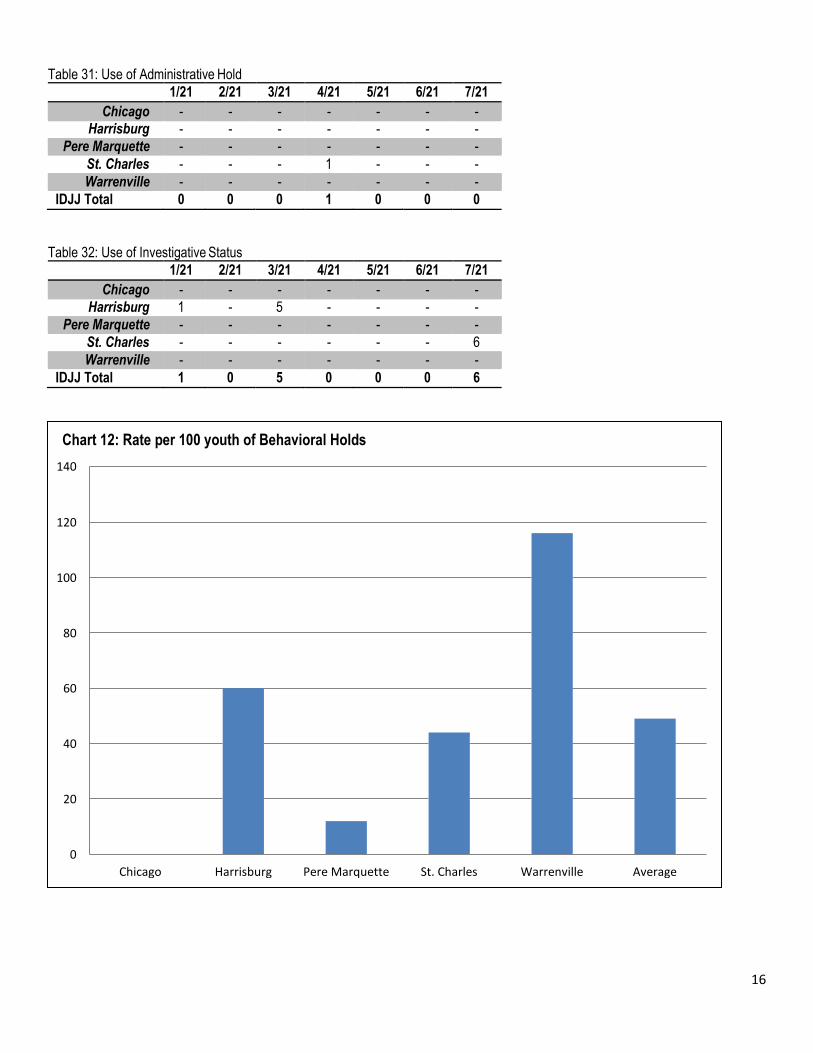
Table 31: Use of Administrative Hold 1/21 2/21 3/21 4/21 5/21 6/21 7/21
Chicago - - - - - - - Harrisburg - - - - - - -
Pere Marquette - - - - - - - St. Charles - - - 1 - - - Warrenville - - - - - - -
IDJJ Total 0 0 0 1 0 0 0
Table 32: Use of Investigative Status 1/21 2/21 3/21 4/21 5/21 6/21 7/21
Chicago - - - - - - - Harrisburg 1 - 5 - - - -
Pere Marquette - - - - - - - St. Charles - - - - - - 6 Warrenville - - - - - - -
IDJJ Total 1 0 5 0 0 0 6
Chart 12: Rate per 100 youth of Behavioral Holds 140
120
100
80
60
40
20
0 Chicago Harrisburg Pere Marquette St. Charles Warrenville Average
17
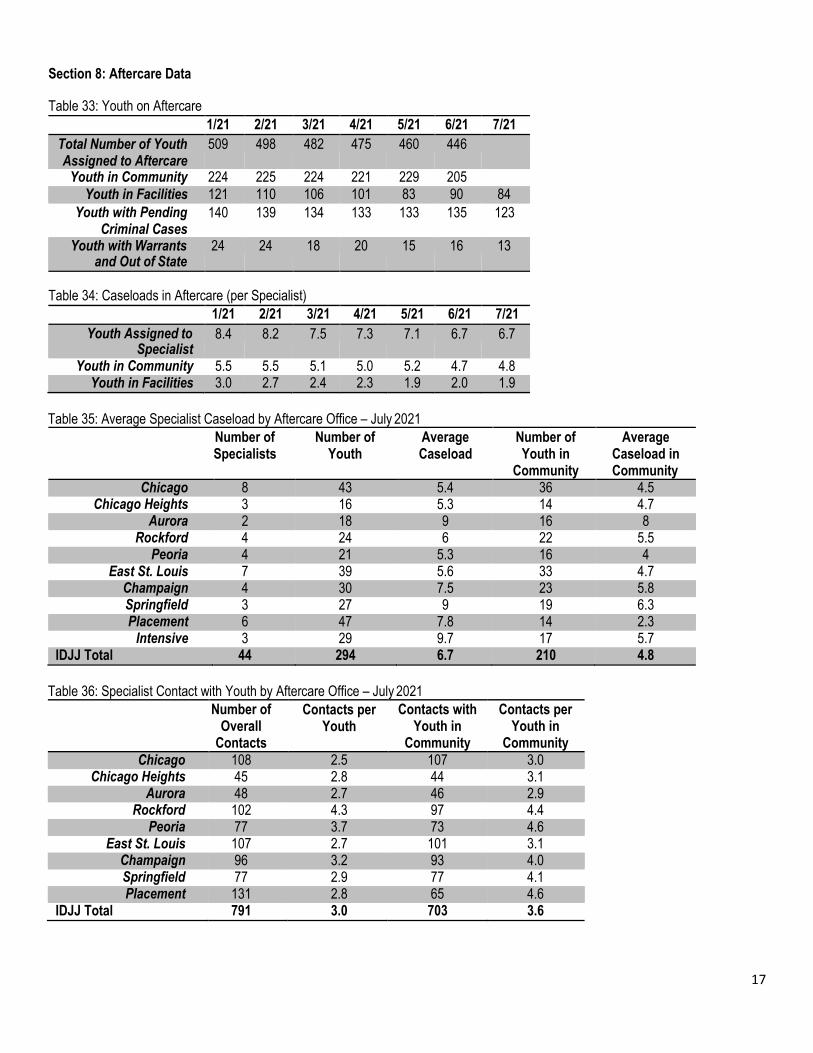
Section 8: Aftercare Data Table 33: Youth on Aftercare
1/21 2/21 3/21 4/21 5/21 6/21 7/21 Total Number of Youth Assigned to Aftercare
509 498 482 475 460 446
Youth in Community 224 225 224 221 229 205 Youth in Facilities 121 110 106 101 83 90 84
Youth with Pending Criminal Cases
140 139 134 133 133 135 123
Youth with Warrants and Out of State
24 24 18 20 15 16 13
Table 34: Caseloads in Aftercare (per Specialist) 1/21 2/21 3/21 4/21 5/21 6/21 7/21
Youth Assigned to Specialist
8.4 8.2 7.5 7.3 7.1 6.7 6.7
Youth in Community 5.5 5.5 5.1 5.0 5.2 4.7 4.8 Youth in Facilities 3.0 2.7 2.4 2.3 1.9 2.0 1.9
Table 35: Average Specialist Caseload by Aftercare Office – July 2021 Number of
Specialists Number of
Youth Average Caseload
Number of Youth in
Community
Average Caseload in Community
Chicago 8 43 5.4 36 4.5 Chicago Heights 3 16 5.3 14 4.7
Aurora 2 18 9 16 8 Rockford 4 24 6 22 5.5
Peoria 4 21 5.3 16 4 East St. Louis 7 39 5.6 33 4.7
Champaign 4 30 7.5 23 5.8 Springfield 3 27 9 19 6.3 Placement 6 47 7.8 14 2.3
Intensive 3 29 9.7 17 5.7 IDJJ Total 44 294 6.7 210 4.8
Table 36: Specialist Contact with Youth by Aftercare Office – July 2021 Number of
Overall Contacts
Contacts per Youth
Contacts with Youth in
Community
Contacts per Youth in
Community Chicago 108 2.5 107 3.0
Chicago Heights 45 2.8 44 3.1 Aurora 48 2.7 46 2.9
Rockford 102 4.3 97 4.4 Peoria 77 3.7 73 4.6
East St. Louis 107 2.7 101 3.1 Champaign 96 3.2 93 4.0 Springfield 77 2.9 77 4.1 Placement 131 2.8 65 4.6
IDJJ Total 791 3.0 703 3.6
18
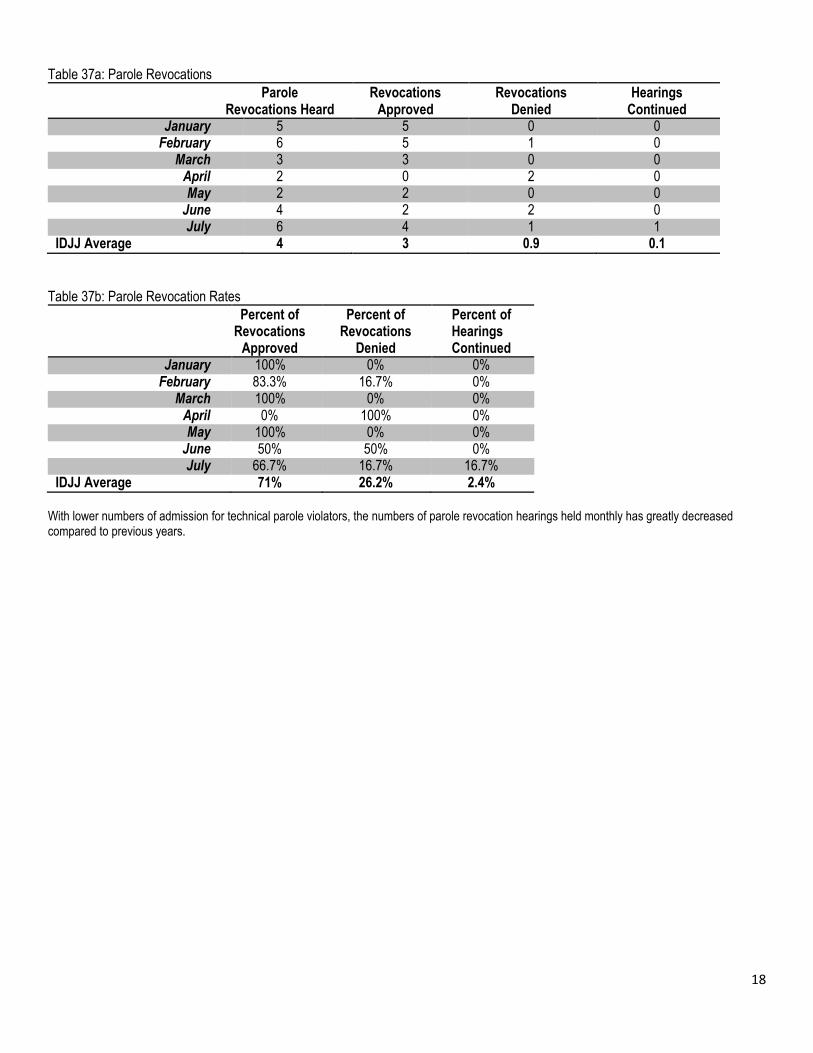
Table 37a: Parole Revocations Parole
Revocations Heard Revocations
Approved Revocations
Denied Hearings
Continued January 5 5 0 0
February 6 5 1 0 March 3 3 0 0
April 2 0 2 0 May 2 2 0 0
June 4 2 2 0 July 6 4 1 1
IDJJ Average 4 3 0.9 0.1
Table 37b: Parole Revocation Rates Percent of
Revocations Approved
Percent of Revocations
Denied
Percent of Hearings Continued
January 100% 0% 0% February 83.3% 16.7% 0%
March 100% 0% 0% April 0% 100% 0% May 100% 0% 0%
June 50% 50% 0% July 66.7% 16.7% 16.7%
IDJJ Average 71% 26.2% 2.4%
With lower numbers of admission for technical parole violators, the numbers of parole revocation hearings held monthly has greatly decreased compared to previous years.
19
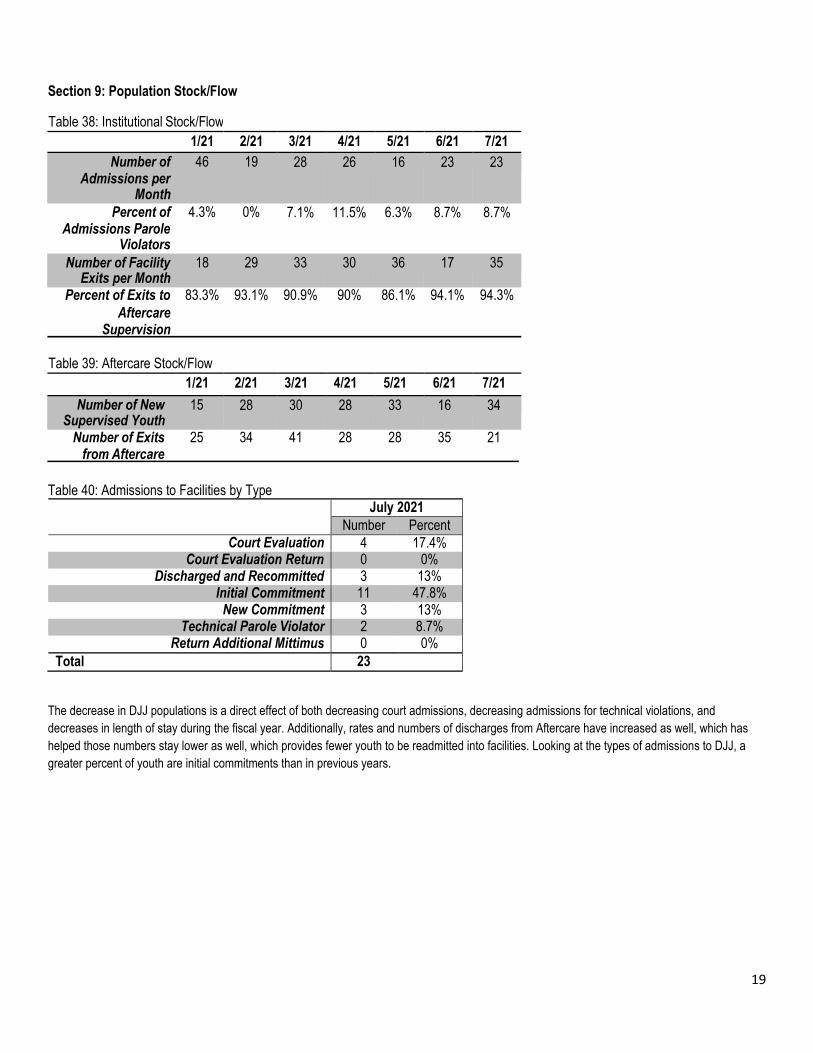
Section 9: Population Stock/Flow
Table 38: Institutional Stock/Flow 1/21 2/21 3/21 4/21 5/21 6/21 7/21
Number of 46 19 Admissions per
Month
28 26 16 23 23
Percent of 4.3% 0% Admissions Parole
Violators
7.1% 11.5% 6.3% 8.7% 8.7%
Number of Facility 18 29 Exits per Month
33 30 36 17 35
Percent of Exits to 83.3% 93.1% 90.9% 90% 86.1% 94.1% 94.3% Aftercare
Supervision
Table 39: Aftercare Stock/Flow
1/21 2/21 3/21 4/21 5/21 6/21 7/21 Number of New 15
Supervised Youth 28 30 28 33 16 34
Number of Exits 25 34 41 28 28 35 21 from Aftercare
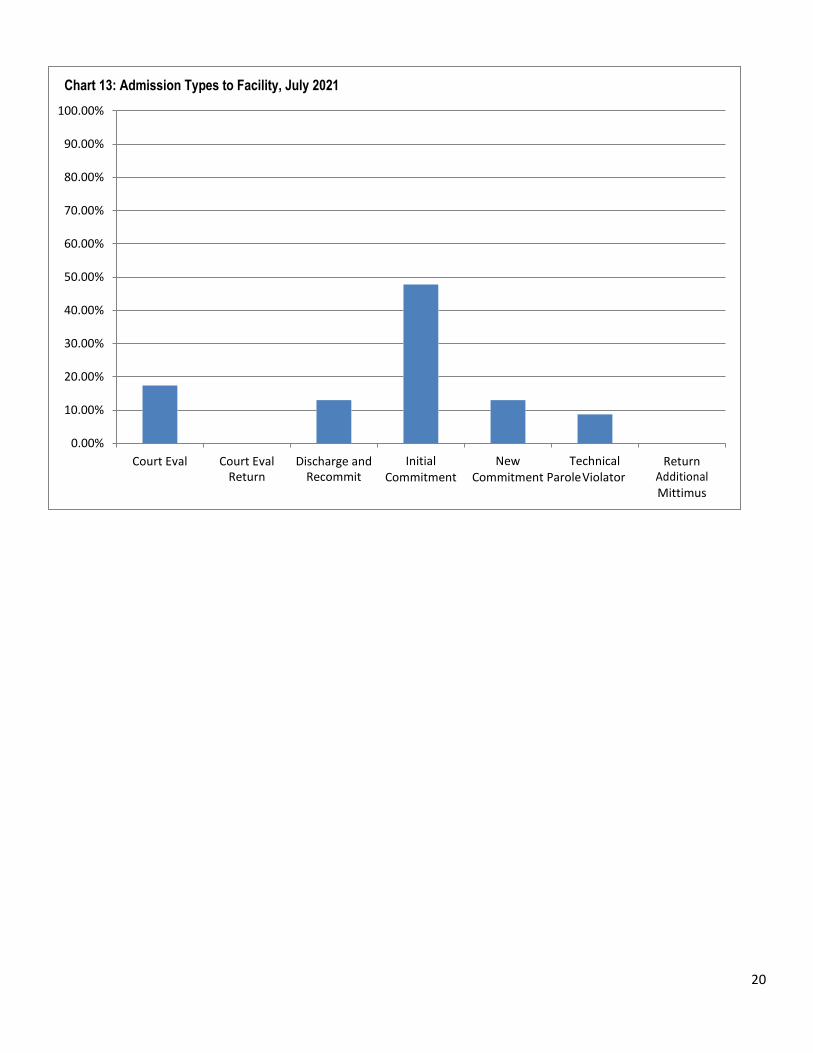
Table 40: Admissions to Facilities by Type July 2021
Number Percent Court Evaluation 4 17.4%
Court Evaluation Return 0 0% Discharged and Recommitted 3 13%
Initial Commitment 11 47.8% New Commitment 3 13%
Technical Parole Violator 2 8.7% Return Additional Mittimus 0 0%
Total 23
The decrease in DJJ populations is a direct effect of both decreasing court admissions, decreasing admissions for technical violations, and decreases in length of stay during the fiscal year. Additionally, rates and numbers of discharges from Aftercare have increased as well, which has helped those numbers stay lower as well, which provides fewer youth to be readmitted into facilities. Looking at the types of admissions to DJJ, a greater percent of youth are initial commitments than in previous years.
20
Chart 13: Admission Types to Facility, July 2021 100.00%
90.00%
80.00%
70.00%
60.00%
50.00%
40.00%
30.00%
20.00%
10.00%
0.00% Court Eval Court Eval
Return Discharge and
Recommit Initial New Technical
Commitment Commitment Parole Violator Return
Additional Mittimus
21
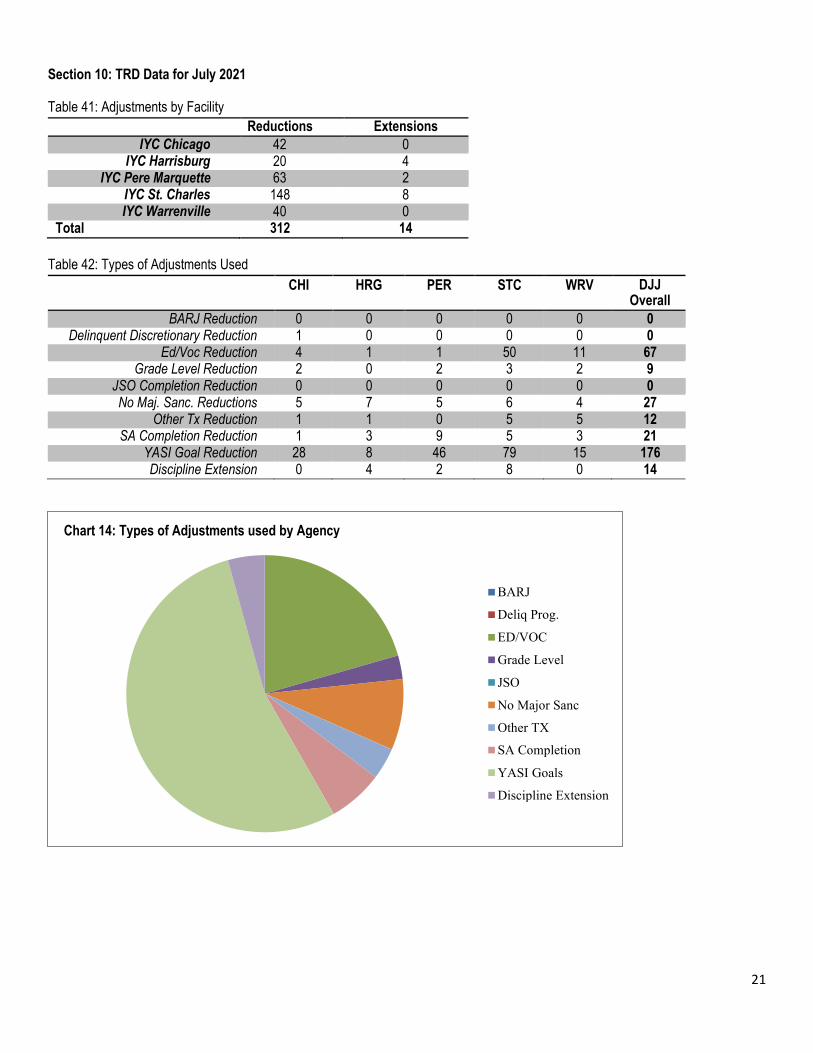
Section 10: TRD Data for July 2021
Table 41: Adjustments by Facility Reductions Extensions
IYC Chicago 42 0 IYC Harrisburg 20 4
IYC Pere Marquette 63 2 IYC St. Charles 148 8 IYC Warrenville 40 0
Total 312 14
Table 42: Types of Adjustments Used CHI HRG PER STC WRV DJJ
Overall BARJ Reduction 0 0 0 0 0 0
Delinquent Discretionary Reduction 1 0 0 0 0 0 Ed/Voc Reduction 4 1 1 50 11 67
Grade Level Reduction 2 0 2 3 2 9 JSO Completion Reduction 0 0 0 0 0 0 No Maj. Sanc. Reductions 5 7 5 6 4 27
Other Tx Reduction 1 1 0 5 5 12 SA Completion Reduction 1 3 9 5 3 21
YASI Goal Reduction 28 8 46 79 15 176 Discipline Extension 0 4 2 8 0 14
Chart 14: Types of Adjustments used by Agency
BARJ
Deliq Prog.
ED/VOC
Grade Level
JSO
No Major Sanc
Other TX
SA Completion
YASI Goals
Discipline Extension
22
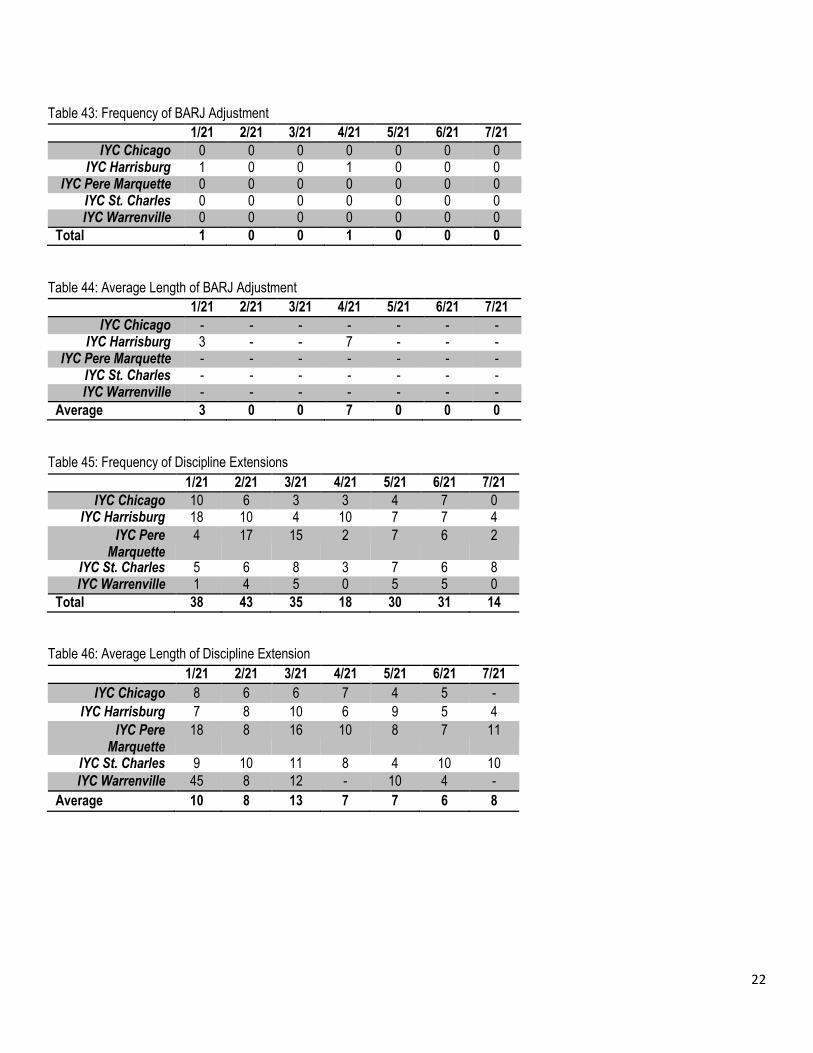
Table 43: Frequency of BARJ Adjustment 1/21 2/21 3/21 4/21 5/21 6/21 7/21
IYC Chicago 0 0 0 0 0 0 0 IYC Harrisburg 1 0 0 1 0 0 0
IYC Pere Marquette 0 0 0 0 0 0 0 IYC St. Charles 0 0 0 0 0 0 0 IYC Warrenville 0 0 0 0 0 0 0
Total 1 0 0 1 0 0 0
Table 44: Average Length of BARJ Adjustment 1/21 2/21 3/21 4/21 5/21 6/21 7/21
IYC Chicago - - - - - - - IYC Harrisburg 3 - - 7 - - -
IYC Pere Marquette - - - - - - - IYC St. Charles - - - - - - - IYC Warrenville - - - - - - -
Average 3 0 0 7 0 0 0
Table 45: Frequency of Discipline Extensions 1/21 2/21 3/21 4/21 5/21 6/21 7/21
IYC Chicago 10 6 3 3 4 7 0 IYC Harrisburg 18 10 4 10 7 7 4
IYC Pere Marquette
4 17 15 2 7 6 2
IYC St. Charles 5 6 8 3 7 6 8 IYC Warrenville 1 4 5 0 5 5 0
Total 38 43 35 18 30 31 14
Table 46: Average Length of Discipline Extension 1/21 2/21 3/21 4/21 5/21 6/21 7/21
IYC Chicago 8 6 6 7 4 5 - IYC Harrisburg 7 8 10 6 9 5 4
IYC Pere Marquette
18 8 16 10 8 7 11
IYC St. Charles 9 10 11 8 4 10 10 IYC Warrenville 45 8 12 - 10 4 -
Average 10 8 13 7 7 6 8
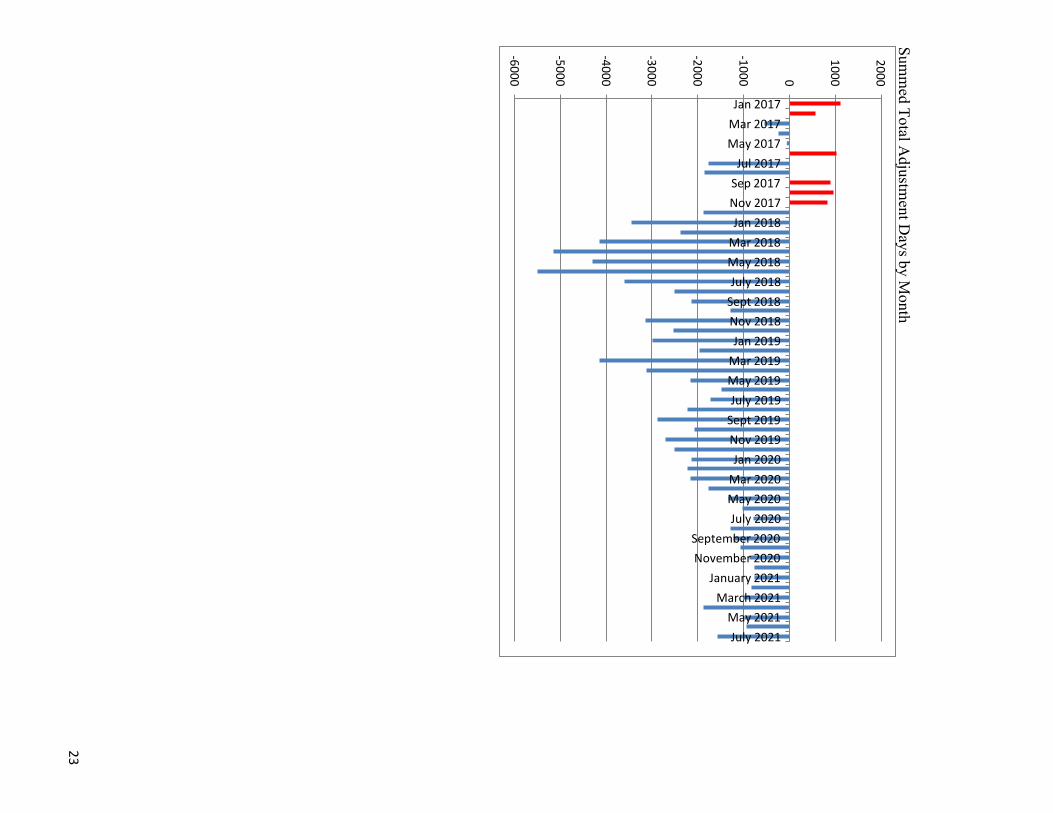
Jan 2017 Mar 2017 May 2017
Jul 2017 Sep 2017 Nov 2017 Jan 2018
Mar 2018 May 2018 July 2018
Sept 2018 Nov 2018 Jan 2019
Mar 2019 May 2019 July 2019
Sept 2019 Nov 2019 Jan 2020
Mar 2020 May 2020 July 2020
September 2020 November 2020
January 2021 March 2021
May 2021 July 2021
Summ
ed Total Adjustm
ent Days by M
onth 2000
1000 0
-1000
-2000
-3000
-4000
-5000
-6000
23
24
Section 11: YASI
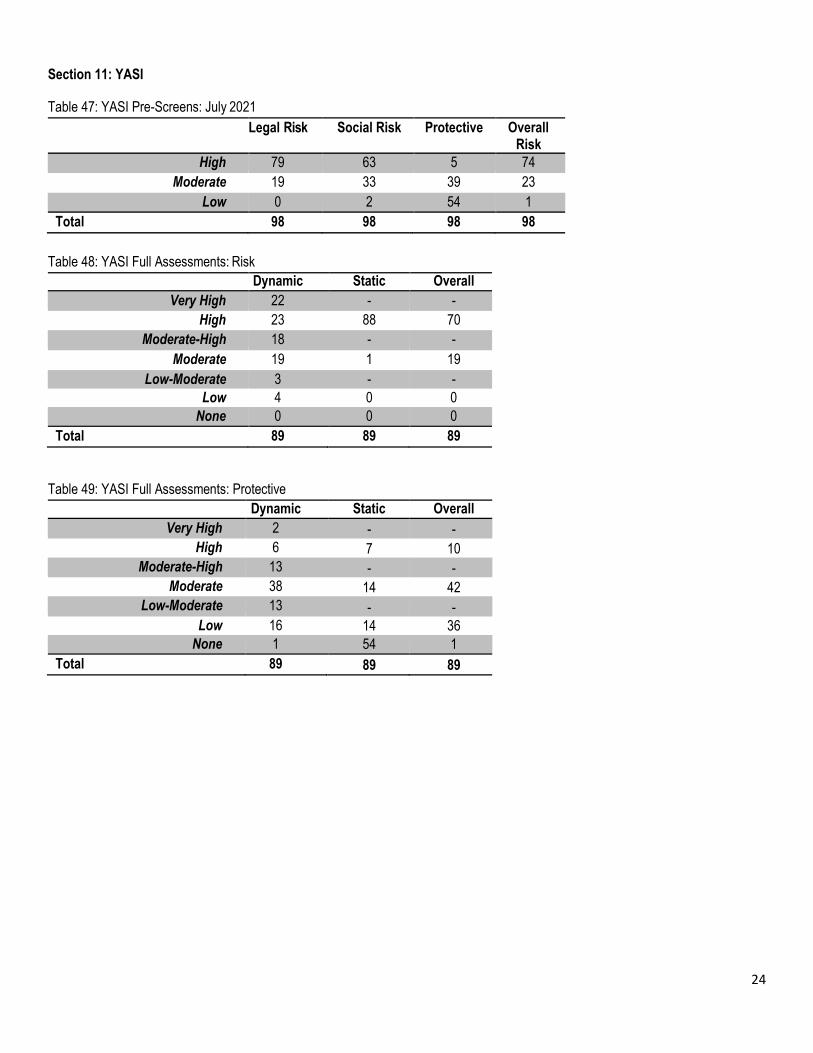
Table 47: YASI Pre-Screens: July 2021 Legal Risk Social Risk Protective Overall
Risk High 79 63 5 74
Moderate 19 33 39 23 Low 0 2 54 1
Total 98 98 98 98
Table 48: YASI Full Assessments: Risk Dynamic Static Overall
Very High 22 - - High 23 88 70
Moderate-High 18 - - Moderate 19 1 19
Low-Moderate 3 - - Low 4 0 0
None 0 0 0 Total 89 89 89
Table 49: YASI Full Assessments: Protective Dynamic Static Overall
Very High 2 - - High 6 7 10
Moderate-High 13 - - Moderate 38 14 42
Low-Moderate 13 - - Low 16 14 36
None 1 54 1 Total 89 89 89
25
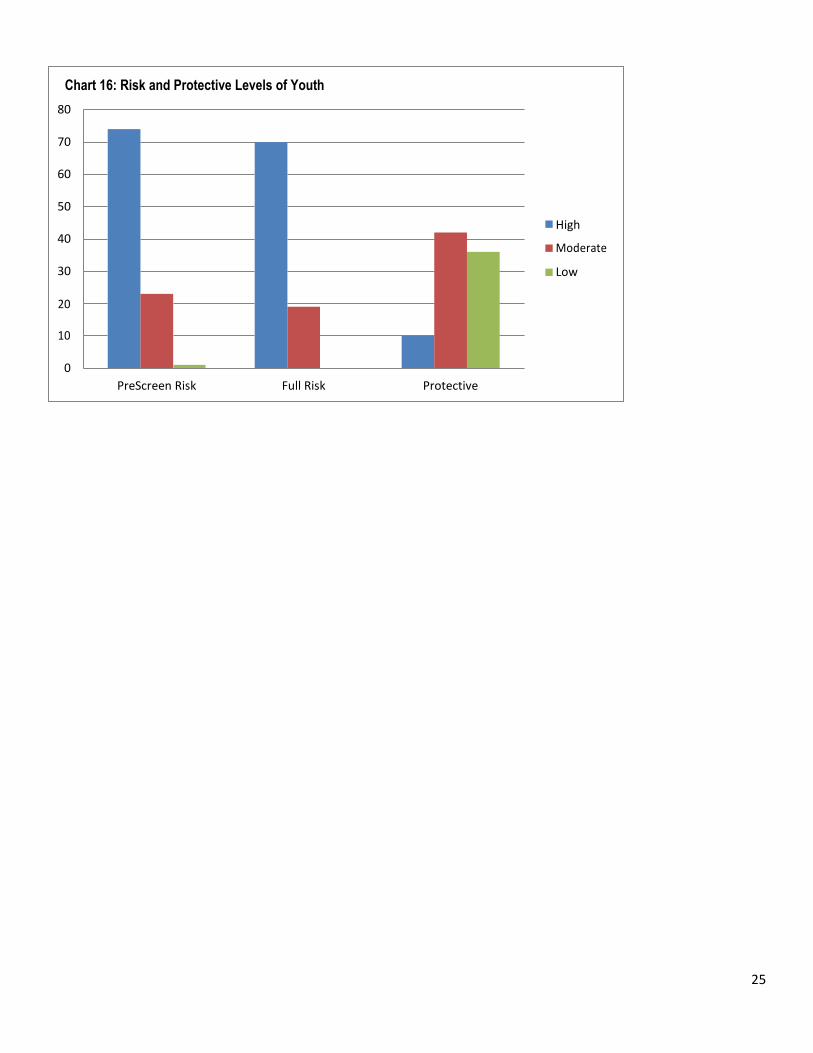
Chart 16: Risk and Protective Levels of Youth 80 70 60 50 40 30
High
Moderate
Low
20 10
0 PreScreen Risk Full Risk Protective
26
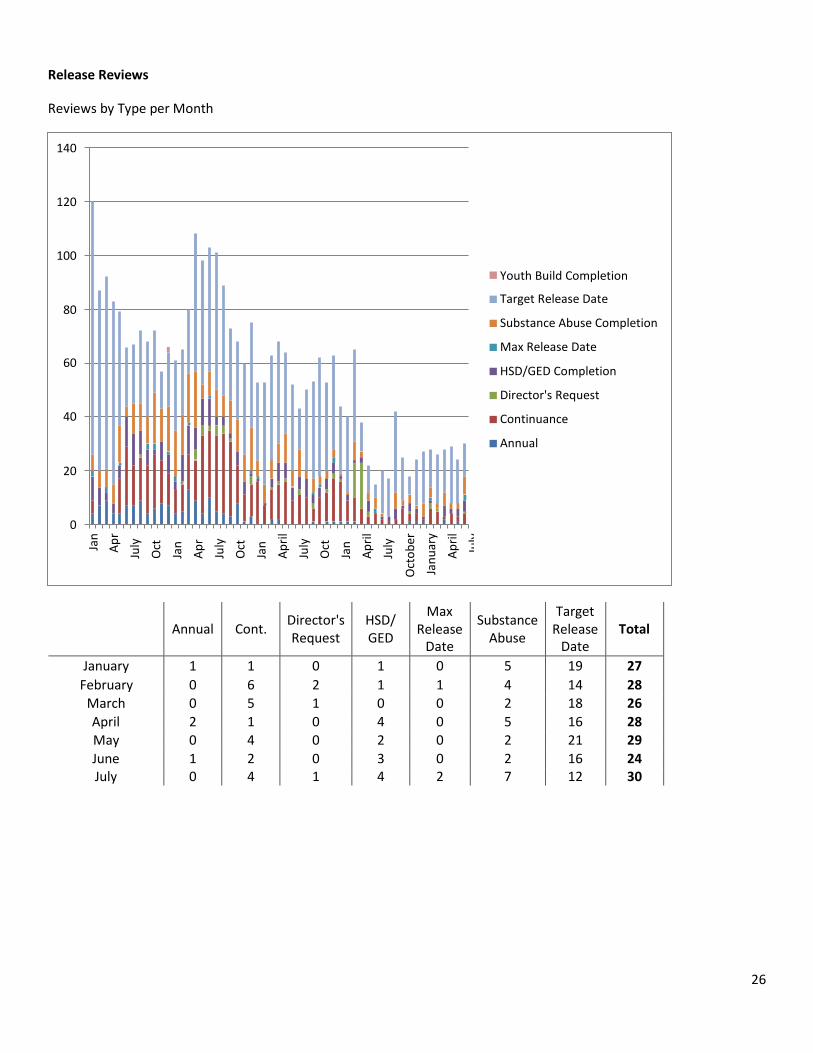
Release Reviews
Reviews by Type per Month
Annual
Cont. Director's
Request HSD/ GED
Max Release
Date
Substance Abuse
Target Release
Date
Total
January 1 1 0 1 0 5 19 27 February 0 6 2 1 1 4 14 28
March 0 5 1 0 0 2 18 26 April 2 1 0 4 0 5 16 28 May 0 4 0 2 0 2 21 29 June 1 2 0 3 0 2 16 24 July 0 4 1 4 2 7 12 30
140
120
100
80 60 40
Youth Build Completion
Target Release Date
Substance Abuse Completion
Max Release Date
HSD/GED Completion
Director's Request
Continuance
Annual
20
0
Jan
Apr
July
Oct
Jan
Apr
July
Oct
Jan
April
July
Oct
Jan
April
July
Oct
ober
Janu
ary
April
July
01/2017 03/2017 05/2017 07/2017 09/2017 11/2017 01/2018 03/2018 05/2018 07/2018 09/2018 11/2018 01/2019 03/2019 05/2019 07/2019 09/2019 11/2019 01/2020 03/2020 05/2020 07/2020 09/2020 11/2020 01/2021 03/2021 05/2021 07/2021
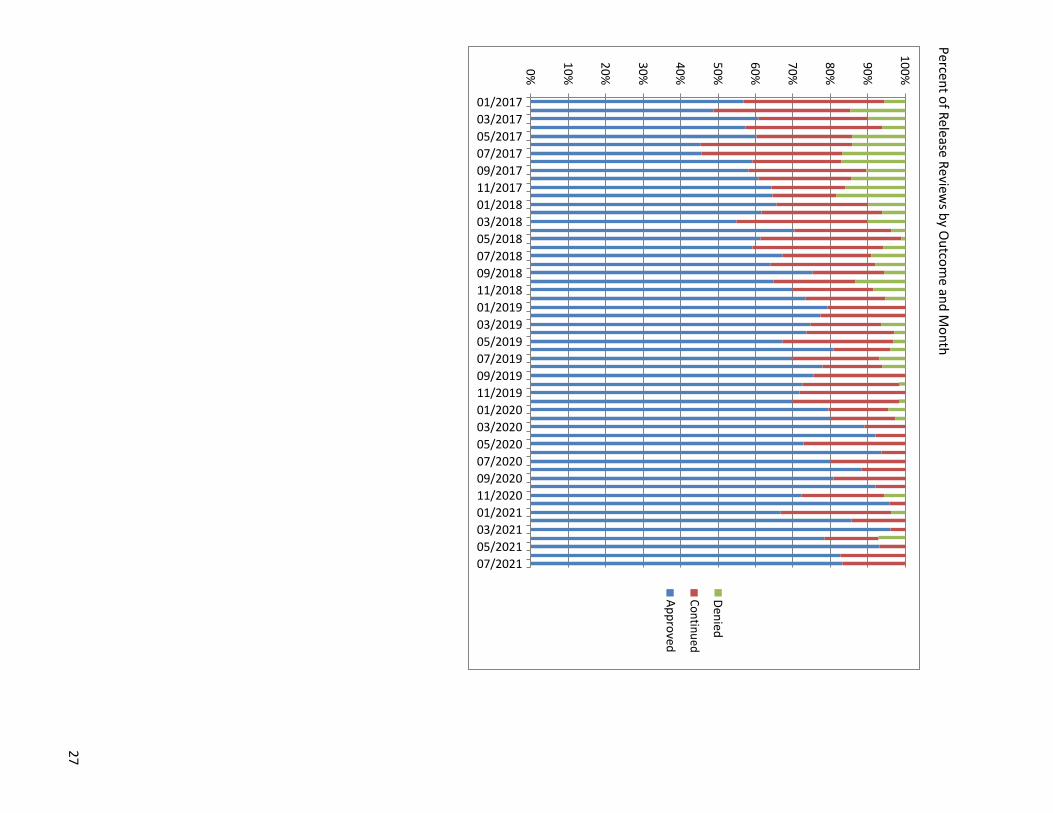
Percent of Release Reviews by O
utcome and M
onth
100%
90%
80%
70%
60%
50%
Denied
Continued
Approved 40%
30%
20%
10%
0%
27
28
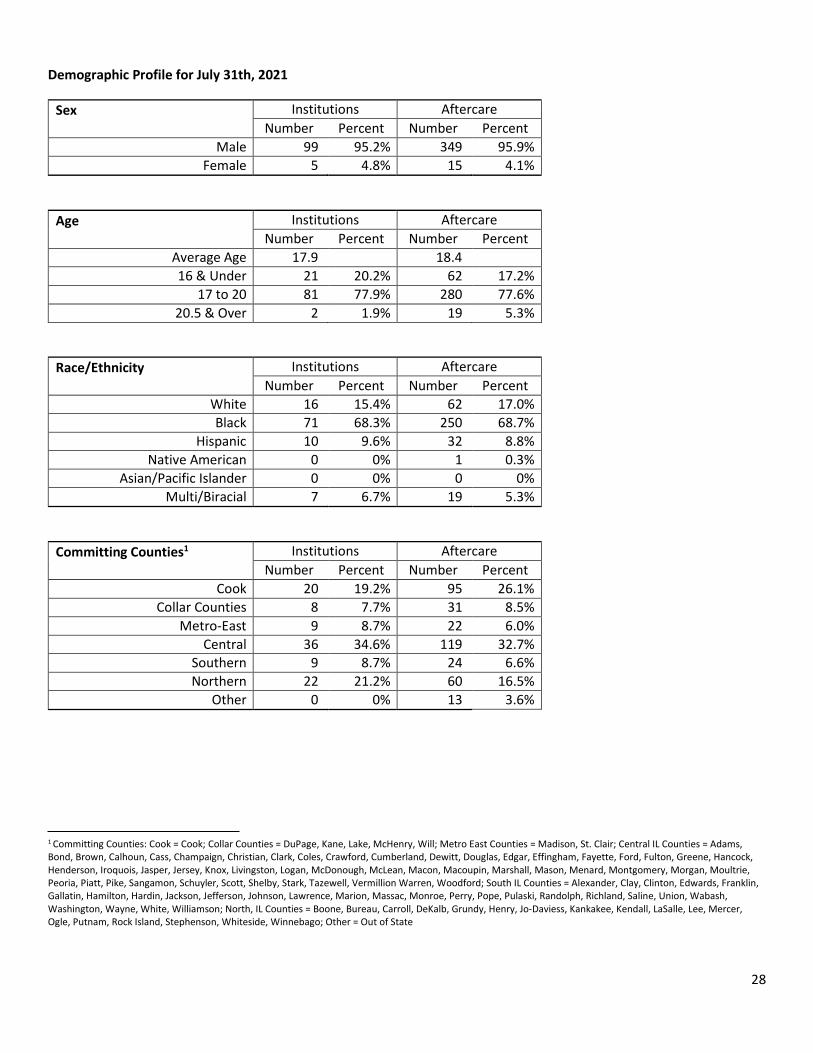
Demographic Profile for July 31th, 2021
Sex Institutions Aftercare Number Percent Number Percent
Male 99 95.2% 349 95.9% Female 5 4.8% 15 4.1%
Age Institutions Aftercare Number Percent Number Percent
Average Age 17.9 18.4 16 & Under 21 20.2% 62 17.2%
17 to 20 81 77.9% 280 77.6% 20.5 & Over 2 1.9% 19 5.3%
Race/Ethnicity Institutions Aftercare Number Percent Number Percent
White 16 15.4% 62 17.0% Black 71 68.3% 250 68.7%
Hispanic 10 9.6% 32 8.8% Native American 0 0% 1 0.3%
Asian/Pacific Islander 0 0% 0 0% Multi/Biracial 7 6.7% 19 5.3%
Committing Counties1 Institutions Aftercare Number Percent Number Percent
Cook 20 19.2% 95 26.1% Collar Counties 8 7.7% 31 8.5%
Metro-East 9 8.7% 22 6.0% Central 36 34.6% 119 32.7%
Southern 9 8.7% 24 6.6% Northern 22 21.2% 60 16.5%
Other 0 0% 13 3.6%
1 Committing Counties: Cook = Cook; Collar Counties = DuPage, Kane, Lake, McHenry, Will; Metro East Counties = Madison, St. Clair; Central IL Counties = Adams, Bond, Brown, Calhoun, Cass, Champaign, Christian, Clark, Coles, Crawford, Cumberland, Dewitt, Douglas, Edgar, Effingham, Fayette, Ford, Fulton, Greene, Hancock, Henderson, Iroquois, Jasper, Jersey, Knox, Livingston, Logan, McDonough, McLean, Macon, Macoupin, Marshall, Mason, Menard, Montgomery, Morgan, Moultrie, Peoria, Piatt, Pike, Sangamon, Schuyler, Scott, Shelby, Stark, Tazewell, Vermillion Warren, Woodford; South IL Counties = Alexander, Clay, Clinton, Edwards, Franklin, Gallatin, Hamilton, Hardin, Jackson, Jefferson, Johnson, Lawrence, Marion, Massac, Monroe, Perry, Pope, Pulaski, Randolph, Richland, Saline, Union, Wabash, Washington, Wayne, White, Williamson; North, IL Counties = Boone, Bureau, Carroll, DeKalb, Grundy, Henry, Jo-Daviess, Kankakee, Kendall, LaSalle, Lee, Mercer, Ogle, Putnam, Rock Island, Stephenson, Whiteside, Winnebago; Other = Out of State
29
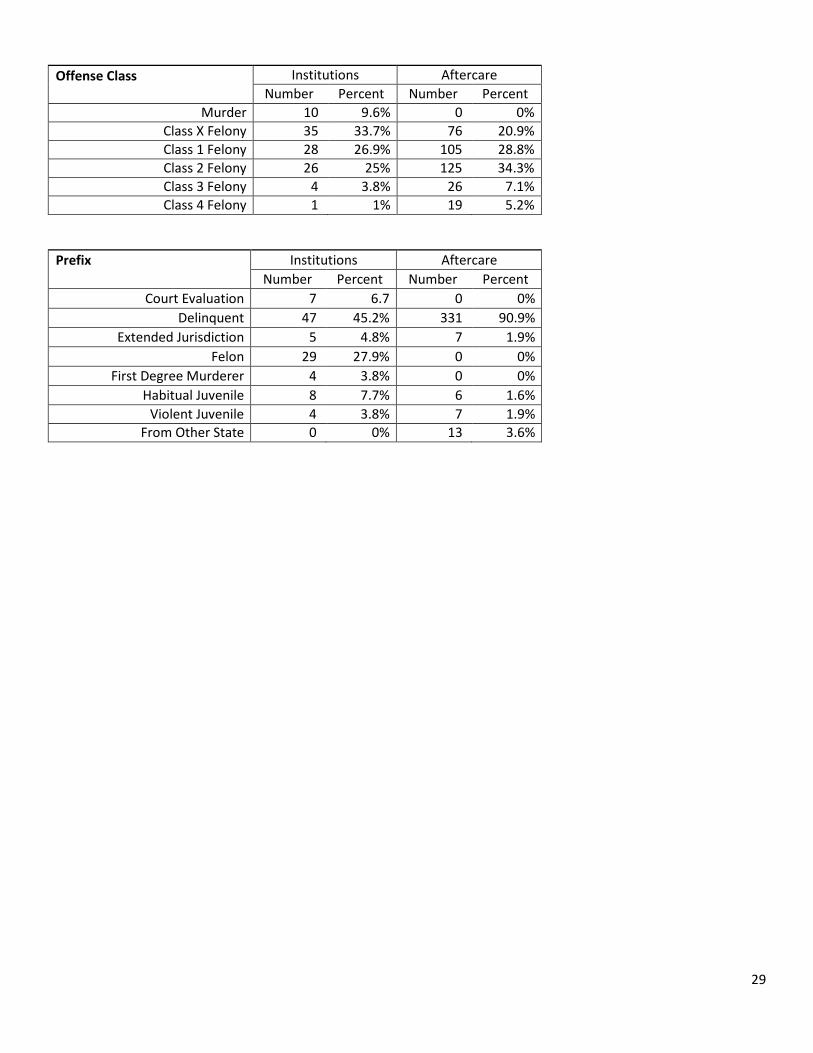
Offense Class Institutions Aftercare Number Percent Number Percent
Murder 10 9.6% 0 0% Class X Felony 35 33.7% 76 20.9% Class 1 Felony 28 26.9% 105 28.8% Class 2 Felony 26 25% 125 34.3% Class 3 Felony 4 3.8% 26 7.1% Class 4 Felony 1 1% 19 5.2%
Prefix Institutions Aftercare Number Percent Number Percent
Court Evaluation 7 6.7 0 0% Delinquent 47 45.2% 331 90.9%
Extended Jurisdiction 5 4.8% 7 1.9% Felon 29 27.9% 0 0%
First Degree Murderer 4 3.8% 0 0% Habitual Juvenile 8 7.7% 6 1.6%
Violent Juvenile 4 3.8% 7 1.9% From Other State 0 0% 13 3.6%
30
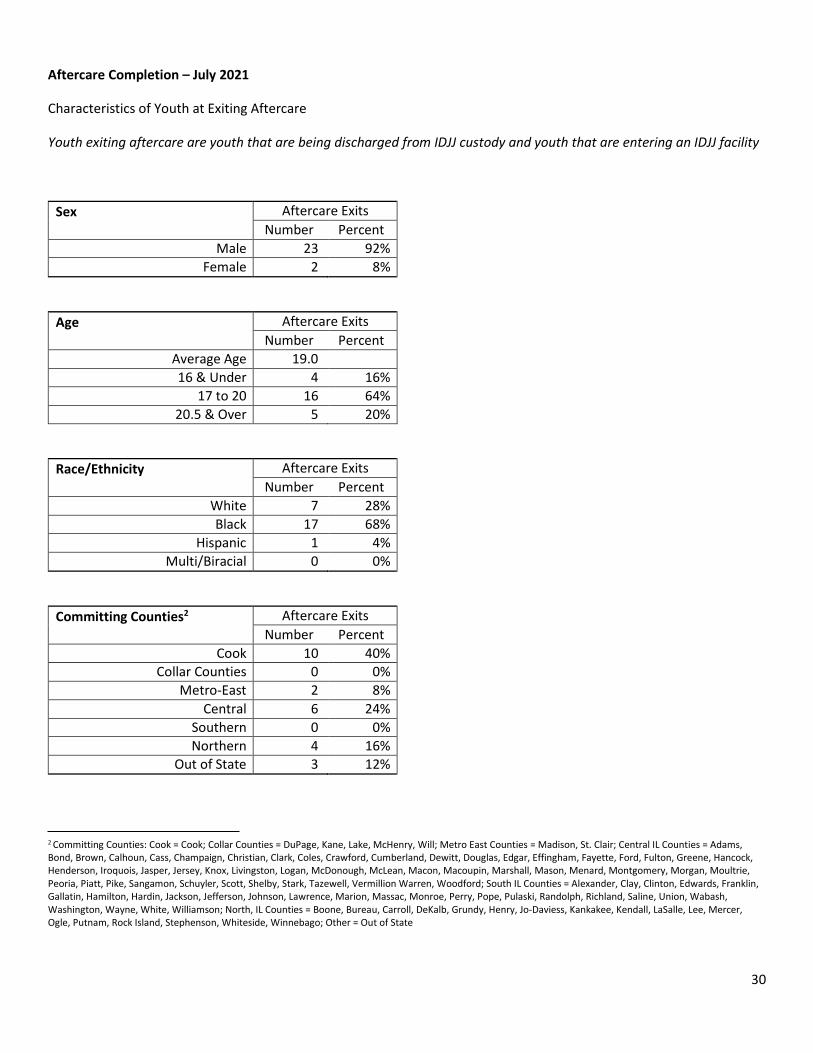
Aftercare Completion – July 2021
Characteristics of Youth at Exiting Aftercare
Youth exiting aftercare are youth that are being discharged from IDJJ custody and youth that are entering an IDJJ facility
Sex Aftercare Exits Number Percent
Male 23 92% Female 2 8%
Age Aftercare Exits Number Percent
Average Age 19.0 16 & Under 4 16%
17 to 20 16 64% 20.5 & Over 5 20%
Race/Ethnicity Aftercare Exits Number Percent
White 7 28% Black 17 68%
Hispanic 1 4% Multi/Biracial 0 0%
Committing Counties2 Aftercare Exits Number Percent
Cook 10 40% Collar Counties 0 0%
Metro-East 2 8% Central 6 24%
Southern 0 0% Northern 4 16%
Out of State 3 12%
2 Committing Counties: Cook = Cook; Collar Counties = DuPage, Kane, Lake, McHenry, Will; Metro East Counties = Madison, St. Clair; Central IL Counties = Adams, Bond, Brown, Calhoun, Cass, Champaign, Christian, Clark, Coles, Crawford, Cumberland, Dewitt, Douglas, Edgar, Effingham, Fayette, Ford, Fulton, Greene, Hancock, Henderson, Iroquois, Jasper, Jersey, Knox, Livingston, Logan, McDonough, McLean, Macon, Macoupin, Marshall, Mason, Menard, Montgomery, Morgan, Moultrie, Peoria, Piatt, Pike, Sangamon, Schuyler, Scott, Shelby, Stark, Tazewell, Vermillion Warren, Woodford; South IL Counties = Alexander, Clay, Clinton, Edwards, Franklin, Gallatin, Hamilton, Hardin, Jackson, Jefferson, Johnson, Lawrence, Marion, Massac, Monroe, Perry, Pope, Pulaski, Randolph, Richland, Saline, Union, Wabash, Washington, Wayne, White, Williamson; North, IL Counties = Boone, Bureau, Carroll, DeKalb, Grundy, Henry, Jo-Daviess, Kankakee, Kendall, LaSalle, Lee, Mercer, Ogle, Putnam, Rock Island, Stephenson, Whiteside, Winnebago; Other = Out of State
31
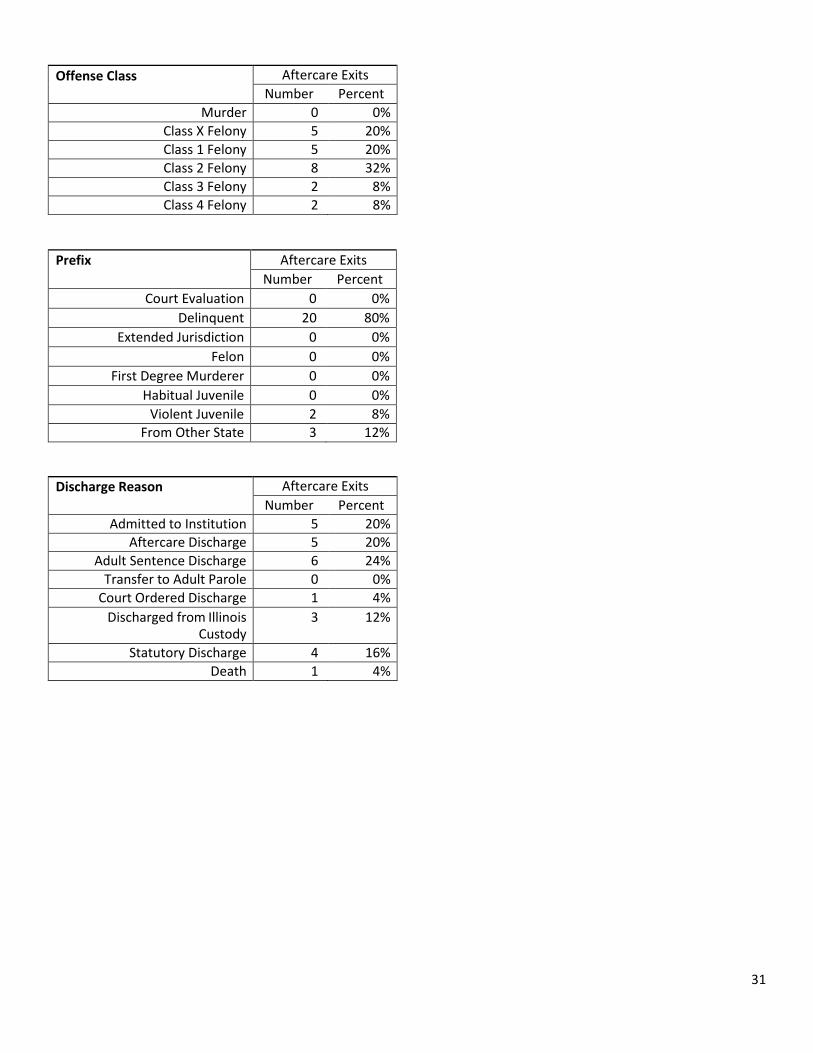
Offense Class Aftercare Exits Number Percent
Murder 0 0% Class X Felony 5 20% Class 1 Felony 5 20% Class 2 Felony 8 32% Class 3 Felony 2 8% Class 4 Felony 2 8%
Prefix Aftercare Exits Number Percent
Court Evaluation 0 0% Delinquent 20 80%
Extended Jurisdiction 0 0% Felon 0 0%
First Degree Murderer 0 0% Habitual Juvenile 0 0%
Violent Juvenile 2 8% From Other State 3 12%
Discharge Reason Aftercare Exits Number Percent
Admitted to Institution 5 20% Aftercare Discharge 5 20%
Adult Sentence Discharge 6 24% Transfer to Adult Parole 0 0%
Court Ordered Discharge 1 4% Discharged from Illinois
Custody 3 12%
Statutory Discharge 4 16% Death 1 4%
32
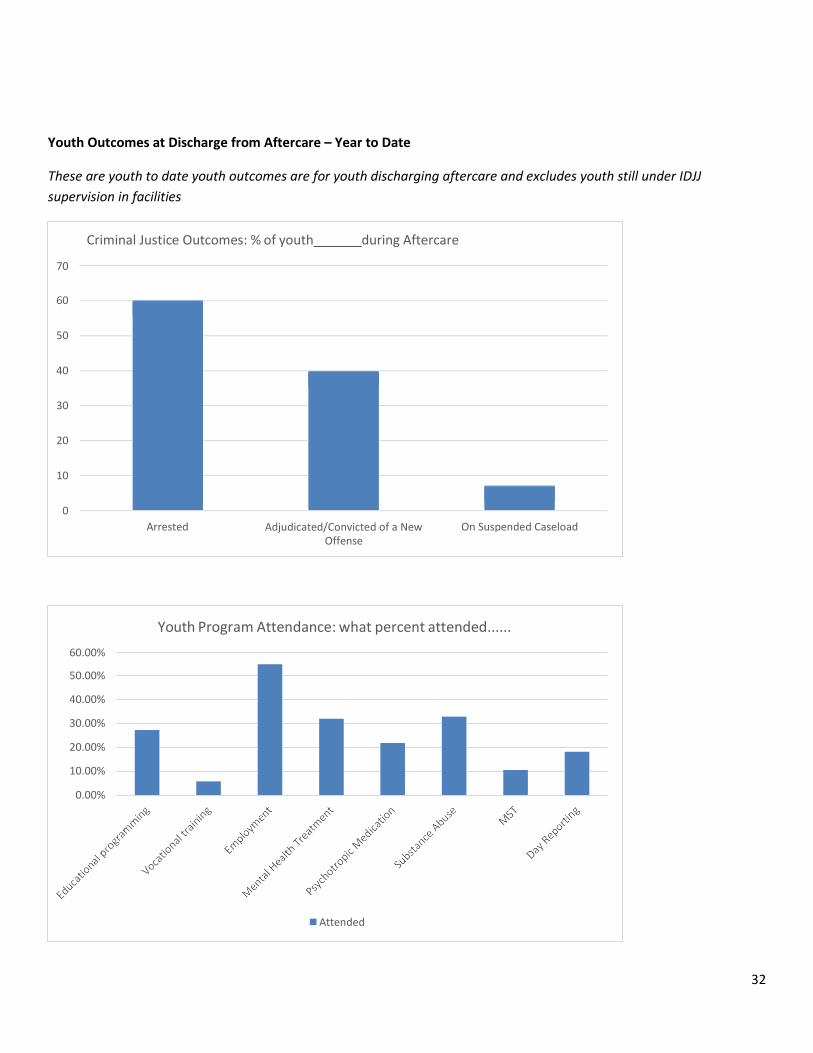
Criminal Justice Outcomes: % of youth during Aftercare
70 60
50
40
30
20
10
0
Arrested Adjudicated/Convicted of a New Offense
On Suspended Caseload
Youth Outcomes at Discharge from Aftercare – Year to Date
These are youth to date youth outcomes are for youth discharging aftercare and excludes youth still under IDJJ supervision in facilities
Youth Program Attendance: what percent attended...... 60.00%
50.00%
40.00%
30.00%
20.00%
10.00%
0.00%
Attended

33