Embed Size (px)
Citation preview

July 9, 2010
Highlights U.S—A slowdown of economic activity looks imminent as consumer
spending and job growth struggle to keep up the momentum. Export-
based industries face the disadvantage of an unanticipated rise in the dol-
lar and small businesses are cautiously optimistic about the expansion.
Financial—Financial regulatory reform is in the final stage of reconcilia-
tion. It touches on a vast number of issues, but was weakened over the
course of negotiation. Equity markets declined in the second quarter and
volatility was up.
Inflation—Recent economic turmoil has complicated the Fed’s dual
mandate of promoting growth with price stability. Despite continued
loose monetary policy, real economic growth remains elusive. However
for the time being, inflation appears to be under control.
Labor Markets—The NYC labor market has recouped 36,000 private
sector jobs over the past three months. However, the City is still down
109,000 jobs from the peak employment level and has a high unemploy-
ment rate of 9.6 percent.
Office Market—Manhattan asking rents have risen by about 4 percent
per year since 1988, slightly ahead of inflation. However, most of the ap-
preciation was in Midtown as rents in Downtown lagged.
Tourism—Tourism in the City has benefitted from a steady flow of for-
eign visitors partially due to favorable exchange rates. While the industry
has rebounded since the hit it took at the beginning of the economic
downturn, the flow of foreign visitors could be subdued as the dollar ap-
preciates and the world copes with continuing economic woes.
The City of New York
Michael R. Bloomberg
Office of
Management and Budget
Mark Page
Director
Michael Dardia
Deputy Director
Tax Policy, Revenue
Forecasting & Economic
Analysis Task Force
Yousuf Rahman
Assistant Director
Rodney Chun
Chief Economist
Joshua Goldstein
Deputy Assistant Director
Kevin McGrady
Supervising Analyst
Marcelo Yoon
Senior Analyst
Monthly Report
On
Current Economic
Conditions
-To view current and past monthly reports online please visit our website-
NYC.gov/omb
This report includes forecasts and estimates that are subject to a variety of assumptions, risks and
uncertainties. Such forecasts and estimates are not intended to be representations of fact or guar-
antees of results and should not be relied upon as such.

New York City Office of Management and Budget 1
Monthly Report on Economic Conditions -7/9/2010
A slowdown of economic activity during the second
half of the year seems to have arrived. It was ex-
pected that the recovery would take a breather as
government stimulus spending waned, the home-
buyers’ tax credit expired and the impact of inven-
tory accumulation faded. Currently, consumer
spending and job growth appear to be struggling to
keep up the momentum from the first half of the
year. Export-based industries are now suddenly
faced with a stronger dollar that raises doubts about
the sustainability of export strength.
After seven straight months of gains, retail sales
took a 1.2 percent dip in May. Even excluding the
volatile components (autos and gasoline), sales fell
0.8 percent. The precipitous decline in spending for
building and garden supplies – due to the expiration
of the homebuyer’s credit – was anticipated, but the
fall in spending for autos, general merchandise and
clothing reflect a more cautious consumer. Same-
store sales data and the latest light-vehicle sales re-
port reveal further erosion in June. Given the latest
read on spending, it appears that real personal con-
sumption expenditure, which grew by 3.0 percent in
the first quarter, may not have performed as well in
the second quarter. Consumer sentiment levels re-
main depressed by tentative hiring in the labor mar-
ket, which is reminiscent of the conditions follow-
ing the 1990 recession.
The labor market is improving at a snail’s pace. The
private sector added only 83,000 jobs in June, after
a paltry gain of 33,000 the previous month – a nota-
ble downward shift from the early spring spurt in
growth. JOLTS data available through April showed
that hires exceeded separations for the fourth
straight month, but this momentum appears to have
lost traction since then. The Challenger layoff fig-
ures, which are available through June, do not indi-
cate improvement in the pace of layoffs. In addition,
initial claims for unemployment insurance remain
stubbornly high, exceeding 450,000, and have not
improved since the beginning of the year.
Until recently, only medium to large businesses
have been showing real growth. The ISM purchas-
ing managers’ index still shows that businesses are
expanding in spite of its slight retraction in June,
when it dropped to 56.2 from 59.7 in May. How-
ever, the dollar’s recent gain against major curren-
cies may have erased some of the price advantage
that export-oriented manufacturers have been enjoy-
ing. On the other hand, small businesses that did not
benefit from the dollar’s decline and were hit hard
The U.S. Economy
Consumer sentiment remains depressed like the early stages of the 1990’s recovery.
65
70
75
80
85
90
95
100
1 2 3 4 5 6 7 8 9 10 11 12
Co
nsu
mer
Sen
tim
ent
Ind
ex
Months following the Recession
1981-82 Recession 1990-91 Recession
2001 Recession 2007-09 Recession

New York City Office of Management and Budget 2
Monthly Report on Economic Conditions -7/9/2010
by the tight credit conditions and weak domestic
demand are showing some signs of revival. In par-
ticular, there are signs that the labor market might
be seeing modestly rising demand from small busi-
ness employers. The employment component of the
non-manufacturing ISM index, which is a better in-
dicator of relatively smaller businesses, touched the
50 mark in May for the first time in two and half
years. Also the small business optimism index
climbed for the second month in a row. The index
stood at 92.2 in May, a definite improvement from
its lowest reading of 81.0 in March 2009, but still
far below its last highest reading of 107.7 in No-
vember of 2004. Moreover, the net percentage of
firms planning to increase employment has hit posi-
tive territory for the first time since the recession
started. Overall, small businesses remain extremely
cautious and restrained about future business expan-
sion.
After two weeks of debate, Congress is in the final
stages of reconciling the House and Senate versions
of the financial regulatory reform legislation. While
it will take years for the full impact of two thousand
pages of legislation to become evident, the finaliza-
tion of the landmark bill at least removes a major
element of uncertainty that has been dogging the
financial sector for the last year. It is expected that
the final bill will be sent to the President for signa-
ture by mid-July.
The number of issues addressed by the legislation is
breathtaking, although many of the more restrictive
parts from the original House and Senate bills were
modified in the joint conference. For instance, the
Senate bill contained the “Volcker Rule” provisions,
which sought to ban large banks from proprietary
trading and to prohibit them from owning or spon-
soring hedge and private equity funds. In the recon-
ciliation, these proscriptions were weakened. Banks
will now be allowed to maintain investments in
hedge or private equity funds, although limited to
three percent of their capital. In addition, while the
prohibition on proprietary trading still remains, the
working definition of the concept will be deter-
mined by regulators such as the SEC and CFTC.
Moreover, there is a list of exceptions which add
further scope for interpretation. For instance, “risk
mitigating” hedging activities are allowable in the
new bill.
Other important items in the final bill include re-
strictions on the derivatives market, a new con-
sumer protection agency and new government re-
sponsibilities including: a systematic risk council, a
resolution authority for seizing and dissolving trou-
bled financial firms, new oversight over ratings
agencies and additional rules for the Fed. Of these,
the most challenging for Wall Street will probably
be the changes in derivatives rules. Most derivative
trading will be moved onto exchanges or routed
through clearinghouses, and non-standard deriva-
tives will be subject to new reporting requirements.
Moving these securities onto public trading plat-
forms will increase the transparency of the market,
resulting in narrower margins. However, banks
managed to avoid even stricter limitations in the
Senate legislation which would have forced them to
spin off their derivatives trading into separately
capitalized subsidiaries. Instead, they will be al-
lowed to maintain their operations, so long as they
are used to hedge risk or trade interest rate or for-
eign exchange swaps.
The ratings agencies also face new restraints, al-
though nowhere near as binding as the original leg-
islation. Instead, the subject will be relegated to a
two year study by the SEC, which will address the
skewed incentives in the ratings process. However,
agencies will still face closer scrutiny from a new
SEC oversight office and will be subject to potential
investor lawsuits. The Federal Reserve is also sub-
ject to new rules. It will now have to disclose (with
a lag) the identities of banks borrowing from the
discount window. Furthermore, the commercial
bank representatives sitting on the regional Fed
bank boards will be barred from selecting regional
Fed bank presidents. The Senate proposal to make
the New York Fed president a Presidential ap-
pointee was dropped during reconciliation, how-
ever.
Equity markets continued to be weak with the
S&P500 and Dow indices falling 5.4 and 3.6 per-
cent, respectively, in June. Over the second quarter,
Financial Markets

New York City Office of Management and Budget 3
Monthly Report on Economic Conditions -7/9/2010
the S&P500 and Dow declined 12 and 10 percent,
the first quarterly losses since the first quarter of
2009 when markets hit their cyclical lows. Other
indicators of market volatility remain high. Al-
though the CBOE’s volatility index (VIX) for the
S&P500 is around 35 – down from the mid-40s in
May – it is more than double the values seen in mid-
April. Likewise, the S&P500 trading days ratio, the
number of days with price movements in excess of
one percent, was 50 percent in June, down from 70
percent in May, but well above the long-run average
of 20 percent.
Looking ahead, the earnings season for the second
quarter will start in mid-July; there are many factors
working against a repeat of the last quarter’s results.
Credit markets are still far from healthy. The last
flow of funds report issued by the Federal Reserve
showed that U.S. companies are holding more cash
as a percentage of company assets than at any point
since 1963. Due to the low interest rate environ-
ment, large companies are able to raise money
cheaply. However, they are reluctant to spend the
cash on expansion or hiring, indicating an overall
wariness in the corporate sector regarding near term
prospects. For smaller firms who rely on the bank-
ing sector for financing, the news is not good either.
The flow of funds data shows that while corporate
borrowing increased in the first quarter, non-
corporate borrowing decreased for the fifth con-
secutive quarter. Furthermore, smaller regional
banks continue to be shuttered at an alarming rate.
Another eight banks were closed in June bringing
the number of failed banks in the first half of 2010
to 86. By this time last year, only 45 banks had
failed. As economic stimulus programs such as the
first-time homebuyers’ tax credit wane, conditions
will only get more difficult for smaller banks that
are heavily exposed to both residential and commer-
cial real estate markets.
At the beginning of the year, the Fed’s job appeared
to be straightforward. Employment growth finally
turned positive along with an increase in national
income, hints of stability had returned to the hous-
ing market, and inflation pressures were subdued. If
conditions had stayed on track, the Fed’s main pri-
ority would have been determining the correct time
to start tightening monetary policy. Recent events,
including the fiscal turmoil in Europe, weak domes-
tic job growth and a decline in the pace of housing
sales have made the Fed’s job considerably more
difficult. In the statement following the June FOMC
meeting, the Fed underscored these concerns by
stating, “Housing starts remain at a depressed level.
Financial conditions have become less supportive of
economic growth on balance, largely reflecting de-
velopments abroad.”
The one issue that is clear-cut is that inflation is un-
der control. Headline inflation in May was only 2
percent (year over year), down from 2.2 percent in
April. Core inflation was only 1 percent, unchanged
from the previous month. The Fed’s preferred price
index – the core PCE – grew at only a 1.3 percent
rate in May (y/y). This measure has remained in the
Fed’s informal 1 to 2 percent target range for the
past year and a half. Inflation expectations implied
by the difference between yields on plain vanilla
and inflation protected 5-year Treasury notes are
stable in the 1.5 to 2 percent range. Relatively
steady oil and gasoline prices also support the view
that inflation will be restrained for a while. Locally,
prices have likewise been stable. The May headline
Inflation & Federal Reserve Both the VIX and the Trading Days Ratio have been
rising lately after a relative calm period at the be-
ginning of the year.
0
10
20
30
40
50
60
70
80
90
100
0%
10%
20%
30%
40%
50%
60%
70%
80%
90%
100%
Jan
-06
Jul-
06
Jan
-07
Jul-
07
Jan
-08
Jul-
08
Jan
-09
Jul-
09
Jan
-10
VIX (Right)
Trading Days
Ratio (Left)

New York City Office of Management and Budget 4
Monthly Report on Economic Conditions -7/9/2010
CPI inflation rate for the New York area was 2.2
percent (y/y) while the core CPI rate was 1.3 per-
cent, 0.3 percentage points higher than the national
figure.
A nascent recovery appears to be underway in the
New York City labor market. Over the past three
months, the private sector has expanded by 36,000
jobs. This leaves the private employment level for
the City about 109,000 below August 2008.
In May, New York City added 5,000 private sector
jobs. The increase marked a deceleration in employ-
ment growth from the previous two months when
the City added 16,000 and 15,000 private sector
jobs. Nonetheless, after about a year and a half of
job losses, three months of gains is an encouraging
sign.
This month professional & business services led the
way, adding 3,500 jobs in May. Accounting and
employment services made up most of the gain.
Since March, professional & business services have
expanded by 10,000. However, the cumulative
losses in this sector are still 37,000 since July 2008,
a six percent decline.
Financial activities also contributed to the overall
job gain. In May, employment in this sector in-
creased by 2,300. Securities added 800 jobs this
month and 2,000 in the last three months combined.
Banking gained 800 jobs as well and real estate
chipped in 300 jobs.
Retail trade had a strong month, boosting employ-
ment by 1,300. Since March, this sector has in-
creased 4,900 jobs. To date, retail trade is only
down 4,800 or two percent from the peak employ-
ment level.
Employment growth in education & health services
slowed this month to 600 jobs. Expansion in this
sector has continued throughout the recession aver-
aging 1,300 jobs per month. In May, education
gained 300 jobs and health increased by 200 jobs.
Construction and manufacturing were a drag on pri-
vate sector employment this month. After gaining
4,300 jobs in March and April, construction cut
2,000 jobs in May. Manufacturing was flat last
month, but dropped 1,000 jobs this month.
New York City Employment
Inflation expectations reflected in the yield spread
between ordinary and inflation-protected 5-year
treasuries has stabilized below two percent.
In recent months, employed residents have out-
paced the growth in the labor force causing the un-
employment rate to fall.
-2.0
-1.5
-1.0
-0.5
0.0
0.5
1.0
1.5
2.0
2.5
3.0
Jan-0
7
Jul-
07
Jan-0
8
Jul-
08
Jan-0
9
Jul-
09
Jan-1
0
Per
cent
Yield Differential
-15
-10
-5
0
5
10
15
20
25
30
0%
2%
4%
6%
8%
10%
12%
2008 2009 2010
Employed Residents Change (Ths., SA) - Right Axis
Labor Force Change (Ths., SA) - Right Axis
Unemployment Rate (SA) - Left Axis

New York City Office of Management and Budget 5
Monthly Report on Economic Conditions -7/9/2010
The household survey for New York City has
shown a gradual improvement in the labor market.
Since December 2009, the City’s unemployment
rate has fallen from 10.5 percent to 9.6 percent. So
far, the new entrants to the labor market have not
bumped up the unemployment rate due to a more
sizable increase in hiring; employed residents have
increased by 60,000, outpacing the 27,000 gain in
the labor force. However, near-ten percent unem-
ployment is still historically very high. Even with
the recent progress, the unemployment rate is above
the peak rate of the 2001 recession of 8.5 percent.
As of May 2010 asking rents in Class A buildings in
NYC were $61 per square foot (psf), down nearly
30 percent from $86 psf in mid-2008. The last time
rents were at this level was in late 2006 just as the
economy was heating up. Prior to 2006, rents
reached $61 psf nearly 10 years ago during the dot-
com boom in late 2000. Since then operating ex-
penses and taxes have risen steadily by nearly $10
in Midtown and $6 in Downtown, suggesting that
landlords are worse off than they had been 10 years
ago.1 Of course real estate fundamentally follows a
boom and bust cycle, which makes comparing the
peak of the market in 2000 to the current trough
misleading.
To get a better long-term perspective, it is useful to
examine comparable figures over the business cy-
cle. Over the past 20 years there have been three
separate business cycles with peaks in 1988, 2001
and 2008. In 1988, rents across the City averaged
$40 psf. Two decades later rents climbed to $86 psf,
a $46 or a 115 percent increase which implies a
growth rate of just under 4 percent per year. In com-
parison, the NY Area CPI increased by about 100
percent or 3.3 percent per year over the same pe-
riod.2
During these market cycles Midtown and Down-
town office markets have diverged. Midtown
showed higher gains over the past two decades, av-
eraging 4.2 percent annual rental increase with rents
climbing by 127 percent from $40 in 1989 to $92 in
2008. Downtown’s performance is a bit disappoint-
ing with rental growth of only 2.0 percent per year
or about 50 percent from $38 in 1998 to $58 in
2008. It is interesting to note that rental rates were
competitive between Midtown and Downtown
twenty years ago but have diverged considerably.
Midtown has always held a slight premium to
Downtown; however the real shift occurred in the
late 1990s during the dot-com boom and continued
into the next boom. Midtown rents increased 102
percent during the 1990s boom while Downtown
rents rose 80 percent. Rents also held up better in
Midtown than Downtown following 9/11 and the
dot-com crash. Asking rents in Midtown fell 26 per-
cent in the aftermath, and 35 percent in Downtown.
New York City Office Market
Midtown and Downtown asking rents have diverged
over the last 20 years.
1. Studley Effective Rent Index 2010
2. The NY Area CPI is used here to represent the overall rate of inflation of the past two decades. It does not reflect the increased cost a
landlord might face. The Studley Effective Rent Index is probably a better measure of the increases in building expenses and taxes, but the
data is not available prior to 1994. From 1994 to 2009 operating expenses and taxes increased approximately 3.8 percent per year in Mid-
town and 3.3 percent per year in Downtown.
-40%
-20%
0%
20%
40%
60%
80%
100%
120%
140%
19
88
19
90
19
92
19
94
19
96
19
98
20
00
20
02
20
04
20
06
20
08
20
10
Ch
an
ge S
ince 1
98
8
Downtown
Midtown
NYC CPI

New York City Office of Management and Budget 6
Monthly Report on Economic Conditions -7/9/2010
As the economy recovered from the 2001 recession,
financial firms continued to make an exodus from
Downtown. Asking rents accelerated in Midtown by
85 percent compared to 72 percent in Downtown.
One might have expected a larger rental correction
in Midtown during the current market correction, as
vacancy rates increased more rapidly. So far this has
not been the case. Asking rents have dropped by 30
percent since 2008 in both Midtown and Down-
town.
Over the past decade, the City’s tourism industry
has grown at a torrid pace. In 2009, the City at-
tracted nearly 45.6 million visitors, nearly 10 mil-
lion more visitors than in 1999.3 Besides the inher-
ent cultural attractions and reputation as the safest
big city in the nation, it is hard to ignore the impact
that favorable exchange rates have had in keeping
the City affordable to international visitors. Through
much of the decade the price of travel into the City
by foreign tourists was relatively less expensive in
terms of the currency equivalents. While hotel room
rates rose in terms of U.S. dollars during the City’s
economic boom, the rate of growth in terms of Ca-
nadian dollars, Euros, and British pounds was rela-
tively subdued.
As the world fell into recession, the City’s tourism
industry was battered. Hotel occupancy rates fell
drastically, and air passenger volume into the City
declined significantly. However, swift action by the
City’s hoteliers countered the slowdown - room
rates were heavily discounted, helping to stabilize
and boost occupancy rates at the City’s hotels. Due
to this decisive maneuver, the City’s hotel occu-
pancy rate has been at 80 percent or higher since
April 2009, and reached 87.8 percent in May 2010,
the highest rate recorded since August 2008.4 Total
air passengers into New York City area airports
grew 0.7 percent year-to-date through April.5 In tan-
dem with the recovery in air passenger volume oc-
cupancy rates, Broadway continued to thrive. Atten-
dance rose 4.6 percent year-on-year through May
over the same time last year, but box office gross
receipts have grown at a much more robust 14.3
percent over the same period, due to a rise of 9.3
percent in average ticket prices.6
While the surge in tourism activity seems to point
towards more growth in the industry, there are rea-
sons to expect a bumpy ride. While New York City
has enjoyed good times from an influx of interna-
tional visitors, the tide could turn as factors such as
the European debt crisis, a strengthening dollar, and
the ongoing global economic uncertainty could
dampen the plans of the prospective travelers into
the City. While hotel room rates have increased by
20 percent since hitting a bottom in June 2009,
room rates vis-à-vis the Euro and the British pound
are up nearly 35 percent. With the industry’s reli-
ance on a steady flow of foreign visitors, further
appreciation of the dollar in terms of foreign curren-
cies of the countries that provide the largest share of
the City’s international visitors means that the City
may face more muted tourist activity in the near fu-
ture.7
New York City Tourism
3. NYC & Company
4. PKF Consulting. Data are seasonally adjusted by OMB.
5. Port Authority of NY & NJ
6. The Broadway League
7. According to NYC & Company, the top five international markets for visitors into New York City were the United Kingdom, Canada,
France, Germany and Italy.
After hitting bottom, hotel room rates have risen
more rapidly in currency equivalence for the Euro
and the British pound.
100
105
110
115
120
125
130
135
140
Jun
-09
Jul-
09
Au
g-0
9
Sep
-09
Oct-
09
No
v-0
9
Dec-0
9
Jan
-10
Feb
-10
Mar-
10
Ap
r-1
0
May
-10
Ind
ex
ed H
ote
l R
oo
m R
ate
s
(Ju
ne 2
009
=10
0)
NYC Hotel Room Rates
U.S. DollarCanadian DollarEuroUK Pound

U.S. General Economic IndicatorsGDP 2006 Q1 2006 Q2 2006 Q3 2006 Q4 2007 Q1 2007 Q2 2007 Q3 2007 Q4 2008 Q1 2008 Q2 2008 Q3 2008 Q4 2009 Q1 2009 Q2 2009 Q3 2009 Q4 2010 Q1Nominal GDP 13183.5 13347.8 13452.9 13611.5 13795.6 13997.2 14179.9 14337.9 14373.9 14497.8 14546.7 14347.3 14178 14151.2 14242.1 14453.8 14592.4Real GDP 12915.9 12962.5 12965.9 13060.7 13099.9 13204 13321.1 13391.2 13366.9 13415.3 13324.6 13141.9 12925.4 12901.5 12973 13149.5 13238.6 (% ch. a.r.) 5.4 1.5 0.1 3 1.2 3.2 3.6 2.1 -0.7 1.5 -2.7 -5.4 -6.4 -0.7 2.2 5.6 2.7(year % ch.) 3 3 2.2 2.4 1.4 1.9 2.7 2.5 2 1.6 0 -1.9 -3.3 -3.8 -2.6 0.1 2.4Final Sales of Domestic Product 12851.3 12891 12898.3 13027.8 13086.4 13179.6 13290.3 13381.1 13363.5 13453.5 13354.3 13193.5 13055.8 13077.8 13127.2 13181.9 13209.5 (% ch. a.r.) 5.9 1.2 0.2 4.1 1.8 2.9 3.4 2.8 -0.5 2.7 -2.9 -4.7 -4.1 0.7 1.5 1.7 0.8(year % ch.) 3.3 2.5 1.8 2.8 1.8 2.2 3 2.7 2.1 2.1 0.5 -1.4 -2.3 -2.8 -1.7 -0.1 1.2Final Sales to Domestic Producers 13584.1 13624.1 13655.2 13722.8 13791.5 13863.2 13928.9 13944 13912.9 13923.2 13828 13654.9 13432.7 13401.4 13477.2 13524.1 13578.7 (% ch. a.r.) 5.2 1.2 0.9 2 2 2.1 1.9 0.4 -0.9 0.3 -2.7 -4.9 -6.4 -0.9 2.3 1.4 1.6(year % ch.) 3.2 2.6 2 2.3 1.5 1.8 2 1.6 0.9 0.4 -0.7 -2.1 -3.5 -3.7 -2.5 -1 1.1
Personal Consumption Expenditures 8986.6 9035 9090.7 9181.6 9265.1 9291.5 9335.6 9363.6 9349.6 9351 9267.7 9195.3 9209.2 9189 9252.6 9289.5 9359 (% ch. a.r.) 4.5 2.2 2.5 4.1 3.7 1.1 1.9 1.2 -0.6 0.1 -3.5 -3.1 0.6 -0.9 2.8 1.6 3(year % ch.) 3.1 2.6 2.5 3.3 3.1 2.8 2.7 2 0.9 0.6 -0.7 -1.8 -1.5 -1.7 -0.2 1 1.6Durable Goods 1142.3 1139.4 1152.1 1167.9 1183.7 1189.9 1205 1221.2 1193.2 1175.7 1139.6 1076.8 1087.2 1071.7 1122.7 1123.7 1156 (% ch. a.r.) 17 -1 4.5 5.6 5.5 2.1 5.2 5.5 -8.9 -5.7 -11.7 -20.3 3.9 -5.6 20.4 0.4 12(year % ch.) 5.4 2.3 2.3 6.3 3.6 4.4 4.6 4.6 0.8 -1.2 -5.4 -11.8 -8.9 -8.8 -1.5 4.4 6.3Nondurable Goods 2003.7 2011.6 2024.5 2054.7 2070.3 2066.1 2076.8 2086 2070.1 2081.4 2051.5 2026.1 2035.5 2025.7 2033.3 2053.4 2072.9 (% ch. a.r.) 2.6 1.6 2.6 6.1 3.1 -0.8 2.1 1.8 -3 2.2 -5.6 -4.9 1.9 -1.9 1.5 4 3.9(year % ch.) 2.8 2.6 2.7 3.2 3.3 2.7 2.6 1.5 0 0.7 -1.2 -2.9 -1.7 -2.7 -0.9 1.3 1.8
Gross Private Domestic Investment 2264.7 2261.2 2229.6 2166 2132.6 2162.2 2166.5 2123.4 2082.9 2026.5 1990.7 1857.7 1558.5 1456.7 1474.4 1621 1683.2 (% ch. a.r.) 6 -0.6 -5.5 -10.9 -6 5.7 0.8 -7.7 -7.4 -10.4 -6.9 -24.2 -50.5 -23.7 4.9 46.1 16.3(year % ch.) 4.3 6.1 3.5 -3 -5.8 -4.4 -2.8 -2 -2.3 -6.3 -8.1 -12.5 -25.2 -28.1 -25.9 -12.7 8Nonresidential 1424.9 1450.3 1466 1474.5 1489.6 1530.3 1565.8 1591.3 1598.9 1604.4 1579.2 1496.1 1321.2 1288.4 1269 1285.5 1292.6 (% ch. a.r.) 17.9 7.3 4.4 2.3 4.2 11.4 9.6 6.7 1.9 1.4 -6.1 -19.4 -39.2 -9.6 -5.9 5.3 2.2(year % ch.) 7.8 8.2 7.8 7.8 4.5 5.5 6.8 7.9 7.3 4.8 0.9 -6 -17.4 -19.7 -19.6 -14.1 -2.2Residential 775.2 740.1 697.4 660.2 631.7 610.4 572.9 525 483.2 462.9 443.3 415 367.9 344.4 359.6 362.9 353.2 (% ch. a.r.) -4.2 -16.9 -21.2 -19.7 -16.2 -12.8 -22.4 -29.5 -28.2 -15.8 -15.9 -23.2 -38.2 -23.2 18.9 3.7 -10.3(year % ch.) 2.3 -4.5 -11 -15.7 -18.5 -17.5 -17.9 -20.5 -23.5 -24.2 -22.6 -21 -23.9 -25.6 -18.9 -12.6 -4
Net Exports of Goods & Services -732.6 -732.8 -756.5 -694.9 -705 -683.4 -638.4 -564 -550.9 -476 -479.2 -470.9 -386.5 -330.4 -357.4 -348 -373 (% ch. a.r.) -6.6 0.1 13.6 -28.8 5.9 -11.7 -23.8 -39.1 -9 -44.3 2.7 -6.8 -54.6 -46.6 36.9 -10.1 32(year % ch.) 2.5 3.3 4.9 -6.8 -3.8 -6.7 -15.6 -18.8 -21.9 -30.3 -24.9 -16.5 -29.8 -30.6 -25.4 -26.1 -3.5Government Consumption & Investment 2397.1 2399.1 2402.7 2409.4 2409.5 2435.4 2458.9 2468.7 2484.7 2506.9 2536.6 2544 2527.2 2568.6 2585.5 2576.9 2564.8 (% ch. a.r.) 4.1 0.3 0.6 1.1 0 4.4 3.9 1.6 2.6 3.6 4.8 1.2 -2.6 6.7 2.7 -1.3 -1.9(year % ch.) 1.6 1.6 0.8 1.5 0.5 1.5 2.3 2.5 3.1 2.9 3.2 3.1 1.7 2.5 1.9 1.3 1.5Change in Private Inventories 65.8 72.5 67.5 31.8 14.5 23.3 29.8 10.3 0.6 -37.1 -29.7 -37.4 -113.9 -160.2 -139.2 -19.7 41.2 (dif) -15.2 6.7 -5 -35.7 -17.3 8.8 6.5 -19.5 -9.7 -37.7 7.4 -7.7 -76.5 -46.3 21 119.5 60.9
Additional U.S. IndicatorsGDP Implicit Price Deflator (% ch. a.r.) 3 3.6 3.1 1.8 4.3 2.7 1.7 2.4 1.7 2 4.1 0 1.9 0 0.4 0.5 1.1 (year % ch.) 3.3 3.6 3.3 2.9 3.2 2.9 2.6 2.7 2.1 1.9 2.6 2 2 1.5 0.6 0.7 0.5Corporate Profits 1590.9 1597.7 1655.1 1589.6 1535.4 1594.9 1537.1 1499.4 1459.7 1403.7 1454.6 1123.6 1182.7 1226.5 1358.9 1467.6 1584.5 (% ch.) 3.8 0.4 3.6 -4 -3.4 3.9 -3.6 -2.5 -2.6 -3.8 3.6 -22.8 5.3 3.7 10.8 8 8(year % ch.) 13 11.8 13.8 3.7 -3.5 -0.2 -7.1 -5.7 -4.9 -12 -5.4 -25.1 -19 -12.6 -6.6 30.6 34ECI Private: Total Compensation 100.8 101.6 102.5 103.3 103.9 104.8 105.6 106.5 107.2 108 108.6 109.1 109.3 109.6 110 110.4 111.1 (% ch. a.r.) 2.4 3.2 3.6 3.2 2.3 3.5 3.1 3.5 2.7 3 2.2 1.9 0.7 1.1 1.5 1.5 2.6(year % ch.) 2.6 2.8 3 3.1 3.1 3.1 3 3.1 3.2 3.1 2.8 2.4 2 1.5 1.3 1.2 1.6NonFarm Business Productivity 137.5 137.7 137 138 138.3 139 141 142 141.8 142.8 143.2 144 144.3 147 149.8 152.1 153.2 (% ch. a.r.) 2.7 0.3 -1.9 2.9 0.9 2.2 5.7 2.9 -0.5 3 1.1 2.2 0.9 7.6 7.8 6.3 2.8(year % ch.) 1.2 1.5 0.2 1 0.6 1 2.9 2.9 2.5 2.7 1.6 1.4 1.8 2.9 4.6 5.6 6.1Unit Labor Costs 121.5 122 123 125 126 125.8 125 125.9 126.4 125.9 127.4 128.1 126.4 126.4 124 121.5 121.1 (% ch. a.r.) 2.6 1.5 3.5 6.6 3.4 -0.8 -2.5 3.1 1.6 -1.9 4.9 2.2 -5 0.1 -7.6 -7.8 -1.3(year % ch.) 2.9 2.4 2.5 3.5 3.7 3.1 1.6 0.7 0.3 0.1 1.9 1.7 0 0.5 -2.7 -5.1 -4.2
Data: Real GDP & Components in Bil. 2000 $, SAARData: Profits with IDA & CCAdj in Bil $, SAData: ECI All Workers, Index Dec 2005=100, SAData: Prod & Unit Labor All Persons, Index 1992=100, SA

U.S. EmploymentPayroll Survey: Current Employment Statistics (CES) Feb 2009 Mar 2009 Apr 2009 May 2009 Jun 2009 Jul 2009 Aug 2009 Sep 2009 Oct 2009 Nov 2009 Dec 2009 Jan 2010 Feb 2010 Mar 2010 Apr 2010 May 2010 Jun 2010Total 132,823 132,070 131,542 131,155 130,640 130,294 130,082 129,857 129,633 129,697 129,588 129,602 129,641 129,849 130,162 130,595 130,470 (dif) -726 -753 -528 -387 -515 -346 -212 -225 -224 64 -109 14 39 208 313 433 -125Private 110,254 109,510 108,861 108,527 108,075 107,778 107,563 107,377 107,115 107,190 107,107 107,123 107,185 107,343 107,584 107,617 107,700 (dif) -707 -744 -649 -334 -452 -297 -215 -186 -262 75 -83 16 62 158 241 33 83Financial Activities 7,894 7,852 7,805 7,773 7,742 7,719 7,695 7,683 7,664 7,666 7,657 7,635 7,628 7,609 7,611 7,599 7,584 (dif) -51 -42 -47 -32 -31 -23 -24 -12 -19 2 -9 -22 -7 -19 2 -12 -15
Finance & Insurance 5,853 5,828 5,796 5,776 5,757 5,738 5,719 5,708 5,695 5,700 5,694 5,677 5,671 5,659 5,657 5,652 5,646 (dif) -32 -25 -32 -20 -20 -19 -19 -11 -13 5 -6 -17 -6 -11 -3 -5 -6
Securities 832 826 816 811 805 801 799 796 796 795 796 793 793 791 797 796 797 (dif) -9 -6 -9 -5 -6 -5 -2 -2 -1 0 1 -3 0 -3 7 -1 1
Banking 2,640 2,625 2,609 2,601 2,592 2,587 2,579 2,571 2,566 2,573 2,571 2,566 2,568 2,567 2,563 2,563 2,562 (dif) -14 -15 -16 -8 -9 -5 -9 -7 -6 8 -2 -5 2 -1 -4 -1 0
Real Estate & Rental & Leasing 2,041 2,024 2,009 1,997 1,985 1,981 1,976 1,976 1,969 1,967 1,963 1,958 1,957 1,950 1,954 1,947 1,938 (dif) -18 -17 -16 -12 -12 -4 -5 0 -7 -2 -4 -5 -1 -7 4 -8 -9
Information 2,873 2,861 2,837 2,812 2,797 2,785 2,776 2,777 2,774 2,762 2,748 2,745 2,739 2,728 2,727 2,723 2,715 (dif) -15 -12 -24 -25 -15 -12 -9 1 -3 -12 -14 -3 -6 -11 -1 -4 -8Professional & Business Services 16,920 16,774 16,636 16,585 16,453 16,405 16,371 16,349 16,360 16,466 16,488 16,511 16,567 16,568 16,638 16,663 16,709 (dif) -171 -146 -138 -51 -132 -48 -34 -22 11 106 22 23 56 1 70 25 46Educational & Health Services 19,085 19,095 19,099 19,137 19,165 19,186 19,221 19,247 19,282 19,313 19,350 19,370 19,400 19,449 19,477 19,497 19,519 (dif) 16 10 4 38 28 21 35 26 35 31 37 20 30 49 28 20 22Leisure & Hospitality 13,183 13,137 13,103 13,126 13,105 13,101 13,083 13,099 13,045 13,024 12,991 13,003 13,026 13,049 13,085 13,077 13,114 (dif) -26 -46 -34 23 -21 -4 -18 16 -54 -21 -33 12 23 23 36 -8 37Other Services 5,410 5,384 5,373 5,366 5,367 5,362 5,353 5,344 5,327 5,321 5,314 5,317 5,310 5,321 5,333 5,336 5,338 (dif) -19 -26 -11 -7 1 -5 -9 -9 -17 -6 -7 3 -7 11 12 3 2Trade, Transportation & Utilities 25,330 25,174 25,052 24,997 24,943 24,845 24,819 24,754 24,670 24,678 24,653 24,666 24,667 24,714 24,741 24,737 24,744 (dif) -145 -156 -122 -55 -54 -98 -26 -65 -84 8 -25 13 1 47 27 -4 7Manufacturing 12,377 12,212 12,063 11,911 11,782 11,739 11,682 11,634 11,577 11,552 11,534 11,556 11,572 11,591 11,629 11,661 11,670 (dif) -166 -165 -149 -152 -129 -43 -57 -48 -57 -25 -18 22 16 19 38 32 9Construction 6,435 6,293 6,179 6,120 6,029 5,949 5,885 5,814 5,747 5,732 5,696 5,636 5,585 5,612 5,634 5,604 5,582 (dif) -116 -142 -114 -59 -91 -80 -64 -71 -67 -15 -36 -60 -51 27 22 -30 -22Government 22,569 22,560 22,681 22,628 22,565 22,516 22,519 22,480 22,518 22,507 22,481 22,479 22,456 22,506 22,578 22,978 22,770 (dif) -19 -9 121 -53 -63 -49 3 -39 38 -11 -26 -2 -23 50 72 400 -208
Other Employment DataUnemployment Rate 8.2 8.6 8.9 9.4 9.5 9.4 9.7 9.8 10.1 10 10 9.7 9.7 9.7 9.9 9.7 9.5 (dif) 0.5 0.4 0.3 0.5 0.1 -0.1 0.3 0.1 0.3 -0.1 0 -0.3 0 0 0.2 -0.2 -0.2Avg. Weekly Hours: Private (CES) 34.1 34 33.9 33.9 33.8 33.8 33.8 33.8 33.7 33.9 33.8 34 33.9 34 34.1 34.2 34.1 (dif) -0.1 -0.1 -0.1 0 -0.1 0 0 0 -0.1 0.2 -0.1 0.2 -0.1 0.1 0.1 0.1 -0.1Avg. Wk. Earnings: Private (CES) 752 751 750 751 749 750 753 754 753 759 756 763 762 764 767 771 768 (dif) -0.8 -1.2 -1.2 1 -1.5 1.4 2.7 0.7 -0.5 5.8 -2.6 6.9 -1.2 2.3 2.9 4 -2.9Initial Claims, SA 2,528 2,571 2,508 3,081 2,418 2,251 2,826 2,187 2,637 1,968 1,896 2,381 1,870 1,792 1,853 2,288 1,866 (dif) -335 43 -63 573 -663 -167 575 -639 450 -669 -72 485 -511 -78 61 435 -422Continued Claims, SA 5,273 5,701 6,119 6,479 6,511 6,167 6,089 6,044 5,815 5,489 5,164 4,851 4,762 4,651 4,657 4,631 -- (dif) 420 429 418 360 32 -344 -77 -45 -229 -326 -325 -313 -90 -110 6 -26 -- ISM Employment Diffusion Index, SA 26.1 28.1 34.4 34.3 40.7 45.6 46.4 46.2 53.1 49.6 50.2 53.3 56.1 55.1 58.5 59.8 57.8 (dif) -3.8 2 6.3 -0.1 6.4 4.9 0.8 -0.2 6.9 -3.5 0.6 3.1 2.8 -1 3.4 1.3 -2ISM Non-Mfg. Emp. Index, SA 37.9 32.8 36.9 38.9 42.2 41.3 42.8 44.1 41.7 41.7 43.6 44.6 48.6 49.8 49.5 50.4 49.7 (dif) 2.5 -5.1 4.1 2 3.3 -0.9 1.5 1.3 -2.4 0 1.9 1 4 1.2 -0.3 0.9 -0.7
Data: CES and Claims in Ths.

The U.S. Consumer & Housing MarketPersonal Income, Consumption and Credit Jan 2009 Feb 2009 Mar 2009 Apr 2009 May 2009 Jun 2009 Jul 2009 Aug 2009 Sep 2009 Oct 2009 Nov 2009 Dec 2009 Jan 2010 Feb 2010 Mar 2010 Apr 2010 May 2010Total Personal Income 12038.3 11937.1 11882.7 11969.8 12146.9 12029.7 11975.2 12011.9 12028.7 12023.8 12065.6 12118.7 12165 12170.1 12224.4 12283.8 12337.5 (% ch.) -1.3 -0.8 -0.5 0.7 1.5 -1 -0.5 0.3 0.1 0 0.3 0.4 0.4 0 0.4 0.5 0.4(year % ch.) -0.8 -1.6 -2.2 -1.6 -1.7 -2.6 -2.3 -2.3 -2.3 -2 -1.4 -0.6 1.1 2 2.9 2.6 1.6Disposable Personal Income 10822.4 10747.7 10726.3 10875.4 11063.9 10959.3 10903.5 10939.5 10959.8 10960.3 10999.7 11049.9 11083 11088.1 11139.3 11203 11252 (% ch.) 0.4 -0.7 -0.2 1.4 1.7 -0.9 -0.5 0.3 0.2 0 0.4 0.5 0.3 0 0.5 0.6 0.4(year % ch.) 2 1.4 1 2.2 -1.5 -0.5 0 1.2 1.2 1.4 1.8 2.5 2.4 3.2 3.9 3 1.7Wage Rate ($) 47639 47439 47401 47921 48164 48369 47907 48120 48098 48060 48094 48156 48409 48461 48543 48673 48738 (% ch.) -1.8 -0.4 -0.1 1.1 0.5 0.4 -1 0.4 0 -0.1 0.1 0.1 0.5 0.1 0.2 0.3 0.1(year % ch.) 0.6 0.2 -0.1 1 1.2 1.5 0.1 0 -0.2 -0.7 -0.9 -0.7 1.6 2.2 2.4 1.6 1.2Personal Consumption Expenditures (PCE) 9972.7 10011.3 9978.9 9968.1 9979.3 10050.6 10068.4 10197.4 10132.8 10188.6 10241.8 10278.8 10302.4 10350.4 10407.7 10409.1 10433.5 (% ch.) 0.8 0.4 -0.3 -0.1 0.1 0.7 0.2 1.3 -0.6 0.6 0.5 0.4 0.2 0.5 0.6 0 0.2(year % ch.) -1.1 -0.7 -1.5 -1.9 -2 -1.9 -1.6 -0.3 -0.6 0.7 2.3 3.9 3.3 3.4 4.3 4.4 4.6Consumer Installment Credit: Total Outstanding 2563.7 2550.7 2536.3 2521.6 2514.6 2506.1 2497.8 2495.3 2486.9 2479.7 2456.3 2448.8 2452.2 2444.4 2439 2440 -- (% ch. a.r.) 1.2 -5.9 -6.6 -6.7 -3.3 -4 -3.9 -1.2 -4 -3.4 -10.8 -3.6 1.7 -3.7 -2.6 0.5 -- (year % ch.) 1.3 0.4 -0.6 -1.6 -1.9 -2.7 -3.3 -3.2 -3.6 -3.7 -4.2 -4.4 -4.3 -4.2 -3.8 -3.2 -- Personal Saving as a % of Disposable Personal Income, (%) 4.4 3.4 3.5 4.9 6.4 4.9 4.3 3.4 4.2 3.7 3.6 3.7 3.8 3.4 3.3 3.8 4
Retail SalesTotal Retail Sales & Food Services 341.6 341.4 336.2 336.7 339.1 343.1 343.5 350.7 343.1 348.3 353.9 354.1 355.2 357.3 364.8 366.9 362.5 (% ch.) 1.8 -0.1 -1.5 0.1 0.7 1.2 0.1 2.1 -2.2 1.5 1.6 0.1 0.3 0.6 2.1 0.6 -1.2(year % ch.) -9.5 -8.5 -10.3 -10.5 -10.1 -9.2 -8.7 -6 -6.5 -2 2.4 5.5 4 4.7 8.5 9 6.9excl. Food Services & Drinking Places 303.1 302.8 297.9 298.3 300.7 304.9 305.3 312.6 304.9 310.2 315.4 315.8 317 318.1 325.4 327.4 323 (% ch.) 1.9 -0.1 -1.6 0.1 0.8 1.4 0.1 2.4 -2.5 1.7 1.7 0.1 0.4 0.3 2.3 0.6 -1.4(year % ch.) -10.7 -9.9 -11.6 -11.8 -11.3 -10.2 -9.6 -6.7 -7.2 -2.2 2.6 6.2 4.6 5.1 9.2 9.8 7.4excl. Autos & Gasoline Stations 255.7 256.1 253.6 254.2 254.2 254.6 254 255.3 256.2 256.7 258.3 258.3 259.4 262.9 266.1 267.6 265.4 (% ch.) 1.2 0.2 -1 0.2 0 0.2 -0.3 0.5 0.4 0.2 0.6 0 0.4 1.3 1.2 0.6 -0.8(year % ch.) -1.8 -0.8 -2.3 -3.2 -3.7 -3.9 -4.4 -3.1 -1.7 -0.9 0.6 2.2 1.5 2.6 4.9 5.3 4.4
TCB Consumer Confidence IndexOverall 37.4 25.3 26.9 40.8 54.8 49.3 47.4 54.5 53.4 48.7 50.6 53.6 56.5 46.4 52.3 57.7 62.7 (dif) -1.2 -12.1 1.6 13.9 14 -5.5 -2 7.1 -1.1 -4.8 2 3 2.8 -10 5.9 5.4 4.9Present Situation 29.7 22.3 21.9 25.5 29.7 25 23.3 25.4 23 21.1 21.2 20.2 25.2 21.7 25.2 28.2 29.8 (dif) -0.6 -7.4 -0.4 3.5 4.3 -4.7 -1.7 2.1 -2.4 -1.9 0.1 -1 5 -3.5 3.5 3 1.6Expectations 42.5 27.3 30.2 51 71.5 65.5 63.4 73.8 73.7 67 70.3 75.9 77.3 62.9 70.4 77.4 84.6 (dif) -1.7 -15.2 2.9 20.8 20.5 -6 -2.1 10.4 -0.1 -6.6 3.2 5.6 1.4 -14.4 7.4 7 7.2
The Reuters/UM Index of Consumer SentimentOverall 61.2 56.3 57.3 65.1 68.7 70.8 66 65.7 73.5 70.6 67.4 72.5 74.4 73.6 73.6 72.2 73.6 (dif) 1.1 -4.9 1 7.8 3.6 2.1 -4.8 -0.3 7.8 -2.9 -3.2 5.1 1.9 -0.8 0 -1.4 1.4Expectations 57.8 50.5 53.5 63.1 69.4 69.2 63.2 65 73.5 68.6 66.5 68.9 70.1 68.4 67.9 66.5 68.8 (dif) 3.8 -7.3 3 9.6 6.3 -0.2 -6 1.8 8.5 -4.9 -2.1 2.4 1.2 -1.7 -0.5 -1.4 2.3
Housing MarketNew Single-Family Homes Sold 339 370 350 341 367 396 408 405 391 396 368 356 349 347 389 446 300 (% ch.) -10.1 9.1 -5.4 -2.6 7.6 7.9 3 -0.7 -3.5 1.3 -7.1 -3.3 -2 -0.6 12.1 14.7 -32.7Existing Single-Family Homes Sold 4080 4190 4130 4190 4240 4330 4530 4480 4930 5230 5710 4760 4430 4360 4700 5060 4980 (% ch.) -3.8 2.7 -1.4 1.5 1.2 2.1 4.6 -1.1 10 6.1 9.2 -16.6 -6.9 -1.6 7.8 7.7 -1.6Housing Starts 488 581 520 477 550 583 587 585 586 529 589 576 612 605 634 659 593 (% ch.) -12.9 19.1 -10.5 -8.3 15.3 6 0.7 -0.3 0.2 -9.7 11.3 -2.2 6.3 -1.1 4.8 3.9 -10Housing Permits 549 566 522 523 550 600 587 610 605 576 621 681 629 650 685 610 574 (% ch.) -0.9 3.1 -7.8 0.2 5.2 9.1 -2.2 3.9 -0.8 -4.8 7.8 9.7 -7.6 3.3 5.4 -10.9 -5.9Median New Single-Family Home Price 208.6 209.7 205.1 219.2 222.3 214.7 214.2 207.1 216.6 215.1 218.8 222.6 218.2 221.9 225.4 202.9 200.9 (% ch.) -9.1 0.5 -2.2 6.9 1.4 -3.4 -0.2 -3.3 4.6 -0.7 1.7 1.7 -2 1.7 1.6 -10 -1Median Existing Single-Family Home Price 164.2 167.9 169.7 166 174.6 181.9 181.7 177.1 175.9 172 169.3 169.6 163.8 163.9 169.5 172.5 179.4 (% ch.) -6.2 2.3 1.1 -2.2 5.2 4.2 -0.1 -2.5 -0.7 -2.2 -1.6 0.2 -3.4 0.1 3.4 1.8 4
Data: Income & Consumption in Bil. $, SAARData: Credit & Retail Sales in Bil. $, SAData: Home Sales, Starts & Permits in Ths., SAARData: Home Prices in Ths. $

U.S. Price and ProductionConsumer Price Index, (1982-84=100, SA) Jan 2009 Feb 2009 Mar 2009 Apr 2009 May 2009 Jun 2009 Jul 2009 Aug 2009 Sep 2009 Oct 2009 Nov 2009 Dec 2009 Jan 2010 Feb 2010 Mar 2010 Apr 2010 May 2010All Items 212 212.9 212.6 212.8 213.1 214.6 214.8 215.6 215.9 216.4 216.9 217.2 217.6 217.6 217.7 217.6 217.2 (% ch.) 0.3 0.4 -0.1 0.1 0.1 0.7 0.1 0.4 0.2 0.2 0.2 0.2 0.2 0 0.1 -0.1 -0.2(year % ch.) -0.1 0.1 -0.4 -0.6 -1 -1.3 -2 -1.5 -1.3 -0.2 1.8 2.8 2.7 2.2 2.4 2.2 2Core (All Items Less Food & Energy) 217.2 217.7 218.1 218.6 218.9 219.3 219.5 219.7 220 220.5 220.5 220.8 220.5 220.6 220.7 220.8 221 (% ch.) 0.2 0.2 0.2 0.2 0.1 0.2 0.1 0.1 0.2 0.2 0 0.1 -0.1 0.1 0 0 0.1(year % ch.) 1.7 1.8 1.8 1.9 1.8 1.7 1.6 1.4 1.5 1.7 1.7 1.8 1.5 1.3 1.2 1 1Commodities 165.4 166.9 166.5 166.8 167.3 170.2 170.4 171.5 172 172.5 173.3 173.8 175.2 174.9 174.8 174.1 173.1 (% ch.) 0.6 0.9 -0.3 0.2 0.3 1.8 0.1 0.6 0.3 0.3 0.5 0.3 0.8 -0.2 -0.1 -0.4 -0.6(year % ch.) -4.3 -3.6 -4.3 -4.3 -4.7 -4.6 -5.6 -4.5 -4.3 -1.8 3.3 5.7 5.9 4.8 5 4.4 3.5Services 258.3 258.7 258.7 258.7 258.7 258.7 258.9 259.3 259.6 260 260.1 260.3 259.7 260 260.5 260.8 261.1 (% ch.) 0.1 0.1 0 0 0 0 0.1 0.2 0.1 0.2 0.1 0.1 -0.2 0.1 0.2 0.1 0.1(year % ch.) 2.8 2.7 2.3 2 1.5 1.1 0.6 0.7 0.8 0.9 0.9 0.9 0.5 0.5 0.7 0.8 0.9
Personal Consumption ExpendituresPCE C-W Price Index, (2000 = 100, SA) 108.3 108.6 108.5 108.6 108.6 109.2 109.2 109.6 109.7 110 110.2 110.4 110.6 110.6 110.7 110.7 110.7 (% ch.) 0.2 0.3 -0.1 0.1 0.1 0.5 0 0.3 0.1 0.3 0.2 0.2 0.2 0 0.1 0 0(year % ch.) 0.5 0.6 0.2 0.1 -0.3 -0.4 -0.9 -0.6 -0.6 0.1 1.5 2.1 2.1 1.8 2.1 2 1.9PCE C-W Price Index Less Food & Energy, (2000 = 100, SA) 108 108.2 108.3 108.6 108.7 108.9 108.9 109 109.1 109.4 109.5 109.6 109.6 109.7 109.8 109.9 110.1 (% ch.) 0.1 0.2 0.1 0.3 0.1 0.1 0.1 0.1 0.1 0.3 0.1 0.1 0 0 0.1 0.1 0.2(year % ch.) 1.7 1.8 1.7 1.7 1.6 1.5 1.3 1.3 1.2 1.4 1.5 1.6 1.5 1.4 1.4 1.2 1.3
Producer Price Index, (1982=100, SA)Finished Goods 171.2 170.9 169.6 170.6 170.6 173.7 171.6 174.1 173.3 173.6 176.2 177.1 179.4 178.8 180 179.8 179.3 (% ch.) 1.1 -0.2 -0.8 0.6 0 1.8 -1.2 1.5 -0.5 0.2 1.5 0.5 1.3 -0.3 0.7 -0.1 -0.3(year % ch.) -1.2 -1.7 -3.5 -3.3 -4.6 -4.3 -6.6 -4.3 -4.8 -2.1 2.3 4.5 4.8 4.6 6.1 5.4 5.1Finished Goods Less Food and Energy 171 171.2 171.5 171.6 171.5 172 171.8 172.3 172.1 171.3 172 172.1 172.7 172.8 172.9 173.3 173.7 (% ch.) 0.2 0.1 0.2 0.1 -0.1 0.3 -0.1 0.3 -0.1 -0.5 0.4 0.1 0.3 0.1 0.1 0.2 0.2(year % ch.) 4.2 3.8 3.9 3.4 3.1 3.2 2.5 2.3 1.8 0.7 1.1 0.9 1 0.9 0.8 1 1.3
West Texas Intermediate Oil Price, ($ per Bbl) 41.7 39.2 48 49.8 59.2 69.7 64.1 71.1 69.5 75.8 78.1 74.3 78.2 76.4 81.2 84.5 73.8 (% ch.) 1.8 -6.2 22.5 3.8 18.8 17.8 -8 10.9 -2.3 9.2 3 -4.8 5.3 -2.3 6.3 4 -12.6
ProductionIndustrial Production, (Index 2002=100, SA) 100.1 99.3 97.7 97.2 96.2 95.8 96.9 98.1 98.7 98.9 99.6 100.2 101.3 101.3 101.6 102.3 103.5 (% ch.) -2.2 -0.8 -1.6 -0.5 -1.1 -0.5 1.2 1.2 0.6 0.2 0.7 0.7 1.1 -0.1 0.3 0.7 1.2Purchasing Managers Index 35.5 35.7 36.4 40.4 43.2 45.3 49.1 52.8 52.4 55.2 53.7 54.9 58.4 56.5 59.6 60.4 59.7 (dif) 3 0.2 0.7 4 2.8 2.1 3.8 3.7 -0.4 2.8 -1.5 1.2 3.5 -1.9 3.1 0.8 -0.7Business Activity 44.1 41.3 44.5 45.7 43.6 48.8 47 50.9 53.2 54 49.6 53.2 52.2 54.8 60 60.3 61.1 (dif) 5.4 -2.8 3.2 1.2 -2.1 5.2 -1.8 3.9 2.3 0.8 -4.4 3.6 -1 2.6 5.2 0.3 0.8Total New Orders 162.8 165.2 160.5 163.1 167.1 164.3 176.5 171.9 177.5 177.5 177.1 178.6 187.5 188.3 188.5 194.2 192 (% ch.) -8 1.4 -2.8 1.6 2.5 -1.6 7.4 -2.6 3.2 0 -0.2 0.9 4.9 0.5 0.1 3 -1.1(year % ch.) -29.3 -27.9 -30 -27.9 -26.1 -27.6 -21.3 -19.1 -16.3 -8.5 -5.2 1 15.1 14 17.5 19.1 14.9Excluding Defense 153.8 153 148.5 149.7 152.4 152.3 163.7 159.6 164.1 166 166 167.6 172.5 175 175 181.2 179.2 (% ch.) -4.5 -0.5 -2.9 0.8 1.8 -0.1 7.5 -2.5 2.8 1.2 0 0.9 3 1.4 0 3.5 -1.1(year % ch.) -29.9 -29.3 -31.7 -30.6 -28.8 -28.6 -23.1 -20.7 -16.6 -9.3 -5.5 4 12.2 14.4 17.8 21 17.6
Inventory/Sales Ratios, SATotal Business 1.48 1.44 1.45 1.43 1.41 1.37 1.35 1.31 1.31 1.3 1.27 1.26 1.25 1.26 1.23 1.23 -- Manufacturing 1.46 1.43 1.44 1.42 1.42 1.37 1.34 1.33 1.3 1.29 1.27 1.25 1.24 1.26 1.24 1.24 --
Data: Orders in Bil. $, SA

Rates & TradeRates Dec 2008 Jan 2009 Feb 2009 Mar 2009 Apr 2009 May 2009 Jun 2009 Jul 2009 Aug 2009 Sep 2009 Oct 2009 Nov 2009 Dec 2009 Jan 2010 Feb 2010 Mar 2010 Apr 2010M2 Money Stock, (Bil. $, SA) 8239.7 8300.7 8338.4 8390.4 8342.5 8415.4 8442.1 8437.7 8414.5 8455.2 8487.8 8522.7 8543.9 8485.5 8541 8512 8479.9 (year % ch.) 9.8 10.2 9.4 9.2 8.2 8.8 9 8.2 8.1 7.1 6 5.8 3.7 2.2 2.4 1.4 1.6Discount Rate, (% P.A.) 0.86 0.5 0.5 0.5 0.5 0.5 0.5 0.5 0.5 0.5 0.5 0.5 0.5 0.5 0.59 0.75 0.75Federal Funds Target Rate, (%) 0.13 0.13 0.13 0.13 0.13 0.13 0.13 0.13 0.13 0.13 0.13 0.13 0.13 0.13 0.13 0.13 0.13Federal Funds Effective Rate, (% P.A.) 0.16 0.15 0.22 0.18 0.15 0.18 0.21 0.16 0.16 0.15 0.12 0.12 0.12 0.11 0.13 0.16 0.2Prime Rate, (% P.A.) 3.61 3.25 3.25 3.25 3.25 3.25 3.25 3.25 3.25 3.25 3.25 3.25 3.25 3.25 3.25 3.25 3.253-Month T-Bill Auction Average, (%) 0.04 0.12 0.34 0.25 0.18 0.18 0.17 0.19 0.18 0.13 0.08 0.06 0.06 0.07 0.1 0.15 0.1510-Year T-Bond Nominal, (% P.A.) 2.42 2.52 2.87 2.82 2.93 3.29 3.72 3.56 3.59 3.4 3.39 3.4 3.59 3.73 3.69 3.73 3.8510-Year T-Bond minus FFunds Rate (Y.Curve) 226 237 265 264 278 311 351 340 343 325 327 328 347 362 356 357 365Moodys AAA Corporate, (% P.A.) 5.06 5.05 5.27 5.5 5.39 5.54 5.61 5.41 5.26 5.13 5.15 5.19 5.26 5.26 5.35 5.27 5.29AAA minus 10-Year Bond 264 253 240 268 246 225 189 185 167 173 176 179 167 153 166 154 144Municipal Bond Yield Average, (%, Seasoned) 5.93 5.43 5.33 5.53 5.32 5.1 5.41 5.21 5.01 4.6 4.63 4.76 4.64 4.7 4.62 4.59 4.61New York Stock Exchange Vol. (Mil.) 47648 45408 50307 65564 53852 50358 46401 40898 41686 43115 43289 32797 35629 33536 32679 36705 41460Dow Jones Industrials, (Index 1920=100, Monthly End) 8776 8001 7063 7609 8168 8500 8447 9172 9496 9712 9713 10345 10428 10067 10325 10857 11009S&P 500 Stock Price (Index 1941-43=10, Monthly Avg) 878 866 805 757 848 902 926 936 1010 1045 1068 1088 1110 1124 1089 1169 1197S&P Common Stock P/E Ratio, (%, NSA, Month Avg) 19.7 18 25.6 52.6 58.7 127.5 134 144 129.2 140.8 138 -- -- -- -- -- -- Nasdaq Composite Index, (Index Feb 05 1971=100) 1526 1537 1486 1432 1641 1726 1827 1874 1997 2085 2123 2144 2221 2268 2194 2362 2476
Trade, (Bil. $, SA)Total Exports 131.9 125.5 126.9 126 124.1 125.8 127.9 129.6 130.4 134.2 138.1 139 143.4 144.4 144.3 149.8 148.8 (% ch.) -6.5 -4.9 1.2 -0.7 -1.5 1.4 1.6 1.4 0.6 2.9 2.9 0.7 3.1 0.7 -0.1 3.8 -0.7(year % ch.) -11 -16.4 -16.9 -17.4 -20.8 -20.7 -21.8 -21.8 -20 -12.2 -8 -1.5 8.7 15.1 13.7 18.9 19.9Total Imports 172.9 161.5 153.3 154 152.6 150.7 155 162.7 161.4 169.3 170.4 174.3 180.5 179.5 184.5 189.9 189.1 (% ch.) -6.5 -6.6 -5.1 0.5 -0.9 -1.2 2.9 5 -0.8 4.9 0.6 2.3 3.6 -0.6 2.8 2.9 -0.4(year % ch.) -16.1 -23.1 -28.8 -27.1 -30.6 -31.5 -31.1 -29.9 -28 -20.4 -18.7 -5.8 4.4 11.1 20.3 23.3 23.9Total Trade Balance -41 -36.1 -26.4 -28 -28.4 -24.9 -27.1 -33.1 -31.1 -35.2 -32.3 -35.3 -37.1 -35.1 -40.1 -40 -40.3 (% ch.) -6.4 -12.1 -26.9 6.2 1.6 -12.6 9.2 21.9 -6.1 13.2 -8.1 9.2 5.3 -5.6 14.5 -0.3 0.6(year % ch.) -29.1 -39.8 -57.9 -52.4 -54.8 -59.4 -55.7 -50.2 -49.4 -41.2 -45.7 -19.5 -9.5 -2.8 52.3 43 41.6
Import Price Index, (2000=100, NSA)Total Imports 114.5 113 113 113.6 114.8 116.8 120 119.3 121.1 121.3 122.3 124.1 124.4 125.9 125.8 126.4 127.5 (% ch.) -4.6 -1.3 0 0.5 1.1 1.7 2.7 -0.6 1.5 0.2 0.8 1.5 0.2 1.2 -0.1 0.5 0.9(year % ch.) -10.1 -12.5 -12.7 -14.9 -16.4 -17.3 -17.5 -19.1 -15.3 -12 -5.6 3.4 8.6 11.4 11.3 11.3 11.1Excluding Fuels 112.7 111.9 111.4 110.7 110.8 111 111.2 111 111.4 111.9 112.3 112.6 113 113.4 113.5 113.7 114.3 (% ch.) -1.1 -0.7 -0.4 -0.6 0.1 0.2 0.2 -0.2 0.4 0.4 0.4 0.3 0.4 0.4 0.1 0.2 0.5(year % ch.) 1.2 -0.3 -1.2 -2.8 -3.8 -4.1 -4.5 -5.3 -5.1 -4.2 -3.1 -1.1 0.3 1.3 1.9 2.7 3.2Canada (% ch.) -4.4 -1.8 -2.1 -0.3 -0.7 1.7 2.7 -0.6 1.2 1.1 1.2 2.8 1 3.6 0.8 -0.4 0.1Mexico (% ch.) 0.5 -1.5 -1.6 -1 2.7 3.1 1.1 -1.7 1.7 0.5 1.1 0.8 -0.7 1.7 -1.1 1.2 1.2European Union (% ch.) -1.5 0.1 -0.2 -0.4 0.2 -0.1 0.6 0.2 0.2 0.4 0.6 0.6 0.4 0.2 0 0.3 0.2Japan (% ch.) 0.3 0.2 0.2 -0.1 -0.1 0 0.7 0.1 0.1 0.1 0.3 0 0.3 0.1 -0.1 0.3 -0.3China (% ch.) -0.5 -0.4 -0.5 -0.6 -0.5 0 0 -0.1 0.3 -0.1 -0.1 0 0.2 -0.3 -0.1 -0.1 0.2
Export Price Index, (2000=100, NSA)Total Exports 115.8 116.6 116.3 115.5 116.1 116.6 117.8 117.4 118.1 117.9 117.9 118.9 119.7 120.7 120.3 121.2 122.7 (% ch.) -2.2 0.7 -0.3 -0.7 0.5 0.4 1 -0.3 0.6 -0.2 0 0.8 0.7 0.8 -0.3 0.7 1.2(year % ch.) -2.9 -3.4 -4.5 -6.7 -6.7 -6.6 -6.6 -8.3 -6.2 -5.6 -3.6 0.4 3.4 3.5 3.4 4.9 5.7
Yen Per U.S. $ 91.3 90.1 92.9 97.9 99 96.6 96.6 94.3 94.9 91.3 90.4 89.3 90 91.1 90.1 90.7 93.5$ per EURO 1.4 1.3 1.3 1.3 1.3 1.4 1.4 1.4 1.4 1.5 1.5 1.5 1.5 1.4 1.4 1.4 1.3Total Surplus or Deficit, ($Mil.) -51754 -63457 -193859 -191589 -20907 -189651 -94332 -180680 -103555 -45207 -176363 -120287 -91410 -42634 -220909 -65387 -82689

NYC Economic Data 2005 Q4 2006 Q1 2006 Q2 2006 Q3 2006 Q4 2007 Q1 2007 Q2 2007 Q3 2007 Q4 2008 Q1 2008 Q2 2008 Q3 2008 Q4 2009 Q1 2009 Q2 2009 Q3 2009 Q4Wage Rate 70,870 95,313 62,498 61,483 74,738 109,602 66,223 66,157 78,298 108,867 67,198 66,751 78,329 86,181 65,245 64,757 79,016 (year % ch.) 3.8 17.6 6.9 0.4 5.5 15 6 7.6 4.8 -0.7 1.5 0.9 0 -20.8 -2.9 -3 0.9Finance Wage Rate 202,306 463,691 156,082 144,422 216,817 578,666 167,910 168,880 228,548 560,292 169,120 165,356 226,544 365,280 160,291 154,075 239,831 (year % ch.) 4.5 32 11 0.7 7.2 24.8 7.6 16.9 5.4 -3.2 0.7 -2.1 -0.9 -34.8 -5.2 -6.8 5.9Securities Wage Rate 278,561 691,395 199,412 182,951 298,737 864,304 212,206 214,988 321,933 818,936 215,063 212,525 318,088 501,239 204,901 194,527 335,441 (year % ch.) 2.4 31.8 13.4 -1.6 7.2 25 6.4 17.5 7.8 -5.2 1.3 -1.1 -1.2 -38.8 -4.7 -8.5 5.5Private Non-Finance Wage Rate 58,315 58,685 52,779 52,758 61,493 62,923 56,039 55,768 64,465 64,501 57,198 57,183 65,211 59,840 56,170 56,320 65,398 (year % ch.) 3.13 7.31 4.87 0.75 5.45 7.22 6.18 5.71 4.83 2.51 2.07 2.54 1.16 -7.23 -1.8 -1.51 0.29Total Wage Earnings 251.2 332.9 222.1 217.8 270.3 392.9 241.1 239.8 290.4 398.1 248.3 244.7 289.7 308.8 233.3 228 283.3 (year % ch.) 5.3 19.4 8.9 2.2 7.6 18 8.5 10.1 7.4 1.3 3 2.1 -0.2 -22.4 -6 -6.8 -2.2Finance Wage Earnings 65.6 150.7 51.4 48.7 72.7 194.5 56.9 58.5 78.7 190.7 57.2 56.3 75.1 117 49.7 47.4 72.9 (year % ch.) 7.6 35.4 14.4 4.6 10.8 29.1 10.8 20.1 8.2 -2 0.5 -3.7 -4.6 -38.6 -13.2 -15.9 -2.9Securities Wage Earnings 47.8 118.2 34.7 33 53.5 154.8 38.7 40.5 60 151.6 39.6 39.5 56.9 85.8 33.7 31.8 54.1 (year % ch.) 7.6 37.2 18.9 3.3 11.8 31 11.4 22.8 12.2 -2.1 2.4 -2.5 -5.2 -43.4 -14.9 -19.4 -4.8Private Non-Finance Wage Earnings 156 154 141.3 140.8 168.2 169.9 154.3 152.7 181.4 178.3 160.3 159.1 183.6 162.1 152.4 150.7 178.7 (year % ch.) 4.7 9.2 7.2 2.7 7.8 10.3 9.2 8.4 7.9 4.9 3.9 4.2 1.2 -9.1 -4.9 -5.3 -2.7
NYSE Member-Firm Profits, (Bil. $) 2.3 4.7 4.5 4.1 7.6 4.7 4.2 -3.8 -16.4 -22.4 1.6 -10.7 -11.2 8.2 28 13.5 11.7 (dif) -0.5 2.4 -0.2 -0.5 3.5 -2.9 -0.4 -8.1 -12.5 -6 24 -12.3 -0.5 19.4 19.8 -14.6 -1.7
Total Employment, SA 3621.8 3638.8 3660.1 3670.6 3696.7 3724.1 3735.2 3744.5 3771.1 3794.9 3801 3801.5 3777.7 3730.3 3689.3 3688.9 3639.7 (year % ch.) 1.6 1.73 1.77 1.55 2.07 2.34 2.05 2.01 2.01 1.9 1.76 1.52 0.17 -1.7 -2.94 -2.96 -3.65Private Employment, SA 3067.4 3083.4 3105.4 3116.8 3139.6 3164.6 3178.1 3186.4 3209.6 3231.1 3237.1 3238.5 3212.1 3164.6 3127.5 3109.5 3086.8 (year % ch.) 1.83 1.99 2.16 1.96 2.36 2.63 2.34 2.23 2.23 2.1 1.86 1.63 0.08 -2.06 -3.38 -3.98 -3.9Unemployment Rate 5.8 5.4 5.2 4.8 4.6 4.6 4.9 5.1 4.8 4.6 4.9 5.6 6.6 8 9.3 10.1 10.5 (dif) 0.03 -0.37 -0.23 -0.33 -0.23 0.03 0.27 0.17 -0.27 -0.2 0.33 0.7 0.97 1.4 1.27 0.83 0.37
Consumer Price Index, (1982-84=100, SA)All Items 215.4 216.8 221.5 223.4 221.3 223.1 227.1 228.4 229.2 231.3 236.2 240.3 235.3 234.4 236.2 238.2 238.5 (year % ch.) 3.99 3.35 4.7 4.31 2.75 2.9 2.53 2.26 3.55 3.68 4.02 5.2 2.69 1.31 0.02 -0.9 1.37Core (All Items Less Food & Energy) 224.9 227.2 231.4 232.6 233 233.9 236.2 237.6 237.8 239 241.2 244.2 244.5 245.3 246.8 247.6 248.3 (year % ch.) 2.73 2.16 3.75 4.03 3.59 2.98 2.1 2.17 2.09 2.18 2.09 2.79 2.79 2.62 2.32 1.4 1.58
NYC Real Estate Jan 2009 Feb 2009 Mar 2009 Apr 2009 May 2009 Jun 2009 Jul 2009 Aug 2009 Sep 2009 Oct 2009 Nov 2009 Dec 2009 Jan 2010 Feb 2010 Mar 2010 Apr 2010 May 2010Primary Asking Rent ($) 78.52 76.1 74.26 72.91 71.84 67.75 65.04 64.4 63.62 62.75 62.48 61.92 61.25 61.28 61.66 61.55 61.13 (dif) -2.07 -2.43 -1.83 -1.36 -1.07 -4.09 -2.71 -0.64 -0.78 -0.87 -0.27 -0.56 -0.67 0.03 0.38 -0.12 -0.42Midtown Asking Rent (Pri, $) 83.31 80.4 78.36 76.6 75.47 70.83 68.04 67.7 66.95 66.13 65.78 64.92 64.36 64.42 64.9 64.87 64.61 (dif) -2.35 -2.91 -2.03 -1.76 -1.13 -4.64 -2.79 -0.35 -0.75 -0.81 -0.35 -0.86 -0.56 0.07 0.48 -0.03 -0.26Downtown Asking Rent (Pri, $) 51.55 49.89 49.08 49.43 48.71 48.47 47.77 46.21 45.96 45.11 44.2 43.78 42.75 42.44 41.46 41.11 40.7 (dif) -1.7 -1.66 -0.81 0.35 -0.72 -0.24 -0.7 -1.56 -0.25 -0.85 -0.91 -0.42 -1.03 -0.31 -0.98 -0.35 -0.41
Primary Vacancy Rate 9 9.6 10.2 11.3 11.6 11.5 12.2 11.9 12.1 12.4 12.3 12 12.1 12.2 12.5 12.5 12Midtown Vacancy Rate (Pri) 9.5 10.2 10.9 12.1 12.4 12.3 12.9 12.5 12.7 13 12.9 12.8 12.9 13 13.4 13.4 12.8Downtown Vacancy Rate (Pri) 6.9 6.9 7.3 7.8 8 8.1 9.2 9.3 9.8 10.2 9.6 8.7 8.9 8.9 8.9 9 9
NYC Housing Permits 306 270 501 440 302 1201 621 452 374 217 493 776 253 210 542 217 -- (dif) -442 -36 231 -61 -138 899 -580 -169 -78 -157 276 283 -523 -43 332 -325 --
NY Metro Area CSW Index 180.9 177.8 173.6 170.7 171.2 172.4 174.2 175.4 175.1 174.6 172.7 171.9 171.4 170.6 169.4 -- -- (year % ch.) -9.7 -10.3 -11.7 -12.3 -11.9 -11.5 -10.1 -9.3 -8.6 -8 -7.4 -6.3 -5.3 -4.1 -2.4 -- --

NYC Employment Seasonally AdjustedJan 2009 Feb 2009 Mar 2009 Apr 2009 May 2009 Jun 2009 Jul 2009 Aug 2009 Sep 2009 Oct 2009 Nov 2009 Dec 2009 Jan 2010 Feb 2010 Mar 2010 Apr 2010 May 2010
Total Nonfarm 3746.9 3730.9 3713 3699.6 3693.1 3675.1 3703.3 3699.4 3664 3655.9 3642.4 3620.9 3645.8 3643 3659.8 3677.6 3700.4 (dif) -18.6 -15.9 -17.9 -13.5 -6.5 -18 28.2 -3.9 -35.4 -8.2 -13.5 -21.5 24.9 -2.7 16.8 17.8 22.8Private 3181 3165.4 3147.5 3133.7 3131.7 3117.1 3113.4 3108.3 3106.9 3097.5 3089 3074 3099.8 3096.8 3112.9 3128.1 3133.1 (dif) -18 -15.6 -17.9 -13.8 -2 -14.5 -3.8 -5 -1.5 -9.4 -8.4 -15 25.8 -3 16.1 15.3 5Financial Activities 451.8 447.4 443.5 440.2 437.8 431.8 430.4 428.7 428.6 428.1 427.2 424 426 424.7 427.2 430.3 432.5 (dif) -2 -4.4 -3.9 -3.3 -2.4 -6 -1.5 -1.7 -0.1 -0.5 -0.9 -3.2 2.1 -1.4 2.5 3.1 2.3Finance & Insurance 331.5 327.7 324.9 321.5 319.3 314.2 312.5 310.8 310.6 309.8 308.2 305.7 306.3 304.3 306.2 308.8 310.7 (dif) -1.8 -3.8 -2.8 -3.4 -2.2 -5.1 -1.7 -1.7 -0.2 -0.8 -1.6 -2.5 0.6 -1.9 1.8 2.6 2Securities 176.5 174.4 172.6 170.6 169.2 164.9 164.1 162.9 162.9 162.2 161.4 161.7 159.7 158.4 159.2 159.7 160.5 (dif) -2 -2.1 -1.8 -2 -1.4 -4.3 -0.9 -1.1 0 -0.7 -0.7 0.3 -2 -1.3 0.8 0.5 0.8Banking 90.2 88.9 88.2 87.2 86.6 86 85.4 85 84.9 84.3 83.7 82.6 84.1 83.9 84.1 85.5 86.3 (dif) 0.3 -1.3 -0.7 -0.9 -0.6 -0.6 -0.5 -0.5 -0.1 -0.5 -0.7 -1 1.5 -0.1 0.2 1.4 0.8Real Estate & Rental & Leasing 120.3 119.7 118.5 118.7 118.5 117.7 117.9 117.9 118 118.3 119 118.2 119.8 120.3 121 121.5 121.8 (dif) -0.2 -0.7 -1.1 0.2 -0.2 -0.8 0.2 0 0.2 0.3 0.6 -0.7 1.5 0.6 0.7 0.5 0.3Information 164.4 161.9 162.4 163 161.8 159.6 160.7 159.5 159.9 161.2 159.7 159.6 160.8 161.4 161.6 161.4 161.2 (dif) -1.3 -2.5 0.5 0.6 -1.2 -2.2 1.1 -1.2 0.4 1.3 -1.5 -0.1 1.2 0.6 0.3 -0.2 -0.2Professional & Business Services 590.7 586.1 582.4 577.1 575 571.4 569.4 566.4 566.3 563.6 564.1 559.3 561.2 562.5 564.7 569.4 572.8 (dif) -6.2 -4.5 -3.7 -5.3 -2.2 -3.6 -2 -3 -0.1 -2.7 0.5 -4.8 1.9 1.3 2.2 4.7 3.5Professional, Scientific, & Technical Services 337.9 335.1 333.7 331.4 328.6 325.9 324.9 322.3 322.2 319.8 319.7 318.5 320.6 323.2 324.1 327.2 329.3 (dif) -4.6 -2.8 -1.4 -2.2 -2.9 -2.7 -1 -2.6 -0.1 -2.5 -0.1 -1.2 2.1 2.5 0.9 3.1 2.2Management of Companies & Enterprises 62.2 62.1 61.7 61.2 60.7 60.1 59.1 59.4 59.4 59.2 59.3 58.9 60.1 60 60.3 60.6 60.7 (dif) -0.1 -0.1 -0.4 -0.5 -0.5 -0.7 -1 0.3 0 -0.2 0.1 -0.4 1.2 0 0.2 0.3 0.1Administrative Services 190.6 189 187.1 184.5 185.7 185.4 185.4 184.7 184.6 184.6 185.1 181.9 180.5 179.3 180.3 181.7 182.8 (dif) -1.5 -1.6 -1.9 -2.6 1.2 -0.2 0 -0.7 0 0 0.5 -3.2 -1.4 -1.2 1 1.4 1.1Employment Services 59.2 58.2 56.9 54.7 55.9 56.2 56.3 56.1 57.8 57.2 56.9 57 56.6 57.3 57.5 57.7 59.9 (dif) -0.7 -1.1 -1.2 -2.2 1.2 0.4 0 -0.2 1.7 -0.6 -0.3 0.1 -0.4 0.7 0.3 0.2 2.2Educational & Health Services 729.3 731.3 728.6 730.8 732.6 734.1 734.7 737.4 735.6 737 738 737.1 745.2 742.4 744.9 748.1 748.7 (dif) 2.2 1.9 -2.7 2.2 1.9 1.5 0.6 2.7 -1.7 1.4 1 -1 8.1 -2.8 2.5 3.2 0.6Educational Services 163.4 163.5 163.9 163.7 164.3 165.2 165.3 166.2 164.3 164.9 164.8 164.4 164.8 163.4 164.6 165.1 165.4 (dif) -0.2 0.1 0.4 -0.3 0.6 0.9 0.1 0.8 -1.9 0.6 -0.1 -0.4 0.4 -1.4 1.1 0.5 0.3Health Care & Social Assistance 566 567.8 564.6 567.1 568.3 568.9 569.4 571.2 571.3 572.1 573.3 572.7 580.4 579 580.4 583 583.3 (dif) 2.4 1.8 -3.1 2.5 1.2 0.6 0.4 1.8 0.1 0.8 1.1 -0.6 7.7 -1.4 1.4 2.7 0.2Leisure & Hospitality 308.5 307.7 306.8 304.9 308.4 307.9 308.1 306.3 311.1 309.4 309.2 306.3 311.5 312.4 314.3 313.9 314 (dif) -1.3 -0.7 -0.9 -1.9 3.5 -0.5 0.2 -1.8 4.8 -1.7 -0.2 -2.9 5.2 0.9 1.8 -0.4 0.1Arts, Entertainment, & Recreation 68.3 68.7 68 67.3 67.2 67.2 67 66.4 67.9 67.3 67.2 66.8 68.6 68.5 69.9 68.7 68.5 (dif) -0.9 0.4 -0.7 -0.7 -0.1 0 -0.2 -0.6 1.5 -0.7 -0.1 -0.4 1.8 -0.1 1.3 -1.2 -0.2Accommodation & Food Services 240.2 239 238.8 237.5 241.2 240.7 241.1 239.9 243.2 242.1 241.9 239.4 242.8 243.9 244.4 245.2 245.5 (dif) -0.4 -1.1 -0.3 -1.2 3.7 -0.5 0.4 -1.2 3.3 -1.1 -0.2 -2.5 3.4 1.1 0.5 0.8 0.3Other Services 160.5 160.6 160.2 159.8 159.9 159.8 160 160.5 159.3 159 158.6 158.3 158.9 158.9 159.7 160.4 161.5 (dif) -0.4 0.1 -0.4 -0.4 0.1 -0.2 0.2 0.5 -1.2 -0.3 -0.3 -0.4 0.6 0 0.7 0.7 1.1Trade, Transportation, & Utilities 560.5 558 553.9 551 551 549.7 548.1 549.3 547.5 543 537 535.5 541.1 542 546.3 548.4 549.2 (dif) -4.5 -2.5 -4.1 -2.9 0.1 -1.3 -1.6 1.3 -1.8 -4.5 -6 -1.5 5.6 0.9 4.3 2.1 0.7Retail Trade 292.6 292 290 289 289.8 290.1 290.3 292.2 291.8 287.3 282.6 282.7 290.6 291.9 293.9 295.5 296.8 (dif) -2.5 -0.6 -2 -1 0.9 0.2 0.3 1.8 -0.4 -4.4 -4.8 0.2 7.9 1.3 2 1.6 1.3Wholesale Trade 144.1 142.7 141.5 140.2 139.9 138.9 137.5 137.7 136.9 136.3 135.3 135.4 135.2 134.6 135.7 136.1 135.7 (dif) -0.9 -1.4 -1.2 -1.3 -0.3 -1.1 -1.3 0.2 -0.8 -0.6 -1 0.1 -0.2 -0.6 1.1 0.4 -0.4Transportation & Warehousing 107.5 107 106 105.5 105 104.7 104.1 103.4 102.9 103.3 103.2 101.4 99.4 99.5 100.7 100.9 100.7 (dif) -1.3 -0.5 -0.9 -0.5 -0.5 -0.4 -0.5 -0.7 -0.5 0.3 0 -1.8 -2 0.2 1.2 0.2 -0.2Utilities 16.3 16.3 16.3 16.2 16.3 16.1 16.1 16.1 16 16.1 16 16 15.9 15.9 16 15.9 16 (dif) 0.2 0 0 -0.1 0 -0.1 -0.1 0 -0.1 0.2 -0.2 0.1 -0.1 0 0.1 -0.1 0Construction 127.1 126.2 124.8 123.4 122.3 120.5 120.5 119.1 117.8 115.9 115.3 114.5 113.9 111.1 113.4 115.5 113.5 (dif) -1.7 -1 -1.4 -1.4 -1.1 -1.8 0 -1.4 -1.3 -1.9 -0.6 -0.8 -0.6 -2.7 2.3 2 -2Manufacturing 88.2 86.2 85 83.6 82.9 82.3 81.6 81.2 80.7 80.3 79.9 79.5 81.2 81.3 80.7 80.8 79.7 (dif) -2.9 -2 -1.2 -1.3 -0.8 -0.6 -0.7 -0.5 -0.5 -0.4 -0.4 -0.4 1.7 0.1 -0.6 0.1 -1Government 565.8 565.5 565.5 565.9 561.4 558 590 591.1 557.2 558.4 553.4 546.8 545.9 546.3 546.9 549.5 567.3 (dif) -0.6 -0.3 0 0.3 -4.4 -3.4 32 1.2 -33.9 1.2 -5 -6.5 -0.9 0.3 0.7 2.5 17.8
Source: NYS DOLData: Ths., Seasonally Adjusted by OMB

NYC Employment Non-Seasonally AdjustedFeb 2009 Mar 2009 Apr 2009 May 2009 Jun 2009 Jul 2009 Aug 2009 Sep 2009 Oct 2009 Nov 2009 Dec 2009 Jan 2010 Feb 2010 Mar 2010 Apr 2010 May 2010 2009 2010
Total 3700.5 3695.7 3689.4 3696 3691.4 3701.7 3675.4 3653 3672.7 3684.5 3680.9 3600.7 3614.1 3642.5 3668 3703.4 3686.8 3645.7 (year dif) -63.3 -83.9 -105.8 -105.8 -123.3 -97.8 -106.7 -134.9 -134.8 -136.5 -147.3 -99.3 -86.4 -53.2 -21.4 7.4 -106.8 -41Private 3137.9 3130.8 3124.5 3132.8 3132.5 3095.1 3079.1 3103.8 3119.1 3132.2 3133.8 3059.9 3070.7 3096.1 3119.4 3134.1 3121.7 3096 (year dif) -65.1 -85.4 -105.6 -104.2 -118.6 -126.4 -135.4 -128.6 -128.3 -124.5 -127.5 -79.3 -67.2 -34.7 -5.1 1.3 -107.8 -25.7Financial Activities 444.7 441.2 436.8 434.1 433.7 434.5 432.7 428.3 428.5 428.3 427.4 423 422.2 425 427 429 434.9 425.2 (year dif) -22.6 -26.1 -28.5 -30 -35.3 -36.9 -38.6 -33.7 -31.3 -29.8 -30 -25.5 -22.5 -16.2 -9.8 -5.1 -30.1 -9.7Finance & Insurance 326 323.1 318.4 315.8 315 316.8 315.4 310.4 309.6 308.7 307.6 304.4 302.8 304.4 305.8 307.4 316.3 305 (year dif) -20.4 -22.3 -25.3 -26.6 -31 -32.6 -34.5 -30 -28.3 -28 -27.7 -25 -23.2 -18.7 -12.6 -8.4 -27 -11.4Securities 173 170.6 168.1 166.5 165.8 167.5 166.5 162.9 162.1 161.9 162.9 158.6 157.2 157.3 157.3 157.9 166.9 157.7 (year dif) -14.2 -15.3 -16.9 -17.6 -21.6 -22.6 -24.2 -20.5 -19.4 -18.8 -16.8 -16.6 -15.8 -13.3 -10.8 -8.6 -18.3 -9.3Banking 88.9 88.5 87 86.2 85.8 85.9 85.5 84.7 84.2 83.6 82.9 83.7 84 84.4 85.3 85.9 86.1 84.7 (year dif) -4.8 -5.4 -6.2 -6.5 -6.8 -7 -7.2 -6.6 -6.7 -6.9 -7.3 -6 -4.9 -4.1 -1.7 -0.3 -6.3 -1.4Real Estate & Rental & Leasing 118.7 118.1 118.4 118.3 118.7 117.7 117.3 117.9 118.9 119.6 119.8 118.6 119.4 120.6 121.2 121.6 118.5 120.3 (year dif) -2.2 -3.8 -3.2 -3.4 -4.3 -4.3 -4.1 -3.7 -3 -1.8 -2.3 -0.5 0.7 2.5 2.8 3.3 -3.1 1.7Information 160.8 161.3 160.8 161.2 160.9 160.6 159.9 161.2 161.4 161.1 162.2 158.3 160.4 160.6 159.3 160.6 161.1 159.8 (year dif) -5.3 -5.1 -4.7 -5.8 -8.2 -6.5 -7.9 -7.6 -5.8 -6.4 -6.3 -3.5 -0.4 -0.7 -1.5 -0.6 -6 -1.3Professional & Business Services 580.9 577.3 573.5 571.8 575.5 573.4 568.9 565.3 564.9 569.1 567.7 553.7 557.6 559.4 566 569.7 572.6 561.3 (year dif) -18.7 -23.4 -31.3 -33.7 -37.1 -40.4 -42.3 -39.9 -39.9 -35.8 -38.3 -29 -23.3 -17.9 -7.5 -2.1 -32.8 -11.3Professional, Scientific, & Technical Services 334.1 332.7 330.3 325.5 328.7 328.4 322.8 318.8 319.4 321.6 322.5 317.6 322.4 323 326.1 326.2 326.6 323.1 (year dif) -9.3 -10.3 -14.2 -17.5 -20.8 -23.3 -25.2 -24.1 -26.2 -24.2 -24.4 -17 -11.7 -9.7 -4.2 0.7 -18.7 -3.6Management of Companies & Enterprises 61.8 61.2 60.9 60.6 60.3 59.7 59.4 58.8 59 59.6 59.6 60.2 59.8 59.8 60.3 60.6 60.3 60.1 (year dif) 1.4 0.7 -0.7 -1.1 -2.2 -3.4 -3.1 -3.2 -3.5 -3.5 -3.5 -2.1 -2 -1.4 -0.6 0 -1.7 -0.1Administrative Services 185 183.4 182.3 185.7 186.5 185.3 186.7 187.7 186.5 187.9 185.6 175.9 175.4 176.6 179.6 182.9 185.7 178.1 (year dif) -10.8 -13.8 -16.4 -15.1 -14.1 -13.7 -14 -12.6 -10.2 -8.1 -10.4 -9.9 -9.6 -6.8 -2.7 -2.8 -12.4 -7.6Employment Services 56.5 55.6 53.5 55.8 56.7 55.4 56.2 58.4 58.3 58.9 60.2 54.6 55.6 56.1 56.4 59.8 56.9 56.5 (year dif) -8.5 -10.1 -12.7 -11.1 -9.6 -9 -8.8 -7.2 -4.8 -4 -3 -2.5 -0.9 0.5 2.9 4 -8.1 -0.4Educational & Health Services 738.2 739.2 740.2 739.7 730.5 711.3 707.5 725 744.5 751.1 753 741.8 749.2 755.6 757.6 755.8 733.8 752 (year dif) 16.9 14 15.1 16.2 15 16.3 16 12.9 14.3 13.6 10.3 16 11 16.4 17.4 16.1 14.9 18.2Educational Services 172.1 174.2 173.7 169.9 158.5 144.4 141.4 157.5 171.1 173.9 174.2 164.1 171.8 174.8 175.2 171.1 164.5 171.4 (year dif) 5.4 6.3 4.7 5.5 2.3 5.8 4.5 2 3.2 2.6 1 1.6 -0.3 0.6 1.5 1.2 4.2 6.9Health Care & Social Assistance 566.1 565 566.5 569.8 572 566.9 566.1 567.5 573.4 577.2 578.8 577.7 577.4 580.8 582.4 584.7 569.4 580.6 (year dif) 11.5 7.7 10.4 10.7 12.7 10.5 11.5 10.9 11.1 11 9.3 14.4 11.3 15.8 15.9 14.9 10.7 11.2Leisure & Hospitality 297.8 299.7 305.3 312.7 314 310.1 305.9 313.6 313.7 313.9 311.4 299.4 302.4 306.9 314.4 318.2 307.9 308.3 (year dif) 0.3 -1.1 -5.5 -1.4 -2 -3.6 -6.4 -1.5 -2.9 -2.5 -3.7 3 4.6 7.2 9.1 5.5 -2.3 0.4Arts, Entertainment, & Recreation 66.3 66.6 68.1 68 68.1 68.2 66.7 66.9 68.5 68.2 68.1 66 66.2 68.4 69.5 69.2 67.4 67.9 (year dif) 0.9 0.3 -1.8 -1.8 -1.9 -2.7 -3.8 -1.6 -2.5 -3.2 -2.4 0.4 -0.1 1.8 1.4 1.2 -1.7 0.4Accommodation & Food Services 231.5 233.1 237.2 244.7 245.9 241.9 239.2 246.7 245.2 245.7 243.3 233.4 236.2 238.5 244.9 249 240.4 240.4 (year dif) -0.6 -1.4 -3.7 0.4 -0.1 -0.9 -2.6 0.1 -0.4 0.7 -1.3 2.6 4.7 5.4 7.7 4.3 -0.7 0Other Services 159.7 159.8 159.9 161.4 161.5 159.3 158.5 158.5 159.6 159.6 159.5 157.5 158.1 159.2 160.5 163 159.7 159.7 (year dif) 0.7 0.2 -1 -0.5 -0.8 -0.9 -1.1 -2.7 -2.6 -2.6 -2.7 -1.5 -1.6 -0.6 0.6 1.6 -1.1 0Trade, Transportation, & Utilities 550.3 547.2 543.4 546.9 550.9 542.1 541.8 549.3 546.6 550.5 557.3 538 534.5 539.6 540.7 544.8 548.6 539.5 (year dif) -16.8 -22.3 -25.8 -24.5 -24.8 -26.6 -26.1 -27 -29.6 -32.5 -30.7 -19.3 -15.8 -7.6 -2.7 -2.1 -25.1 -9.1Retail Trade 286.1 284.5 282.9 285.5 289.4 288.3 288.8 292 288.9 293.3 298.8 289.1 286.1 288.3 289.2 292.3 289.1 289 (year dif) -7.5 -10.4 -11.6 -10 -8.8 -9.7 -9.3 -8.8 -12.9 -15.5 -13.2 -2 0 3.8 6.3 6.8 -10.4 -0.1Wholesale Trade 141.8 141 139.1 139.2 139.2 137.2 137.5 137.3 137.2 136.2 137.2 134.4 133.8 135.2 135 135 138.8 134.7 (year dif) -7.6 -8.7 -9.9 -9.7 -10.4 -11.6 -10.9 -11.2 -10.8 -11.1 -9.8 -8.8 -8 -5.8 -4.1 -4.2 -9.8 -4.2Transportation & Warehousing 106.1 105.4 105.2 106 106.1 100.5 99.4 104 104.4 105 105.2 98.6 98.7 100.1 100.6 101.6 104.5 99.9 (year dif) -2.5 -3.9 -4.8 -5.3 -5.9 -5.5 -6.1 -7 -6 -5.7 -7.6 -8.1 -7.4 -5.3 -4.6 -4.4 -5.2 -4.6Utilities 16.3 16.3 16.2 16.2 16.2 16.1 16.1 16 16.1 16 16.1 15.9 15.9 16 15.9 15.9 16.2 15.9 (year dif) 0.8 0.7 0.5 0.5 0.3 0.2 0.2 0 0.1 -0.2 -0.1 -0.4 -0.4 -0.3 -0.3 -0.3 0.3 -0.2Construction 120.5 120.8 121.7 122.3 122.6 122.4 122.5 120.6 118.4 117.7 115.4 108.8 106.2 109.8 113.9 113.5 120.5 110.4 (year dif) -7.7 -8.7 -10 -10.8 -11.4 -13.6 -15 -15.2 -17.2 -16.1 -14.5 -12.6 -14.3 -11 -7.8 -8.8 -12.2 -10.1Manufacturing 85 84.3 82.9 82.7 82.9 81.4 81.4 82 81.5 80.9 79.9 79.4 80.1 80 80 79.5 82.6 79.8 (year dif) -11.9 -12.9 -13.9 -13.7 -14 -14.2 -14 -13.9 -13.3 -12.4 -11.6 -6.9 -4.9 -4.3 -2.9 -3.2 -13 -2.8Government 562.6 564.9 564.9 563.2 558.9 606.6 596.3 549.2 553.6 552.3 547.1 540.8 543.4 546.4 548.6 569.3 565 549.7 (year dif) 1.8 1.5 -0.2 -1.6 -4.7 28.6 28.7 -6.3 -6.5 -12 -19.8 -20 -19.2 -18.5 -16.3 6.1 1 -15.3
Source: NYS DOLData: Ths.Annual Figures: Average YTD

NY Household EmploymentNew York City Feb 2009 Mar 2009 Apr 2009 May 2009 Jun 2009 Jul 2009 Aug 2009 Sep 2009 Oct 2009 Nov 2009 Dec 2009 Jan 2010 Feb 2010 Mar 2010 Apr 2010 May 2010 2009 2010Labor Force SA 3,975 3,983 3,989 3,994 3,997 3,996 3,993 3,988 3,983 3,978 3,974 3,968 3,970 3,973 3,989 4,001 3,985 3,980 (dif) 7.2 7.3 6.6 4.9 2.6 -0.6 -3.1 -4.6 -5.1 -5 -4.5 -6 2.6 2.1 16.1 12.5 63.9 -4.8Labor Force NSA 3,987 3,985 3,974 3,969 3,994 4,044 4,017 3,971 3,983 3,976 3,961 3,961 3,986 3,983 3,994 3,981 3,984 3,981 (year dif) 104.2 83.2 81.1 82.8 86 83.8 67.4 52 36.2 23.1 4.2 8 -1.1 -1.7 19.6 12.7 63.3 -3.4(year % ch.) 2.7 2.1 2.1 2.1 2.2 2.1 1.7 1.3 0.9 0.6 0.1 0.2 0 0 0.5 0.3 1.6 0.2
Employed Residents SA 3,656 3,644 3,633 3,623 3,612 3,600 3,590 3,580 3,570 3,562 3,556 3,555 3,565 3,575 3,599 3,616 3,608 3,582 (dif) -13 -11.9 -10.9 -10.7 -11.1 -11.3 -10.8 -10 -9.1 -8 -6.7 -0.3 9.5 10.5 23.3 17 -99.4 -25.9Employed Residents NSA 3,647 3,641 3,641 3,609 3,609 3,630 3,607 3,566 3,568 3,572 3,548 3,545 3,579 3,588 3,617 3,609 3,607 3,587 (year dif) -60.3 -80.1 -80.4 -91.2 -100.7 -105.7 -110.8 -127.1 -141.8 -130.2 -134.8 -98.5 -68.2 -53.3 -23.7 -0.4 -101.2 -19.3(year % ch.) -1.6 -2.2 -2.2 -2.5 -2.7 -2.8 -3 -3.4 -3.8 -3.5 -3.7 -2.7 -1.9 -1.5 -0.7 0 -2.7 -1.3
Unemployed Residents SA 319 338 356 372 385 396 404 409 413 416 418 413 405 397 390 385 377 398 (dif) 20.2 19.2 17.4 15.8 13.6 10.7 7.7 5.4 4 3.1 2.1 -5.6 -7.3 -8.1 -7.1 -4.7 163.3 21Unemployed Residents NSA 340 344 333 359 385 413 410 405 416 404 413 417 407 395 376 373 378 394 (year dif) 164.5 163.2 161.5 174 186.6 189.6 178.3 179.1 178 153.4 139 106.6 67.1 51.5 43.4 13.1 164.5 16(year % ch.) 93.8 90.4 94.2 93.9 94.2 84.7 77 79.4 74.9 61.2 50.8 34.4 19.7 15 13 3.6 78.9 17.2
LF Participation Rate SA 60.6 60.6 60.7 60.8 60.8 60.7 60.7 60.5 60.4 60.3 60.2 60.1 60.1 60.1 60.3 60.5 60.6 60.2LF Participation Rate NSA 60.7 60.7 60.5 60.4 60.7 61.5 61 60.3 60.4 60.3 60 60 60.3 60.3 60.4 60.2 60.6 60.2Emp Pop Ratio SA 55.7 55.5 55.3 55.1 54.9 54.7 54.5 54.3 54.2 54 53.9 53.9 54 54.1 54.4 54.7 54.8 54.2Emp Pop Ratio NSA 55.6 55.4 55.4 54.9 54.9 55.2 54.8 54.1 54.1 54.2 53.8 53.7 54.2 54.3 54.7 54.5 54.8 54.3
Unemployment Rate SA 8 8.5 8.9 9.3 9.6 9.9 10.1 10.3 10.4 10.5 10.5 10.4 10.2 10 9.8 9.6 9.5 10Unemployment Rate NSA 8.5 8.6 8.4 9.1 9.6 10.2 10.2 10.2 10.4 10.2 10.4 10.5 10.2 9.9 9.4 9.4 9.5 9.9
New York StateLabor Force SA 9,728 9,731 9,731 9,730 9,723 9,711 9,697 9,682 9,667 9,651 9,639 9,635 9,645 9,653 9,681 9,694 9,701 9,662 (dif) 5.8 3.3 -0.5 -1 -6.1 -12.1 -14.7 -15.1 -14.8 -15.7 -11.6 -4.1 9.8 7.9 28 12.8 29.6 -39.2Labor Force NSA 9,701 9,682 9,665 9,674 9,813 9,888 9,811 9,630 9,646 9,633 9,590 9,605 9,630 9,622 9,638 9,636 9,699 9,626 (year dif) 130.1 84.4 78.8 65.5 66.6 44.4 19 -14.7 -46.5 -51.4 -94.3 -54.5 -70.9 -59.7 -27 -38.6 28.4 -73.3(year % ch.) 1.4 0.9 0.8 0.7 0.7 0.5 0.2 -0.2 -0.5 -0.5 -1 -0.6 -0.7 -0.6 -0.3 -0.4 0.3 -0.5
Employed Residents SA 8,999 8,967 8,940 8,915 8,890 8,866 8,845 8,826 8,809 8,794 8,782 8,784 8,801 8,821 8,864 8,887 8,889 8,831 (dif) -35 -31.2 -27 -25.6 -24.8 -23.7 -21.4 -18.9 -16.8 -15 -12.3 2 16.7 20.8 42.5 23.3 -266.3 -57.5Employed Residents NSA 8,901 8,888 8,920 8,888 8,974 9,021 8,967 8,793 8,810 8,811 8,746 8,706 8,740 8,779 8,853 8,859 8,886 8,787 (year dif) -189.3 -234.9 -240.1 -259 -284.9 -292.2 -290.4 -323.5 -348.5 -301.8 -307.8 -209.5 -160.7 -109.6 -66.4 -28.5 -270.6 -98.7(year % ch.) -2.1 -2.6 -2.6 -2.8 -3.1 -3.1 -3.1 -3.5 -3.8 -3.3 -3.4 -2.3 -1.8 -1.2 -0.7 -0.3 -3 -1.3
Unemployed Residents SA 729 764 790 815 833 845 852 856 858 857 858 854 845 832 817 807 812 831 (dif) 40.8 34.6 26.5 24.5 18.7 11.7 6.5 3.9 2 -0.7 0.8 -3.2 -9.9 -13 -14.4 -10.5 295.9 18.9Unemployed Residents NSA 800 794 746 786 839 867 844 837 837 822 845 899 890 844 785 776 813 839 (year dif) 319.3 319.3 319 324.5 351.6 336.6 309.4 308.8 302 250.6 213.5 155 89.8 49.9 39.4 -10.1 299 25.4(year % ch.) 66.4 67.3 74.8 70.3 72.1 63.4 57.9 58.5 56.5 43.8 33.8 20.8 11.2 6.3 5.3 -1.3 59.2 8.5
LF Participation Rate SA 63.4 63.4 63.3 63.3 63.2 63.1 63 62.8 62.7 62.6 62.4 62.4 62.4 62.5 62.6 62.7 63.1 62.5LF Participation Rate NSA 63.2 63 62.9 62.9 63.8 64.3 63.7 62.5 62.6 62.4 62.1 62.2 62.3 62.3 62.3 62.3 63 62.3Emp Pop Ratio SA 58.6 58.4 58.2 58 57.8 57.6 57.4 57.3 57.1 57 56.9 56.9 57 57.1 57.3 57.4 57.8 57.1Emp Pop Ratio NSA 58 57.9 58.1 57.8 58.4 58.6 58.2 57.1 57.1 57.1 56.7 56.4 56.6 56.8 57.2 57.3 57.8 56.9
Unemployment Rate SA 7.5 7.8 8.1 8.4 8.6 8.7 8.8 8.8 8.9 8.9 8.9 8.8 8.8 8.6 8.4 8.3 8.4 8.6Unemployment Rate NSA 8.2 8.2 7.7 8.1 8.6 8.8 8.6 8.7 8.7 8.5 8.8 9.4 9.2 8.8 8.1 8.1 8.4 8.7
Source: NYS DOLLabor Force Data in Ths., Rates & Ratios in %Annual Figures: Average YTD

U.S. General Economic IndicatorsGDP 1993 1994 1995 1996 1997 1998 1999 2000 2001 2002 2003 2004 2005 2006 2007 2008 2009Nominal GDP 6667.3 7085.2 7414.6 7838.5 8332.4 8793.5 9353.5 9951.5 10286.2 10642.3 11142.2 11867.8 12638.4 13398.9 14077.7 14441.4 14256.3Real GDP 8523.5 8870.7 9093.8 9433.9 9854.4 10283.5 10779.9 11226 11347.2 11553 11840.7 12263.8 12638.4 12976.3 13254.1 13312.2 12987.4 (% ch.) 2.9 4.1 2.5 3.7 4.5 4.4 4.8 4.1 1.1 1.8 2.5 3.6 3.1 2.7 2.1 0.4 -2.4Final Sales of Domestic Product 8515.3 8809.2 9073.2 9412.5 9782.6 10217 10715.7 11167.5 11391.7 11543.5 11824.8 12198.2 12588.4 12917.1 13234.4 13341.2 13110.7 (% ch.) 2.8 3.5 3 3.7 3.9 4.4 4.9 4.2 2 1.3 2.4 3.2 3.2 2.6 2.5 0.8 -1.7Final Sales to Domestic Producers 8584.5 8914.5 9168.3 9520.5 9920.9 10473.5 11077.1 11623.1 11870.8 12098.4 12433.5 12886.8 13311.2 13646.6 13881.9 13829.8 13458.9 (% ch.) 3.3 3.8 2.8 3.8 4.2 5.6 5.8 4.9 2.1 1.9 2.8 3.6 3.3 2.5 1.7 -0.4 -2.7
Personal Consumption Expenditures 5701.2 5918.9 6079 6291.2 6523.4 6865.5 7241 7608.1 7813.9 8021.9 8247.5 8532.7 8819 9073.5 9314 9290.9 9235.1 (% ch.) 3.5 3.8 2.7 3.5 3.7 5.2 5.5 5.1 2.7 2.7 2.8 3.5 3.4 2.9 2.7 -0.2 -0.6Durable Goods 455.8 492.1 511.7 549.8 594.7 667.2 753.8 819.9 864.4 930.1 986.2 1051 1105.5 1150.4 1200 1146.3 1101.3 (% ch.) 7.5 8 4 7.5 8.2 12.2 13 8.8 5.4 7.6 6 6.6 5.2 4.1 4.3 -4.5 -3.9Nondurable Goods 1350.4 1403 1437.8 1479.4 1522.9 1580.3 1660.9 1714.7 1745.6 1780.3 1845.7 1904.6 1968.4 2023.6 2074.8 2057.3 2037 (% ch.) 2.5 3.9 2.5 2.9 2.9 3.8 5.1 3.2 1.8 2 3.7 3.2 3.4 2.8 2.5 -0.8 -1
Gross Private Domestic Investment 1074.8 1220.9 1258.9 1370.3 1540.8 1695.1 1844.3 1970.3 1831.9 1807 1871.6 2058.3 2172.2 2230.4 2146.2 1989.5 1527.7 (% ch.) 8.9 13.6 3.1 8.8 12.4 10 8.8 6.8 -7 -1.4 3.6 10 5.5 2.7 -3.8 -7.3 -23.2Nonresidential 656.5 716.9 792.2 866.2 970.8 1087.4 1200.8 1318.6 1281.8 1180.2 1191 1263 1347.3 1453.9 1544.3 1569.7 1291 (% ch.) 8.8 9.2 10.5 9.3 12.1 12 10.4 9.8 -2.8 -7.9 0.9 6 6.7 7.9 6.2 1.6 -17.8Residential 429.6 471.5 456.1 492.5 501.8 540.4 574.2 580 583.2 613.9 664.3 729.5 775 718.2 585 451.1 358.7 (% ch.) 8.2 9.7 -3.3 8 1.9 7.7 6.3 1 0.6 5.3 8.2 9.8 6.2 -7.3 -18.5 -22.9 -20.5
Net Exports of Goods & Services -- -- -98.8 -110.7 -139.9 -252.6 -356.6 -451.6 -472.1 -548.8 -604 -688 -722.7 -729.2 -647.7 -494.3 -355.6 (% ch.) -- -- -- 12.1 26.3 80.6 41.2 26.6 4.5 16.3 10 13.9 5 0.9 -11.2 -23.7 -28.1Government Consumption & Investment 1878.2 1878.1 1888.9 1907.9 1943.8 1985 2056.1 2097.8 2178.3 2279.6 2330.4 2362 2369.9 2402.1 2443.1 2518.1 2564.6 (% ch.) -0.8 0 0.6 1 1.9 2.1 3.6 2 3.8 4.7 2.2 1.4 0.3 1.4 1.7 3.1 1.8Change in Private Inventories 22.3 69.3 32.1 31.2 77.4 71.6 68.6 60.2 -41.8 12.8 17.3 66.4 49.9 59.4 19.5 -25.9 -108.3 (dif) 4.4 47 -37.2 -0.9 46.2 -5.8 -3.1 -8.3 -102 54.5 4.6 49 -16.4 9.5 -39.9 -45.4 -82.4
Additional U.S. IndicatorsGDP Implicit Price Deflator (% ch.) 2.2 2.1 2.1 1.9 1.8 1.1 1.5 2.2 2.3 1.6 2.1 2.8 3.3 3.3 2.9 2.1 1.2Corporate Profits 543.7 628.2 716.2 801.5 884.9 812.4 856.3 819.2 784.2 872.2 977.8 1246.9 1456.1 1608.3 1541.7 1360.4 1308.9 (% ch.) 9.6 15.6 14 11.9 10.4 -8.2 5.4 -4.3 -4.3 11.2 12.1 27.5 16.8 10.5 -4.1 -11.8 -3.8ECI Private: Total Compensation 65.9 68.1 70 72 74.2 76.8 79.3 82.9 86.3 89.3 92.7 96.2 99.2 102.1 105.2 108.2 109.8 (% ch.) 3.6 3.4 2.8 2.8 3.1 3.5 3.2 4.5 4.1 3.5 3.8 3.8 3.1 2.9 3.1 2.9 1.5NonFarm Business Productivity 100.6 101.6 102 104.6 106.2 109.4 113 116.7 120.3 125.7 130.3 134 136.2 137.5 140.1 142.9 148.3 (% ch.) 0.6 1 0.4 2.6 1.5 2.9 3.3 3.3 3 4.5 3.7 2.8 1.7 1 1.8 2.1 3.7Unit Labor Costs 101.4 102.2 103.9 104.6 106.3 109.4 110.4 114.8 116.5 115 116.2 116.8 119.5 122.9 125.7 126.9 124.6 (% ch.) 1.4 0.8 1.7 0.7 1.6 3 0.9 3.9 1.5 -1.3 1.1 0.5 2.3 2.8 2.3 1 -1.9
Data: Real GDP & Components in Bil. 2000 $, SAData: Profits with IDA & CCAdj in Bil $, SAData: ECI All Workers, Index Dec 2005=100, SAData: Prod & Unit Labor All Persons, Index 1992=100, SA

U.S. EmploymentPayroll Survey: Current Employment Statistics (CES) 1993 1994 1995 1996 1997 1998 1999 2000 2001 2002 2003 2004 2005 2006 2007 2008 2009Total Nonfarm 110,847 114,282 117,307 119,698 122,767 125,923 128,992 131,794 131,830 130,340 129,996 131,419 133,694 136,086 137,588 136,777 130,911 (dif) 2,125 3,435 3,025 2,392 3,069 3,156 3,069 2,802 36 -1,489 -344 1,423 2,275 2,392 1,503 -812 -5,866Total Private 91,854 95,008 97,872 100,169 103,108 106,013 108,680 111,003 110,710 108,831 108,416 109,801 111,890 114,114 115,371 114,272 108,360 (dif) 1,917 3,154 2,864 2,298 2,938 2,906 2,666 2,324 -294 -1,878 -415 1,385 2,089 2,224 1,256 -1,098 -5,913Financial Activities 6,708 6,866 6,828 6,969 7,178 7,462 7,646 7,688 7,809 7,848 7,976 8,031 8,153 8,328 8,300 8,143 7,758 (dif) 169 158 -38 142 209 284 185 42 121 39 128 55 122 175 -28 -157 -386
Finance & Insurance 5,032 5,132 5,069 5,152 5,302 5,528 5,664 5,677 5,770 5,814 5,919 5,945 6,019 6,155 6,131 6,015 5,762 (dif) 120 100 -63 83 150 226 135 13 93 45 105 26 74 136 -24 -116 -253
Securities 508 553 562 590 636 692 737 805 831 790 757 766 786 818 848 864 809 (dif) 32 46 9 27 46 56 45 68 26 -41 -32 8 21 32 30 16 -55
Banking 2,361 2,376 2,314 2,368 2,433 2,532 2,591 2,548 2,598 2,686 2,793 2,818 2,870 2,924 2,866 2,733 2,597 (dif) 43 15 -62 54 65 98 59 -43 50 88 107 25 52 55 -59 -133 -135
Real Estate & Rental & Leasing 1,676 1,734 1,759 1,818 1,876 1,933 1,982 2,011 2,039 2,034 2,057 2,086 2,134 2,173 2,169 2,128 1,996 (dif) 49 58 25 59 58 58 49 29 28 -5 23 29 48 39 -4 -40 -133
Information 2,668 2,739 2,843 2,940 3,084 3,219 3,418 3,630 3,629 3,394 3,189 3,117 3,061 3,038 3,031 2,984 2,808 (dif) 26 71 105 97 144 135 199 212 -1 -235 -205 -72 -56 -24 -6 -48 -176Professional & Business Services 11,493 12,171 12,847 13,461 14,333 15,142 15,955 16,672 16,480 15,975 15,985 16,388 16,952 17,570 17,944 17,735 16,575 (dif) 527 678 676 614 872 810 813 717 -192 -505 10 403 564 619 373 -208 -1,160Educational & Health Services 12,303 12,806 13,288 13,683 14,088 14,445 14,795 15,109 15,643 16,201 16,588 16,950 17,370 17,824 18,321 18,840 19,187 (dif) 413 503 482 395 405 357 349 315 534 558 387 362 420 454 497 518 348Leisure & Hospitality 9,733 10,098 10,499 10,774 11,016 11,232 11,544 11,860 12,032 11,986 12,175 12,492 12,813 13,108 13,425 13,437 13,101 (dif) 294 365 401 274 243 216 312 316 173 -46 189 317 321 295 317 12 -336Other Services 4,350 4,429 4,572 4,691 4,825 4,976 5,087 5,168 5,258 5,372 5,401 5,409 5,395 5,438 5,494 5,515 5,363 (dif) 111 78 143 119 134 151 111 82 90 114 28 9 -15 43 55 21 -152Trade, Transportation & Utilities 22,377 23,123 23,833 24,240 24,700 25,186 25,770 26,225 25,986 25,500 25,287 25,536 25,960 26,275 26,625 26,292 24,949 (dif) 251 745 711 406 460 486 584 455 -239 -486 -213 250 424 315 350 -333 -1,343Manufacturing 16,776 17,024 17,244 17,237 17,418 17,560 17,323 17,265 16,440 15,257 14,508 14,315 14,225 14,157 13,877 13,401 11,884 (dif) -24 248 220 -7 182 142 -237 -58 -825 -1,184 -748 -194 -89 -69 -279 -476 -1,517Construction 4,779 5,094 5,276 5,538 5,813 6,147 6,545 6,788 6,827 6,715 6,736 6,973 7,333 7,692 7,630 7,161 6,036 (dif) 174 315 182 262 275 334 397 243 39 -111 20 238 360 359 -62 -469 -1,125Government 18,993 19,274 19,435 19,529 19,659 19,910 20,312 20,790 21,120 21,509 21,580 21,618 21,804 21,971 22,218 22,504 22,551 (dif) 208 281 161 94 130 251 402 478 330 389 71 38 186 167 246 286 47
Other Employment DataUnemployment Rate 6.9 6.1 5.6 5.4 4.9 4.5 4.2 4 4.7 5.8 6 5.5 5.1 4.6 4.6 5.8 9.3 (dif) -0.6 -0.8 -0.5 -0.2 -0.5 -0.4 -0.3 -0.3 0.8 1 0.2 -0.4 -0.5 -0.5 0 1.2 3.5Avg. Weekly Hours: Total Private (CES) -- -- -- -- -- -- -- -- -- -- -- -- -- -- 34.6 34.5 33.9 (dif) -- -- -- -- -- -- -- -- -- -- -- -- -- -- -- -0.1 -0.6Avg. Wk. Earnings: Total Private (CES) -- -- -- -- -- -- -- -- -- -- -- -- -- -- 725 745 753 (dif) -- -- -- -- -- -- -- -- -- -- -- -- -- -- -- 20 7Initial Claims, SA 1,489 1,502 1,555 1,524 1,394 1,374 1,289 1,322 1,757 1,750 1,743 1,484 1,462 1,354 1,391 1,814 2,478 (dif) -285 12 53 -30 -131 -20 -85 33 435 -8 -6 -259 -22 -108 37 423 664Continued Claims, SA 2,767 2,670 2,589 2,553 2,301 2,214 2,185 2,110 3,010 3,571 3,530 2,928 2,658 2,457 2,548 3,339 5,809 (dif) -438 -98 -81 -36 -251 -88 -29 -75 899 561 -41 -602 -270 -201 91 791 2470ISM Employment Diffusion Index, SA 45.1 50.1 46.9 46.3 51.1 47.5 50.6 50.4 38.3 45.8 46.3 56.8 53.5 51.6 50.5 43.2 40.4 (dif) -0.3 5 -3.2 -0.6 4.8 -3.6 3.1 -0.2 -12 7.5 0.4 10.6 -3.3 -1.9 -1.1 -7.3 -2.8ISM Non-Mfg. Emp. Index, SA -- -- -- -- -- 52.9 52.3 53.5 46.9 46.3 50.6 54.3 55.9 53.8 52 43.8 39.9 (dif) -- -- -- -- -- -- -0.7 1.2 -6.6 -0.6 4.4 3.6 1.6 -2.1 -1.8 -8.2 -3.8
Data: CES and Claims in Ths.

The U.S. Consumer & Housing MarketPersonal Income, Consumption and Credit 1993 1994 1995 1996 1997 1998 1999 2000 2001 2002 2003 2004 2005 2006 2007 2008 2009Total Personal Income 5568.1 5874.8 6200.9 6591.6 7000.8 7525.4 7910.8 8559.4 8883.3 9060.1 9378.1 9937.3 10485.9 11268.1 11894.1 12238.8 12019 (% ch.) 4.1 5.5 5.6 6.3 6.2 7.5 5.1 8.2 3.8 2 3.5 6 5.5 7.5 5.6 2.9 -1.8Disposable Personal Income 4921.6 5184.3 5457 5759.6 6074.6 6499 6803.3 7327.2 7648.5 8009.7 8377.8 8889.4 9277.3 9915.7 10403.1 10806.4 10917.3 (% ch.) 3.9 5.3 5.3 5.5 5.5 7 4.7 7.7 4.4 4.7 4.6 6.1 4.4 6.9 4.9 3.9 1Wage Rate ($) 27752 28268 29136 30210 31573 33205 34573 36630 37565 38341 39536 41283 42640 44594 46580 47861 47947 (% ch.) 1.5 1.9 3.1 3.7 4.5 5.2 4.1 5.9 2.6 2.1 3.1 4.4 3.3 4.6 4.5 2.8 0.2Personal Consumption Expenditures (PCE) 4483.6 4750.8 4987.3 5273.6 5570.6 5918.5 6342.8 6830.4 7148.8 7439.2 7804 8285.1 8819 9322.7 9826.4 10129.9 10089.1 (% ch.) 5.8 6 5 5.7 5.6 6.2 7.2 7.7 4.7 4.1 4.9 6.2 6.4 5.7 5.4 3.1 -0.4Consumer Installment Credit: Total Outstanding 865.7 997.3 1140.7 1253.4 1324.8 1421 1531.1 1716.5 1866.2 1970.8 2076.6 2192.1 2291.7 2385.7 2522.8 2561.1 2448.8 (% ch.) 7.4 15.2 14.4 9.9 5.7 7.3 7.7 12.1 8.7 5.6 5.4 5.6 4.5 4.1 5.7 1.5 -4.4Personal Saving as a % of Disposable Personal Income, (%) 5.8 5.2 5.2 4.9 4.6 5.3 3.1 2.9 2.7 3.5 3.5 3.4 1.4 2.4 1.7 2.6 4.2
Retail SalesTotal Retail Sales & Food Services 179.7 194.5 204.9 216.9 227.9 238.4 257.6 274.1 282.2 288.9 301.5 320.1 341.1 359.4 371.2 367.4 344.3 (% ch.) 7.1 8.2 5.4 5.9 5 4.6 8.1 6.4 2.9 2.4 4.3 6.2 6.5 5.4 3.3 -1 -6.3excl. Food Services & Drinking Places 161.7 175.7 185.4 196.7 206.3 215.7 233.9 248.7 255.6 261.3 272.2 288.9 307.9 324 334 329.3 306 (% ch.) 7.2 8.7 5.5 6.1 4.9 4.5 8.4 6.4 2.8 2.2 4.2 6.1 6.6 5.2 3.1 -1.4 -7.1excl. Autos & Gasoline Stations 126.6 134.9 141.3 148.5 156.5 164.8 176.1 186.9 193.1 199.7 208.3 221 235.4 248.8 257.6 260.7 255.6 (% ch.) 5.7 6.6 4.7 5.1 5.4 5.3 6.8 6.1 3.3 3.4 4.3 6.1 6.5 5.7 3.5 1.2 -1.9
TCB Consumer Confidence IndexOverall 65.9 90.6 100 104.6 125.4 131.7 135.3 139 106.6 96.6 79.8 96.1 100.3 105.9 103.3 57.9 45.2 (dif) 4.3 24.7 9.5 4.5 20.8 6.3 3.6 3.6 -32.4 -9.9 -16.8 16.3 4.2 5.6 -2.5 -45.4 -12.7Present Situation 48.6 88 112.9 121 151.4 169.3 176.6 181 141.7 94.6 68 94.9 116.1 130.2 128.8 69.9 24 (dif) 17.6 39.3 24.9 8.1 30.5 17.9 7.3 4.4 -39.4 -47.1 -26.6 26.9 21.2 14.1 -1.4 -58.9 -45.8Expectations 77.4 92.3 91.5 93.7 108 106.6 107.8 110.9 83.2 98 87.7 96.9 89.7 89.7 86.4 50 59.4 (dif) -4.6 14.9 -0.8 2.2 14.3 -1.4 1.2 3.1 -27.7 14.8 -10.3 9.1 -7.1 -0.1 -3.3 -36.4 9.4
The Reuters/UM Index of Consumer SentimentOverall 82.8 92.3 92.2 93.6 103.2 104.6 105.8 107.6 89.2 89.6 87.6 95.2 88.6 87.3 85 63.8 66.3 (dif) 5.5 9.5 0 1.4 9.6 1.4 1.2 1.8 -18.3 0.3 -2 7.6 -6.7 -1.2 -2.3 -21.3 2.5Expectations 72.8 83.8 83.2 85.7 97.7 98.3 99.3 102.7 82.3 84.6 81.4 88.5 77.4 75.9 75.6 57.3 64.1 (dif) 2.6 11 -0.6 2.5 12 0.6 1 3.4 -20.4 2.3 -3.1 7.1 -11.1 -1.5 -0.3 -18.3 6.8
Housing MarketNew Single-Family Homes Sold 674 667 670 756 806 889 879 880 907 976 1091 1201 1279 1049 769 482 374 (% ch.) 9.9 -1.1 0.3 12.9 6.7 10.3 -1.2 0.2 3.1 7.6 11.7 10.1 6.5 -18 -26.7 -37.3 -22.5Existing Single-Family Homes Sold 3421 3554 3514 3783 3973 4492 4636 4614 4727 4998 5443 5914 6181 5712 4959 4338 4567 (% ch.) 8.8 3.9 -1.1 7.6 5 13.1 3.2 -0.5 2.4 5.7 8.9 8.6 4.5 -7.6 -13.2 -12.5 5.3Housing Starts 1292 1446 1361 1469 1475 1621 1647 1573 1601 1710 1854 1950 2073 1812 1342 900 554 (% ch.) 7.5 12 -5.9 7.9 0.4 9.9 1.6 -4.5 1.8 6.8 8.4 5.2 6.3 -12.6 -25.9 -32.9 -38.4Housing Permits 1207 1367 1336 1419 1442 1619 1664 1598 1637 1749 1889 2058 2160 1844 1392 896 583 (% ch.) 9.9 13.2 -2.3 6.2 1.6 12.3 2.7 -3.9 2.4 6.8 8 8.9 5 -14.6 -24.5 -35.6 -35Median New Single-Family Home Price 126.1 130.4 133.4 139.8 145.1 152 159.8 166.5 172.6 185 191.4 217.8 234.2 243.1 243.7 230.4 214.5 (% ch.) 4 3.4 2.3 4.7 3.8 4.8 5.2 4.2 3.6 7.2 3.4 13.8 7.5 3.8 0.3 -5.5 -6.9Median Existing Single-Family Home Price 108.3 112.7 115.8 121.9 128 135 140.3 146 154.5 166.2 178.3 192.8 217.5 221.9 215.5 195.8 172.5 (% ch.) 3 4.1 2.8 5.2 5.1 5.4 3.9 4.1 5.8 7.6 7.3 8.1 12.8 2 -2.9 -9.2 -11.9
Data: Income & Consumption in Bil. $, SAData: Credit & Retail Sales in Bil. $, SAData: Home Sales, Starts & Permits in Ths., SAData: Home Prices in Ths. $
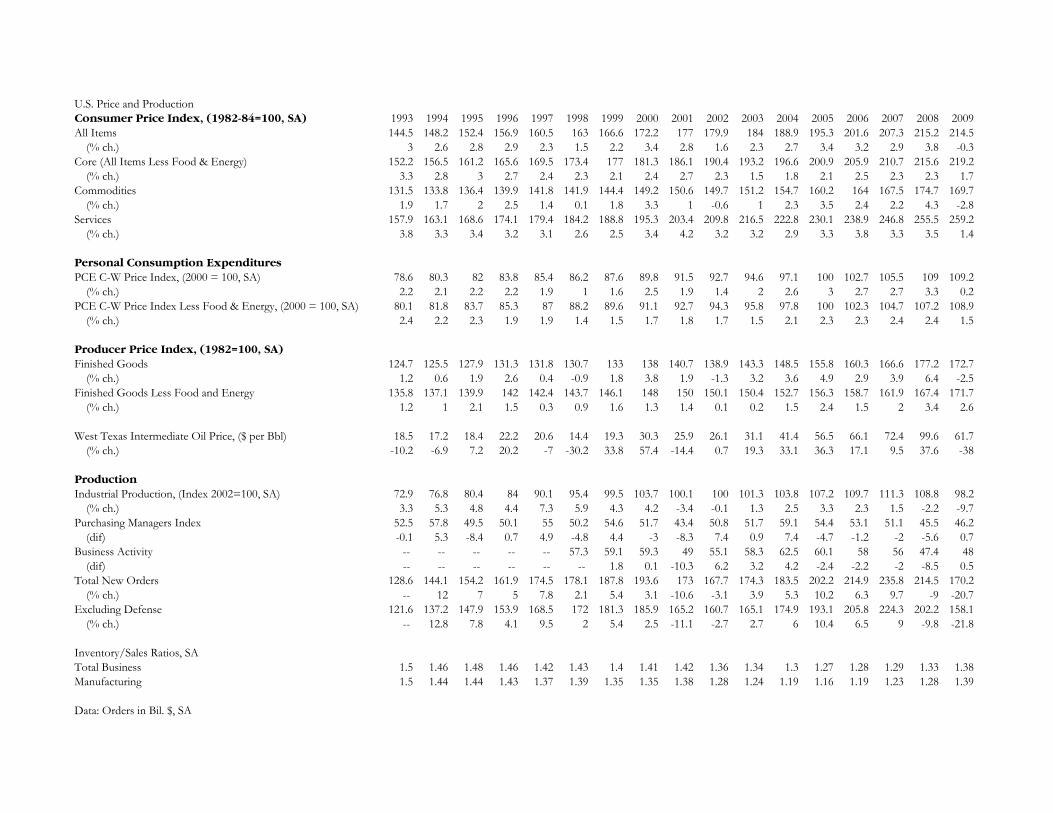
U.S. Price and ProductionConsumer Price Index, (1982-84=100, SA) 1993 1994 1995 1996 1997 1998 1999 2000 2001 2002 2003 2004 2005 2006 2007 2008 2009All Items 144.5 148.2 152.4 156.9 160.5 163 166.6 172.2 177 179.9 184 188.9 195.3 201.6 207.3 215.2 214.5 (% ch.) 3 2.6 2.8 2.9 2.3 1.5 2.2 3.4 2.8 1.6 2.3 2.7 3.4 3.2 2.9 3.8 -0.3Core (All Items Less Food & Energy) 152.2 156.5 161.2 165.6 169.5 173.4 177 181.3 186.1 190.4 193.2 196.6 200.9 205.9 210.7 215.6 219.2 (% ch.) 3.3 2.8 3 2.7 2.4 2.3 2.1 2.4 2.7 2.3 1.5 1.8 2.1 2.5 2.3 2.3 1.7Commodities 131.5 133.8 136.4 139.9 141.8 141.9 144.4 149.2 150.6 149.7 151.2 154.7 160.2 164 167.5 174.7 169.7 (% ch.) 1.9 1.7 2 2.5 1.4 0.1 1.8 3.3 1 -0.6 1 2.3 3.5 2.4 2.2 4.3 -2.8Services 157.9 163.1 168.6 174.1 179.4 184.2 188.8 195.3 203.4 209.8 216.5 222.8 230.1 238.9 246.8 255.5 259.2 (% ch.) 3.8 3.3 3.4 3.2 3.1 2.6 2.5 3.4 4.2 3.2 3.2 2.9 3.3 3.8 3.3 3.5 1.4
Personal Consumption ExpendituresPCE C-W Price Index, (2000 = 100, SA) 78.6 80.3 82 83.8 85.4 86.2 87.6 89.8 91.5 92.7 94.6 97.1 100 102.7 105.5 109 109.2 (% ch.) 2.2 2.1 2.2 2.2 1.9 1 1.6 2.5 1.9 1.4 2 2.6 3 2.7 2.7 3.3 0.2PCE C-W Price Index Less Food & Energy, (2000 = 100, SA) 80.1 81.8 83.7 85.3 87 88.2 89.6 91.1 92.7 94.3 95.8 97.8 100 102.3 104.7 107.2 108.9 (% ch.) 2.4 2.2 2.3 1.9 1.9 1.4 1.5 1.7 1.8 1.7 1.5 2.1 2.3 2.3 2.4 2.4 1.5
Producer Price Index, (1982=100, SA)Finished Goods 124.7 125.5 127.9 131.3 131.8 130.7 133 138 140.7 138.9 143.3 148.5 155.8 160.3 166.6 177.2 172.7 (% ch.) 1.2 0.6 1.9 2.6 0.4 -0.9 1.8 3.8 1.9 -1.3 3.2 3.6 4.9 2.9 3.9 6.4 -2.5Finished Goods Less Food and Energy 135.8 137.1 139.9 142 142.4 143.7 146.1 148 150 150.1 150.4 152.7 156.3 158.7 161.9 167.4 171.7 (% ch.) 1.2 1 2.1 1.5 0.3 0.9 1.6 1.3 1.4 0.1 0.2 1.5 2.4 1.5 2 3.4 2.6
West Texas Intermediate Oil Price, ($ per Bbl) 18.5 17.2 18.4 22.2 20.6 14.4 19.3 30.3 25.9 26.1 31.1 41.4 56.5 66.1 72.4 99.6 61.7 (% ch.) -10.2 -6.9 7.2 20.2 -7 -30.2 33.8 57.4 -14.4 0.7 19.3 33.1 36.3 17.1 9.5 37.6 -38
ProductionIndustrial Production, (Index 2002=100, SA) 72.9 76.8 80.4 84 90.1 95.4 99.5 103.7 100.1 100 101.3 103.8 107.2 109.7 111.3 108.8 98.2 (% ch.) 3.3 5.3 4.8 4.4 7.3 5.9 4.3 4.2 -3.4 -0.1 1.3 2.5 3.3 2.3 1.5 -2.2 -9.7Purchasing Managers Index 52.5 57.8 49.5 50.1 55 50.2 54.6 51.7 43.4 50.8 51.7 59.1 54.4 53.1 51.1 45.5 46.2 (dif) -0.1 5.3 -8.4 0.7 4.9 -4.8 4.4 -3 -8.3 7.4 0.9 7.4 -4.7 -1.2 -2 -5.6 0.7Business Activity -- -- -- -- -- 57.3 59.1 59.3 49 55.1 58.3 62.5 60.1 58 56 47.4 48 (dif) -- -- -- -- -- -- 1.8 0.1 -10.3 6.2 3.2 4.2 -2.4 -2.2 -2 -8.5 0.5Total New Orders 128.6 144.1 154.2 161.9 174.5 178.1 187.8 193.6 173 167.7 174.3 183.5 202.2 214.9 235.8 214.5 170.2 (% ch.) -- 12 7 5 7.8 2.1 5.4 3.1 -10.6 -3.1 3.9 5.3 10.2 6.3 9.7 -9 -20.7Excluding Defense 121.6 137.2 147.9 153.9 168.5 172 181.3 185.9 165.2 160.7 165.1 174.9 193.1 205.8 224.3 202.2 158.1 (% ch.) -- 12.8 7.8 4.1 9.5 2 5.4 2.5 -11.1 -2.7 2.7 6 10.4 6.5 9 -9.8 -21.8
Inventory/Sales Ratios, SATotal Business 1.5 1.46 1.48 1.46 1.42 1.43 1.4 1.41 1.42 1.36 1.34 1.3 1.27 1.28 1.29 1.33 1.38Manufacturing 1.5 1.44 1.44 1.43 1.37 1.39 1.35 1.35 1.38 1.28 1.24 1.19 1.16 1.19 1.23 1.28 1.39
Data: Orders in Bil. $, SA

Rates & TradeRates 1993 1994 1995 1996 1997 1998 1999 2000 2001 2002 2003 2004 2005 2006 2007 2008 2009M2 Money Stock, (Bil. $, SA) 3479.9 3494.6 3637.4 3815.8 4029.7 4372.2 4630.5 4912.6 5427.8 5776.6 6065.5 6407.1 6671.6 7071.7 7501.4 8239.7 8543.9 (% ch.) 1.5 0.4 4.1 4.9 5.6 8.5 5.9 6.1 10.5 6.4 5 5.6 4.1 6 6.1 9.8 3.7Discount Rate, (% P.A.) 3 3.6 5.21 5.02 5 4.92 4.62 5.73 3.41 1.17 2.12 2.34 4.19 5.96 5.86 2.39 0.5Federal Funds Target Rate, (%) 3 5.5 5.5 5.25 5.5 4.75 5.5 6.5 1.75 1.25 1 2.25 4.25 5.25 4.25 0.13 0.13Federal Funds Effective Rate, (% P.A.) 3.02 4.2 5.84 5.3 5.46 5.35 4.97 6.24 3.89 1.67 1.13 1.35 3.21 4.96 5.02 1.93 0.16Prime Rate, (% P.A.) 6 7.14 8.83 8.27 8.44 8.35 7.99 9.23 6.92 4.68 4.12 4.34 6.19 7.96 8.05 5.09 3.253-Month T-Bill Auction Average, (%) 3.02 4.26 5.52 5.02 5.07 4.82 4.66 5.85 3.45 1.62 1.01 1.37 3.15 4.72 4.41 1.47 0.1610-Year T-Bond Nominal, (% P.A.) 5.87 7.08 6.58 6.44 6.35 5.26 5.64 6.03 5.02 4.61 4.01 4.27 4.29 4.79 4.63 3.67 3.2610-Year T-Bond minus FFunds Rate (Y.Curve) 285 288 74 114 89 -9 67 -21 113 294 289 293 108 -17 -39 174 310Moodys AAA Corporate, (% P.A.) 7.22 7.96 7.59 7.37 7.26 6.53 7.04 7.62 7.08 6.49 5.67 5.63 5.23 5.59 5.56 5.63 5.31AAA minus 10-Year Bond 135 88 101 93 91 127 141 159 206 188 165 135 94 79 93 197 206Municipal Bond Yield Average, (%, Seasoned) 5.58 5.98 5.9 5.68 5.41 5.03 5.47 5.8 5.27 5.13 4.81 4.77 4.51 4.45 4.33 5.03 5.08New York Stock Exchange Vol. (Mil.) -- -- -- -- -- -- -- -- -- -- -- 31833 36539 40516 44336 55020 45775Dow Jones Industrials, (Index 1920=100, Monthly End) 3754 3834 5117 6448 7908 9181 11497 10787 10022 8342 10454 10783 10718 12463 13265 8776 10428S&P 500 Stock Price (Index 1941-43=10, Monthly Avg) 451 460 542 671 873 1084 1326 1427 1192 996 964 1131 1207 1311 1477 1221 947S&P Common Stock P/E Ratio, (%, NSA, Month Avg) 23.4 19.9 16.9 19.3 22.1 27.5 33.6 28.8 27.1 37.8 30.9 22.7 19.8 18.1 18 20.6 -- Nasdaq Composite Index, (Index Feb 05 1971=100) 715 752 925 1165 1468 1793 2721 3778 2031 1543 1643 1986 2099 2265 2577 2162 1841
Trade, (Bil. $, SA)Total Exports 53.6 58.6 66.2 71 77.9 77.8 80.5 89.2 83.7 81.5 85 96.6 106.8 121.4 136.9 152.2 129.6 (% ch.) 4.2 9.4 13 7.2 9.7 -0.1 3.5 10.8 -6.1 -2.7 4.4 13.6 10.5 13.7 12.8 11.2 -14.9Total Imports 59.4 66.8 74.2 79.6 86.9 91.6 102.6 120.9 114.2 116.6 126.3 147.4 166.4 184.2 195.4 210.2 161.1 (% ch.) 8.7 12.4 11.1 7.3 9.1 5.4 12 17.8 -5.5 2.1 8.3 16.8 12.9 10.7 6.1 7.6 -23.4Total Trade Balance -5.9 -8.2 -8 -8.7 -9 -13.8 -22.1 -31.7 -30.5 -35.1 -41.3 -50.8 -59.6 -62.8 -58.5 -58 -31.6 (% ch.) 79.3 40.1 -2.1 8 4 53.4 59.6 43.3 -3.8 15.3 17.4 23.2 17.3 5.3 -6.9 -0.8 -45.6
Import Price Index, (2000=100, NSA)Total Imports 94.6 96.2 100.6 101.6 99.1 93.1 93.9 100 96.5 94.1 96.9 102.3 110 115.4 120.2 134.1 118.6 (% ch.) -0.3 1.7 4.5 1 -2.5 -6 0.9 6.5 -3.5 -2.5 2.9 5.6 7.5 4.9 4.2 11.5 -11.5Excluding Fuels -- -- -- -- -- -- -- -- -- 99.9 100.4 102.9 104.9 106.9 109.6 115 111.6 (% ch.) -- -- -- -- -- -- -- -- -- -- 0.5 2.4 1.9 1.9 2.6 4.9 -3Canada (% ch.) -- 1.9 7 0.6 -0.9 -3.5 1.7 9.4 0.4 -2.6 5.9 8.7 9.7 4.4 4.4 15 -16.5Mexico (% ch.) -- -- -- -- -- -- -- -- -- -- -- -- 7.2 7.2 7.1 13.4 -9European Union (% ch.) -- 1.4 5.6 2.5 -1.2 -1.1 0.4 0.5 -1.6 1.1 3.5 5.7 5 3.9 2.6 6.8 -4Japan (% ch.) -- 4.9 4.5 -2.2 -4.9 -4.8 0.2 1.5 -1.6 -3.1 -1.2 1.2 0.5 -1.4 -0.5 1.3 1.8China (% ch.) -- -- -- -- -- -- -- -- -- -- -- -- -0.8 -1.1 0.8 4.1 -1.6
Export Price Index, (2000=100, NSA)Total Exports 96.9 98.9 103.9 104.5 103.1 99.7 98.4 100 99.2 98.2 99.7 103.6 106.9 110.7 116.1 123.1 117.4 (% ch.) 0.6 2.1 5 0.5 -1.4 -3.3 -1.3 1.6 -0.8 -1 1.6 3.9 3.2 3.6 4.9 6 -4.6
Yen Per U.S. $ 111.2 102.2 94.1 108.7 121 130.7 113.7 107.8 121.5 125.3 115.9 108.2 110.1 116.3 117.8 103.4 93.6$ per EURO 1.2 1.2 1.4 1.3 1.1 1.1 1.1 0.9 0.9 0.9 1.1 1.2 1.2 1.3 1.4 1.5 1.4Total Surplus or Deficit, ($Mil.) -226348 -174982 -146454 -110891 -2440 54388 158616 254848 94263 -230644 -396771 -398474 -321779 -209219 -187940 -680467 -1471297

NYC Economic Data1993 1994 1995 1996 1997 1998 1999 2000 2001 2002 2003 2004 2005 2006 2007 2008 2009
Nominal GCP 282.4 294.7 307.6 332.6 357.2 368.2 405.2 451.6 439.1 434.8 460.8 496.2 545.5 600 641.8 610.6 -- (% ch.) 4.7 4.4 4.4 8.1 7.4 3.1 10.1 11.5 -2.8 -1 6 7.7 9.9 10 7 -4.9 -- Real GCP 367.6 376.6 386 409.7 432.3 440.3 478.7 523.8 499.3 481.9 496.2 515.3 545.5 578.1 601.7 563.9 -- (year % ch.) 2.4 2.4 2.5 6.1 5.5 1.8 8.7 9.4 -4.7 -3.5 3 3.9 5.9 6 4.1 -6.3 -- Wage Rate 40,314 40,872 43,394 45,980 48,884 51,336 54,000 59,139 61,014 59,477 60,355 64,861 67,912 73,508 80,070 80,286 73,800 (% ch.) 1.46 1.38 6.17 5.96 6.32 5.02 5.19 9.52 3.17 -2.52 1.48 7.47 4.7 8.24 8.93 0.27 -8.08Finance Wage Rate 85,373 81,473 93,990 107,861 124,363 129,215 144,072 174,561 181,137 165,568 167,061 196,190 209,405 245,253 286,001 280,328 229,869 (% ch.) 3 -4.6 15.4 14.8 15.3 3.9 11.5 21.2 3.8 -8.6 0.9 17.4 6.7 17.1 16.6 -2 -18Securities Wage Rate 129,624 113,424 132,451 160,102 176,802 195,568 196,054 242,211 247,252 225,750 226,519 270,589 291,244 343,123 403,358 391,153 309,027 (% ch.) -1.4 -12.5 16.8 20.9 10.4 10.6 0.2 23.5 2.1 -8.7 0.3 19.5 7.6 17.8 17.6 -3 -21Private Non-Finance Wage Rate 34,553 35,478 36,709 38,134 39,627 42,177 43,730 46,449 47,852 48,615 49,757 51,768 53,923 56,429 59,799 61,023 59,432 (% ch.) 0.68 2.68 3.47 3.88 3.92 6.44 3.68 6.22 3.02 1.59 2.35 4.04 4.16 4.65 5.97 2.05 -2.61Total Wage Earnings 129.8 132.5 140.7 150.9 163.2 175.9 189.5 213.1 217.4 205.9 206.7 223 236.8 260.8 291 295.2 263.3 (% ch.) 1.5 2 6.2 7.3 8.2 7.8 7.7 12.5 2 -5.3 0.4 7.9 6.2 10.1 11.6 1.4 -10.8Finance Wage Earnings 30.4 29.3 33.1 37.4 43.4 45.9 51.2 62.9 64.8 53.9 52.1 61.3 67.1 80.9 97.2 94.8 71.7 (% ch.) 1.9 -3.6 13 13.1 15.8 5.8 11.6 22.8 3.1 -16.8 -3.4 17.6 9.5 20.5 20.1 -2.4 -24.3Securities Wage Earnings 17.6 16.4 19.2 23.2 27.3 32 33.1 46 47.4 37.7 35.8 43.6 48.8 59.8 73.5 71.9 51.3 (% ch.) 3.4 -6.8 16.5 21.3 17.5 17.1 3.4 38.9 3.1 -20.5 -5.1 21.9 11.8 22.7 22.8 -2.2 -28.6Private Non-Finance Wage Earnings 79.7 82.9 87 92.4 98.2 107.2 114.2 125.3 127.2 125.6 127.7 133.8 141.5 151.1 164.6 170.3 161 (% ch.) 1.08 4.04 4.96 6.17 6.33 9.15 6.55 9.72 1.52 -1.31 1.73 4.74 5.76 6.78 8.93 3.51 -5.49
Personal Income, (Bil. $) 200.5 207 220.6 234 246.5 260.5 273.6 293.2 298.9 299.7 305.8 327.7 351.8 387 421.5 434.1 -- (% ch.) 2.7 3.3 6.5 6.1 5.3 5.7 5 7.2 2 0.3 2 7.2 7.4 10 8.9 3 --
NYSE Member-Firm Profits, (Bil. $) 8.6 1.1 7.4 11.3 12.2 9.8 16.3 21 10.4 6.9 16.7 13.7 9.4 20.9 -11.3 -42.6 61.4 (% ch.) 39 -86.9 556.5 52.2 8.3 -19.8 66.2 28.9 -50.4 -33.5 142.1 -18.3 -30.9 121.2 -154.1 276.8 -244.3
Total Employment, SA 3289.4 3320.4 3337.4 3367.1 3439.7 3526.8 3618.4 3717.1 3689.4 3581.2 3531.3 3549.4 3602.5 3666.5 3743.7 3793.8 3687 (% ch.) 0.27 0.94 0.51 0.89 2.16 2.53 2.6 2.73 -0.75 -2.93 -1.39 0.51 1.5 1.78 2.1 1.34 -2.81Private Employment, SA 2702.5 2742.8 2778 2822 2889.4 2966.4 3051.5 3148.3 3127.1 3015 2974.6 2995 3046.8 3111.3 3184.7 3229.7 3122.1 (% ch.) 0.22 1.49 1.28 1.58 2.39 2.67 2.87 3.17 -0.67 -3.59 -1.34 0.68 1.73 2.12 2.36 1.41 -3.33Unemployment Rate 10.3 8.8 8.2 8.8 9.4 7.9 6.9 5.8 6 8.1 8.3 7 5.8 5 4.8 5.4 9.5 (dif) -0.78 -1.53 -0.62 0.64 0.6 -1.51 -1.06 -1.08 0.26 2.02 0.24 -1.25 -1.28 -0.77 -0.15 0.59 4.02
Consumer Price Index, (1982-84=100, SA)All Items 154.5 158.2 162.2 166.9 170.8 173.6 177 182.5 187.1 191.9 197.8 204.8 212.7 220.7 226.9 235.8 236.8 (% ch.) 2.99 2.38 2.51 2.94 2.33 1.63 1.94 3.11 2.55 2.55 3.07 3.53 3.88 3.78 2.81 3.9 0.44Core (All Items Less Food & Energy) 163.2 167.5 171.9 176.9 181.4 185.4 188.8 193.5 198.7 205.8 210.9 217 223.5 231 236.4 242.2 247 (% ch.) 3.14 2.6 2.64 2.91 2.55 2.23 1.83 2.5 2.69 3.56 2.46 2.92 2.96 3.38 2.33 2.46 1.97

NYC Employment Non-Seasonally Adjusted1993 1994 1995 1996 1997 1998 1999 2000 2001 2002 2003 2004 2005 2006 2007 2008 2009
Total 3289.3 3320.4 3337.3 3367.3 3439.8 3526.9 3618.8 3717.7 3689.1 3581.1 3531.1 3549.4 3602.5 3666.6 3743.8 3793.6 3686.8 (dif) 9.2 31.1 17 29.9 72.6 87.1 91.9 98.9 -28.6 -107.9 -50 18.2 53.1 64.1 77.2 49.8 -106.8Private 2702.3 2742.7 2777.9 2822.2 2889.4 2966.5 3051.9 3148.8 3126.7 3015 2974.5 2995 3046.9 3111.4 3184.8 3229.5 3121.7 (dif) 6.1 40.4 35.2 44.3 67.2 77.1 85.4 96.9 -22.1 -111.7 -40.4 20.5 51.9 64.6 73.4 44.7 -107.8Financial Activities 464.9 471.8 467.2 464.2 467.7 477.3 481 488.8 473.6 445.1 433.6 435.5 445.1 458.3 467.6 465 434.9 (dif) -6.6 6.9 -4.6 -3 3.5 9.5 3.8 7.7 -15.1 -28.5 -11.5 1.9 9.6 13.2 9.3 -2.6 -30.1Finance & Insurance 360.4 365.1 358.4 354.3 356.5 362.9 364.5 369.9 356.7 330.9 318.8 319.4 327.1 339.3 347 343.3 316.4 (dif) -8.7 4.8 -6.7 -4.2 2.2 6.4 1.6 5.4 -13.2 -25.9 -12.1 0.7 7.6 12.3 7.7 -3.7 -27Securities 151.4 162.5 161.6 161.7 170.5 179.8 185.6 195.4 188.1 169.5 161.3 164.7 169.9 178.7 186.1 185.3 166.9 (dif) 5.3 11.1 -0.9 0.1 8.9 9.3 5.8 9.8 -7.3 -18.6 -8.2 3.4 5.1 8.8 7.4 -0.9 -18.3Banking 126.6 121.4 116.6 113.6 108.8 106.8 103.9 102.7 98.5 92.6 90.1 89 92.1 95.7 95.5 92.3 86.1 (dif) -10.8 -5.2 -4.8 -3 -4.8 -2 -2.9 -1.3 -4.1 -5.9 -2.5 -1.1 3.1 3.5 -0.2 -3.1 -6.3Real Estate & Rental & Leasing 104.5 106.7 108.8 109.9 111.2 114.3 116.6 118.9 116.9 114.2 114.8 116 118 119 120.7 121.7 118.5 (dif) 2.1 2.1 2.2 1.1 1.3 3.1 2.2 2.4 -2 -2.7 0.6 1.2 2 1 1.6 1 -3.1Information 151.8 152.4 154.4 158.9 162.6 166.5 172.8 187.3 200.4 176.9 163.9 160.2 162.8 164.6 165.5 167.1 161.1 (dif) -0.9 0.6 2 4.5 3.7 3.8 6.3 14.5 13.1 -23.5 -13 -3.7 2.6 1.8 0.9 1.6 -6Professional & Business Services 425 437.1 445.1 468.4 493.7 525.2 552.9 586.5 581.9 550.4 536.6 541.6 555.6 571.8 593.2 605.4 572.6 (dif) 9.6 12.1 8 23.3 25.3 31.4 27.8 33.6 -4.6 -31.5 -13.8 5 14 16.2 21.4 12.2 -32.8Professional, Scientific, & Technical Services 222.3 226.1 232.3 239.7 254 277.6 296.8 320.7 312.2 289.3 286 292.2 303.7 319.7 334.8 345.3 326.6 (dif) 2.3 3.8 6.3 7.3 14.3 23.6 19.2 24 -8.5 -23 -3.2 6.1 11.5 16.1 15.1 10.5 -18.7Management of Companies & Enterprises 51.6 52.8 54 56.4 56.2 58.5 57.3 52.6 54.7 58.4 58.9 56.9 57.6 58.6 59.4 62 60.3 (dif) 1.7 1.2 1.1 2.4 -0.1 2.3 -1.2 -4.7 2 3.7 0.5 -1.9 0.7 0.9 0.8 2.6 -1.7Administrative Services 151.1 158.2 158.8 172.4 183.5 189 198.9 213.1 215 202.7 191.7 192.5 194.3 193.5 199 198.1 185.7 (dif) 5.5 7.1 0.6 13.6 11.1 5.6 9.8 14.3 1.8 -12.2 -11 0.8 1.8 -0.8 5.5 -0.9 -12.4Employment Services 41.3 46.1 47.3 56.8 65.4 68 74.6 83.9 84.2 75 67.2 65.4 66.4 66 67.9 65 56.9 (dif) 5.2 4.7 1.3 9.5 8.6 2.7 6.6 9.3 0.2 -9.2 -7.8 -1.8 1 -0.4 1.9 -2.9 -8.1Educational & Health Services 515.6 535.6 551 565.5 576.2 588.7 604.4 615.2 627.1 646 658.2 665.3 678.8 694.7 705.1 719 733.8 (dif) 15.4 20 15.3 14.5 10.7 12.6 15.6 10.9 11.8 18.9 12.2 7.1 13.5 16 10.4 13.9 14.9Educational Services 96.6 101 105.1 116.1 119.9 123.7 124.2 126.5 133.1 138.7 142.2 144.8 146.6 151.3 154.4 160.3 164.5 (dif) 0.2 4.4 4.2 11 3.8 3.8 0.4 2.3 6.6 5.6 3.6 2.6 1.7 4.7 3.1 5.9 4.2Health Care & Social Assistance 419 434.6 445.8 449.4 456.3 465 480.2 488.7 494 507.3 516 520.4 532.2 543.5 550.7 558.7 569.4 (dif) 15.2 15.7 11.2 3.6 6.9 8.7 15.2 8.5 5.3 13.3 8.6 4.5 11.8 11.3 7.2 8 10.7Leisure & Hospitality 194.3 200.8 208.5 216.6 227.9 235.8 243.7 256.7 260.1 255.3 260.3 270.1 276.7 284.9 297.8 310.2 307.9 (dif) 1.1 6.4 7.7 8.1 11.4 7.9 7.8 13.1 3.4 -4.8 5 9.8 6.6 8.1 12.9 12.5 -2.4Arts, Entertainment, & Recreation 40.9 42.4 43.8 46.3 49.6 50.5 52.9 56.4 56.9 56.2 57.5 60.7 61.5 63.2 65.3 69.1 67.4 (dif) 0.8 1.6 1.4 2.5 3.3 0.9 2.5 3.4 0.6 -0.7 1.3 3.2 0.8 1.7 2.1 3.9 -1.7Accommodation & Food Services 153.5 158.3 164.7 170.3 178.3 185.3 190.7 200.4 203.2 199.1 202.8 209.4 215.3 221.7 232.5 241.1 240.4 (dif) 0.3 4.9 6.3 5.6 8 7 5.4 9.7 2.8 -4.1 3.7 6.6 5.9 6.4 10.9 8.6 -0.7Other Services 119.8 120.7 122.6 125.2 129.3 133.9 141.5 147.4 148.7 149.7 149.1 150.5 153.2 154.3 157.7 160.8 159.7 (dif) 1.6 0.9 1.9 2.7 4.1 4.6 7.6 5.8 1.3 1 -0.6 1.4 2.7 1.1 3.4 3.1 -1.1Trade, Transportation, & Utilities 526.8 524.5 531.5 532 537.3 542 556.3 569.6 557.4 536.5 533.6 539.3 547.5 558.3 569.7 573.7 548.6 (dif) -6.7 -2.3 7 0.4 5.3 4.7 14.3 13.3 -12.2 -20.9 -2.9 5.7 8.2 10.9 11.4 4 -25.1Retail Trade 233.6 236.6 243 248.2 253.1 260.1 270.1 281.5 272 268.1 267.3 273.5 281.3 287.4 295.4 299.6 289.1 (dif) 0 3 6.4 5.2 4.9 7.1 10 11.4 -9.5 -4 -0.8 6.1 7.9 6.1 7.9 4.2 -10.4Wholesale Trade 158.6 157.4 157.7 153.3 154.8 153.2 155.5 155.1 155.9 149.1 147.7 147.8 147.5 148.9 149.9 148.7 138.8 (dif) -4.5 -1.2 0.3 -4.5 1.6 -1.6 2.3 -0.5 0.9 -6.8 -1.3 0.1 -0.3 1.4 1 -1.3 -9.8Transportation & Warehousing 114.5 111.2 112 112.6 112.3 112.7 115.4 118.1 114.7 104.5 103.6 103.5 103.8 106.8 108.9 109.7 104.5 (dif) -1.7 -3.2 0.8 0.5 -0.2 0.3 2.7 2.7 -3.4 -10.2 -0.9 -0.1 0.2 3 2.2 0.8 -5.2Utilities 20.1 19.3 18.8 18 17 16 15.2 14.9 14.8 14.8 14.9 14.5 14.9 15.2 15.4 15.8 16.2 (dif) -0.5 -0.8 -0.6 -0.8 -0.9 -1.1 -0.8 -0.3 -0.1 0.1 0 -0.4 0.4 0.3 0.2 0.4 0.3Construction 84.9 88.1 89.8 90.9 93.5 101.3 112.5 120.5 122.1 115.8 112.7 111.8 113.3 118.5 127.3 132.7 120.5 (dif) -1.1 3.2 1.8 1.1 2.5 7.9 11.2 8.1 1.5 -6.3 -3.1 -0.9 1.5 5.2 8.8 5.5 -12.2Manufacturing 219.3 211.8 207.8 200.5 201.2 195.9 186.8 176.8 155.5 139.4 126.6 120.8 113.9 106.1 101 95.6 82.6 (dif) -6.3 -7.5 -4 -7.3 0.7 -5.3 -9.1 -10 -21.3 -16.1 -12.8 -5.7 -6.9 -7.8 -5 -5.4 -13Government 587 577.7 559.5 545.1 550.5 560.4 567 568.9 562.4 566.2 556.6 554.4 555.6 555.2 559 564.1 565 (dif) 3.1 -9.3 -18.2 -14.4 5.4 10 6.5 1.9 -6.5 3.8 -9.6 -2.3 1.3 -0.4 3.8 5.1 1
Data: Ths.