Embed Size (px)
Citation preview
1
This month the charter market has been a bit quieter, allowing Charterers to rein in the rates somewhat. On the SNP side there is not much in the way of speculative activity anymore given asset price firmness but quite a few real Buyers for this sort of tonnage are still making enquiries. Activity wise we have seen the four Yasa su-ezmaxes sold with two each going to Tsakos and NAT; in addition Tufton have purchased Koenig & Cie’s 2003 Korean blt sisters “Cape Bata” and “Cape Bowen” .
Cape rates have continued to increase and the BCI is now at its highest level since late No-vember last year. This has fuelled the ongoing rise in asset values and sales and purchase activity in the sector. “Corona Bulker” (180k dwt 2011blt HHI) has been sold to Marmaras Navigation of Greece at US$33.6m, and is said to have been inspected by 13 parties, we understand that “Blue Cho Oyu”(180k dwt 2011blt Daeh-an) is on subs at similar levels; compare this with the sales of “Geosand Max” (176k dwt 2011blt SWS) at US$27.5m in June and “Blue Everest”(180k dwt 2010blt Daehan – sister to Blue Cho Oyu) at US$27.0m in May and we can see the clear trend in prices. The rise is not
restricted to capes however as sales of US$20.5m for the “Asita Sun”(82k dwt 2012blt DSME) and US$19.7m for the “Orion Pride” (81.3k dwt 2011blt Samho) demonstrate – for comparison see the sales of the “Daebo Lumut” (81.4k dwt 2011blt HHI) at US$17.25m last month (albeit at auction) and “Prabhu Sher” (81.3k dwt 2011blt HHI) at US$17.7m and “Blue Matterhorn” (81.4k dwt 2011blt Samho) at US$17.8m both in April.
A tepid recovery is underway in the SH market for STST vessels. Sinochem has reportedly pur-chased the SC Stealth for US$24.5m from Brave Mari-time, higher than previous sales for similar tonnage. The SC Stealth of 19,900 dwt (Fukuoka blt 2007), is the latest vessel sold in the same sub-segment. We currently value a SH5 STST chemical carrier to US$26.5m, which should mean about US$23m for an eight year-old vessel. The higher correspond-ing price paid for the SC Stealth indicates a SH market for STST chemical carriers firming slowly on the improved freight rates this year and the comments made by chemical carrier own-ers of a better second-half of the year.
The tighter SH market for STST chemical carriers also comes as the number of Chinese ship-yards building such tonnage are
becoming increasingly limited. In our S&P report for June we wrote that the Danish chemical tanker company Celsius Ship-ping had cancelled its new-building series of STST chemical tankers at Nantong Mingde, acquired by financially strained Jiangsu Sainty Marine Corp. Jiangsu Sainty has since said that it will not financially sup-port additionally Nantong Mingde.
There was a fair amount of ac-tivity in the S&P market for LPG vessels in July. The Baltic Gas (20.500cbm SR, 1994) was sold from Ultragas to an unknown buyer for region US$20m Navi-gator sold the Navigator Mari-ner (20,500cbm SR, 2000) to an Indonesian buyer PNR. The Auteil (3,200cbm PR, 1995) was sold from Lomar to E Marine for US$2m. There were also a few sales for demolition. Syner-gas sold the Syn Markab (4,000cbm SR, 1992) for demo-lition in India at a price of US$485 per lwt. Samsun Logix sold the Korea Gas (4,000cbm PR, 1986) for demolition in Chi-na PNR. Ultragas sold the Lady Stephanie (3,200cbm PR, 1991) for demolition in Turkey PNR. Thenamaris contracted two MGC’s of 38,000cbm at Hyun-dai Mipo for delivery mid-2017 at a price in the region of US$100m en block.
HIGHLIGHTS
Crude: Less
speculative activity
Dry: Rally in rates
increasing S&P
activity
Chemical: Firming
values
Gas: High activity
during July
July 2015
Dry
Crude
Chemical
Gas
Monthly S&P Report
-Shipbrokers and consultants since 1919-
Hot Hulls
2
-Shipbrokers and consultants since 1919-
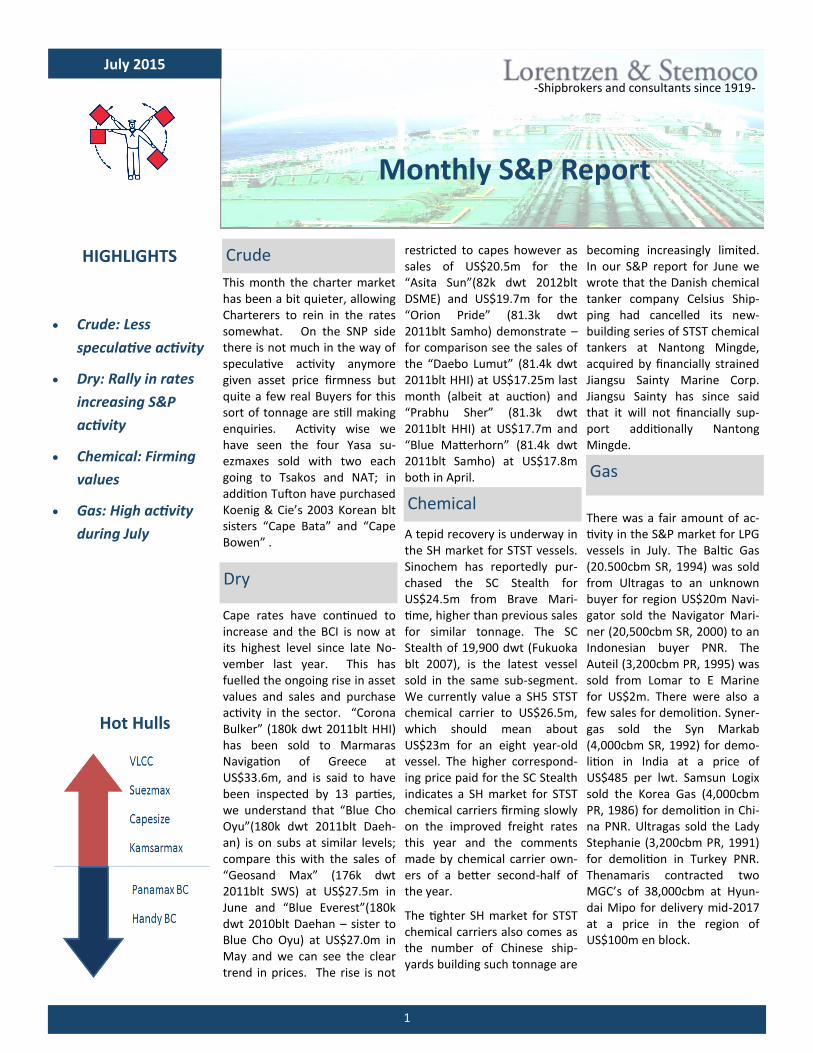
The Baltic LPG index reached a peak in July with healthy activity in both East and West markets. VLGCs were largely well em-ployed, strongly supported by Indian charterers. Congestion continues to be serious in Indian ports, further strengthening rates.
VLGC
Capesize
VLCC
July continued in a positive trajectory, with the Baltic Dry Bulk Index recovering further to 1131, the Capesize market has been
driven by a lack of available vessels in the Pacific and increasing front-haul trade from Brazil to China.
Capesize Values Capesize- Deliveries and Scrapping
VLGC rates (1 yr TC)
VLCC TCE
After a strong sustained rise in freight rates for the first half of July pressure has fallen a bit in the VLCC market, causing rates to
soften to levels more indicative of the past two months, as demand from Chinese refineries is taken down a notch.
VLCC Values
3
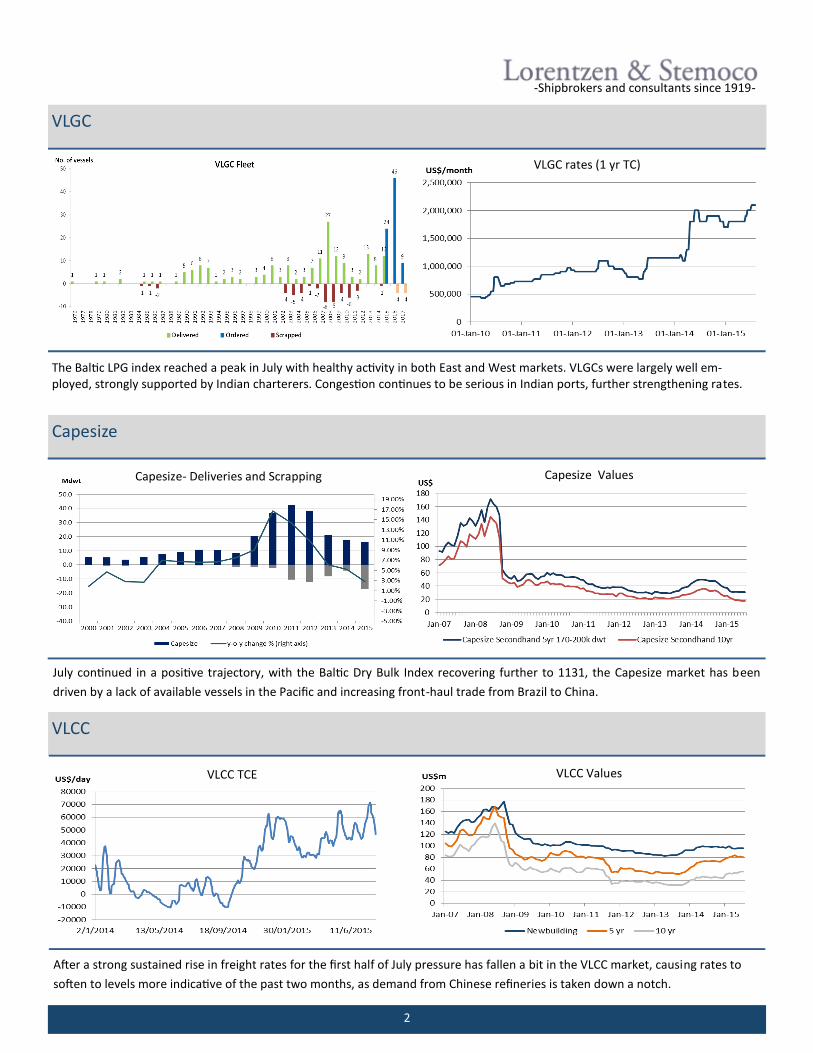
July has been a month of unseasonably good news for the hard-
hit dry bulk market, as the Baltic Capesize Index (BCI) has
strengthened from levels of 1251 to 2116, an increase of 69%.
Whilst still far away from strong earnings levels, the uptick in
rates is pushing the market above the calculated operating and
capital costs for Capesize vessels, a welcome respite for owners
after months of challenging market fundamentals.
Exceptionally high scrapping levels this year (see graph page 4 of
this report) has helped to reduce Capesize oversupply relative to
demand. Demolition has been a driving factor as of late, but
with the rebound in freight rates scrapping activity seems set to
slow down in the short-term.
A positive driver for the segment is the front-haul market of iron
ore from Tubarão, Brazil to Qingdao, China, a route challenged
by the increased activity in Valemax vessels of 400,000dwt car-
rying ore to China. Due to increased activity for Valemaxes as
Chinese port regulations are altered, 40 older VLCCs that were
converted to ore carriers serving this trade could become redun-
dant and prime scrapping candidates, providing further support
for the Capesize segment as the effect of the Valemaxes on mar-
ket sentiment is dampened. This development might mean that
we see a longer-term positive movement in freight rates for
Capesize vessels, including development in indicative indices
such as the BCI.
Any substantial recovery in the Capesize market must currently
be supported by demand from China, as in spite of being on the
rise, Indian iron ore imports still fall short of replacing demand
from the Far East major. Current developments in the Chinese
stock market could however prove a downside risk for the dry
bulk market in general, should firms see a substantial reduction
in equity values which could negatively impact the purchasing
and investment power of an already fragile Chinese construction
and housing market. The Shanghai Composite Index has fallen
by close to 30% since mid-June, and is likely to enter further
bearish territory as we go ahead, in spite of government support
being initiated. Interestingly, iron ore prices do not seem to
have been as negatively affected as expected, and have rallied
from weak June levels. Prices are still low however, which might
further strengthen buyer interest, amidst firming prices for steel
in China.
The combination of asset values that have been under pressure
and a market that seems to be strengthening, is causing us to
upgrade the status of Capesize vessels to ‘hot’ assets in this is-
sue, as we believe S&P activity will increase in this segment and
expect further rate hikes to be seen already in August and Sep-
tember, rather than Q4.
-Shipbrokers and consultants since 1919- Special Report
Capesize—Real Recovery or Dead Cat Bounce?
4
-Shipbrokers and consultants since 1919-
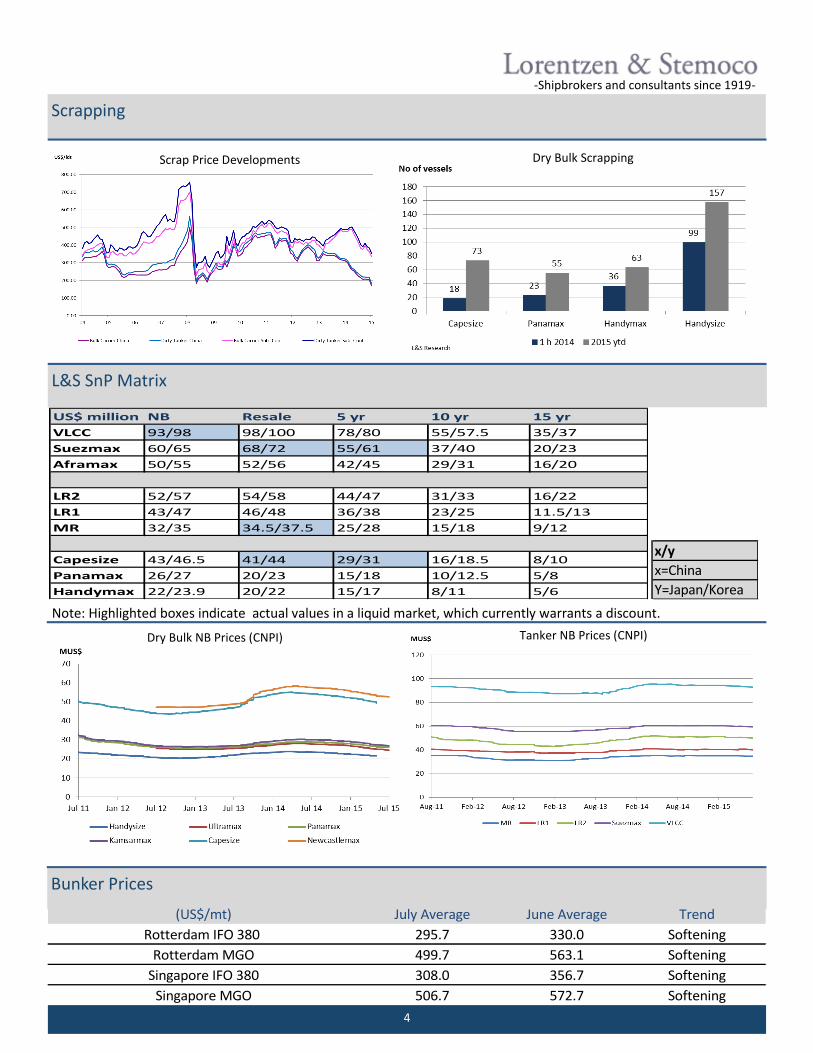
Scrapping
L&S SnP Matrix
Bunker Prices
Dry Bulk Scrapping Scrap Price Developments
Dry Bulk NB Prices (CNPI) Tanker NB Prices (CNPI)
US$ million NB Resale 5 yr 10 yr 15 yr
VLCC 93/98 98/100 78/80 55/57.5 35/37
Suezmax 60/65 68/72 55/61 37/40 20/23
Aframax 50/55 52/56 42/45 29/31 16/20
LR2 52/57 54/58 44/47 31/33 16/22
LR1 43/47 46/48 36/38 23/25 11.5/13
MR 32/35 34.5/37.5 25/28 15/18 9/12
Capesize 43/46.5 41/44 29/31 16/18.5 8/10
Panamax 26/27 20/23 15/18 10/12.5 5/8
Handymax 22/23.9 20/22 15/17 8/11 5/6
x/y
x=China
Y=Japan/Korea
Note: Highlighted boxes indicate actual values in a liquid market, which currently warrants a discount.
(US$/mt) July Average June Average Trend
Rotterdam IFO 380 295.7 330.0 Softening
Rotterdam MGO 499.7 563.1 Softening
Singapore IFO 380 308.0 356.7 Softening
Singapore MGO 506.7 572.7 Softening
5
-Shipbrokers and consultants since 1919-
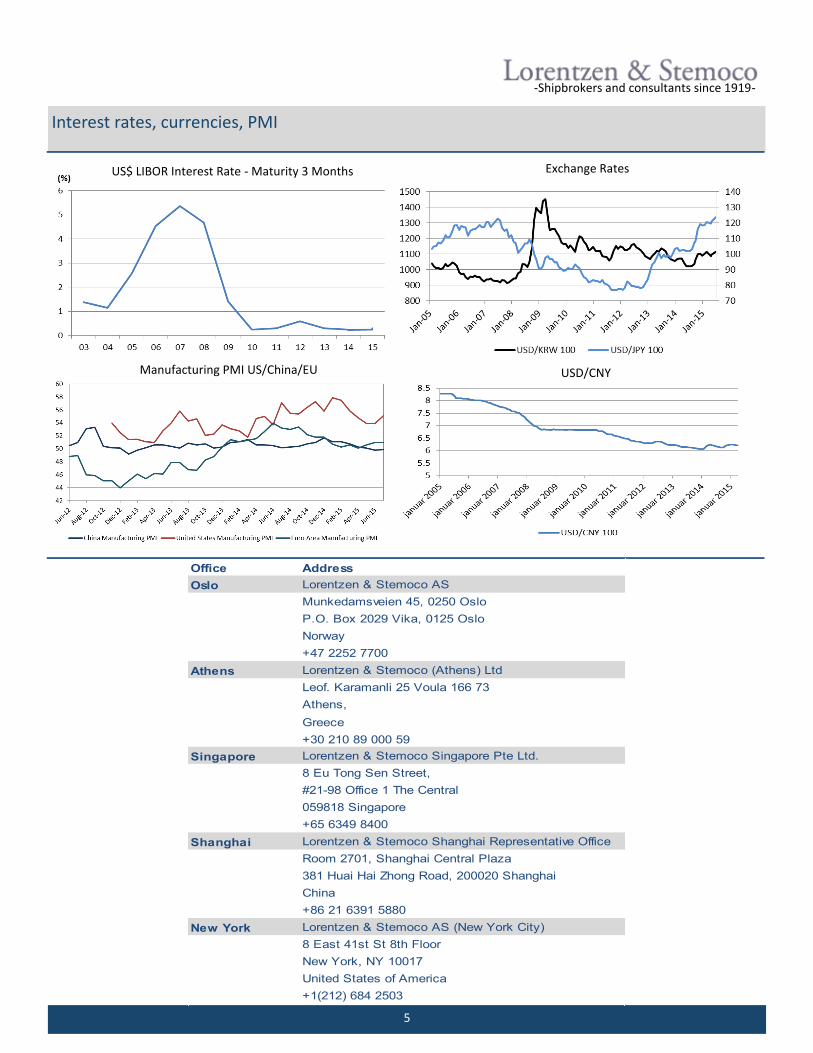
Interest rates, currencies, PMI
Manufacturing PMI US/China/EU
US$ LIBOR Interest Rate - Maturity 3 Months
USD/CNY
Exchange Rates
Office Address
Oslo Lorentzen & Stemoco AS
Munkedamsveien 45, 0250 Oslo
P.O. Box 2029 Vika, 0125 Oslo
Norway
+47 2252 7700
Athens Lorentzen & Stemoco (Athens) Ltd
Leof. Karamanli 25 Voula 166 73
Athens,
Greece
+30 210 89 000 59
Singapore Lorentzen & Stemoco Singapore Pte Ltd.
8 Eu Tong Sen Street,
#21-98 Office 1 The Central
059818 Singapore
+65 6349 8400
Shanghai Lorentzen & Stemoco Shanghai Representative Office
Room 2701, Shanghai Central Plaza
381 Huai Hai Zhong Road, 200020 Shanghai
China
+86 21 6391 5880
New York Lorentzen & Stemoco AS (New York City)
8 East 41st St 8th Floor
New York, NY 10017
United States of America
+1(212) 684 2503
6
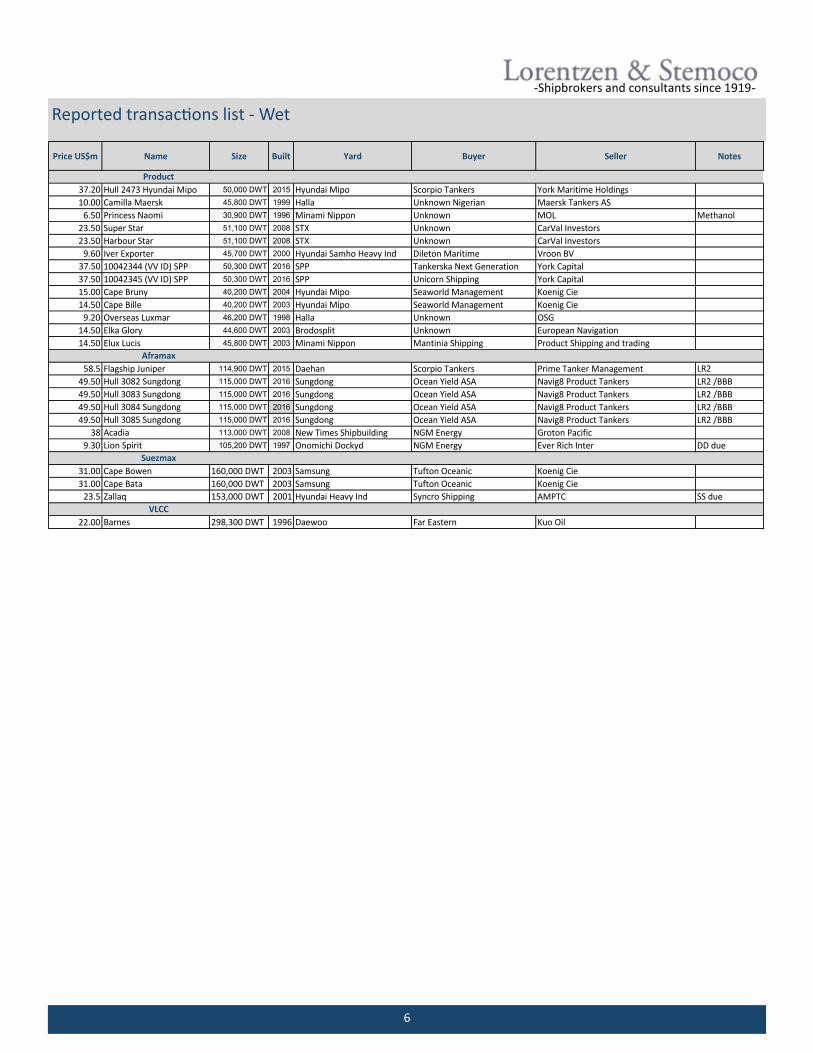
Reported transactions list - Wet
-Shipbrokers and consultants since 1919-
Price US$m Name Size Built Yard Buyer Seller Notes
37.20 Hull 2473 Hyundai Mipo 50,000 DWT 2015 Hyundai Mipo Scorpio Tankers York Maritime Holdings
10.00 Camilla Maersk 45,800 DWT 1999 Halla Unknown Nigerian Maersk Tankers AS
6.50 Princess Naomi 30,900 DWT 1996 Minami Nippon Unknown MOL Methanol
23.50 Super Star 51,100 DWT 2008 STX Unknown CarVal Investors
23.50 Harbour Star 51,100 DWT 2008 STX Unknown CarVal Investors
9.60 Iver Exporter 45,700 DWT 2000 Hyundai Samho Heavy Ind Dileton Maritime Vroon BV
37.50 10042344 (VV ID) SPP 50,300 DWT 2016 SPP Tankerska Next Generation York Capital
37.50 10042345 (VV ID) SPP 50,300 DWT 2016 SPP Unicorn Shipping York Capital
15.00 Cape Bruny 40,200 DWT 2004 Hyundai Mipo Seaworld Management Koenig Cie
14.50 Cape Bille 40,200 DWT 2003 Hyundai Mipo Seaworld Management Koenig Cie
9.20 Overseas Luxmar 46,200 DWT 1998 Halla Unknown OSG
14.50 Elka Glory 44,600 DWT 2003 Brodosplit Unknown European Navigation
14.50 Elux Lucis 45,800 DWT 2003 Minami Nippon Mantinia Shipping Product Shipping and trading
58.5 Flagship Juniper 114,900 DWT 2015 Daehan Scorpio Tankers Prime Tanker Management LR2
49.50 Hull 3082 Sungdong 115,000 DWT 2016 Sungdong Ocean Yield ASA Navig8 Product Tankers LR2 /BBB
49.50 Hull 3083 Sungdong 115,000 DWT 2016 Sungdong Ocean Yield ASA Navig8 Product Tankers LR2 /BBB
49.50 Hull 3084 Sungdong 115,000 DWT 2016 Sungdong Ocean Yield ASA Navig8 Product Tankers LR2 /BBB
49.50 Hull 3085 Sungdong 115,000 DWT 2016 Sungdong Ocean Yield ASA Navig8 Product Tankers LR2 /BBB
38 Acadia 113,000 DWT 2008 New Times Shipbuilding NGM Energy Groton Pacific
9.30 Lion Spirit 105,200 DWT 1997 Onomichi Dockyd NGM Energy Ever Rich Inter DD due
31.00 Cape Bowen 160,000 DWT 2003 Samsung Tufton Oceanic Koenig Cie
31.00 Cape Bata 160,000 DWT 2003 Samsung Tufton Oceanic Koenig Cie
23.5 Zallaq 153,000 DWT 2001 Hyundai Heavy Ind Syncro Shipping AMPTC SS due
22.00 Barnes 298,300 DWT 1996 Daewoo Far Eastern Kuo Oil
Product
VLCC
Suezmax
Aframax
7
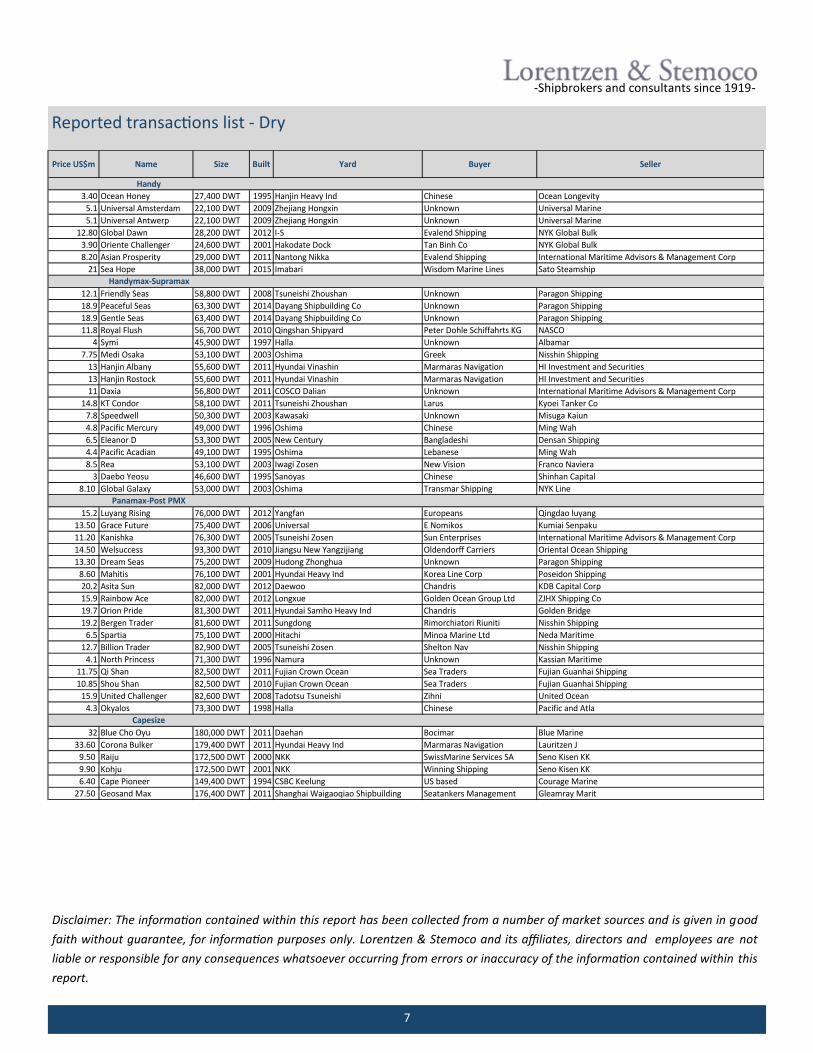
Reported transactions list - Dry
-Shipbrokers and consultants since 1919-
Disclaimer: The information contained within this report has been collected from a number of market sources and is given in good
faith without guarantee, for information purposes only. Lorentzen & Stemoco and its affiliates, directors and employees are not
liable or responsible for any consequences whatsoever occurring from errors or inaccuracy of the information contained within this
report.
Price US$m Name Size Built Yard Buyer Seller
3.40 Ocean Honey 27,400 DWT 1995 Hanjin Heavy Ind Chinese Ocean Longevity
5.1 Universal Amsterdam 22,100 DWT 2009 Zhejiang Hongxin Unknown Universal Marine
5.1 Universal Antwerp 22,100 DWT 2009 Zhejiang Hongxin Unknown Universal Marine
12.80 Global Dawn 28,200 DWT 2012 I-S Evalend Shipping NYK Global Bulk
3.90 Oriente Challenger 24,600 DWT 2001 Hakodate Dock Tan Binh Co NYK Global Bulk
8.20 Asian Prosperity 29,000 DWT 2011 Nantong Nikka Evalend Shipping International Maritime Advisors & Management Corp
21 Sea Hope 38,000 DWT 2015 Imabari Wisdom Marine Lines Sato Steamship
12.1 Friendly Seas 58,800 DWT 2008 Tsuneishi Zhoushan Unknown Paragon Shipping
18.9 Peaceful Seas 63,300 DWT 2014 Dayang Shipbuilding Co Unknown Paragon Shipping
18.9 Gentle Seas 63,400 DWT 2014 Dayang Shipbuilding Co Unknown Paragon Shipping
11.8 Royal Flush 56,700 DWT 2010 Qingshan Shipyard Peter Dohle Schiffahrts KG NASCO
4 Symi 45,900 DWT 1997 Halla Unknown Albamar
7.75 Medi Osaka 53,100 DWT 2003 Oshima Greek Nisshin Shipping
13 Hanjin Albany 55,600 DWT 2011 Hyundai Vinashin Marmaras Navigation HI Investment and Securities
13 Hanjin Rostock 55,600 DWT 2011 Hyundai Vinashin Marmaras Navigation HI Investment and Securities
11 Daxia 56,800 DWT 2011 COSCO Dalian Unknown International Maritime Advisors & Management Corp
14.8 KT Condor 58,100 DWT 2011 Tsuneishi Zhoushan Larus Kyoei Tanker Co
7.8 Speedwell 50,300 DWT 2003 Kawasaki Unknown Misuga Kaiun
4.8 Pacific Mercury 49,000 DWT 1996 Oshima Chinese Ming Wah
6.5 Eleanor D 53,300 DWT 2005 New Century Bangladeshi Densan Shipping
4.4 Pacific Acadian 49,100 DWT 1995 Oshima Lebanese Ming Wah
8.5 Rea 53,100 DWT 2003 Iwagi Zosen New Vision Franco Naviera
3 Daebo Yeosu 46,600 DWT 1995 Sanoyas Chinese Shinhan Capital
8.10 Global Galaxy 53,000 DWT 2003 Oshima Transmar Shipping NYK Line
15.2 Luyang Rising 76,000 DWT 2012 Yangfan Europeans Qingdao luyang
13.50 Grace Future 75,400 DWT 2006 Universal E Nomikos Kumiai Senpaku
11.20 Kanishka 76,300 DWT 2005 Tsuneishi Zosen Sun Enterprises International Maritime Advisors & Management Corp
14.50 Welsuccess 93,300 DWT 2010 Jiangsu New Yangzijiang Oldendorff Carriers Oriental Ocean Shipping
13.30 Dream Seas 75,200 DWT 2009 Hudong Zhonghua Unknown Paragon Shipping
8.60 Mahitis 76,100 DWT 2001 Hyundai Heavy Ind Korea Line Corp Poseidon Shipping
20.2 Asita Sun 82,000 DWT 2012 Daewoo Chandris KDB Capital Corp
15.9 Rainbow Ace 82,000 DWT 2012 Longxue Golden Ocean Group Ltd ZJHX Shipping Co
19.7 Orion Pride 81,300 DWT 2011 Hyundai Samho Heavy Ind Chandris Golden Bridge
19.2 Bergen Trader 81,600 DWT 2011 Sungdong Rimorchiatori Riuniti Nisshin Shipping
6.5 Spartia 75,100 DWT 2000 Hitachi Minoa Marine Ltd Neda Maritime
12.7 Billion Trader 82,900 DWT 2005 Tsuneishi Zosen Shelton Nav Nisshin Shipping
4.1 North Princess 71,300 DWT 1996 Namura Unknown Kassian Maritime
11.75 Qi Shan 82,500 DWT 2011 Fujian Crown Ocean Sea Traders Fujian Guanhai Shipping
10.85 Shou Shan 82,500 DWT 2010 Fujian Crown Ocean Sea Traders Fujian Guanhai Shipping
15.9 United Challenger 82,600 DWT 2008 Tadotsu Tsuneishi Zihni United Ocean
4.3 Okyalos 73,300 DWT 1998 Halla Chinese Pacific and Atla
32 Blue Cho Oyu 180,000 DWT 2011 Daehan Bocimar Blue Marine
33.60 Corona Bulker 179,400 DWT 2011 Hyundai Heavy Ind Marmaras Navigation Lauritzen J
9.50 Raiju 172,500 DWT 2000 NKK SwissMarine Services SA Seno Kisen KK
9.90 Kohju 172,500 DWT 2001 NKK Winning Shipping Seno Kisen KK
6.40 Cape Pioneer 149,400 DWT 1994 CSBC Keelung US based Courage Marine
27.50 Geosand Max 176,400 DWT 2011 Shanghai Waigaoqiao Shipbuilding Seatankers Management Gleamray Marit
Handy
Panamax-Post PMX
Handymax-Supramax
Capesize