Embed Size (px)
Citation preview

MOPD – Weekly MeetingsMeeting 1 – Year 15-16
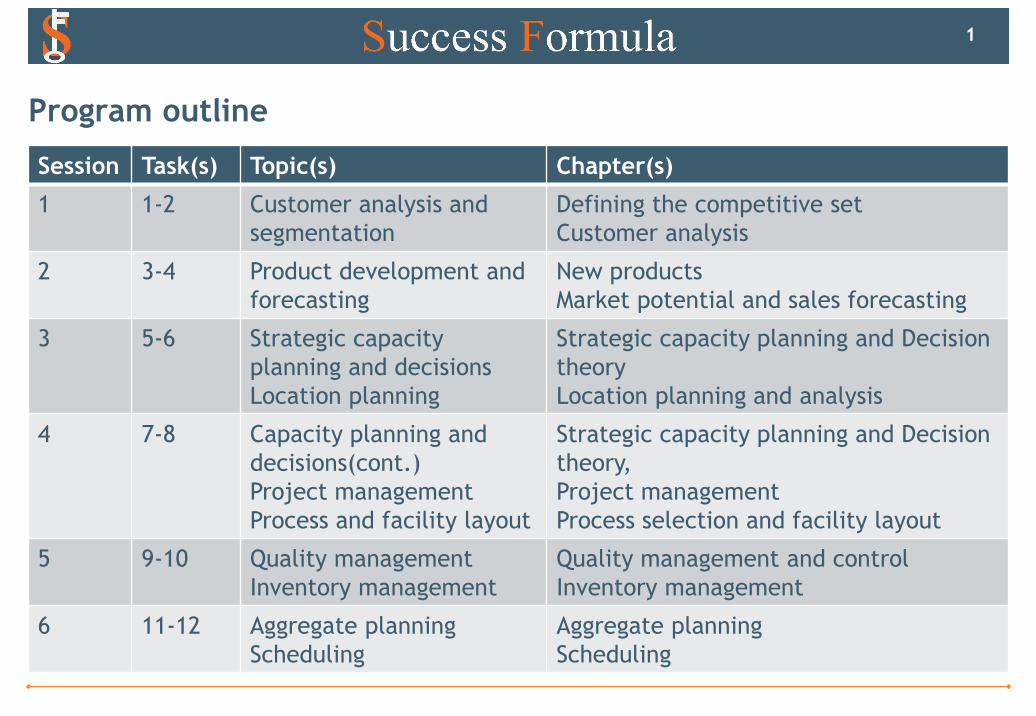
Program outline
Session Task(s) Topic(s) Chapter(s)
1 1-2 Customer analysis and
segmentation
Defining the competitive set
Customer analysis
2 3-4 Product development and
forecasting
New products
Market potential and sales forecasting
3 5-6 Strategic capacity
planning and decisions
Location planning
Strategic capacity planning and Decision
theory
Location planning and analysis
4 7-8 Capacity planning and
decisions(cont.)
Project management
Process and facility layout
Strategic capacity planning and Decision
theory,
Project management
Process selection and facility layout
5 9-10 Quality management
Inventory management
Quality management and control
Inventory management
6 11-12 Aggregate planning
Scheduling
Aggregate planning
Scheduling
1
MOPD
Weekly meeting 1
2
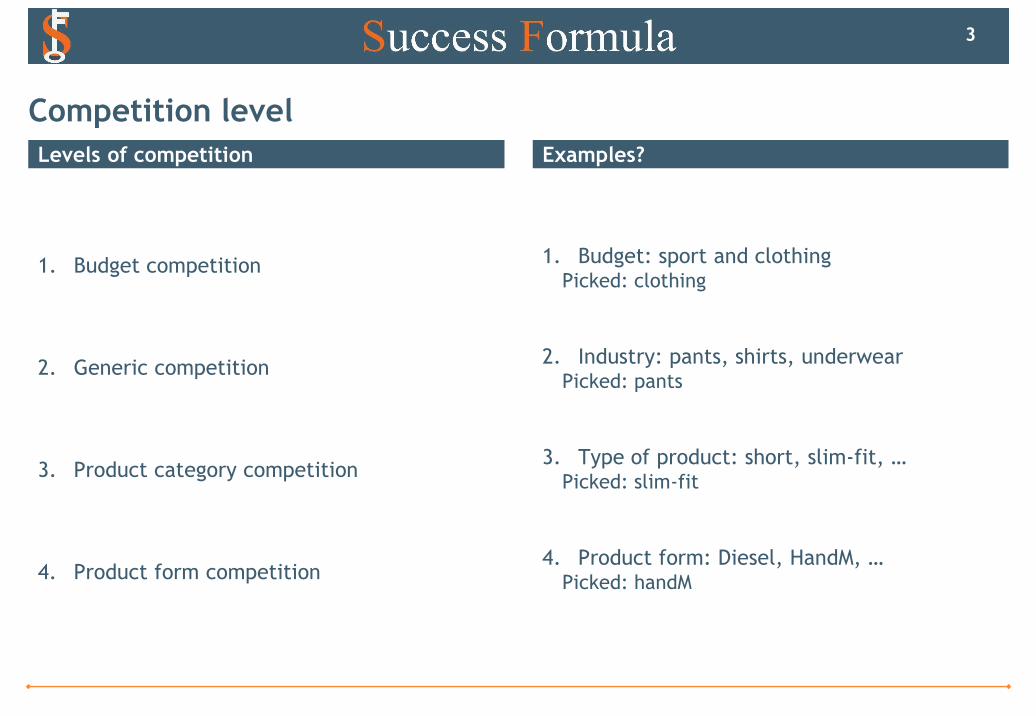
Levels of competition Examples?
1. Budget competition
2. Generic competition
3. Product category competition
4. Product form competition
1. Budget: sport and clothing Picked: clothing
2. Industry: pants, shirts, underwearPicked: pants
3. Type of product: short, slim-fit, …Picked: slim-fit
4. Product form: Diesel, HandM, … Picked: handM
Competition level
3
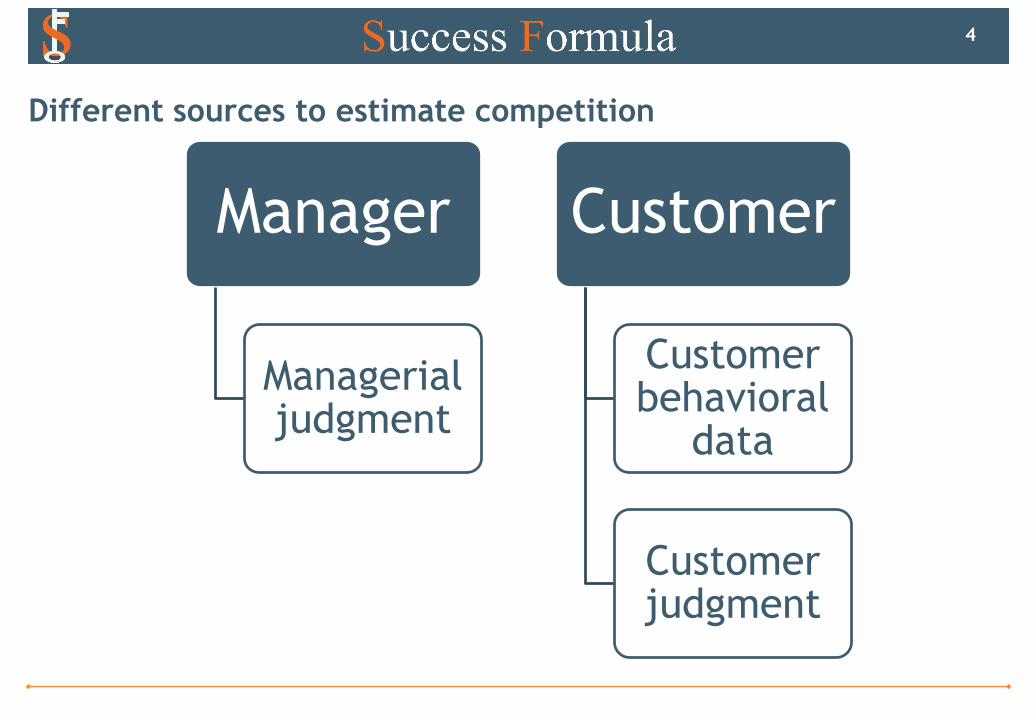
Manager
Managerial judgment
Customer
Customer behavioral
data
Customer judgment
Different sources to estimate competition
4
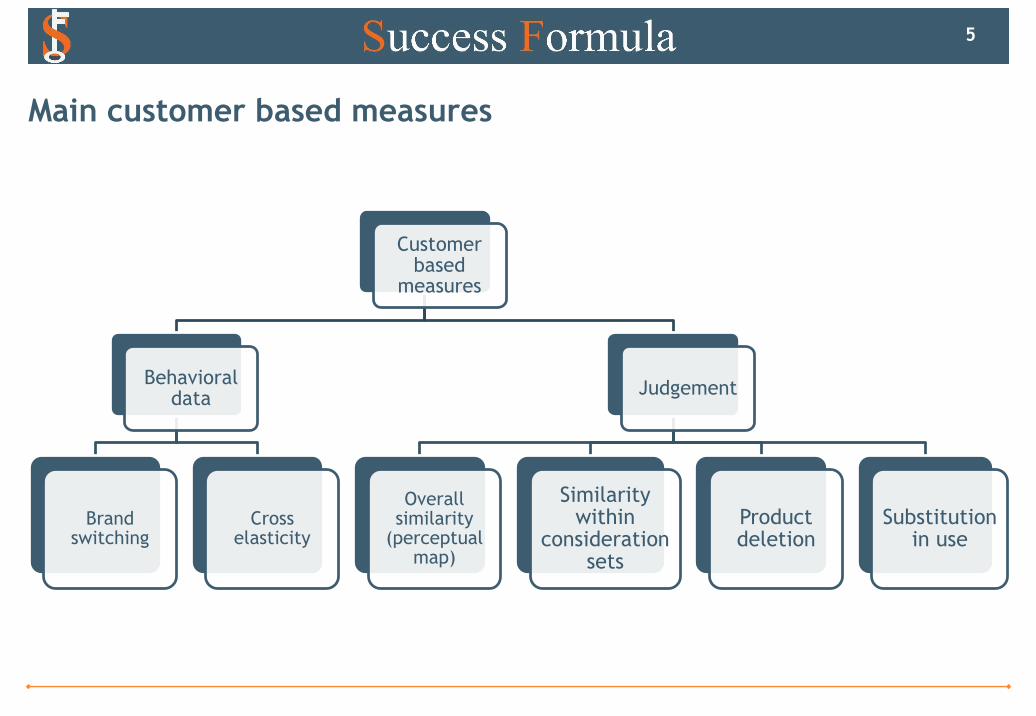
Customer based
measures
Behavioral data
Brand switching
Cross elasticity
Judgement
Overall similarity
(perceptual map)
Similarity within
consideration sets
Product deletion
Substitution in use
Main customer based measures
5
1
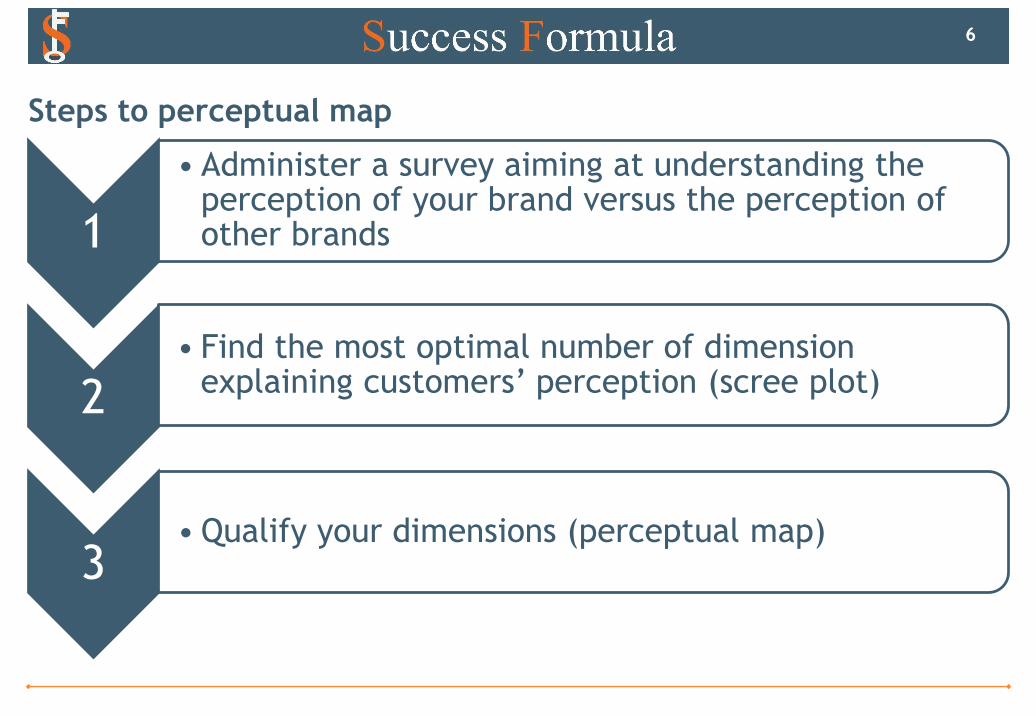
• Administer a survey aiming at understanding the perception of your brand versus the perception of other brands
2• Find the most optimal number of dimension
explaining customers’ perception (scree plot)
3• Qualify your dimensions (perceptual map)
Steps to perceptual map
6
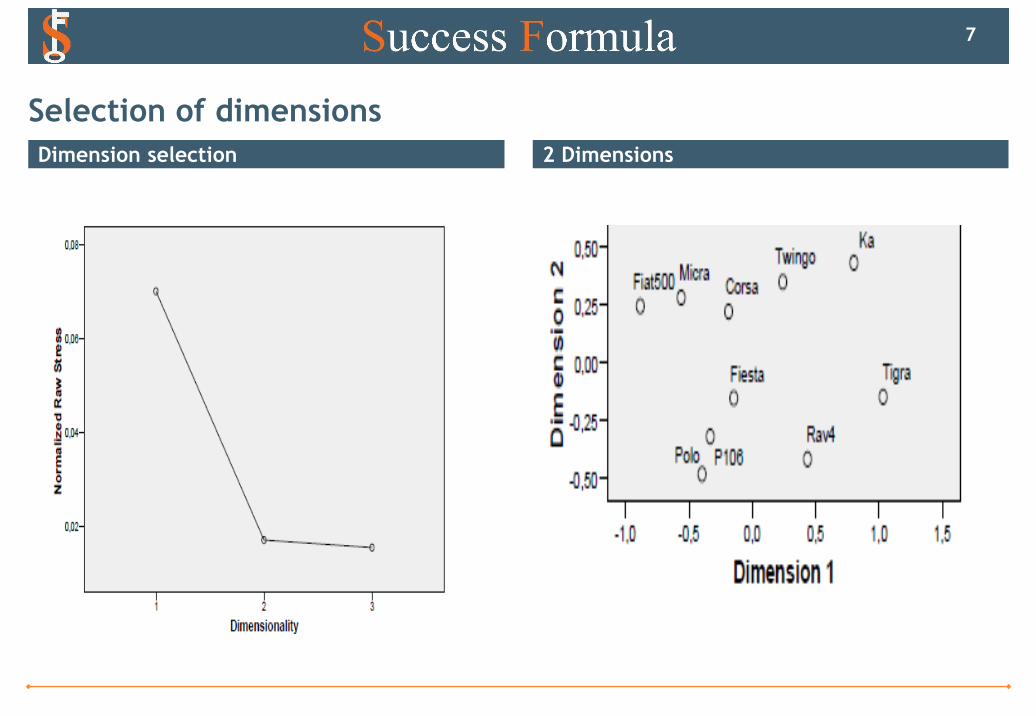
Dimension selection 2 Dimensions
Selection of dimensions
7
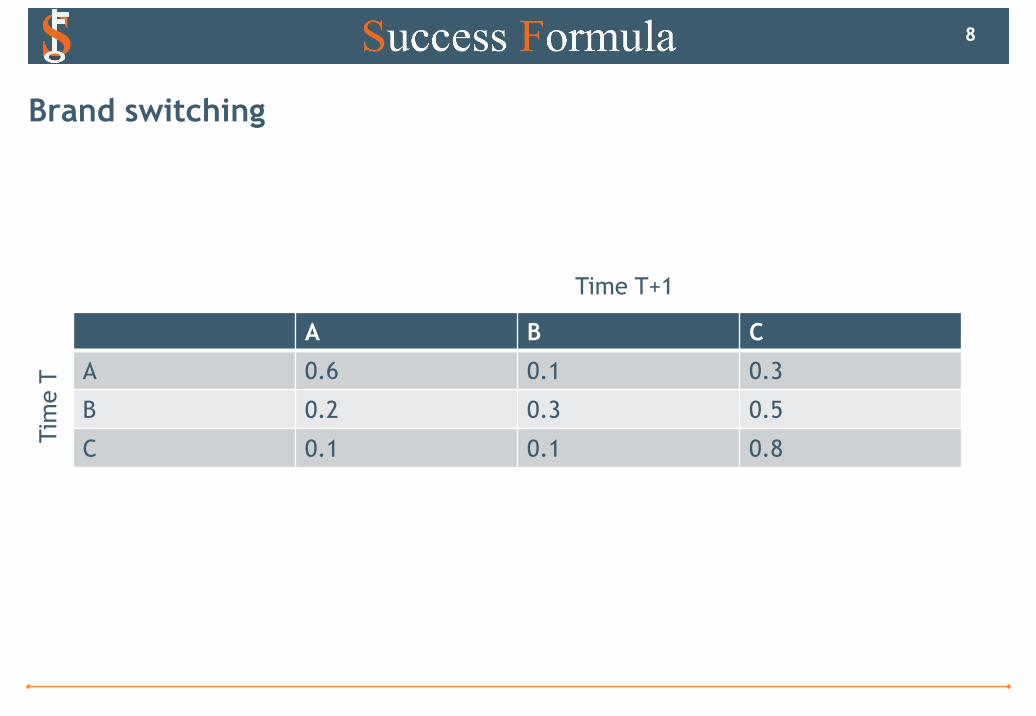
A B C
A 0.6 0.1 0.3
B 0.2 0.3 0.5
C 0.1 0.1 0.8
Brand switching
8
Time T+1
Tim
e T
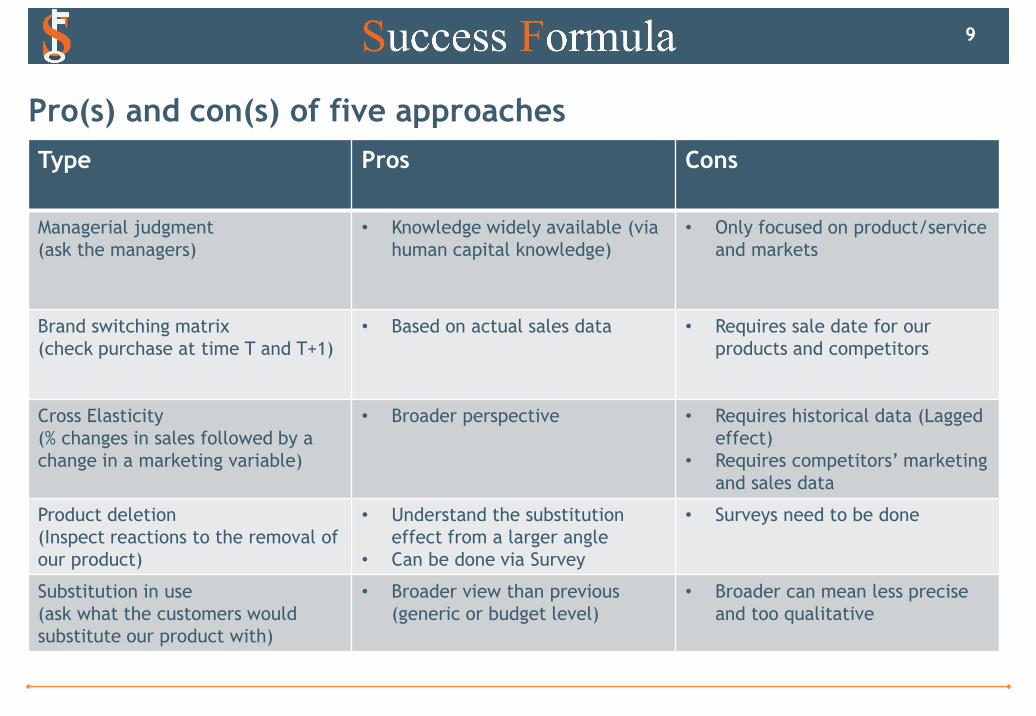
Type Pros Cons
Managerial judgment
(ask the managers)
• Knowledge widely available (via
human capital knowledge)
• Only focused on product/service
and markets
Brand switching matrix
(check purchase at time T and T+1)
• Based on actual sales data • Requires sale date for our
products and competitors
Cross Elasticity
(% changes in sales followed by a
change in a marketing variable)
• Broader perspective • Requires historical data (Lagged
effect)
• Requires competitors’ marketing
and sales data
Product deletion
(Inspect reactions to the removal of
our product)
• Understand the substitution
effect from a larger angle
• Can be done via Survey
• Surveys need to be done
Substitution in use
(ask what the customers would
substitute our product with)
• Broader view than previous
(generic or budget level)
• Broader can mean less precise
and too qualitative
Pro(s) and con(s) of five approaches
9
Note: Data are made up
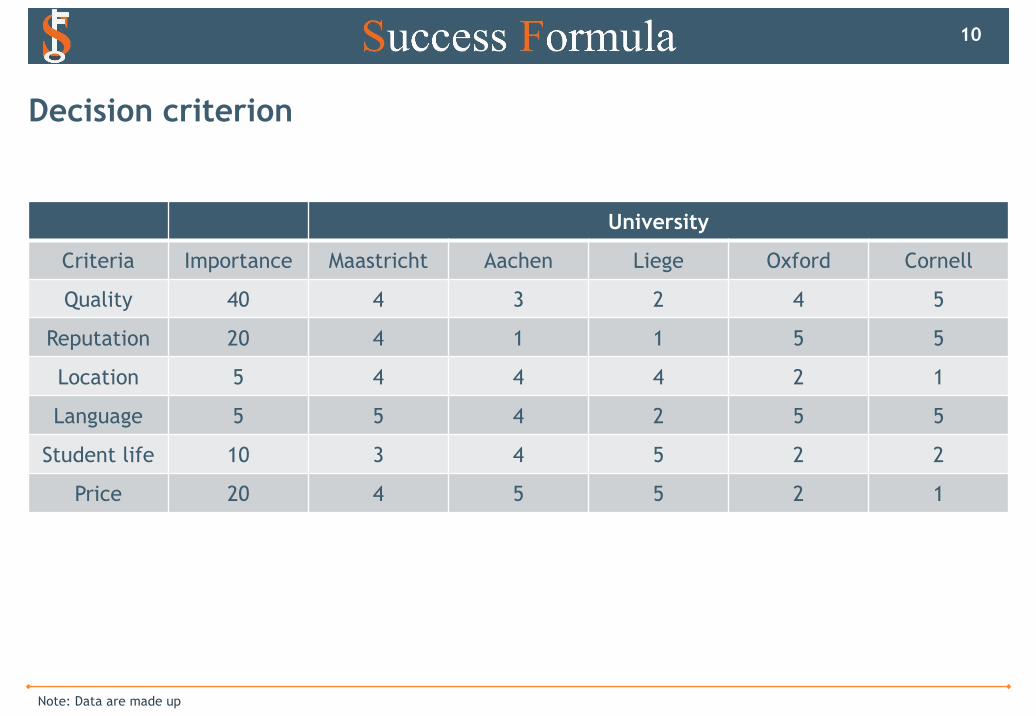
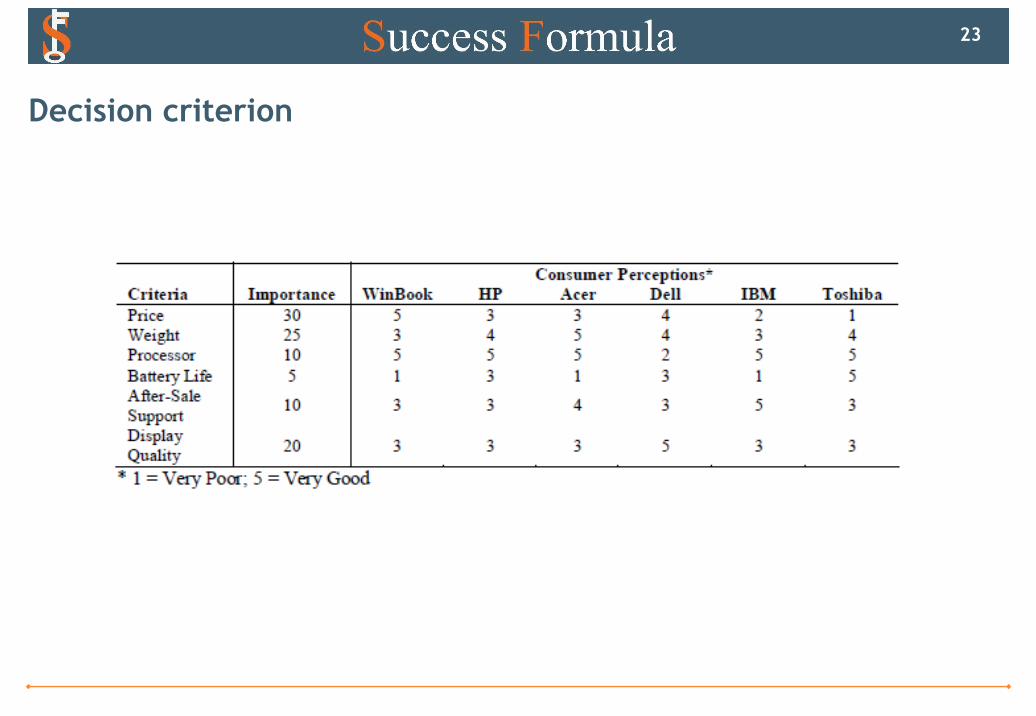
Decision criterion
10
University
Criteria Importance Maastricht Aachen Liege Oxford Cornell
Quality 40 4 3 2 4 5
Reputation 20 4 1 1 5 5
Location 5 4 4 4 2 1
Language 5 5 4 2 5 5
Student life 10 3 4 5 2 2
Price 20 4 5 5 2 1
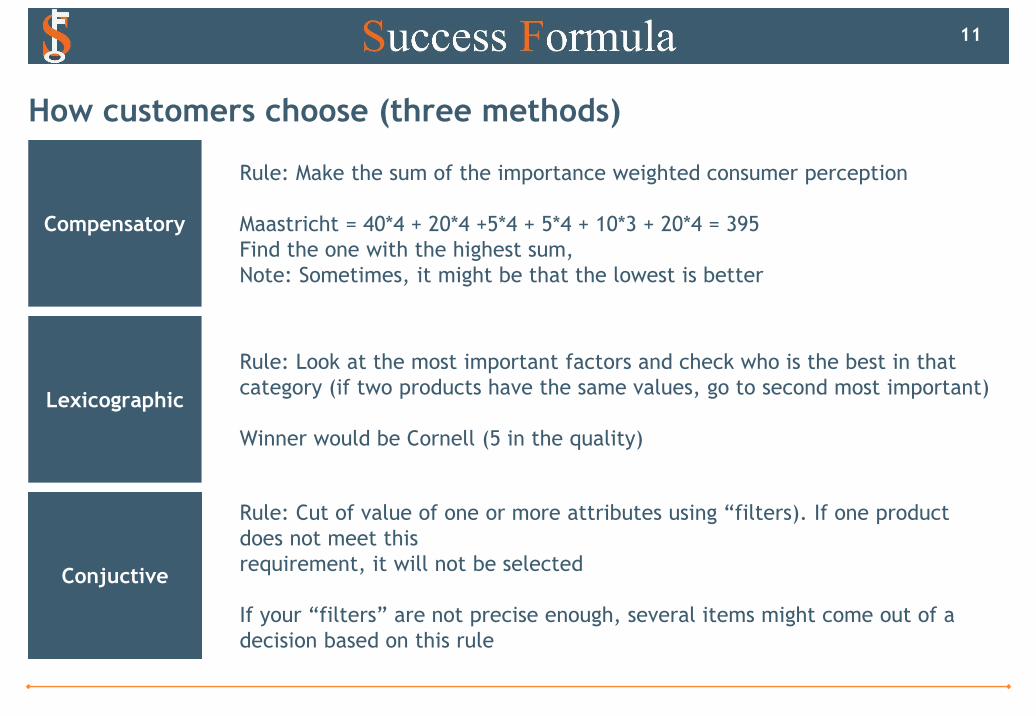
Compensatory
Rule: Make the sum of the importance weighted consumer perception
Maastricht = 40*4 + 20*4 +5*4 + 5*4 + 10*3 + 20*4 = 395
Find the one with the highest sum,
Note: Sometimes, it might be that the lowest is better
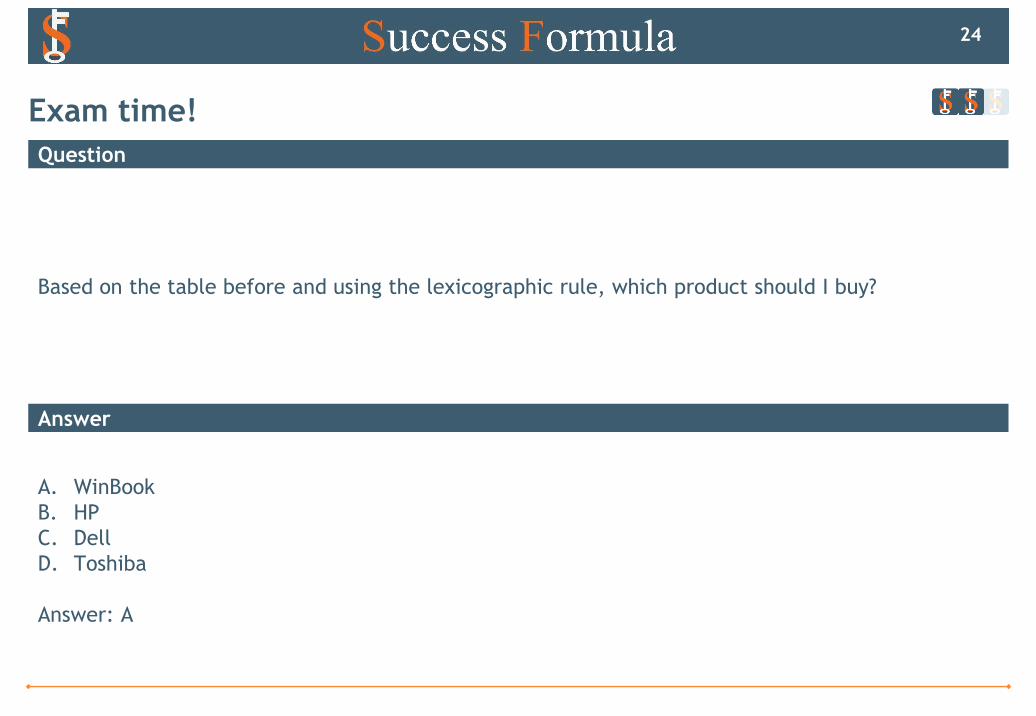
Lexicographic
Conjuctive
Rule: Look at the most important factors and check who is the best in that
category (if two products have the same values, go to second most important)
Winner would be Cornell (5 in the quality)
Rule: Cut of value of one or more attributes using “filters). If one product
does not meet this
requirement, it will not be selected
If your “filters” are not precise enough, several items might come out of a
decision based on this rule
How customers choose (three methods)
11
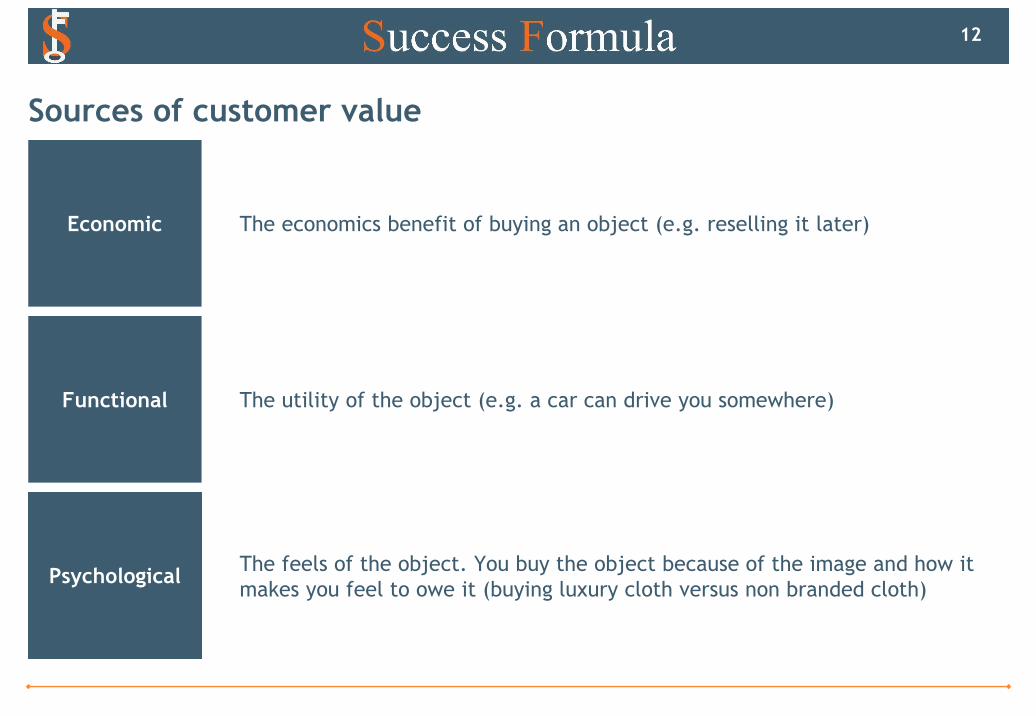
Economic The economics benefit of buying an object (e.g. reselling it later)
Functional
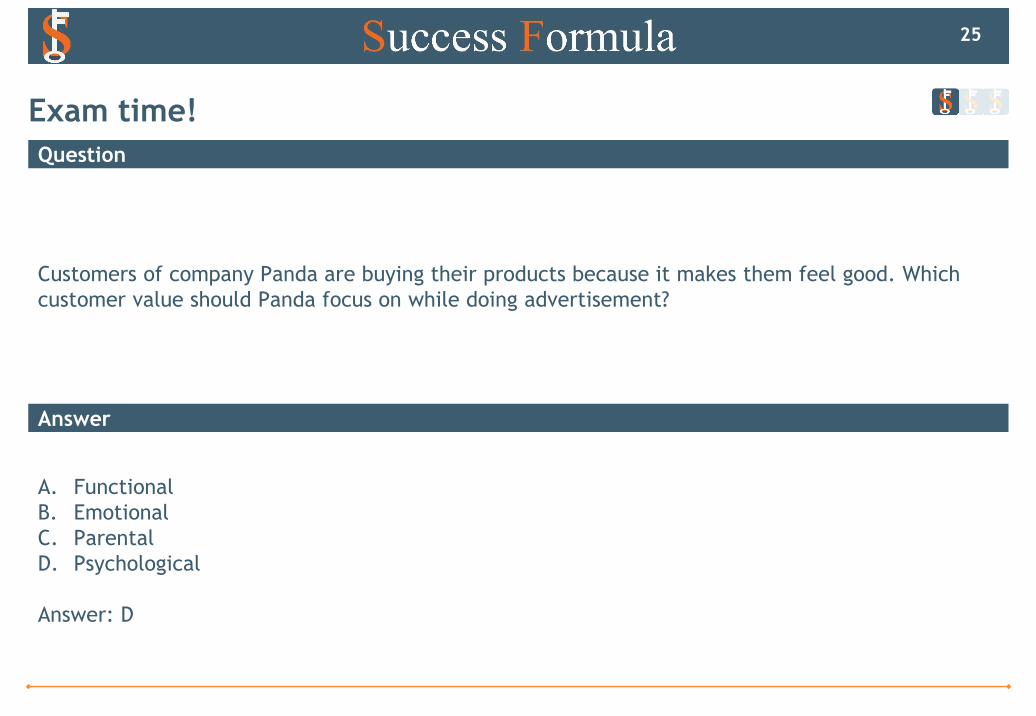
Psychological
The utility of the object (e.g. a car can drive you somewhere)
The feels of the object. You buy the object because of the image and how it
makes you feel to owe it (buying luxury cloth versus non branded cloth)
Sources of customer value
12
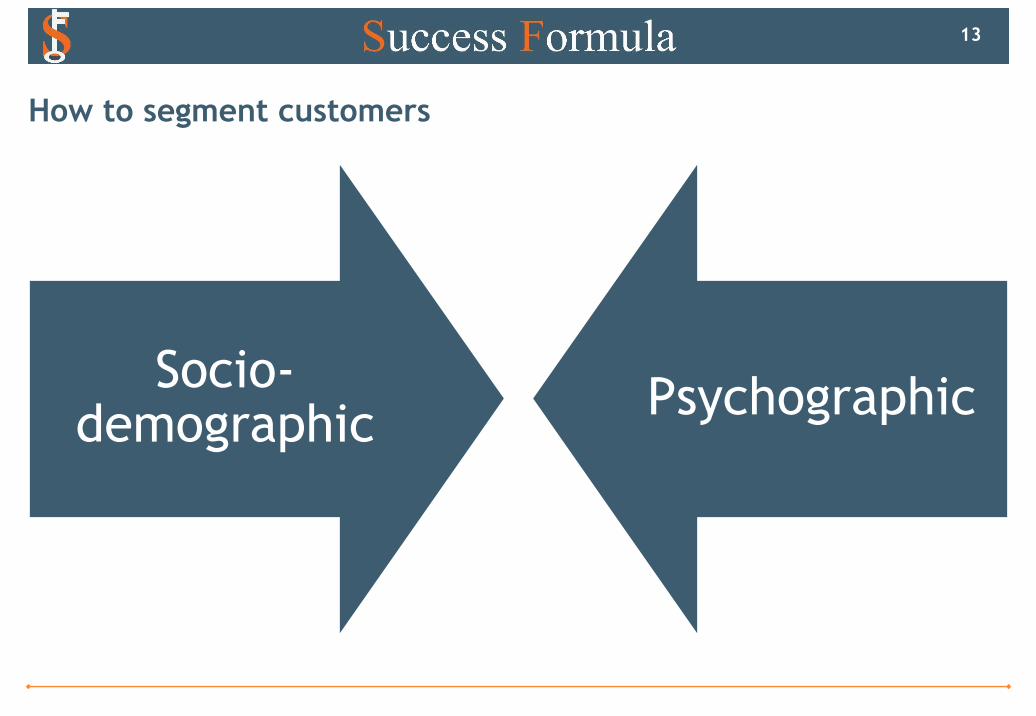
Socio-demographic
Psychographic
How to segment customers
13
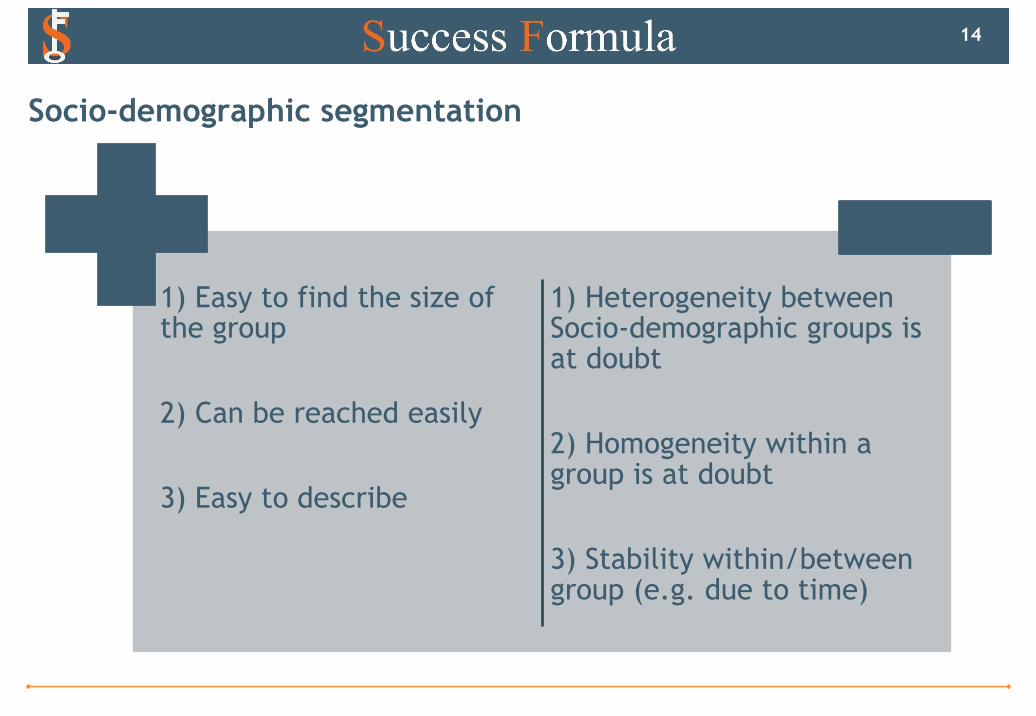
1) Easy to find the size of the group
2) Can be reached easily
3) Easy to describe
1) Heterogeneity between Socio-demographic groups is at doubt
2) Homogeneity within a group is at doubt
3) Stability within/between group (e.g. due to time)
Socio-demographic segmentation
14
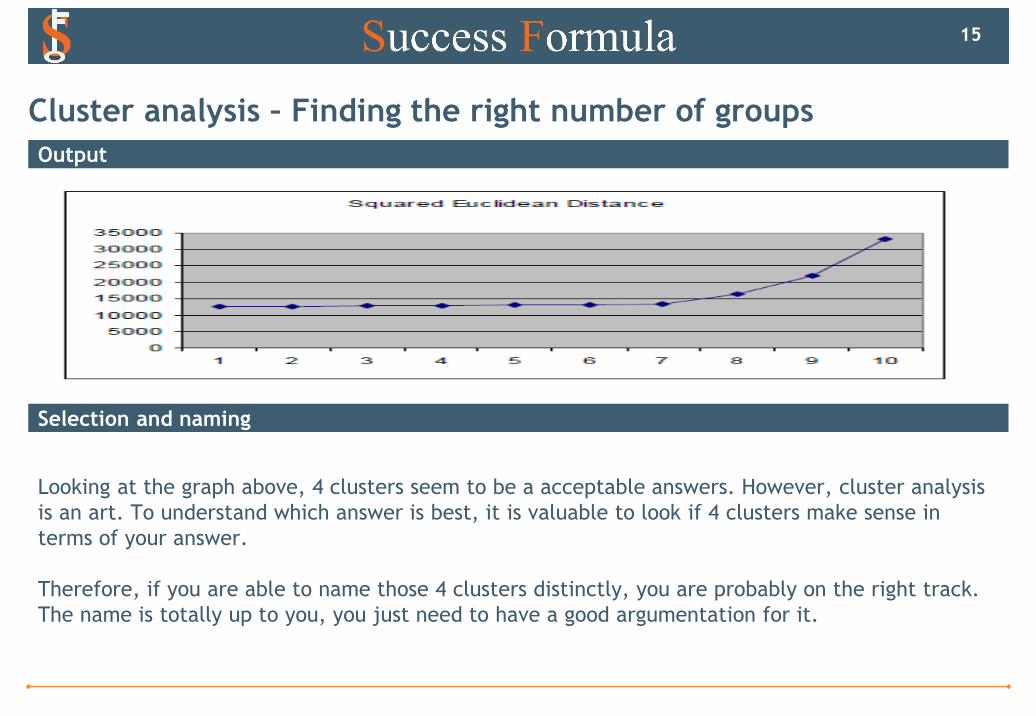
Output
Selection and naming
Looking at the graph above, 4 clusters seem to be a acceptable answers. However, cluster analysis
is an art. To understand which answer is best, it is valuable to look if 4 clusters make sense in
terms of your answer.
Therefore, if you are able to name those 4 clusters distinctly, you are probably on the right track.
The name is totally up to you, you just need to have a good argumentation for it.
Cluster analysis – Finding the right number of groups
15
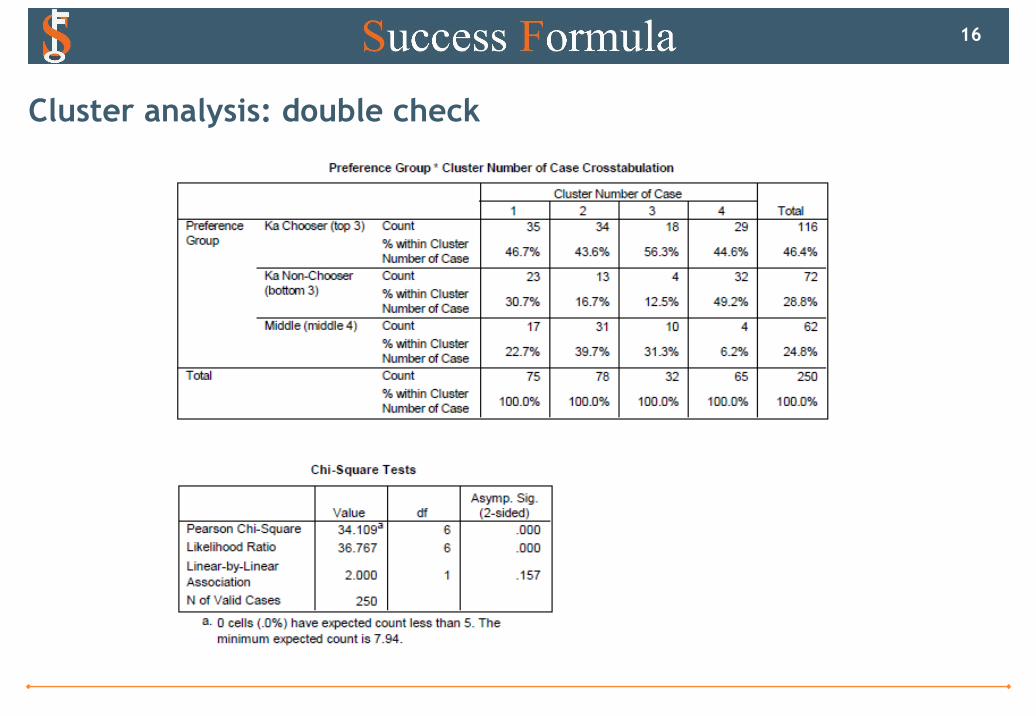
Cluster analysis: double check
16
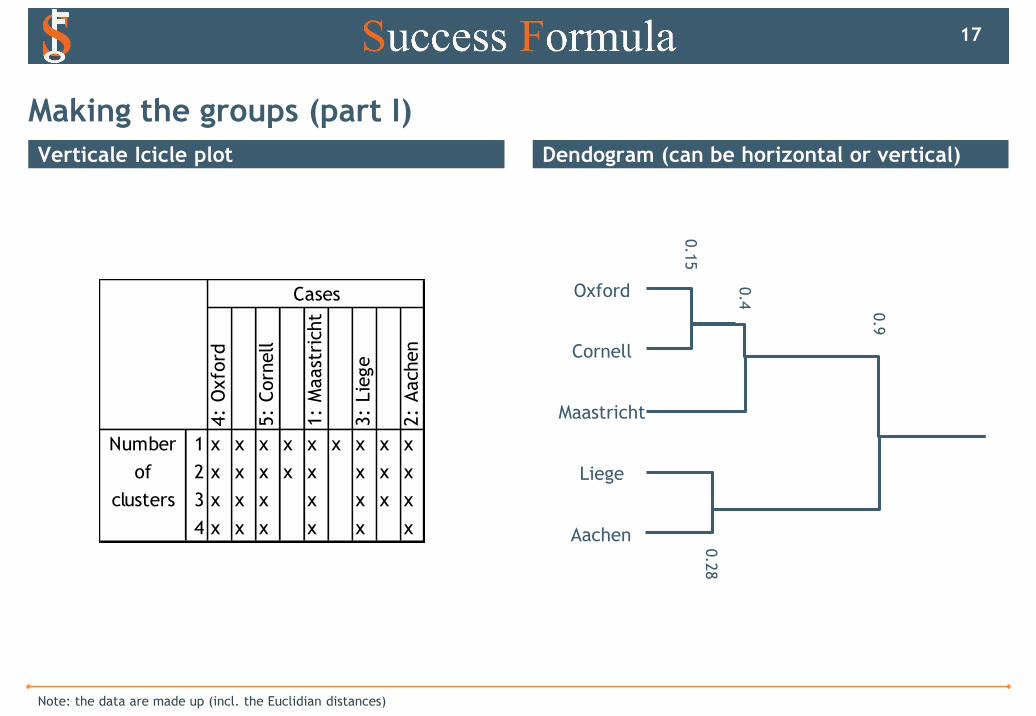
Verticale Icicle plot Dendogram (can be horizontal or vertical)
Making the groups (part I)
Note: the data are made up (incl. the Euclidian distances)
17
Oxford
Cornell
Maastricht
Liege
Aachen
4:
Oxfo
rd
5:
Corn
ell
1:
Maast
rich
t
3:
Lie
ge
2:
Aach
en
1 x x x x x x x x x
2 x x x x x x x x
3 x x x x x x x
4 x x x x x x
Number
of
clusters
Cases
0.1
5
0.4
0.2
8
0.9
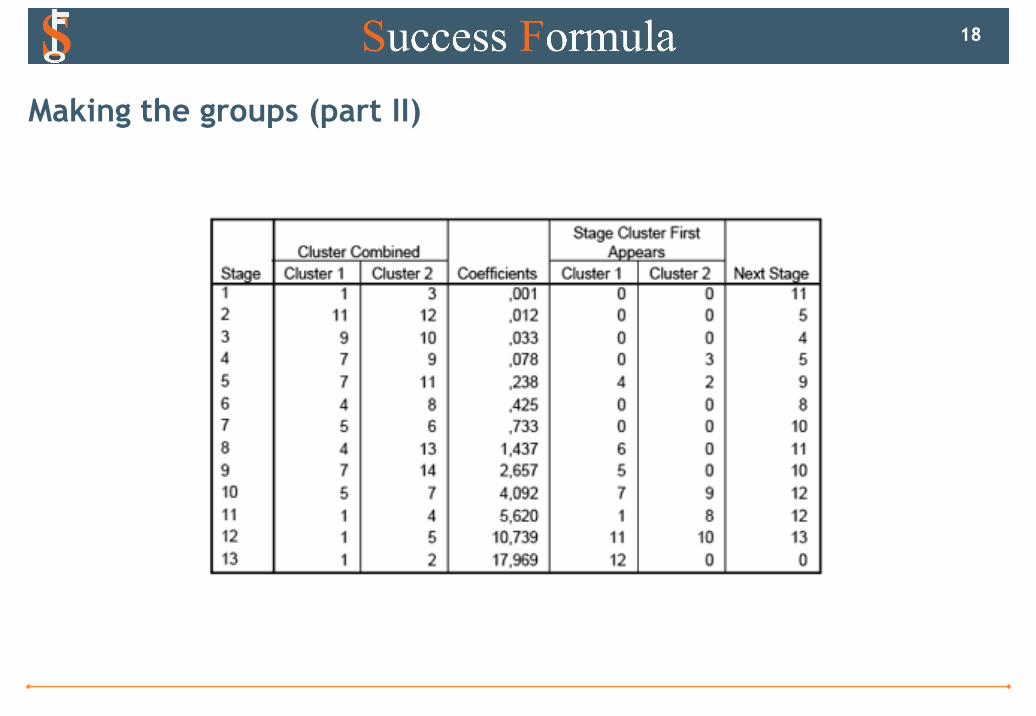
Making the groups (part II)
18
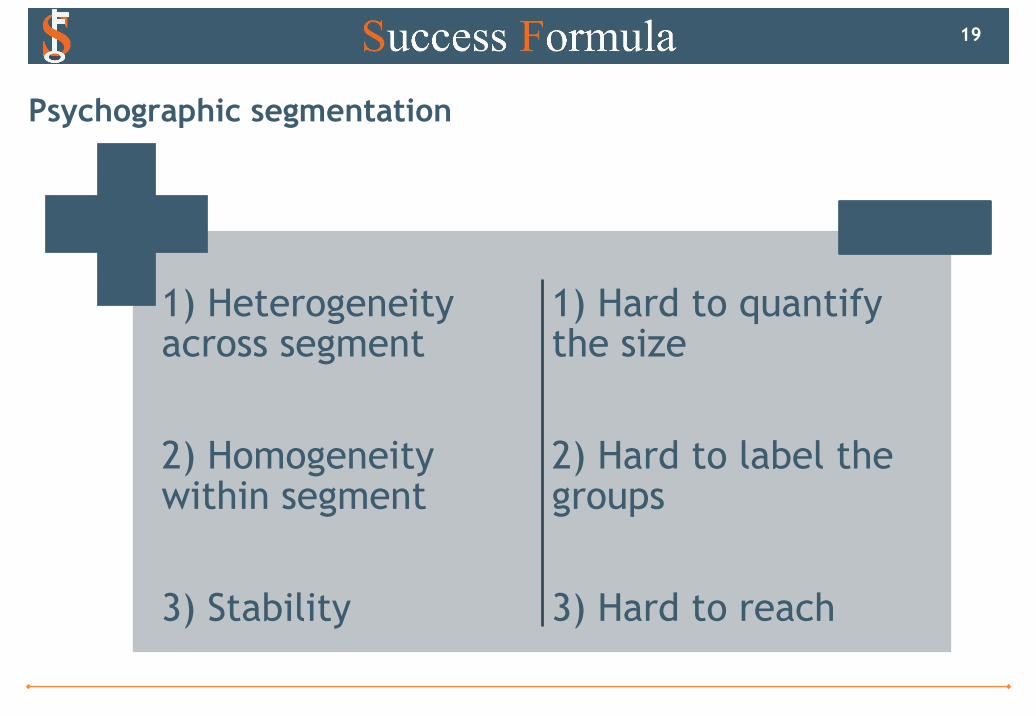
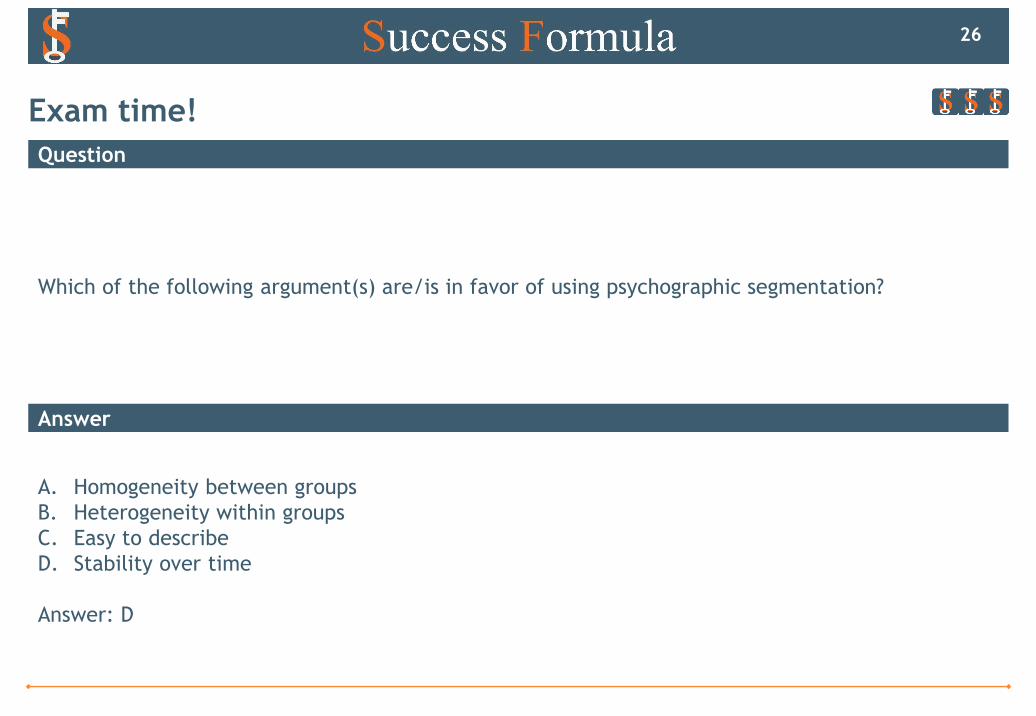
1) Heterogeneity across segment
2) Homogeneity within segment
3) Stability
1) Hard to quantify the size
2) Hard to label the groups
3) Hard to reach
Psychographic segmentation
19

MOPD
Extra questions
20
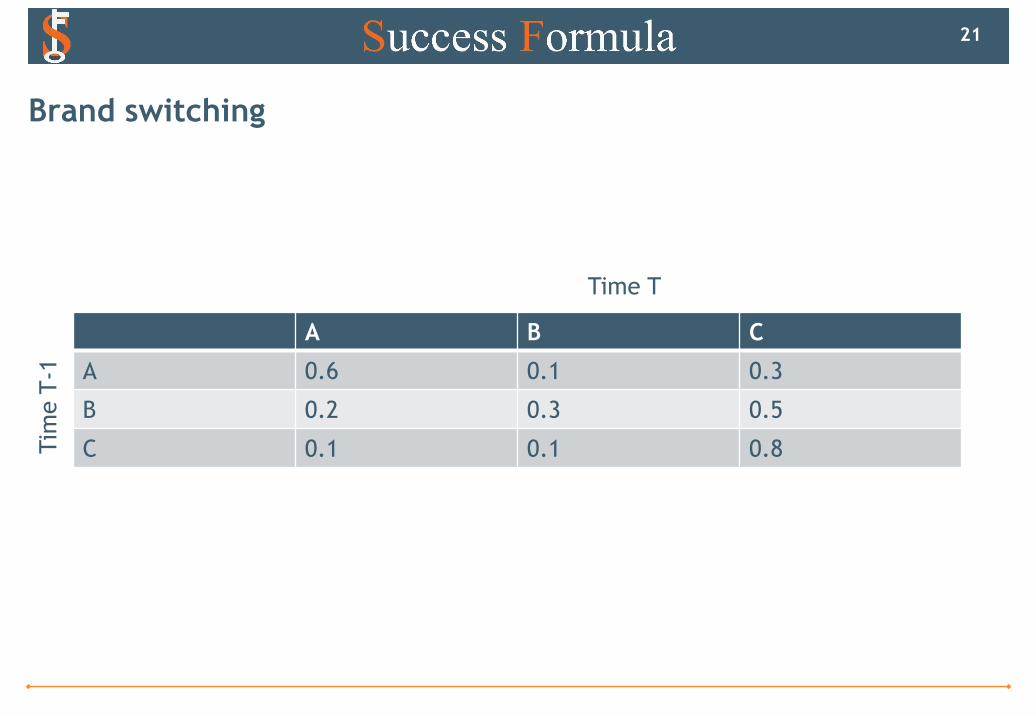
A B C
A 0.6 0.1 0.3
B 0.2 0.3 0.5
C 0.1 0.1 0.8
Brand switching
21
Time T
Tim
e T
-1
Question
Answer
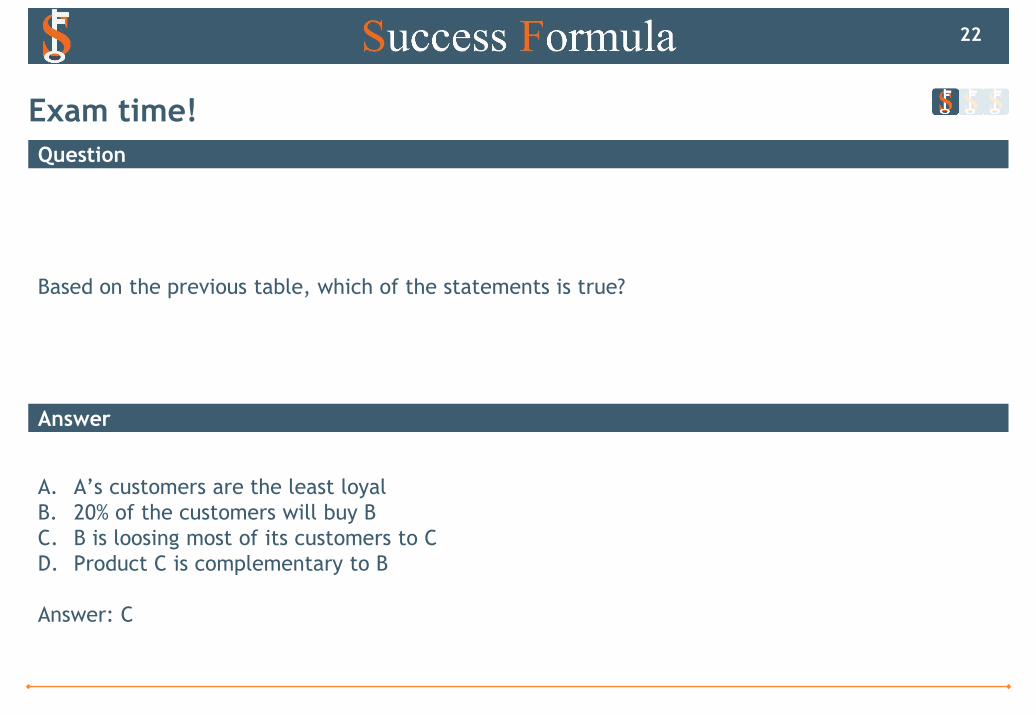
Based on the previous table, which of the statements is true?
A. A’s customers are the least loyal
B. 20% of the customers will buy B
C. B is loosing most of its customers to C
D. Product C is complementary to B
Answer: C
Exam time!
22
Decision criterion
23
Question
Answer
Based on the table before and using the lexicographic rule, which product should I buy?
A. WinBook
B. HP
C. Dell
D. Toshiba
Answer: A
Exam time!
24
Question
Answer
Customers of company Panda are buying their products because it makes them feel good. Which
customer value should Panda focus on while doing advertisement?
A. Functional
B. Emotional
C. Parental
D. Psychological
Answer: D
Exam time!
25
Question
Answer
Which of the following argument(s) are/is in favor of using psychographic segmentation?
A. Homogeneity between groups
B. Heterogeneity within groups
C. Easy to describe
D. Stability over time
Answer: D
Exam time!
26
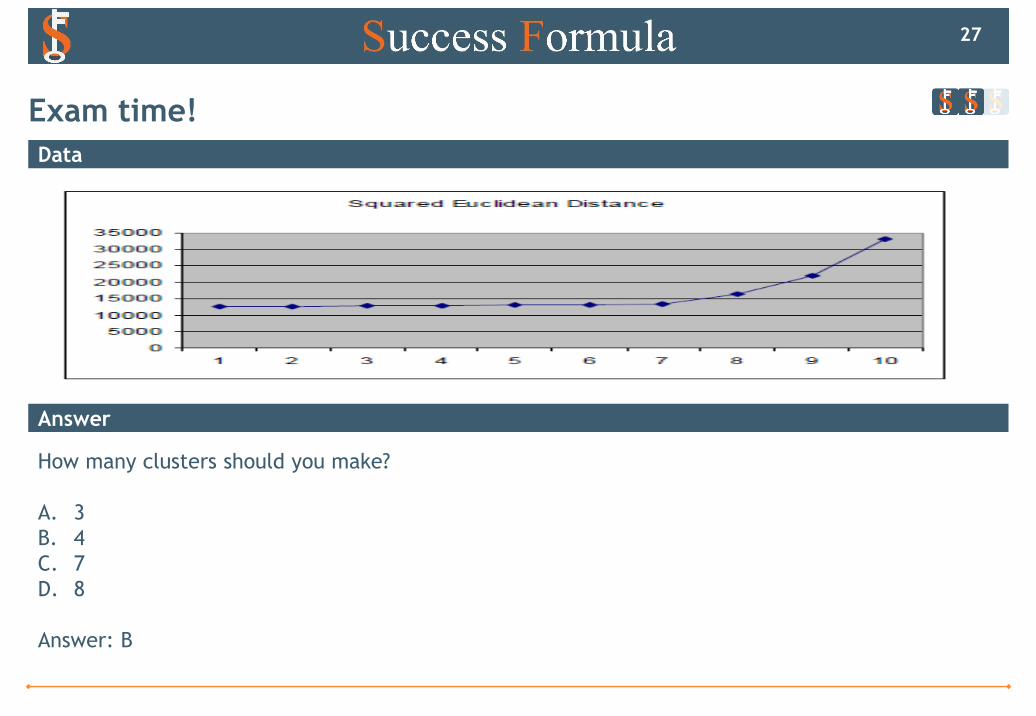
Data
Answer
Which of the following statements is true?
How many clusters should you make?
A. 3
B. 4
C. 7
D. 8
Answer: B
Exam time!
27
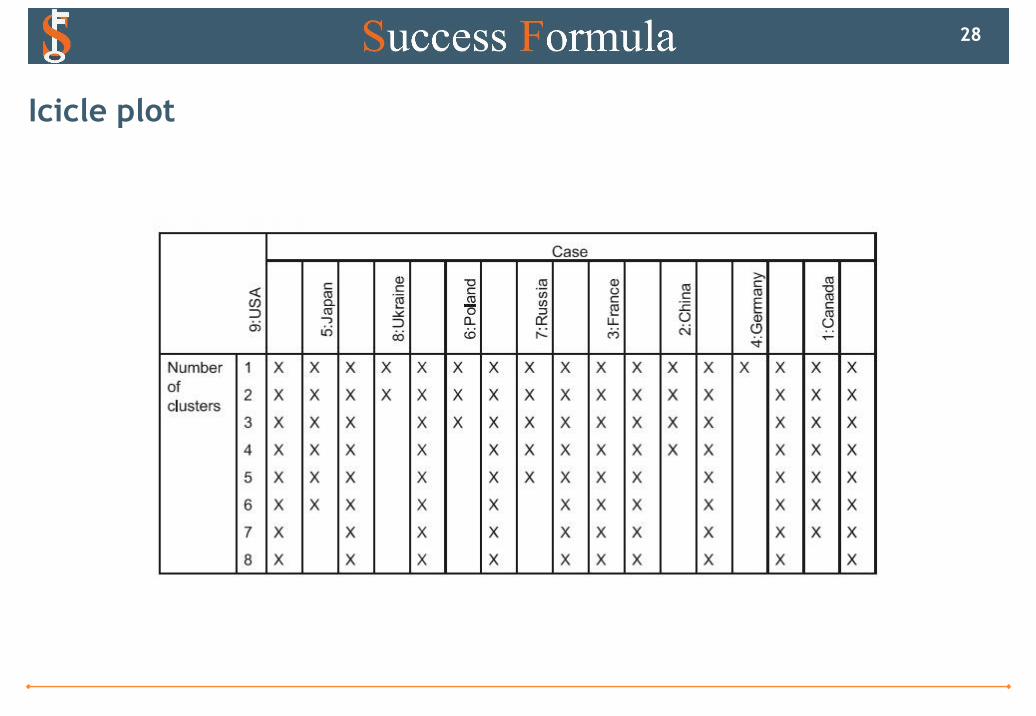
Icicle plot
28
Question
Answer
Based on the previous output, what does China cluster with for its first cluster?
A. Germany
B. France
C. France and Russia
D. France, Russia, and Poland
Answer: D
Exam time!
29
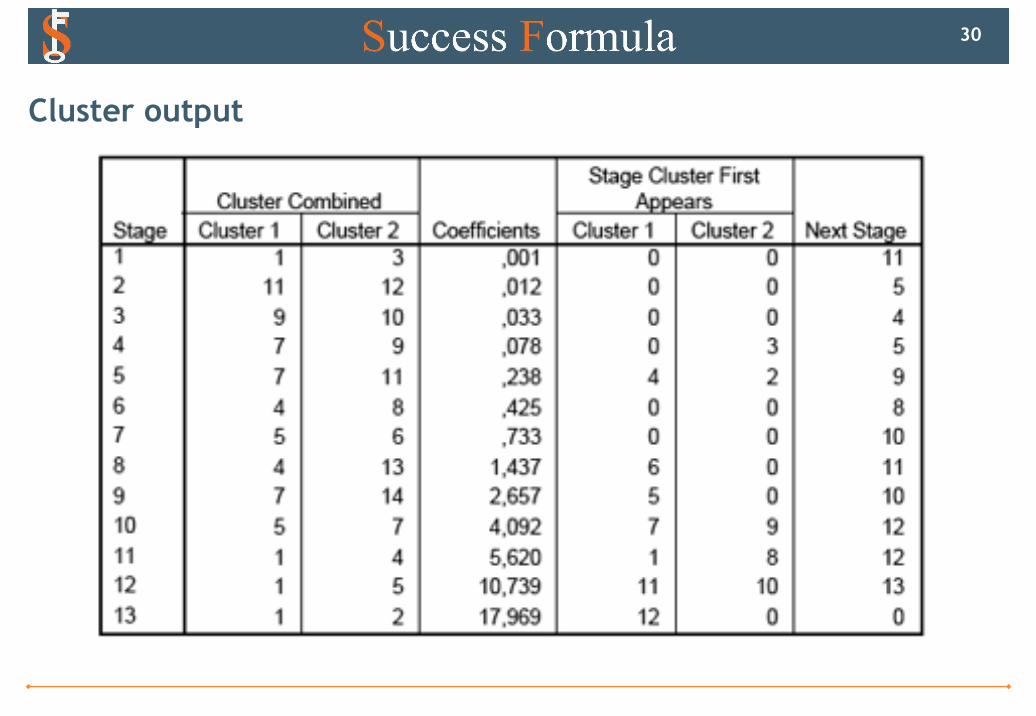
Cluster output
30
Question
Answer
Regarding the previous output, which statements is false?
A. The last remaining cluster is only composed of the initial clusters 1 and 2
B. The output is an agglomeration schedule
C. The coefficients are a measure of within group heterogeneity
D. We should stop at stage 7
Answer: A
Exam time!
31

We wish you Success!
32