Embed Size (px)
Citation preview
More Developed Countries, Less Developed Countries, and Human Development Index
MDC,LDC, & HDI
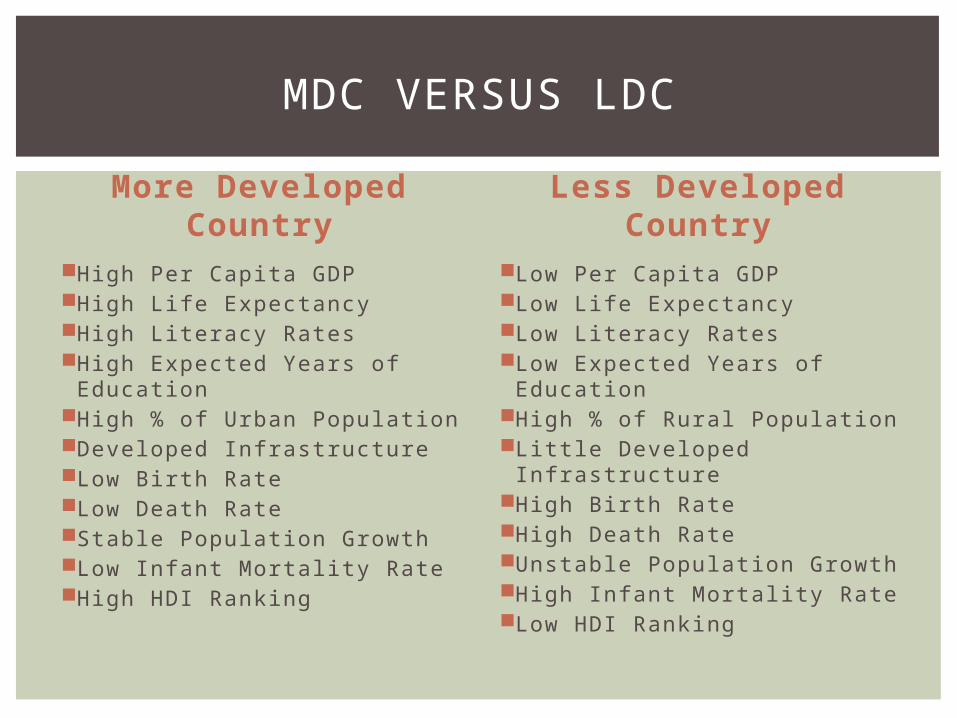
More Developed Country
High Per Capita GDPHigh Life ExpectancyHigh Literacy RatesHigh Expected Years of
EducationHigh % of Urban PopulationDeveloped InfrastructureLow Birth Rate Low Death RateStable Population GrowthLow Infant Mortality RateHigh HDI Ranking
Less Developed Country
Low Per Capita GDP Low Life Expectancy Low Literacy Rates Low Expected Years of
Education High % of Rural Population Little Developed
Infrastructure High Birth Rate High Death Rate Unstable Population Growth High Infant Mortality Rate Low HDI Ranking
MDC VERSUS LDC

IF YOU SLEEP IN A BED, PUT YOUR FOOD IN A REFRIGERATOR, CLOTHES IN A CLOSET, DRIVE OR WALK TO SCHOOL ON A PAVED ROAD, GET
TO SEE A DOCTOR OR A DENTIST, YOU LIVE IN A MDC (CORE)

IF YOU SLEEP ON THE FLOOR, WONDER WHERE YOUR NEXT MEAL IS COMING FROM, HAVE ON YOUR ONLY
SET OF CLOTHING, WALK 6 MILES TO THE ONLY SCHOOL IN YOUR CITY, AND HAVE NEVER SEEN A
DOCTOR OR EVEN HEARD OF A DENTIST, YOU LIVE IN A LDC (PERIPHERY.)

MDC (CORE)

LDC (PERIPHERY)
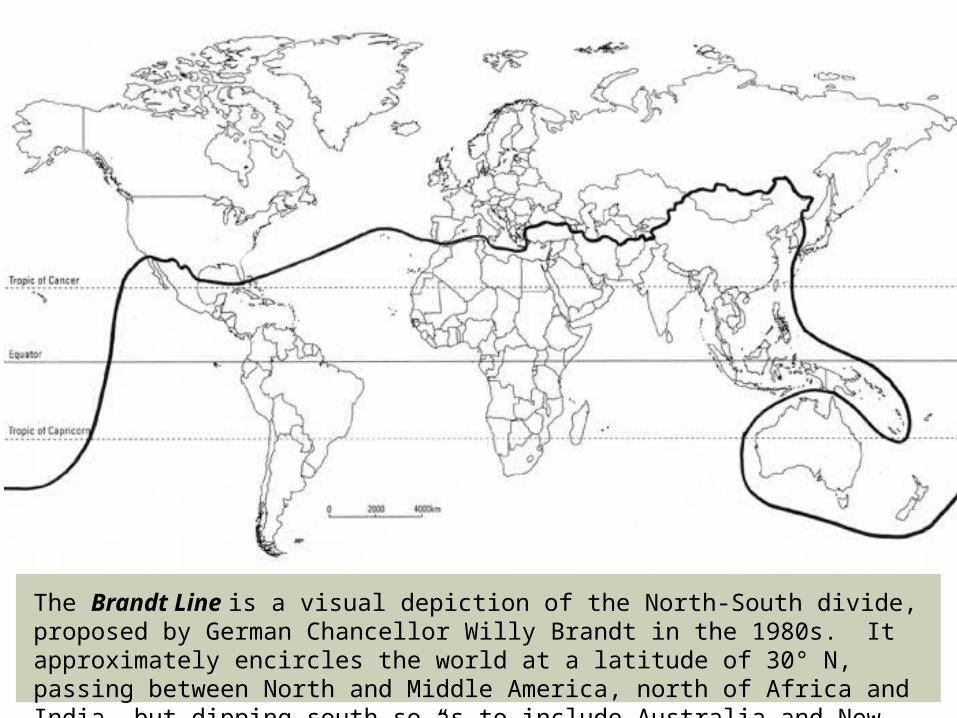
The Brandt Line is a visual depiction of the North-South divide, proposed by German Chancellor Willy Brandt in the 1980s. It approximately encircles the world at a latitude of 30° N, passing between North and Middle America, north of Africa and India, but dipping south so as to include Australia and New Zealand in the “Rich North.”

The map above showing the north-south divide as been updated recently to include countries like South Africa, Singapore and Taiwan. It was based upon the Brandt line and shows the more economically developed countries in blue and the less economically developed countries in red.Positives of Map:Simplifies data so that it's easy to understand.GDP is used which is an easy to access data source.Negatives of Map:Doesn't include some countries which are more economically developed.Generalized patterns with some countries above the Brandt line less developed less than some below.

G – Gross = TotalD – Domestic = Inside a country’s
bordersP – Product = Value of goods and
servicesGDP – Gross Domestic Product equals
the total value of all goods and services produced inside a country’s borders. Used as an economic indicator. The higher the GDP the wealthier the country.
GDP
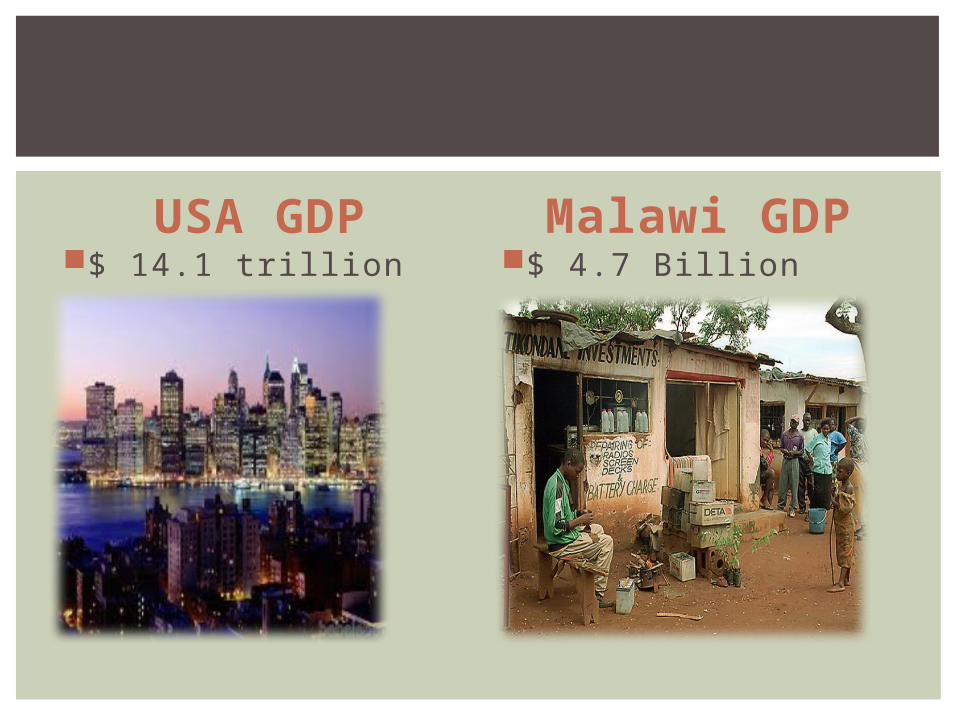
USA GDP$ 14.1 trillion
Malawi GDP$ 4.7 Billion
Per Capita GDP is the GDP of a country divided by the total population. Gives a more accurate representation of the typical citizens way of life.
PER CAPITA GDP

Per Capita GDP of USA$ 46, 860
Per Capita GDP of Malawi
$ 821

Life Expectancy – The number of years a person is expected to live in a given country. The higher the life expectancy the more developed the country.
Life Expectancy in the USA is 78 years.Life Expectancy in Uganda is 53 years.
LIFE EXPECTANCY
Literacy Rate – The % of adults that can read and write. High Literacy Rates are found in more developed countries. Literacy Rate in the USA 99 %. Literacy Rate in Mali 23.2 %.
Expected years of Education – Average number of years the typical citizen will spend in school. Higher number of years will be found in your MDCs. Expected years in Australia 20.7 years Expected years in Turkey 10.1 years
LITERACY RATE AND EXPECTED YEARS OF EDUCATION
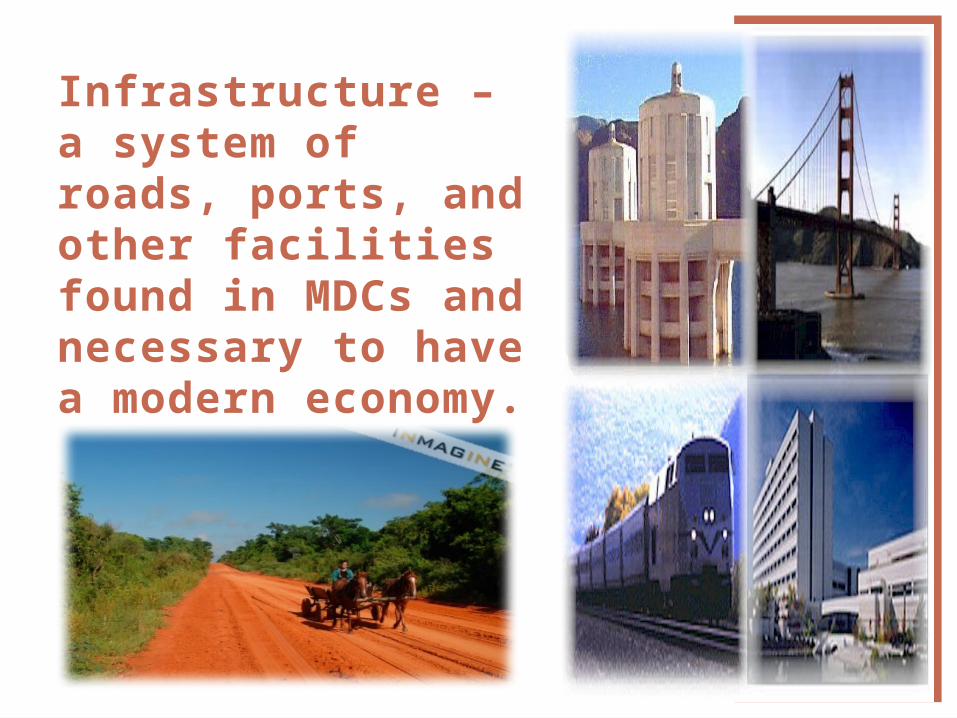
Infrastructure – a system of roads, ports, and other facilities found in MDCs and necessary to have a modern economy.
INFRASTRUCTURE
Birth Rate – number of births a year for every thousand people in
a country .
Birth Rate is the dominant factor in determining the rate of population growth.
High Birth Rates are found in LDCs. USA Birth Rate 13.83 Afghanistan Birth Rate
38.37
Death Rate – number of deaths a year for every thousand people in
a country.
Death Rate is a rough indicator of the mortality situation in a country, it accurately indicates the current mortality impact on population growth.
High Death Rates are found in LDCs. Angola Death Rate 23.4 Canada Death Rate 7.98
BIRTH RATE & DEATH RATE
Infant Mortality Rate (IMR) - the number of deaths of infants under one year old in a given year per 1,000 live births in the same year. Higher IMRs are found in LDCs.IMR in Afghanistan 149.2IMR in Japan 2.78
INFANT MORTALITY RATE

WHAT DO THESE THINGS HAVE IN
COMMON??
HDI – Human Development Index is a RANKING of the level of development of countries.
THEY ARE ALL RANKINGS!

The HDI uses all of the statistics we have talked about to rank countries level of development.
Key statistics used to determine HDI Per Capita GDP Expected Years of Education Life Expectancy

HIGHEST HDI RANKINGS

LOWEST HDI RANKING

High Life Expectancy Low Literacy RateLow IMR Low Birth RateHigh Urban Population Unstable Population GrowthHigh Death Rate Low HDI RankHigh GDPLow Death Rate High Birth RateHigh HDI Rank No InfrastructureHigh Rural Population Stable Population GrowthLow GDP Low Per Capita GDPDeveloped InfrastructureHigh Literacy Rate Subsistence Based EconomyLow Years of EducationLow Life Expectancy High Per Capita GDPFree Market Economy High IMR
MDC VS. LDCPUT THE FOLLOWING STATISTICS IN THE
CORRECT CATEGORY