Embed Size (px)
Citation preview
Registered Number: 34161590Registered Office:Locatellikade 1Parnassustoren1076 AZAmsterdamThe Netherlands
MORGAN STANLEY B.V.
Interim financial report
30 June 2010
For identification purpose only.
MORGAN STANLEY B.V.
CONTENTS
Page
Interim management report 1
Responsibility statement 4
Condensed statement of comprehensive income 5
Condensed statement of changes in equity 6
Condensed statement of financial position 7
Condensed statement of cash flows 8
Notes to the condensed financial statements 9
Independent review report to the members of Morgan Stanley B.V 24
For identification purpose only,Goes tog 1hwjreviewdated IJ
MORGAN STANLEY B.V.
INTERIM MANAGEMENT REPORT
The Directors present their interim management report, responsibility statement and the condensed financialstatements of Morgan Stanley B.V. (the “Company”) for the six months ended 30 June 2010.
As disclosed in the Company’s annual financial statements, the Company has changed its annual accountingreference date from 30 November to 31 December to align with the changed year end of its ultimate parentundertaking, Morgan Stanley. Accordingly, these condensed fmancial statements are for the six months ended 30June 2010. With the exception of the comparatives for the condensed statement of financial position and relatednotes, which are as at 31 December 2009, the comparative figures reflected within the condensed financialstatements are for the six months ended 31 May 2009 which is considered comparable for the purposes ofInternational Accounting Standard 34 “Interim Financial Reporting” as adopted by the European Union (“EU”).
RESULTS AND DIViDENDS
The profit for the period, after tax, was €818,000 (2009: €1,011,000).
During the period no dividends were paid or proposed (2009: €nil).
PRINCIPAL ACTIVITY
The Company’s ultimate parent undertaking and controlling entity is Morgan Stanley, which, together with theCompany and Morgan Stanley’s other subsidiary undertakings, form the “Morgan Stanley Group”.
The principal activity of the Company is the issuance of financial instruments and the hedging of the obligationsarising pursuant to such issuances.
Future outlook
There have not been any significant changes in the Company’s principal activity in the period under review and nosignificant change in the Company’s principal activity is expected.
BUSINESS REVIEW
The modest economic recovery initiated in 2009 continues to be evident in the wider economy, although theCompany continues to be impacted by challenging market conditions. These conditions present difficulties anduncertainty for the business outlook which may adversely impact the financial performance of the Company in thefuture. The condensed statement of comprehensive income for the period is set out on page 5. The profit for thecurrent period decreased by €193,000, 19% from the prior period. This was primarily driven by a reduction ininterest income, which was partially offset by an increase in fees received due to an increased level of issuances.
The condensed statement of financial position is presented on page 7. Due to increased issuances during the periodtotal assets at the end of the period were €4,459,917,000 an increase of 54% from 31 December 2009.
Risk Management
Risk is an inherent part of the Company’s business activity and is managed within the context of the broaderMorgan Stanley Group’s business activities. The Morgan Stanley Group seeks to identify, assess, monitor andmanage each of the various types of risk involved in its activities on a global basis, in accordance with definedpolicies and procedures and in consideration of the individual legal entities.
For identification purpose only.
MORGAN STANLEY B.V.
INTERIM MANAGEMENT REPORT
BUSINESS REVIEW (CONTINUED)
Risk Management (continued)
Market risk
Market risk refers to the risk that a change in the level of one or more market prices, rates, indices, impliedvolatilities (the price volatility of the underlying instruments imputed from option prices), correlations or othermarket factors, such as liquidity, will result in losses for a position or portfolio.
The Morgan Stanley Group manages the market risk associated with its trading activities in consideration of eachindividual legal entity, but on a global basis, at both a trading division and an individual product level.
Credit Risk
Credit risk refers to the risk of loss arising from borrower or counterparty default when a borrower, counterparty orobligor does not meet its financial obligations.
The Morgan Stanley Group manages credit risk exposure in consideration of each individual legal entity, but on aglobal basis, by ensuring transparency of material credit risks, ensuring compliance with established limits,approving material extensions of credit, escalating risk concentrations to appropriate senior management andmitigating credit risk through the use of collateral and other arrangements.
Liquidity andfunding risk
Liquidity and funding risk refers to the risk that the Company will be unable to meet its funding obligations in atimely manner. Liquidity risk stems from the potential risk that the Company will be unable to obtain necessaryfunding through borrowing money at favourable interest rates or maturity terms, or selling assets in a timely mannerand at a reasonable price.
The Morgan Stanley Group’s senior management establishes the overall liquidity and capital policies of the MorganStanley Group. The Morgan Stanley Group’s liquidity and funding risk management policies are designed tomitigate the potential risk that the Morgan Stanley Group and the Company may be unable to access adequatefinancing to service its financial obligations without material franchise or business impact. The key objectives of theliquidity and funding risk management framework are to support the successful execution of the Morgan StanleyGroup’s and the Company’s business strategies while ensuring sufficient liquidity through the business cycle andduring periods of stressed market conditions. The Morgan Stanley Group has established regional committees tooversee the activities of its subsidiaries from a regional perspective.
This liquidity and funding risk management framework continues to provide sufficient liquidity to the MorganStanley Group and to the Company, and the Company’s capital and liquidity position is satisfactory.
Going Concern
Taking all of the above factors into consideration, the Directors have no reason to believe that the Company will nothave access to adequate resources to continue in operational existence for the foreseeable future. Accordingly, theycontinue to adopt the going concern basis in preparing the interim management report and condensed financialstatements.
DIRECTORS
The following changes have occurred to the composition of the Board of Directors since 31 December 2009:
J.Y. Bahurel (resigned 2 July 2010)P.W. Banks (appointed 7 July 2010)R.H.L. de Groot (appointed 1 July 2010)H.K.A. Lee (appointed 7 July 2010)P.J.G. de Reus (appointed 1 July 2010)
For identification purpose on’y.Goes together with revi reportdated 44.A1JG!OIO
MORGAN STANLEY B.V.
INTERIM MANAGEMENT REPORT
EVENTS AFTER THE REPORTING PERIOD
There have been no significant events since the reporting date.
AUDIT COMMITTEE
The Company qualifies as an organisation of public interest pursuant Dutch and EU law. The Morgan Stanley Grouphas an audit committee that complies with international corporate governance rules. The Company has thereforetaken the exemption for groups and has not installed an audit committee.
Approved by the Board and signed on its behalf on
Directors
A.J.S. Crawford P.W. Banks R.H.L. de Groot H. Hernnann H.K.A. Lee
P.J.G. de Reus J.A. Solan TMF Management B.V.
For identification purpose only.Goes together with reviereportdated ..31.AUG.2U1
MORGAN STANLEY B.V.
RESPONSIBILITY STATEMENT
The Directors, the names of whom are set out below, confirm that to the best of their knowledge:
(a) the condensed set of financial statements have been prepared in accordance with International AccountingStandard 34 “Interim Financial Reporting” as adopted by the European Union (“EU”) and Title 9 of Book 2 ofthe Netherlands Civil Code on the basis of the Company’s international connections and gives a true and fairview of the assets, liabilities, financial position and result of the Company; and
(b) the interim management report includes a fair review of the important events that have occurred during theperiod and the impact on the condensed financial statements and provides a description of the principal risks anduncertainties that the Company faces for the remaining six months of the financial year.
Approved by the Board and signed on its behalf on
Directors
A.J.S. Crawford P.W. Banks R.H.L. de Groot H. Herrmann H.K.A. Lee
P.J.G. de Reus l.A. Solan TMF Management B.V.
For identification purpose only.Goes together with revi reportdated “31AIJG”2&1&
MORGAN STANLEY B.V.
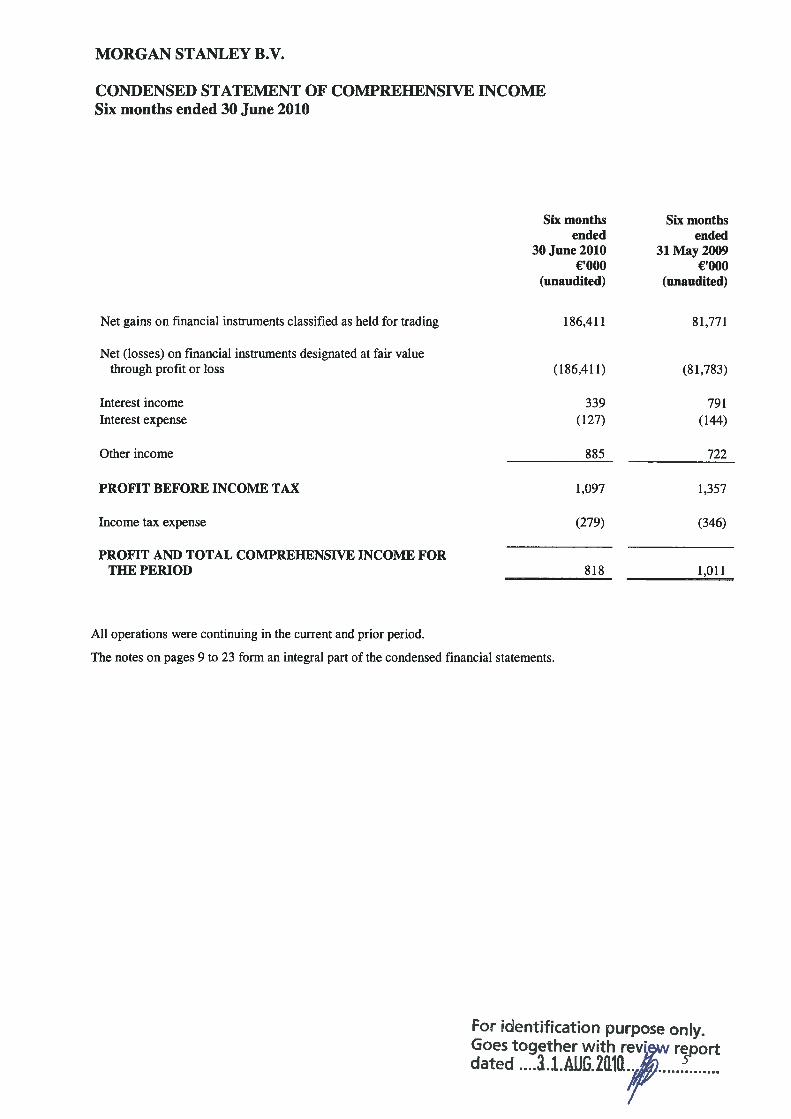
CONDENSED STATEMENT OF COMPREHENSIVE INCOMESix months ended 30 June 2010
Six months Six monthsended ended
30 June 2010 31 May 2009€000 €‘OOO
(unaudited) (unaudited)
Net gains on financial instruments classified as held for trading 186,411 81,771
Net (losses) on financial instruments designated at fair valuethrough profit or loss (186,411) (81,783)
Interest income 339 791Interest expense (127) (144)
Other income 885 722
PROFIT BEFORE INCOME TAX 1,097 1,357
Income tax expense (279) (346)
PROFIT AND TOTAL COMPREHENSIVE INCOME FORTHE PERIOD 818 1,011
All operations were continuing in the current and prior period.
The notes on pages 9 to 23 form an integral part of the condensed financial statements.
For identification purpose on’y.Goes together with review reportdated ..3.1.AJJ.2aIa..
MORGAN STANLEY B.V.
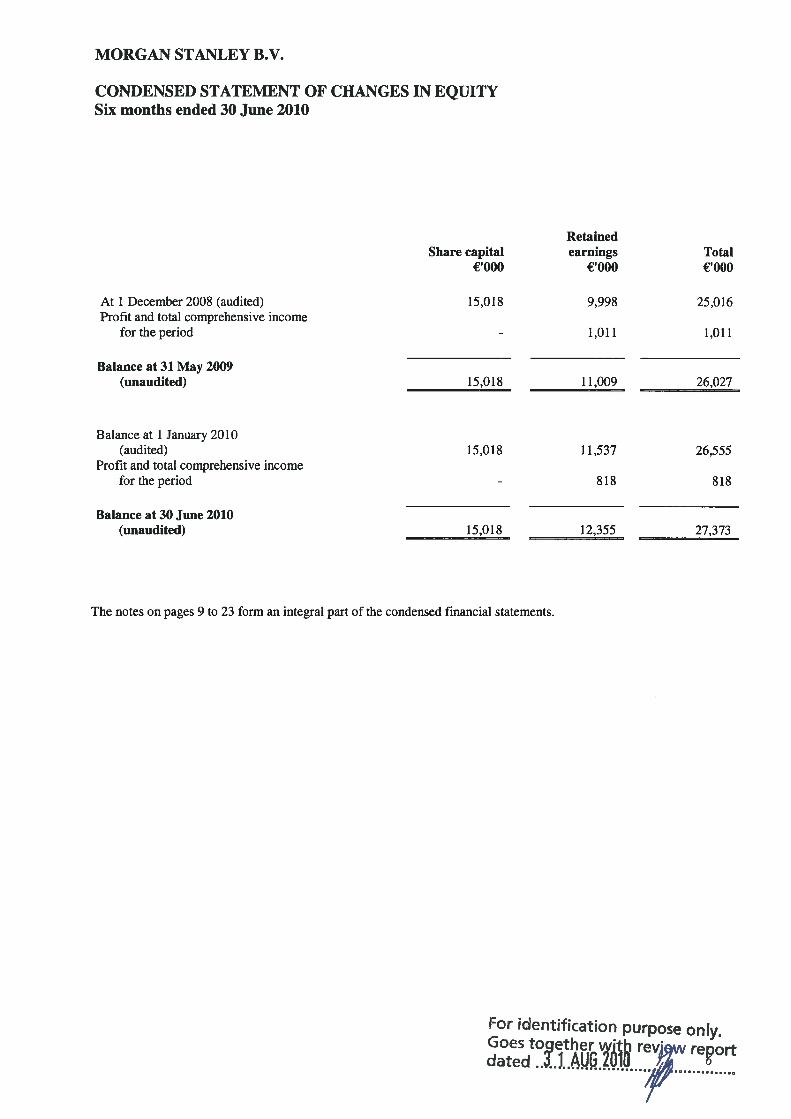
CONDENSED STATEMENT OF CHANGES IN EQUITYSix months ended 30 June 2010
RetainedShare capital earnings Total
€‘OOO €‘OOO €‘OOO
At 1 December 2008 (audited) 15,018 9,998 25,016Profit and total comprehensive income
for the period - 1,011 1,011
Balance at 31 May 2009(unaudited) 15,018 11,009 26,027
Balance at 1 January 2010(audited) 15,018 11,537 26,555
Profit and total comprehensive incomefor the period - 818 818
Balance at 30 June 2010(unaudited) 15,018 12,355 27,373
The notes on pages 9 to 23 form an integral part of the condensed financial statements.
For identification purpose only.

MORGAN STANLEY B.V.
CONDENSED STATEMENT OF FINANCIAL POSITIONAs at 30 June 2010
30 June 31 December2010 2009
€000 €‘OOONotes (unaudited) (audited)
ASSETSLoans and receivables:
Cash at bank 21 6,596Trade receivables 13,530 10,659Other receivables 27,497 33,960
41,048 51,215
Financial assets classified as held for trading 2 30,958Financial assets designated at fair value through profit or loss 3 4,418,676 2,818,679Current tax 193 -
TOTAL ASSETS 4,459,917 2,900,852
LIABILITIES AND EQUITYFinancial liabilities at amortised cost:
Bank overdraft 12 -
Trade payables 60,788 18,300Other payables 231 12,565
61,031 30,865
Financial liabilities classified as held for trading 2 132,158 -
Financial liabilities designated at fair value through profit or loss 3 4,239,355 2,843,278Current tax - 154TOTAL LIABILITIES 4,432,544 2,874,297
EQUITYShare capital 15,018 15,018Retained earnings 12,355 11,537TOTAL EQUITY 27,373 26,555
TOTAL LIABILITIES AND EQUITY 4,459,917 2,900,852
The notes on pages 9 to 23 form an integral part of the condensed financial statements.
For identification purpose only.
MORGAN STANLEY B.V.
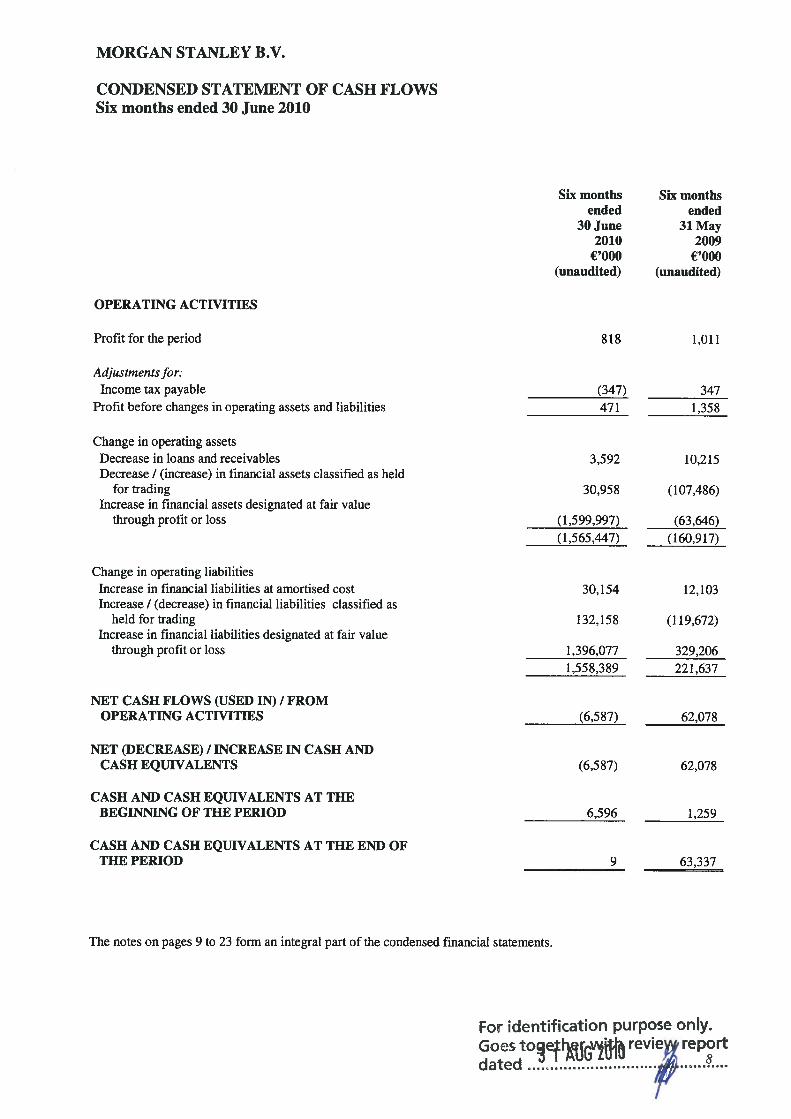
CONDENSED STATEMENT OF CASH FLOWSSix months ended 30 June 2010
Six monthsended
30 June2010
€‘OOO(unaudited)
Six monthsended
31 May2009
€‘OOO(unaudited)
OPERATING ACTIVITIES
Profit for the period 818 1,011
Adjustments for:Income tax payable
Profit before changes in operating assets and liabilities(347)471
3471,358
Change in operating assetsDecrease in loans and receivablesDecrease / (increase) in financial assets classified as held
for tradingIncrease in financial assets designated at fair value
through profit or loss
Change in operating liabilitiesIncrease in financial liabilities at amortised costIncrease / (decrease) in financial liabilities classified as
held for tradingIncrease in financial liabilities designated at fair value
through profit or loss
NET CASH FLOWS (USED IN) I FROMOPERATING ACTIVITIES (6,587) 62,078
NET (DECREASE) I INCREASE IN CASH AN])CASH EQUIVALENTS (6,587)
CASH A1D CASH EQUIVALENTS AT THEBEGINMNG OF THE PERIOD 6,596 1,259
CASH AND CASH EQUIVALENTS AT THE END OFTHE PERIOD
The notes on pages 9 to 23 form an integral part of the condensed financial statements.
9 63,337
For dentificatiofl purpose only.Goes to report
3,592 10,215
30,958 (107,486)
(1,599,997)(1,565,447)
(63,646)(160,917)
30,154 12,103
132,158 (119,672)
1,396,077 329,2061,558,389 221,637
62,078
MORGAN STANLEY B.V.
NOTES TO THE CONDENSED FINANCIAL STATEMENTSSix months ended 30 June 2010
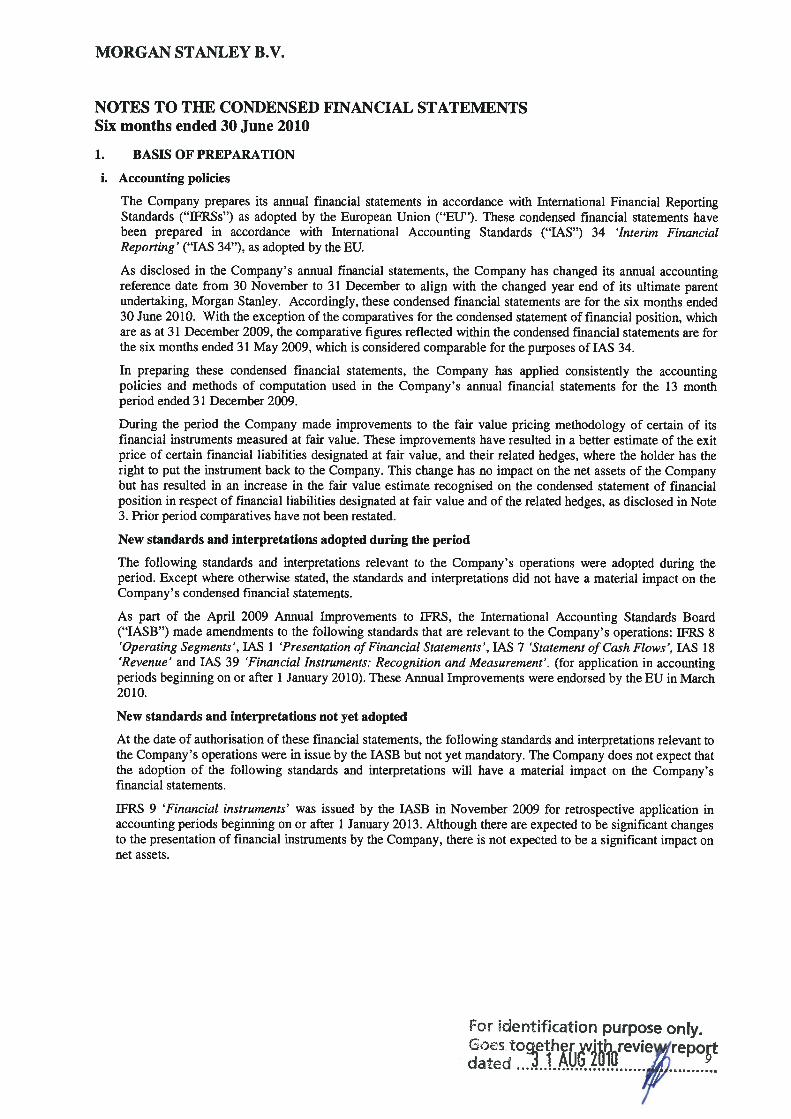
BASIS OF PREPARATION
i. Accounting policies
The Company prepares its annual financial statements in accordance with International Financial ReportingStandards (“IFRSs”) as adopted by the European Union (“EU”). These condensed financial statements havebeen prepared in accordance with International Accounting Standards (“lAS”) 34 ‘interim FinancialReporting’ (“lAS 34”), as adopted by the EU.
As disclosed in the Company’s annual financial statements, the Company has changed its annual accountingreference date from 30 November to 31 December to align with the changed year end of its ultimate parentundertaking, Morgan Stanley. Accordingly, these condensed financial statements are for the six months ended30 June 2010. With the exception of the comparatives for the condensed statement of financial position, whichare as at 31 December 2009, the comparative figures reflected within the condensed financial statements are forthe six months ended 31 May 2009, which is considered comparable for the purposes of lAS 34.
In preparing these condensed financial statements, the Company has applied consistently the accountingpolicies and methods of computation used in the Company’s annual financial statements for the 13 monthperiod ended 31 December 2009.
During the period the Company made improvements to the fair value pricing methodology of certain of itsfinancial instruments measured at fair value. These improvements have resulted in a better estimate of the exitprice of certain financial liabilities designated at fair value, and their related hedges, where the holder has theright to put the instrument back to the Company. This change has no impact on the net assets of the Companybut has resulted in an increase in the fair value estimate recognised on the condensed statement of financialposition in respect of financial liabilities designated at fair value and of the related hedges, as disclosed in Note3. Prior period comparatives have not been restated.
New standards and interpretations adopted during the period
The following standards and interpretations relevant to the Company’s operations were adopted during theperiod. Except where otherwise stated, the standards and interpretations did not have a material impact on theCompany’s condensed financial statements.
As part of the April 2009 Annual Improvements to IFRS, the International Accounting Standards Board(“IASB”) made amendments to the following standards that are relevant to the Company’s operations: IFRS 8‘Operating Segments’, lAS 1 ‘Presentation of Financial Statements’, lAS 7 ‘Statement of Cash Flows’, lAS 18‘Revenue’ and lAS 39 ‘Financial Instruments: Recognition and Measurement’. (for application in accountingperiods beginning on or after 1 January 2010). These Annual Improvements were endorsed by the EU in March2010.
New standards and interpretations not yet adopted
At the date of authorisation of these financial statements, the following standards and interpretations relevant tothe Company’s operations were in issue by the IASB but not yet mandatory. The Company does not expect thatthe adoption of the following standards and interpretations will have a material impact on the Company’sfinancial statements.
JERS 9 ‘Financial instruments’ was issued by the IASB in November 2009 for retrospective application inaccounting periods beginning on or after 1 January 2013. Although there are expected to be significant changesto the presentation of financial instruments by the Company, there is not expected to be a significant impact onnet assets.
For identification purpose only.E;oes toetherv, revielreport
dated. ,.jAV.’L4!j

MORGAN STANLEY B.V.
NOTES TO THE CONDENSED FINANCIAL STATEMENTSSix months ended 30 June 2010
1. BASIS OF PREPARATION (CONTINUED)
lAS 24 ‘Related party disclosures’ was revised by the IASB in November 2009 for retrospective application inannual periods beginning on or after 1 January 2011. The revised standard was endorsed by the EU in July2010.
As part of the May 2010 Improvements to IFRSs, the IASB made amendments to the following standards thatare relevant to the Company’s operations: IFRS 7 ‘Financial instruments: disclosures’ and lAS 1 ‘Presentationof Financial Statements’ (for application in accounting periods beginning on or after 1 January 2011).
ii. Use of estimates and sources of uncertainty
The preparation of financial information requires the Company to make estimates and assumptions regardingthe valuation of certain financial instruments and other matters that affect the condensed financial statementsand related disclosures. The Company believes that the estimates utilised in preparing these condensedfinancial statements are reasonable, relevant and reliable. Actual results could differ from these estimates.
2. FINANCIAL ASSETS AND FINANCIAL LIABILITIES CLASSIFIED AS HELD FOR TRADING
Financial assets and financial liabilities classified as held for trading are summarised in the table below:
30 June 2010 31 December 2009
Assets Liabilities Assets Liabilities€‘OOO €‘OOO €‘OOO €‘OOO
Derivatives - 132,158 30,958 -
3. FINANCIAL ASSETS AND FINANCIAL LIABILITIES DESIGNATED AT FAIR VALUETHROUGH PROFIT OR LOSS
Financial instruments designated at fair value through profit or loss consist primarily of the following financialassets and financial liabilities:
Issued structured notes - These instruments contain an embedded derivative which significantly modifies the cashflows of the issuance. The return on the instrument is linked to an underlying that is not clearly and closely relatedto the debt host including, but not limited to, equity, credit or commodity-linked notes. The instruments aredesignated at fair value as the risks to which the Company is a contractual party are risk managed on a fair valuebasis as part of the Company’s trading portfolio and the risk is reported to key management personnel on this basis.
Prepaid equity securities contracts - These contracts involve derivatives for which an initial payment is paid atinception. These contracts, along with the loans designated at fair value and the derivative contracts classified asheld for trading, are part of the hedging strategy for the obligations arising pursuant to the issuance of the structurednotes. The contracts are designated at fair value as the risks to which the Company is a contractual party aremanaged on a fair value basis as part of the Company’s trading portfolio and the risk is reported to key managementpersonnel on this basis.
Designated loans - These are loans to other Morgan Stanley Group companies that, along with the prepaid equitysecurities contracts and the derivative contracts classified as held for trading, are part of the hedging strategy for theobligations arising pursuant to the issuance of the structured notes. These loans are designated at fair value as therisks to which the Company is a contractual party are managed on a fair value basis as part of the Company’strading portfolio and the risk is reported to key management personnel on this basis.
For identification purpose on’y.Goesdated . ..
.
MORGAN STANLEY B.V.
NOTES TO THE CONDENSED FINANCIAL STATEMENTSSix months ended 30 June 2010
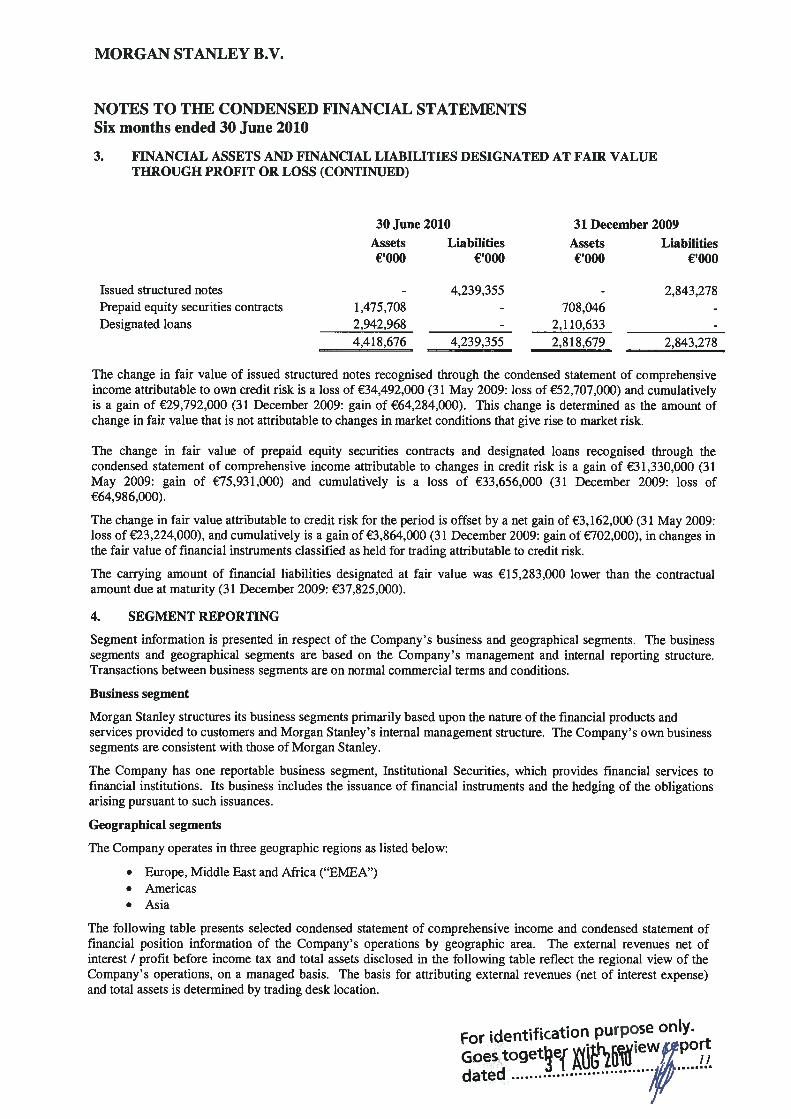
3. FINANCIAL ASSETS AND FINANCIAL LIABILITIES DESIGNATED AT FAIR VALUETHROUGH PROFIT OR LOSS (CONTINUED)
30 June 2010 31 December 2009
Assets Liabilities Assets Liabilities€‘000 €‘OOO €‘OOO €‘OOO
Issued structured notes - 4,239,355 2,843,278Prepaid equity securities contracts 1,475,708 708,046 -
Designated loans 2,942,968 - 2,110,633 -
4,418,676 4,239,355 2,818,679 2,843,278
The change in fair value of issued structured notes recognised through the condensed statement of comprehensiveincome attributable to own credit risk is a loss of €34,492,000 (31 May 2009: loss of €52,707,000) and cumulativelyis a gain of €29,792,000 (31 December 2009: gain of €64,284,000). This change is determined as the amount ofchange in fair value that is not attributable to changes in market conditions that give rise to market risk.
The change in fair value of prepaid equity securities contracts and designated loans recognised through thecondensed statement of comprehensive income attributable to changes in credit risk is a gain of €31,330,000 (31May 2009: gain of €75,931,000) and cumulatively is a loss of €33,656,000 (31 December 2009: loss of€64,986,000).
The change in fair value attributable to credit risk for the period is offset by a net gain of €3,162,000 (31 May 2009:loss of €23,224,000), and cumulatively is a gain of €3,864,000 (31 December 2009: gain of €702,000), in changes inthe fair value of financial instruments classified as held for trading attributable to credit risk.
The carrying amount of financial liabilities designated at fair value was €15,283,000 lower than the contractualamount due at maturity (31 December 2009: €37,825,000).
4. SEGMENT REPORTING
Segment information is presented in respect of the Company’s business and geographical segments. The businesssegments and geographical segments are based on the Company’s management and internal reporting structure.Transactions between business segments are on normal commercial terms and conditions.
Business segment
Morgan Stanley structures its business segments primarily based upon the nature of the financial products andservices provided to customers and Morgan Stanley’s internal management structure. The Company’s own businesssegments are consistent with those of Morgan Stanley.
The Company has one reportable business segment, Institutional Securities, which provides financial services tofinancial institutions. Its business includes the issuance of financial instruments and the hedging of the obligationsarising pursuant to such issuances.
Geographical segments
The Company operates in three geographic regions as listed below:
• Europe, Middle East and Africa (“EMEA”)• Americas• Asia
The following table presents selected condensed statement of comprehensive income and condensed statement offinancial position information of the Company’s operations by geographic area. The external revenues net ofinterest / profit before income tax and total assets disclosed in the following table reflect the regional view of theCompany’s operations, on a managed basis. The basis for attributing external revenues (net of interest expense)and total assets is determined by trading desk location.
For identification purpose only.
Goes togetedated
MORGAN STANLEY B.V.
NOTES TO THE CONDENSED FINANCIAL STATEMENTSSix months ended 30 June 2010
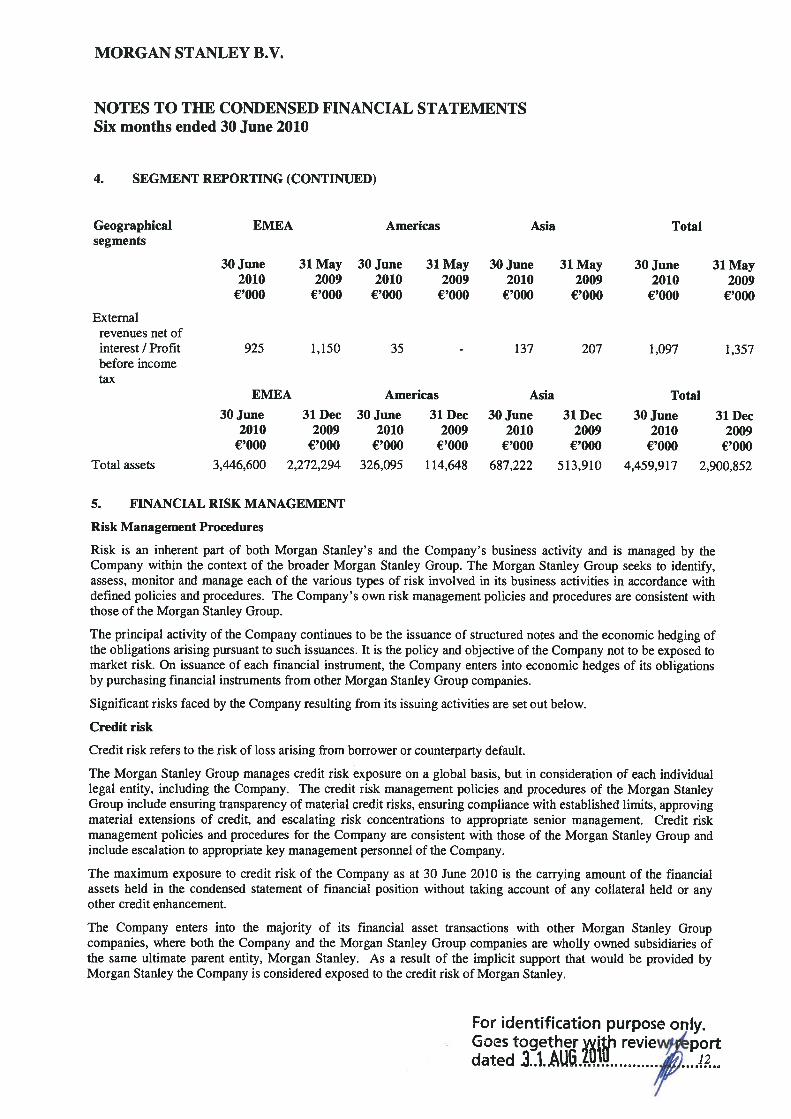
4. SEGMENT REPORTING (CONTINUED)
Geographical EMEA Americas Asia Totalsegments
30 June 31 May 30 June 31 May 30 June 31 May 30 June 31 May2010 2009 2010 2009 2010 2009 2010 2009
€‘OOO €‘OOO €‘OOO €‘OOO €‘OOO €‘OOO €‘OOO €‘OOO
Externalrevenues net ofinterest/Profit 925 1,150 35 - 137 207 1,097 1,357before incometax
EMEA Americas Asia Total
30 June 31 Dec 30 June 31 Dec 30 June 31 Dec 30 June 31 Dec2010 2009 2010 2009 2010 2009 2010 2009
€‘OOO €‘OOO €‘OOO €‘OOO €‘OOO €‘OOO €‘OOO €‘OOO
Total assets 3,446,600 2,272,294 326,095 114,648 687,222 513,910 4,459,917 2,900,852
5. FINANCIAL RISK MANAGEMENT
Risk Management Procedures
Risk is an inherent part of both Morgan Stanley’s and the Company’s business activity and is managed by theCompany within the context of the broader Morgan Stanley Group. The Morgan Stanley Group seeks to identify,assess, monitor and manage each of the various types of risk involved in its business activities in accordance withdefined policies and procedures. The Company’s own risk management policies and procedures are consistent withthose of the Morgan Stanley Group.
The principal activity of the Company continues to be the issuance of structured notes and the economic hedging ofthe obligations arising pursuant to such issuances. It is the policy and objective of the Company not to be exposed tomarket risk. On issuance of each financial instrument, the Company enters into economic hedges of its obligationsby purchasing financial instruments from other Morgan Stanley Group companies.
Significant risks faced by the Company resulting from its issuing activities are set out below.
Credit risk
Credit risk refers to the risk of loss arising from borrower or counterparty default.
The Morgan Stanley Group manages credit risk exposure on a global basis, but in consideration of each individuallegal entity, including the Company. The credit risk management policies and procedures of the Morgan StanleyGroup include ensuring transparency of material credit risks, ensuring compliance with established limits, approvingmaterial extensions of credit, and escalating risk concentrations to appropriate senior management. Credit riskmanagement policies and procedures for the Company are consistent with those of the Morgan Stanley Group andinclude escalation to appropriate key management personnel of the Company.
The maximum exposure to credit risk of the Company as at 30 June 2010 is the carrying amount of the financialassets held in the condensed statement of financial position without taking account of any collateral held or anyother credit enhancement.
The Company enters into the majority of its financial asset transactions with other Morgan Stanley Groupcompanies, where both the Company and the Morgan Stanley Group companies are wholly owned subsidiaries ofthe same ultimate parent entity, Morgan Stanley. As a result of the implicit support that would be provided byMorgan Stanley the Company is considered exposed to the credit risk of Morgan Stanley.
For dentification purpose only.Goes together wjlJi review/portdated tAUiJ
MORGAN STANLEY B.V.
NOTES TO THE CONDENSED FINANCIAL STATEMENTSSix months ended 30 June 2010
5. FINANCIAL RISK MANAGEMENT (CONTINUED)
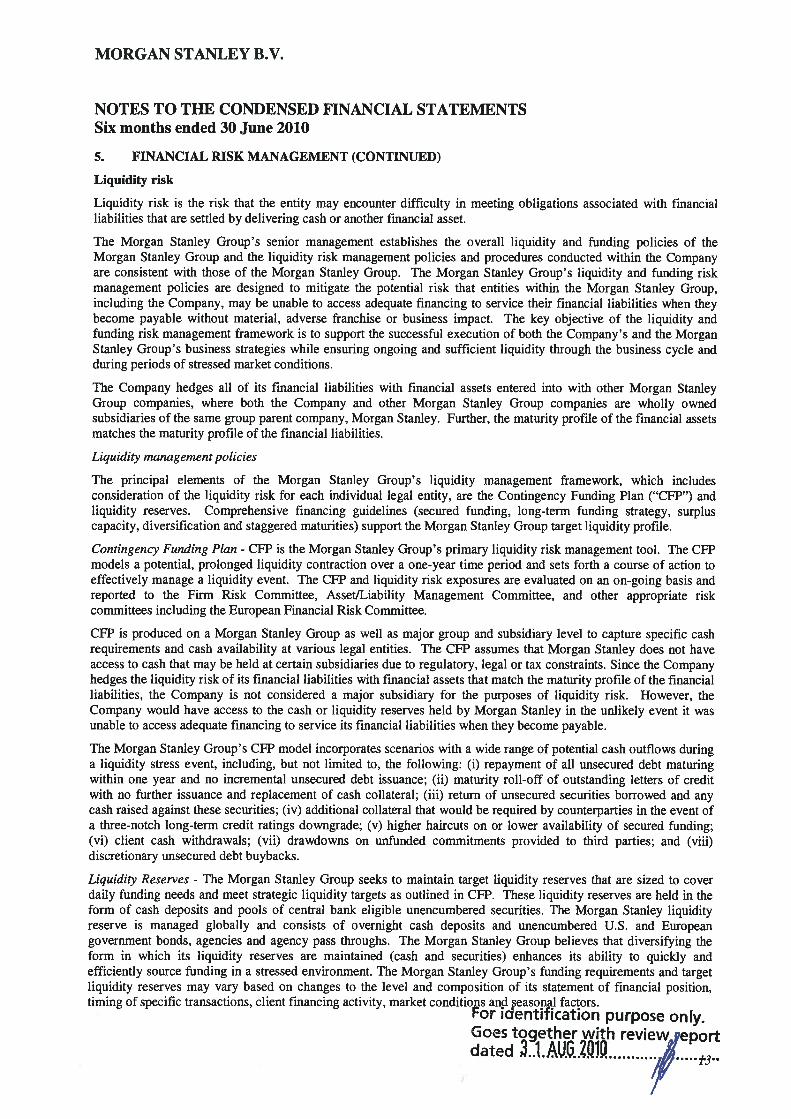
Liquidity risk
Liquidity risk is the risk that the entity may encounter difficulty in meeting obligations associated with financialliabilities that are settled by delivering cash or another financial asset.
The Morgan Stanley Group’s senior management establishes the overall liquidity and funding policies of theMorgan Stanley Group and the liquidity risk management policies and procedures conducted within the Companyare consistent with those of the Morgan Stanley Group. The Morgan Stanley Group’s liquidity and funding riskmanagement policies are designed to mitigate the potential risk that entities within the Morgan Stanley Group,including the Company, may be unable to access adequate financing to service their financial liabilities when theybecome payable without material, adverse franchise or business impact. The key objective of the liquidity andfunding risk management framework is to support the successful execution of both the Company’s and the MorganStanley Group’s business strategies while ensuring ongoing and sufficient liquidity through the business cycle andduring periods of stressed market conditions.
The Company hedges all of its financial liabilities with financial assets entered into with other Morgan StanleyGroup companies, where both the Company and other Morgan Stanley Group companies are wholly ownedsubsidiaries of the same group parent company, Morgan Stanley. Further, the maturity profile of the financial assetsmatches the maturity profile of the financial liabilities.
Liquidity management policies
The principal elements of the Morgan Stanley Group’s liquidity management framework, which includesconsideration of the liquidity risk for each individual legal entity, are the Contingency Funding Plan (“CFP”) andliquidity reserves. Comprehensive financing guidelines (secured funding, long-term funding strategy, surpluscapacity, diversification and staggered maturities) support the Morgan Stanley Group target liquidity profile.
Contingency Funding Plan - CFP is the Morgan Stanley Group’s primary liquidity risk management tool. The CFPmodels a potential, prolonged liquidity contraction over a one-year time period and sets forth a course of action toeffectively manage a liquidity event. The CFP and liquidity risk exposures are evaluated on an on-going basis andreported to the Firm Risk Committee, Asset/Liability Management Committee, and other appropriate riskcommittees including the European Financial Risk Committee.
CFP is produced on a Morgan Stanley Group as well as major group and subsidiary level to capture specific cashrequirements and cash availability at various legal entities. The CFP assumes that Morgan Stanley does not haveaccess to cash that may be held at certain subsidiaries due to regulatory, legal or tax constraints. Since the Companyhedges the liquidity risk of its financial liabilities with financial assets that match the maturity profile of the financialliabilities, the Company is not considered a major subsidiary for the purposes of liquidity risk. However, theCompany would have access to the cash or liquidity reserves held by Morgan Stanley in the unlikely event it wasunable to access adequate financing to service its financial liabilities when they become payable.
The Morgan Stanley Group’s CFP model incorporates scenarios with a wide range of potential cash outflows duringa liquidity stress event, including, but not limited to, the following: (i) repayment of all unsecured debt maturingwithin one year and no incremental unsecured debt issuance; (ii) maturity roll-off of outstanding letters of creditwith no further issuance and replacement of cash collateral; (iii) return of unsecured securities borrowed and anycash raised against these securities; (iv) additional collateral that would be required by counterparties in the event ofa three-notch long-term credit ratings downgrade; (v) higher haircuts on or lower availability of secured funding;(vi) client cash withdrawals; (vii) drawdowns on unfunded commitments provided to third parties; and (viii)discretionary unsecured debt buybacks.
Liquidity Reserves - The Morgan Stanley Group seeks to maintain target liquidity reserves that are sized to coverdaily funding needs and meet strategic liquidity targets as outlined in CFP. These liquidity reserves are held in theform of cash deposits and pools of central bank eligible unencumbered securities. The Morgan Stanley liquidityreserve is managed globally and consists of overnight cash deposits and unencumbered U.S. and Europeangovernment bonds, agencies and agency pass throughs. The Morgan Stanley Group believes that diversifying theform in which its liquidity reserves are maintained (cash and securities) enhances its ability to quickly andefficiently source funding in a stressed environment. The Morgan Stanley Group’s funding requirements and targetliquidity reserves may vary based on changes to the level and composition of its statement of financial position,timing of specific transactions, client financing activity, market conditions anii easonal factors.
For centification purpose on y.Goes together with review eportdated 2J.AU.21O

MORGAN STANLEY B.V.
NOTES TO THE CONDENSED FINANCIAL STATEMENTSSix months ended 30 June 2010
5. FINANCIAL RISK MANAGEMENT (CONTINUED)
Funding management policies
The Morgan Stanley Group’s funding management policies are designed to provide for financings that are executedin a manner that reduces the risk of disruption to the Morgan Stanley Group’s and the Company’s operations. TheMorgan Stanley Group pursues a strategy of diversification of secured and unsecured funding sources (by product,by investor and by region) and attempts to ensure that the tenor of the Morgan Stanley Group’s, and the Company’s,liabilities equals or exceeds the expected holding period of the assets being financed. Maturities of financings aredesigned to manage exposure to refinancing risk in any one period.
The Morgan Stanley Group funds its statement of financial position on a global basis through diverse sources, whichincludes consideration of the funding risk of each legal entity. These sources may include the Morgan StanleyGroup’s equity capital, long-term debt, repurchase agreements, securities lending, deposits, commercial paper,letters of credit and lines of credit. The Morgan Stanley Group has active financing programs for both standard andstructured products in the U.S., European and Asian markets, targeting global investors and currencies such as U.S.dollar, Euro, British pound, Australian dollar and Japanese Yen.
In managing both the Company’s and the Morgan Stanley Group’s funding risk the composition and size of theentire statement of financial position, not just financial liabilities, is monitored and evaluated. A substantial portionof the Morgan Stanley Group’s total assets consist of highly liquid marketable securities and short-term receivablesarising from its Institutional Securities sales and trading activities. The liquid nature of these assets provides theCompany and the Morgan Stanley Group with flexibility in financing and managing its business.
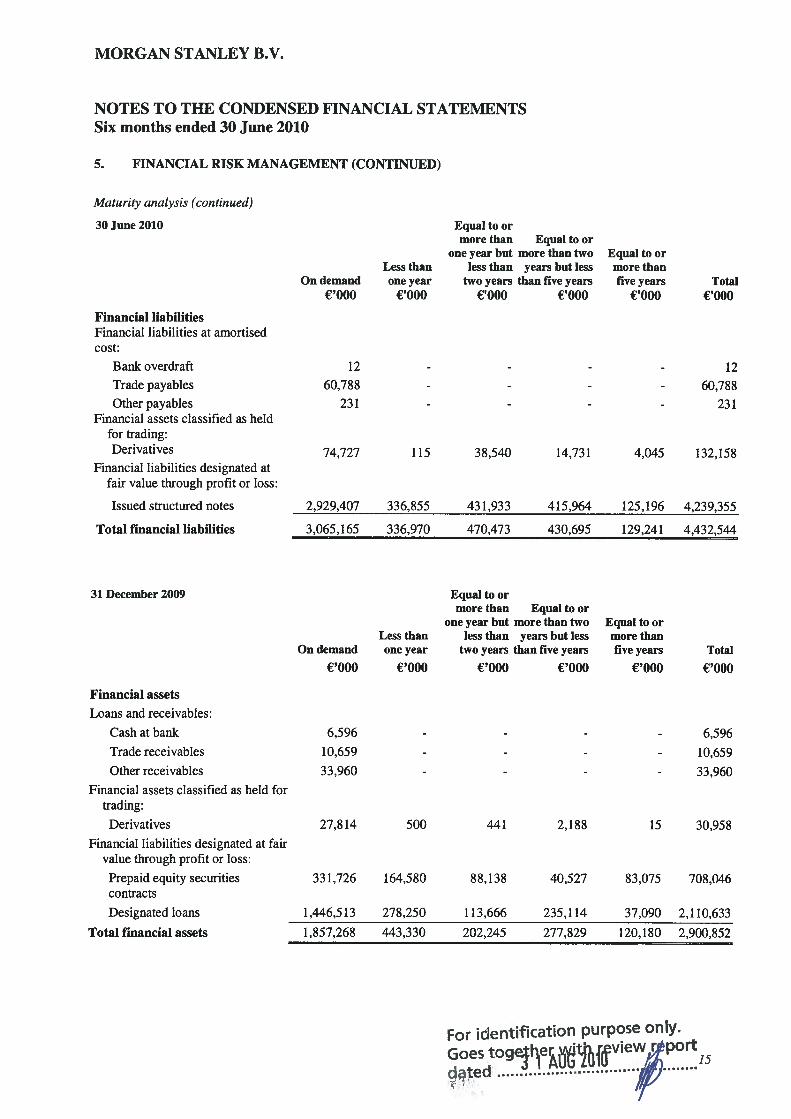
Maturity analysis
In the following maturity analysis of financial assets and financial liabilities, derivative contracts, financial assetsdesignated at fair value through profit or loss and financial liabilities designated at fair value through profit or lossare disclosed according to their earliest contractual maturity; all such amounts are presented at their fair value,consistent with how these financial instruments are managed. All other amounts represent the undiscounted cashflows receivable and payable by the Company arising from its financial assets and financial liabilities to earliestcontractual maturities as at 30 June 2010. Receipt of financial assets and repayments of financial liabilities that aresubject to immediate notice are treated as if notice were given immediately and are classified as on demand. Thispresentation is considered by the Company to appropriately reflect the liquidity risk arising from these financialassets and financial liabilities, presented in a way that is consistent with how the liquidity risk on these financialassets and financial liabilities is managed by the Company.
30 June 2010 Equal to ormore than Equal to or
one year but more than two Equal to orLess than less than years but less more than
On demand one year two years than five years five years Total€‘OOO €‘OOO €‘OOO €‘OOO €‘OOO €‘OOO
Financial assets
Loans and receivables:
Cashatbank 21 - - - - 21Trade receivables 13,530 - - - 13,530
Other receivables 27,497 - - - - 27,497
Financial assets designated at fairvalue through the profit or loss:
Prepaid equity securities 776,430 296,803 65,086 316,908 20,481 1,475,708contracts
Designated loans
Total financial assets
2,274,867 40,167 405,387 113,787 108,760 2,942,968
3,092,345 336,970 470,473 430,695 129,241 4,459,724
or dentificatiOfl purpose only.
{3fiS toeMJfi1V1dated
MORGAN STANLEY B.V.
NOTES TO THE CONDENSED FINANCIAL STATEMENTSSix months ended 30 June 2010
5. FINANCIAL RISK MANAGEMENT (CONTINUED)
Maturity analysis (continued)
Financial liabilitiesFinancial liabilities at amortisedcost:
Bank overdraft
Trade payables
Other payablesFinancial assets classified as held
for trading:Derivatives
Financial liabilities designated atfair value through profit or loss:
Issued structured notes
Total financial liabilities
Financial assets
Loans and receivables:
Cash at bank
Trade receivables
Other receivables
Financial assets classified as held fortrading:
Derivatives
Financial liabilities designated at fairvalue through profit or loss:
Prepaid equity securitiescontracts
Designated loans
Total financial assets
Less thanOn demand one year
€‘OOO €‘OOO
Equal to ormore than Equal to or
one year but more than twoless than years but less
two years than five years‘000 €‘OOO
30 June 2010
Equal to ormore thanfive years
€‘OOOTotal
€‘OOO
12 - - - - 1260,788 - - - - 60,788
231 - - - - 231
74,727 115 38,540 14,731 4,045 132,158
31 December 2009
2,929,407 336,855 431,933 415,964 125,196 4,239,355
3,065,165 336,970 470,473 430,695 129,241 4,432,544
Equal to ormore than Equal to or
one year but more than two Equal to orLess than less than years but less more than
On demand one year two years than five years five years Total
€‘OOO €‘OOO €‘OOO €‘OOO €‘OOO €‘OOO
6,596 - - - - 6,596
10,659 - - - - 10,659
33,960 - - - - 33,960
27,814 500 441 2,188 15 30,958
331,726 164,580 88,138 40,527 83,075 708,046
1,446,513 278,250 113,666 235,114 37,090 2,110,633
1,857,268 443,330 202,245 277,829 120,180 2,900,852
For identification purpose only.
MORGAN STANLEY B.V.
NOTES TO THE CONDENSED FINANCIAL STATEMENTSSix months ended 30 June 2010
5. FINANCIAL RISK MANAGEMENT (CONTINUED)
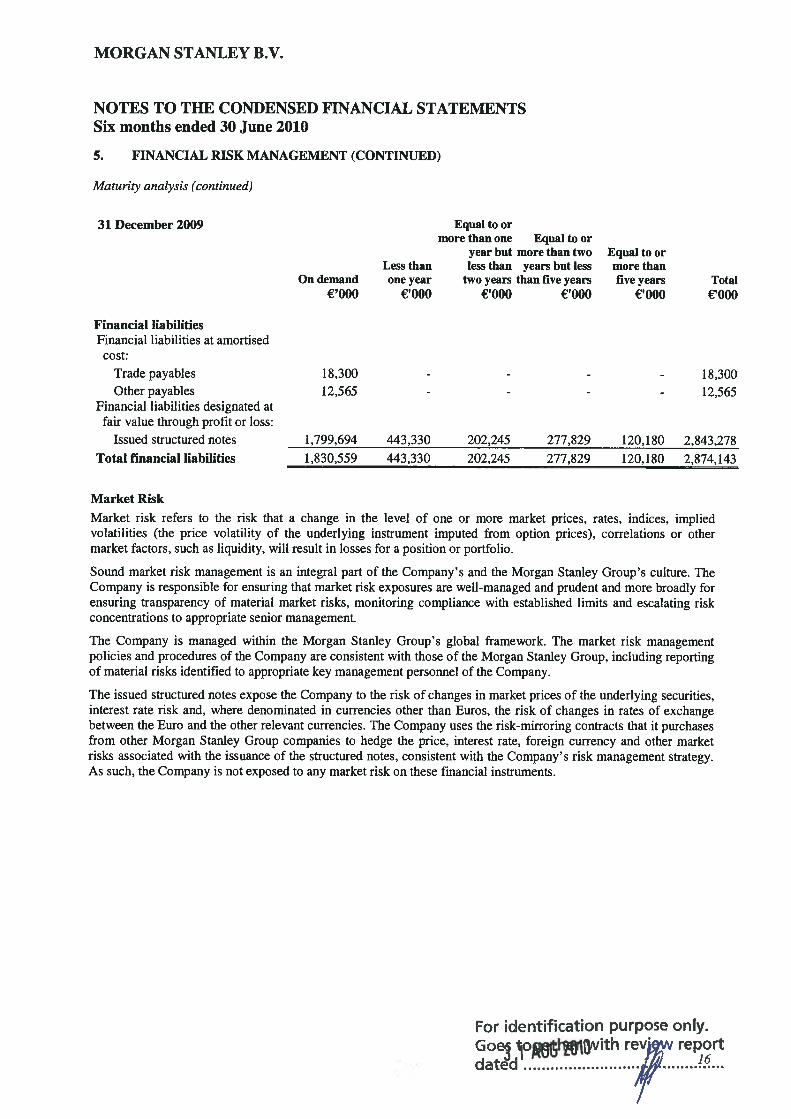
Maturity analysis (continued)
Financial liabilitiesFinancial liabilities at amortisedcost:
Trade payablesOther payables
Financial liabilities designated atfair value through profit or loss:
Issued structured notes
Total fmancial liabilities
Less thanOn demand one year
€‘OOO ‘OOO
Equal to ormore than one Equal to or
year but more than twoless than years but less
two years than five years€‘OOO €OO0
Equal to ormore thanfive years
€‘OOO
- 18,300- 12,565
Market Risk
Market risk refers to the risk that a change in the level of one or more market prices, rates, indices, impliedvolatilities (the price volatility of the underlying instrument imputed from option prices), correlations or othermarket factors, such as liquidity, will result in losses for a position or portfolio.
Sound market risk management is an integral part of the Company’s and the Morgan Stanley Group’s culture. TheCompany is responsible for ensuring that market risk exposures are well-managed and prudent and more broadly forensuring transparency of material market risks, monitoring compliance with established limits and escalating riskconcentrations to appropriate senior management.
The Company is managed within the Morgan Stanley Group’s global framework. The market risk managementpolicies and procedures of the Company are consistent with those of the Morgan Stanley Group, including reportingof material risks identified to appropriate key management personnel of the Company.
The issued structured notes expose the Company to the risk of changes in market prices of the underlying securities,interest rate risk and, where denominated in currencies other than Euros, the risk of changes in rates of exchangebetween the Euro and the other relevant currencies. The Company uses the risk-mirroring contracts that it purchasesfrom other Morgan Stanley Group companies to hedge the price, interest rate, foreign currency and other marketrisks associated with the issuance of the structured notes, consistent with the Company’s risk management strategy.As such, the Company is not exposed to any market risk on these financial instruments.
For identification purpose only.
7..rr
31 December 2009
Total€‘OOO
18,30012,565
1,799,694 443,330 202,245 277,829 120,180 2,843,2781,830,559 443,330 202,245 277,829 120,180 2,874,143
MORGAN STANLEY B.V.
NOTES TO THE CONDENSED FINANCIAL STATEMENTSSix months ended 30 June 2010
6. FINANCIAL INSTRUMENTS MEASURED AT FAIR VALUE
a. Fair value hierarchy disclosure
Financial instruments recognised at fair value are broken down for disclosure purposes into a three level fair valuehierarchy based on the observability of inputs as follows:
Quoted prices (unadjusted) in an active market for identical assets or liabilities (Level 1) — Valuationsbased on quoted prices in active markets for identical assets or liabilities that the Morgan Stanley Grouphas the ability to access. Valuation adjustments and block discounts are not applied to Level I instruments.Since valuations are based on quoted prices that are readily and regularly available in an active market,valuation of these products does not entail a significant degree ofjudgement.
• Valuation techniques using observable inputs (Level 2) — Valuations based on one or more quoted prices inmarkets that are not active or for which all significant inputs are observable, either directly or indirectly.
• Valuation techniques with significant unobservable inputs (Level 3) — Valuations based on inputs that areunobservable and significant to the overall fair value measurement.
The Company’s valuation approach and fair value hierarchy categorisation for certain significant classes of financialinstruments recognised at fair value are as follows:
Derivatives
Over-the-counter (“OTC”) derivative contracts include forward, swap and option contracts related to equity prices,interest rates or foreign currencies.
Depending on the product and the terms of the transaction, the fair value of OTC derivative products can be eitherobserved or modelled using a series of techniques, and model inputs from comparable benchmarks, includingclosed-form analytic formulas such as the Black-Scholes option pricing model, and simulation models or acombination thereof. Many pricing models do not entail material subjectivity because the methodologies employeddo not necessitate significant judgement, and the pricing inputs are observed from actively quoted markets. In thecase of more established derivative products, the pricing models used by the Company are widely accepted by thefinancial services industry. OTC derivative products valued by the Company using pricing models are generallycategorised in Level 2 of the fair value hierarchy. In instances where significant inputs are unobservable, they arecategorised as Level 3 of the fair value hierarchy.
Designated loans
The fair value of loans to other Morgan Stanley Group companies is estimated based on the present value of theexpected future cash flows using its best estimate of interest rate yield curves. Designated loans are generallycategorised in Level 2 of the fair value hierarchy.
Issued structured notes and prepaid equity securities contracts
The Company issues structured notes and purchases prepaid equity securities contracts that have coupons orrepayment terms linked to the performance of debt or equity securities or currencies. Fair value of structured notesand prepaid equity securities contracts is estimated using valuation models described above for the derivative anddebt features of the notes. These models incorporate observable inputs referencing identical or comparablesecurities, including prices that the notes are linked to, interest rate yield curves, option volatility and currency rates.The impact of own credit spreads is also included based on observed secondary bond market spreads. Structurednotes and prepaid equity securities contracts are generally categorised in Level 2 of the fair value hierarchy. Ininstances where significant inputs are unobservable, they are categorised as Level 3 of the fair value hierarchy.
For identification purpose only.Goes together with reviw reportdated ..34.A1JG.21ft .
6. FINANCIAL INSTRUMENTS MEASURED AT FAIR VALUE (CONTINUED)
Fair value control processes
The Company employs control processes to validate the fair value of its financial instruments, including thosederived from pricing models. These control processes are designed to assure that the values used for financialreporting are based on observable inputs wherever possible. In the event that observable inputs are not available, thecontrol processes are designed to assure that the valuation approach utilised is appropriate and consistently appliedand that the assumptions are reasonable. These control processes include reviews of the pricing model’s theoreticalsoundness and appropriateness by Morgan Stanley Group personnel with relevant expertise who are independentfrom the trading desks.
Additionally, groups independent from the trading divisions within the financial control, market risk and credit riskmanagement departments participate in the review and validation of the fair values generated from pricing models,as appropriate. Where a pricing model is used to determine fair value, recently comparable transactions and otherobservable market data are considered for purposes of validating assumptions underlying the model.
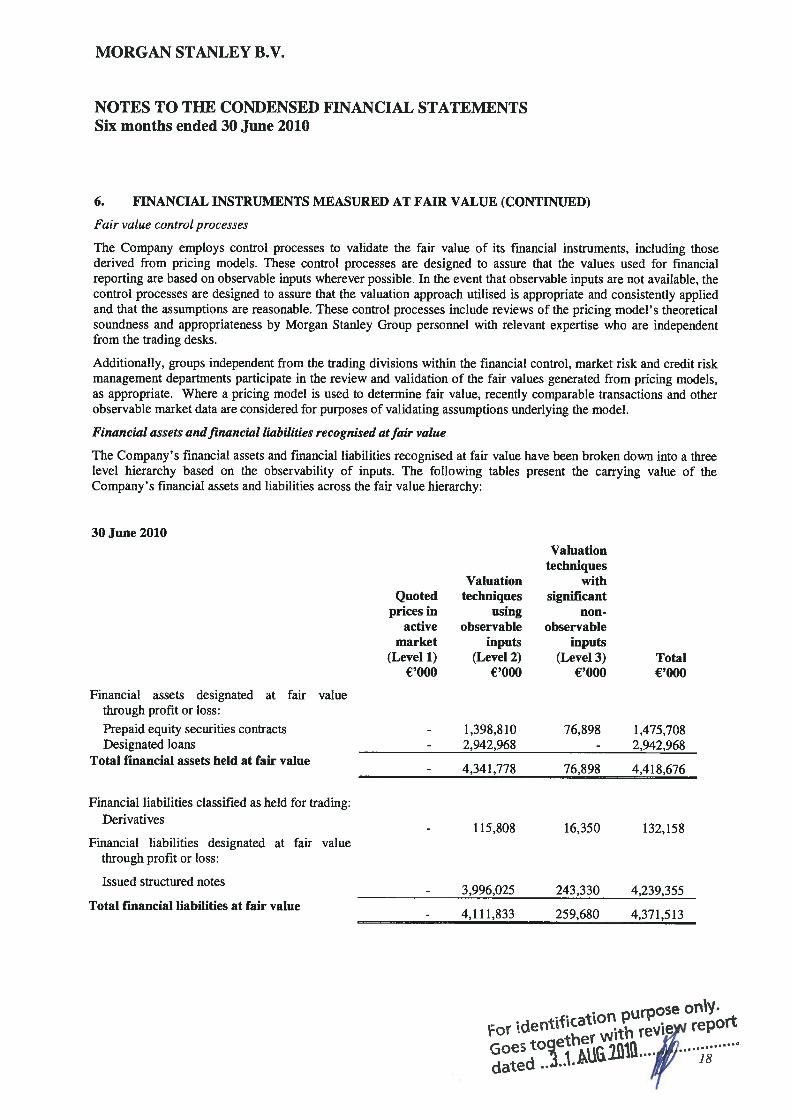
Financial assets andfinancial liabilities recognised atfair value
The Company’s financial assets and financial liabilities recognised at fair value have been broken down into a threelevel hierarchy based on the observability of inputs. The following tables present the carrying value of theCompany’s financial assets and liabilities across the fair value hierarchy:
Valuationtechniques
withsignificant
non-observable
Financial assets designated at fair valuethrough profit or loss:
Prepaid equity securities contractsDesignated loans
_____________________________________________________
Total financial assets held at fair value
Financial liabilities classified as held for trading:Derivatives
Financial liabilities designated at fair valuethrough profit or loss:
Issued structured notes
Total financial liabilities at fair value
MORGAN STANLEY B.V.
NOTES TO THE CONDENSED FINANCIAL STATEMENTSSix months ended 30 June 2010
30 June 2010
Quotedprices in
activemarket
(Level 1)€‘OOO
Valuationtechniques
usingobservable
inputs(Level 2)
€‘OOO
1,398,8102,942,968
inputs(Level 3)
€‘OOOTotal€,000
76,898 1,475,708- 2,942,968
- 4,341,778 76,898 4,418,676
- 115,808 16,350 132,158
- 3,996,025 243,330 4,239,355
- 4,111,833 259,680 4,371,513
rep0
Goes18
MORGAN STANLEY B.V.
NOTES TO THE CONDENSED FINANCIAL STATEMENTSSix months ended 30 June 2010
6. FINANCIAL INSTRUMENTS MEASURED AT FAIR VALUE (CONTINUED)
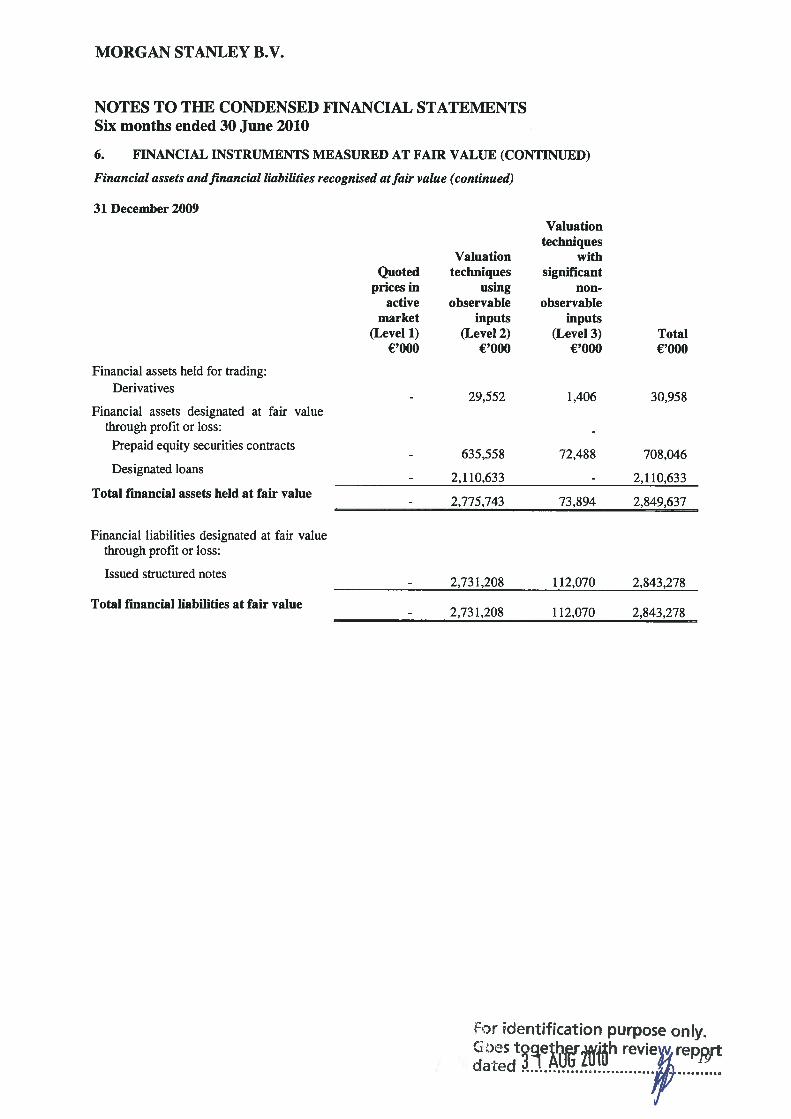
Financial assets andfinancial liabilities recognised atfair value (continued)
31 December 2009
or identification purpose only.
[
Quotedprices in
activemarket
(Level 1)€‘OOO
Valuationtechniques
withsignificant
non-observable
inputs(Level 3)
€‘OOO
1,406
72,488
Valuationtechniques
usingobservable
inputs(Level 2)
€‘OOO
29,552
635,558
2,110,633
2,775,743
Financial assets held for trading:Derivatives
Financial assets designated at fair valuethrough profit or loss:
Prepaid equity securities contracts
Designated loans
Total financial assets held at fair value
Financial liabilities designated at fair valuethrough profit or loss:
Issued structured notes
Total financial liabilities at fair value
Total€‘OOO
30,958
708,046
2,110,633
2,849,63773,894
- 2,731,208 112,070 2,843,278
- 2,731,208 112,070 2,843,278

MORGAN STANLEY B.V.
NOTES TO THE CONDENSED FINANCIAL STATEMENTSSix months ended 30 June 2010
6. FINANCIAL INSTRUMENTS MEASURED AT FAIR VALUE (CONTINUED)
b. Changes in Level 3 assets and liabilities at fair value
The following table presents the changes in the fair value of the Company’s Level 3 financial assets and financialliabilities for the period ended 30 June 2010:
Nettransfers
E inand/oroutof
Level 3 (1) Balance at— 30 June 2010
€‘OOO €‘OOO €‘OOO €‘OOO
Financial assetsdesignated at fairvalue through profitor loss:
Prepaid equitysecurities contracts
Financial liabilitiesclassified as held fortrading:
Net derivative 1,406 (1,299) - - - (18,271) 1,814 (16,350) (1,139)contracts (3)
Financial liabilitiesdesignated at fairvalue through profitor loss:
Issued structured (112,070) - (148,481) 26,233 (11,010) (243,330) 1,417notes
(1) For financial assets and fmancial liabilities that were transferred into and out of Level 3 during the period, gains or (losses) are presented as ifthe assets or liabilities had been transferred into or Out of Level 3 as at the beginning of the period.(2) Amounts represent unrealized gains or (losses) for the period ended 30 June 2010 related to assets and liabilities still outstanding at 30 June2010.(3) Net derivative contracts represent financial assets classified as held for trading — derivative contracts net of financial liabilities classified asheld for trading — derivative contracts.
During the period ended 30 June 2010, the Company reclassified approximately €25,890,000 of financial liabilitiesfrom Level 2 to Level 3. The reclassifications were due to either a reduction in the volume of recently executedtransactions and market price quotations for these instruments, or a lack of available broker quotes, such that certainunobservable inputs became significant to the fair value measurement.
During the period ended 30 June 2010, the Company reclassified approximately €23,246,000 of financial assets and€16,694,000 of financial liabilities from Level 3 to Level 2. The reclassifications were due to an increase in marketprice quotations for these or comparable instruments such that significant inputs for the fair value measurementbecame observable.
ntflcatiofl purpose on’y.
30 June 2010
Balance at1 January
2010
Total gainsl(losses)
recognisedin profit or
loss
€‘OOO €‘OOO €‘OOO €‘OOO
72,488 4,029 39,596 - (15,969) (23,246) 76,898
Unrealisedgainsl(losses) for
level 3assets I liabilities
outstandingas at
30 June 2010 (2)€000
4,135
1,998
(38,176) 4,728 39,596 - (148,481) (8,007) (32,442) (182,782) 4,413
MORGAN STANLEY B.V.
NOTES TO THE CONDENSED FINANCIAL STATEMENTSSix months ended 30 June 2010
6. FINANCIAL INSTRUMENTS MEASURED AT FAIR VALUE (CONTINUED)
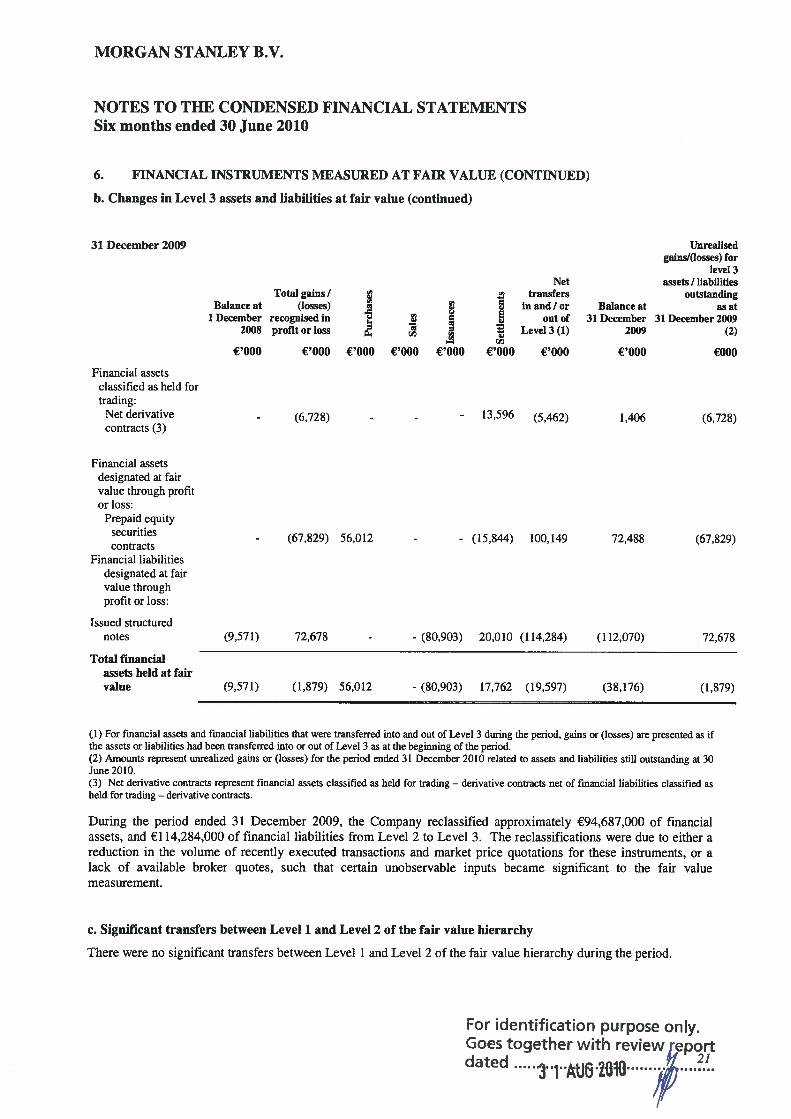
b. Changes in Level 3 assets and liabilities at fair value (continued)
Financial assetsclassified as held fortrading:
Net derivativecontracts (3)
Financial assets
rla? a?
aa aa?cl
€‘OOO €‘OOO €‘OOO €‘OOO €‘OOO
designated at fairvalue through profitor loss:
Prepaid equitysecuritiescontracts
Financial liabilitiesdesignated at fairvalue throughprofit or loss:
Issued structurednotes
Total financialassets held at fair
- (67,829) 56,012
(9,571) 72,678 -
-- (15,844) 100,149
- (80,903) 20,010 (114,284)
72,488 (67,829)
(112,070) 72,678
(1) For financial assets and financial liabilities that were transferred into and out of Level 3 during the period, gains or (losses) are presented as ifthe assets or liabilities had been transferred into or Out of Level 3 as at the beginning of the period.(2) Amounts represent unrealized gains or (losses) for the period ended 31 December 2010 related to assets and liabilities still outstanding at 30June 2010.(3) Net derivative contracts represent financial assets classified as held for trading — derivative contracts net of financial liabilities classified asheld for trading — derivative contracts.
During the period ended 31 December 2009, the Company reclassified approximately €94,687,000 of financialassets, and €114,284,000 of financial liabilities from Level 2 to Level 3. The reclassifications were due to either areduction in the volume of recently executed transactions and market price quotations for these instruments, or alack of available broker quotes, such that certain unobservable inputs became significant to the fair valuemeasurement.
c. Significant transfers between Level 1 and Level 2 of the fair value hierarchy
There were no significant transfers between Level I and Level 2 of the fair value hierarchy during the period.
For identification purpose only.Goes together with revieweport
3iAtJO!1O
IT
31 December 2009
Total gains/(losses)
recognised inprofit or loss
Balance at1 December
2008
€,000
Nettransfers
in and! orout of
Level 3(1)
€‘OOO
(6,728)
Unrealisedgainsl(losses) for
level 3assets I liabilities
outstandingas at
31 December 2009(2)
€000
(6,728)
Balance at31 December
2009
€‘OOO
1,40613,596 (5,462)
value (9,571) (1,879) 56,012 - (80,903) 17,762 (19,597) (38,176) (1,879)
MORGAN STANLEY B.V.
NOTES TO THE CONDENSED FINANCIAL STATEMENTSSix months ended 30 June 2010
6. FINANCIAL INSTRUMENTS MEASURED AT FAIR VALUE (CONTINUED)
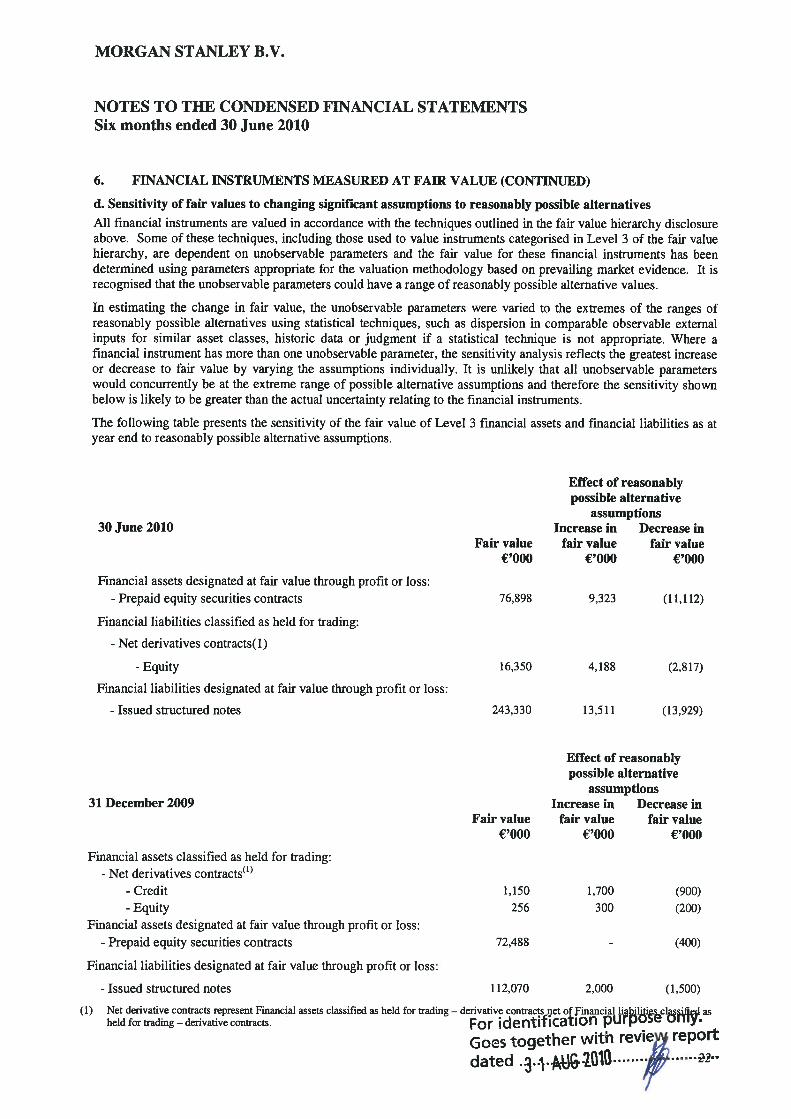
d. Sensitivity of fair values to changing significant assumptions to reasonably possible alternatives
All financial instruments are valued in accordance with the techniques outlined in the fair value hierarchy disclosureabove. Some of these techniques, including those used to value instruments categorised in Level 3 of the fair valuehierarchy, are dependent on unobservable parameters and the fair value for these financial instruments has beendetermined using parameters appropriate for the valuation methodology based on prevailing market evidence. It isrecognised that the unobservable parameters could have a range of reasonably possible alternative values.
In estimating the change in fair value, the unobservable parameters were varied to the extremes of the ranges ofreasonably possible alternatives using statistical techniques, such as dispersion in comparable observable externalinputs for similar asset classes, historic data or judgment if a statistical technique is not appropriate. Where afinancial instrument has more than one unobservable parameter, the sensitivity analysis reflects the greatest increaseor decrease to fair value by varying the assumptions individually. It is unlikely that all unobservable parameterswould concurrently be at the extreme range of possible alternative assumptions and therefore the sensitivity shownbelow is likely to be greater than the actual uncertainty relating to the financial instruments.
The following table presents the sensitivity of the fair value of Level 3 financial assets and financial liabilities as atyear end to reasonably possible alternative assumptions.
Effect of reasonablypossible alternative
assumptions30 June 2010 Increase in Decrease in
Fair value fair value fair value€‘OOO €‘OOO €‘OOO
Financial assets designated at fair value through profit or loss:- Prepaid equity securities contracts 76,898 9,323 (11,112)
Financial liabilities classified as held for trading:
- Net derivatives contracts( 1)
- Equity 16,350 4,188 (2,817)
Financial liabilities designated at fair value through profit or loss:
- Issued structured notes 243,330 13,511 (13,929)
Effect of reasonablypossible alternative
assumptions31 December 2009 Increase in Decrease in
Fair value fair value fair value€‘OOO €‘OOO €‘OOO
Financial assets classified as held for trading:- Net derivatives contracts’
- Credit 1,150 1,700 (900)- Equity 256 300 (200)
Financial assets designated at fair value through profit or loss:- Prepaid equity securities contracts 72,488 (400)
Financial liabilities designated at fair value through profit or loss:
- Issued structured notes 112,070 2,000 (1,500)
(1) Net derivative contracts represent Financial assets classified as held for trading — derivative contracts et of Financial lialjji clçl asheldfortrading—derivativecontracts. For identIfiCation pUr1_’. ‘
Goes together with revie report
dated
MORGAN STANLEY B.V.
NOTES TO THE CONDENSED FINANCIAL STATEMENTSSix months ended 30 June 2010
These condensed financial statements were approved by the Board and authorised for issue on
Signed on behalf of the Board
Directors
A.J.S. Crawford P.W. Banks R.H.L. de Groot H. Herrmann H.K.A. Lee
P.J.G. de Reus J.A. Solan TMF Management B.V.
F.enLh,cat1ofl purpose only

INDEPENDENT REVIEW REPORT TO THE MEMBERS OF MORGAN STANLEYB.V.
For identification purpose only.Goes together with review repodated 3.UJJ6.2a1L...
DeloItte. Deloitte Accountants B.V.
1043 OP AmsterdamP.O.Box 581101040 HC AmsterdamNetherlands
Tel: +31 (0)88 288 2888Fax: +31 (0)88 288 9739www.deloitte.nl
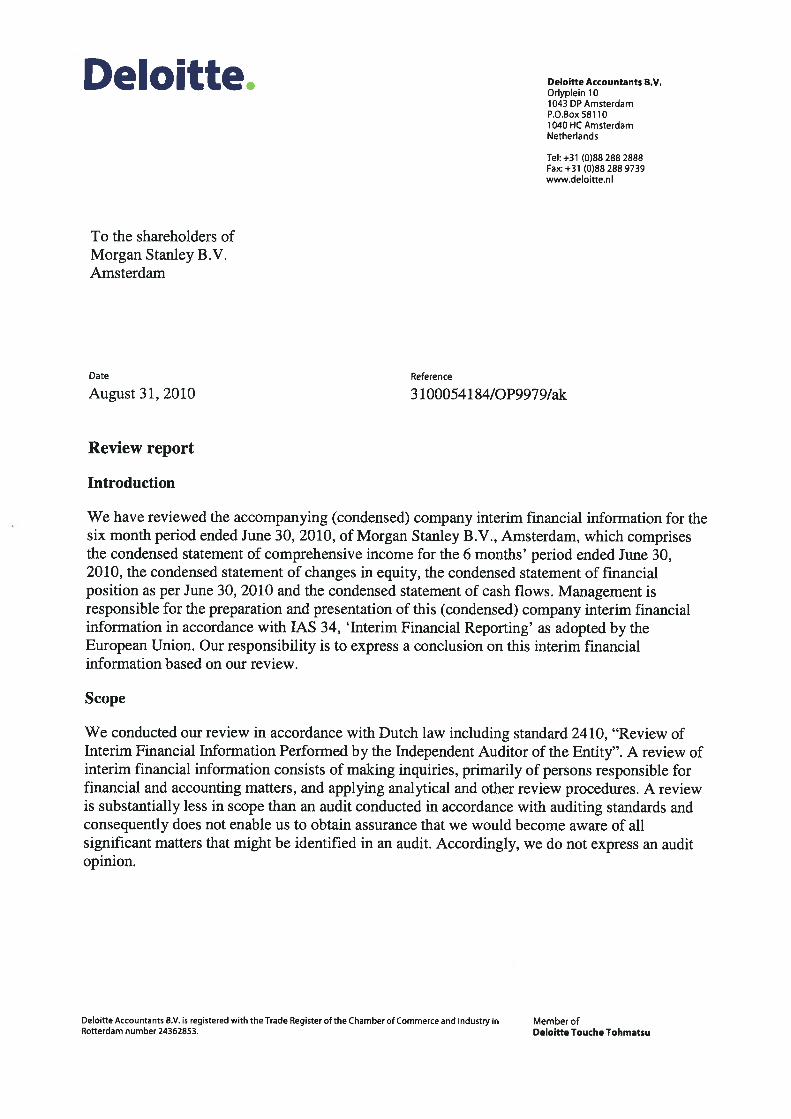
To the shareholders ofMorgan Stanley B.V.Amsterdam
Date Reference
August 31, 2010 3 100054184/0P9979/ak
Review report
Introduction
We have reviewed the accompanying (condensed) company interim financial information for thesix month period ended June 30, 2010, of Morgan Stanley B.V., Amsterdam, which comprisesthe condensed statement of comprehensive income for the 6 months’ period ended June 30,2010, the condensed statement of changes in equity, the condensed statement of financialposition as per June 30, 2010 and the condensed statement of cash flows. Management isresponsible for the preparation and presentation of this (condensed) company interim financialinformation in accordance with lAS 34, ‘Interim Financial Reporting’ as adopted by theEuropean Union. Our responsibility is to express a conclusion on this interim financialinformation based on our review.
Scope
We conducted our review in accordance with Dutch law including standard 2410, “Review ofInterim Financial Information Performed by the Independent Auditor of the Entity”. A review ofinterim financial information consists of making inquiries, primarily of persons responsible forfinancial and accounting matters, and applying analytical and other review procedures. A reviewis substantially less in scope than an audit conducted in accordance with auditing standards andconsequently does not enable us to obtain assurance that we would become aware of allsignificant matters that might be identified in an audit. Accordingly, we do not express an auditopinion.
Deloitte Accountants By, is registered with the Trade Register of the Chamber of Commerce and Industry in Member ofRotterdam number 24362853. Qeloitte Touche Tohmatsu
Deloitte.
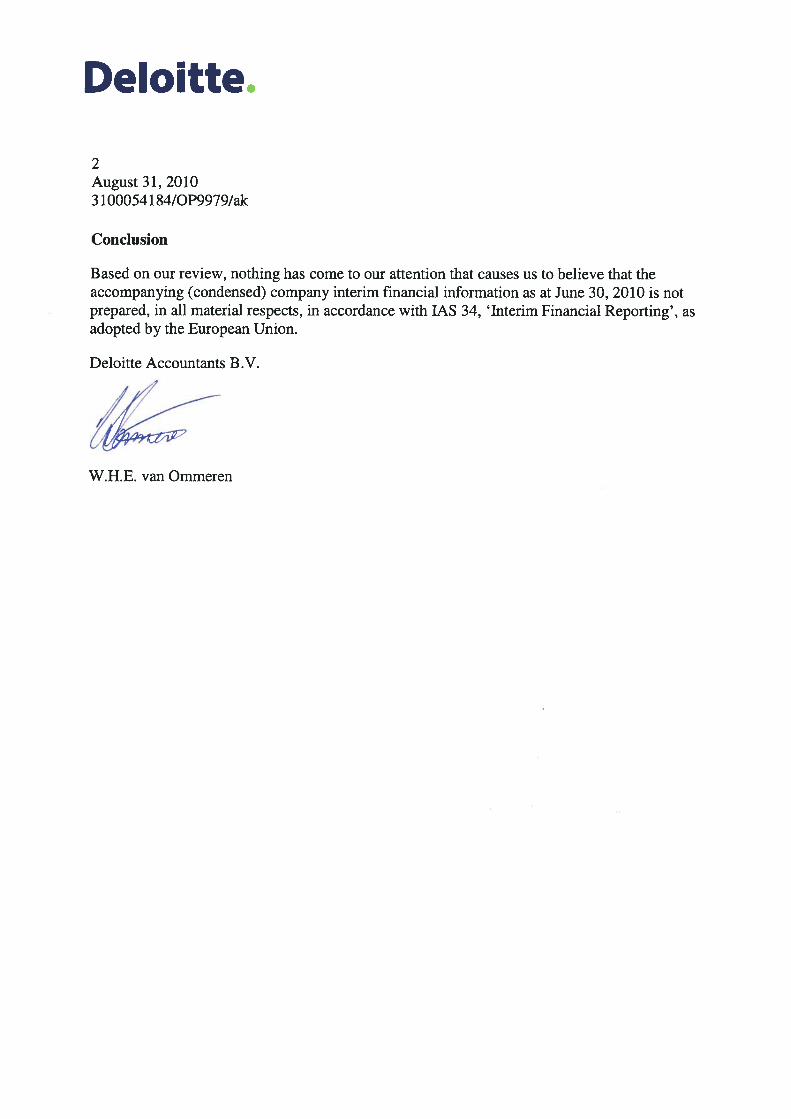
2August 31, 201031000541 8410P9979/ak
Conclusion
Based on our review, nothing has come to our attention that causes us to believe that theaccompanying (condensed) company interim financial information as at June 30, 2010 is notprepared, in all material respects, in accordance with lAS 34, ‘Interim Financial Reporting’, asadopted by the European Union.
Deloitte Accountants B.V.
W.H.E. van Ommeren


![Morgan Stanley B.V. Morgan Stanley BV - Certificate... · Morgan Stanley B.V. ... above [in each case] on the terms and conditions set out in the terms and conditions (the Conditions)](https://img.pdfslide.net/doc/110x75/5aa529e57f8b9a7c1a8d03bb/morgan-stanley-bv-morgan-bv-certificatemorgan-stanley-bv-above-in.jpg)