Embed Size (px)
Citation preview
MORPC Model Comparison ProjectTrip vs. Tour Model

Research Project
• Led by Ohio DOT and initiated in 2008• Main objective: examine the performance
of the MORPC trip-based and tour-based frameworks in the context of a before-and-after project analysis
• ODOT, MORPC, OKI and NOACA are looking to obtain a clearer picture of the potential practical benefits of tour-based models in the context of assessing projects and policies
Research Tasks
1. Understand model differences2. Determine analysis methodologies
and data requirements3. Select study projects for before/after
analysis4. Determine data collection projects5. Prepare models and model data6. Run models, analyze output and
observed conditions
Requirements for an Analogous Comparison• Common analysis years
– Using 1990, 2000, 2005 (due to better 1990 SE data than 1995)
• Identical estimation datasets• Isolate supply-side differences• Isolate demand-side differences
• Borrowed a Trip Model from OMS
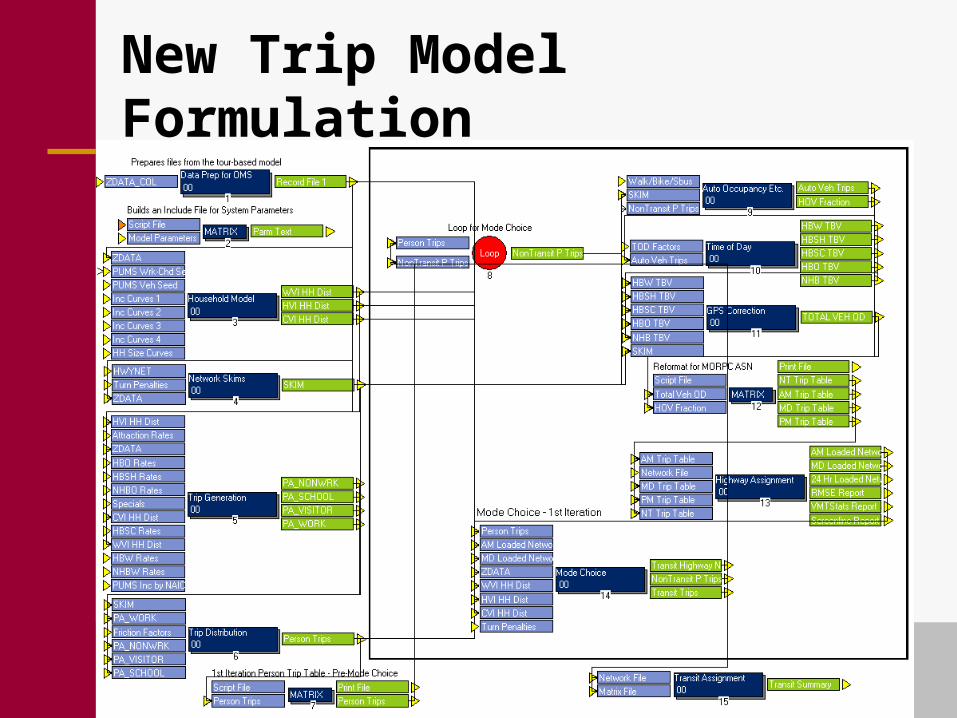
New Trip Model Formulation
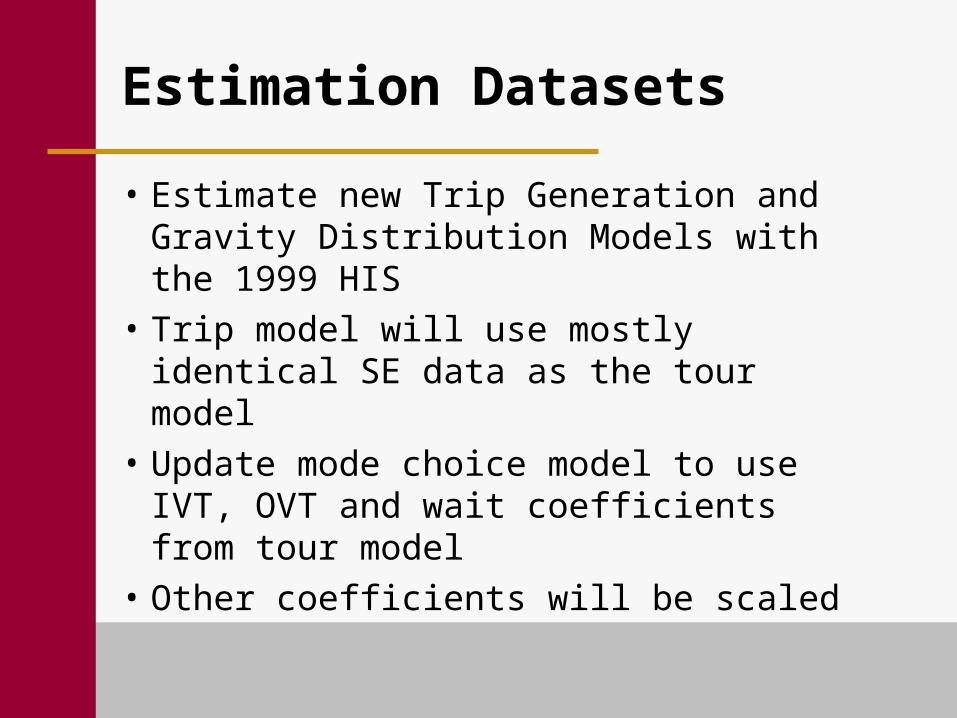
Estimation Datasets
• Estimate new Trip Generation and Gravity Distribution Models with the 1999 HIS
• Trip model will use mostly identical SE data as the tour model
• Update mode choice model to use IVT, OVT and wait coefficients from tour model
• Other coefficients will be scaled
Mode Choice
• Mode choice– Trip model uses nested logit
structure based on 1993 on-board survey
– Tour model uses mostly multinomial structures based on 1999 HIS + 1993 on-board survey - Also adheres to FTA New Starts parameter guidelines
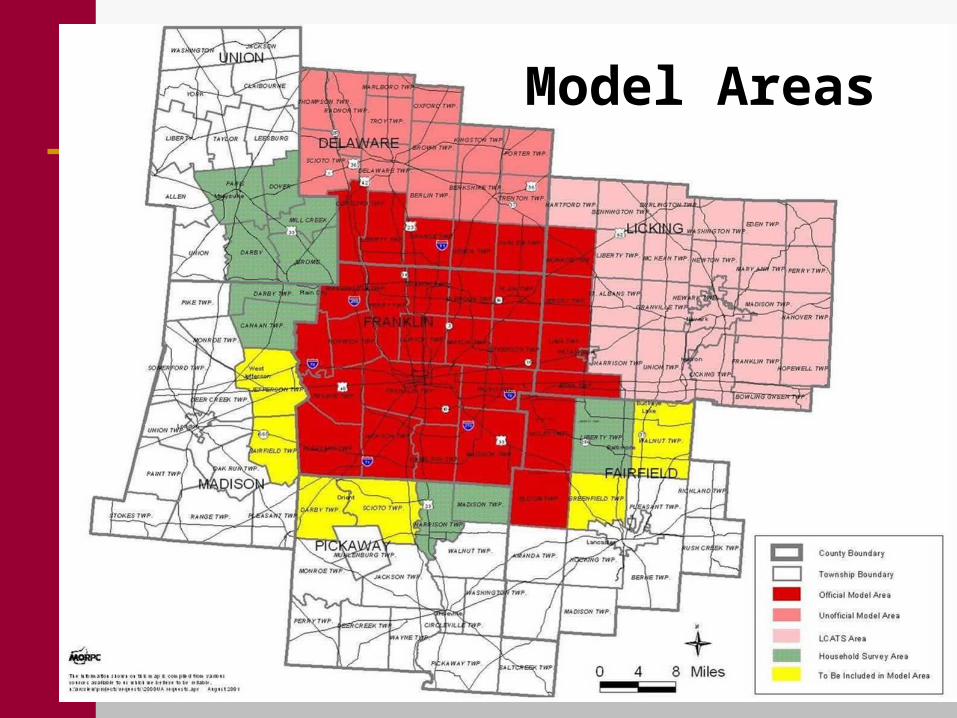
Model Areas

Demand-side Differences
• 4-period assignment• External and CMV models are based on SE
data and network impedances, so they would change with different assignments– Solution: hold trip tables constant across the
models and alternatives• Equilibrium assignment closure rates can
vary mode choice impedances and final highway volumes– Solution: apply very high closure rate to both
models
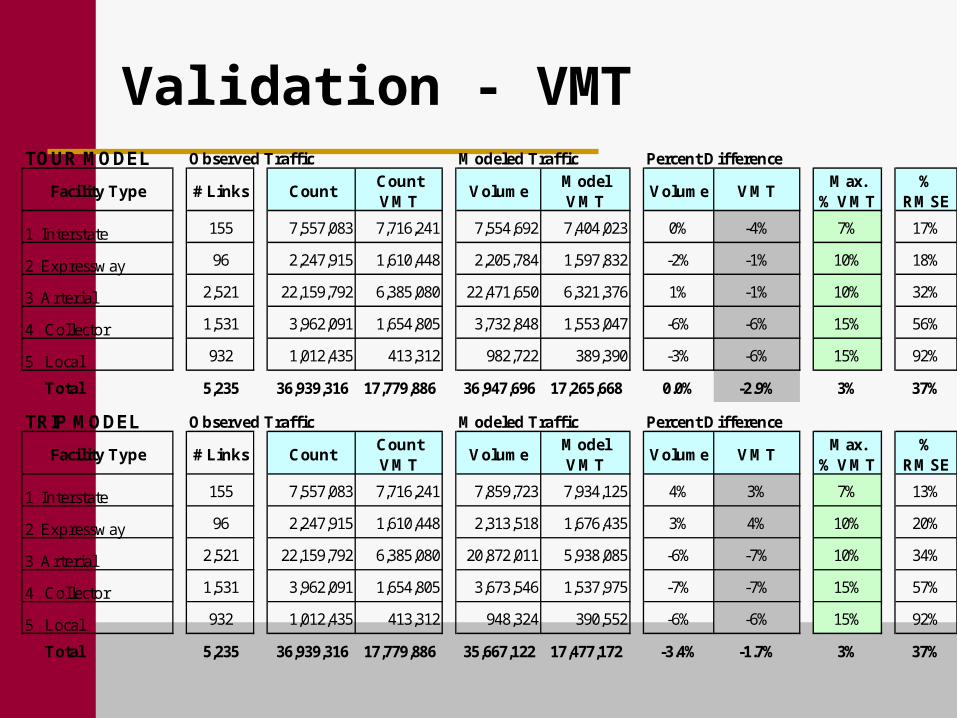
Validation - VMTTOUR MODEL Observed Traffic Modeled Traffic Percent Difference
Facility Type # Links CountCount VMT
VolumeModel VMT
Volume VMTMax.
% VMT%
RMSE
1 Interstate 155 7,557,083 7,716,241 7,554,692 7,404,023 0% -4% 7% 17%
2 Expressway 96 2,247,915 1,610,448 2,205,784 1,597,832 -2% -1% 10% 18%
3 Arterial 2,521 22,159,792 6,385,080 22,471,650 6,321,376 1% -1% 10% 32%
4 Collector 1,531 3,962,091 1,654,805 3,732,848 1,553,047 -6% -6% 15% 56%
5 Local 932 1,012,435 413,312 982,722 389,390 -3% -6% 15% 92%
Total 5,235 36,939,316 17,779,886 36,947,696 17,265,668 0.0% -2.9% 3% 37%
TRIP MODEL Observed Traffic Modeled Traffic Percent Difference
Facility Type # Links CountCount VMT
VolumeModel VMT
Volume VMTMax.
% VMT%
RMSE
1 Interstate 155 7,557,083 7,716,241 7,859,723 7,934,125 4% 3% 7% 13%
2 Expressway 96 2,247,915 1,610,448 2,313,518 1,676,435 3% 4% 10% 20%
3 Arterial 2,521 22,159,792 6,385,080 20,872,011 5,938,085 -6% -7% 10% 34%
4 Collector 1,531 3,962,091 1,654,805 3,673,546 1,537,975 -7% -7% 15% 57%
5 Local 932 1,012,435 413,312 948,324 390,552 -6% -6% 15% 92%
Total 5,235 36,939,316 17,779,886 35,667,122 17,477,172 -3.4% -1.7% 3% 37%
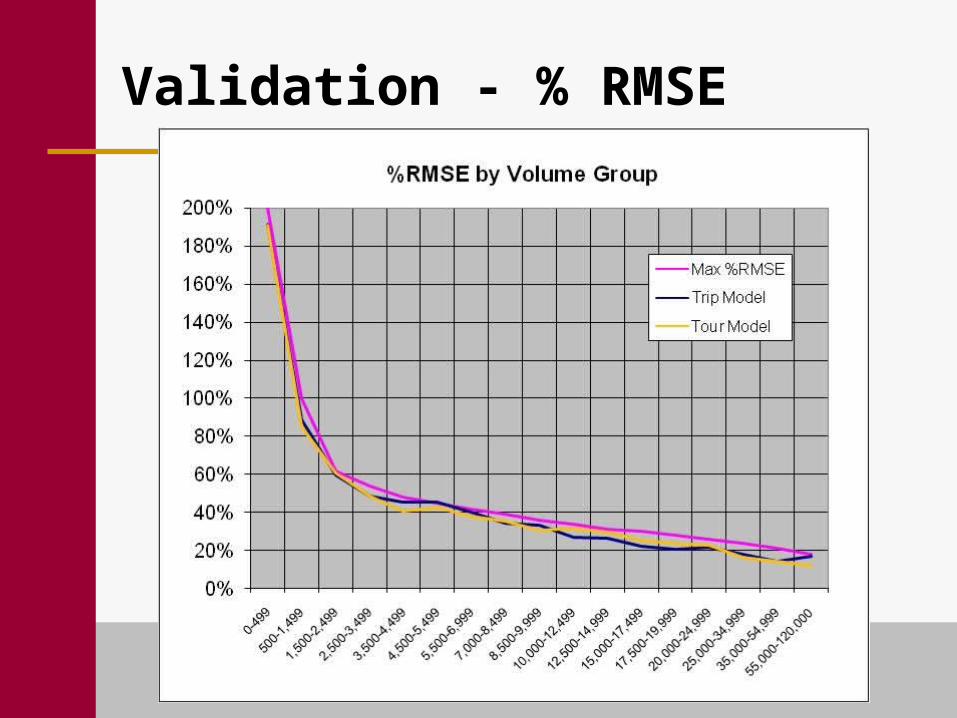
Validation - % RMSE
Other Considerations
• Trip Model is fairly simplistic– No peak spreading– No vehicle ownership– Daily level generation and
distribution– Gravity distribution model– 1 iteration of feedback to mode
choice
Proposed Before/After Projects
• Spring-Sandusky interchange– Large-scale freeway project– Project is completed and
subsequent land-use development has stabilized
• Polaris– Medium-scale freeway interchange
project– New and subsequently modified
interchange in rapid growth area
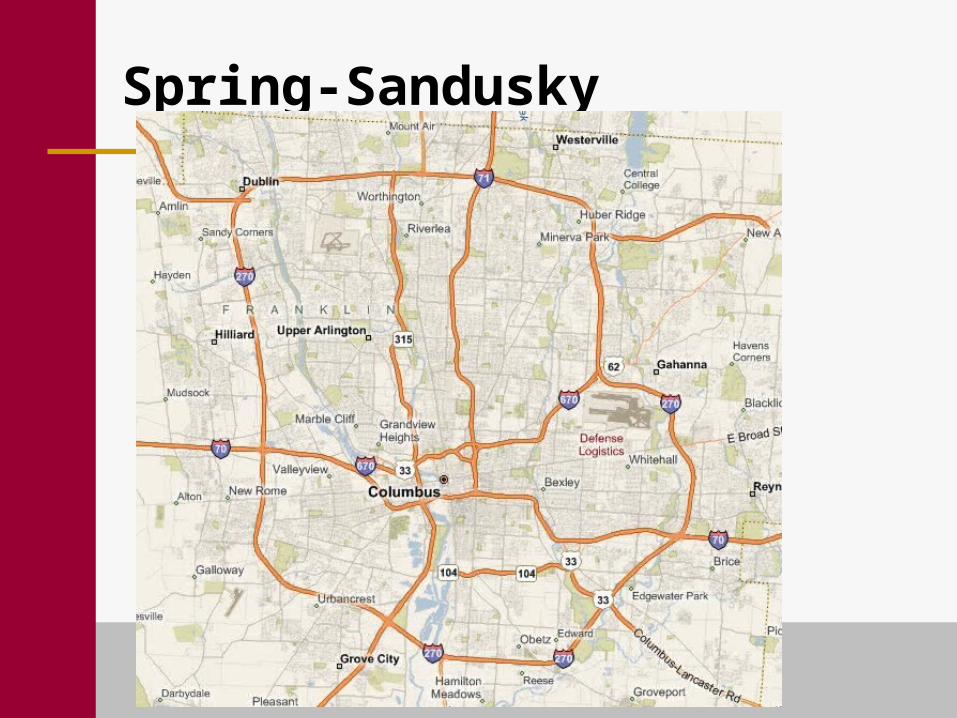
Spring-Sandusky

Spring-Sandusky
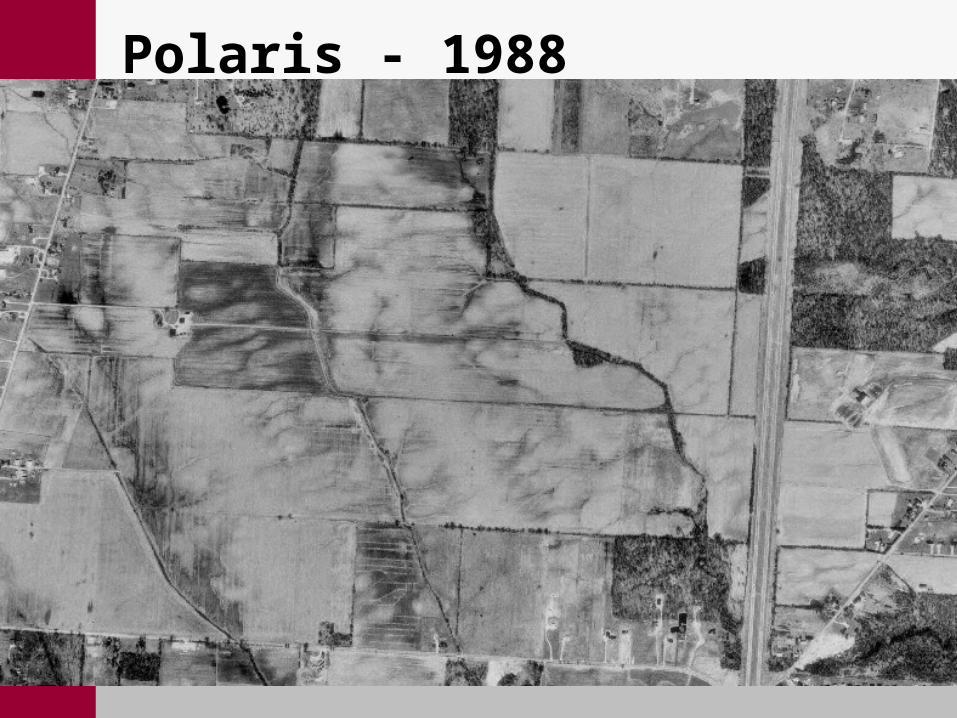
Polaris - 1988
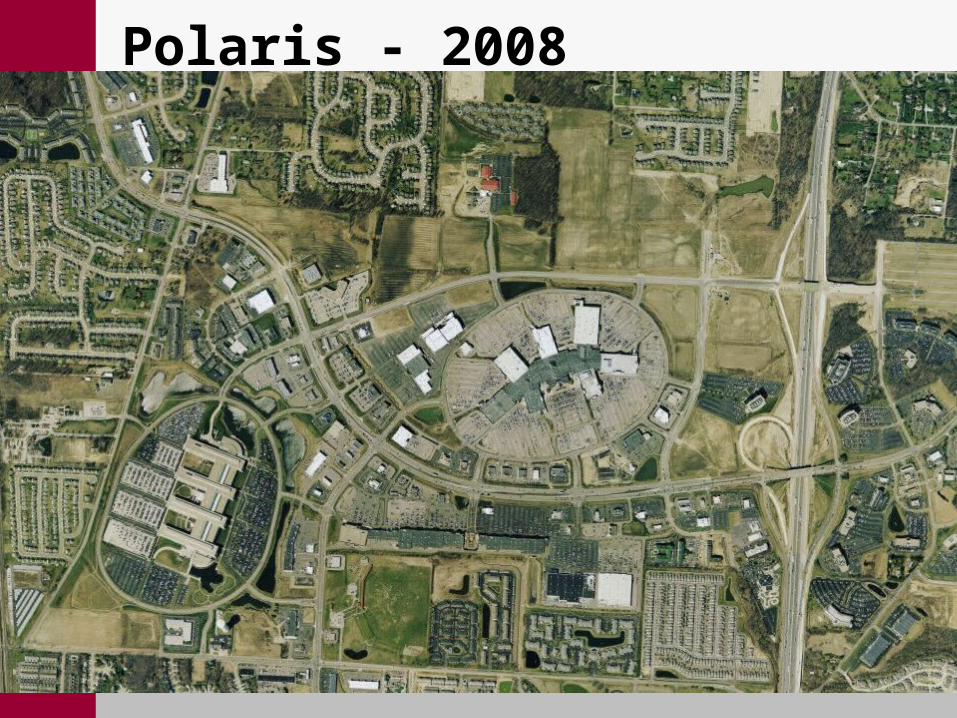
Polaris - 2008
Proposed Before/After Projects
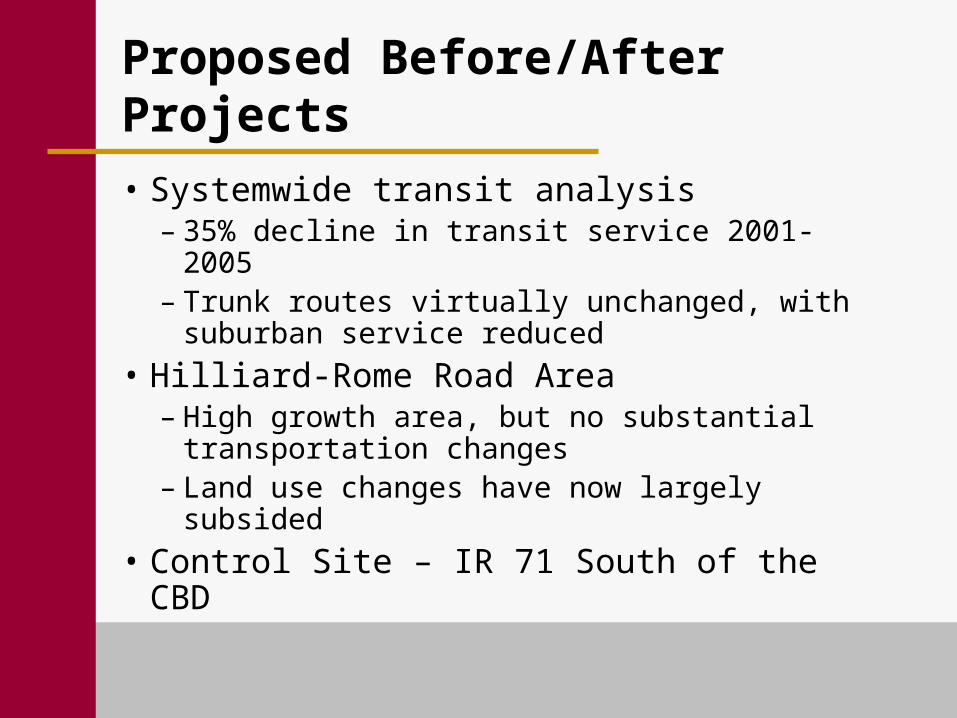
• Systemwide transit analysis– 35% decline in transit service 2001-2005– Trunk routes virtually unchanged, with
suburban service reduced • Hilliard-Rome Road Area
– High growth area, but no substantial transportation changes
– Land use changes have now largely subsided
• Control Site – IR 71 South of the CBD
Traffic Volumes
• Why we care about traffic volumes– 100-200 projects a year that use
the model’s traffic volumes

Contact Information
Rebekah Anderson – [email protected]
Greg Giaimo – [email protected]
David Schmitt – [email protected]