Embed Size (px)
Citation preview
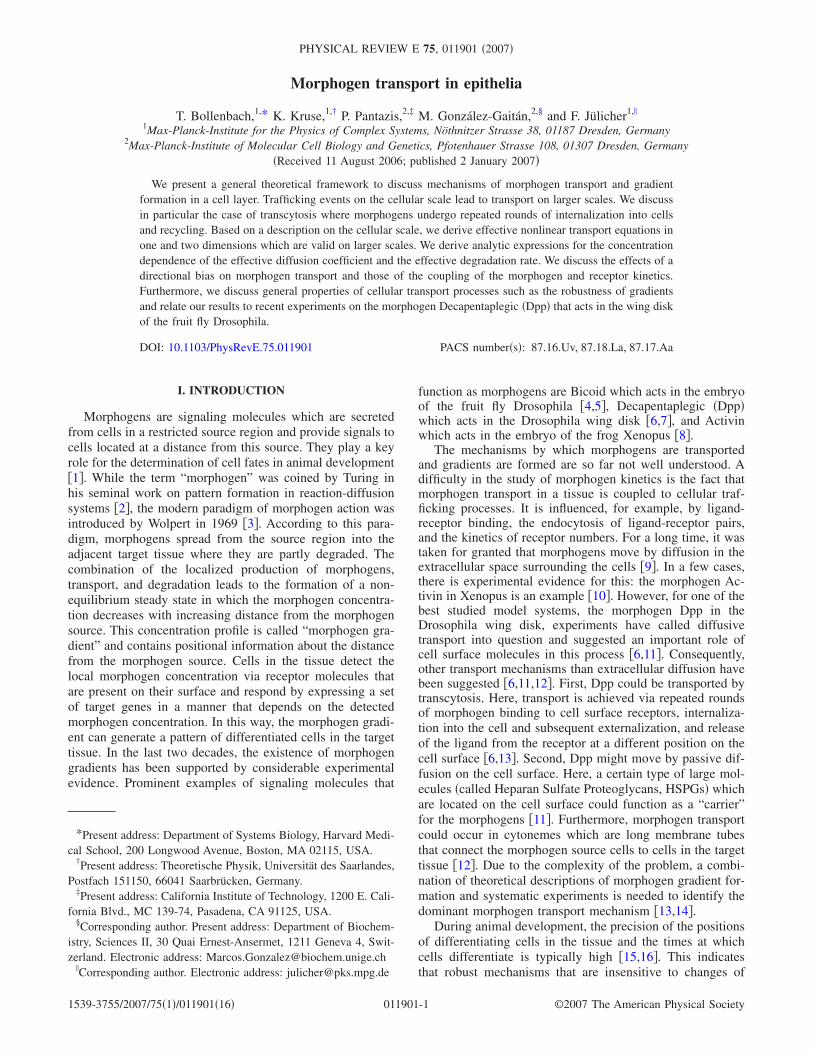
Morphogen transport in epithelia
T. Bollenbach,1,* K. Kruse,1,† P. Pantazis,2,‡ M. González-Gaitán,2,§ and F. Jülicher1,!
1Max-Planck-Institute for the Physics of Complex Systems, Nöthnitzer Strasse 38, 01187 Dresden, Germany2Max-Planck-Institute of Molecular Cell Biology and Genetics, Pfotenhauer Strasse 108, 01307 Dresden, Germany
"Received 11 August 2006; published 2 January 2007#
We present a general theoretical framework to discuss mechanisms of morphogen transport and gradientformation in a cell layer. Trafficking events on the cellular scale lead to transport on larger scales. We discussin particular the case of transcytosis where morphogens undergo repeated rounds of internalization into cellsand recycling. Based on a description on the cellular scale, we derive effective nonlinear transport equations inone and two dimensions which are valid on larger scales. We derive analytic expressions for the concentrationdependence of the effective diffusion coefficient and the effective degradation rate. We discuss the effects of adirectional bias on morphogen transport and those of the coupling of the morphogen and receptor kinetics.Furthermore, we discuss general properties of cellular transport processes such as the robustness of gradientsand relate our results to recent experiments on the morphogen Decapentaplegic "Dpp# that acts in the wing diskof the fruit fly Drosophila.
DOI: 10.1103/PhysRevE.75.011901 PACS number"s#: 87.16.Uv, 87.18.La, 87.17.Aa
I. INTRODUCTION
Morphogens are signaling molecules which are secretedfrom cells in a restricted source region and provide signals tocells located at a distance from this source. They play a keyrole for the determination of cell fates in animal development$1%. While the term “morphogen” was coined by Turing inhis seminal work on pattern formation in reaction-diffusionsystems $2%, the modern paradigm of morphogen action wasintroduced by Wolpert in 1969 $3%. According to this para-digm, morphogens spread from the source region into theadjacent target tissue where they are partly degraded. Thecombination of the localized production of morphogens,transport, and degradation leads to the formation of a non-equilibrium steady state in which the morphogen concentra-tion decreases with increasing distance from the morphogensource. This concentration profile is called “morphogen gra-dient” and contains positional information about the distancefrom the morphogen source. Cells in the tissue detect thelocal morphogen concentration via receptor molecules thatare present on their surface and respond by expressing a setof target genes in a manner that depends on the detectedmorphogen concentration. In this way, the morphogen gradi-ent can generate a pattern of differentiated cells in the targettissue. In the last two decades, the existence of morphogengradients has been supported by considerable experimentalevidence. Prominent examples of signaling molecules that
function as morphogens are Bicoid which acts in the embryoof the fruit fly Drosophila $4,5%, Decapentaplegic "Dpp#which acts in the Drosophila wing disk $6,7%, and Activinwhich acts in the embryo of the frog Xenopus $8%.
The mechanisms by which morphogens are transportedand gradients are formed are so far not well understood. Adifficulty in the study of morphogen kinetics is the fact thatmorphogen transport in a tissue is coupled to cellular traf-ficking processes. It is influenced, for example, by ligand-receptor binding, the endocytosis of ligand-receptor pairs,and the kinetics of receptor numbers. For a long time, it wastaken for granted that morphogens move by diffusion in theextracellular space surrounding the cells $9%. In a few cases,there is experimental evidence for this: the morphogen Ac-tivin in Xenopus is an example $10%. However, for one of thebest studied model systems, the morphogen Dpp in theDrosophila wing disk, experiments have called diffusivetransport into question and suggested an important role ofcell surface molecules in this process $6,11%. Consequently,other transport mechanisms than extracellular diffusion havebeen suggested $6,11,12%. First, Dpp could be transported bytranscytosis. Here, transport is achieved via repeated roundsof morphogen binding to cell surface receptors, internaliza-tion into the cell and subsequent externalization, and releaseof the ligand from the receptor at a different position on thecell surface $6,13%. Second, Dpp might move by passive dif-fusion on the cell surface. Here, a certain type of large mol-ecules "called Heparan Sulfate Proteoglycans, HSPGs# whichare located on the cell surface could function as a “carrier”for the morphogens $11%. Furthermore, morphogen transportcould occur in cytonemes which are long membrane tubesthat connect the morphogen source cells to cells in the targettissue $12%. Due to the complexity of the problem, a combi-nation of theoretical descriptions of morphogen gradient for-mation and systematic experiments is needed to identify thedominant morphogen transport mechanism $13,14%.
During animal development, the precision of the positionsof differentiating cells in the tissue and the times at whichcells differentiate is typically high $15,16%. This indicatesthat robust mechanisms that are insensitive to changes of
*Present address: Department of Systems Biology, Harvard Medi-cal School, 200 Longwood Avenue, Boston, MA 02115, USA.
†Present address: Theoretische Physik, Universität des Saarlandes,Postfach 151150, 66041 Saarbrücken, Germany.
‡Present address: California Institute of Technology, 1200 E. Cali-fornia Blvd., MC 139-74, Pasadena, CA 91125, USA.
§Corresponding author. Present address: Department of Biochem-istry, Sciences II, 30 Quai Ernest-Ansermet, 1211 Geneva 4, Swit-zerland. Electronic address: [email protected]
!Corresponding author. Electronic address: [email protected]
PHYSICAL REVIEW E 75, 011901 "2007#
1539-3755/2007/75"1#/011901"16# ©2007 The American Physical Society011901-1
environmental conditions and to intrinsic fluctuations haveevolved to control cell differentiation. Clearly, such robust-ness could be achieved if morphogen gradients are them-selves robust. Evidence for the robustness of morphogen gra-dients was found in recent experiments $17–19%. Thisrobustness must originate in the mechanisms by which mor-phogens are transported and degraded. The robustness andprecision of morphogen gradients $16,18–21% or a possiblerole of anomalous diffusion in morphogen transport $22% canonly be understood using a combination of theoretical andexperimental efforts.
In this article, we provide a detailed description of mor-phogen gradient formation by different mechanisms and pro-vide full derivations of the morphogen transport equations.Our description captures several processes that are supportedby experimental data for the morphogen Dpp in the Droso-phila wing disk. These experimental findings will be brieflysummarized in Sec. II. While we focus on the wing disk ofthe fruit fly here, these processes are very likely to play animportant role for morphogen gradient formation in otheranimals. Starting from a description of cellular traffickingprocesses, we derive in Sec. III effective transport equationson larger scales. We investigate key properties of gradientformation by these mechanisms in Sec. IV and study theeffects of a directional bias for transport resulting from cel-lular polarity. Finally, we extend our approach to higher di-mensions in Sec. V and discuss morphogen transport in two-dimensional epithelia.
This article extends and complements our recent work onmorphogen gradient formation $20%. In our previous work,we highlighted key results of our analysis, in particular therobustness of steady state gradients formed by transcytosis$20%. Here, we discuss the underlying theoretical frameworkin detail and extend it to higher dimensions and to variousother transport scenarios. For the sake of completeness, webriefly recall some of the results of $20%.
II. MORPHOGEN GRADIENT FORMATIONAND CELLULAR TRAFFICKING PROCESSES
The larva of the fruit fly Drosophila contains precursorsof the organs of the adult animal. The precursor of the flywing is a flat pouch that consists of two cell layers that areconnected at the edges and is called wing disk "see Fig. 1 in$13%#. The thicker one of these cell layers is formed by co-lumnar epithelial cells and includes the so-called wing pri-mordium. In the following, we consider this two-dimensionalcell layer $13,14%. Dpp is produced and secreted in a specificsource region which is a narrow stripe with a width of about7 cell diameters that is located at the center of this layer.Cells outside of this source do not produce Dpp but possessreceptors located at their cell surface to detect its presence.Dpp spreads from the source region into the adjacent targettissue on both sides of the source region. In the whole tissue,Dpp molecules are degraded. As a consequence of the local-ized source and degradation, a graded morphogen profile isbuilt up. This formation of the morphogen gradient can bedirectly observed in experiments by using a Dpp that is la-beled with green fluorescent protein "GFP-Dpp# $6,7%. In
steady state, the Dpp gradient extends over 50 !m into thetarget tissue. This corresponds to about 20 cell diameters.
Several cellular processes are relevant during the forma-tion of this morphogen gradient. Morphogens are ligandswhich bind to specific receptor molecules. Ligand-receptorpairs are internalized into the cell via endocytosis. Internal-ized ligands are either degraded or they can be recycled tothe cell surface via exocytosis. Finally, receptor-ligand pairscan diffuse on the cell surface $23% and free ligands candiffuse in the extracellular space surrounding the cells.
Furthermore, cells in the wing disk produce, degrade, ex-ternalize, and internalize receptor molecules. In general, theproduction rate of these receptors is affected by the localmorphogen concentration. For example, a high Dpp concen-tration leads to a reduced production rate of the Dpp receptorThick-veins "Tkv# in the wing disk $7%. This behavior iscalled “receptor down-regulation.” The opposite behaviorcan also occur: high concentrations of Hedgehog, anothermorphogen acting in the wing disk, lead to an increased pro-duction of its receptor Patched $24%. This phenomenon iscalled “receptor up-regulation.”
Recent experiments have revealed the interplay of Dppgradient formation and cellular trafficking. First, endocytosishas been blocked in the whole wing disk except for the Dppsource region or, alternatively, in smaller patches of cells"clones# in the tissue $6,13%. This has been achieved usingmutant flies in which endocytosis can be blocked at an el-evated temperature of 34 °C due to the temperature-sensitivemutation shibire. Five hours upon blocking endocytosis inthe whole target tissue, GFP-Dpp fluorescence was almostundetectable in the target tissue while its gradient extendedvisibly over more than 20 cell diameters into this tissue be-fore the endocytic block. When endocytosis was onlyblocked in patches of cells near the Dpp source region, apronounced transient depletion of the GFP-Dpp concentra-tion behind these clones was observed. Both experimentsindicate a role of endocytosis in Dpp transport. This suggeststhat instead of simply diffusing in the extracellular space,Dpp is transported via the cell interior in repeated rounds ofendocytosis and exocytosis. This transport mechanism iscalled transcytosis $6%. Indeed, a theoretical description inwhich morphogen transport is solely based on extracellulardiffusion while interactions of the morphogen with its recep-tors are taken into account was found to be inconsistent withthe experimental observations $13%.
In a different set of experiments, the role of large cellsurface molecules "HSPGs# in morphogen transport was in-vestigated $11%. A depletion of extracellular Dpp was ob-served behind mutant clones of cells which lack HSPGs.This indicates a role of HSPGs in Dpp transport. Indeed, ithas been suggested that HSPGs facilitate the diffusion ofmorphogens on the cell surface $11%.
III. MORPHOGEN TRANSPORT IN ONE DIMENSION
We introduce a discrete description of morphogen trans-port by transcytosis and passive extracellular diffusion andderive transport equations for these processes. The theoreti-cal description developed here is generally applicable to bio-
BOLLENBACH et al. PHYSICAL REVIEW E 75, 011901 "2007#
011901-2
logical systems in which molecules are transported by extra-cellular diffusion and transcytosis. To stress this generality,we will mostly refer to the transported molecules as“ligands” instead of “morphogens.”
A. Ligand kinetics in a chain of cells
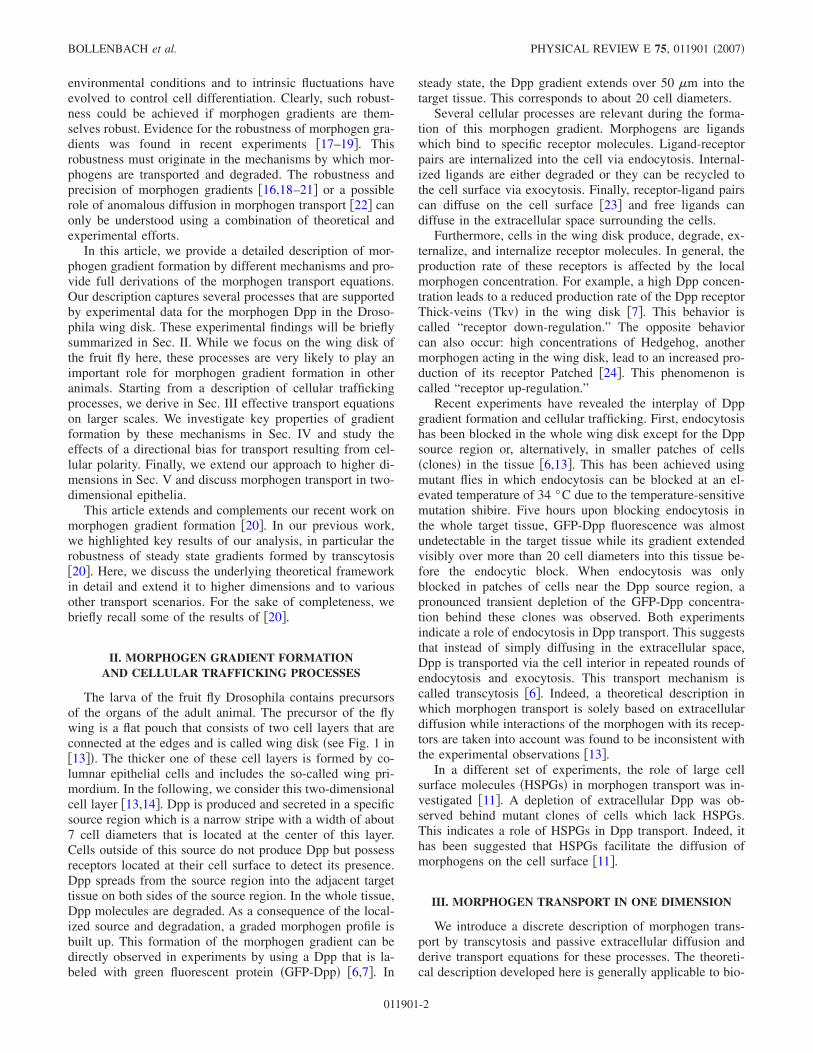
In one space dimension, we describe the ligand kinetics ina chain of cells, see Fig. 1. We denote the distance betweenthe centers of two neighboring cells by a and the width of thegap between two cells by b. In this chain, n indexes the cells,see Fig. 1. The number of free extracellular ligands betweencells n and n+1 is denoted Ln. The numbers of intracellularfree and ligand-bound receptors are denoted Rn
"i# and Sn"i#,
respectively. Rn"l# and Rn
"r# denote the concentrations of freereceptors on the left and right cell surfaces, respectively. Sn
"l#
and Sn"r# denote the ligand-bound receptors accordingly. The
kinetics of the ligand and receptor numbers are given by
d
dtLn = koff"Sn
"r# + Sn+1"l# # ! kon"Rn
"r# + Rn+1"l# #Ln
+D0
a2 "Ln+1 + Ln!1 ! 2Ln# ! edegLn,
d
dtRn
"r# =fsyn
2+ koffSn
"r# ! konRn"r#Ln ! f intRn
"r# +fext
2Rn
"i#,
d
dtSn
"r# = ! koffSn"r# + konRn
"r#Ln ! bintSn"r# +
bext
2Sn
"i#,
d
dtRn
"l# =fsyn
2+ koffSn
"l# ! konRn"l#Ln!1 ! f intRn
"l# +fext
2Rn
"i#,
d
dtSn
"l# = ! koffSn"l# + konRn
"l#Ln!1 ! bintSn"l# +
bext
2Sn
"i#,
d
dtRn
"i# = ! fextRn"i# + f int"Rn
"l# + Rn"r## ! fdegRn
"i#,
d
dtSn
"i# = ! bextSn"i# + bint"Sn
"l# + Sn"r## ! bdegSn
"i#. "1#
Here, the binding and un-binding of ligands to and fromreceptors is characterized by rates kon and koff. The internal-ization and externalization of receptor-ligand complexes iscaptured by the rates bint and bext. Free ligands can hop di-rectly from one gap between the cells to the adjacent ones ata rate 2D0 /a2. This describes their free diffusion in the ex-tracellular space around the cells with diffusion coefficientD0. The degradation of ligands in the extracellular space oc-curs with rate edeg and that of ligands bound to receptorsinside the cell with rate bdeg. Furthermore, free receptors areinternalized and externalized with rates f int and fext, respec-tively. Internalized free receptors are degraded with rate fdeg.In addition, each cell produces receptors with a rate fsyn.
Newly produced receptors appear on the cell surface $25%.The rate of receptor synthesis fsyn in Eq. "1# depends onRn
"l#+Rn"r# and Sn
"l#+Sn"r#:
fsyn = fsyn0 &1 !
Rn"l# + Rn
"r# + ""Sn"l# + Sn
"r##Rmax
' , "2#
where fsyn0 is a basal rate of receptor synthesis and Rmax is the
saturation value of the surface receptor concentration atwhich the production of new receptors stops. The dimension-less parameter " couples receptor synthesis to the concentra-tion of morphogens. The two cases of receptor up- anddown-regulation $25% are captured by "#1 and "$1, re-spectively.
The description "1# is valid in the bulk of the system. Westill have to specify the kinetics at the boundaries of thechain. To describe the effects of a ligand source located atn=0 in Eq. "1#, we modify the equation for the free ligand:
d
dtL0 = koffS1
"l# ! konR1"l#L0 +
D0
a2 "L1 ! L0# ! edegL0 + % , "3#
where % is the rate at which ligands from the source enter thesystem. At the position n=N where the lattice ends, we im-pose
d
dtLN = koffSN
"r# ! konRN"r#LN +
D0
a2 "LN!1 ! LN# ! edegLN, "4#
which describes a zero flux boundary condition at this edgeof the lattice. This boundary condition can be motivated bythe geometry of the Drosophila wing disk $13%. However, ifN is sufficiently large the ligand number at N is small and thechoice of boundary condition has only a small influence onthe ligand profile. A sequence of morphogen and receptorprofiles at different times that were obtained by numericalsolution of Eq. "1# are presented in Fig. 2 together with thesteady state profiles that represent the morphogen gradient.
FIG. 1. Schematic representation of ligand transport by transcy-tosis in a chain of cells of diameter a indexed by n. The rates ofligand-receptor binding and un-binding, internalization and exter-nalization of ligand-receptor pairs are denoted kon, koff, bint, and bext.Degradation of ligand occurs inside the cells with rate bdeg and inthe extracellular space with rate edeg. Ligands can also hop directlybetween neighboring extracellular spaces at a rate 2D0 /a2 whichdescribes their movement in the extracellular space around the cellsby passive diffusion with diffusion coefficient D0 "not shown#. Fig-ure modified from $20% .
MORPHOGEN TRANSPORT IN EPITHELIA PHYSICAL REVIEW E 75, 011901 "2007#
011901-3

B. Effective transport equations on larger scales
We derive effective continuum transport equations forligand transport starting from Eq. "1#. We introduce theconcentrations l"t ,x#=Ln"t# /a, r"l#"t ,x#=Rn
"l#"t# /a, r"r#"t ,x#=Rn
"r#"t# /a, ri"t ,x#=Rn"i#"t# /a, s"l#"t ,x#=Sn
"l#"t# /a, s"r#"t ,x#=Sn
"r#"t# /a, and si"t ,x#=Sn"i#"t# /a where x=na. We derive con-
tinuum equations for the kinetics of these densities startingfrom Eq. "1# by locally expanding the densities in a powerseries with respect to x, for example, Ln+1 /a= l"x+a#= l"x#+a!xl"x#+a2!x
2l"x# /2. It is further useful to introduce thenew variables r±"t ,x#=r"l#"t ,x#±r"r#"t ,x# and s±"t ,x#=s"l#"t ,x#±s"r#"t ,x# so that r+ and s+ measure the total freeand ligand bound surface receptor concentrations per cell andr! and s! the polarization of these concentrations on the cellsurface, respectively.
In situations where the length &D over which the steadystate gradient decays is large compared to the cell diametera, a separation of time scales occurs in the system whichmakes the adiabatic elimination of rapid variables possible.Indeed, if 'a is the relaxation time of the kinetics within onecell, the slow relaxation of the gradient occurs on a timescale '&D
='a"&D /a#2('a. We thus use the approximation thatall local kinetics relaxes instantaneously. At each position x,this yields the relations
l =koffs+
konar+,
si =bints+
bext,
s! =konalr! !
abkon
2r+!xl +
"a ! b#bext
2!xsi
bint + koff,
ri =f intr+
fext,
r! =koffs! +
abkon
2r+!xl +
"a ! b#fext
2!xri
f int + konal. "5#
Using these expressions, we can adiabatically eliminatefive of the seven variables l ,si ,s+ ,s! ,ri ,r+ ,r! and obtainonly two coupled equations for the remaining slow variableswhich are the total ligand density )"x , t#= l"x , t#+si"x , t#+s+"x , t# and the total receptor density *"x , t#=ri"x , t#+r+"x , t#+si"x , t#+s+"x , t#:
!t) = !x„D)"),*#!x) + D*"),*#!x*… ! k)"),*#) , "6#
!t* = %syn"),*# ! k*"),*#* . "7#
The other densities l ,si ,s+ ,s! ,ri ,r+ ,r! can be calculatedfrom ), *, and their first spatial derivatives via Eq. "5#. Thederivation of Eqs. "5#–"7# is discussed in Appendix A. Inaddition to Eqs. "6# and "7#, this procedure provides us with
FIG. 2. "Color online# Time development of gradient formation in our description of ligand transport. Ligand densities in the presence ofa source at x=0 at different times tbdeg=0.72,2.16,3.6 during gradient formation "black lines# and in steady state "red lines#. Lines indicatesolutions to Eq. "6#, while symbols indicate solutions to Eq. "1# for comparison. "a–c# Time development of the profiles of the total liganddensity )"x , t# "a#, the total receptor density *"x , t# "b#, and the receptor bound ligand density si"x , t#+s+"x , t# "c# in the absence ofextracellular diffusion, i.e., for D0=0. "d# Like "a# but with 2D0 /a2bdeg=10/3, i.e., in the presence of extracellular diffusion. All concen-trations are normalized to the steady state value of the surface receptor concentration in the absence of ligands r0. Initial conditions at t=0: )"x#=0 and *"x#= "1+ f int / fext#r0. Parameters are koff /bdeg=bint /bdeg= f int /bdeg=1000/3, konarmax/bdeg=8000/3, bext /bdeg= fext /bdeg=2000/3, edeg/bdeg=2/3, fdeg/bdeg=1, fsyn
0 /armaxbdeg=1/12, "=2, j0 /bdegarmax=25/6, r0 /rmax=1/7, and j=0 at x /a=50.
BOLLENBACH et al. PHYSICAL REVIEW E 75, 011901 "2007#
011901-4
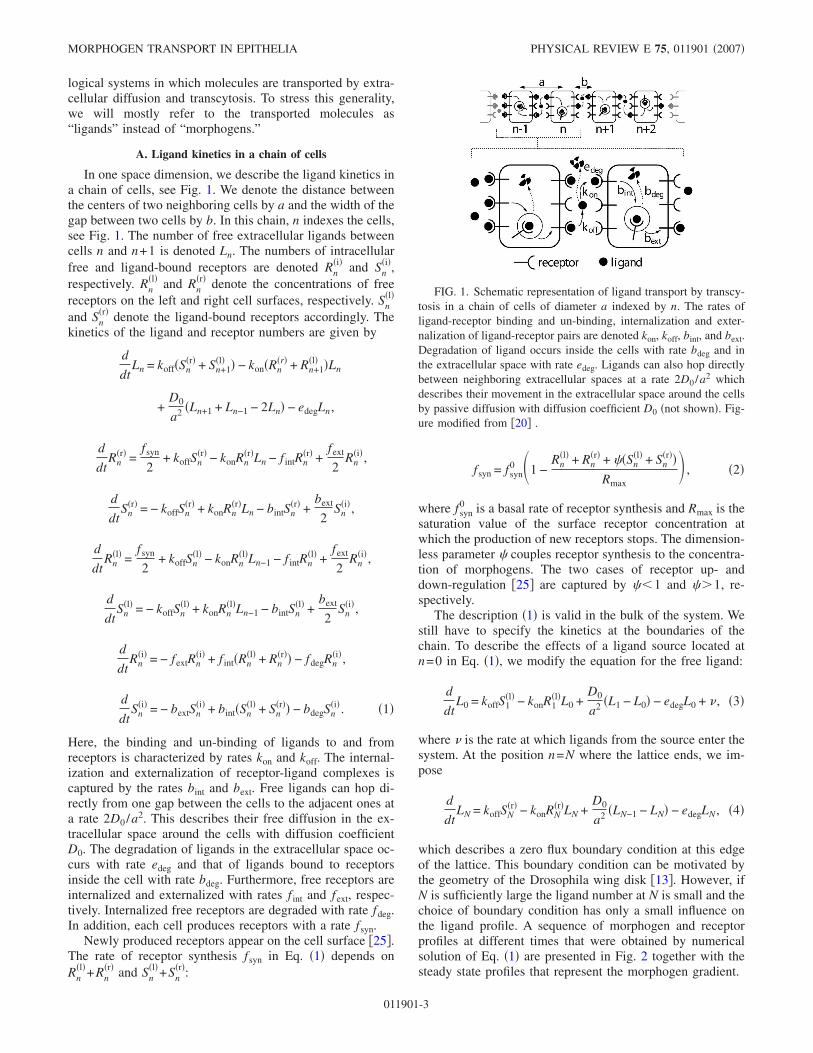
explicit expressions for the effective diffusion coefficient D),the effective degradation rate k), the receptor degradationrate k* as well as the transport coefficient D* which describesligand transport induced by gradients of the receptor concen-tration, see Eq. "A6#. In Figs. 3"a# and 3"b#, the coefficientsD), D*, and k) are displayed as a function of the ligand
concentration ) for a typical choice of parameters. The ef-fective receptor production rate %syn") ,*#= fsyn/a is a func-tion of the ligand and receptor concentrations. The functionalform of %syn that corresponds to the receptor production rate"2# in the discrete description is
%syn"),*# =fsyn
0
a&1 !
r+"),*# + "s+"),*#rmax
' , "8#
with rmax=Rmax/a. Ligand transport is associated with thecurrent j=!$D)") ,*#!x)+D*") ,*#!x*%. The current j0 at x=0 is related to the secretion rate % in Eq. "3#. In one dimen-sion j0=%.
In Fig. 2 we show time-dependent receptor and ligandprofiles which are solutions to Eqs. "6# and "7#. These solu-tions are in agreement with the corresponding solutions tothe discrete description "1# which validates the adiabatic ap-proximation made in the derivation of Eqs. "6# and "7#.
C. Effects of a directional bias
If cells possess a polarity, transcytosis can have a bias andlead to directed transport. Here, we include a directional biasin our description of ligand transport. Experiments indicatethat the transport of the morphogen Dpp in the Drosophilawing disk is nondirectional on macroscopic length scales $6%.However, epithelia with cell polarity could in principle ex-hibit directional transcytosis.
We therefore generalize the discrete description "1# byallowing receptor-bound ligand molecules to be preferen-tially externalized on either the left or the right cell surface.To this end, we introduce a dimensionless parameter + whichmeasures this bias: for +=!1/2, all receptor-bound ligandsare externalized on the left surface, for +=1/2 on the rightsurface, and for +=0, we recover the unbiased description,see Appendix B for details.
In the presence of such a bias, the transport equations "6#and "7# generalize to
!t) = !x„D)"),*#!x) + D*"),*#!x* ! V+"),*#)… ! k)"),*#) ,
!t* = %syn"),*# ! k*"),*#* , "9#
where V+") ,*# is a concentration-dependent effective driftvelocity, see Eq. "B3#. The other coefficients in Eq. "9# re-main the same as in the case without directional bias. In Fig.4"a#, we show V+ as a function of ) for +=0.1, i.e., a biasthat leads to preferential transport to the right. Typical ligandand receptor profiles that are generated in the presence of abias are shown in Figs. 4"b# and 4"c#.
D. Constant surface receptor concentration
We now discuss the simple case where the total surfacereceptor number R is constant everywhere. This approxima-tion is useful because it still captures most important featuresof morphogen transport by transcytosis $20%.
In this case the receptor kinetics in Eq. "1# becomes ob-solete. The equations describing ligand transport in thissimple case are
FIG. 3. Effective transport coefficients and degradation rates fortranscytosis. "a,b# Coefficients D)") ,*#, D*") ,*#, and k)") ,*# inthe transport equation "6# as a function of the dimensionless ratio) /* of the total ligand concentration ) and the total receptor con-centration *. The solid lines show the coefficients D) and D* inpresence of extracellular diffusion with 2D0 /a2bdeg=10/3. Brokenlines show these coefficients in the absence of extracellular diffu-sion, i.e., with D0=0. Inset in "a#: the solid line shows k) withedeg/bdeg=2/3 and the broken line with edeg=0. *0 denotes thesteady state total receptor concentration in the absence of ligands."c# Effective diffusion coefficient D")# in the transport equation forthe constant surface receptor approximation "11# as a function of theligand concentration ) /r for 2D0 /a2bdeg=10/3 "solid line# and D0=0 "dashed line#. Inset: effective degradation rate k")# as a functionof ) /r for edeg=0 "dashed line# and edeg/bdeg=2/3 "solid line#. Theconstant total surface receptor concentration is denoted r. Param-eters as in Fig. 2 with kona* /bdeg=8000/3 in "a# and "b# andkonar /bdeg=8000/3 in "c#.
MORPHOGEN TRANSPORT IN EPITHELIA PHYSICAL REVIEW E 75, 011901 "2007#
011901-5

d
dtLn = koff"Sn
"r# + Sn+1"l# # ! kon"R ! Sn
"r# ! Sn+1"l# #Ln
+D0
a2 "Ln+1 + Ln!1 ! 2Ln# ! edegLn,
d
dtSn
"r# = ! koffSn"r# + kon&R
2! Sn
"r#'Ln ! bintSn"r# +
12
bextSn"i#,
d
dtSn
"l# = ! koffSn"l# + kon&R
2! Sn
"l#'Ln!1 ! bintSn"l# +
12
bextSn"i#,
d
dtSn
"i# = ! bextSn"i# + bint"Sn
"l# + Sn"r## ! bdegSn
"i#. "10#
Boundary conditions analogous to Eqs. "3# and "4# are im-posed at n=0 and n=N.
If the surface receptor concentration is constant, the con-tinuum limit after adiabatic elimination of fast variables isdescribed by
!t) = !x„D")#!x)… ! k")#) , "11#
where the effective diffusion coefficient D")# in the absenceof extracellular diffusion "for D0=0# and the effective deg-radation rate k")# are given by
D")# =a2bextbintkoffakonrC!")#
4A")#$2akonrkoff"bext + bint# + bintC!")#%,
k")# =C+")#akon)
& bdegbint
2bext"bext + bint#+
edegkoff
C!")# ' . "12#
In these expressions, r=R /a and
A")# = (! 4bext"bext + bint#a2kon2 r)
+ $bintakonr + bextB+")#%2)1/2,
B±")# = koff + akon") ± r#
C±")# = bintakonr , A")# ± bextB±")# .
These coefficients D")# and k")# are shown as a function of) in Fig. 3"c#. Their nonlinear dependence on the total ligandconcentration ) is very similar to that of the coefficientsD)") ,*# and k)") ,*# in Eq. "6#, see Fig. 3"a#.
We can describe transport by diffusion of receptor-boundligands in the cell membrane by the same methods. We dis-cuss this mechanism in Appendix D where we consider thecase where endocytosis and recycling are unimportant. Fur-thermore, we have so far discussed the case where extracel-lular diffusion is weak "D0 small#. The opposite case inwhich extracellular diffusion dominates ligand transport isdiscussed in Appendix E.
IV. PROPERTIES OF TRANSPORT BY TRANSCYTOSIS
A. Nonlinear diffusion and degradation
Several key features of transcytosis follow directly fromthe general shape of the transport equations "6# and "7# and
from the dependence of the transport and degradation coef-ficients on the ligand and receptor concentrations. First, thepresence of the term D*") ,*#!x* in Eq. "6# shows that gra-dients of the receptor concentration induce a ligand currentthat is directed toward higher receptor concentrations sinceD*#0. This contribution to the current comes up because theligand affinity for a region increases with the receptor con-centration in that region. For small ligand concentrationsD**), which ensures that the corresponding current van-ishes. Furthermore, D) and k) in Eq. "6# approach finite val-ues for small ). In this limit, Eq. "6# consequently becomes alinear diffusion equation with degradation. This implies that
FIG. 4. "Color online# Ligand transport by transcytosis with adirectional bias. "a# Drift velocity V+ from Eq. "B3# as a function of) /*. "b, c# Time development of gradient formation with directionalbias. Profiles of the total ligand concentration )"x , t# "b# and thetotal receptor concentration *"x , t# "c# in the presence of a source atx=0 at different times tbdeg=0.72,2.16,3.6 during gradient forma-tion "black lines# and in steady state "red lines#. Lines indicatesolutions to Eq. "9#, while symbols indicate solutions to Eq. "B1#for comparison. All concentrations are normalized to the steadystate value of the surface receptor concentration in the absence ofligands r0. Initial condition: )"x#=0 and *"x#= "1+ f int / fext#r0. Pa-rameters as in Fig. 2 with +=0.1, D0=0, and j=0 at x /a=100.
BOLLENBACH et al. PHYSICAL REVIEW E 75, 011901 "2007#
011901-6

on large length scales and for small ligand concentrations,transcytosis is indistinguishable from passive diffusion.
In the opposite limit of large ligand concentrations ), D),and k) exhibit the asymptotic behavior
D) + D0 + c1"*#)!2
and k)+edeg+c2"*#)!1. Here D0 is the extracellular diffusioncoefficient which is approached in the limit of large ), andwe have defined c1"*#=abextf intkoff* /4kon"bext+bint# andc2"*#=bdegbint* / "bext+bint#. The transport coefficient
D* + ! D0 ! c1"*#)!2
in this limit. Interestingly, both D) and ,D*, approach thevalue D0. This implies that transport is dominated by extra-cellular diffusion for large ligand concentrations ). This be-havior results from the fact that most receptors are occupiedand can consequently not participate in ligand transport bytranscytosis. A maximum of D) can occur for intermediatevalues of ) as long as D0 is smaller than a critical value, seeFig. 3"a#. Similarly, there can be a minimum of D* as afunction of ), see Fig. 3"b#. The observation that ligandtransport is most efficient at a specific ligand concentration )is an interesting consequence of the nonlinearities of thetransport process.
In the special case D0=0, D* as well as D) vanish in theabsence of receptors, i.e., for *=0, or if either binding orunbinding of ligands from the receptor, internalization, orexternalization of occupied or free receptors is suppressed,i.e., if either one of the rates kon, koff, bint, bext, f int, or fextvanishes. This reflects that in the absence of extracellulardiffusion, transport is generated by repeated internalizationand externalization of ligand-bound receptors as well asligands binding to and unbinding from surface receptors. Inthe limit of fast internalization or fast unbinding, the ligandsare confined to the cell interior or the extracellular space,respectively, and transport is consequently hampered. Indeedfor D0=0, D)!0 if bint!- or if koff!-. We discuss otherlimits of our description in Appendix C.
Similarly, if transcytosis has a directional bias, the effec-tive drift velocity V+ vanishes if either *, kon, koff, bint, bext,f int, or fext is zero and also for bint!- or koff!-. Moreover,the drift velocity V+ is independent of D0. For small ), V+adopts a finite value. ,V+, is a monotonically decreasingfunction of ) and, in the limit of large ), V+ vanishes asV++c3"*#)!2, with c3"*#=+bextf intkoff* / $"bext+bint#kon%, seeFig. 4"a#. The fact that V+ vanishes asymptotically for large) again reflects that transport is mediated by receptors whichare only present in limited numbers.
B. Steady state concentration profile
We now calculate the steady state ligand profile formed inthe half-space x.0 in the presence of a source which islocated at x#0. In the steady state, Eq. "7# with the condi-tion !t*=0 yields a relation *"x#=*s")"x## between the totalreceptor concentration * and the total ligand concentration )at position x. This combined with Eq. "6# leads to the steadystate equation for the ligand profile
!x„Ds")#!x)… ! ks")#) = 0, "13#
with the effective diffusion coefficient in the steady stateDs")#=D)") ,*s")##+D*") ,*s")##d*s")# /d) and the effec-tive degradation rate ks")#=k)") ,*s")##. The steady state re-lation *s")# is a monotonic function of ) and converges tofinite values *- for )!- and *0 for )!0. This reflects thateach cell only contains a limited number of receptors and isnever completely devoid of receptors. It implies thatd*s /d)=0 for large ), so that in this limit Ds")#+D)") ,*-#.
The steady state ligand profile )"x# described by Eq. "13#can be determined exactly. We rewrite Eq. "13# as
!xjs = ! ks")#) ,
!x) = !js")#Ds")#
,
where the steady state current js is a function of )"x# only.This implies
djs")#d)
=ks")#)Ds")#
js")#,
dx")#d)
= !Ds")#js")#
, "14#
where x")# is the inverse function of the steady state ligandprofile )"x#. Using Eq. "14#, we find the steady state solution
x = ! -)"0#
)"x#
d)!Ds")!#/js")!# , "15#
where the steady state current is
js")# = &2-0
)
d)!ks")!#Ds")!#)!'1/2
. "16#
In the steady state, the total ligand concentration decreasesmonotonically with increasing distance to the source. Forsmall ), the ligand profile decays as )*exp"!x /&# with &=.Ds"0# /ks"0#. For large ligand concentrations )()T and inthe absence of free diffusion "i.e., for D0=0#, the current jsbehaves asymptotically as
js2")# + js")T#2 + 2edegc1"*-#ln")/)T#
+ 2c1"*-#c2"*-#"1/)T ! 1/)# .
Here, )T denotes a crossover value beyond which theasymptotic behavior becomes valid. Therefore, the currentdiverges logarithmically as js
2+2c1"*-#edeg ln ) for large )and edeg$0.
This behavior of js has interesting implications for thesteady state ligand concentration: )"x# is characterized by asingularity which occurs at a position x*#0 that moves to-ward x=0 as )"0# becomes large. In the vicinity of x*, )"x#behaves as
MORPHOGEN TRANSPORT IN EPITHELIA PHYSICAL REVIEW E 75, 011901 "2007#
011901-7
) * "x ! x*#!1$! ln"x ! x*#%!1/2. "17#
Note, that the case edeg=0 has to be discussed separately. Inthis case, the current reaches for large ) a finite maximalvalue jmax and the steady state profile diverges as
) + c1"*-#/"x ! x*#jmax. "18#
If extracellular diffusion is present, i.e., if D0$0, Ds")# inEq. "13# changes its asymptotic behavior to Ds+c1"*-# /)2
+D0. For large )$)D with )D+$c1"*-# /D0%1/2, Eq. "13# be-comes linear and the steady state solution decays exponen-tially on a length scale &d=.D0 /edeg. The nonlinear behaviordescribed by Eqs. "17# and "18# is thus valid for )T#)#)D.
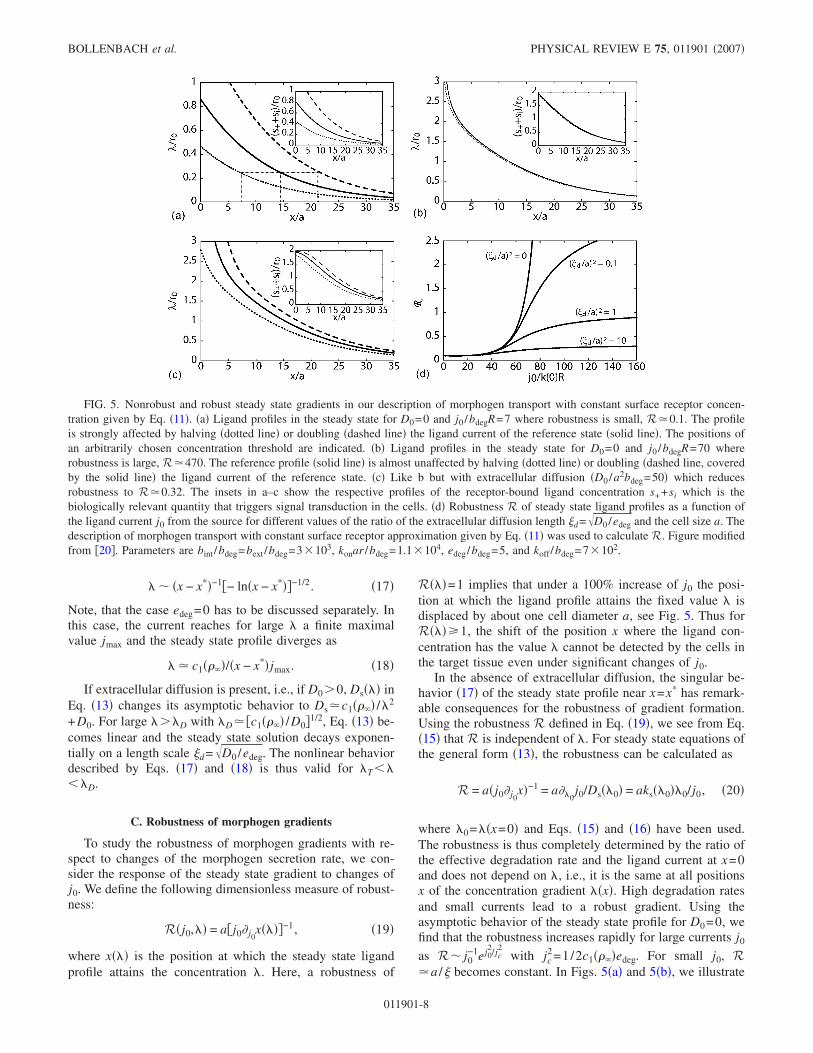
C. Robustness of morphogen gradients
To study the robustness of morphogen gradients with re-spect to changes of the morphogen secretion rate, we con-sider the response of the steady state gradient to changes ofj0. We define the following dimensionless measure of robust-ness:
R"j0,)# = a$j0! j0x")#%!1, "19#
where x")# is the position at which the steady state ligandprofile attains the concentration ). Here, a robustness of
R")#=1 implies that under a 100% increase of j0 the posi-tion at which the ligand profile attains the fixed value ) isdisplaced by about one cell diameter a, see Fig. 5. Thus forR")#.1, the shift of the position x where the ligand con-centration has the value ) cannot be detected by the cells inthe target tissue even under significant changes of j0.
In the absence of extracellular diffusion, the singular be-havior "17# of the steady state profile near x=x* has remark-able consequences for the robustness of gradient formation.Using the robustness R defined in Eq. "19#, we see from Eq."15# that R is independent of ). For steady state equations ofthe general form "13#, the robustness can be calculated as
R = a"j0! j0x#!1 = a!)0
j0/Ds")0# = aks")0#)0/j0, "20#
where )0=)"x=0# and Eqs. "15# and "16# have been used.The robustness is thus completely determined by the ratio ofthe effective degradation rate and the ligand current at x=0and does not depend on ), i.e., it is the same at all positionsx of the concentration gradient )"x#. High degradation ratesand small currents lead to a robust gradient. Using theasymptotic behavior of the steady state profile for D0=0, wefind that the robustness increases rapidly for large currents j0
as R* j0!1ej0
2/jc2
with jc2=1/2c1"*-#edeg. For small j0, R
+a /& becomes constant. In Figs. 5"a# and 5"b#, we illustrate
FIG. 5. Nonrobust and robust steady state gradients in our description of morphogen transport with constant surface receptor concen-tration given by Eq. "11#. "a# Ligand profiles in the steady state for D0=0 and j0 /bdegR=7 where robustness is small, R+0.1. The profileis strongly affected by halving "dotted line# or doubling "dashed line# the ligand current of the reference state "solid line#. The positions ofan arbitrarily chosen concentration threshold are indicated. "b# Ligand profiles in the steady state for D0=0 and j0 /bdegR=70 whererobustness is large, R+470. The reference profile "solid line# is almost unaffected by halving "dotted line# or doubling "dashed line, coveredby the solid line# the ligand current of the reference state. "c# Like b but with extracellular diffusion "D0 /a2bdeg=50# which reducesrobustness to R+0.32. The insets in a–c show the respective profiles of the receptor-bound ligand concentration s++si which is thebiologically relevant quantity that triggers signal transduction in the cells. "d# Robustness R of steady state ligand profiles as a function ofthe ligand current j0 from the source for different values of the ratio of the extracellular diffusion length &d=.D0 /edeg and the cell size a. Thedescription of morphogen transport with constant surface receptor approximation given by Eq. "11# was used to calculate R. Figure modifiedfrom $20%. Parameters are bint /bdeg=bext /bdeg=3/103, konar /bdeg=1.1/104, edeg/bdeg=5, and koff /bdeg=7/102.
BOLLENBACH et al. PHYSICAL REVIEW E 75, 011901 "2007#
011901-8
the behavior of the robustness of steady state gradients for asmall and a large value of j0.
The situation is different if free diffusion in the extracel-lular space is present. As discussed in the previous section,the singularity in the steady state solution disappears forD0$0. As a result of this, the robustness approaches a finitevalue Rmax=a /&d as j0!-. In Fig. 5"d#, R"j0# is shown fordifferent values of &d /a and Fig. 5"c# shows an example forthe effect of the presence of extracellular diffusion on therobustness of the gradient.
In summary, we find that morphogen gradients can beextremely robust to changes in the morphogen secretion rateof the source cells if transport is dominated by transcytosis.The presence of extracellular diffusion reduces this robust-ness that is completely lost when extracellular diffusion isthe dominant transport mechanism.
V. MORPHOGEN TRANSPORT IN TWO DIMENSIONS
A. Ligand kinetics on the cellular scale
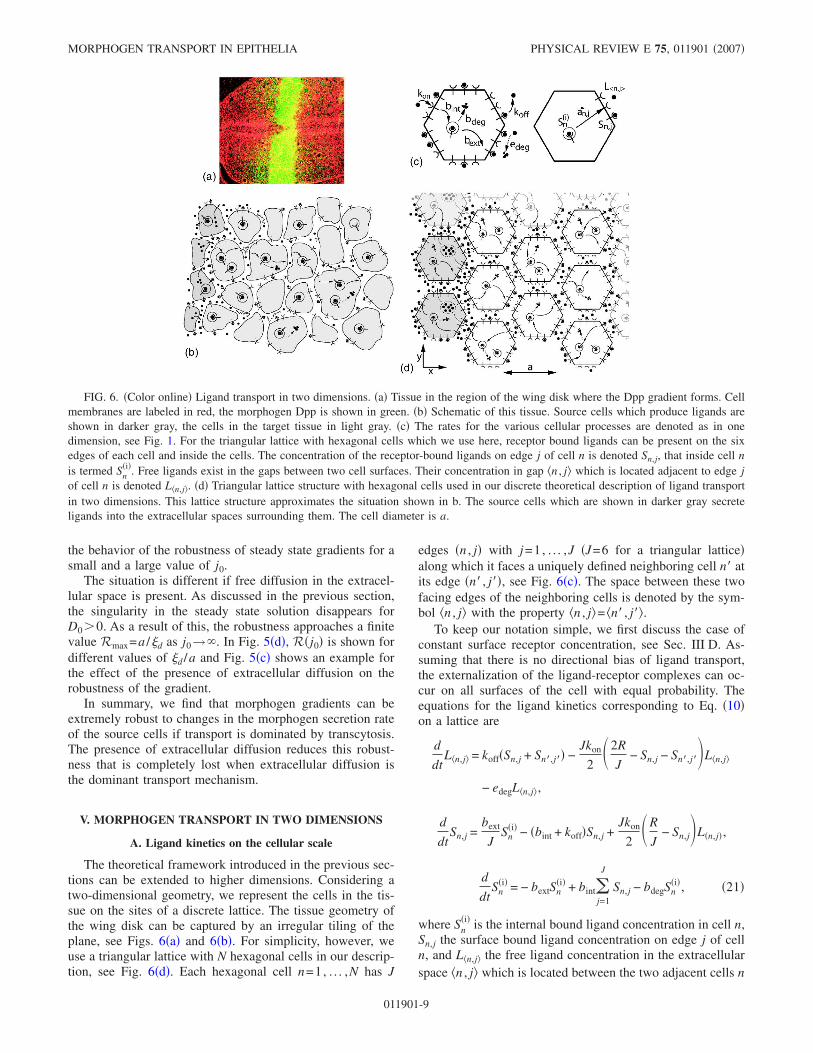
The theoretical framework introduced in the previous sec-tions can be extended to higher dimensions. Considering atwo-dimensional geometry, we represent the cells in the tis-sue on the sites of a discrete lattice. The tissue geometry ofthe wing disk can be captured by an irregular tiling of theplane, see Figs. 6"a# and 6"b#. For simplicity, however, weuse a triangular lattice with N hexagonal cells in our descrip-tion, see Fig. 6"d#. Each hexagonal cell n=1, . . . ,N has J
edges "n , j# with j=1, . . . ,J "J=6 for a triangular lattice#along which it faces a uniquely defined neighboring cell n! atits edge "n! , j!#, see Fig. 6"c#. The space between these twofacing edges of the neighboring cells is denoted by the sym-bol /n , j0 with the property /n , j0= /n! , j!0.
To keep our notation simple, we first discuss the case ofconstant surface receptor concentration, see Sec. III D. As-suming that there is no directional bias of ligand transport,the externalization of the ligand-receptor complexes can oc-cur on all surfaces of the cell with equal probability. Theequations for the ligand kinetics corresponding to Eq. "10#on a lattice are
d
dtL/n,j0 = koff"Sn,j + Sn!,j!# !
Jkon
2&2R
J! Sn,j ! Sn!,j!'L/n,j0
! edegL/n,j0,
d
dtSn,j =
bext
JSn
"i# ! "bint + koff#Sn,j +Jkon
2&R
J! Sn,j'L"n,j#,
d
dtSn
"i# = ! bextSn"i# + bint1
j=1
J
Sn,j ! bdegSn"i#, "21#
where Sn"i# is the internal bound ligand concentration in cell n,
Sn,j the surface bound ligand concentration on edge j of celln, and L/n,j0 the free ligand concentration in the extracellularspace /n , j0 which is located between the two adjacent cells n
FIG. 6. "Color online# Ligand transport in two dimensions. "a# Tissue in the region of the wing disk where the Dpp gradient forms. Cellmembranes are labeled in red, the morphogen Dpp is shown in green. "b# Schematic of this tissue. Source cells which produce ligands areshown in darker gray, the cells in the target tissue in light gray. "c# The rates for the various cellular processes are denoted as in onedimension, see Fig. 1. For the triangular lattice with hexagonal cells which we use here, receptor bound ligands can be present on the sixedges of each cell and inside the cells. The concentration of the receptor-bound ligands on edge j of cell n is denoted Sn,j, that inside cell nis termed Sn
"i#. Free ligands exist in the gaps between two cell surfaces. Their concentration in gap /n , j0 which is located adjacent to edge jof cell n is denoted L/n,j0. "d# Triangular lattice structure with hexagonal cells used in our discrete theoretical description of ligand transportin two dimensions. This lattice structure approximates the situation shown in b. The source cells which are shown in darker gray secreteligands into the extracellular spaces surrounding them. The cell diameter is a.
MORPHOGEN TRANSPORT IN EPITHELIA PHYSICAL REVIEW E 75, 011901 "2007#
011901-9
and n! and the edges "n , j# and "n! , j!#, see Figs. 6"c# and6"d#. In Eq. "21#, we have for simplicity neglected extracel-lular diffusion which would couple the concentration L/n,j0 tothe one on neighboring sites. At the boundaries of the lattice,the equation for d
dtL/n,j0 in "21# takes into account ligandinflux analogously to the one-dimensional situation, see Eqs."3# and "4#.
B. Transport equations on larger scales
The effective behavior of ligand transport as described byEq. "21# exhibits anisotropy on large scales due to the aniso-tropic lattice structure. We consider for simplicity an isotro-pic continuum limit. This simplification is motivated by theirregular arrangement of cells in a tissue which does notexhibit lattice anisotropies.
In the isotropic case, the continuum limit describing trans-port by transcytosis in two dimensions is of the general form
!t) = " · $D2d")# " )% ! k2d")#) . "22#
The effective coefficients D2d")# and k2d")# in Eq. "22# arein general different from those in the one-dimensional case"12#. In order to determine values for the coefficients D2d")#and k2d")# we first consider concentration profiles whichvary only along one symmetry axis of the lattice given by thex axis in Fig. 6"d#. In this situation the problem can be rep-resented on a one-dimensional lattice similar to the one-dimensional chain discussed above. We thus determinedD2d")# and k2d")# along this lattice axis using our one-dimensional approach. Lattice symmetry implies that thesecoefficients apply to three different lattice axes. In our iso-tropic simplification, we assume that they apply to all direc-tions. From this argument, we find the same effective degra-dation rate k2d")#=k")# as in one dimension, see Eq. "12#.The effective diffusion coefficient changes by a factor of2 /3: D2d")#= "2/3#D")#.
By the same considerations, the more general descriptionwith receptor kinetics introduced in one dimension in Eqs."6# and "7# generalizes in two dimensions to
!t) = " · $D)2d"),*# " ) + D*
2d"),*# " *% ! k)2d"),*#) ,
!t* = %sys2d "),*# ! k*
2d"),*#* .
Here the coefficients D)2d") ,*#, D*
2d") ,*#, k)2d") ,*#, and
k*2d") ,*# are in general modified due to the lattice geometry.
For a triangular lattice D)2d") ,*#= "2/3#D)") ,*# and
D*2d") ,*#= "2/3#D*") ,*#. The degradation rates k)
2d and k*2d
are identical to those in the one-dimensional case. Finally,the rate of receptor synthesis %syn
2d =%syn/a is the same as inone dimension, see Eq. "8#, but measured in different units.At the boundary line at x=0, the ligand source is describedby a current j0=% /a across this boundary line.
We have compared solutions of the effective continuumequation in two dimensions "22# to those of the discrete de-scription on a triangular lattice "21#. Here, the ligand sourcelocated at x#0 extends along the y direction. This setup istranslation invariant along this direction if no inhomogene-ities are present in the tissue. In this situation, the solutions
of the discrete and continuum descriptions are in good agree-ment. In order to test the validity of the continuum descrip-tion for a case that is not translation invariant along the ydirection, we compared the solutions of Eq. "22# for a geom-etry in which a rectangular region which the ligand cannotenter is present in the tissue to solutions of Eq. "21# wheresuch a rectangular region is approximated, see Fig. 7. In thediscrete description, we imposed this constraint by settingbint=0 in this region. In the continuum description "22#, thiscorresponds to D2d=0 within this region which we realizedby imposing a zero flux boundary condition "j=0# at its bor-der. As in one dimension, the continuum description is ap-propriate as long as the degradation rates and the hoppingrate D0 /a2 which describes extracellular diffusion remainsmall.
VI. DISCUSSION
In this article, we have first presented a description ofmorphogen transport in which cells are discrete entities. Thisdescription is based on key processes like the diffusion ofmorphogens in the extracellular space, binding and unbind-ing of the morphogens to and from receptor molecules thatare located on the cell surfaces, internalization of thesereceptor-ligand complexes into the cell and their subsequentrecycling, as well as degradation of external and internalizedligands, see Fig. 1. Moreover, the production and intracellu-lar trafficking of free receptor molecules by the cells is in-cluded. We have derived effective nonlinear transport equa-tions "6# and "7# for the total morphogen concentration andthe total receptor concentration which describe transport bytranscytosis on larger length scales. The effective diffusioncoefficient and the effective degradation rate in these equa-tions are concentration dependent. If transcytosis has a direc-tional bias, an additional drift term appears in the transportequations.
Other mechanisms of ligand transport can be effectivelydescribed by equations "6# and "7#. The effective transportcoefficients can be derived from a detailed description of anyparticular transport mechanism. As an example for this, wehave discussed a model of morphogen transport where trans-port occurs via diffusion of ligands bound to carrier mol-ecules in the cell membrane $11,26%, see Appendix D.
Our theoretical discription of morphogen transport cap-tures the key processes that are relevant for ligand transportand ligand-receptor interactions in multicellular epitheliasuch as the wing disk. We used a simplified description ofthese processes and neglected several aspects that could playa role. For example, we did not account for cell divisions andtissue growth in our description $27%. More importantly, thepresence of different receptor types which is quite commonfor signaling molecules of the TGF-+ superfamily like Dppwas neglected in our description. These receptors typicallyform dimers or other complexes and, in general, the affinityof the ligand is different for the different receptor types andcomplexes. The trafficking of ligand-receptor pairs inside thecell is a very complex process that is only crudely capturedin our description by a few parameters.
Our coarse-graining procedure starts from a discrete cel-lular representation and allows us to obtain effective trans-
BOLLENBACH et al. PHYSICAL REVIEW E 75, 011901 "2007#
011901-10

port equations in a continuum limit. This provides a theoret-ical framework for a quantitative analysis of the spreadingand trafficking of signaling molecules in and between cells.Using this approach one can relate experimental data ob-tained at different scales ranging from the cell to the tissuelevel. For example, the situation shown in Fig. 7 mimicsrecent experiments done in the Drosophila wing disk inwhich endocytosis is blocked in patches of cells in the tissue"see Sec. II# $6%. The calculation results shown in Fig. 7 areconsistent with the experimental data obtained in these shi-bire clone experiments $6%. They show a ligand depletion ofdecreasing relative magnitude "“contrast”# behind the cloneregion as it is observed experimentally, see Fig. 7"h#. Note,that the clone region itself is devoid of ligands which is alsoseen experimentally and is evidence for a transport mecha-nism via transcytosis $13%.
Transport processes of signaling molecules in tissuesshow many features in common which are captured by our
description. Our study highlights some general properties ofthese systems such as the robustness of gradients which arelargely independent of parameter values and molecular de-tails. We expect that such general features can play an im-portant role in very different biological signaling systems.
APPENDIX A: DERIVATION OF THE EFFECTIVETRANSPORT EQUATIONS IN ONE DIMENSION
To perform a continuum limit of Eq. "1#, we introduce thedensities l"t ,x#, r"l/r#"t ,x#, ri"t ,x#, s"l/r#"t ,x#, and si"t ,x#, suchthat x=na, Ln"t# /a= l"t ,x#, Rn
"l#"t# /a=r"l#"t ,x#, Rn"r#"t# /a
=r"r#"t ,x#, Rn"i#"t# /a=ri"t ,x#, Sn
"l#"t# /a=s"l#"t ,x#, Sn"r#"t# /a
=s"r#"t ,x#, and Sn"i#"t# /a=si"t ,x#. Kinetic equations for these
are obtained by replacing the discrete densities Rn"i#, Rn
"l/r#, Sn"i#,
Sn"l/r#, and Ln in Eq. "1# with the continuum densities ri, r"l/r#,
si, s"l/r#, and l. The spatial separation of the quantities defined
FIG. 7. "Color online# Time development of ligand densities )"x! , t# in two dimensions. The solution to the continuum transport equation"22# is compared to that of the discrete description given by Eq. "21# in the presence of a region which the ligand cannot enter located at60x /a011 and !40y /a04. In the discrete description, this is realized by setting bint to zero in the region. In the continuum description,zero flux boundary conditions are imposed on the outlining edge of the region. "a–d# Two-dimensional ligand profiles at tbdeg=3.6 "a,b# andat tbdeg=17.3 which is close to the steady state "c,d#. These profiles were obtained by solving the discrete "a,c# and continuum description"b,d#, respectively. The rectangular region which the ligand cannot enter appears in white. It appears smaller in a and c than in b and dbecause in the discrete description, ligands can still bind to surface receptors on the cells located at the edge of the region so that )$0 forthese cells. "e–g# Profiles of )"x! , t# along the slices indicated in b at tbdeg=0.72,2.16,3.6 "black lines# and in steady state "red lines#. Linesindicate solutions to Eq. "22#, while symbols indicate solutions to Eq. "21# for comparison. "h# Contrast of the depletion of )"x! , t# shown ing. The contrast is defined as c"t#=1!)b"t# /)o"t# where )b"t# and )o"t# are the total ligand concentration at the locations shown by the crossesin a, i.e., directly behind the clone and far away from it, respectively. Initial condition: )"x!#=0. Parameters as in Fig. 2 with D0=0,j0 /bdegar=25/3 at x=0, j=0 at y /a= ±25 and at x /a=50.
MORPHOGEN TRANSPORT IN EPITHELIA PHYSICAL REVIEW E 75, 011901 "2007#
011901-11
on the lattice as indicated in Fig. 1 is taken into accountby including terms up to second order in a power seriesexpansion in x. We also change variables to r±"t ,x#=r"l#"t ,x#±r"r#"t ,x# and s±"t ,x#=s"l#"t ,x#±s"r#"t ,x# so that r+and s+ measure the total free and ligand bound surface re-ceptor concentrations per cell and r! and s! the polarizationof these concentrations on the cell surface, respectively. Thisyields the continuum equations
!tl = koffs+ ! "akonr+ + edeg#l !ab2kon
8l!x
2r+ +b2koff
8!x
2s+
+ D0!x2l !
abkon
2l!xr! +
bkoff
2!xs!,
!ts+ = akonlr+ + bextsi ! "bint + koff#s+ +ab2kon
8r+!x
2l
+"a ! b#2bext
8!x
2si !abkon
2r!!xl ,
!tsi = ! "bext + bdeg#si + bints+ +"a ! b#2bint
8!x
2s+
!"a ! b#bint
2!xs!,
!ts! = akonlr! ! "bint + koff#s! +ab2kon
8r!!x
2l !abkon
2r+!xl
+"a ! b#bext
2!xsi,
!tr+ =fsyn
a+ fextri ! f intr+ ! akonlr+ + koffs+ !
ab2kon
8r+!x
2l
+"a ! b#2fext
8!x
2ri +abkon
2r!!xl ,
!tri = ! "fext + fdeg#ri + f intr+ +"a ! b#2f int
8!x
2r+
!"a ! b#f int
2!xr!,
!tr! = ! f intr! ! akonlr! + koffs! !ab2kon
8r!!x
2l +abkon
2r+!xl
+"a ! b#fext
2!xri. "A1#
Here, it is reasonable to neglect derivatives of higher orderwith respect to x because the most important contribution toligand transport on large length scales comes from the sec-ond derivative terms. This is due to the fact that first deriva-tive terms must not appear in an effective transport equationbecause of the mirror symmetry of the original description.
In the absence of degradation and production, there are
two conserved quantities in the system, namely the totalligand number and the total receptor number. Indeed, thekinetic equation for the total ligand density )= l+si+s+ thatfollows from Eq. "A1# can be written as a continuity equa-tion with sink term
!t) = ! !xj ! bdegsi ! edegl . "A2#
Here, the total ligand current is
j =abkon
2lr! +
"a ! b#bint
2s! !
bkoff
2s! !
ab2kon
8"r+!xl ! l!xr+#
!"a ! b#2bext
8!xsi !
"a ! b#2bint + b2koff
8!xs+ ! D0!xl .
"A3#
Note, that the terms involving r! and s! appear directlywhereas all other terms are proportional to derivatives of r+,s+, si, or l. The kinetics of the total receptor density *=ri+r++si+s+ is given by another continuity equation withsource and sink terms:
!t* = ! !xj* +fsyn
a! fdegri ! bdegsi "A4#
with the total receptor current
j* ="a ! b#
2"f intr! + bints!# !
"a ! b#2
8"fext!xri + f int!xr+
+ bext!xsi + bint!xs+# . "A5#
The individual terms of the currents j and j* are difficult tointerpret. However, it will become clear below that the termsin j* do not give rise to transport over large distanceswhereas this is the case for the terms in j.
The equations "A2# and "A4# have the unpleasant propertythat they relate the time development of ) and * to that of allthe individual quantities l ,si ,s± ,ri ,r± whose time develop-ment is given by the set of coupled partial differential equa-tions "A1#. It would be better if the kinetics of ) and * couldbe described by equations which only involve these twoquantities. This can be achieved by exploiting a separation oftime scales.
As discussed in the main text, the relaxation time scale 'afor the kinetics in one cell is much smaller than the timescale '&D
for ligand transport on a large length scale &D onwhich the ligand profile develops. As we are interested in thebehavior on large length scales in the continuum description,we exploit 'a1'&D
by making an adiabatic approximation inwhich the system equilibrates infinitely fast locally. This isdone by setting all time derivatives in Eq. "A1# to zero andneglecting the second derivative terms. The resulting equa-tions provide five relations between the seven variablesl ,ri ,r± ,si ,s±. Here, we also assume that the production anddegradation rates are small compared to the other rates. For-mally, this corresponds to setting bdeg=edeg= fdeg= fsyn=0.This procedure yields the relations "5#.
Note, that we have kept the first derivative terms for r!and s! in Eq. "5#. This is done to retain all second derivative
BOLLENBACH et al. PHYSICAL REVIEW E 75, 011901 "2007#
011901-12

terms when inserting Eq. "5# into Eqs. "A2#–"A5#. Using Eq."5#, one can express l ,ri ,r! ,si ,s! in terms of r+ and s+ andspatial derivatives thereof. Finally, r+ and s+ can be ex-pressed in terms of *=ri+r++si+s+ and )= l+si+s+. Math-ematically, there exist two solutions for s+") ,*# and r+") ,*#but only one of them satisfies the physical requirement thats+")=0,*#=0 and r+") ,*=0#=0. Thus, we can uniquely ex-
press l, ri, r±, si, and s± in terms of ) and * in the adiabaticapproximation.
Using these expressions, it is straightforward to cast Eqs."A2#–"A5# into the two coupled partial differential equations"6# and "7#. The explicit expressions for the transport anddegradation coefficients in this one-dimensional descriptionof morphogen transport are
D)"),*# = ! a3bextbint"bext + bint#fext2f intkoffkon*†! 2bint$bext"fext + f int#koff + a"bext + bint#fextkon)%2
+ 2A"),*#„! (bintfext$2f int"bint + koff# + abintkon)%) + bext(! 2fextf intkoff + bint$f intkoff + fext"! 2f int + koff ! akon)#%)…+ 2abint"bext + bint#fextkon$A"),*# ! 2bext"fext + f int#koff + 2a"bext + bint#fextkon)%* ! 2a2bint"bext + bint#2fext
2kon2*2‡!1
+ 2D0abext"bext + bint#fext"fext + f int#koffkon*†A"),*#„A"),*# ! bext(f intkoff + fext$koff + akon") ! *#%)
+ abintfextkon"* ! )#…‡!1,
D*"),*# = a4bextbint"bext + bint#fext2f intkoffkon
2)*†2„(! $f int"bint + koff#% ! abintkon))$bext"fext + f int#koff + a"bext + bint#fextkon)%
/$A"),*# + bext"fext + f int#koff + a"bext + bint#fextkon)% + a"bext + bint#fextkon„! $A"),*#f int"bint + koff#% + aA"),*#bintkon)
+ 2$f int"bint + koff# + abintkon)%(! $bext"fext + f int#koff% + a"bext + bint#fextkon))…* ! a2"bext + bint#2fext2kon
2
/ $f int"bint + koff# + abintkon)%*2…‡!1 + 2D0bext"fext + f int#koff†„$"fext + f int#koff + afextkon)%2 + afextkon$"fext + f int#koff
! afextkon)%*…bext2 ! A"),*#$"fext + f int#koff + afextkon)%bext + abintfextkon$2fext)"koff + akon)# + fext"koff ! 2akon)#*
+ f intkoff"2) + *#%bext + abintfextkon) / $abintfextkon") ! *# ! A"),*#%‡†A"),*#„A"),*# ! bext(f intkoff + fext$koff + akon")
! *#%) + abintfextkon"* ! )#…2‡!1,
k)"),*# = †bdegbint„abintfextkon") + *# ! A"),*# + bext(f intkoff + fext$koff + akon") + *#%)…‡$2a"bext + bint#2fextkon)%!1
k*"),*# = „(! $"bext + bint#fdegf int% + bdegbint"fext + f int#)$! A"),*# + bext"fext + f int#koff + a"bext + bint#fextkon)%
+ a"bext + bint#fext$"bext + bint#fdegf int + bdegbint"fext + f int#%kon*… / $2a"bext + bint#2fext"fext + f int#kon*%!1,
with
A"),*# = †„bext(f intkoff + fext$koff + akon") ! *#%) + abintfextkon") ! *#…2 + 4abext"bext + bint#fext"fext + f int#koffkon*‡1/2. "A6#
APPENDIX B: DIRECTIONAL BIAS OF INTRACELLULARTRAFFICKING
We study the effects of a bias in the description of tran-scytosis. We introduce a dimensionless parameter !1/20+01/2 which measures this bias in Eq. "1#. The kinetic equa-tions of the discrete description with bias are
d
dtSn
"r# = ! koffSn"r# + konRn
"r#Ln ! bintSn"r# + bext"1/2 + +#Sn
"i#,
d
dtSn
"l# = ! koffSn"l# + konRn
"l#Ln!1 ! bintSn"l# + bext"1/2 ! +#Sn
"i#,
"B1#
with the kinetics for the remaining quantities as in Eq. "1#.For +=!1/2, all receptor-bound ligands are externalized on
the left surface, for +=1/2 on the right surface, and for +=0, we recover the unbiased description. This implies thatthe externalization of the free receptors remains unbiased.We proceed as before to derive the continuum equations. Theadiabatic approximation changes to
s! =konalr! ! 2+bextsi !
abkon
2r+!xl +
"a ! b#bext
2!xsi
bint + koff
"B2#
with the other relations as in Eq. "5#. Finally, the transportequations "6# and "7# generalize to Eq. "9# with the neweffective drift velocity
MORPHOGEN TRANSPORT IN EPITHELIA PHYSICAL REVIEW E 75, 011901 "2007#
011901-13

V+"),*# = 2a2+bextbintfextf intkoffkon*„bext$f int"bint + koff#
+ abintkon)%$"fext + f int#koff + afextkon)%
+ abextfextkon$f int"bint + koff# ! abintkon)%*
+ $f int"bint + koff# + abintkon)%A"),*#
+ abintfextkon(f intkoff") + *# + bint$akon)") ! *#
+ f int") + *#%)…!1, "B3#
where A") ,*# is defined in Eq. "A6#. The other coefficientsappearing in Eq. "9# remain as in the case without directionalbias.
APPENDIX C: SIMPLE LIMITS OF THE EFFECTIVETRANSPORT EQUATIONS
In biological systems, it is well possible that some of theprocesses included in our description of ligand transport aremuch faster than the others. For example, the binding of theligand to its receptor can be fast compared to other processesdue to the small volume of the gaps between cells. The con-finement of the ligands to this small volume leads to frequentcollisions between ligands and receptors. Assuming that thereaction is diffusion limited this can lead to a high reactionrate kon.
It is worthwhile to note that Eqs. "6# and "7# becomesimpler if this or another one of the cellular processes ismuch faster than the others, i.e., if the corresponding rates inour description are very large. For example, in the limit ofvery fast binding of ligands to receptors, i.e., for kon!-, wefind
D)"),*# =! a2bextbintfextf intkoff*
B"),*#,
D*"),*# =a2bextbintfextf intkoff)
B"),*#,
k)"),*# =bdegbint
bext + bint,
k*"),*# =bdegbint"fext + f int#) + "bext + bint#fdegf int"* ! )#
"bext + bint#"fext + f int#*,
"C1#
where
B"),*# = 4(bintfextf int"bint + koff# + bext$bintfextf int + fextf intkoff
! bint"fext + f int#koff%))
! 4"bext + bint#fextf int"bint + koff#* .
There are no free ligands in this limit because l=0 via Eq."5#. As all ligands are bound to receptors, free diffusion doesnot contribute to the current and D0 does not appear in Eq."C1#. This also imposes the constraint )0*. The examplegiven by Eq. "C1# is instructive because the effective trans-port and degradation coefficients are much simpler than
those in the general case "A6#. Many of the properties dis-cussed above for the general case that is valid for arbitrarykon can be read directly from the expressions in Eq. "C1#. Forexample, if bext=0 ligands do not move because D)=D*=0in Eq. "C1#. Due to the constraint )0*, however, the state-ments for the asymptotic behavior for )!- do not apply tothis case. Furthermore, D) does no longer exhibit a maxi-mum as a function of ). It either grows or decreases mono-tonically depending on the parameter choice.
In principle, one can write down simpler expressions as inEq. "C1# for many different limits. If several transport stepsare much faster than the others, only the ratios of the corre-sponding parameters enter the simplified description. For ex-ample, if the binding and unbinding of the ligand to thereceptor is faster than all other processes the effective diffu-sion coefficient and degradation rate do not depend on konand koff individually but only on the ratio kon/koff. The num-ber of parameters can thus be reduced to obtain the minimaldescription for a given situation. A simple but instructiveexample is the situation kon(koff(bext(bint in Eq. "11#, forwhich we obtain the effective diffusion coefficient
limbext!-
limkoff!-
limkon!-
D")# = binta2/4.
This reflects that the only slow process—in this case theinternalization of ligands at rate bint—limits the transport ef-ficiency and defines the effective diffusion coefficient. Note,that the limits taken above do not commute because D")#=0 for koff(kon.
APPENDIX D: TRANSPORT BY DIFFUSIONIN THE CELL MEMBRANE
As another example for an application of our theoreticalframework, consider a transport mechanism in which ligandscan move across cells by passive diffusion in the cell mem-brane. The ligand first binds to a receptor molecule on thecell surface. This complex then diffuses in the cell mem-brane. At any time, the ligand can detach from the receptor itoccupies and, after diffusing over a short distance in theextracellular space, it can attach to a new receptor that can belocated on the surface of the same or a different cell. Note,that if we simply replace the receptors with HSPG moleculesthis transport mechanism is very similar to one that was re-cently suggested for Dpp in the wing disk $11%.
We can describe this mechanism on the same lattice struc-ture as used above for transcytosis, see Fig. 1. For simplicity,we focus on the essence of the transport phenomenon and donot include ligand degradation or the production and degra-dation of receptors in our description. Furthermore, the re-ceptor concentration is assumed to be constant on the cellsurface. This description is similar to that of transcytosiswith constant surface receptor concentration given by Eq."10#. However, instead of the internalization and externaliza-tion of receptor-ligand complexes as in transcytosis, disloca-tion of the ligand-receptor complexes across one cell is dueto diffusion on the cell surface. In a discrete one-dimensionaldescription, this effect is captured by hopping at a rate h+DM /2a2 between the left and right surface of each cell,
BOLLENBACH et al. PHYSICAL REVIEW E 75, 011901 "2007#
011901-14
where DM is the diffusion coefficient of receptors in the cellmembrane. Using the same notation as in Eq. "10#, a discretedescription of this mechanism reads
d
dtLn = koff"Sn
"r# + Sn+1"l# # ! kon"R ! Sn
"r# ! Sn+1"l# #Ln,
d
dtSn
"r# = ! koffSn"r# + kon"R/2 ! Sn
"r##Ln + h"Sn"l# ! Sn
"r## ,
d
dtSn
"l# = ! koffSn"l# + kon"R/2 ! Sn
"l##Ln!1 + h"Sn"r# ! Sn
"l## .
Applying the same method as in Sec. III B, we obtain thecontinuum transport equation !t)=!x(DSD")#!x)) where ) isthe total ligand concentration and
DSD")# =a3rhkoffkon$E")# ! koff + akon"! ) + r#%
4E")#$E")#h ! h"koff + akon)# + ar"h + koff#kon%,
with
E")# = (! 4a2rkon2) + $koff + akon"r + )#%2)1/2. "D1#
DSD")# has properties that are similar to those of the effec-tive diffusion coefficient of the transcytosis model. It exhib-its a maximum as a function of ) and decays as DSD*)!2
for large ). Hence, upon inclusion of ligand degradation inthe description, gradient formation by this mechanism exhib-its similar properties as transcytosis.
APPENDIX E: TRANSPORT BY EXTRACELLULARDIFFUSION
In order to ultimately identify the mechanism of morpho-gen gradient formation present in a given system, it is im-portant to develop mathematical descriptions of all poten-tially relevant transport mechanisms so that these can becompared to the available experimental data. Extracellular
diffusion is widely believed to be the dominant transportmechanism for some morphogens $8,14%. For this reason, webriefly discuss the extracellular diffusion dominated limit ofthe transport phenomenon defined by Eq. "1# in this section.
Assuming that extracellular diffusion gives the dominantcontribution to the ligand current, we neglect the contribu-tion of transcytosis. This approach is valid if the rates ofligand trafficking are such that the effective diffusion coeffi-cient resulting from transcytosis ,D") ,*#,p=0 in Eq. "6# ismuch smaller for all values of ) and * than the extracellulardiffusion constant D0.
The derivation of the continuum limit of Eq. "1# isstraightforward in this situation. Only the equation for thetime development of the free ligand concentration contains alinear diffusion term. All other quantities can be described bya coupled set of ordinary differential equations. Together,these constitute a set of reaction-diffusion equations. Withthe notation used throughout this article, the kinetic equa-tions in two dimensions read
!tl = D02l ! kona2lr+ + koffs+ ! edegl ,
!ts+ = kona2lr+ ! "bint + koff#s+ + bextsi,
!tsi = bints+ ! "bext + bdeg#si,
!tr+ =fsyn
a2 + koffs+ + fextri ! konlr+ ! f intr+,
!tri = f intr+ ! "fext + fdeg#ri. "E1#
This is essentially the system that was previously studied in$13,14%. This reaction-diffusion system can reproduce someexperimental results that were obtained for the morphogenDpp and its receptor Tkv in the wing disk $13,14%. However,there are experimental observations that are in disagreementwith the solutions of Eq. "E1# indicating that this is not acorrect description of the ligand and receptor kinetics in thissystem $6,13%. In other experimental systems, reaction-diffusion mechanisms may play a role in pattern formationduring development $2,28,29%.
$1% T. Tabata and Y. Takei, Development 131, 703 "2004#.$2% A. M. Turing, Philos. Trans. R. Soc. London, Ser. B 237, 37
"1952#.$3% L. Wolpert, J. Theor. Biol. 25, 1 "1969#.$4% W. Driever and C. Nüsslein-Volhard, Cell 54, 83 "1988#.$5% W. Driever and C. Nüsslein-Volhard, Cell 54, 95 "1988#.$6% E. V. Entchev, A. Schwabedissen, and M. González-Gaitán,
Cell 103, 981 "2000#.$7% A. A. Teleman and S. M. Cohen, Cell 103, 971 "2000#.$8% J. B. Gurdon, P. Harger, A. Mitchell, and P. Lemaire, Nature
"London# 371, 487 "1994#.$9% F. Crick, Nature "London# 225, 420 "1970#.
$10% N. McDowell, A. M. Zorn, D. J. Crease, and J. B. Gurdon,Curr. Biol. 7, 671 "1997#.
$11% T. Y. Belenkaya, C. Han, D. Yan, R. J. Opoka, M. Khodoun,
and X. Lin, Cell 119, 231 "2004#.$12% F. A. Ramirez-Weber and T. B. Kornberg, Cell 97, 599 "1999#.$13% K. Kruse, P. Pantazis, T. Bollenbach, F. Jülicher, and M.
González-Gaitán, Development 131, 4843 "2004#.$14% A. D. Lander, Q. Nie, and F. Y. M. Wan, Dev. Cell 2, 785
"2002#.$15% B. Houchmandzadeh, E. Wieschaus, and S. Leibler, Nature
"London# 415, 798 "2002#.$16% T. Gregor, W. Bialek, R. R. de Ruyter van Stevenick, D. W.
Tank, and E. F. Wieschaus, Proc. Natl. Acad. Sci. U.S.A. 102,18403 "2005#.
$17% S. Morimura, L. Maves, Y. Chen, and F. Hoffmann, Dev. Biol."Orlando, FL, U.S.# 177, 136 "1996#.
$18% A. Eldar, R. Dorfman, D. Weiss, H. Ashe, B. Z. Shilo, and N.Barkai, Nature "London# 419, 304 "2002#.
MORPHOGEN TRANSPORT IN EPITHELIA PHYSICAL REVIEW E 75, 011901 "2007#
011901-15
$19% A. Eldar, D. Rosin, B. Z. Shilo, and N. Barkai, Dev. Cell 5,635 "2003#.
$20% T. Bollenbach, K. Kruse, P. Pantazis, M. González-Gaitán, andF. Jülicher, Phys. Rev. Lett. 94, 018103 "2005#.
$21% M. Howard and P. R. ten Wolde, Phys. Rev. Lett. 95, 208103"2005#.
$22% G. Hornung, B. Berkowitz, and N. Barkai, Phys. Rev. E 72,041916 "2005#.
$23% M. Kerszberg and L. Wolpert, J. Theor. Biol. 191, 103 "1998#.$24% Y. Chen and G. Struhl, Cell 87, 553 "1996#.
$25% D. A. Lauffenburger and J. J. Lindermann, Receptors: Modelsfor Binding, Trafficking, and Signaling "Oxford UniversityPress, Oxford, UK, 1993#.
$26% C. Han, T. Y. Belenkaya, B. Wang, and X. H. Lin, Develop-ment 131, 601 "2004#.
$27% B. Shraiman, Proc. Natl. Acad. Sci. U.S.A. 102, 3318 "2005#.$28% H. Meinhardt, Models of Biological Pattern Formation "Aca-
demic, London, 1982#.$29% A. J. Koch and H. Meinhardt, Rev. Mod. Phys. 66, 1481
"1994#.
BOLLENBACH et al. PHYSICAL REVIEW E 75, 011901 "2007#
011901-16